Embed Size (px)
Citation preview
IWMP-3 Idar
District Watershed Development Unit, Sabarkanth
(1)
Detail Project Report IWMP-3(Idar)
Project Implementing Agency
DWDU
Sabarkantha-Himatnagar
IWMP-3 Idar
District Watershed Development Unit, Sabarkanth
(2)
TABLE OF CONTENT
CHAPTER – 1 ............................................................................................................................................................................................................................................. 5
PROJECT BACKGROUND ....................................................................................................................................................................................................................... 5
Project Background ................................................................................................................................................................................................................................. 6
Table no.1: Basic project information ................................................................................................................................................................................................. 6
Table no.2: Weight age of the project ................................................................................................................................................................................................. 7
Table no.3: Watershed information ..................................................................................................................................................................................................... 8
Table no. 4: Developmental programmes running in the project area: ............................................................................................................................................. 10
Table no. 5: Previous Watershed programmes in the project area: ................................................................................................................................................... 10
CHAPTER – 2 ........................................................................................................................................................................................................................................... 12
PROJECT IMPLEMENTING AGENCY ................................................................................................................................................................................................. 12
Project Implementing Agency ............................................................................................................................................................................................................... 12
Table no.6: PIA: ................................................................................................................................................................................................................................ 15
Table no. 7: Staff at PIA Level: ......................................................................................................................................................................................................... 15
CHAPTER – 3 ........................................................................................................................................................................................................................................... 17
BASIC INFORMATION OF PROJECT AREA ....................................................................................................................................................................................... 17
Basic Information of Project Area ......................................................................................................................................................................................................... 18
Table no. 8: Land use pattern: ........................................................................................................................................................................................................... 19
Table no. 9: Soil type and topography: .............................................................................................................................................................................................. 20
Table no. 10: Flood and drought condition: ...................................................................................................................................................................................... 20
Table no. 11: Edaphic Factors ........................................................................................................................................................................................................... 21
Table no. 12: Climatic conditions: .................................................................................................................................................................................................... 23
Table no. 13: Physiographic and relief .............................................................................................................................................................................................. 24
Table no. 14: Land ownership details ................................................................................................................................................................................................ 24
Table no. 15: Agriculture ................................................................................................................................................................................................................... 25
Table no. 16: Irrigation ...................................................................................................................................................................................................................... 25
Table no. 17: Crop details: ................................................................................................................................................................................................................ 26
Table no. 18: Livestock ..................................................................................................................................................................................................................... 28
Table no. 19: Drinking water ............................................................................................................................................................................................................. 29
Table no. 20: Details of Common Property Resources ..................................................................................................................................................................... 29
IWMP-3 Idar
District Watershed Development Unit, Sabarkanth
(3)
Table no. 21: Demographic information ........................................................................................................................................................................................... 33
Table no. 22: Literacy rate ................................................................................................................................................................................................................. 34
Table no.23: Migration Details .......................................................................................................................................................................................................... 35
Table no. 24: Poverty ......................................................................................................................................................................................................................... 36
Table no.25: Village infrastructure .................................................................................................................................................................................................... 36
Table no. 26: Facilities / HH assets ................................................................................................................................................................................................... 37
Table no. 27: Income ........................................................................................................................................................................................................................ 38
Table no.28: Dependence on Forest/CPR .......................................................................................................................................................................................... 39
Table no. 29: Livelihood pattern (Occupational distribution) ........................................................................................................................................................... 40
CHAPTER – 4 ........................................................................................................................................................................................................................................... 46
WATERSHED ACTIVITIES .................................................................................................................................................................................................................... 46
Watershed Activities .............................................................................................................................................................................................................................. 47
Table no. 30: Details of Scientific Planning and Inputs in IWMP-3 projects. .................................................................................................................................. 52
Table no. 31: Watershed committee details ....................................................................................................................................................................................... 57
Table no.32: SHG detail .................................................................................................................................................................................................................... 64
Table no. 33: UG detail ..................................................................................................................................................................................................................... 67
Table No. 34 Entry point activities (EPA) (All financial figures in lakh Rs.) .................................................................................................................................. 72
Table no.35: Details of activities of preparatory phase (All financial figures in lakh Rs.) ................................................................ Error! Bookmark not defined.
Table no.36: Activities related to Surface water resources in the project areas (all financial figures in lakh Rs.) ........................................................................... 74
Table no.37: Activities related to recharging ground water resources in the project areas (all financial figures in lakh Rs.) .......................................................... 87
Table no. 38: Activities related to livelihoods by Self Help Groups (SHGs) in the project areas .................................................................................................... 91
Table no. 39: Other activities of watershed works phase – Proposed target ...................................................................................... Error! Bookmark not defined.
Table no.40: Details of engineering structures in watershed works* ................................................................................................................................................ 74
Table no.41: Details of activities connected with vegetative cover in watershed works:- .............................................................................................................. 102
Table no.42: Details of allied / other activities ................................................................................................................................... Error! Bookmark not defined.
Table no.43: Details of activities in the CPRs in the project areas.................................................................................................................................................. 106
Table No. 44 Capacity Building Institution ..................................................................................................................................................................................... 107
Table No. 45 Capacity Building Plan: ............................................................................................................................................................................................. 108
Table no.46: Information, education and Communication Activities: ............................................................................................................................................ 110
CHAPTER – 5 ......................................................................................................................................................................................................................................... 111
Budgeting ................................................................................................................................................................................................................................................. 111
Table no. 47: Budget at a glance for the Project ............................................................................................................................................................................. 111
Table no. 48: Village component wise budget available under IWMP ........................................................................................................................................... 116
IWMP-3 Idar
District Watershed Development Unit, Sabarkanth
(4)
Table no. 49: Village wise gap in funds requirement ...................................................................................................................................................................... 117
Table No. 50: Details of Convergence of IWMP with other Schemes ............................................................................................................................................ 118
Table no. 51: Public-Private Partnership in the IWMP projects ..................................................................................................................................................... 119
CHAPTER – 6 ......................................................................................................................................................................................................................................... 120
EXPECTED OUTCOMES ...................................................................................................................................................................................................................... 120
Expected Outcome ............................................................................................................................................................................................................................... 120
Table No. 52: Employment in Project is ......................................................................................................................................................................................... 121
Table no. 53: Details of seasonal migration from Project area ....................................................................................................................................................... 121
Table No. 54: Details of average ground water table depth in the project areas (in meters) .......................................................................................................... 122
Table No. 55: Status of Drinking water ........................................................................................................................................................................................... 124
Table no. 56: Details of crop are and field in the Project areas ....................................................................................................................................................... 125
Table no. 57: Area under horticulture ............................................................................................................................................................................................. 125
Table No. 58: Forest/vegetative cover ............................................................................................................................................................................................. 126
Table no. 59: Details of livestock in the project areas ..................................................................................................................................................................... 126
Table No. 60: Backward-Forward linkages ..................................................................................................................................................................................... 128
CHAPTER – 7 ......................................................................................................................................................................................................................................... 130
QUALITY AND SUSTAINABILITY ISSUES ...................................................................................................................................................................................... 130
Quality and Sustainability Issues ......................................................................................................................................................................................................... 131
CHAPTER – 8 ............................................................................................................................................................................................ Error! Bookmark not defined.
MAPS ......................................................................................................................................................................................................... Error! Bookmark not defined.
IWMP-3 Idar
District Watershed Development Unit, Sabarkanth
(5)
CHAPTER – 1
PROJECT BACKGROUND
IWMP-3 Idar
District Watershed Development Unit, Sabarkanth
(6)
Project Background
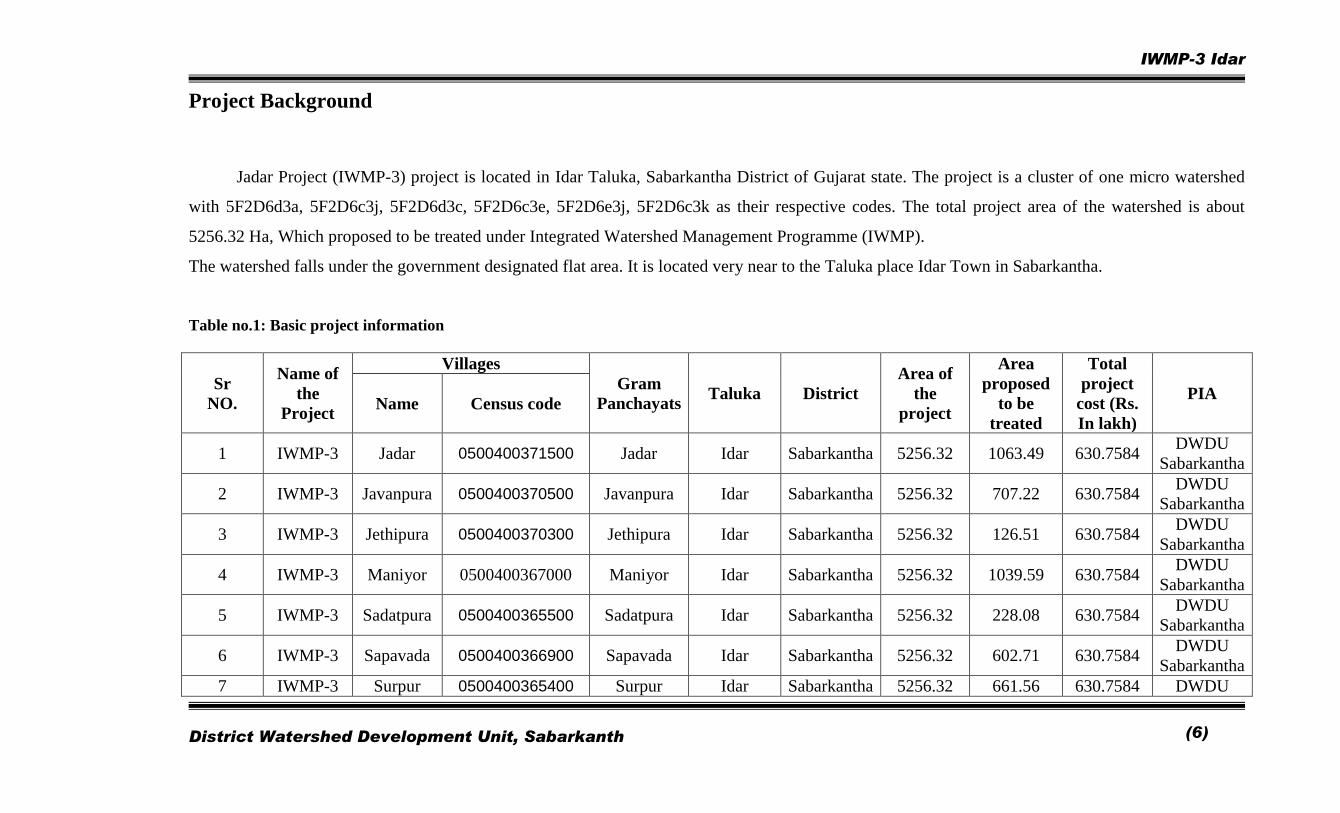
Jadar Project (IWMP-3) project is located in Idar Taluka, Sabarkantha District of Gujarat state. The project is a cluster of one micro watershed
with 5F2D6d3a, 5F2D6c3j, 5F2D6d3c, 5F2D6c3e, 5F2D6e3j, 5F2D6c3k as their respective codes. The total project area of the watershed is about
5256.32 Ha, Which proposed to be treated under Integrated Watershed Management Programme (IWMP).
The watershed falls under the government designated flat area. It is located very near to the Taluka place Idar Town in Sabarkantha.
Table no.1: Basic project information
Sr
NO.
Name of
the
Project
Villages
Gram
Panchayats Taluka District
Area of
the
project
Area
proposed
to be
treated
Total
project
cost (Rs.
In lakh)
PIA Name Census code
1 IWMP-3 Jadar 0500400371500 Jadar Idar Sabarkantha 5256.32 1063.49 630.7584 DWDU
Sabarkantha
2 IWMP-3 Javanpura 0500400370500 Javanpura Idar Sabarkantha 5256.32 707.22 630.7584 DWDU
Sabarkantha
3 IWMP-3 Jethipura 0500400370300 Jethipura Idar Sabarkantha 5256.32 126.51 630.7584 DWDU
Sabarkantha
4 IWMP-3 Maniyor 0500400367000 Maniyor Idar Sabarkantha 5256.32 1039.59 630.7584 DWDU
Sabarkantha
5 IWMP-3 Sadatpura 0500400365500 Sadatpura Idar Sabarkantha 5256.32 228.08 630.7584 DWDU
Sabarkantha
6 IWMP-3 Sapavada 0500400366900 Sapavada Idar Sabarkantha 5256.32 602.71 630.7584 DWDU
Sabarkantha
7 IWMP-3 Surpur 0500400365400 Surpur Idar Sabarkantha 5256.32 661.56 630.7584 DWDU
IWMP-3 Idar
District Watershed Development Unit, Sabarkanth
(7)
Sabarkantha
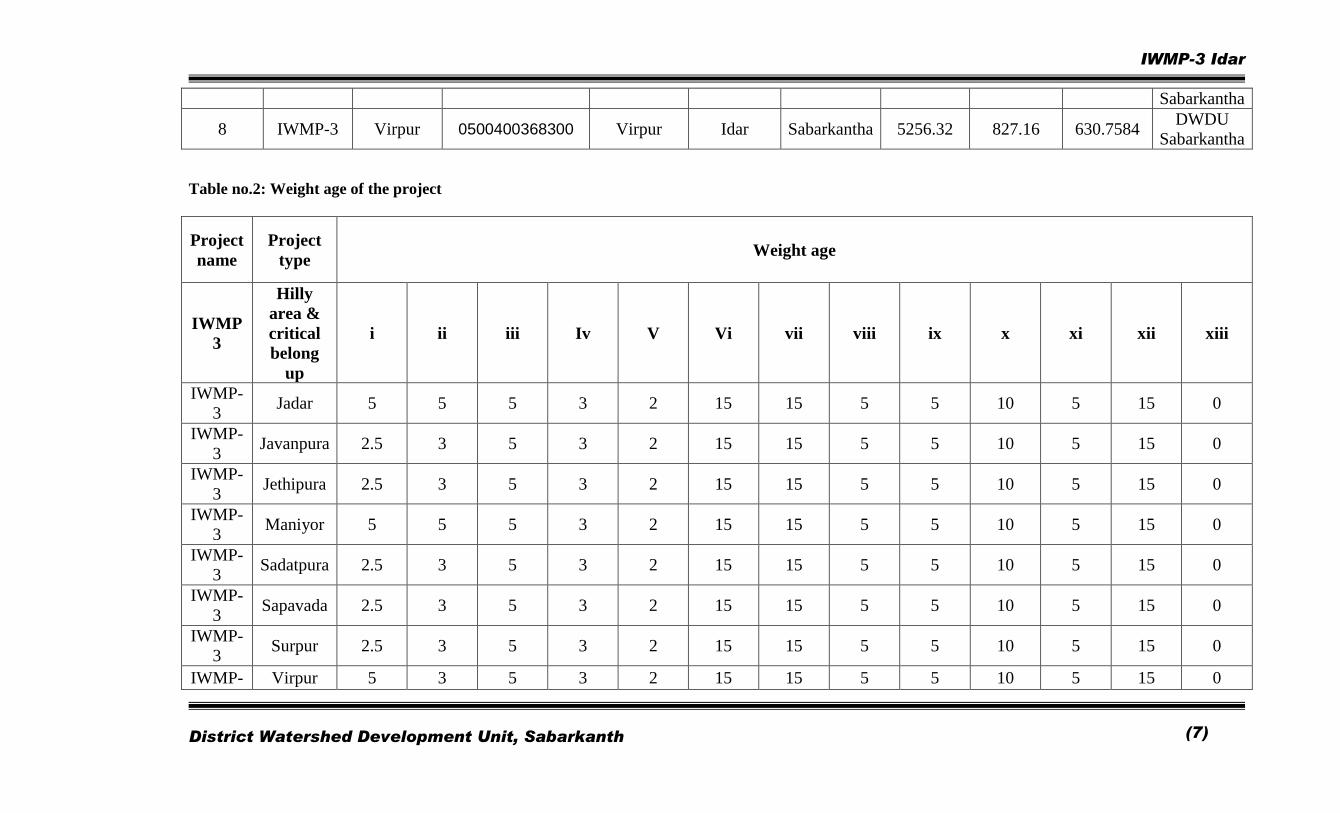
8 IWMP-3 Virpur 0500400368300 Virpur Idar Sabarkantha 5256.32 827.16 630.7584 DWDU
Sabarkantha
Table no.2: Weight age of the project
Project
name
Project
type Weight age
IWMP
3
Hilly
area &
critical
belong
up
i ii iii Iv V Vi vii viii ix x xi xii xiii
IWMP-
3 Jadar 5 5 5 3 2 15 15 5 5 10 5 15 0
IWMP-
3 Javanpura 2.5 3 5 3 2 15 15 5 5 10 5 15 0
IWMP-
3 Jethipura 2.5 3 5 3 2 15 15 5 5 10 5 15 0
IWMP-
3 Maniyor 5 5 5 3 2 15 15 5 5 10 5 15 0
IWMP-
3 Sadatpura 2.5 3 5 3 2 15 15 5 5 10 5 15 0
IWMP-
3 Sapavada 2.5 3 5 3 2 15 15 5 5 10 5 15 0
IWMP-
3 Surpur 2.5 3 5 3 2 15 15 5 5 10 5 15 0
IWMP- Virpur 5 3 5 3 2 15 15 5 5 10 5 15 0
IWMP-3 Idar
District Watershed Development Unit, Sabarkanth
(8)
3
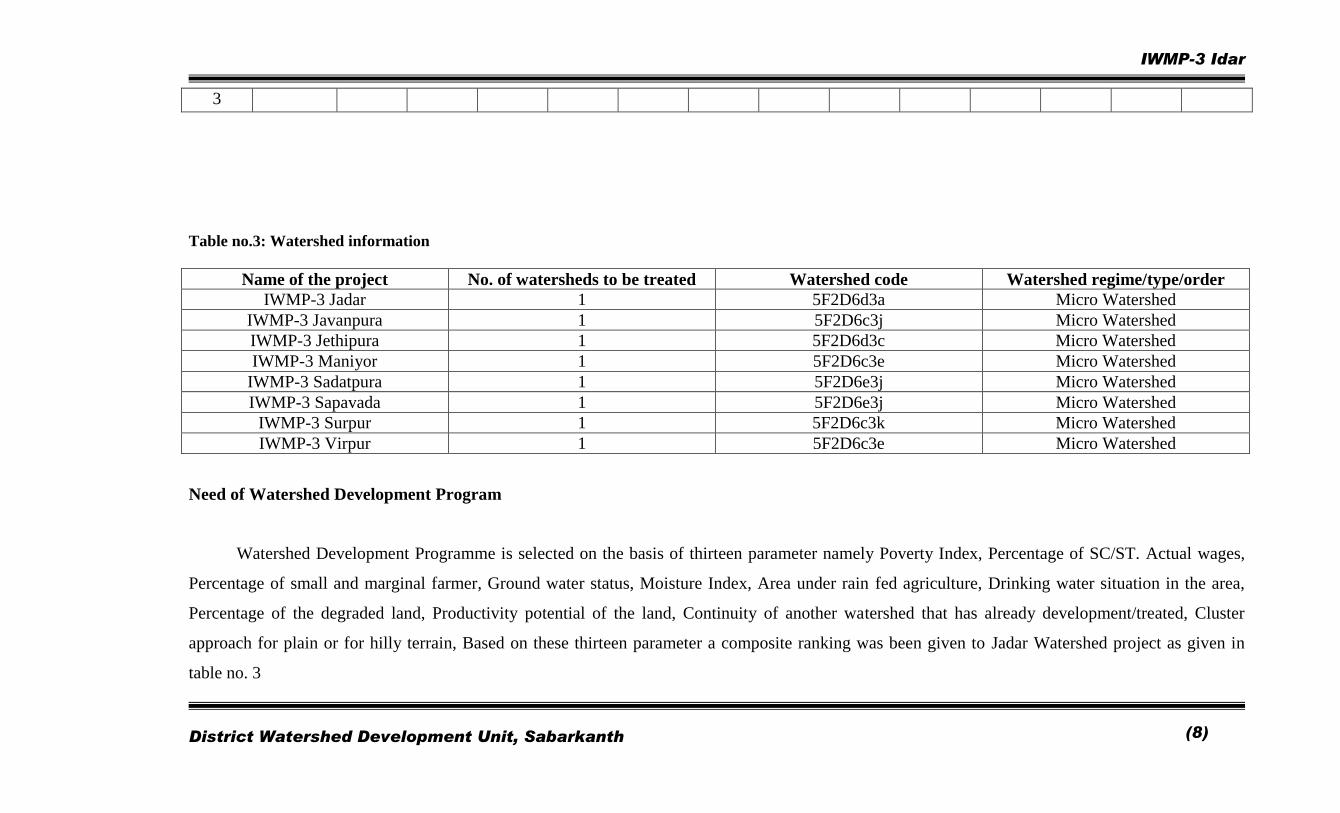
Table no.3: Watershed information
Name of the project No. of watersheds to be treated Watershed code Watershed regime/type/order
IWMP-3 Jadar 1 5F2D6d3a Micro Watershed
IWMP-3 Javanpura 1 5F2D6c3j Micro Watershed
IWMP-3 Jethipura 1 5F2D6d3c Micro Watershed
IWMP-3 Maniyor 1 5F2D6c3e Micro Watershed
IWMP-3 Sadatpura 1 5F2D6e3j Micro Watershed
IWMP-3 Sapavada 1 5F2D6e3j Micro Watershed
IWMP-3 Surpur 1 5F2D6c3k Micro Watershed
IWMP-3 Virpur 1 5F2D6c3e Micro Watershed
Need of Watershed Development Program
Watershed Development Programme is selected on the basis of thirteen parameter namely Poverty Index, Percentage of SC/ST. Actual wages,
Percentage of small and marginal farmer, Ground water status, Moisture Index, Area under rain fed agriculture, Drinking water situation in the area,
Percentage of the degraded land, Productivity potential of the land, Continuity of another watershed that has already development/treated, Cluster
approach for plain or for hilly terrain, Based on these thirteen parameter a composite ranking was been given to Jadar Watershed project as given in
table no. 3
IWMP-3 Idar
District Watershed Development Unit, Sabarkanth
(9)
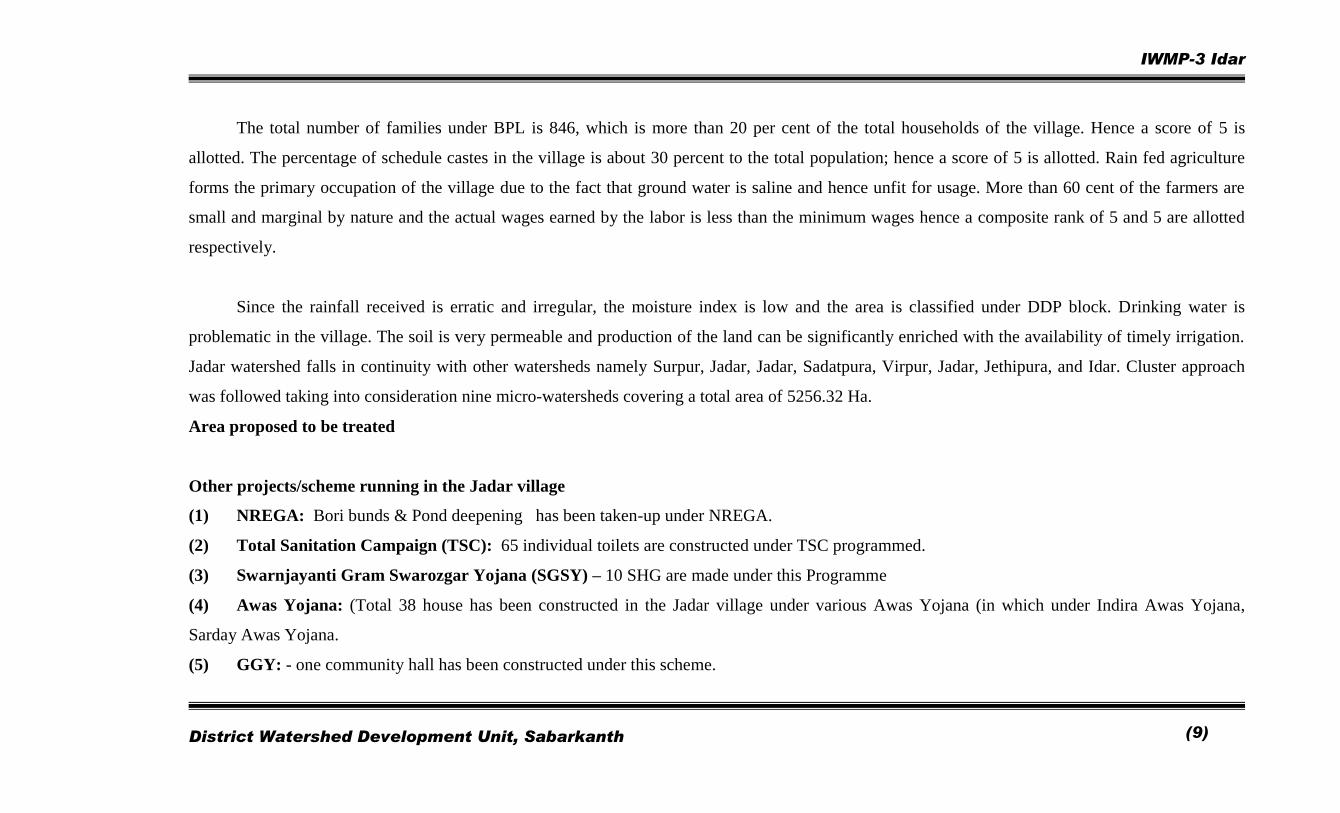
The total number of families under BPL is 846, which is more than 20 per cent of the total households of the village. Hence a score of 5 is
allotted. The percentage of schedule castes in the village is about 30 percent to the total population; hence a score of 5 is allotted. Rain fed agriculture
forms the primary occupation of the village due to the fact that ground water is saline and hence unfit for usage. More than 60 cent of the farmers are
small and marginal by nature and the actual wages earned by the labor is less than the minimum wages hence a composite rank of 5 and 5 are allotted
respectively.
Since the rainfall received is erratic and irregular, the moisture index is low and the area is classified under DDP block. Drinking water is
problematic in the village. The soil is very permeable and production of the land can be significantly enriched with the availability of timely irrigation.
Jadar watershed falls in continuity with other watersheds namely Surpur, Jadar, Jadar, Sadatpura, Virpur, Jadar, Jethipura, and Idar. Cluster approach
was followed taking into consideration nine micro-watersheds covering a total area of 5256.32 Ha.
Area proposed to be treated
Other projects/scheme running in the Jadar village
(1) NREGA: Bori bunds & Pond deepening has been taken-up under NREGA.
(2) Total Sanitation Campaign (TSC): 65 individual toilets are constructed under TSC programmed.
(3) Swarnjayanti Gram Swarozgar Yojana (SGSY) – 10 SHG are made under this Programme
(4) Awas Yojana: (Total 38 house has been constructed in the Jadar village under various Awas Yojana (in which under Indira Awas Yojana,
Sarday Awas Yojana.
(5) GGY: - one community hall has been constructed under this scheme.
IWMP-3 Idar
District Watershed Development Unit, Sabarkanth
(10)
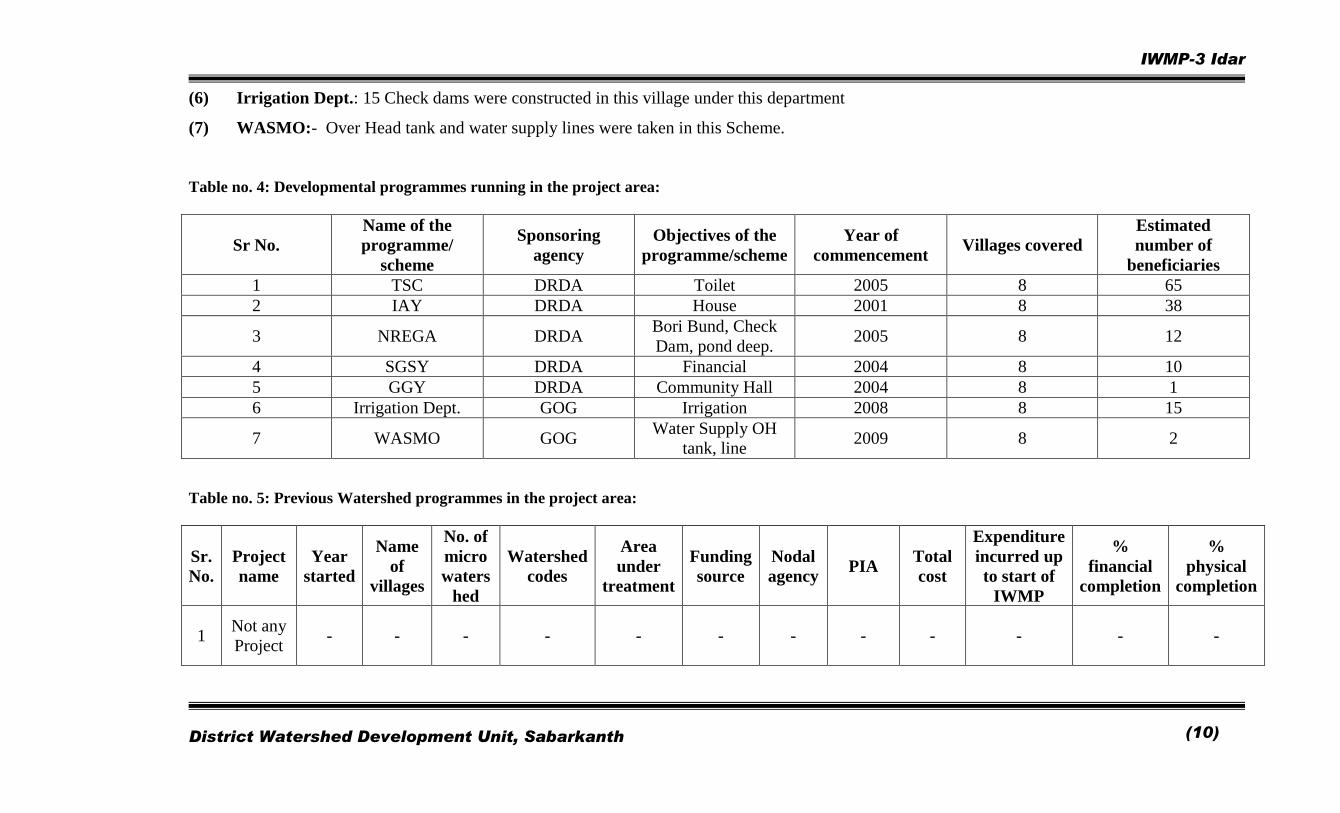
(6) Irrigation Dept.: 15 Check dams were constructed in this village under this department
(7) WASMO:- Over Head tank and water supply lines were taken in this Scheme.
Table no. 4: Developmental programmes running in the project area:
Sr No.
Name of the
programme/
scheme
Sponsoring
agency
Objectives of the
programme/scheme
Year of
commencement Villages covered
Estimated
number of
beneficiaries
1 TSC DRDA Toilet 2005 8 65
2 IAY DRDA House 2001 8 38
3 NREGA DRDA Bori Bund, Check
Dam, pond deep. 2005 8 12
4 SGSY DRDA Financial 2004 8 10
5 GGY DRDA Community Hall 2004 8 1
6 Irrigation Dept. GOG Irrigation 2008 8 15
7 WASMO GOG Water Supply OH
tank, line 2009 8 2
Table no. 5: Previous Watershed programmes in the project area:
Sr.
No.
Project
name
Year
started
Name
of
villages
No. of
micro
waters
hed
Watershed
codes
Area
under
treatment
Funding
source
Nodal
agency PIA
Total
cost
Expenditure
incurred up
to start of
IWMP
%
financial
completion
%
physical
completion
1 Not any
Project - - - - - - - - - - - -

IWMP-3 Idar
District Watershed Development Unit, Sabarkanth
(11)
IWMP-3 Idar
District Watershed Development Unit, Sabarkanth
(12)
CHAPTER – 2
PROJECT IMPLEMENTING AGENCY
Project Implementing Agency
The Project Implementing Agency (PIA) is being selected by an appropriate mechanism by State Level Nodal Agency (SLNL). PIAs would responsible
for implementation of watershed project. These PIAs may include relevant line departments, autonomous organizations under State / Central,
IWMP-3 Idar
District Watershed Development Unit, Sabarkanth
(13)
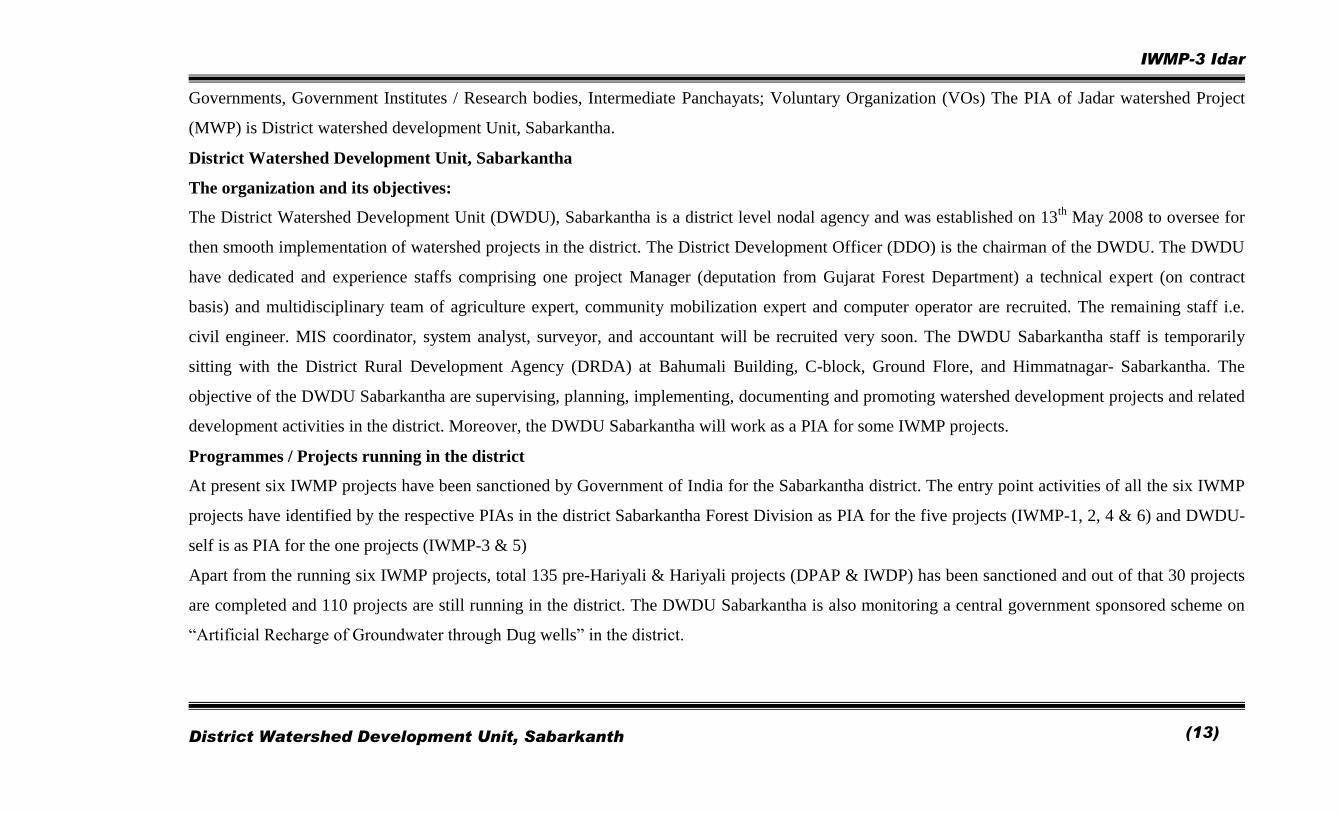
Governments, Government Institutes / Research bodies, Intermediate Panchayats; Voluntary Organization (VOs) The PIA of Jadar watershed Project
(MWP) is District watershed development Unit, Sabarkantha.
District Watershed Development Unit, Sabarkantha
The organization and its objectives:
The District Watershed Development Unit (DWDU), Sabarkantha is a district level nodal agency and was established on 13th
May 2008 to oversee for
then smooth implementation of watershed projects in the district. The District Development Officer (DDO) is the chairman of the DWDU. The DWDU
have dedicated and experience staffs comprising one project Manager (deputation from Gujarat Forest Department) a technical expert (on contract
basis) and multidisciplinary team of agriculture expert, community mobilization expert and computer operator are recruited. The remaining staff i.e.
civil engineer. MIS coordinator, system analyst, surveyor, and accountant will be recruited very soon. The DWDU Sabarkantha staff is temporarily
sitting with the District Rural Development Agency (DRDA) at Bahumali Building, C-block, Ground Flore, and Himmatnagar- Sabarkantha. The
objective of the DWDU Sabarkantha are supervising, planning, implementing, documenting and promoting watershed development projects and related
development activities in the district. Moreover, the DWDU Sabarkantha will work as a PIA for some IWMP projects.
Programmes / Projects running in the district
At present six IWMP projects have been sanctioned by Government of India for the Sabarkantha district. The entry point activities of all the six IWMP
projects have identified by the respective PIAs in the district Sabarkantha Forest Division as PIA for the five projects (IWMP-1, 2, 4 & 6) and DWDU-
self is as PIA for the one projects (IWMP-3 & 5)
Apart from the running six IWMP projects, total 135 pre-Hariyali & Hariyali projects (DPAP & IWDP) has been sanctioned and out of that 30 projects
are completed and 110 projects are still running in the district. The DWDU Sabarkantha is also monitoring a central government sponsored scheme on
“Artificial Recharge of Groundwater through Dug wells” in the district.
IWMP-3 Idar
District Watershed Development Unit, Sabarkanth
(14)
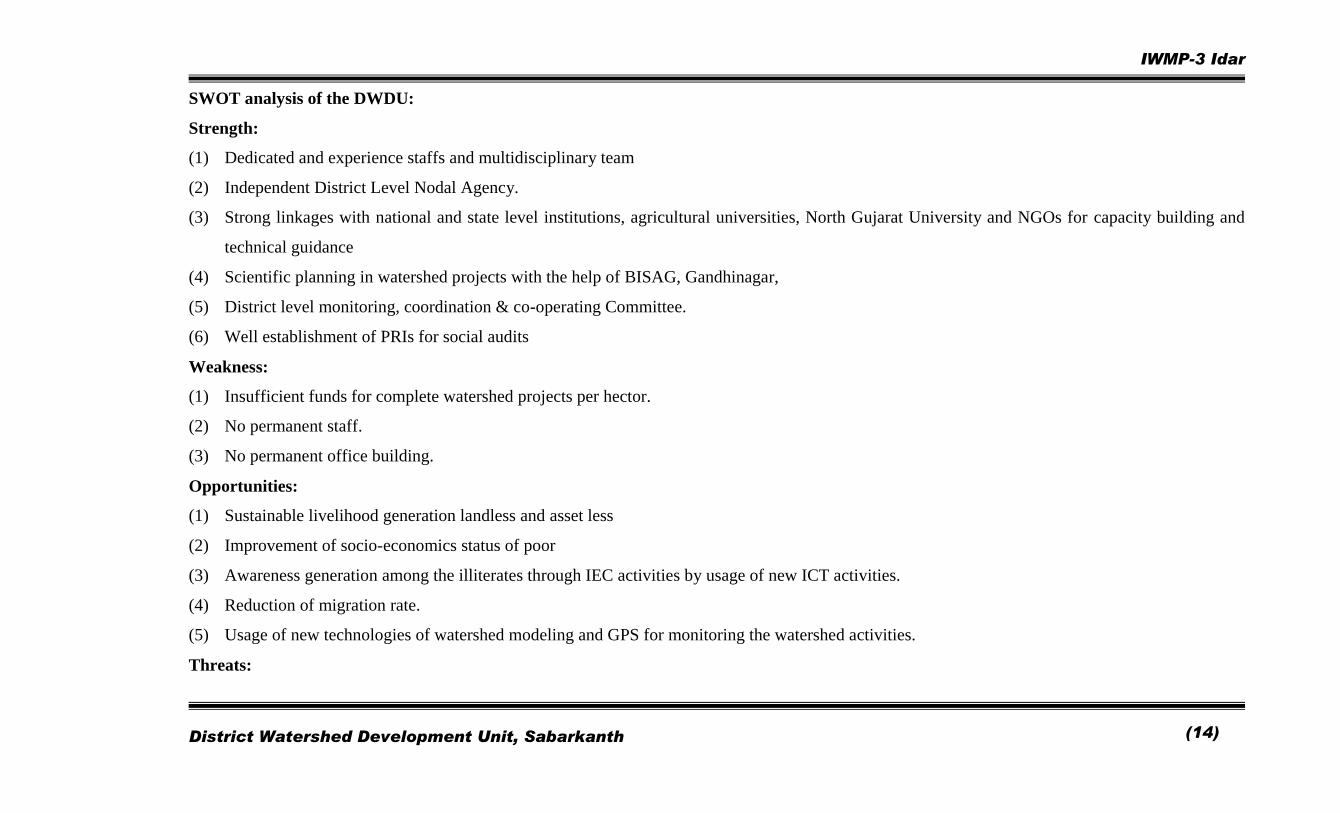
SWOT analysis of the DWDU:
Strength:
(1) Dedicated and experience staffs and multidisciplinary team
(2) Independent District Level Nodal Agency.
(3) Strong linkages with national and state level institutions, agricultural universities, North Gujarat University and NGOs for capacity building and
technical guidance
(4) Scientific planning in watershed projects with the help of BISAG, Gandhinagar,
(5) District level monitoring, coordination & co-operating Committee.
(6) Well establishment of PRIs for social audits
Weakness:
(1) Insufficient funds for complete watershed projects per hector.
(2) No permanent staff.
(3) No permanent office building.
Opportunities:
(1) Sustainable livelihood generation landless and asset less
(2) Improvement of socio-economics status of poor
(3) Awareness generation among the illiterates through IEC activities by usage of new ICT activities.
(4) Reduction of migration rate.
(5) Usage of new technologies of watershed modeling and GPS for monitoring the watershed activities.
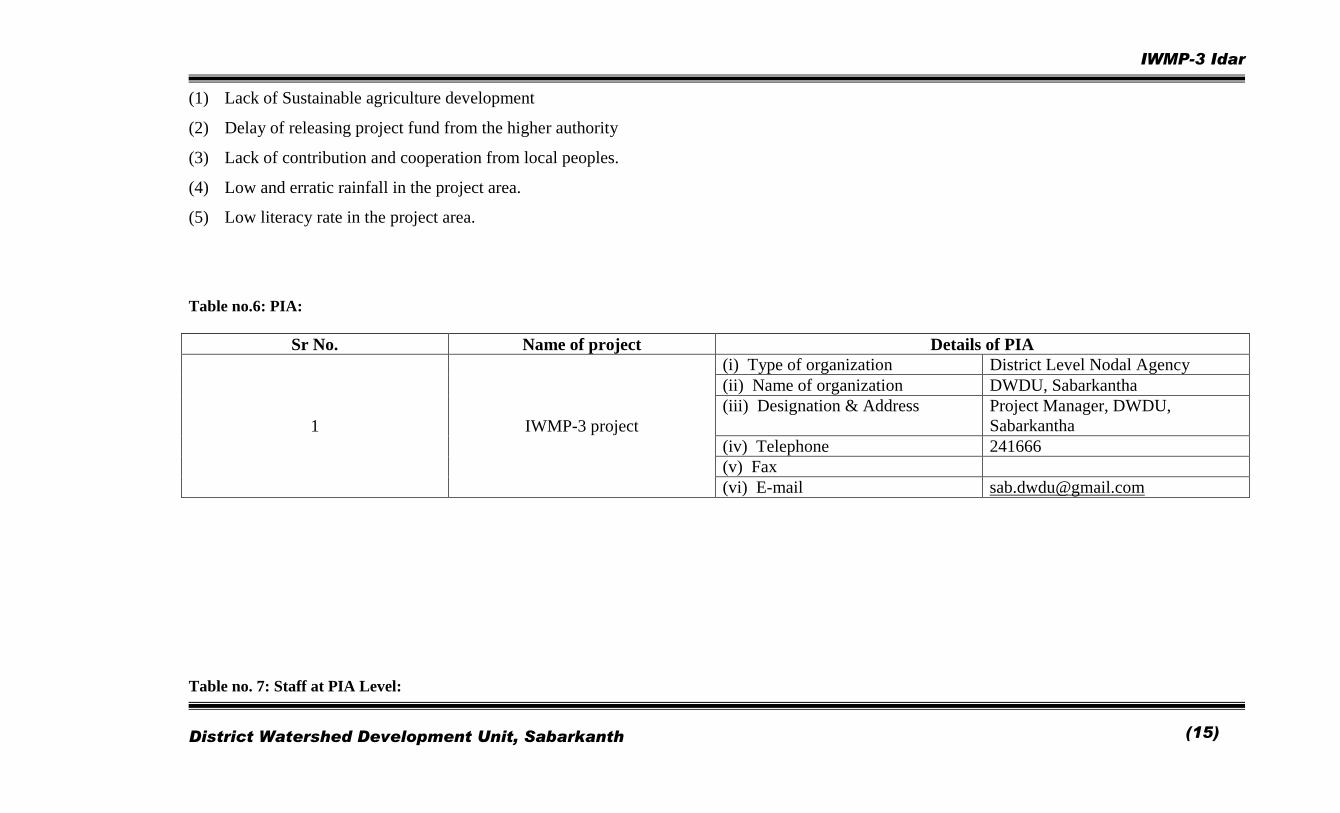
Threats:
IWMP-3 Idar
District Watershed Development Unit, Sabarkanth
(15)
(1) Lack of Sustainable agriculture development
(2) Delay of releasing project fund from the higher authority
(3) Lack of contribution and cooperation from local peoples.
(4) Low and erratic rainfall in the project area.
(5) Low literacy rate in the project area.
Table no.6: PIA:
Sr No. Name of project Details of PIA
1 IWMP-3 project
(i) Type of organization District Level Nodal Agency
(ii) Name of organization DWDU, Sabarkantha
(iii) Designation & Address Project Manager, DWDU,
Sabarkantha
(iv) Telephone 241666
(v) Fax
(vi) E-mail [email protected]
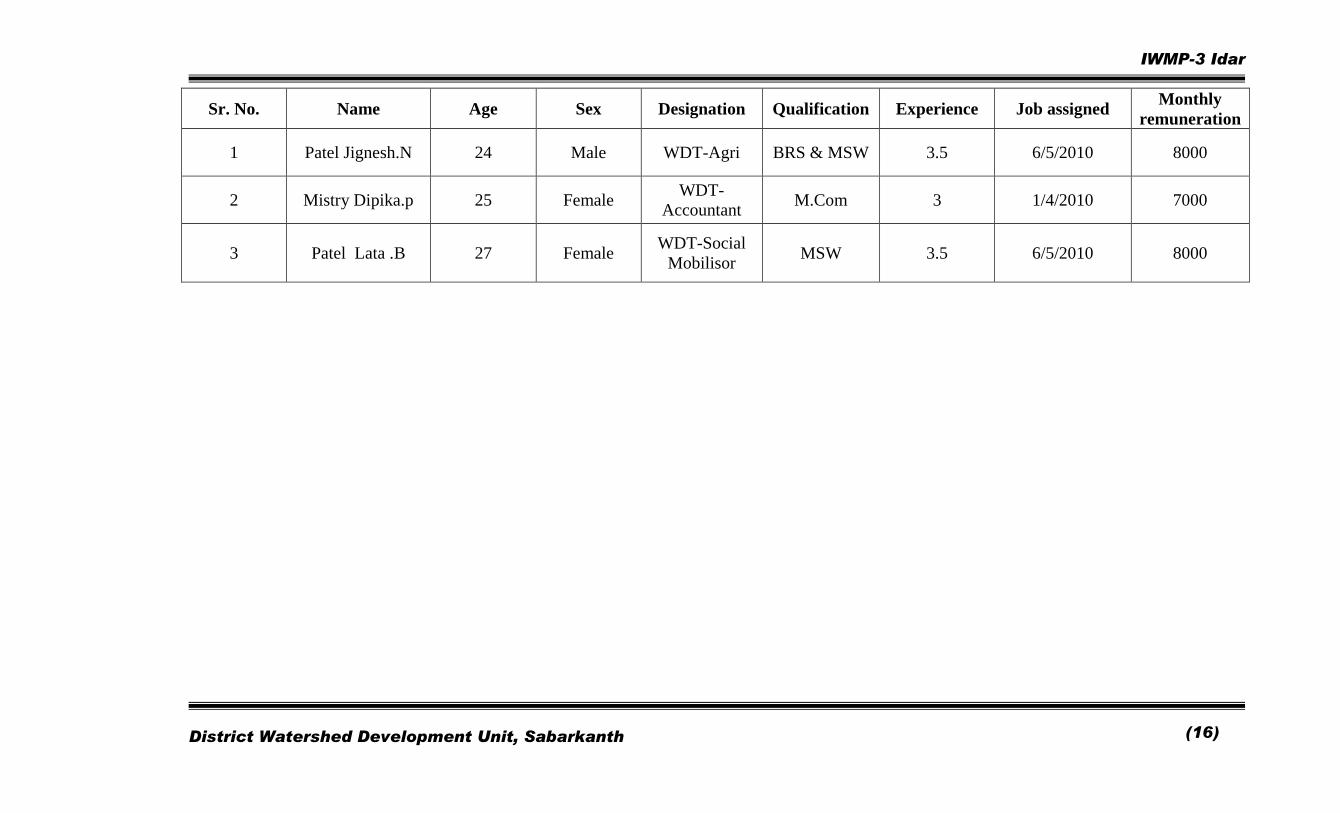
Table no. 7: Staff at PIA Level:
IWMP-3 Idar
District Watershed Development Unit, Sabarkanth
(16)
Sr. No. Name Age Sex Designation Qualification Experience Job assigned Monthly
remuneration
1 Patel Jignesh.N 24 Male WDT-Agri BRS & MSW 3.5 6/5/2010 8000
2 Mistry Dipika.p 25 Female WDT-
Accountant M.Com 3 1/4/2010 7000
3 Patel Lata .B 27 Female WDT-Social
Mobilisor MSW 3.5 6/5/2010 8000
IWMP-3 Idar
District Watershed Development Unit, Sabarkanth
(17)
CHAPTER – 3
BASIC INFORMATION OF PROJECT AREA

IWMP-3 Idar
District Watershed Development Unit, Sabarkanth
(18)
Fig. Village Meeting Photograph
Basic Information of Project Area
Idar block watershed is located in the district of Sabarkantha about 28 Kms. From district head quarters. The project area is characterized by high
temperature and low rainfall. The proposed watershed has a land area of 5256.32 ha will be treated. The Idar block watershed project is characterized by
Flat with varying slopes and drainages. The soil and underground water is highly saline which results in acute shortage of drinking water.
Land use pattern:
IWMP-3 Idar
District Watershed Development Unit, Sabarkanth
(19)
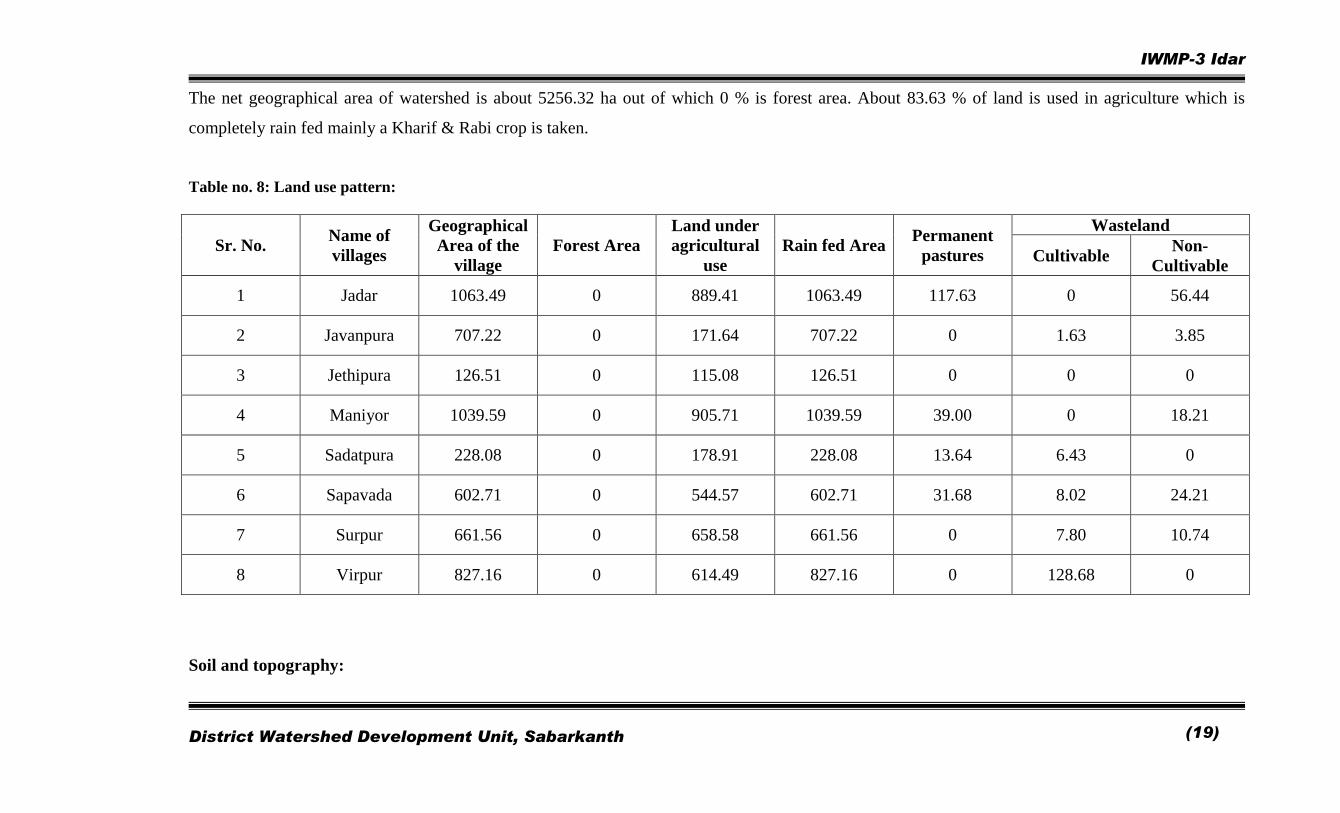
The net geographical area of watershed is about 5256.32 ha out of which 0 % is forest area. About 83.63 % of land is used in agriculture which is
completely rain fed mainly a Kharif & Rabi crop is taken.
Table no. 8: Land use pattern:
Sr. No. Name of
villages
Geographical
Area of the
village
Forest Area
Land under
agricultural
use
Rain fed Area Permanent
pastures
Wasteland
Cultivable Non-
Cultivable
1 Jadar 1063.49 0 889.41 1063.49 117.63 0 56.44
2 Javanpura 707.22 0 171.64 707.22 0 1.63 3.85
3 Jethipura 126.51 0 115.08 126.51 0 0 0
4 Maniyor 1039.59 0 905.71 1039.59 39.00 0 18.21
5 Sadatpura 228.08 0 178.91 228.08 13.64 6.43 0
6 Sapavada 602.71 0 544.57 602.71 31.68 8.02 24.21
7 Surpur 661.56 0 658.58 661.56 0 7.80 10.74
8 Virpur 827.16 0 614.49 827.16 0 128.68 0
Soil and topography:
IWMP-3 Idar
District Watershed Development Unit, Sabarkanth
(20)
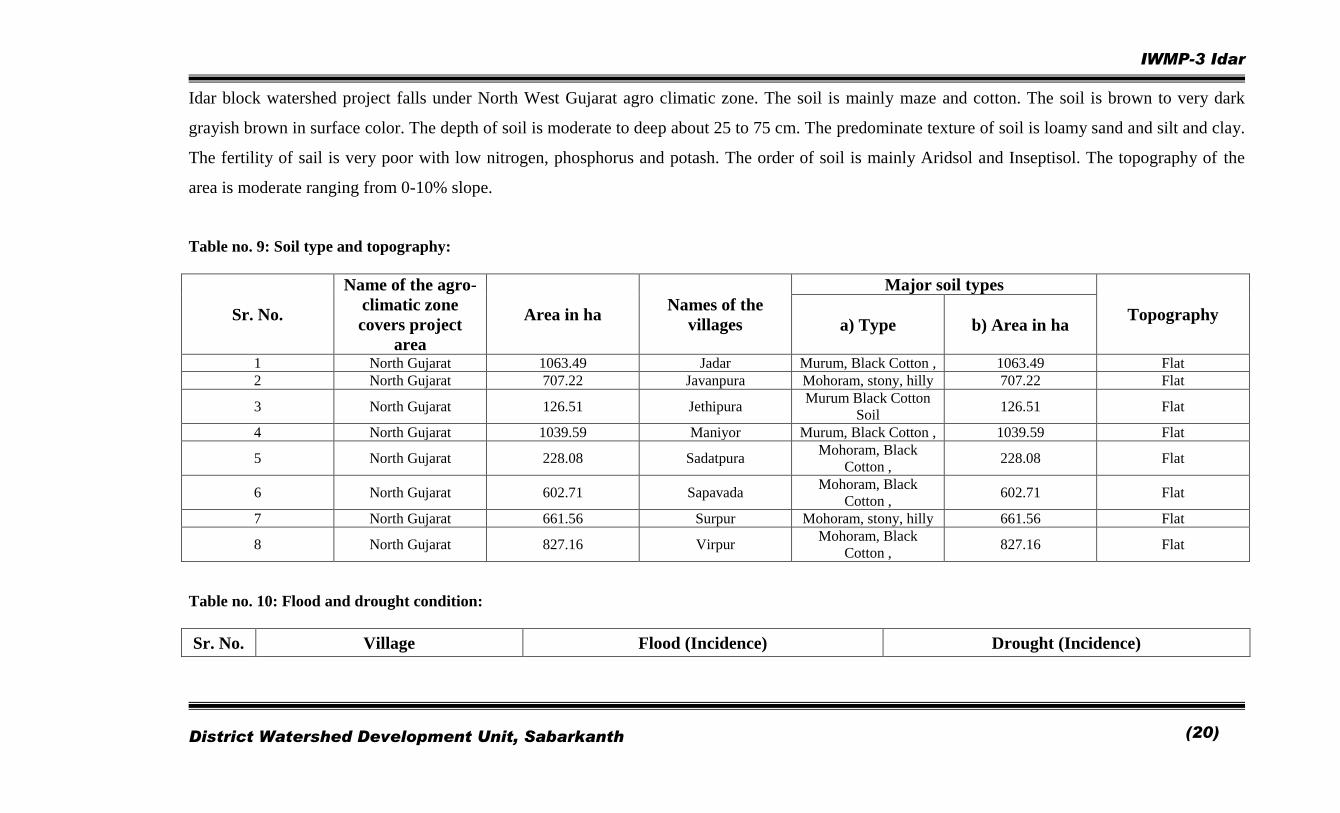
Idar block watershed project falls under North West Gujarat agro climatic zone. The soil is mainly maze and cotton. The soil is brown to very dark
grayish brown in surface color. The depth of soil is moderate to deep about 25 to 75 cm. The predominate texture of soil is loamy sand and silt and clay.
The fertility of sail is very poor with low nitrogen, phosphorus and potash. The order of soil is mainly Aridsol and Inseptisol. The topography of the
area is moderate ranging from 0-10% slope.
Table no. 9: Soil type and topography:
Sr. No.
Name of the agro-
climatic zone
covers project
area
Area in ha Names of the
villages
Major soil types
Topography a) Type b) Area in ha
1 North Gujarat 1063.49 Jadar Murum, Black Cotton , 1063.49 Flat
2 North Gujarat 707.22 Javanpura Mohoram, stony, hilly 707.22 Flat
3 North Gujarat 126.51 Jethipura Murum Black Cotton
Soil 126.51 Flat
4 North Gujarat 1039.59 Maniyor Murum, Black Cotton , 1039.59 Flat
5 North Gujarat 228.08 Sadatpura Mohoram, Black
Cotton , 228.08 Flat
6 North Gujarat 602.71 Sapavada Mohoram, Black
Cotton , 602.71 Flat
7 North Gujarat 661.56 Surpur Mohoram, stony, hilly 661.56 Flat
8 North Gujarat 827.16 Virpur Mohoram, Black
Cotton , 827.16 Flat
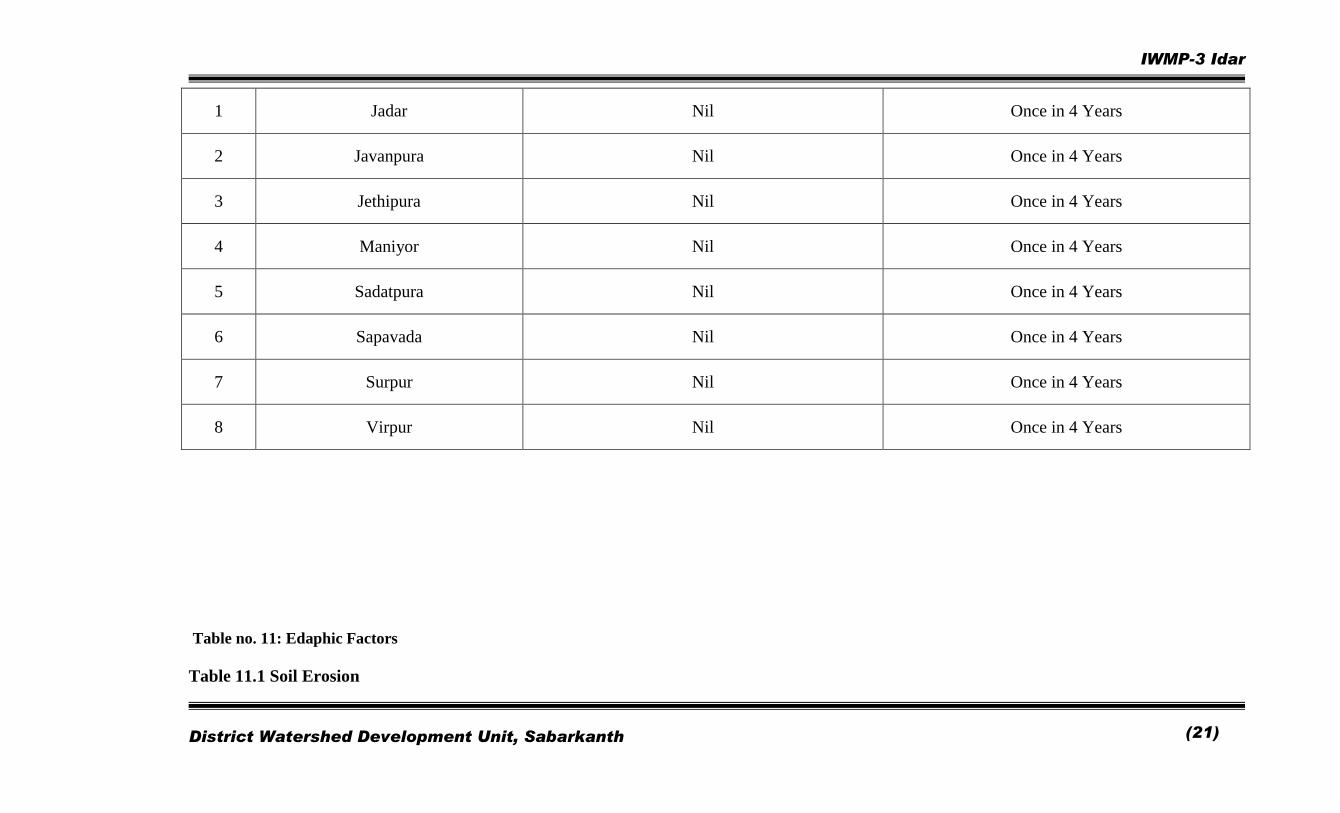
Table no. 10: Flood and drought condition:
Sr. No. Village Flood (Incidence) Drought (Incidence)
IWMP-3 Idar
District Watershed Development Unit, Sabarkanth
(21)
1 Jadar Nil Once in 4 Years
2 Javanpura Nil Once in 4 Years
3 Jethipura Nil Once in 4 Years
4 Maniyor Nil Once in 4 Years
5 Sadatpura Nil Once in 4 Years
6 Sapavada Nil Once in 4 Years
7 Surpur Nil Once in 4 Years
8 Virpur Nil Once in 4 Years
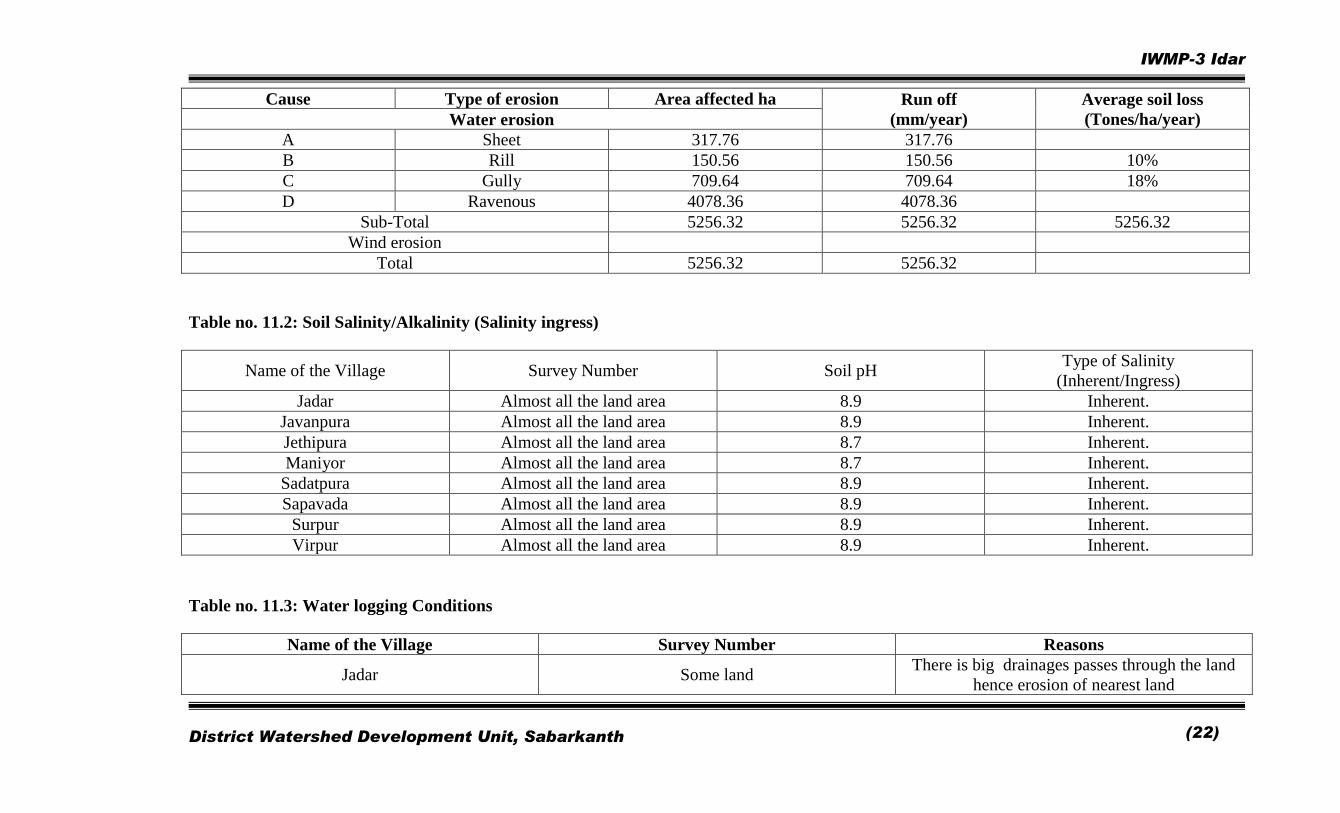
Table no. 11: Edaphic Factors
Table 11.1 Soil Erosion
IWMP-3 Idar
District Watershed Development Unit, Sabarkanth
(22)
Cause Type of erosion Area affected ha Run off
(mm/year)
Average soil loss
(Tones/ha/year) Water erosion
A Sheet 317.76 317.76
B Rill 150.56 150.56 10%
C Gully 709.64 709.64 18%
D Ravenous 4078.36 4078.36
Sub-Total 5256.32 5256.32 5256.32
Wind erosion
Total 5256.32 5256.32
Table no. 11.2: Soil Salinity/Alkalinity (Salinity ingress)
Name of the Village Survey Number Soil pH Type of Salinity
(Inherent/Ingress)
Jadar Almost all the land area 8.9 Inherent.
Javanpura Almost all the land area 8.9 Inherent.
Jethipura Almost all the land area 8.7 Inherent.
Maniyor Almost all the land area 8.7 Inherent.
Sadatpura Almost all the land area 8.9 Inherent.
Sapavada Almost all the land area 8.9 Inherent.
Surpur Almost all the land area 8.9 Inherent.
Virpur Almost all the land area 8.9 Inherent.
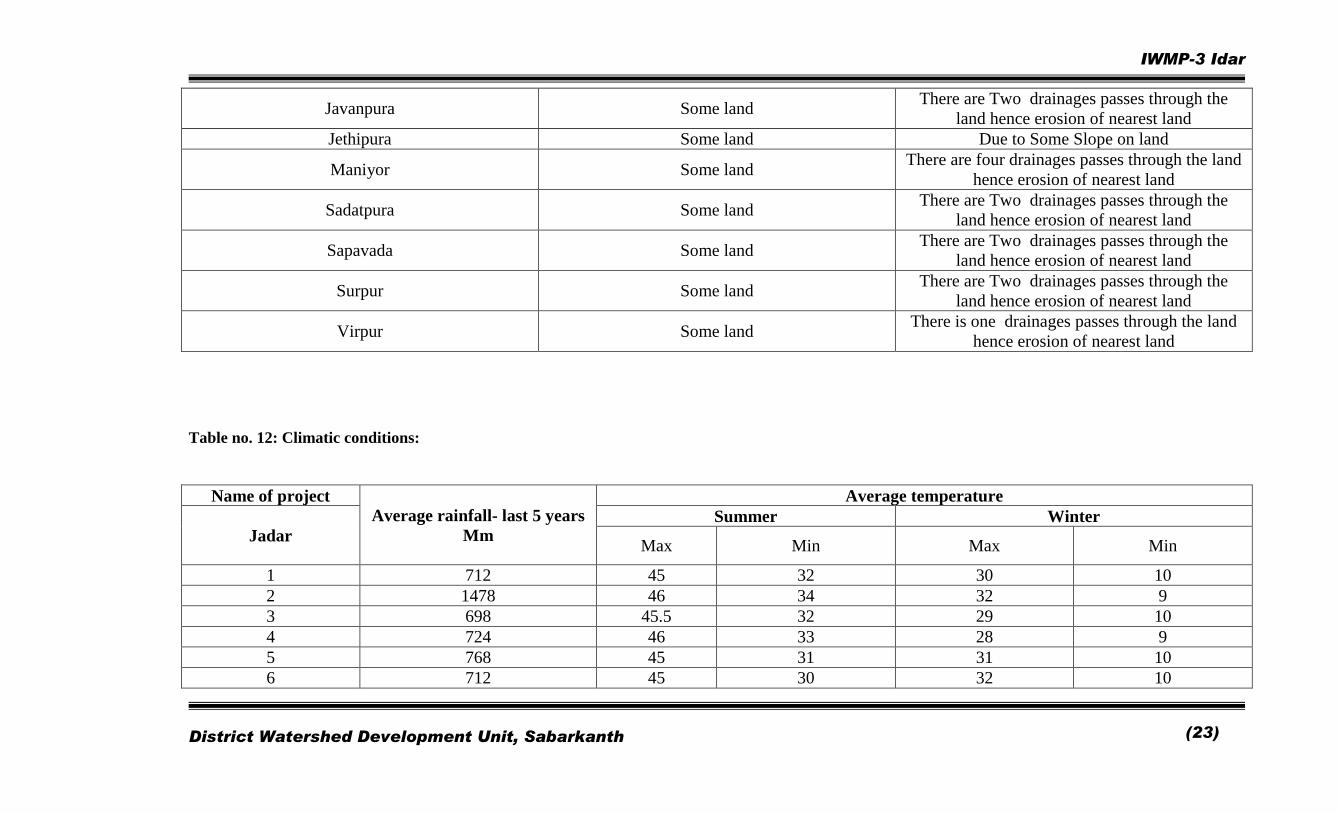
Table no. 11.3: Water logging Conditions
Name of the Village Survey Number Reasons
Jadar Some land There is big drainages passes through the land
hence erosion of nearest land
IWMP-3 Idar
District Watershed Development Unit, Sabarkanth
(23)
Javanpura Some land There are Two drainages passes through the
land hence erosion of nearest land
Jethipura Some land Due to Some Slope on land
Maniyor Some land There are four drainages passes through the land
hence erosion of nearest land
Sadatpura Some land There are Two drainages passes through the
land hence erosion of nearest land
Sapavada Some land There are Two drainages passes through the
land hence erosion of nearest land
Surpur Some land There are Two drainages passes through the
land hence erosion of nearest land
Virpur Some land There is one drainages passes through the land
hence erosion of nearest land
Table no. 12: Climatic conditions:
Name of project
Average rainfall- last 5 years
Mm
Average temperature
Jadar
Summer Winter
Max Min Max Min
1 712 45 32 30 10
2 1478 46 34 32 9
3 698 45.5 32 29 10
4 724 46 33 28 9
5 768 45 31 31 10
6 712 45 30 32 10
IWMP-3 Idar
District Watershed Development Unit, Sabarkanth
(24)
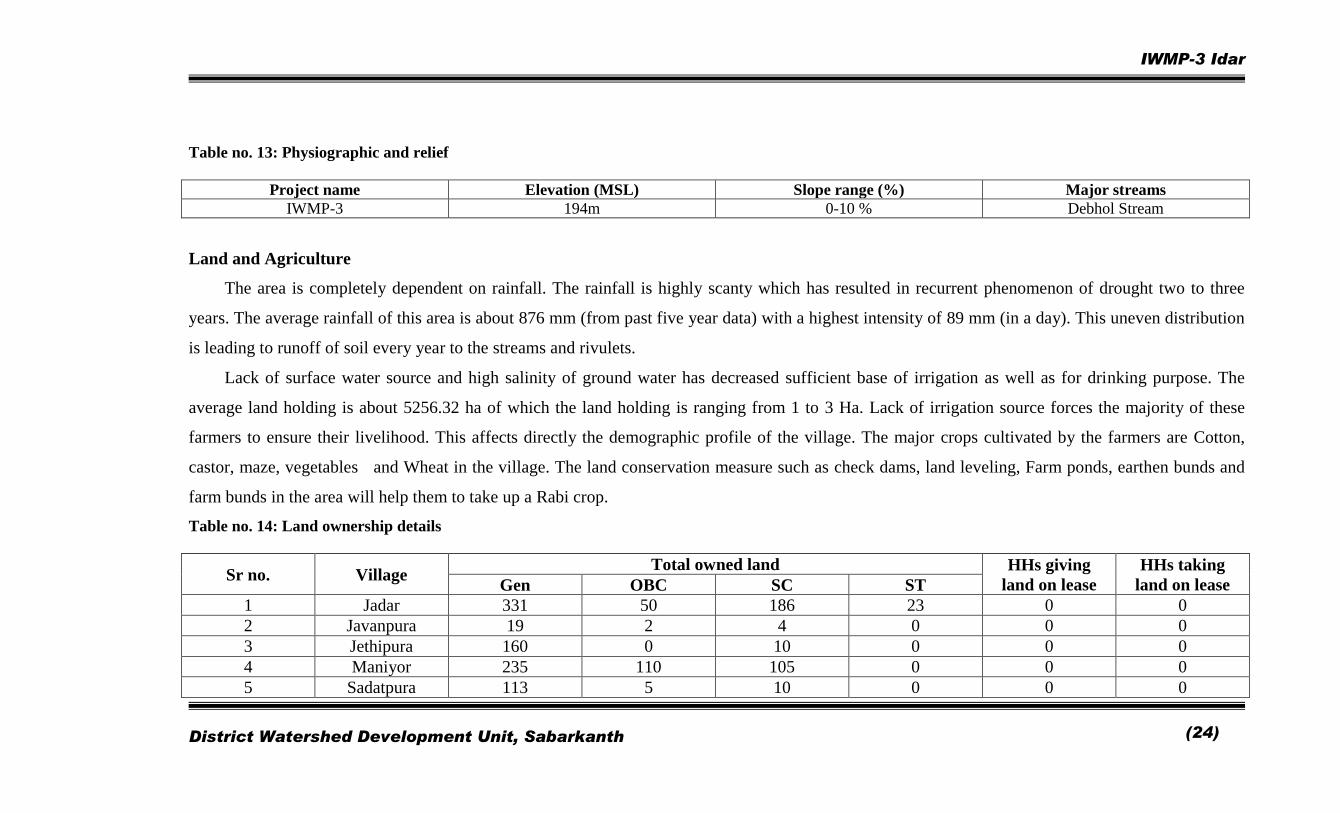
Table no. 13: Physiographic and relief
Project name Elevation (MSL) Slope range (%) Major streams
IWMP-3 194m 0-10 % Debhol Stream
Land and Agriculture
The area is completely dependent on rainfall. The rainfall is highly scanty which has resulted in recurrent phenomenon of drought two to three
years. The average rainfall of this area is about 876 mm (from past five year data) with a highest intensity of 89 mm (in a day). This uneven distribution
is leading to runoff of soil every year to the streams and rivulets.
Lack of surface water source and high salinity of ground water has decreased sufficient base of irrigation as well as for drinking purpose. The
average land holding is about 5256.32 ha of which the land holding is ranging from 1 to 3 Ha. Lack of irrigation source forces the majority of these
farmers to ensure their livelihood. This affects directly the demographic profile of the village. The major crops cultivated by the farmers are Cotton,
castor, maze, vegetables and Wheat in the village. The land conservation measure such as check dams, land leveling, Farm ponds, earthen bunds and
farm bunds in the area will help them to take up a Rabi crop.
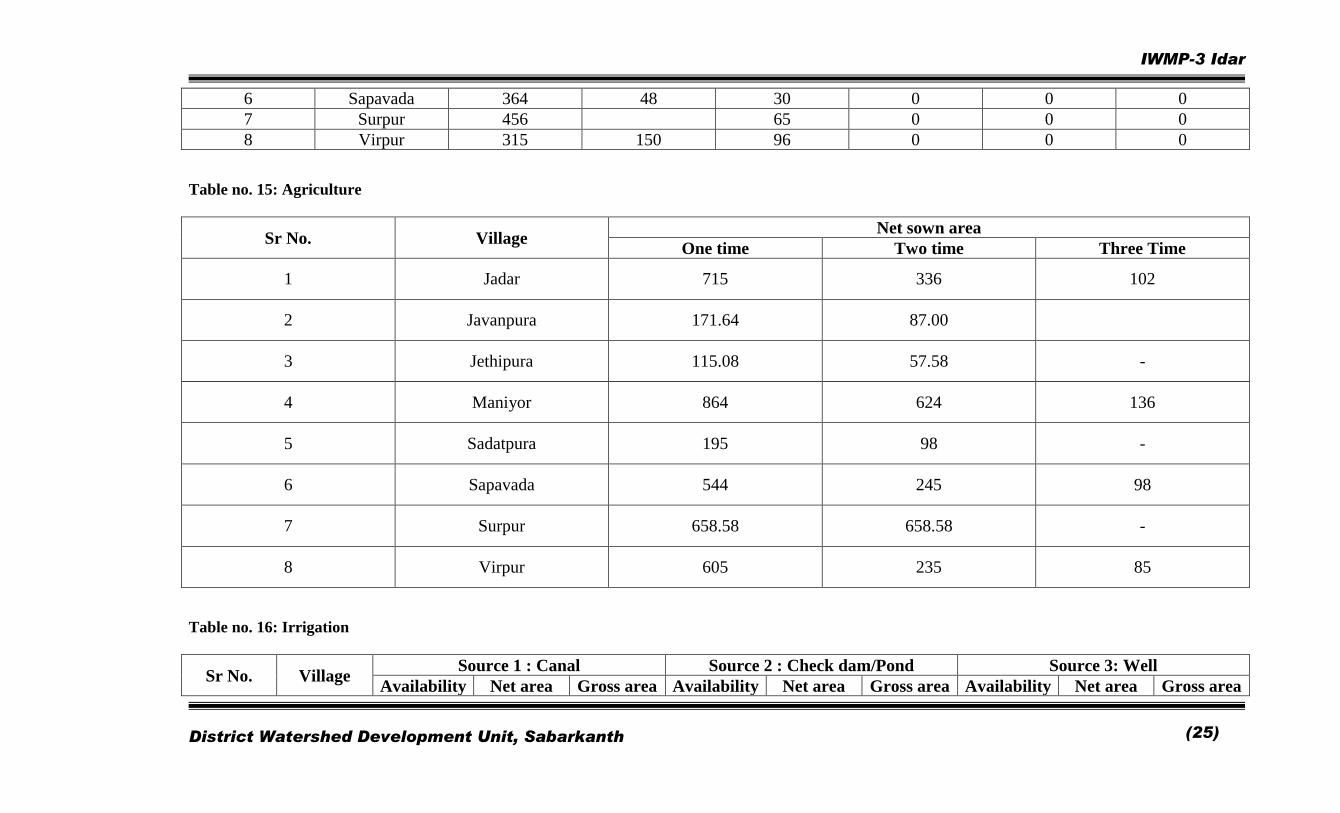
Table no. 14: Land ownership details
Sr no. Village Total owned land HHs giving
land on lease
HHs taking
land on lease Gen OBC SC ST
1 Jadar 331 50 186 23 0 0
2 Javanpura 19 2 4 0 0 0
3 Jethipura 160 0 10 0 0 0
4 Maniyor 235 110 105 0 0 0
5 Sadatpura 113 5 10 0 0 0
IWMP-3 Idar
District Watershed Development Unit, Sabarkanth
(25)
6 Sapavada 364 48 30 0 0 0
7 Surpur 456 65 0 0 0
8 Virpur 315 150 96 0 0 0
Table no. 15: Agriculture
Sr No. Village Net sown area
One time Two time Three Time
1 Jadar 715 336 102
2 Javanpura 171.64 87.00
3 Jethipura 115.08 57.58 -
4 Maniyor 864 624 136
5 Sadatpura 195 98 -
6 Sapavada 544 245 98
7 Surpur 658.58 658.58 -
8 Virpur 605 235 85
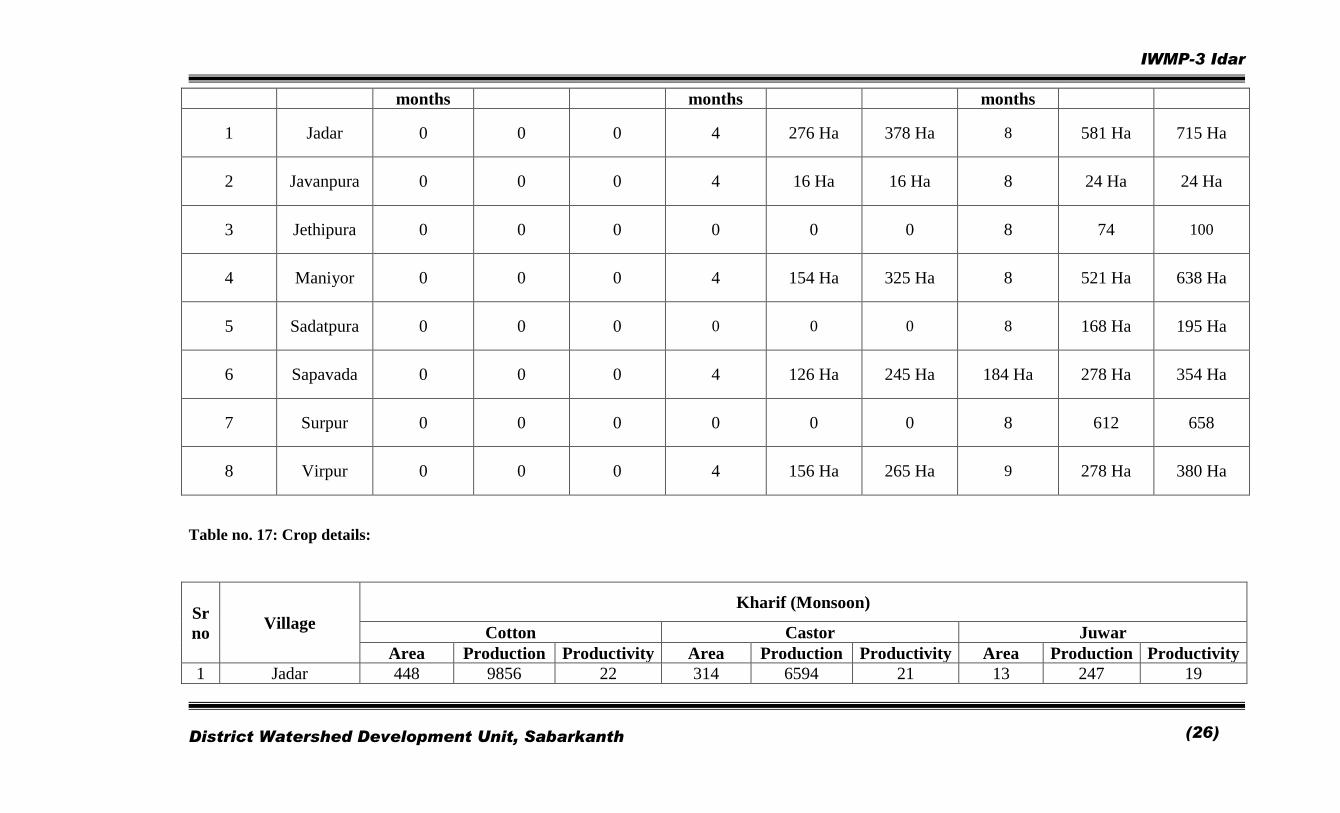
Table no. 16: Irrigation
Sr No. Village Source 1 : Canal Source 2 : Check dam/Pond Source 3: Well
Availability Net area Gross area Availability Net area Gross area Availability Net area Gross area
IWMP-3 Idar
District Watershed Development Unit, Sabarkanth
(26)
months months months
1 Jadar 0 0 0 4 276 Ha 378 Ha 8 581 Ha 715 Ha
2 Javanpura 0 0 0 4 16 Ha 16 Ha 8 24 Ha 24 Ha
3 Jethipura 0 0 0 0 0 0 8 74 100
4 Maniyor 0 0 0 4 154 Ha 325 Ha 8 521 Ha 638 Ha
5 Sadatpura 0 0 0 0 0 0 8 168 Ha 195 Ha
6 Sapavada 0 0 0 4 126 Ha 245 Ha 184 Ha 278 Ha 354 Ha
7 Surpur 0 0 0 0 0 0 8 612 658
8 Virpur 0 0 0 4 156 Ha 265 Ha 9 278 Ha 380 Ha
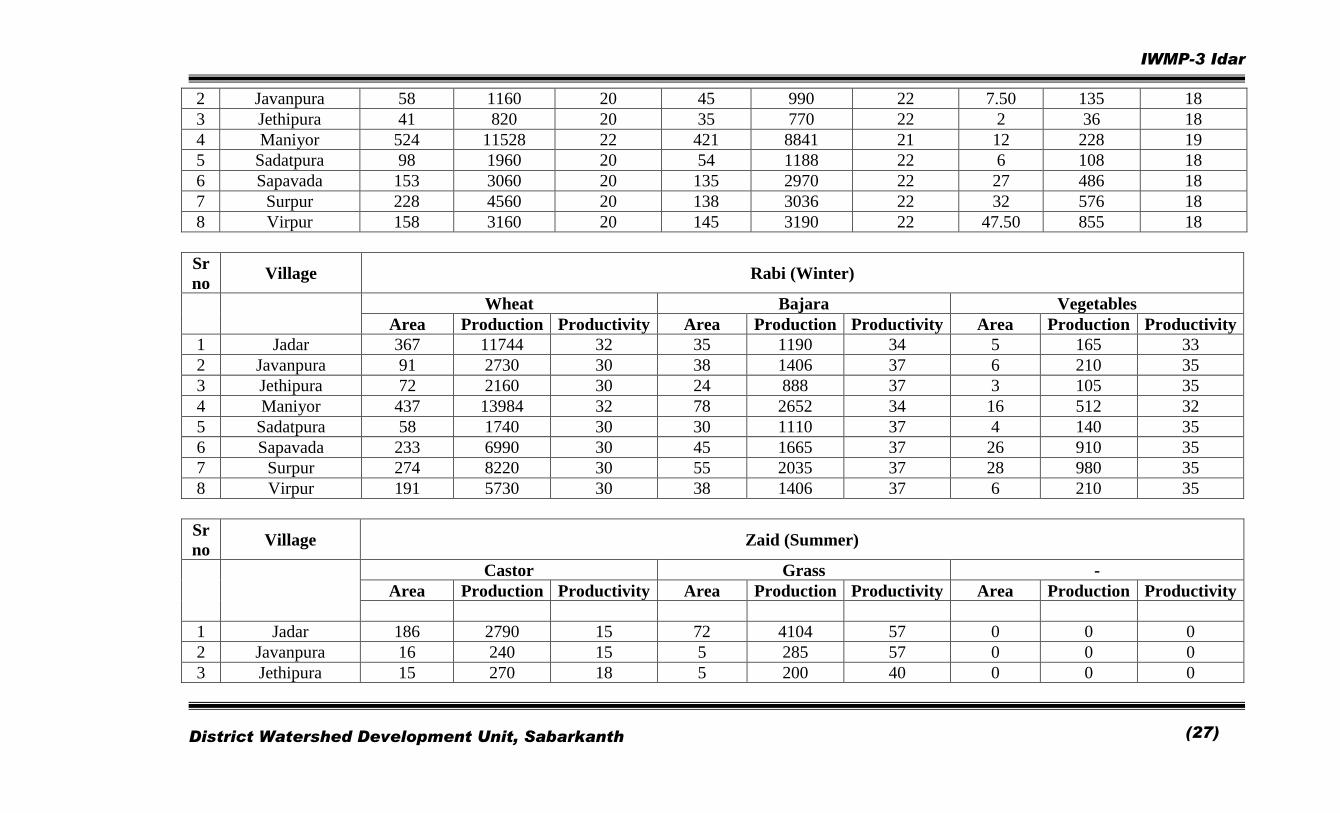
Table no. 17: Crop details:
Sr
no Village
Kharif (Monsoon)
Cotton Castor Juwar
Area Production Productivity Area Production Productivity Area Production Productivity
1 Jadar 448 9856 22 314 6594 21 13 247 19
IWMP-3 Idar
District Watershed Development Unit, Sabarkanth
(27)
2 Javanpura 58 1160 20 45 990 22 7.50 135 18
3 Jethipura 41 820 20 35 770 22 2 36 18
4 Maniyor 524 11528 22 421 8841 21 12 228 19
5 Sadatpura 98 1960 20 54 1188 22 6 108 18
6 Sapavada 153 3060 20 135 2970 22 27 486 18
7 Surpur 228 4560 20 138 3036 22 32 576 18
8 Virpur 158 3160 20 145 3190 22 47.50 855 18
Sr
no Village Rabi (Winter)
Wheat Bajara Vegetables
Area Production Productivity Area Production Productivity Area Production Productivity
1 Jadar 367 11744 32 35 1190 34 5 165 33
2 Javanpura 91 2730 30 38 1406 37 6 210 35
3 Jethipura 72 2160 30 24 888 37 3 105 35
4 Maniyor 437 13984 32 78 2652 34 16 512 32
5 Sadatpura 58 1740 30 30 1110 37 4 140 35
6 Sapavada 233 6990 30 45 1665 37 26 910 35
7 Surpur 274 8220 30 55 2035 37 28 980 35
8 Virpur 191 5730 30 38 1406 37 6 210 35
Sr
no Village Zaid (Summer)
Castor Grass -
Area Production Productivity Area Production Productivity Area Production Productivity
1 Jadar 186 2790 15 72 4104 57 0 0 0
2 Javanpura 16 240 15 5 285 57 0 0 0
3 Jethipura 15 270 18 5 200 40 0 0 0
IWMP-3 Idar
District Watershed Development Unit, Sabarkanth
(28)
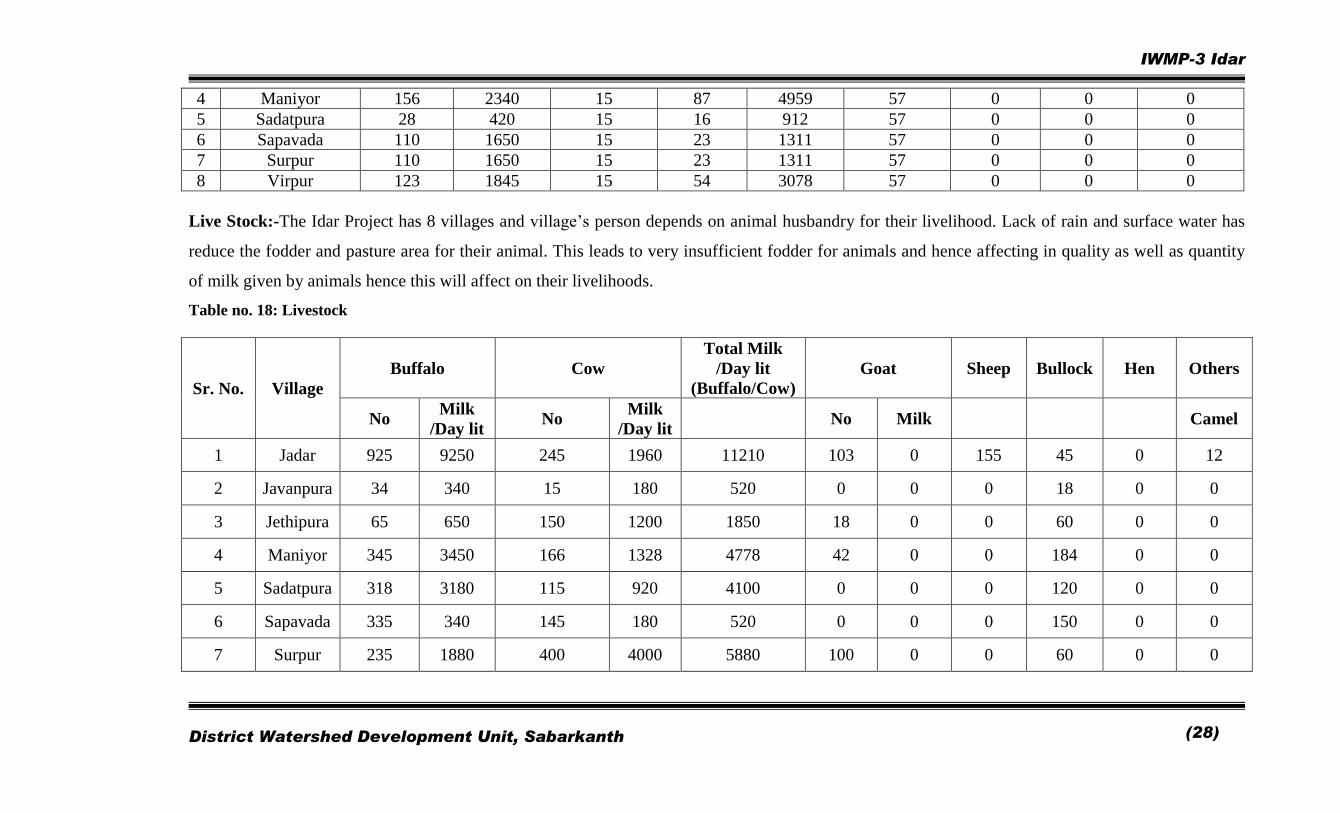
4 Maniyor 156 2340 15 87 4959 57 0 0 0
5 Sadatpura 28 420 15 16 912 57 0 0 0
6 Sapavada 110 1650 15 23 1311 57 0 0 0
7 Surpur 110 1650 15 23 1311 57 0 0 0
8 Virpur 123 1845 15 54 3078 57 0 0 0
Live Stock:-The Idar Project has 8 villages and village’s person depends on animal husbandry for their livelihood. Lack of rain and surface water has
reduce the fodder and pasture area for their animal. This leads to very insufficient fodder for animals and hence affecting in quality as well as quantity
of milk given by animals hence this will affect on their livelihoods.
Table no. 18: Livestock
Sr. No. Village
Buffalo Cow
Total Milk
/Day lit
(Buffalo/Cow)
Goat Sheep Bullock Hen Others
No Milk
/Day lit No
Milk
/Day lit No Milk Camel
1 Jadar 925 9250 245 1960 11210 103 0 155 45 0 12
2 Javanpura 34 340 15 180 520 0 0 0 18 0 0
3 Jethipura 65 650 150 1200 1850 18 0 0 60 0 0
4 Maniyor 345 3450 166 1328 4778 42 0 0 184 0 0
5 Sadatpura 318 3180 115 920 4100 0 0 0 120 0 0
6 Sapavada 335 340 145 180 520 0 0 0 150 0 0
7 Surpur 235 1880 400 4000 5880 100 0 0 60 0 0
IWMP-3 Idar
District Watershed Development Unit, Sabarkanth
(29)
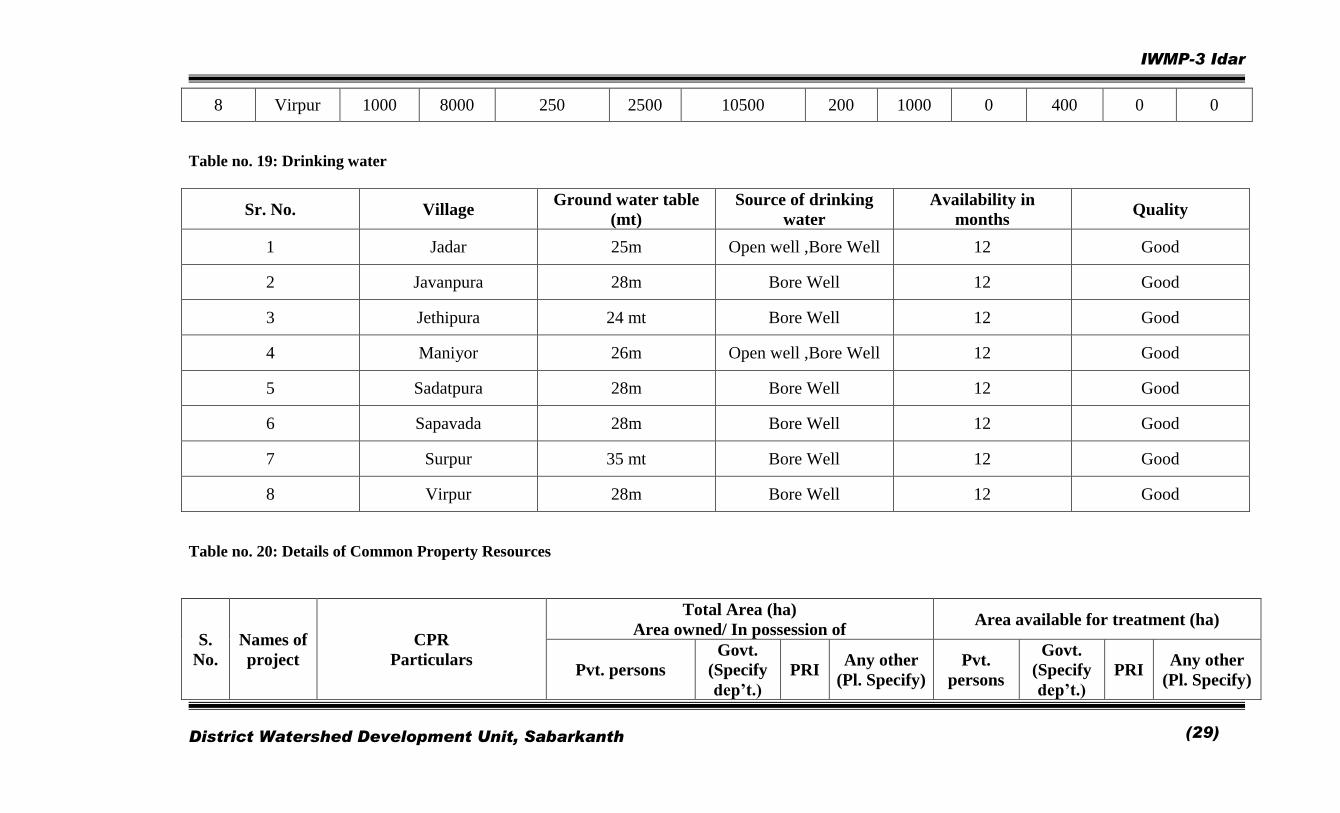
8 Virpur 1000 8000 250 2500 10500 200 1000 0 400 0 0
Table no. 19: Drinking water
Sr. No. Village Ground water table
(mt)
Source of drinking
water
Availability in
months Quality
1 Jadar 25m Open well ,Bore Well 12 Good
2 Javanpura 28m Bore Well 12 Good
3 Jethipura 24 mt Bore Well 12 Good
4 Maniyor 26m Open well ,Bore Well 12 Good
5 Sadatpura 28m Bore Well 12 Good
6 Sapavada 28m Bore Well 12 Good
7 Surpur 35 mt Bore Well 12 Good
8 Virpur 28m Bore Well 12 Good
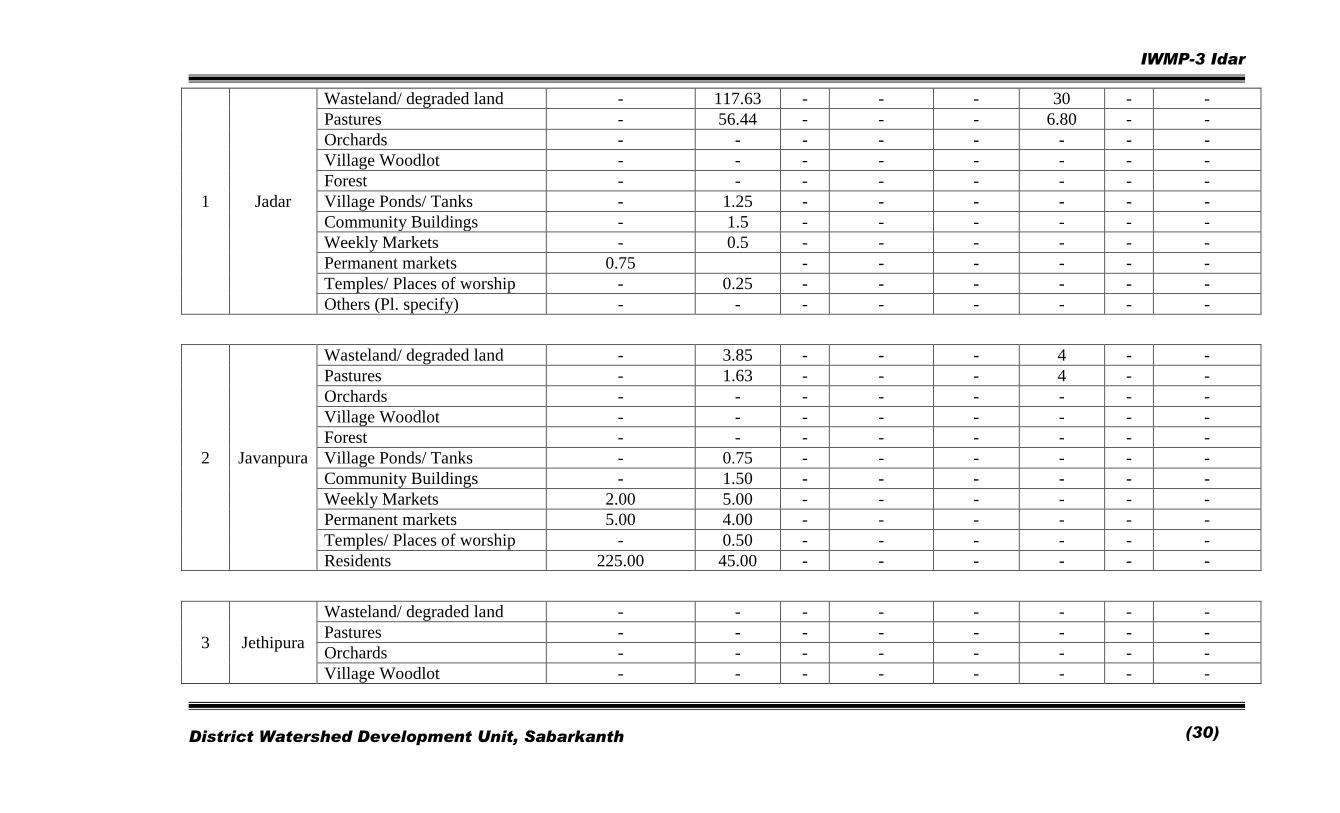
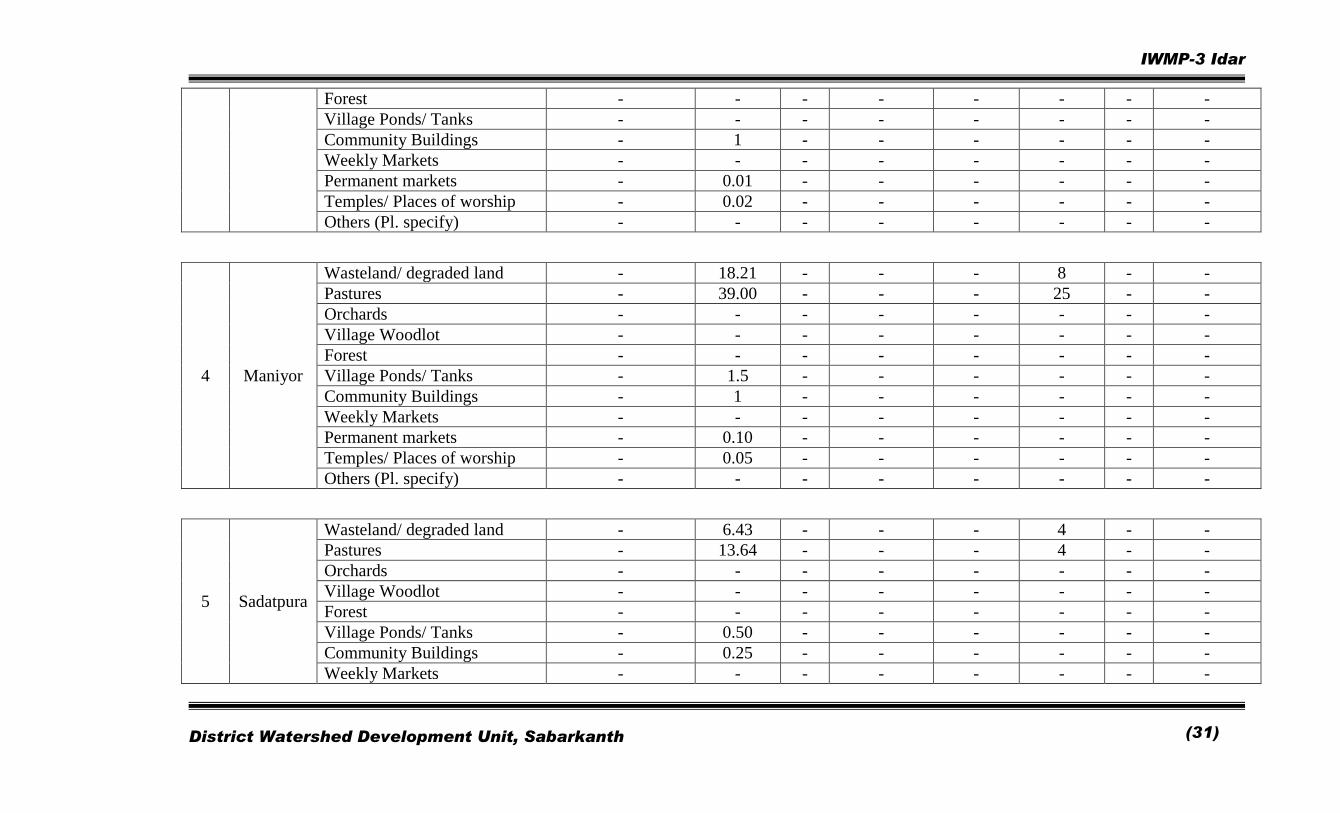
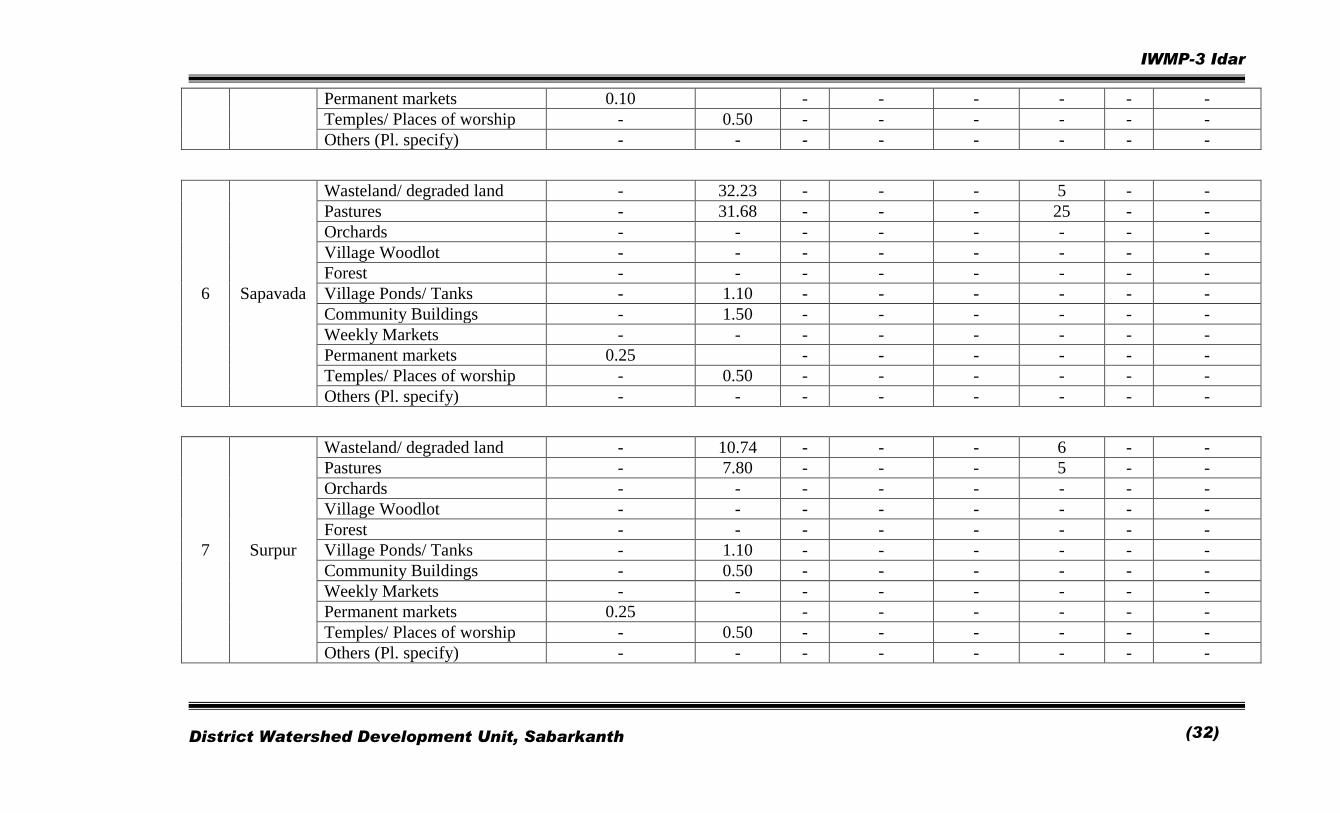
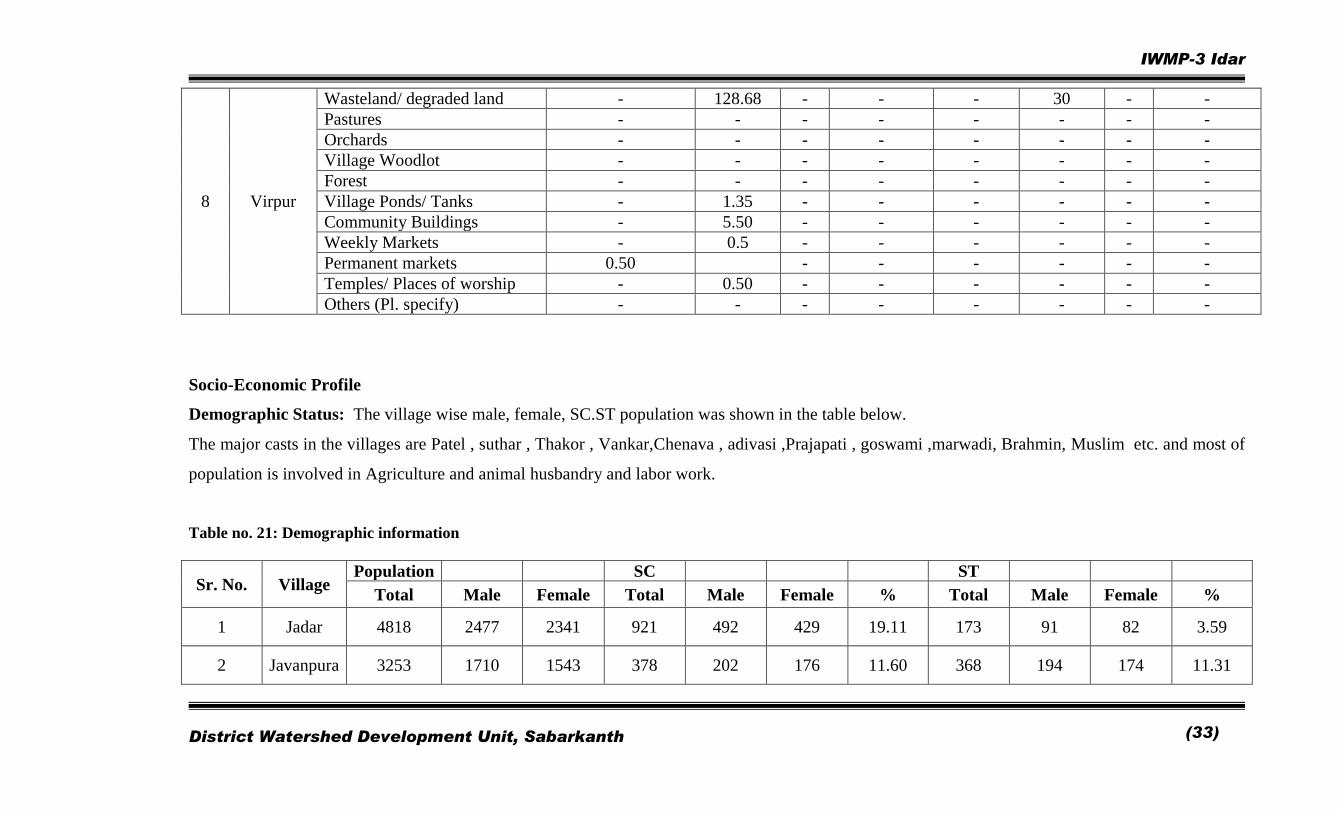
Table no. 20: Details of Common Property Resources
S.
No.
Names of
project
CPR
Particulars
Total Area (ha)
Area owned/ In possession of Area available for treatment (ha)
Pvt. persons
Govt.
(Specify
dep’t.)
PRI Any other
(Pl. Specify)
Pvt.
persons
Govt.
(Specify
dep’t.)
PRI Any other
(Pl. Specify)
IWMP-3 Idar
District Watershed Development Unit, Sabarkanth
(30)
1 Jadar
Wasteland/ degraded land - 117.63 - - - 30 - -
Pastures - 56.44 - - - 6.80 - -
Orchards - - - - - - - -
Village Woodlot - - - - - - - -
Forest - - - - - - - -
Village Ponds/ Tanks - 1.25 - - - - - -
Community Buildings - 1.5 - - - - - -
Weekly Markets - 0.5 - - - - - -
Permanent markets 0.75 - - - - - -
Temples/ Places of worship - 0.25 - - - - - -
Others (Pl. specify) - - - - - - - -
2 Javanpura
Wasteland/ degraded land - 3.85 - - - 4 - -
Pastures - 1.63 - - - 4 - -
Orchards - - - - - - - -
Village Woodlot - - - - - - - -
Forest - - - - - - - -
Village Ponds/ Tanks - 0.75 - - - - - -
Community Buildings - 1.50 - - - - - -
Weekly Markets 2.00 5.00 - - - - - -
Permanent markets 5.00 4.00 - - - - - -
Temples/ Places of worship - 0.50 - - - - - -
Residents 225.00 45.00 - - - - - -
3 Jethipura
Wasteland/ degraded land - - - - - - - -
Pastures - - - - - - - -
Orchards - - - - - - - -
Village Woodlot - - - - - - - -
IWMP-3 Idar
District Watershed Development Unit, Sabarkanth
(31)
Forest - - - - - - - -
Village Ponds/ Tanks - - - - - - - -
Community Buildings - 1 - - - - - -
Weekly Markets - - - - - - - -
Permanent markets - 0.01 - - - - - -
Temples/ Places of worship - 0.02 - - - - - -
Others (Pl. specify) - - - - - - - -
4 Maniyor
Wasteland/ degraded land - 18.21 - - - 8 - -
Pastures - 39.00 - - - 25 - -
Orchards - - - - - - - -
Village Woodlot - - - - - - - -
Forest - - - - - - - -
Village Ponds/ Tanks - 1.5 - - - - - -
Community Buildings - 1 - - - - - -
Weekly Markets - - - - - - - -
Permanent markets - 0.10 - - - - - -
Temples/ Places of worship - 0.05 - - - - - -
Others (Pl. specify) - - - - - - - -
5 Sadatpura
Wasteland/ degraded land - 6.43 - - - 4 - -
Pastures - 13.64 - - - 4 - -
Orchards - - - - - - - -
Village Woodlot - - - - - - - -
Forest - - - - - - - -
Village Ponds/ Tanks - 0.50 - - - - - -
Community Buildings - 0.25 - - - - - -
Weekly Markets - - - - - - - -
IWMP-3 Idar
District Watershed Development Unit, Sabarkanth
(32)
Permanent markets 0.10 - - - - - -
Temples/ Places of worship - 0.50 - - - - - -
Others (Pl. specify) - - - - - - - -
6 Sapavada
Wasteland/ degraded land - 32.23 - - - 5 - -
Pastures - 31.68 - - - 25 - -
Orchards - - - - - - - -
Village Woodlot - - - - - - - -
Forest - - - - - - - -
Village Ponds/ Tanks - 1.10 - - - - - -
Community Buildings - 1.50 - - - - - -
Weekly Markets - - - - - - - -
Permanent markets 0.25 - - - - - -
Temples/ Places of worship - 0.50 - - - - - -
Others (Pl. specify) - - - - - - - -
7 Surpur
Wasteland/ degraded land - 10.74 - - - 6 - -
Pastures - 7.80 - - - 5 - -
Orchards - - - - - - - -
Village Woodlot - - - - - - - -
Forest - - - - - - - -
Village Ponds/ Tanks - 1.10 - - - - - -
Community Buildings - 0.50 - - - - - -
Weekly Markets - - - - - - - -
Permanent markets 0.25 - - - - - -
Temples/ Places of worship - 0.50 - - - - - -
Others (Pl. specify) - - - - - - - -
IWMP-3 Idar
District Watershed Development Unit, Sabarkanth
(33)
8 Virpur
Wasteland/ degraded land - 128.68 - - - 30 - -
Pastures - - - - - - - -
Orchards - - - - - - - -
Village Woodlot - - - - - - - -
Forest - - - - - - - -
Village Ponds/ Tanks - 1.35 - - - - - -
Community Buildings - 5.50 - - - - - -
Weekly Markets - 0.5 - - - - - -
Permanent markets 0.50 - - - - - -
Temples/ Places of worship - 0.50 - - - - - -
Others (Pl. specify) - - - - - - - -
Socio-Economic Profile
Demographic Status: The village wise male, female, SC.ST population was shown in the table below.
The major casts in the villages are Patel , suthar , Thakor , Vankar,Chenava , adivasi ,Prajapati , goswami ,marwadi, Brahmin, Muslim etc. and most of
population is involved in Agriculture and animal husbandry and labor work.
Table no. 21: Demographic information
Sr. No. Village Population SC ST
Total Male Female Total Male Female % Total Male Female %
1 Jadar 4818 2477 2341 921 492 429 19.11 173 91 82 3.59
2 Javanpura 3253 1710 1543 378 202 176 11.60 368 194 174 11.31
IWMP-3 Idar
District Watershed Development Unit, Sabarkanth
(34)
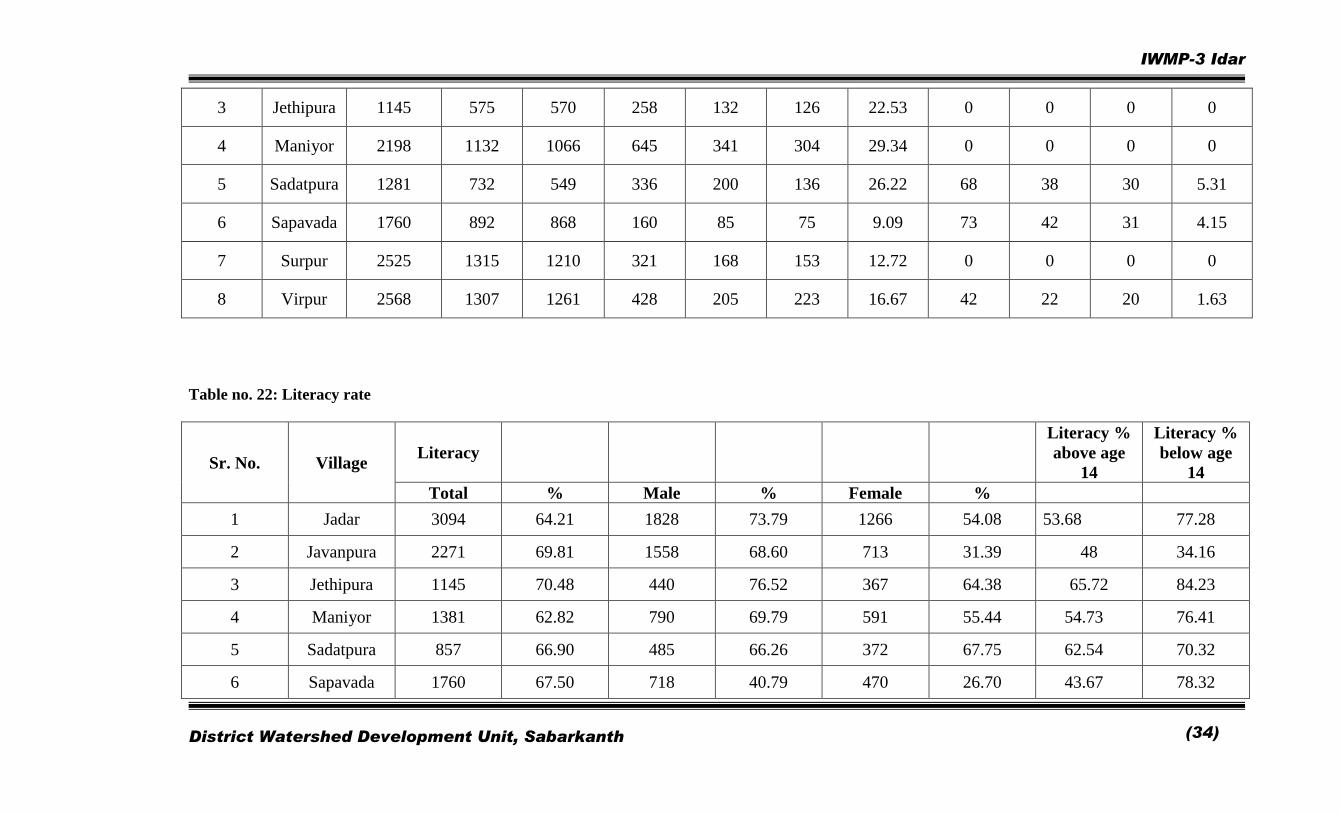
3 Jethipura 1145 575 570 258 132 126 22.53 0 0 0 0
4 Maniyor 2198 1132 1066 645 341 304 29.34 0 0 0 0
5 Sadatpura 1281 732 549 336 200 136 26.22 68 38 30 5.31
6 Sapavada 1760 892 868 160 85 75 9.09 73 42 31 4.15
7 Surpur 2525 1315 1210 321 168 153 12.72 0 0 0 0
8 Virpur 2568 1307 1261 428 205 223 16.67 42 22 20 1.63
Table no. 22: Literacy rate
Sr. No. Village Literacy
Literacy %
above age
14
Literacy %
below age
14
Total % Male % Female %
1 Jadar 3094 64.21 1828 73.79 1266 54.08 53.68 77.28
2 Javanpura 2271 69.81 1558 68.60 713 31.39 48 34.16
3 Jethipura 1145 70.48 440 76.52 367 64.38 65.72 84.23
4 Maniyor 1381 62.82 790 69.79 591 55.44 54.73 76.41
5 Sadatpura 857 66.90 485 66.26 372 67.75 62.54 70.32
6 Sapavada 1760 67.50 718 40.79 470 26.70 43.67 78.32

IWMP-3 Idar
District Watershed Development Unit, Sabarkanth
(35)
7 Surpur 2525 69.74 954 66.69 547 45.20 58.75 71.52
8 Virpur 1809 70.44 1031 78.88 778 61.70 73.67 78.32
Migration:- There is no migration in this village
Table no.23: Migration Details
Sr. No. Village Total
population
Migration Migration by Months Main
Reason for
migration
Income
during
migration/
month Total Male Female
Up to 3
months 3-6 months
More then
6 months
1 Jadar NA 0 0 0 0 0 0 0 0
2 Javanpura NA 0 0 0 0 0 0 0 0
3 Jethipura NA 0 0 0 0 0 0 0 0
4 Maniyor NA 0 0 0 0 0 0 0 0
5 Sadatpura NA 0 0 0 0 0 0 0 0
6 Sapavada NA 0 0 0 0 0 0 0 0
7 Surpur NA 0 0 0 0 0 0 0 0
8 Virpur NA 0 0 0 0 0 0 0 0
IWMP-3 Idar
District Watershed Development Unit, Sabarkanth
(36)
Table no. 24: Poverty
Sr. No. Village Total
Household
BPL % BPL HH
Total Land
less HH
% of land less
HH 0-16 16-20 Total
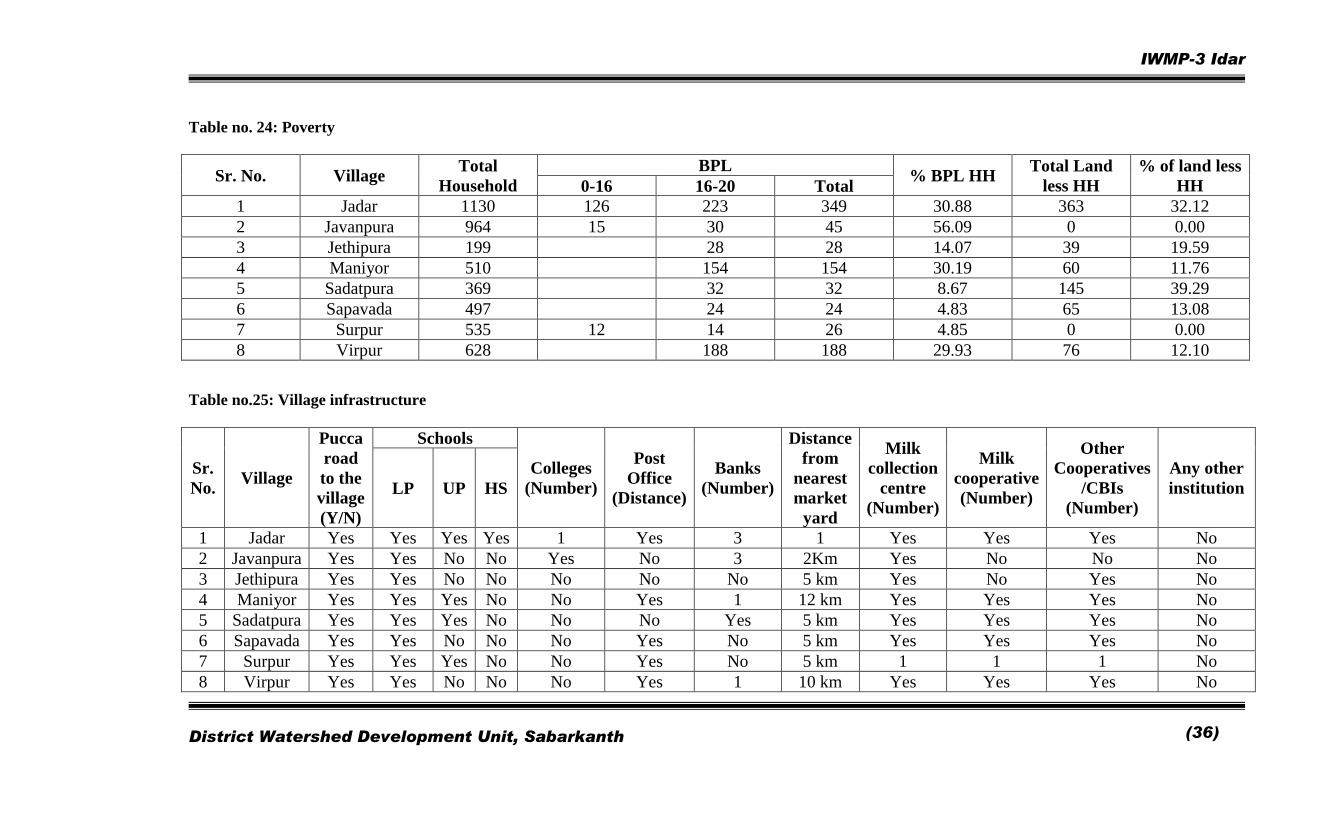
1 Jadar 1130 126 223 349 30.88 363 32.12
2 Javanpura 964 15 30 45 56.09 0 0.00
3 Jethipura 199 28 28 14.07 39 19.59
4 Maniyor 510 154 154 30.19 60 11.76
5 Sadatpura 369 32 32 8.67 145 39.29
6 Sapavada 497 24 24 4.83 65 13.08
7 Surpur 535 12 14 26 4.85 0 0.00
8 Virpur 628 188 188 29.93 76 12.10
Table no.25: Village infrastructure
Sr.
No. Village
Pucca
road
to the
village
(Y/N)
Schools
Colleges
(Number)
Post
Office
(Distance)
Banks
(Number)
Distance
from
nearest
market
yard
Milk
collection
centre
(Number)
Milk
cooperative
(Number)
Other
Cooperatives
/CBIs
(Number)
Any other
institution LP UP HS
1 Jadar Yes Yes Yes Yes 1 Yes 3 1 Yes Yes Yes No
2 Javanpura Yes Yes No No Yes No 3 2Km Yes No No No
3 Jethipura Yes Yes No No No No No 5 km Yes No Yes No
4 Maniyor Yes Yes Yes No No Yes 1 12 km Yes Yes Yes No
5 Sadatpura Yes Yes Yes No No No Yes 5 km Yes Yes Yes No
6 Sapavada Yes Yes No No No Yes No 5 km Yes Yes Yes No
7 Surpur Yes Yes Yes No No Yes No 5 km 1 1 1 No
8 Virpur Yes Yes No No No Yes 1 10 km Yes Yes Yes No
IWMP-3 Idar
District Watershed Development Unit, Sabarkanth
(37)
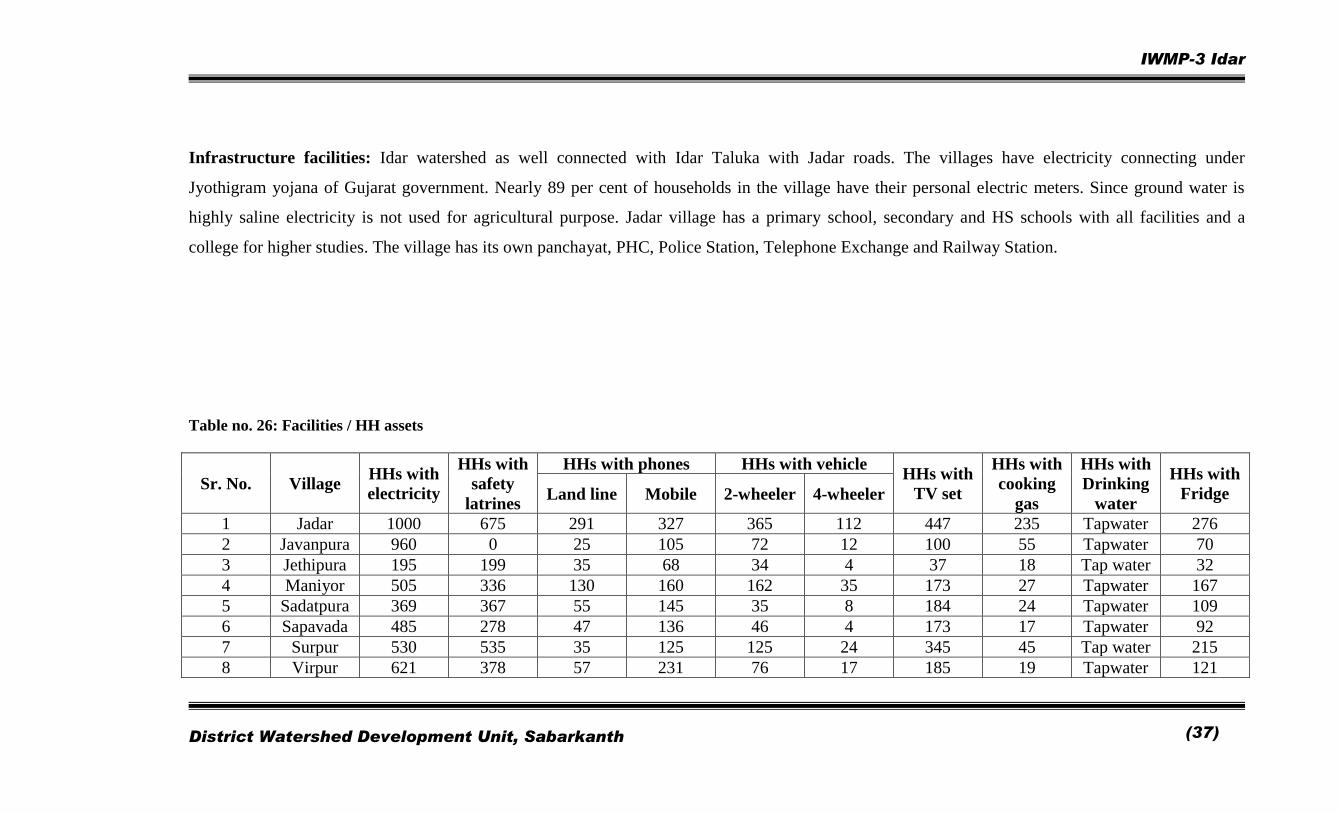
Infrastructure facilities: Idar watershed as well connected with Idar Taluka with Jadar roads. The villages have electricity connecting under
Jyothigram yojana of Gujarat government. Nearly 89 per cent of households in the village have their personal electric meters. Since ground water is
highly saline electricity is not used for agricultural purpose. Jadar village has a primary school, secondary and HS schools with all facilities and a
college for higher studies. The village has its own panchayat, PHC, Police Station, Telephone Exchange and Railway Station.
Table no. 26: Facilities / HH assets
Sr. No. Village HHs with
electricity
HHs with
safety
latrines
HHs with phones HHs with vehicle HHs with
TV set
HHs with
cooking
gas
HHs with
Drinking
water
HHs with
Fridge Land line Mobile 2-wheeler 4-wheeler
1 Jadar 1000 675 291 327 365 112 447 235 Tapwater 276
2 Javanpura 960 0 25 105 72 12 100 55 Tapwater 70
3 Jethipura 195 199 35 68 34 4 37 18 Tap water 32
4 Maniyor 505 336 130 160 162 35 173 27 Tapwater 167
5 Sadatpura 369 367 55 145 35 8 184 24 Tapwater 109
6 Sapavada 485 278 47 136 46 4 173 17 Tapwater 92
7 Surpur 530 535 35 125 125 24 345 45 Tap water 215
8 Virpur 621 378 57 231 76 17 185 19 Tapwater 121
IWMP-3 Idar
District Watershed Development Unit, Sabarkanth
(38)
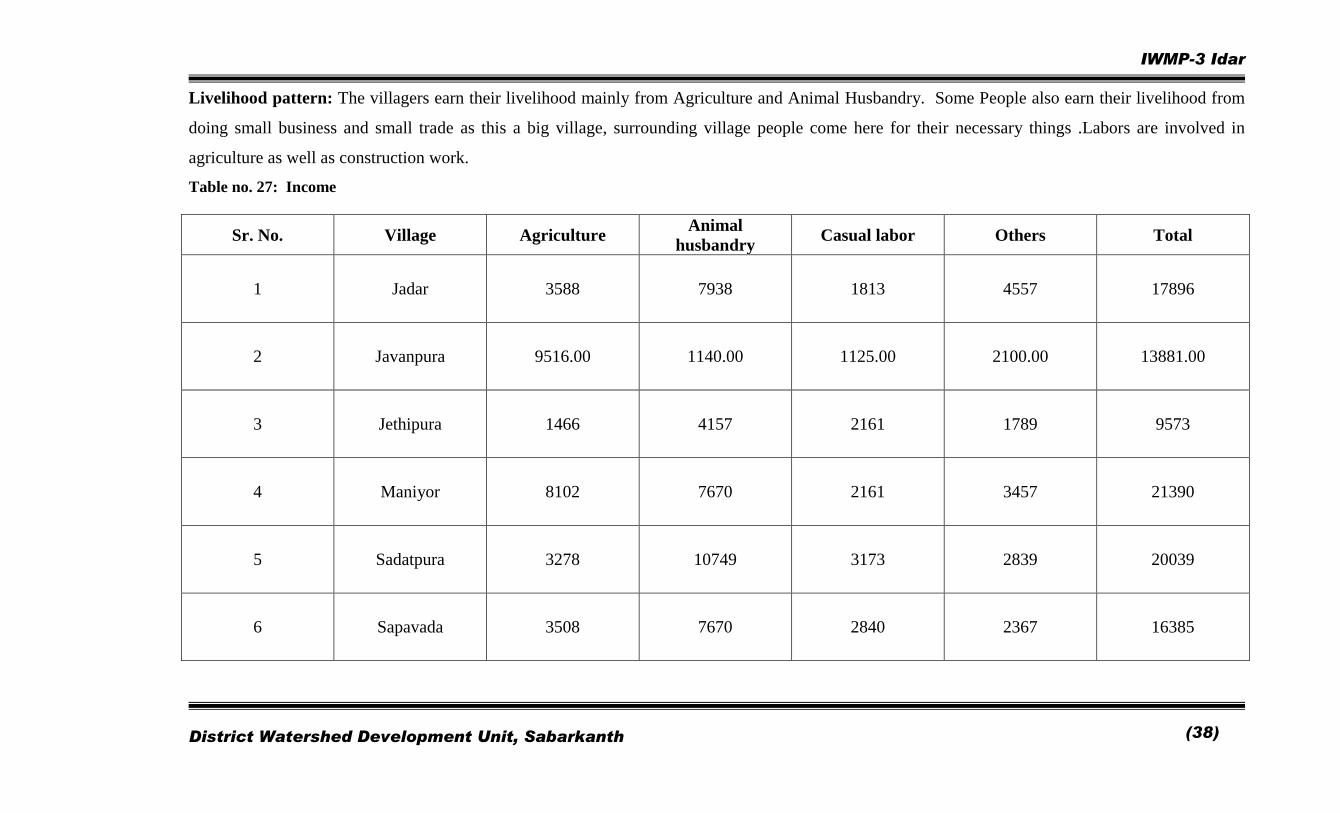
Livelihood pattern: The villagers earn their livelihood mainly from Agriculture and Animal Husbandry. Some People also earn their livelihood from
doing small business and small trade as this a big village, surrounding village people come here for their necessary things .Labors are involved in
agriculture as well as construction work.
Table no. 27: Income
Sr. No. Village Agriculture Animal
husbandry Casual labor Others Total
1 Jadar 3588 7938 1813 4557 17896
2 Javanpura 9516.00 1140.00 1125.00 2100.00 13881.00
3 Jethipura 1466 4157 2161 1789 9573
4 Maniyor 8102 7670 2161 3457 21390
5 Sadatpura 3278 10749 3173 2839 20039
6 Sapavada 3508 7670 2840 2367 16385
IWMP-3 Idar
District Watershed Development Unit, Sabarkanth
(39)
7 Surpur 4402 7590 3959 3023 18974
8 Virpur 4809 13901 2647 1958 23315
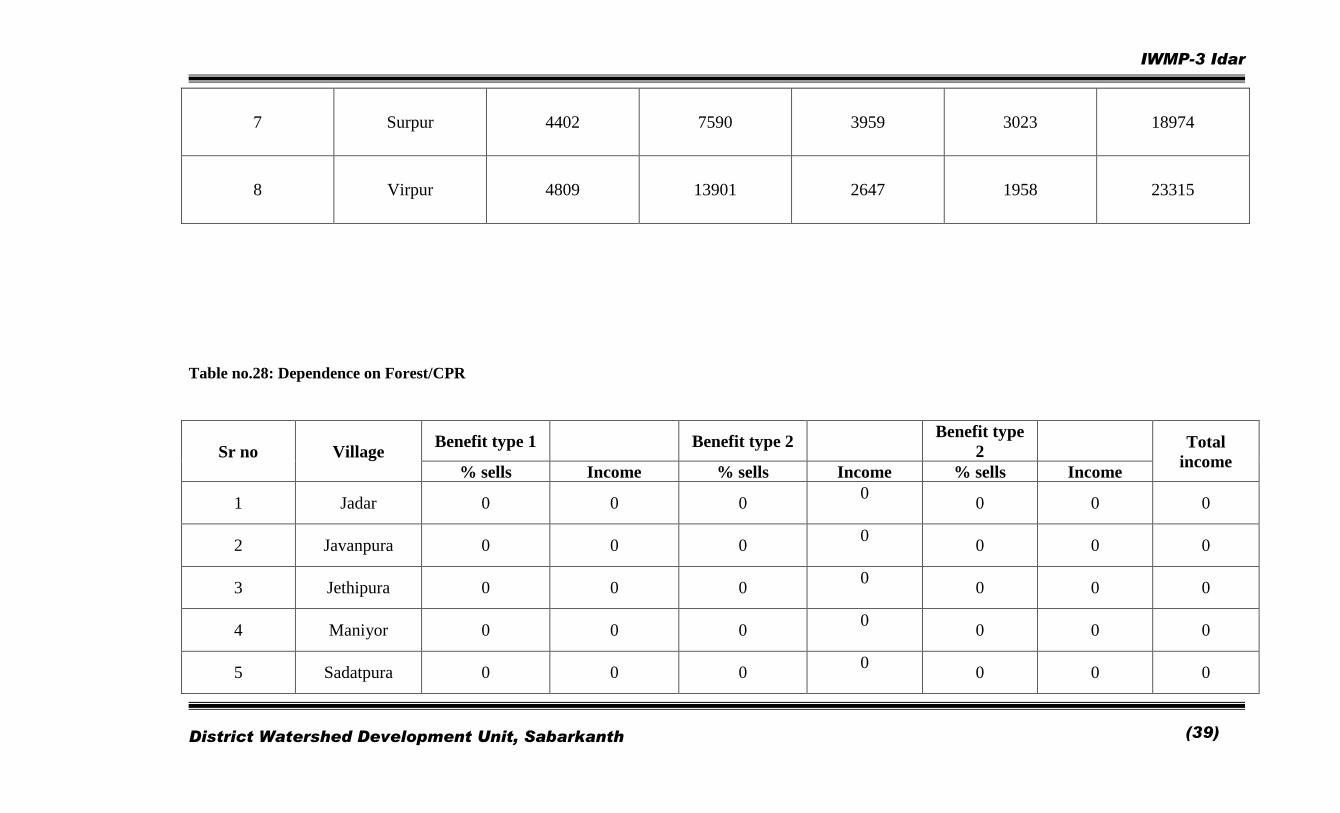
Table no.28: Dependence on Forest/CPR
Sr no Village Benefit type 1 Benefit type 2
Benefit type
2 Total
income % sells Income % sells Income % sells Income
1 Jadar 0 0 0 0
0 0 0
2 Javanpura 0 0 0 0
0 0 0
3 Jethipura 0 0 0 0
0 0 0
4 Maniyor 0 0 0 0
0 0 0
5 Sadatpura 0 0 0 0
0 0 0
IWMP-3 Idar
District Watershed Development Unit, Sabarkanth
(40)
6 Sapavada 0 0 0 0
0 0 0
7 Surpur 0 0 0 0
0 0 0
8 Virpur 0 0 0 0
0 0 0
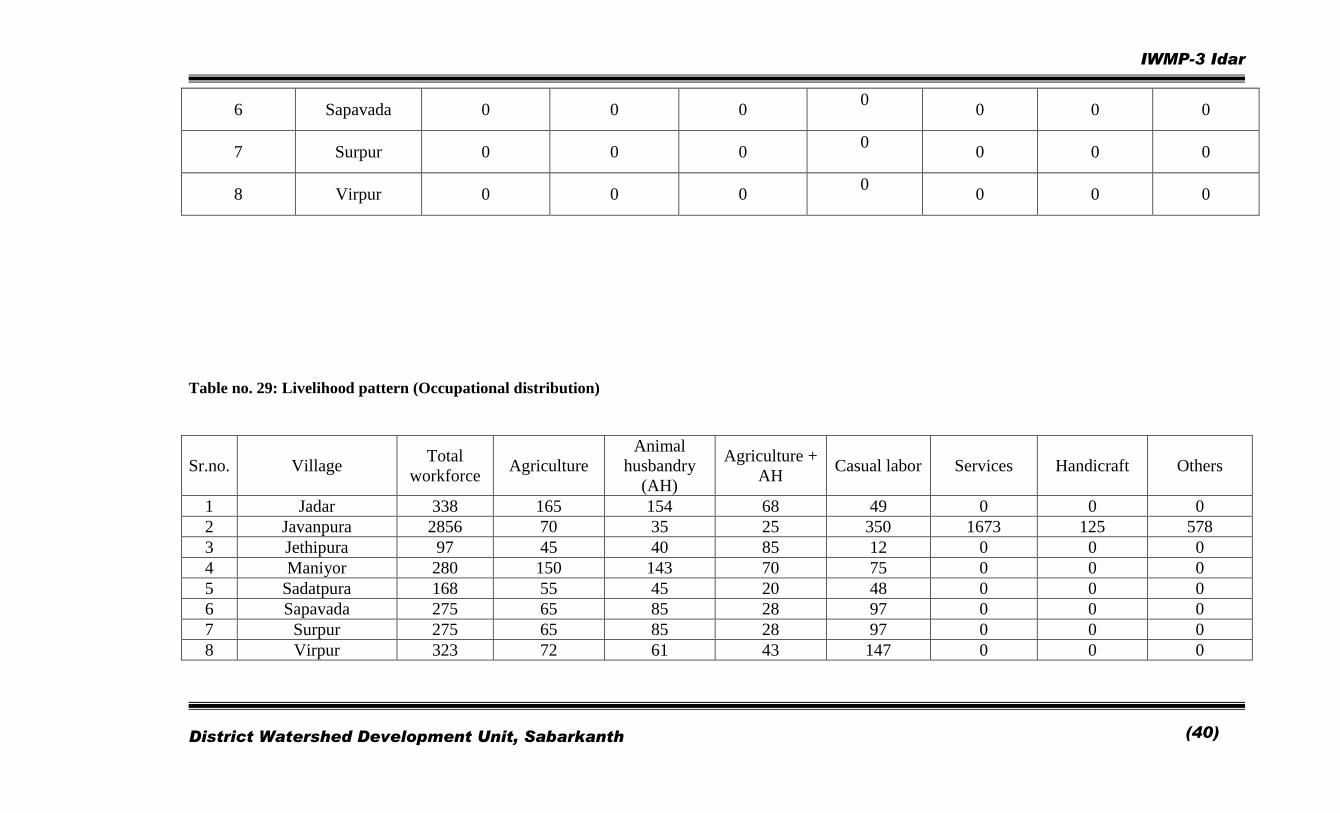
Table no. 29: Livelihood pattern (Occupational distribution)
Sr.no. Village Total
workforce Agriculture
Animal
husbandry
(AH)
Agriculture +
AH Casual labor Services Handicraft Others
1 Jadar 338 165 154 68 49 0 0 0
2 Javanpura 2856 70 35 25 350 1673 125 578
3 Jethipura 97 45 40 85 12 0 0 0
4 Maniyor 280 150 143 70 75 0 0 0
5 Sadatpura 168 55 45 20 48 0 0 0
6 Sapavada 275 65 85 28 97 0 0 0
7 Surpur 275 65 85 28 97 0 0 0
8 Virpur 323 72 61 43 147 0 0 0
IWMP-3 Idar
District Watershed Development Unit, Sabarkanth
(41)
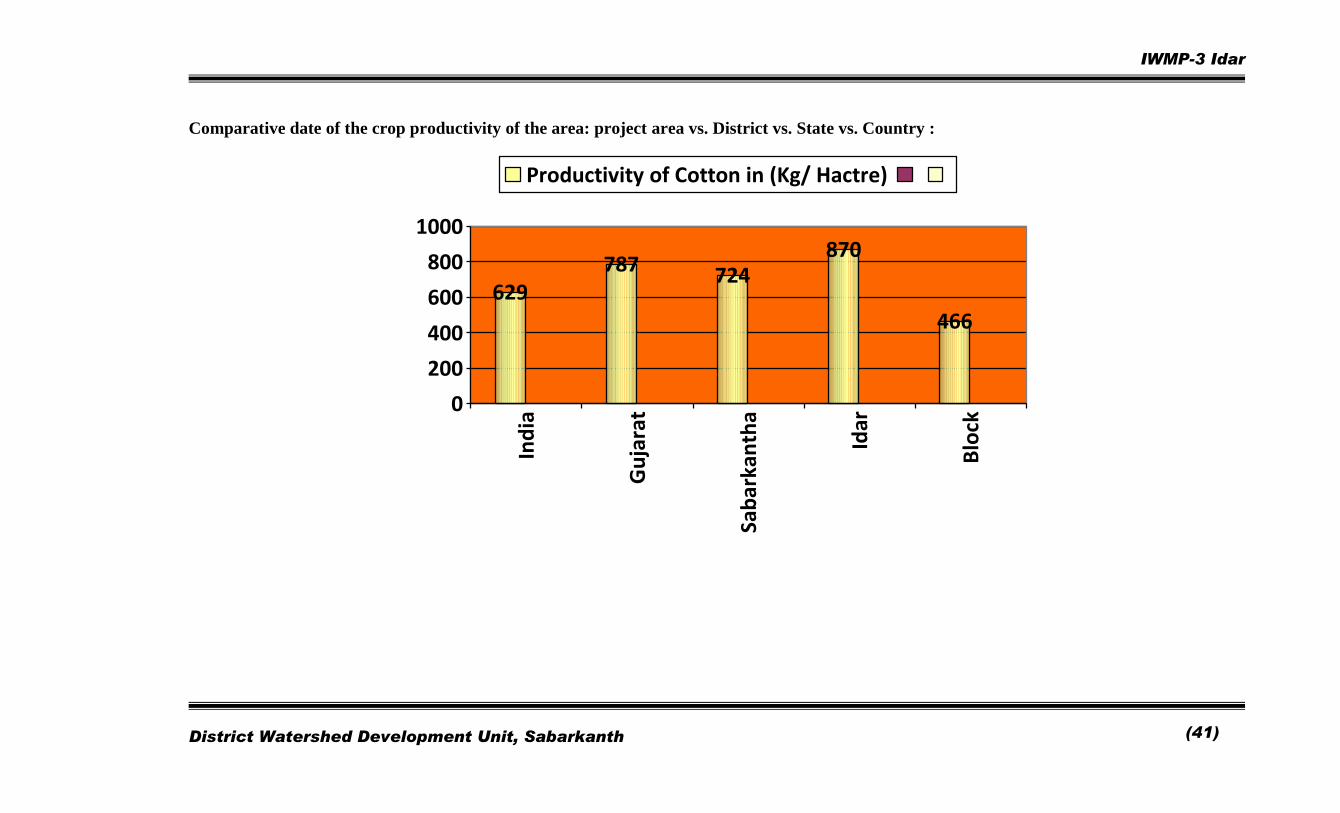
Comparative date of the crop productivity of the area: project area vs. District vs. State vs. Country :
629787 724
870
466
0
200
400
600
800
1000
Ind
ia
Gu
jara
t
Sab
arka
nth
a
Idar
Blo
ck
Productivity of Cotton in (Kg/ Hactre)
IWMP-3 Idar
District Watershed Development Unit, Sabarkanth
(42)
1094
1838 1958 1934
1439
0
500
1000
1500
2000
Ind
ia
Gu
jara
t
Sab
arka
nth
a
Idar
Blo
ck
Productivity of Castor in (Kg/ Hactre)
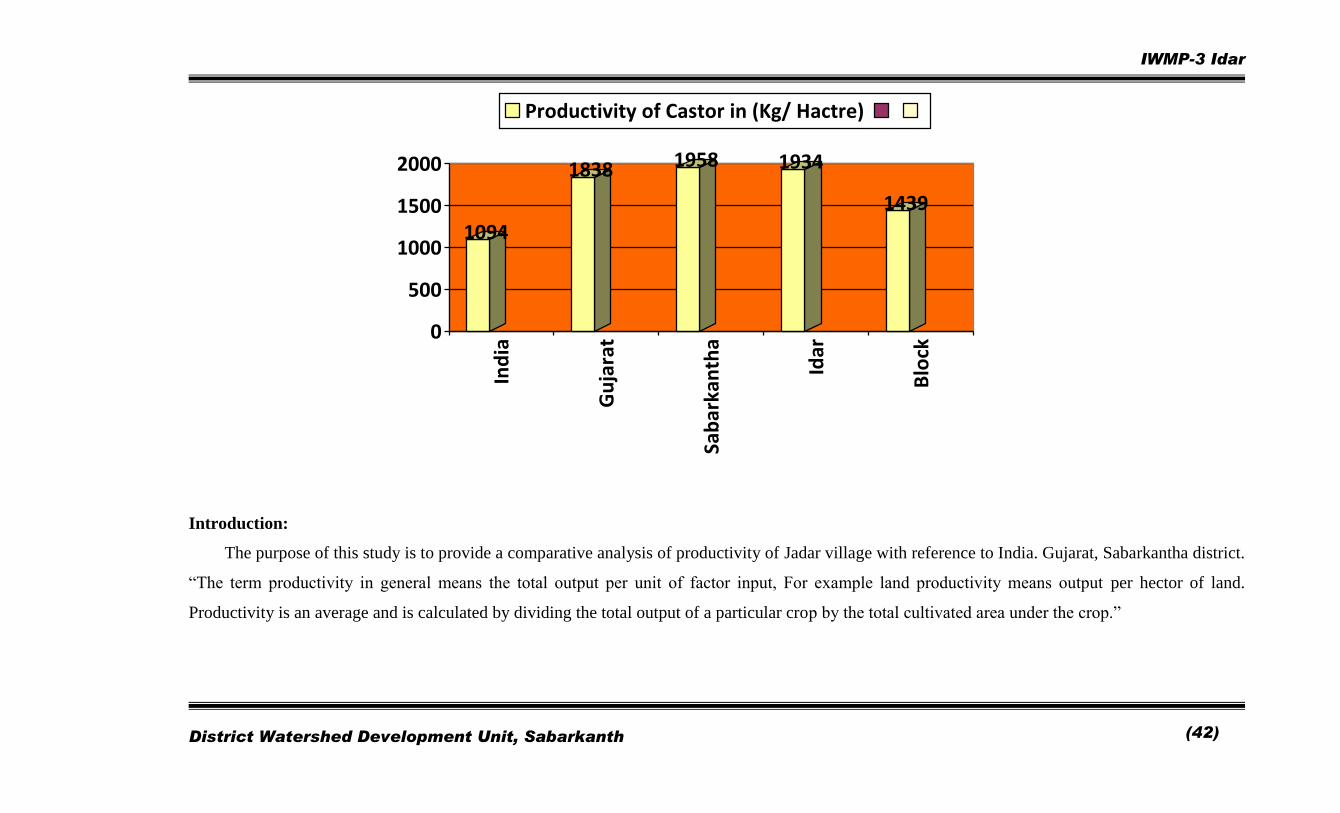
Introduction:
The purpose of this study is to provide a comparative analysis of productivity of Jadar village with reference to India. Gujarat, Sabarkantha district.
“The term productivity in general means the total output per unit of factor input, For example land productivity means output per hector of land.
Productivity is an average and is calculated by dividing the total output of a particular crop by the total cultivated area under the crop.”
IWMP-3 Idar
District Watershed Development Unit, Sabarkanth
(43)
Date are made available by Baseline survey (for Jadar village), Handbook of Agriculture, ICAR publication 2006 (For Gujarat and India), and
Final district plan (DAP) of Dept. of Agriculture (For Sabarkantha). The results show that productivity is important not only because we observe a
strong positive relationship with profits but that the results are suggestive of important scale that should be taken to improve the production. These
results indicate that Jadar village has very low productivity compared to world. India, Gujarat and Sabarkantha. The productivity is low not because that
the land is unproductive or the farmer’s lack the skills to managing their crop but it is due lack of source of irrigation, salty water and scarcity of rain.
The Jadar village comes under arid zone. So farmers grow crop according to the rainfall. If they get good rainfall they generally grow high value
crops like cotton, castor, vegetables etc. In case of low rainfall they go for maze, jowar etc so we can say that monsoon decides cropping patterns of
Jadar village.
The productivity of cotton is 629 kg/ha in India, Gujarat produces major cotton of our country with a record productivity of about 787
kg/ha.Sabarkantha district has very good productivity 724 kg /ha. The Idar Taluka has major productivity of 870 kgHa of cotton .The Jadar project area
has only 466 kg/ha productivity. It is low compare to Taluka, district, State, and country India.
The world productivity of castor is 984 kg/ha. In India, it is grown in about 7.3 lakh hectares with a production of 8.0 lakh tones and productivity
of 1,094 kg/ha. Gujarat alone produces about 80% of the total castor of our country from 50% of the area with a record productivity of about 1838
kg/ha. Sabarkantha district has very good productivity 1958 kg /ha. The Idar Taluka has productivity of 1934 kg/Ha. The Jadar project area has
comparatively low productivity of 1339 kg/Ha. It is low compare to district, State, India and world.
.
IWMP-3 Idar
District Watershed Development Unit, Sabarkanth
(44)
The Jadar project area has low productivity because of the following reasons:
1. 100% cultivated area depends on monsoon:
Jadar village is depend on monsoon without monsoon they cannot get any crop because irrigation water is salty. Water is essential input in
agriculture. Due to the absence of proper irrigation facility, 100% of the total cultivated area depends on the uncertain monsoon. Therefore the success
of failure of agriculture production. The rains, as a source of irrigation, are unreliable de to work factors;
* Untimely rain: The rains are sometimes received when the crops are ready for harvesting. The ready crop may be ruined due to untimely
Rain
* Inadequate rain: There are regions in India which do not get adequate rain and face a difficult situation every year. There are other
regions where there are excessive rains which are harmful for the crops. The dependence on the uncertain rainfall is a factor that
contributes to low productivity of land.
2. Less use of fertilizer per unit cropped area:
Farmers don't use sufficient fertilizer due to scarcity of fertilizer in market and insufficient money for fertilizer. Many times they don't get
fertilizer at the right time.
IWMP-3 Idar
District Watershed Development Unit, Sabarkanth
(45)
3. Traditional farming methods:
This is the factor that leads low productivity. There is lot of ignorance about the use of new farming methods and technologies such as multiple
cropping. They don't use FYM and other input in a proper way that is why they don't get 100% output. So these factors contribute low
productivity.
4. Lack of finances for farmers:
In Jadar most of farmers are marginal and small. Farmers do not have enough resources to purchase these seed.
5. Lack of good quality seeds and fertilizers:
Good quality seed, fertilizer and pesticide are important factor in agriculture productivity. The use of good quality leads to higher land
productivity. In Jadar, however, there are two limitations in the use of fertilizer, First these fertilizers are most useful in irrigated condition.
But in Jadar 90 per cent of land depend on rainfall. In Jadar mostly farmers use nitrogenous fertilizers especially urea. This has resulted in
disproportionate use of fertilizer depleting the quality of land.
6. Lack of rural credit:
Farmers face so many problems for rural credit and it leads to low agricultural productivity. Farmers need credit mainly for the purchase of various
inputs such as seed, fertilizers and pesticide and for repair of implements. They use long term credit for buying land, and for investment to
improve the quality of land, buying the new implements and improving irrigation facilities.

IWMP-3 Idar
District Watershed Development Unit, Sabarkanth
(46)
CHAPTER – 4
WATERSHED ACTIVITIES
IWMP-3 Idar
District Watershed Development Unit, Sabarkanth
(47)
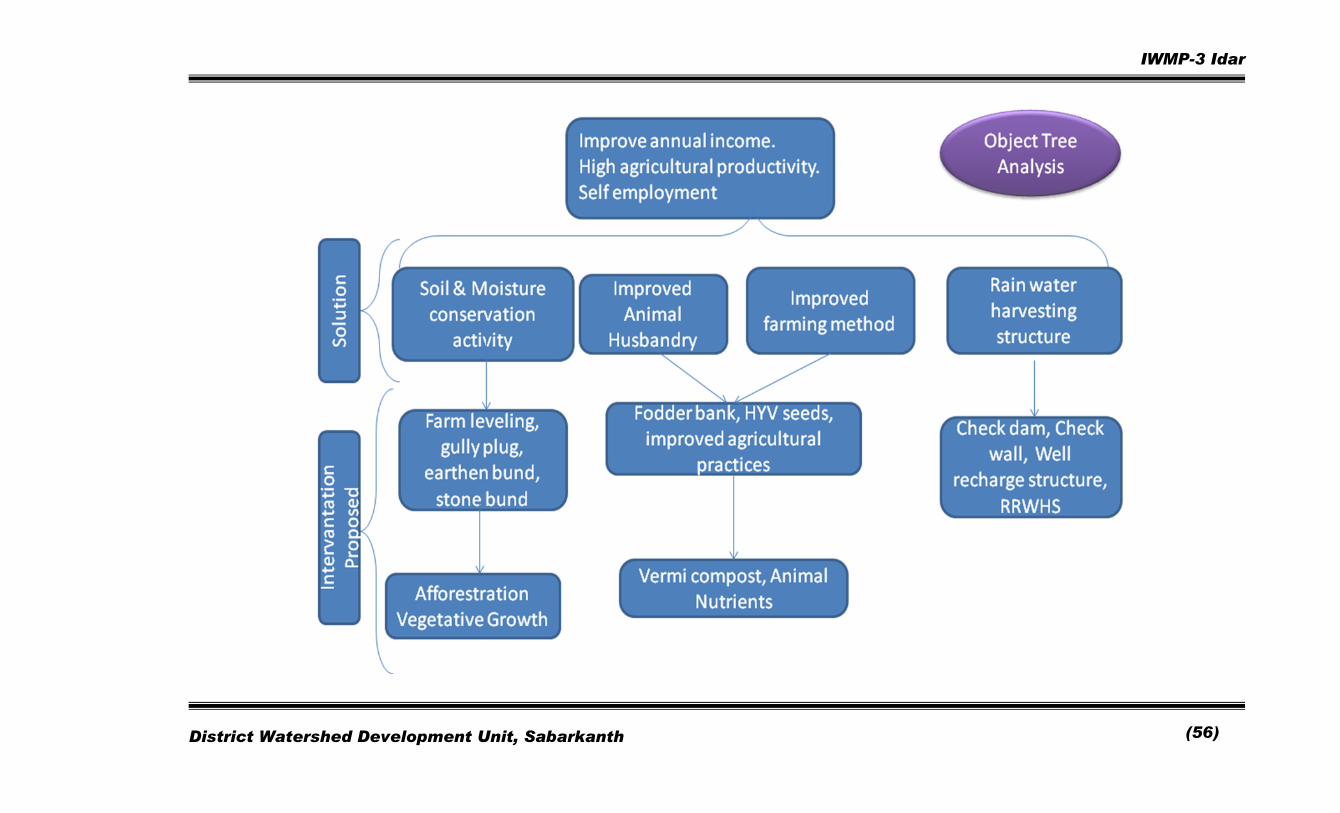
Watershed Activities
Watershed management as a strategy is been adapted by Government of India especially in the rain fed regions of semi-arid tropics. These regions
are characterized by low and undependable rain, low soil fertility, poor infrastructure development, low literacy and high incidence of migration. The
inherit ant low fertility of crops results in high productivity of crops which have a very low biological efficiency.
Several studies have identified that there is a dire need of a systematic and scientific approach to deal with watershed development. The common
guidelines generate a fresh and flexible framework for the next generation watershed development.
1. Cluster Approach
This envisages a broader vision of Geo-hydrological unit which involves treating a cluster of micro-watershed. The Jadar Project
consists of one micro-watershed namely 5F2D6d3a as their respective codes.
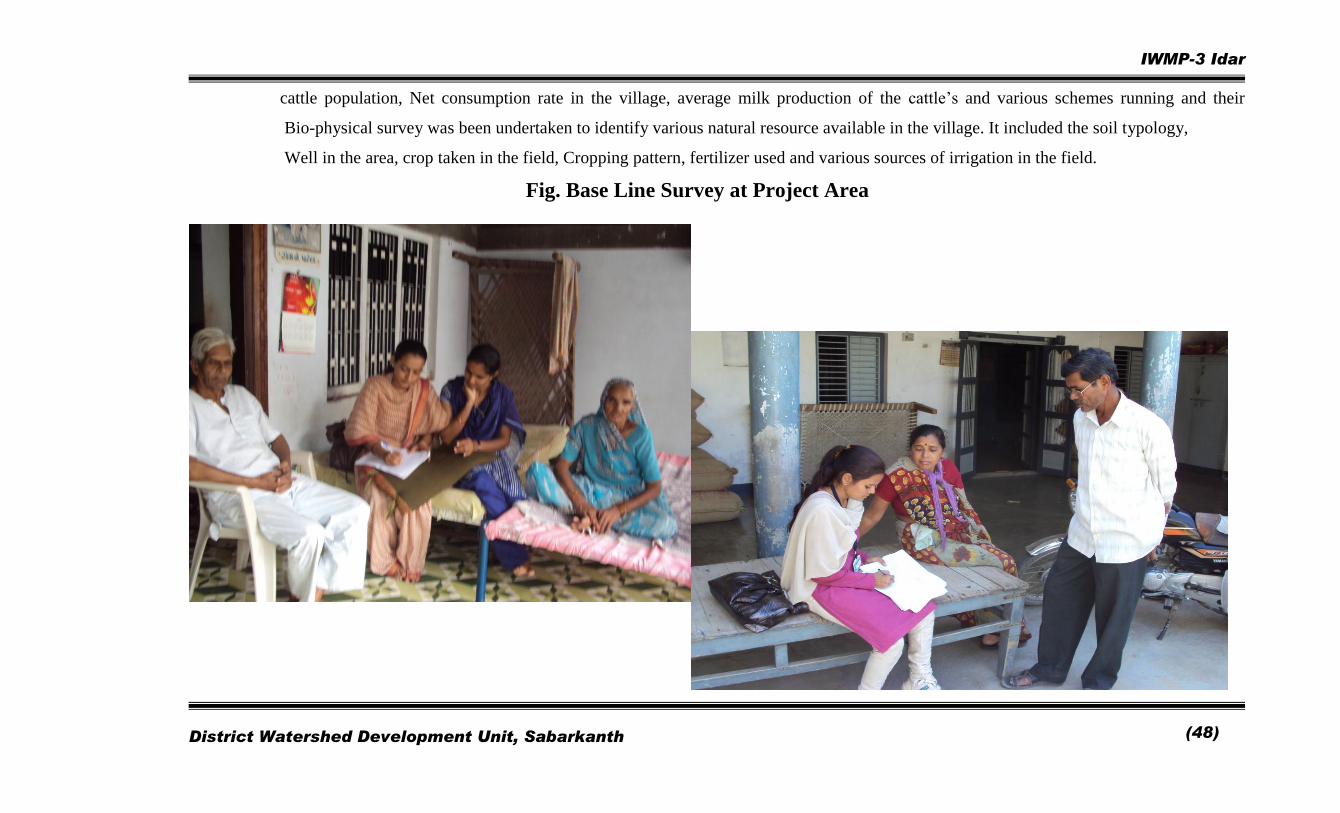
2. Base line Survey
To access the impact of any watershed development programme a detailed baseline survey has to be conducted. This acts a
benchmark for any intervention during and post implementation of any development programme. A detailed baseline survey was been
undertaken which involved household census survey, Bio-physical survey and Village level date collection from Talati-Cum mantri.
Household census survey includes a detailed questionnaire which was been filled by visiting each and every house-hold in the village.
This gave in the details of the demographic profile of the village, the literacy percentage, SC/ST population, number of BPL household,
IWMP-3 Idar
District Watershed Development Unit, Sabarkanth
(48)
cattle population, Net consumption rate in the village, average milk production of the cattle’s and various schemes running and their
Bio-physical survey was been undertaken to identify various natural resource available in the village. It included the soil typology,
Well in the area, crop taken in the field, Cropping pattern, fertilizer used and various sources of irrigation in the field.
Fig. Base Line Survey at Project Area
IWMP-3 Idar
District Watershed Development Unit, Sabarkanth
(49)
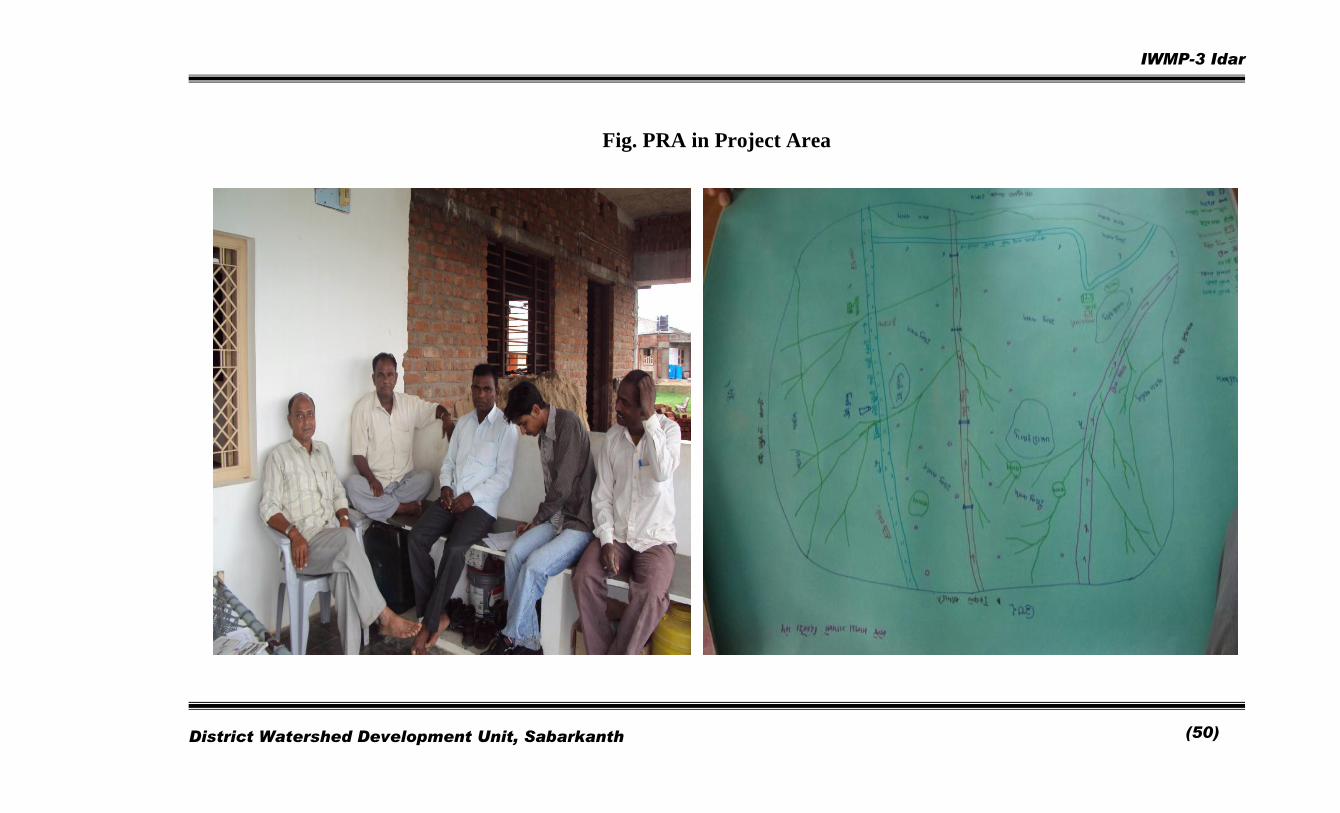
3. Participatory Rural Appraisal (PRA)
The past experience of watershed has given tremendous input to focus on creating accountability of the stakeholder towards the
programme. This has created an emphasis to include all the stakeholder communities and their local and indigenous Technological
Knowledge (ITK) while planning for any activity. Participatory approach provides a new path for planning, implementing, monitoring and
post-withdrawal activities with a complete accountability of the stakeholders. These decreases the efforts of the ground staff i.e. WDT
members and involve more of villages as implementers. Various PRA techniques like resource mapping, social mapping, and season
calendars were used to understand the physical and social orientation of the village in general and watershed in specific. These tools put the
village in ease than the complicated questionnaires. Various tools like Matrix ranking, venue Diagram were used to identify various local
vegetations (apt for a forestation), Fodders crops, various institutions and their significance in the life of the farmers.
IWMP-3 Idar
District Watershed Development Unit, Sabarkanth
(50)
Fig. PRA in Project Area
IWMP-3 Idar
District Watershed Development Unit, Sabarkanth
(51)
4. Use of GIS and remote sensing for planning
Use of various high science tools has been promoted at various stages of watershed development.
a) Prioritization
Geographical Information System (GIS) has been use for prioritization process. Various layer maps were created like Geo-morphological,
Soil, BPL, Population, SC/ST population, Ground water Status, Drinking water situation Slope percent. These were all given proper weight
ages according to the DoLR specification. This helped in prioritization of various watershed areas.
b) Planning
A action plan matrix was been formulated by State Level Nodal Agency (SLNA) taking into account various features like the slope
percent soil Depth, Soil Texture, Soil erosion in the area for wasteland, forest land and agricultural land.
Global positioning system (GPS) was used to identify each and every water conservation structures available in the project area. This will
be used to create a map. Contour Map of vertical interval of 1 meter at a scale of 1:8000 was used for identifying various location specific
for soil and water conservation structures.
c) Hydrological modeling
Hydrology modeling technique was been used for locating drainage, stream length, flow direction, sink, Flow accumulation. This model
overlaid over cadastral map hell to calculate the catchment area of each structures like the check dam etc. This has helped to remove the
human error which generally occurring while calculating the catchment area of a check dam.
IWMP-3 Idar
District Watershed Development Unit, Sabarkanth
(52)
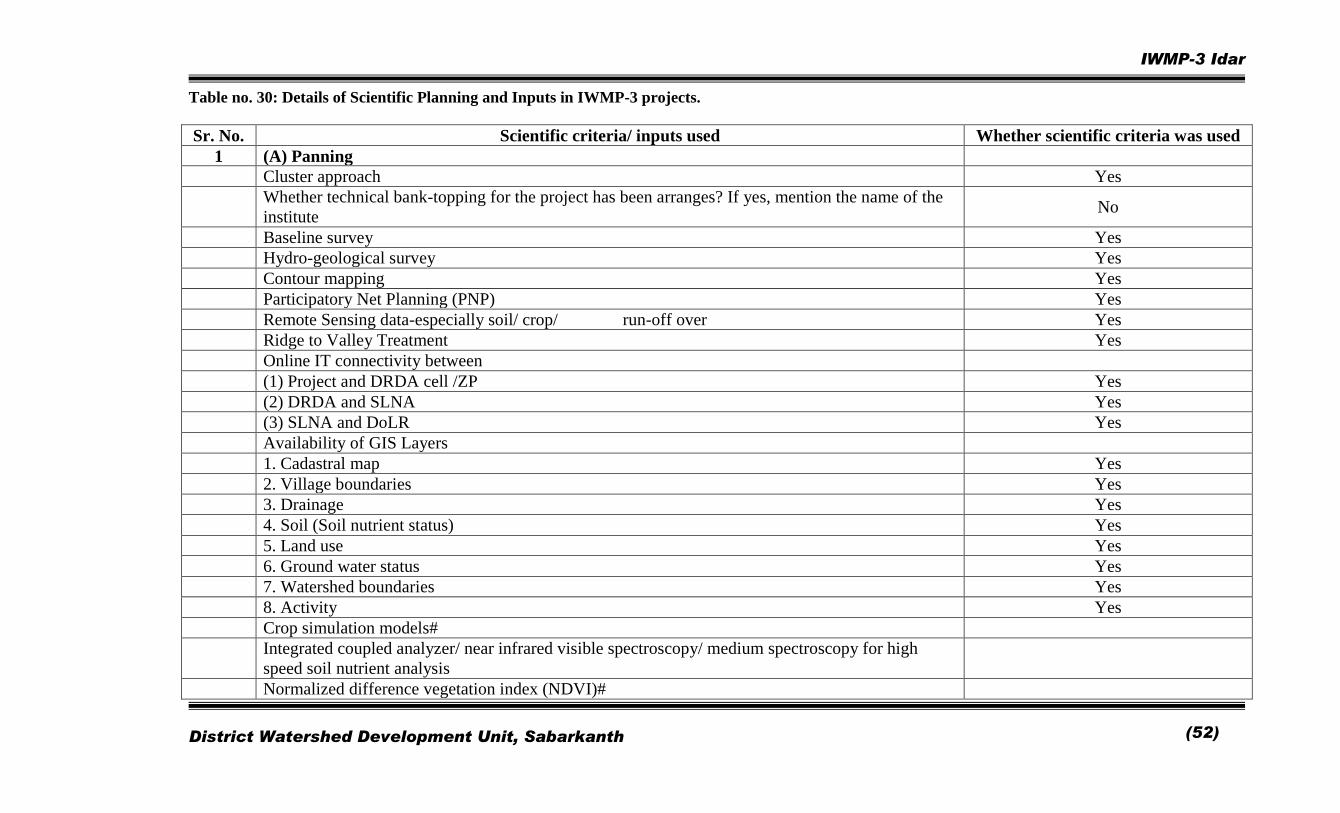
Table no. 30: Details of Scientific Planning and Inputs in IWMP-3 projects.
Sr. No. Scientific criteria/ inputs used Whether scientific criteria was used
1 (A) Panning
Cluster approach Yes
Whether technical bank-topping for the project has been arranges? If yes, mention the name of the
institute No
Baseline survey Yes
Hydro-geological survey Yes
Contour mapping Yes
Participatory Net Planning (PNP) Yes
Remote Sensing data-especially soil/ crop/ run-off over Yes
Ridge to Valley Treatment Yes
Online IT connectivity between
(1) Project and DRDA cell /ZP Yes
(2) DRDA and SLNA Yes
(3) SLNA and DoLR Yes
Availability of GIS Layers
1. Cadastral map Yes
2. Village boundaries Yes
3. Drainage Yes
4. Soil (Soil nutrient status) Yes
5. Land use Yes
6. Ground water status Yes
7. Watershed boundaries Yes
8. Activity Yes
Crop simulation models#
Integrated coupled analyzer/ near infrared visible spectroscopy/ medium spectroscopy for high
speed soil nutrient analysis
Normalized difference vegetation index (NDVI)#
IWMP-3 Idar
District Watershed Development Unit, Sabarkanth
(53)
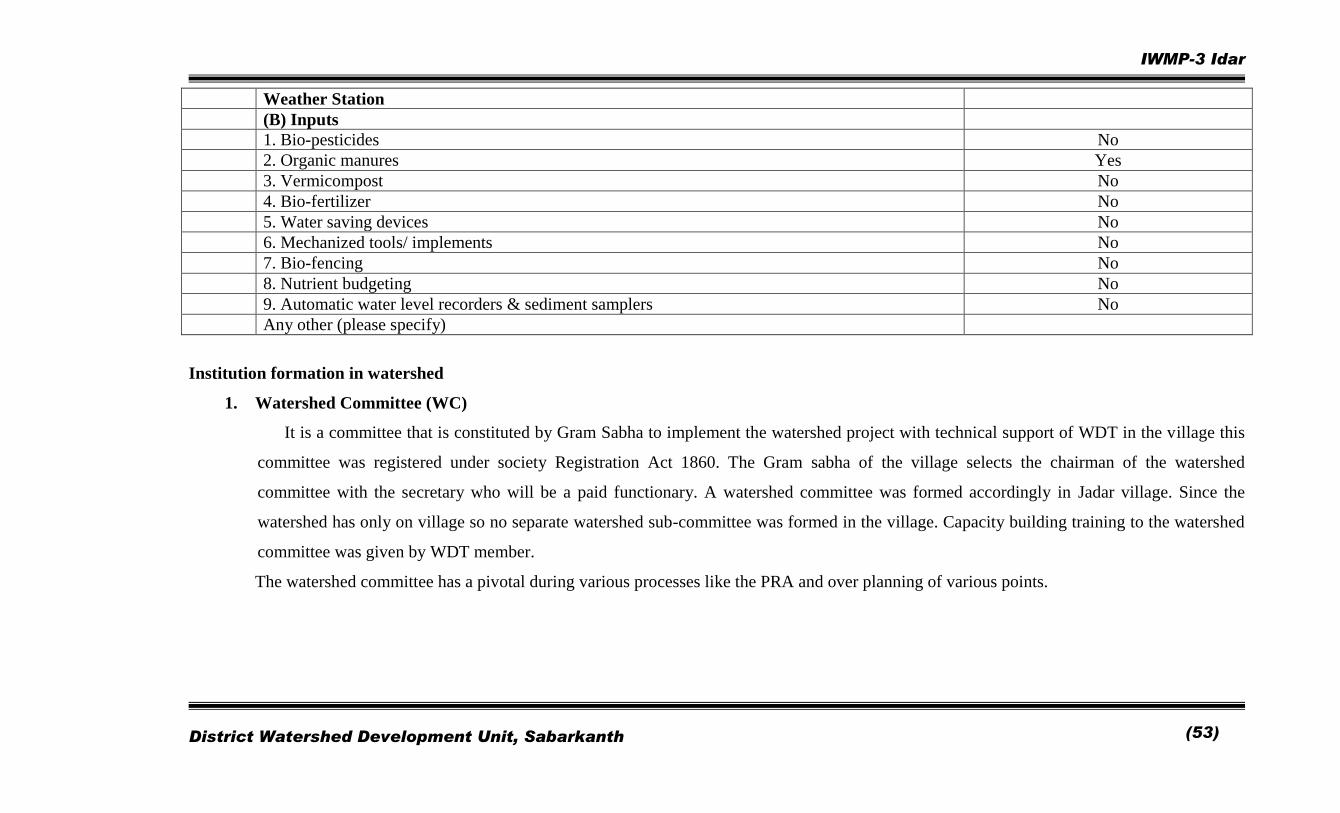
Weather Station
(B) Inputs
1. Bio-pesticides No
2. Organic manures Yes
3. Vermicompost No
4. Bio-fertilizer No
5. Water saving devices No
6. Mechanized tools/ implements No
7. Bio-fencing No
8. Nutrient budgeting No
9. Automatic water level recorders & sediment samplers No
Any other (please specify)
Institution formation in watershed
1. Watershed Committee (WC)
It is a committee that is constituted by Gram Sabha to implement the watershed project with technical support of WDT in the village this
committee was registered under society Registration Act 1860. The Gram sabha of the village selects the chairman of the watershed
committee with the secretary who will be a paid functionary. A watershed committee was formed accordingly in Jadar village. Since the
watershed has only on village so no separate watershed sub-committee was formed in the village. Capacity building training to the watershed
committee was given by WDT member.
The watershed committee has a pivotal during various processes like the PRA and over planning of various points.
IWMP-3 Idar
District Watershed Development Unit, Sabarkanth
(54)
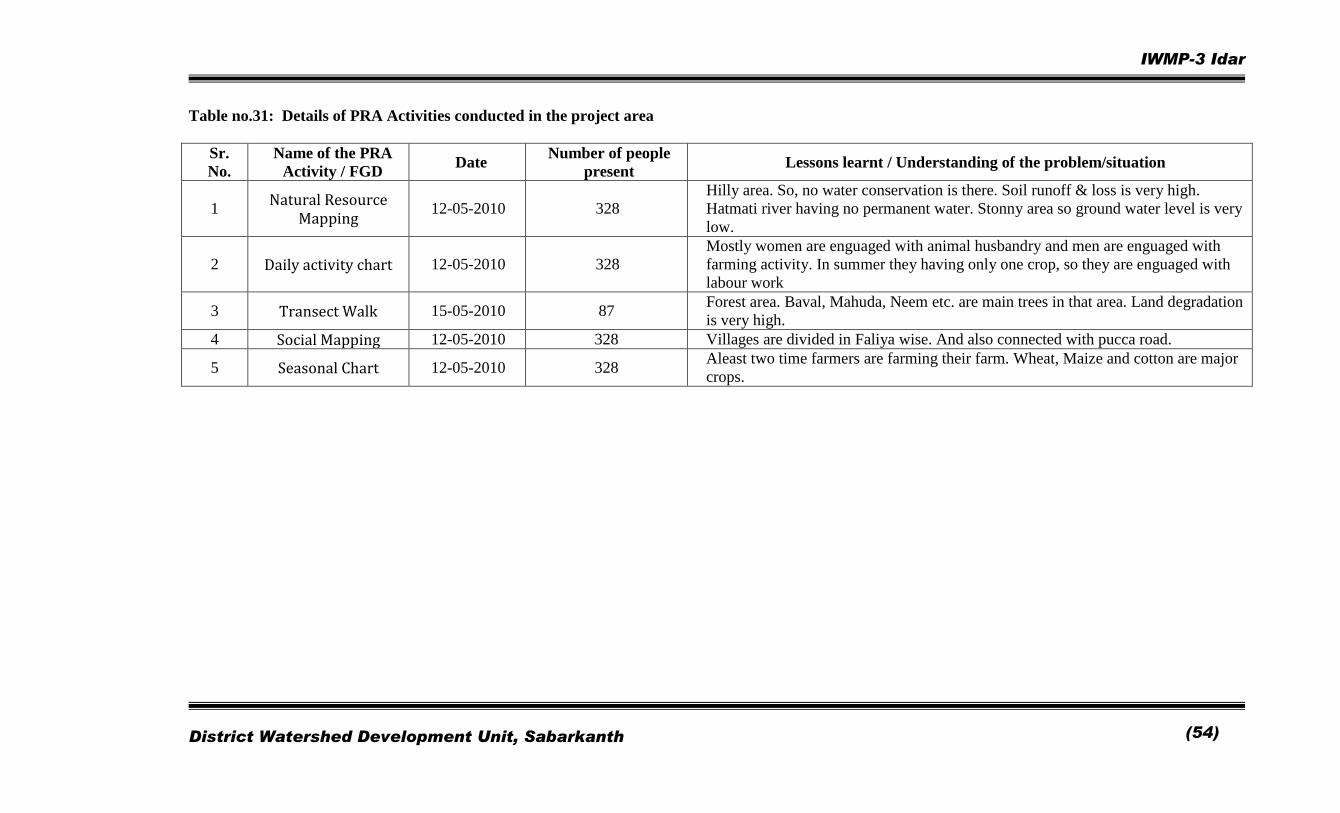
Table no.31: Details of PRA Activities conducted in the project area
Sr.
No.
Name of the PRA
Activity / FGD Date
Number of people
present Lessons learnt / Understanding of the problem/situation
1 Natural Resource
Mapping 12-05-2010 328
Hilly area. So, no water conservation is there. Soil runoff & loss is very high.
Hatmati river having no permanent water. Stonny area so ground water level is very
low.
2 Daily activity chart 12-05-2010 328
Mostly women are enguaged with animal husbandry and men are enguaged with
farming activity. In summer they having only one crop, so they are enguaged with
labour work
3 Transect Walk 15-05-2010 87 Forest area. Baval, Mahuda, Neem etc. are main trees in that area. Land degradation
is very high.
4 Social Mapping 12-05-2010 328 Villages are divided in Faliya wise. And also connected with pucca road.
5 Seasonal Chart 12-05-2010 328 Aleast two time farmers are farming their farm. Wheat, Maize and cotton are major
crops.
IWMP-3 Idar
District Watershed Development Unit, Sabarkanth
(55)
IWMP-3 Idar
District Watershed Development Unit, Sabarkanth
(56)

IWMP-3 Idar
District Watershed Development Unit, Sabarkanth
(57)
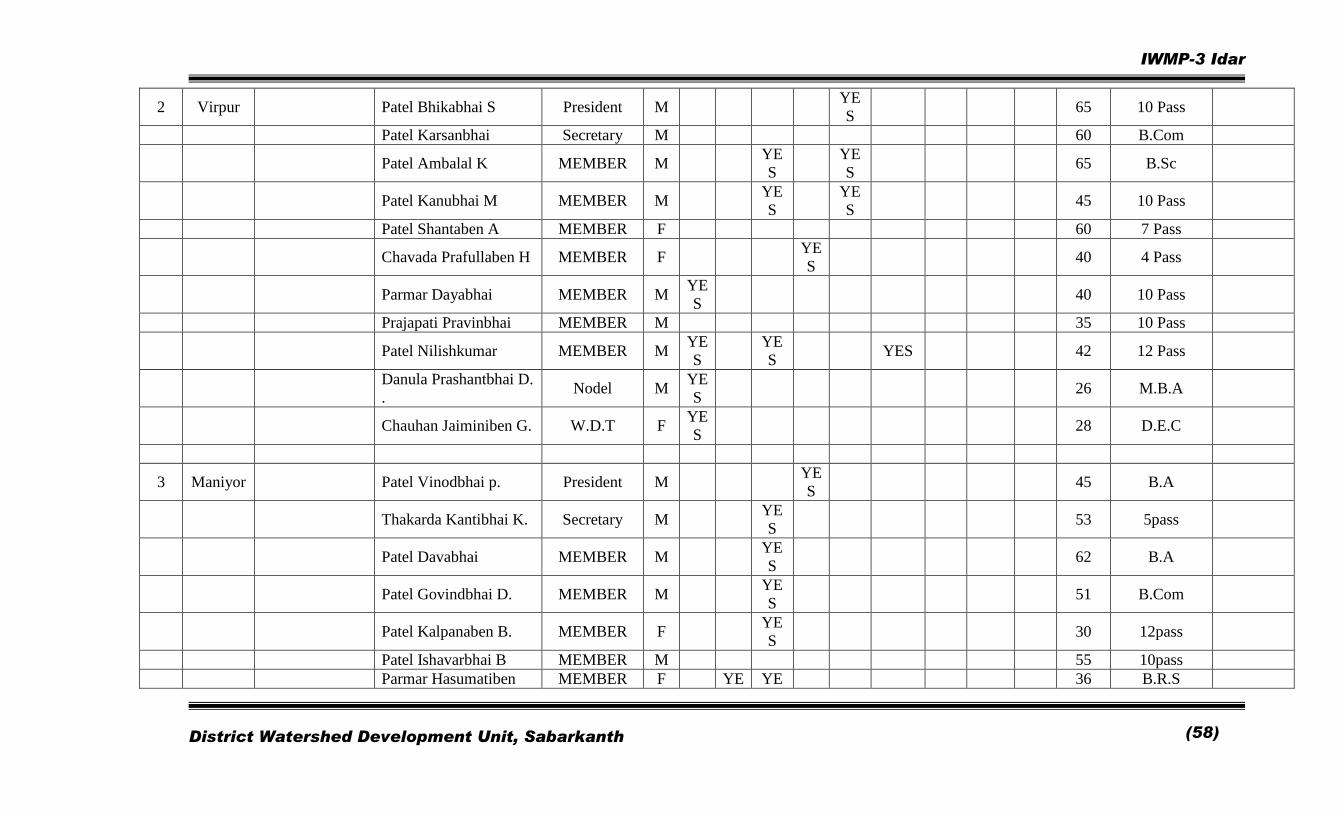
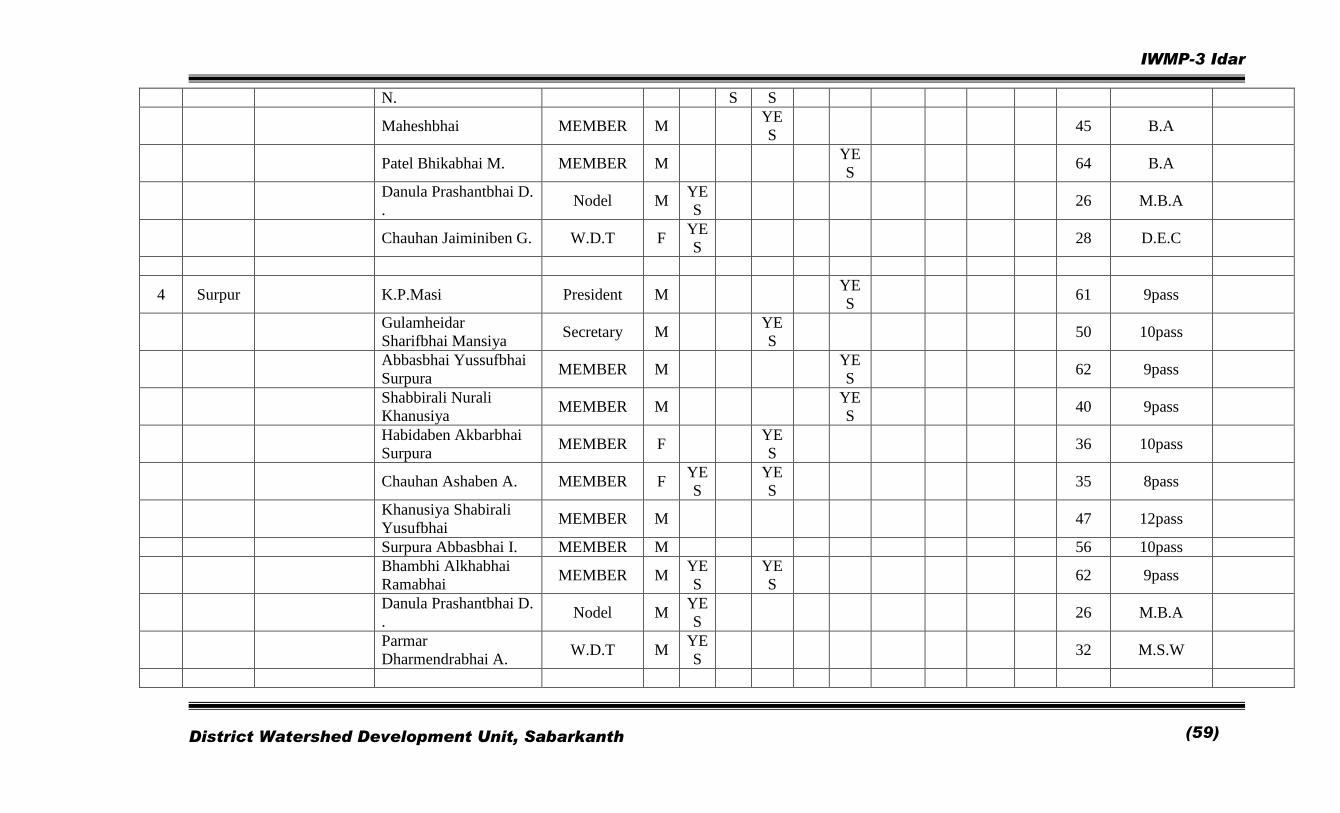
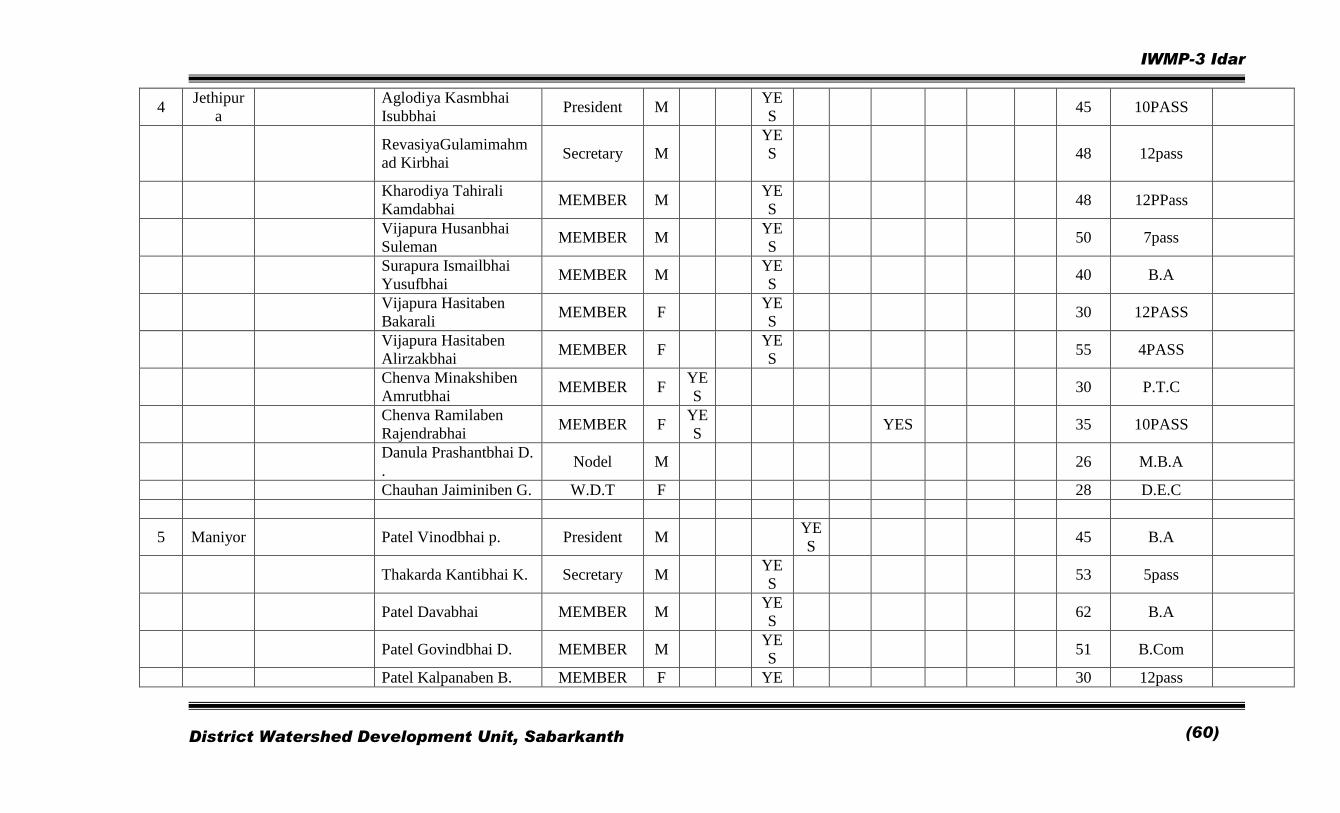
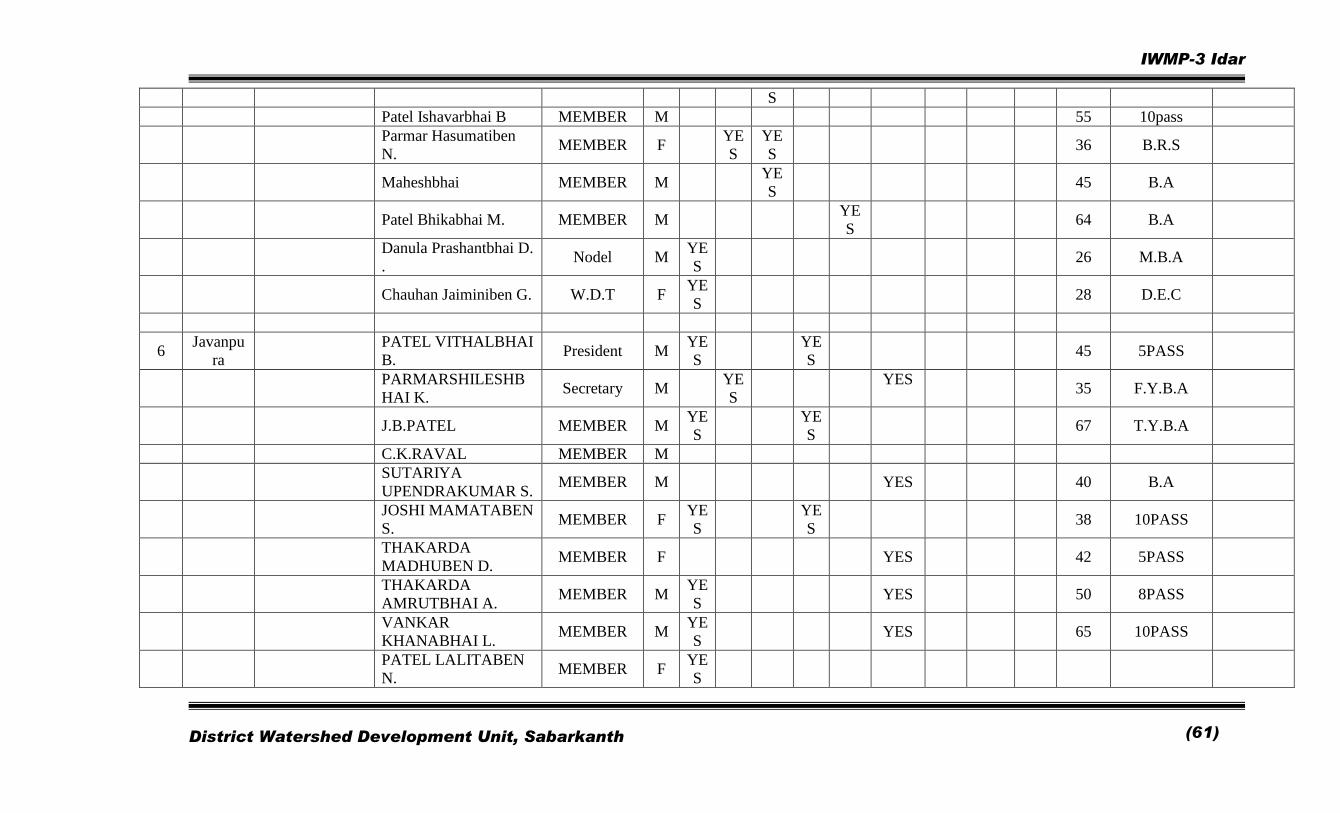
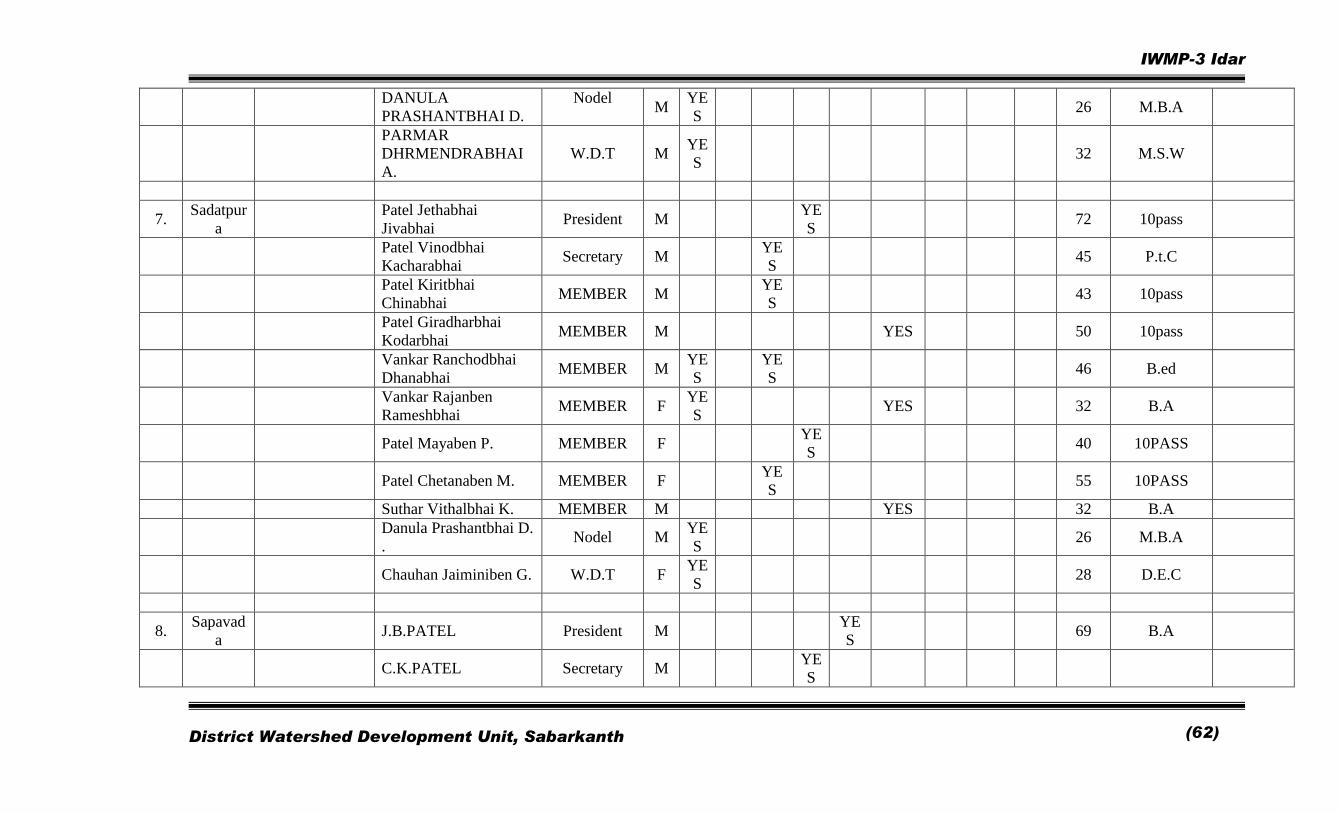
Table no. 32: Watershed committee details
Sr.
No.
Name of
WCs
Date of
Registration as
a Society
(dd/mm/yyyy)
Name of Mamber Designation M/
F SC ST SF
M
F LF
Land
- less UG
SH
G GP Age
Educational
Qualificatio
n
Function’
s
assigned
1
Jadar
com
mit
tee
30/4/2010
Harshidaben J. Oja President F YE
S Yes Yes 43 M.A
P.V.Suthar Secretary M Yes 34 12p
Patel Ambalal G. MEMBER M YE
S Yes 35 12p
Patel Nirajanben B MEMBER M YE
S 45 B.A
Bhoi Purnimaben MEMBER F YES 45 7P
Patel Ushaben
Sanjaybhai MEMBER F
YE
S Yes 35 10P
Modi Bhaveshbhai MEMBER M YE
S
YE
S 48 B.COM
P.M.Patel MEMBER M YE
S Yes 43 B.A
B.R .Patel MEMBER M YE
S
YE
S
YE
S YES 44 12PASS
Dhanula Prashantbhai
D.
.
Nodal M YE
S 26 M.B.A
Parmar
Dharmendrabhai A. W.D.T M
YE
S 32 M.S.W
IWMP-3 Idar
District Watershed Development Unit, Sabarkanth
(58)
2 Virpur Patel Bhikabhai S President M YE
S 65 10 Pass
Patel Karsanbhai Secretary M 60 B.Com
Patel Ambalal K MEMBER M YE
S
YE
S 65 B.Sc
Patel Kanubhai M MEMBER M YE
S
YE
S 45 10 Pass
Patel Shantaben A MEMBER F 60 7 Pass
Chavada Prafullaben H MEMBER F YE
S 40 4 Pass
Parmar Dayabhai MEMBER M YE
S 40 10 Pass
Prajapati Pravinbhai MEMBER M 35 10 Pass
Patel Nilishkumar MEMBER M YE
S
YE
S YES 42 12 Pass
Danula Prashantbhai D.
. Nodel M
YE
S 26 M.B.A
Chauhan Jaiminiben G. W.D.T F YE
S 28 D.E.C
3 Maniyor Patel Vinodbhai p. President M YE
S 45 B.A
Thakarda Kantibhai K. Secretary M YE
S 53 5pass
Patel Davabhai MEMBER M YE
S 62 B.A
Patel Govindbhai D. MEMBER M YE
S 51 B.Com
Patel Kalpanaben B. MEMBER F YE
S 30 12pass
Patel Ishavarbhai B MEMBER M 55 10pass
Parmar Hasumatiben MEMBER F YE YE 36 B.R.S
IWMP-3 Idar
District Watershed Development Unit, Sabarkanth
(59)
N. S S
Maheshbhai MEMBER M YE
S 45 B.A
Patel Bhikabhai M. MEMBER M YE
S 64 B.A
Danula Prashantbhai D.
. Nodel M
YE
S 26 M.B.A
Chauhan Jaiminiben G. W.D.T F YE
S 28 D.E.C
4 Surpur K.P.Masi President M YE
S 61 9pass
Gulamheidar
Sharifbhai Mansiya Secretary M
YE
S 50 10pass
Abbasbhai Yussufbhai
Surpura MEMBER M
YE
S 62 9pass
Shabbirali Nurali
Khanusiya MEMBER M
YE
S 40 9pass
Habidaben Akbarbhai
Surpura MEMBER F
YE
S 36 10pass
Chauhan Ashaben A. MEMBER F YE
S
YE
S 35 8pass
Khanusiya Shabirali
Yusufbhai MEMBER M 47 12pass
Surpura Abbasbhai I. MEMBER M 56 10pass
Bhambhi Alkhabhai
Ramabhai MEMBER M
YE
S
YE
S 62 9pass
Danula Prashantbhai D.
. Nodel M
YE
S 26 M.B.A
Parmar
Dharmendrabhai A. W.D.T M
YE
S 32 M.S.W
IWMP-3 Idar
District Watershed Development Unit, Sabarkanth
(60)
4 Jethipur
a
Aglodiya Kasmbhai
Isubbhai President M
YE
S 45 10PASS
RevasiyaGulamimahm
ad Kirbhai Secretary M
YE
S
48 12pass
Kharodiya Tahirali
Kamdabhai MEMBER M
YE
S 48 12PPass
Vijapura Husanbhai
Suleman MEMBER M
YE
S 50 7pass
Surapura Ismailbhai
Yusufbhai MEMBER M
YE
S 40 B.A
Vijapura Hasitaben
Bakarali MEMBER F
YE
S 30 12PASS
Vijapura Hasitaben
Alirzakbhai MEMBER F
YE
S 55 4PASS
Chenva Minakshiben
Amrutbhai MEMBER F
YE
S 30 P.T.C
Chenva Ramilaben
Rajendrabhai MEMBER F
YE
S YES 35 10PASS
Danula Prashantbhai D.
. Nodel M 26 M.B.A
Chauhan Jaiminiben G. W.D.T F 28 D.E.C
5 Maniyor Patel Vinodbhai p. President M YE
S 45 B.A
Thakarda Kantibhai K. Secretary M YE
S 53 5pass
Patel Davabhai MEMBER M YE
S 62 B.A
Patel Govindbhai D. MEMBER M YE
S 51 B.Com
Patel Kalpanaben B. MEMBER F YE 30 12pass
IWMP-3 Idar
District Watershed Development Unit, Sabarkanth
(61)
S
Patel Ishavarbhai B MEMBER M 55 10pass
Parmar Hasumatiben
N. MEMBER F
YE
S
YE
S 36 B.R.S
Maheshbhai MEMBER M YE
S 45 B.A
Patel Bhikabhai M. MEMBER M YE
S 64 B.A
Danula Prashantbhai D.
. Nodel M
YE
S 26 M.B.A
Chauhan Jaiminiben G. W.D.T F YE
S 28 D.E.C
6 Javanpu
ra
PATEL VITHALBHAI
B. President M
YE
S
YE
S 45 5PASS
PARMARSHILESHB
HAI K. Secretary M
YE
S
YES
35 F.Y.B.A
J.B.PATEL MEMBER M YE
S
YE
S 67 T.Y.B.A
C.K.RAVAL MEMBER M
SUTARIYA
UPENDRAKUMAR S. MEMBER M YES 40 B.A
JOSHI MAMATABEN
S. MEMBER F
YE
S
YE
S 38 10PASS
THAKARDA
MADHUBEN D. MEMBER F YES 42 5PASS
THAKARDA
AMRUTBHAI A. MEMBER M
YE
S YES 50 8PASS
VANKAR
KHANABHAI L. MEMBER M
YE
S YES 65 10PASS
PATEL LALITABEN
N. MEMBER F
YE
S
IWMP-3 Idar
District Watershed Development Unit, Sabarkanth
(62)
DANULA
PRASHANTBHAI D.
Nodel
M
YE
S 26 M.B.A
PARMAR
DHRMENDRABHAI
A.
W.D.T M YE
S 32 M.S.W
7. Sadatpur
a
Patel Jethabhai
Jivabhai President M
YE
S 72 10pass
Patel Vinodbhai
Kacharabhai Secretary M
YE
S 45 P.t.C
Patel Kiritbhai
Chinabhai MEMBER M
YE
S 43 10pass
Patel Giradharbhai
Kodarbhai MEMBER M YES 50 10pass
Vankar Ranchodbhai
Dhanabhai MEMBER M
YE
S
YE
S 46 B.ed
Vankar Rajanben
Rameshbhai MEMBER F
YE
S YES 32 B.A
Patel Mayaben P. MEMBER F YE
S 40 10PASS
Patel Chetanaben M. MEMBER F YE
S 55 10PASS
Suthar Vithalbhai K. MEMBER M YES 32 B.A
Danula Prashantbhai D.
. Nodel M
YE
S 26 M.B.A
Chauhan Jaiminiben G. W.D.T F YE
S 28 D.E.C
8. Sapavad
a J.B.PATEL President M
YE
S 69 B.A
C.K.PATEL Secretary M YE
S
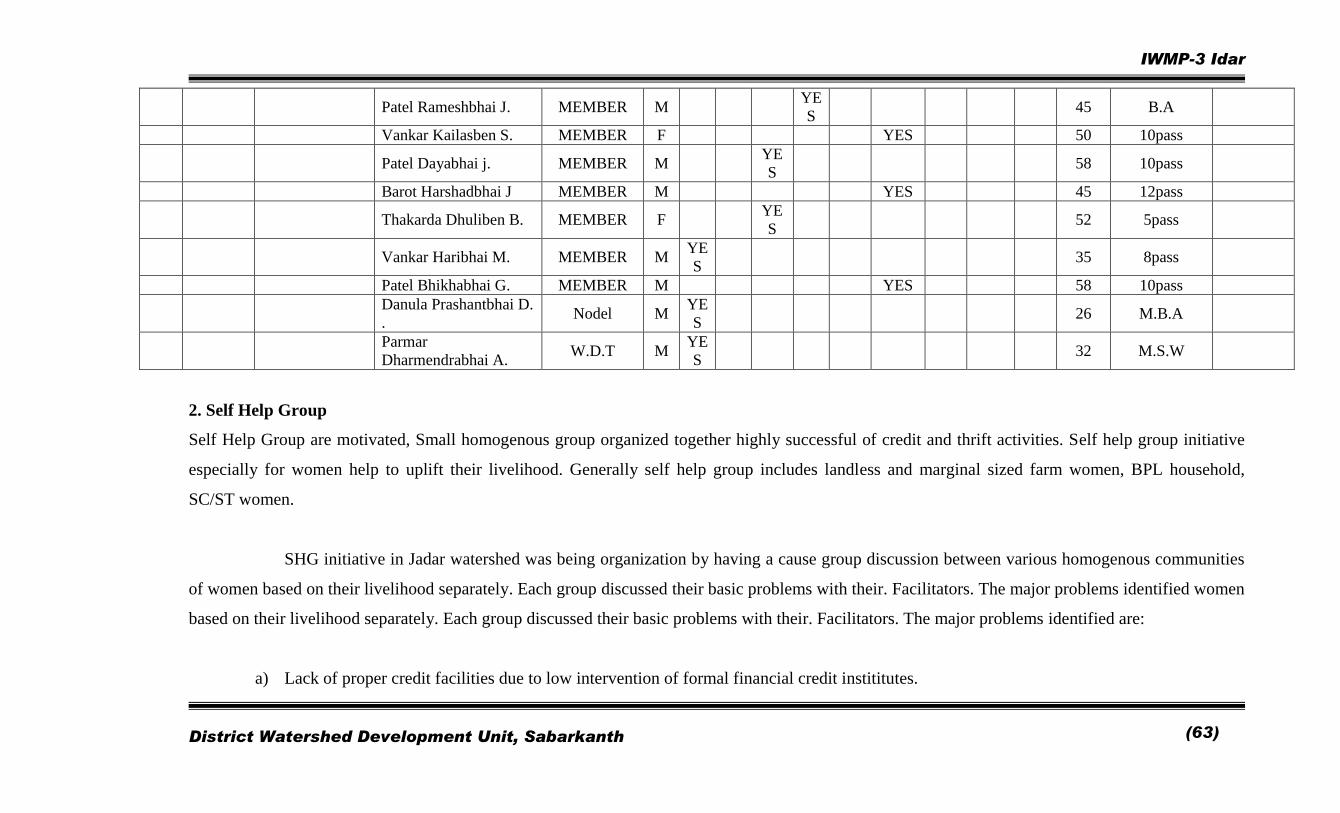
IWMP-3 Idar
District Watershed Development Unit, Sabarkanth
(63)
Patel Rameshbhai J. MEMBER M YE
S 45 B.A
Vankar Kailasben S. MEMBER F YES 50 10pass
Patel Dayabhai j. MEMBER M YE
S 58 10pass
Barot Harshadbhai J MEMBER M YES 45 12pass
Thakarda Dhuliben B. MEMBER F YE
S 52 5pass
Vankar Haribhai M. MEMBER M YE
S 35 8pass
Patel Bhikhabhai G. MEMBER M YES 58 10pass
Danula Prashantbhai D.
. Nodel M
YE
S 26 M.B.A
Parmar
Dharmendrabhai A. W.D.T M
YE
S 32 M.S.W
2. Self Help Group
Self Help Group are motivated, Small homogenous group organized together highly successful of credit and thrift activities. Self help group initiative
especially for women help to uplift their livelihood. Generally self help group includes landless and marginal sized farm women, BPL household,
SC/ST women.
SHG initiative in Jadar watershed was being organization by having a cause group discussion between various homogenous communities
of women based on their livelihood separately. Each group discussed their basic problems with their. Facilitators. The major problems identified women
based on their livelihood separately. Each group discussed their basic problems with their. Facilitators. The major problems identified are:
a) Lack of proper credit facilities due to low intervention of formal financial credit instititutes.
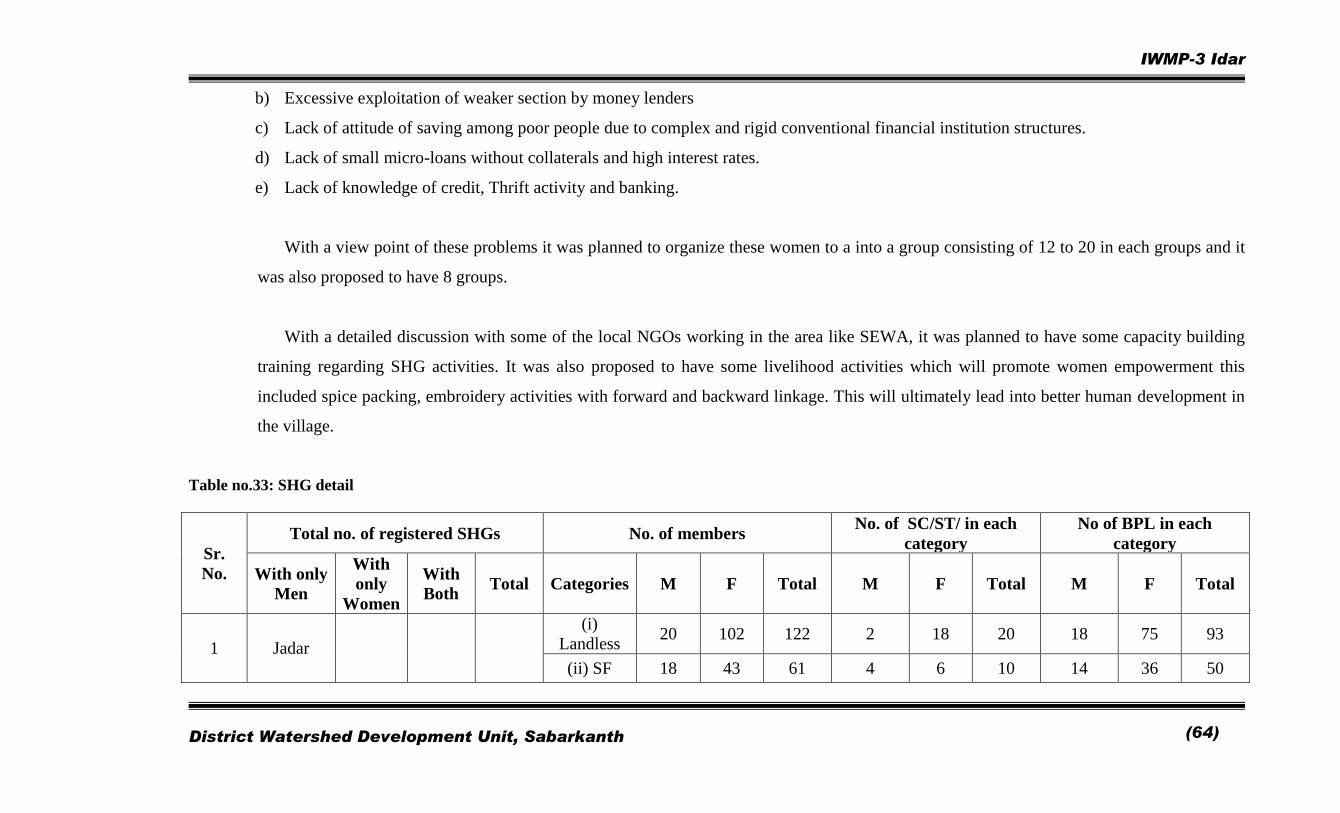
IWMP-3 Idar
District Watershed Development Unit, Sabarkanth
(64)
b) Excessive exploitation of weaker section by money lenders
c) Lack of attitude of saving among poor people due to complex and rigid conventional financial institution structures.
d) Lack of small micro-loans without collaterals and high interest rates.
e) Lack of knowledge of credit, Thrift activity and banking.
With a view point of these problems it was planned to organize these women to a into a group consisting of 12 to 20 in each groups and it
was also proposed to have 8 groups.
With a detailed discussion with some of the local NGOs working in the area like SEWA, it was planned to have some capacity building
training regarding SHG activities. It was also proposed to have some livelihood activities which will promote women empowerment this
included spice packing, embroidery activities with forward and backward linkage. This will ultimately lead into better human development in
the village.
Table no.33: SHG detail
Sr.
No.
Total no. of registered SHGs No. of members No. of SC/ST/ in each
category
No of BPL in each
category
With only
Men
With
only
Women
With
Both Total Categories M F Total M F Total M F Total
1 Jadar
(i)
Landless 20 102 122 2 18 20 18 75 93
(ii) SF 18 43 61 4 6 10 14 36 50
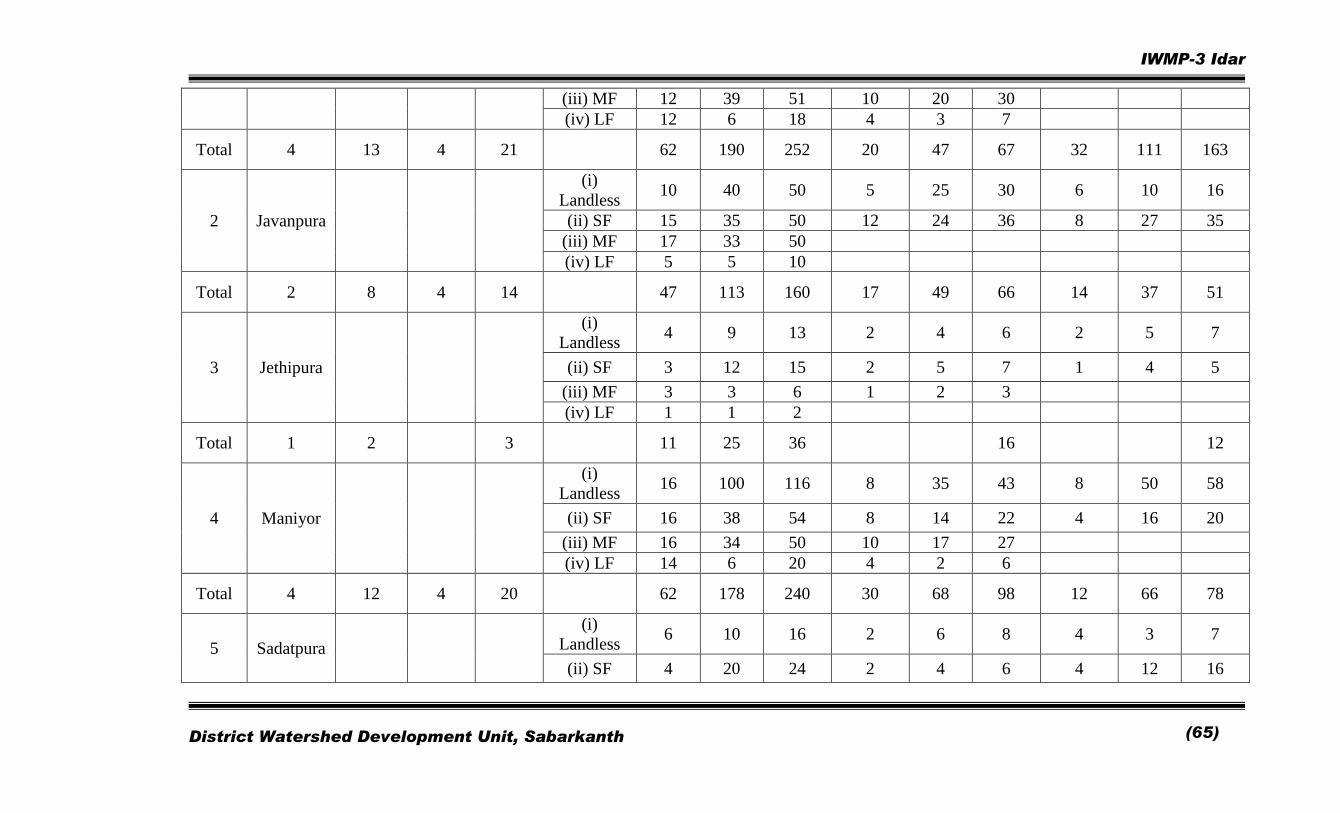
IWMP-3 Idar
District Watershed Development Unit, Sabarkanth
(65)
(iii) MF 12 39 51 10 20 30
(iv) LF 12 6 18 4 3 7
Total 4 13 4 21 62 190 252 20 47 67 32 111 163
2 Javanpura
(i)
Landless 10 40 50 5 25 30 6 10 16
(ii) SF 15 35 50 12 24 36 8 27 35
(iii) MF 17 33 50
(iv) LF 5 5 10
Total 2 8 4 14 47 113 160 17 49 66 14 37 51
3 Jethipura
(i)
Landless 4 9 13 2 4 6 2 5 7
(ii) SF 3 12 15 2 5 7 1 4 5
(iii) MF 3 3 6 1 2 3
(iv) LF 1 1 2
Total 1 2 3 11 25 36 16 12
4 Maniyor
(i)
Landless 16 100 116 8 35 43 8 50 58
(ii) SF 16 38 54 8 14 22 4 16 20
(iii) MF 16 34 50 10 17 27
(iv) LF 14 6 20 4 2 6
Total 4 12 4 20 62 178 240 30 68 98 12 66 78
5 Sadatpura
(i)
Landless 6 10 16 2 6 8 4 3 7
(ii) SF 4 20 24 2 4 6 4 12 16
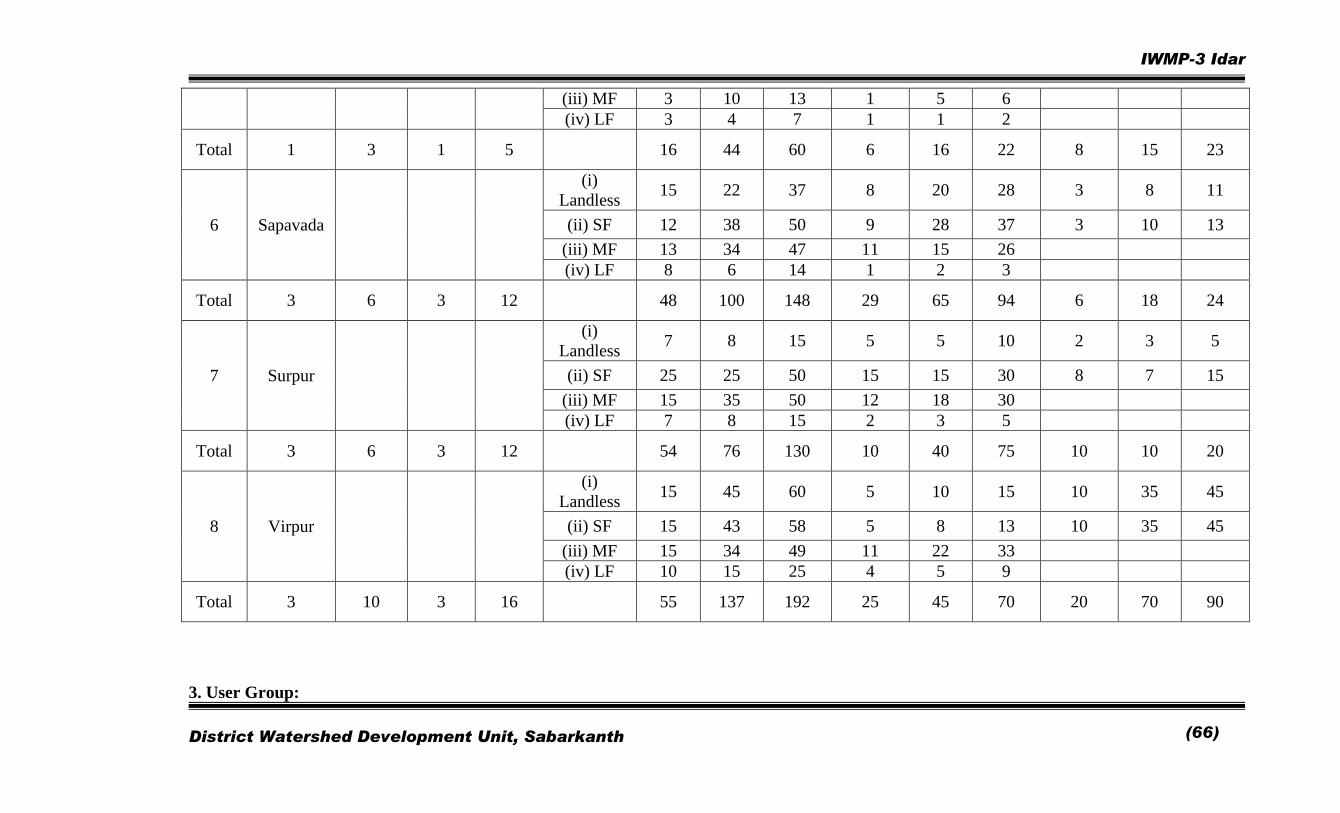
IWMP-3 Idar
District Watershed Development Unit, Sabarkanth
(66)
(iii) MF 3 10 13 1 5 6
(iv) LF 3 4 7 1 1 2
Total 1 3 1 5 16 44 60 6 16 22 8 15 23
6 Sapavada
(i)
Landless 15 22 37 8 20 28 3 8 11
(ii) SF 12 38 50 9 28 37 3 10 13
(iii) MF 13 34 47 11 15 26
(iv) LF 8 6 14 1 2 3
Total 3 6 3 12 48 100 148 29 65 94 6 18 24
7 Surpur
(i)
Landless 7 8 15 5 5 10 2 3 5
(ii) SF 25 25 50 15 15 30 8 7 15
(iii) MF 15 35 50 12 18 30
(iv) LF 7 8 15 2 3 5
Total 3 6 3 12 54 76 130 10 40 75 10 10 20
8 Virpur
(i)
Landless 15 45 60 5 10 15 10 35 45
(ii) SF 15 43 58 5 8 13 10 35 45
(iii) MF 15 34 49 11 22 33
(iv) LF 10 15 25 4 5 9
Total 3 10 3 16 55 137 192 25 45 70 20 70 90
3. User Group:
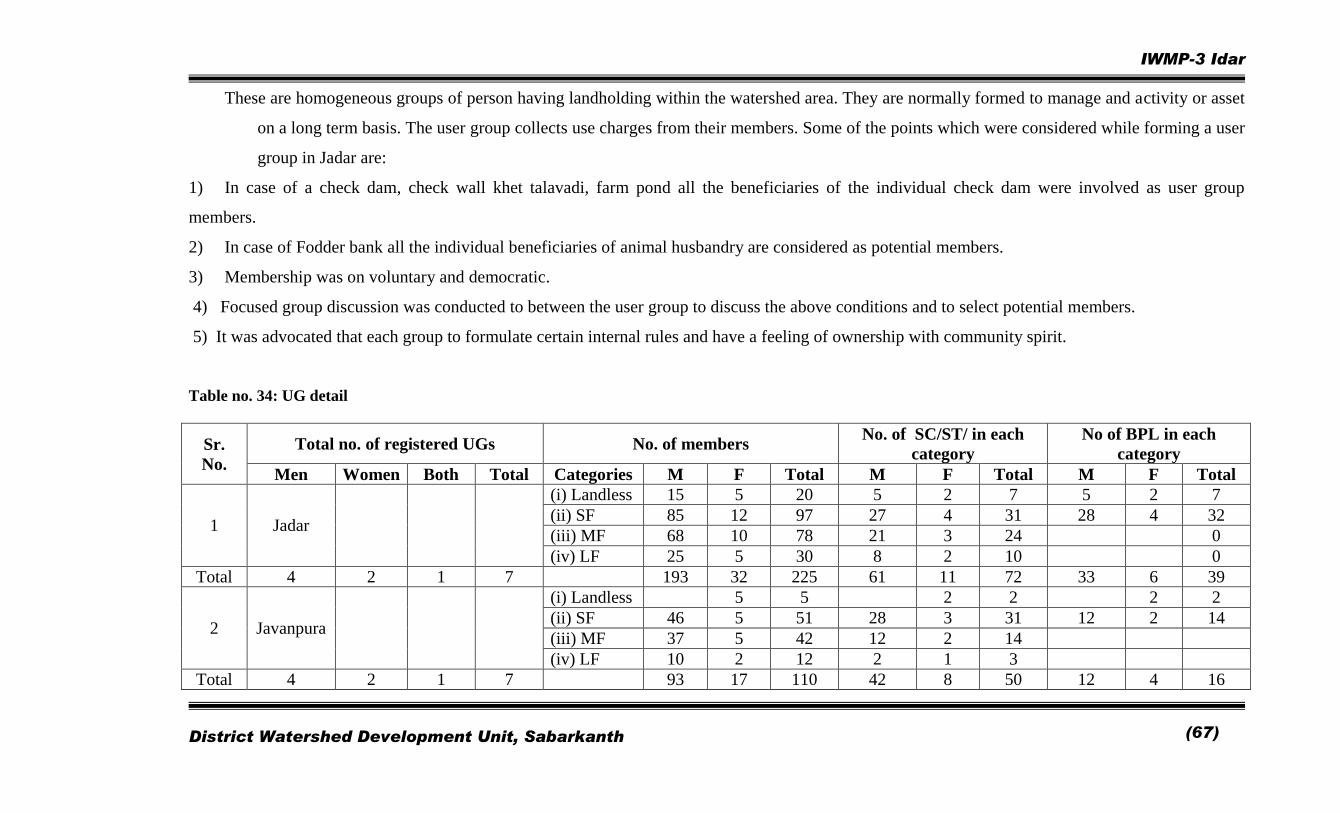
IWMP-3 Idar
District Watershed Development Unit, Sabarkanth
(67)
These are homogeneous groups of person having landholding within the watershed area. They are normally formed to manage and activity or asset
on a long term basis. The user group collects use charges from their members. Some of the points which were considered while forming a user
group in Jadar are:
1) In case of a check dam, check wall khet talavadi, farm pond all the beneficiaries of the individual check dam were involved as user group
members.
2) In case of Fodder bank all the individual beneficiaries of animal husbandry are considered as potential members.
3) Membership was on voluntary and democratic.
4) Focused group discussion was conducted to between the user group to discuss the above conditions and to select potential members.
5) It was advocated that each group to formulate certain internal rules and have a feeling of ownership with community spirit.
Table no. 34: UG detail
Sr.
No.
Total no. of registered UGs No. of members No. of SC/ST/ in each
category
No of BPL in each
category
Men Women Both Total Categories M F Total M F Total M F Total
1 Jadar
(i) Landless 15 5 20 5 2 7 5 2 7
(ii) SF 85 12 97 27 4 31 28 4 32
(iii) MF 68 10 78 21 3 24 0
(iv) LF 25 5 30 8 2 10 0
Total 4 2 1 7 193 32 225 61 11 72 33 6 39
2 Javanpura
(i) Landless 5 5 2 2 2 2
(ii) SF 46 5 51 28 3 31 12 2 14
(iii) MF 37 5 42 12 2 14
(iv) LF 10 2 12 2 1 3
Total 4 2 1 7 93 17 110 42 8 50 12 4 16
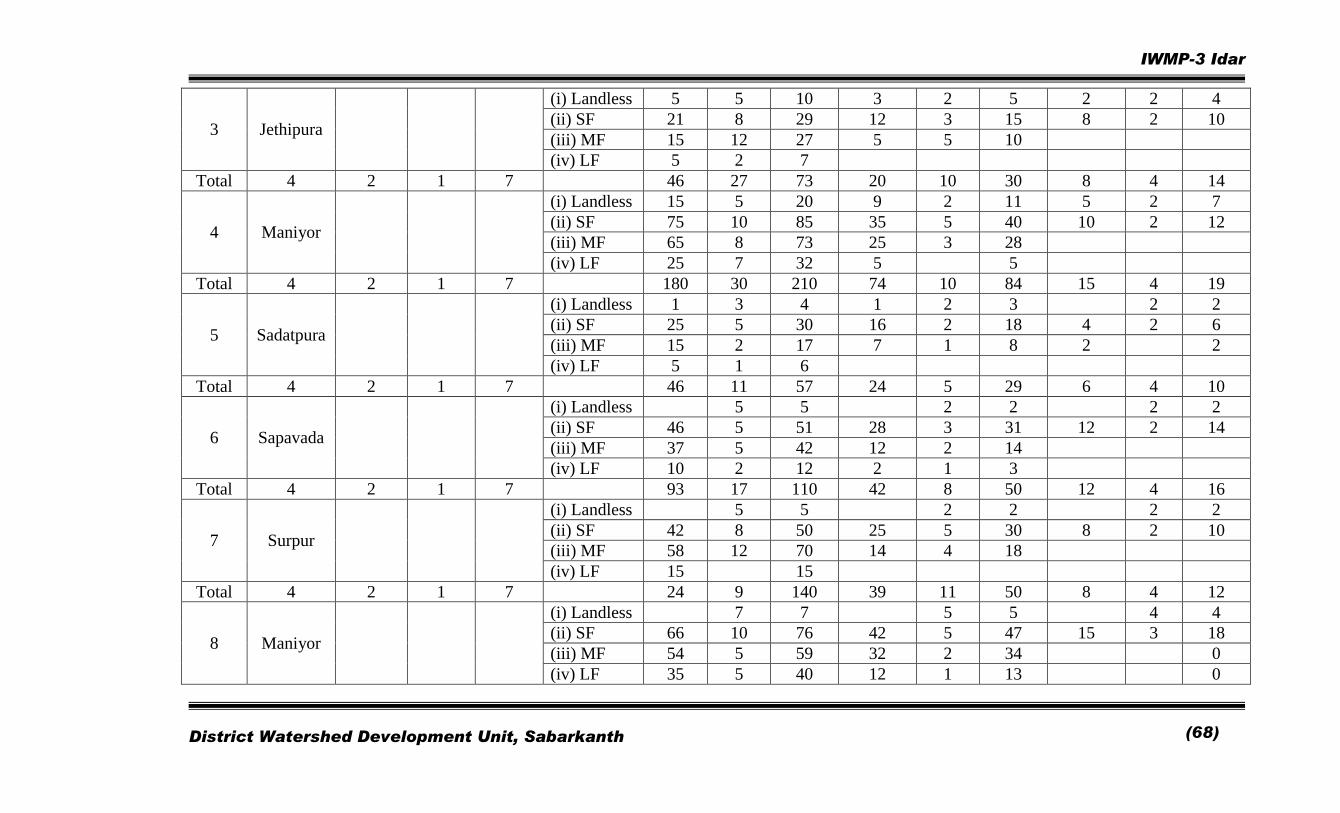
IWMP-3 Idar
District Watershed Development Unit, Sabarkanth
(68)
3 Jethipura
(i) Landless 5 5 10 3 2 5 2 2 4
(ii) SF 21 8 29 12 3 15 8 2 10
(iii) MF 15 12 27 5 5 10
(iv) LF 5 2 7
Total 4 2 1 7 46 27 73 20 10 30 8 4 14
4 Maniyor
(i) Landless 15 5 20 9 2 11 5 2 7
(ii) SF 75 10 85 35 5 40 10 2 12
(iii) MF 65 8 73 25 3 28
(iv) LF 25 7 32 5 5
Total 4 2 1 7 180 30 210 74 10 84 15 4 19
5 Sadatpura
(i) Landless 1 3 4 1 2 3 2 2
(ii) SF 25 5 30 16 2 18 4 2 6
(iii) MF 15 2 17 7 1 8 2 2
(iv) LF 5 1 6
Total 4 2 1 7 46 11 57 24 5 29 6 4 10
6 Sapavada
(i) Landless 5 5 2 2 2 2
(ii) SF 46 5 51 28 3 31 12 2 14
(iii) MF 37 5 42 12 2 14
(iv) LF 10 2 12 2 1 3
Total 4 2 1 7 93 17 110 42 8 50 12 4 16
7 Surpur
(i) Landless 5 5 2 2 2 2
(ii) SF 42 8 50 25 5 30 8 2 10
(iii) MF 58 12 70 14 4 18
(iv) LF 15 15
Total 4 2 1 7 24 9 140 39 11 50 8 4 12
8 Maniyor
(i) Landless 7 7 5 5 4 4
(ii) SF 66 10 76 42 5 47 15 3 18
(iii) MF 54 5 59 32 2 34 0
(iv) LF 35 5 40 12 1 13 0
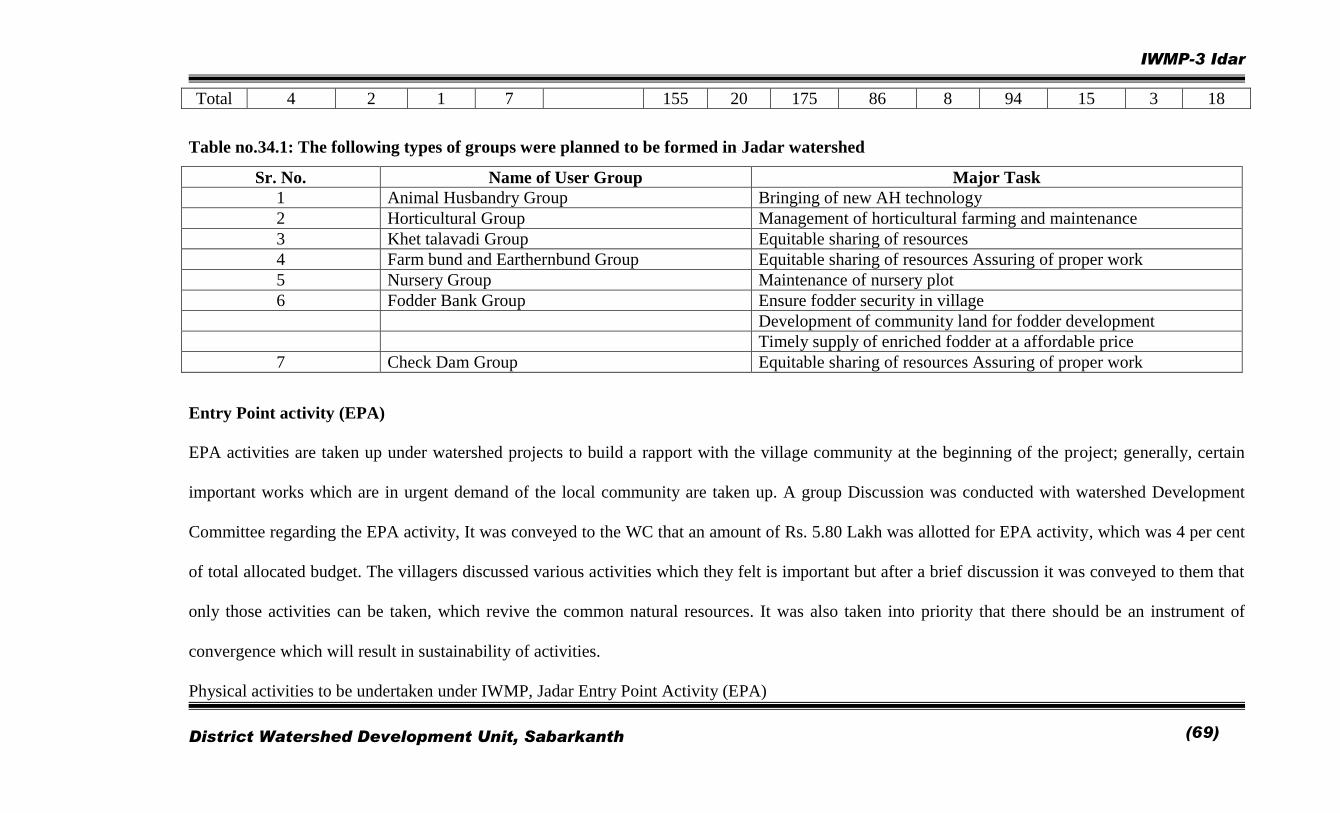
IWMP-3 Idar
District Watershed Development Unit, Sabarkanth
(69)
Total 4 2 1 7 155 20 175 86 8 94 15 3 18
Table no.34.1: The following types of groups were planned to be formed in Jadar watershed
Sr. No. Name of User Group Major Task
1 Animal Husbandry Group Bringing of new AH technology
2 Horticultural Group Management of horticultural farming and maintenance
3 Khet talavadi Group Equitable sharing of resources
4 Farm bund and Earthernbund Group Equitable sharing of resources Assuring of proper work
5 Nursery Group Maintenance of nursery plot
6 Fodder Bank Group Ensure fodder security in village
Development of community land for fodder development
Timely supply of enriched fodder at a affordable price
7 Check Dam Group Equitable sharing of resources Assuring of proper work
Entry Point activity (EPA)
EPA activities are taken up under watershed projects to build a rapport with the village community at the beginning of the project; generally, certain
important works which are in urgent demand of the local community are taken up. A group Discussion was conducted with watershed Development
Committee regarding the EPA activity, It was conveyed to the WC that an amount of Rs. 5.80 Lakh was allotted for EPA activity, which was 4 per cent
of total allocated budget. The villagers discussed various activities which they felt is important but after a brief discussion it was conveyed to them that
only those activities can be taken, which revive the common natural resources. It was also taken into priority that there should be an instrument of
convergence which will result in sustainability of activities.
Physical activities to be undertaken under IWMP, Jadar Entry Point Activity (EPA)

IWMP-3 Idar
District Watershed Development Unit, Sabarkanth
(70)
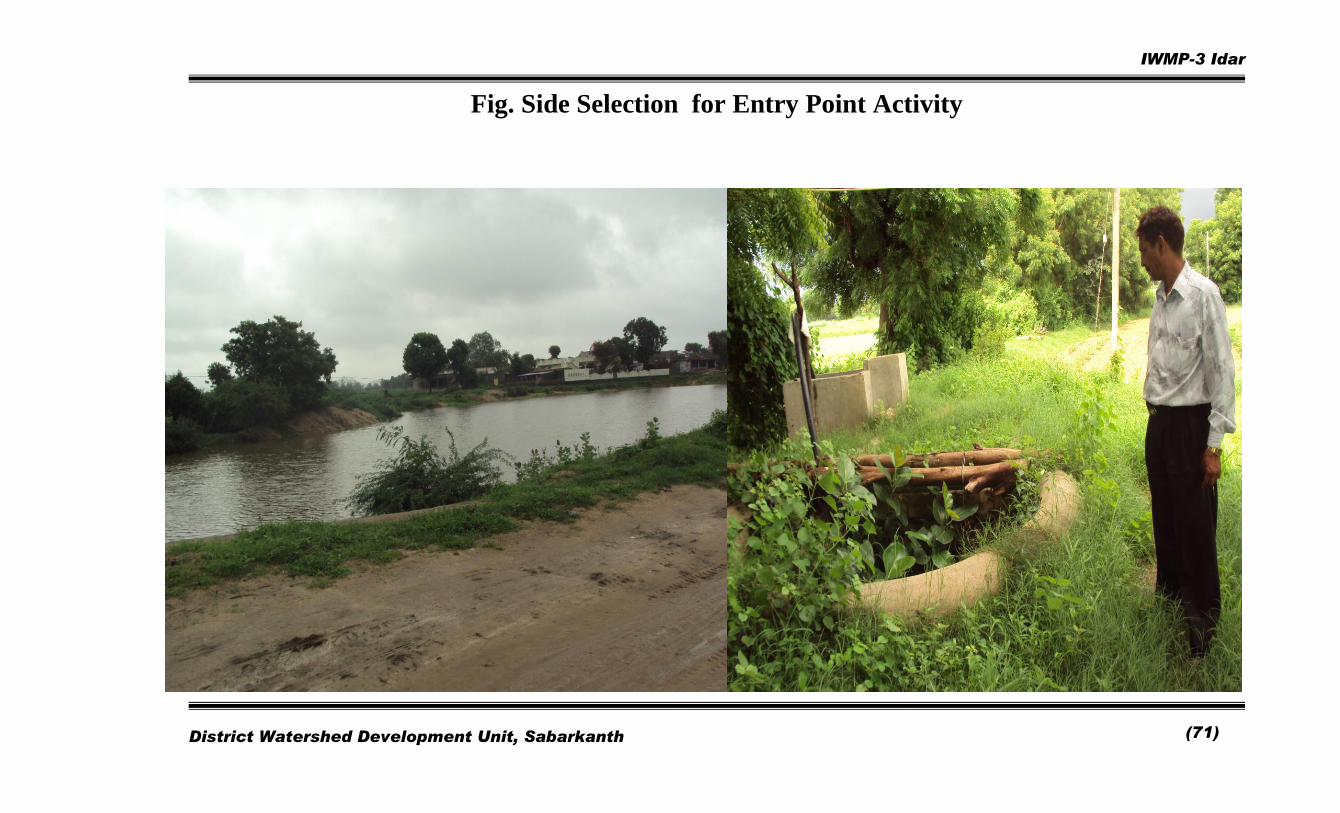
IWMP-3 Idar
District Watershed Development Unit, Sabarkanth
(71)
Fig. Side Selection for Entry Point Activity
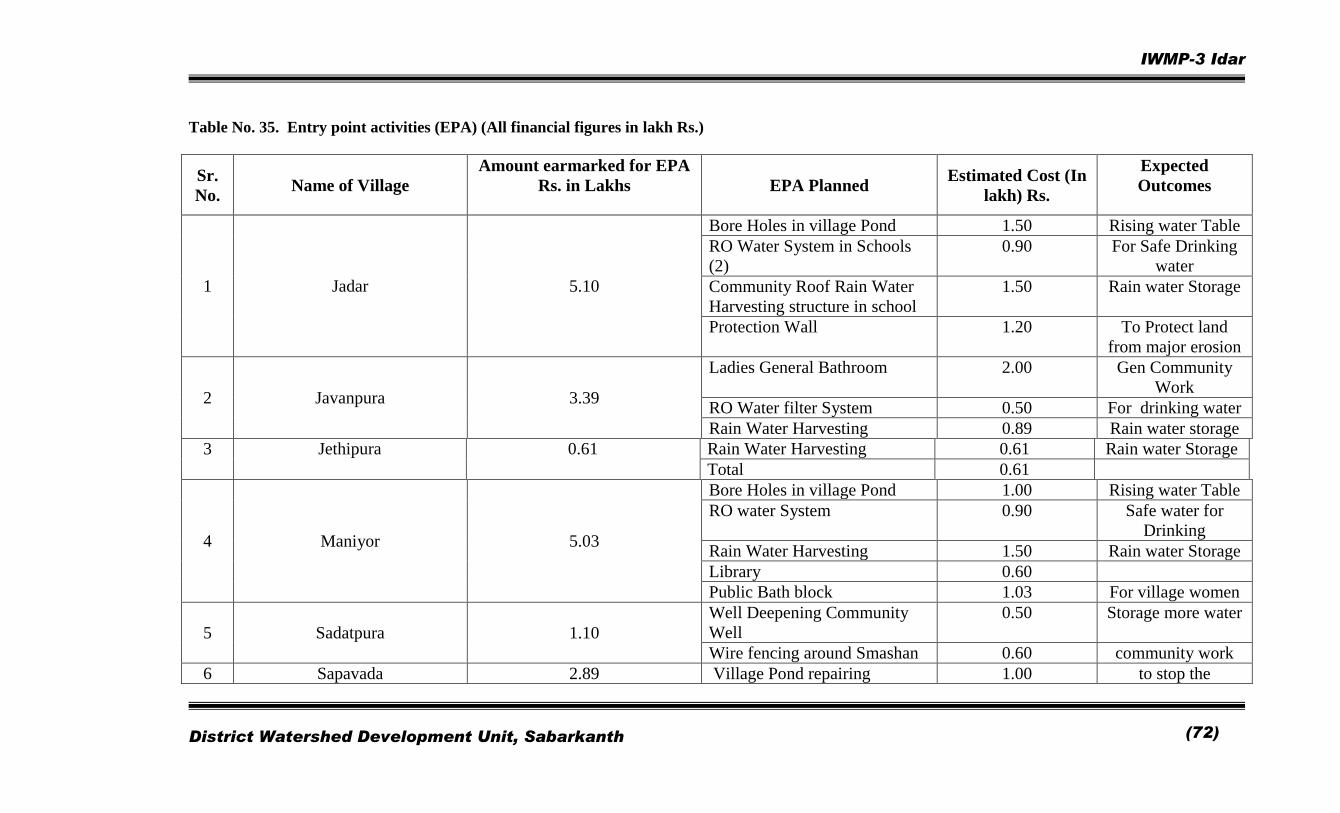
IWMP-3 Idar
District Watershed Development Unit, Sabarkanth
(72)
Table No. 35. Entry point activities (EPA) (All financial figures in lakh Rs.)
Sr.
No. Name of Village
Amount earmarked for EPA
Rs. in Lakhs
EPA Planned Estimated Cost (In
lakh) Rs.
Expected
Outcomes
1 Jadar 5.10
Bore Holes in village Pond 1.50 Rising water Table
RO Water System in Schools
(2)
0.90 For Safe Drinking
water
Community Roof Rain Water
Harvesting structure in school
1.50 Rain water Storage
Protection Wall 1.20 To Protect land
from major erosion
2 Javanpura 3.39
Ladies General Bathroom 2.00 Gen Community
Work
RO Water filter System 0.50 For drinking water
Rain Water Harvesting 0.89 Rain water storage
3 Jethipura 0.61 Rain Water Harvesting 0.61 Rain water Storage
Total 0.61
4 Maniyor 5.03
Bore Holes in village Pond 1.00 Rising water Table
RO water System 0.90 Safe water for
Drinking
Rain Water Harvesting 1.50 Rain water Storage
Library 0.60
Public Bath block 1.03 For village women
5 Sadatpura 1.10
Well Deepening Community
Well
0.50 Storage more water
Wire fencing around Smashan 0.60 community work
6 Sapavada 2.89 Village Pond repairing 1.00 to stop the
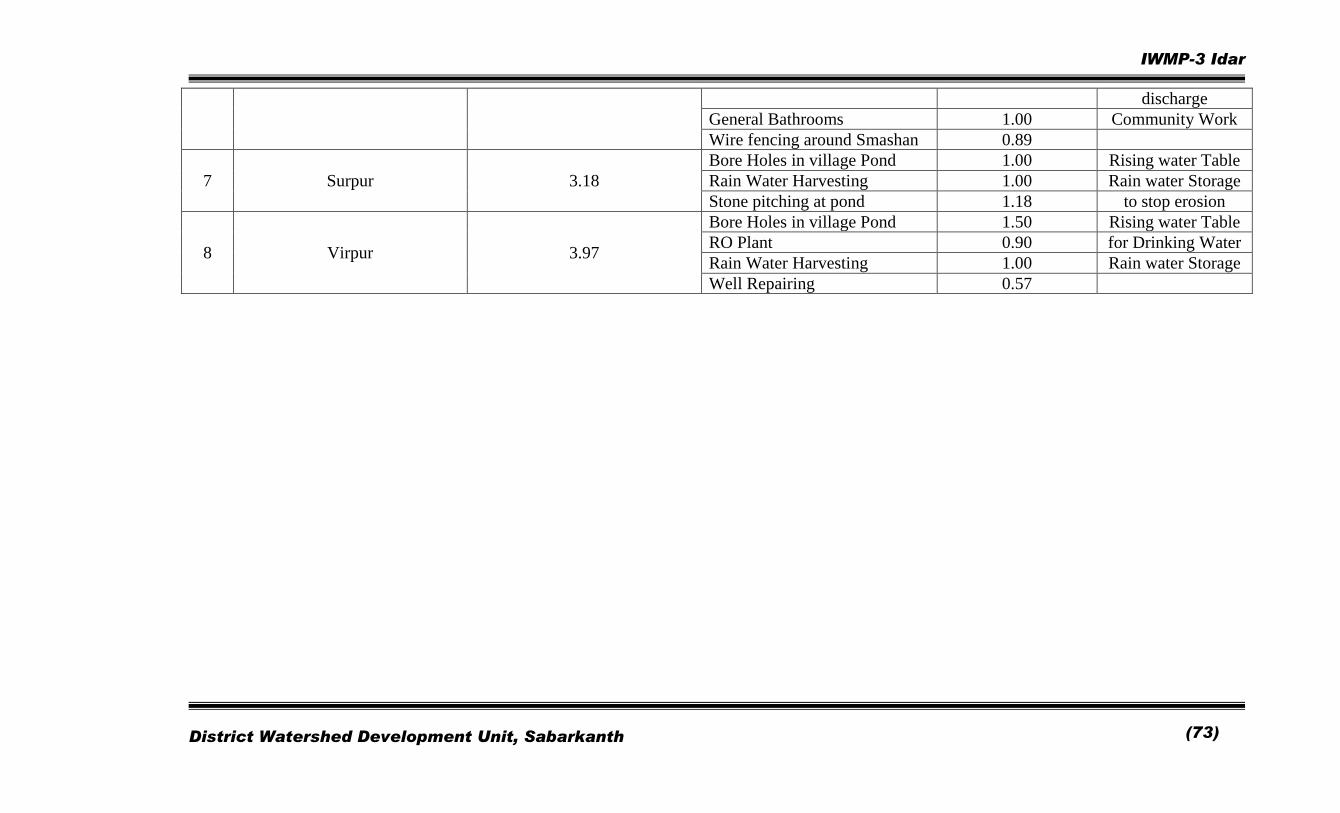
IWMP-3 Idar
District Watershed Development Unit, Sabarkanth
(73)
discharge
General Bathrooms 1.00 Community Work
Wire fencing around Smashan 0.89
7 Surpur 3.18
Bore Holes in village Pond 1.00 Rising water Table
Rain Water Harvesting 1.00 Rain water Storage
Stone pitching at pond 1.18 to stop erosion
8 Virpur 3.97
Bore Holes in village Pond 1.50 Rising water Table
RO Plant 0.90 for Drinking Water
Rain Water Harvesting 1.00 Rain water Storage
Well Repairing 0.57
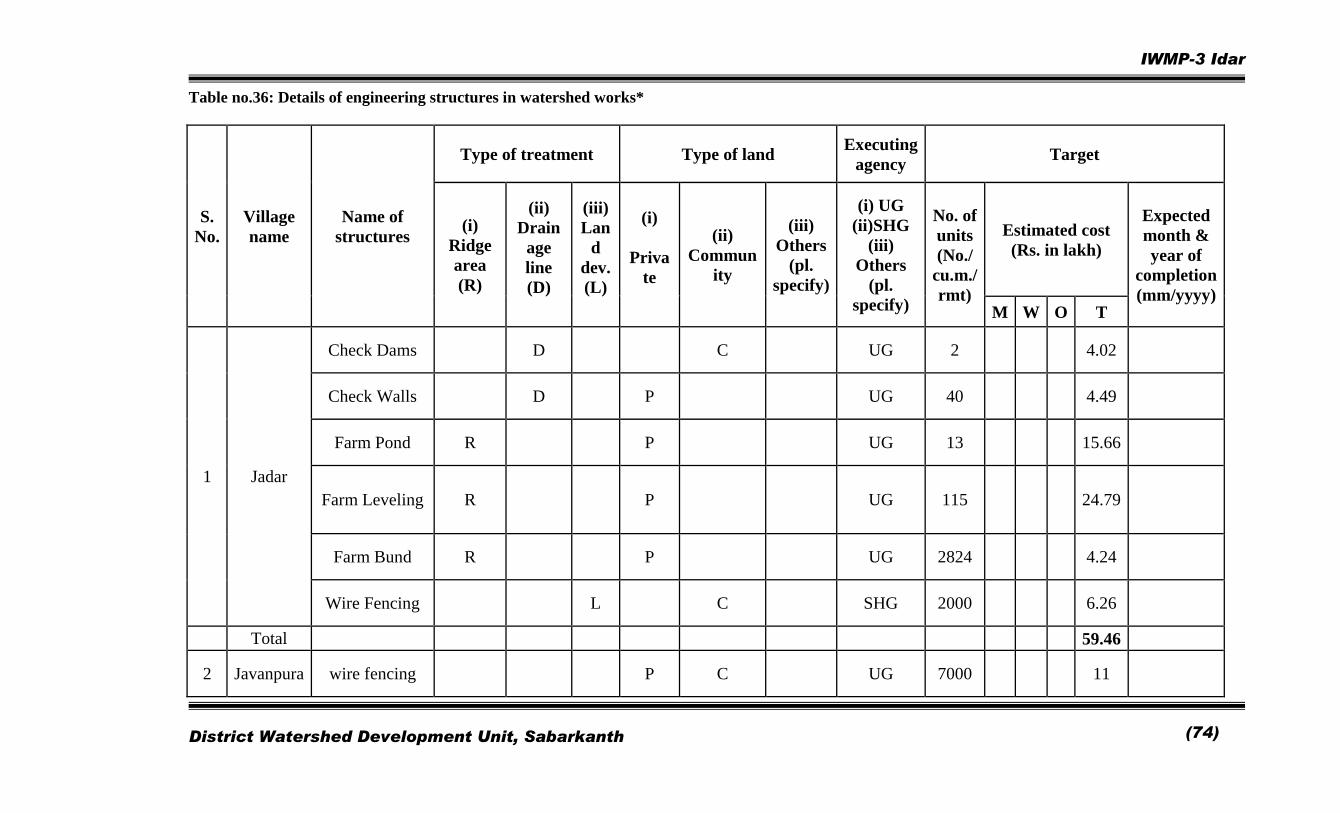
IWMP-3 Idar
District Watershed Development Unit, Sabarkanth
(74)
Table no.36: Details of engineering structures in watershed works*
S.
No.
Village
name
Name of
structures
Type of treatment Type of land Executing
agency Target
(i)
Ridge
area
(R)
(ii)
Drain
age
line
(D)
(iii)
Lan
d
dev.
(L)
(i)
Priva
te
(ii)
Commun
ity
(iii)
Others
(pl.
specify)
(i) UG
(ii)SHG
(iii)
Others
(pl.
specify)
No. of
units
(No./
cu.m./
rmt)
Estimated cost
(Rs. in lakh)
Expected
month &
year of
completion
(mm/yyyy) M W O T
1 Jadar
Check Dams D C UG 2 4.02
Check Walls D P UG 40 4.49
Farm Pond R P UG 13 15.66
Farm Leveling R P UG 115 24.79
Farm Bund R P UG 2824 4.24
Wire Fencing L C SHG 2000 6.26
Total 59.46
2 Javanpura wire fencing P C UG 7000 11
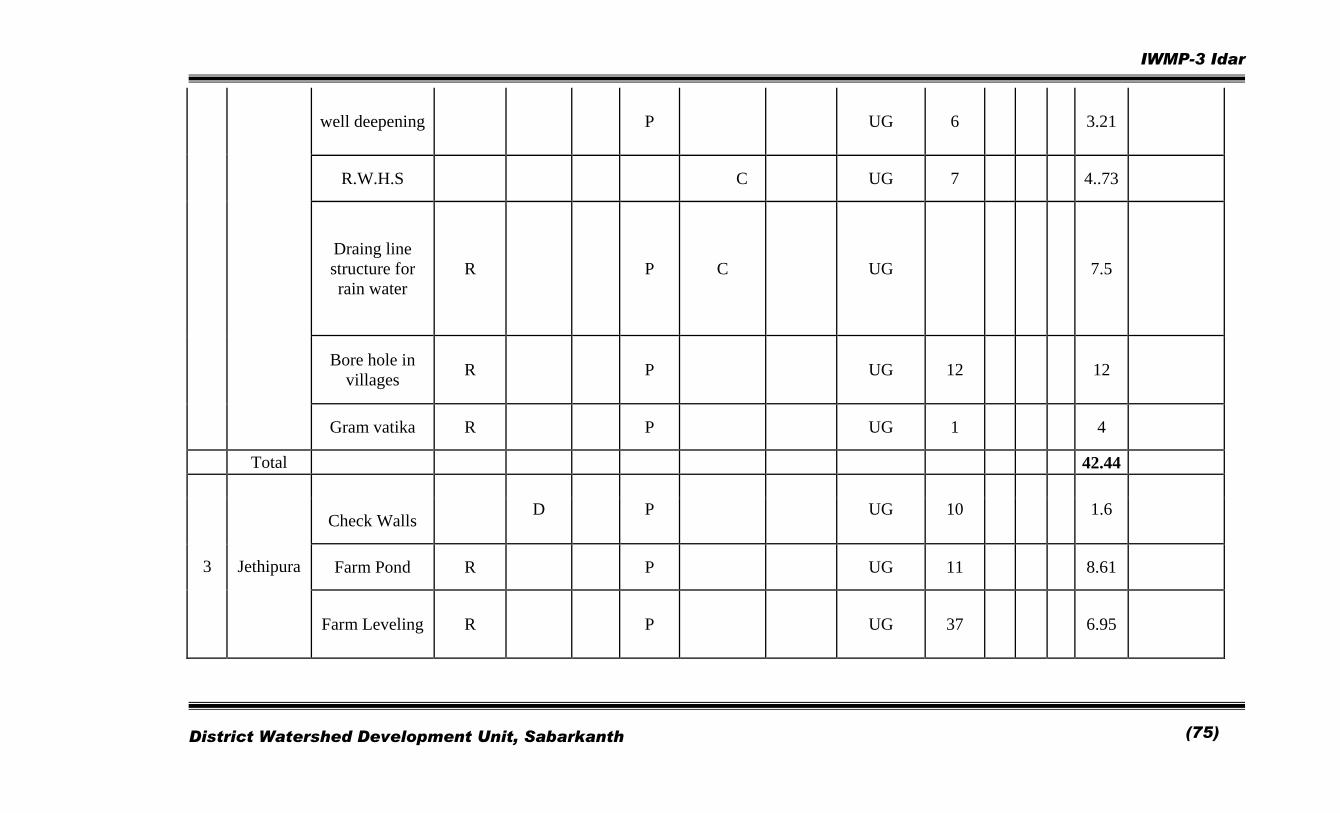
IWMP-3 Idar
District Watershed Development Unit, Sabarkanth
(75)
well deepening P UG 6 3.21
R.W.H.S C UG 7 4..73
Draing line
structure for
rain water
R P C UG 7.5
Bore hole in
villages R P UG 12 12
Gram vatika R P UG 1 4
Total 42.44
3 Jethipura
D P UG 10 1.6 Check Walls
Farm Pond R P UG 11 8.61
Farm Leveling R P UG 37 6.95
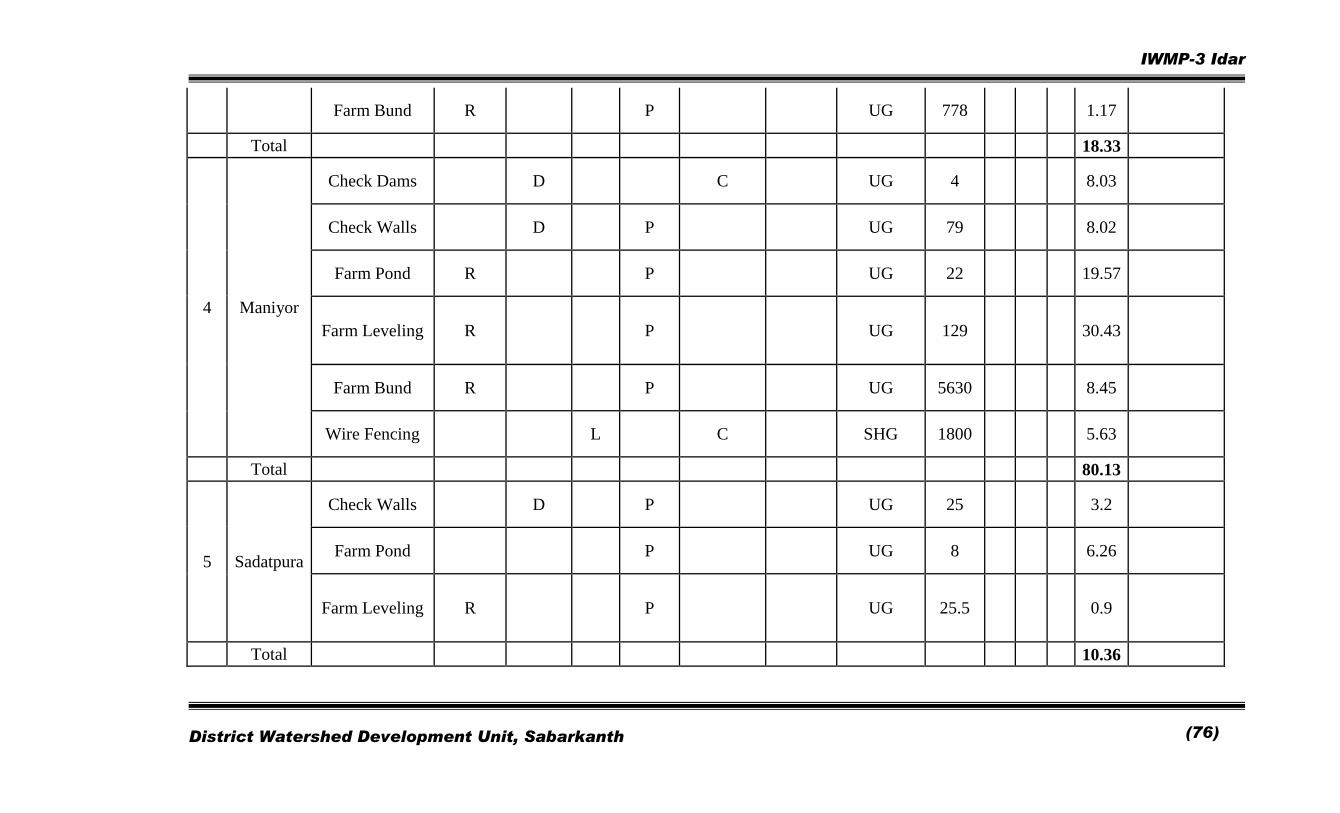
IWMP-3 Idar
District Watershed Development Unit, Sabarkanth
(76)
Farm Bund R P UG 778 1.17
Total 18.33
4 Maniyor
Check Dams D C UG 4 8.03
Check Walls D P UG 79 8.02
Farm Pond R P UG 22 19.57
Farm Leveling R P UG 129 30.43
Farm Bund R P UG 5630 8.45
Wire Fencing L C SHG 1800 5.63
Total 80.13
5 Sadatpura
Check Walls D P UG 25 3.2
Farm Pond P UG 8 6.26
Farm Leveling R P UG 25.5 0.9
Total 10.36
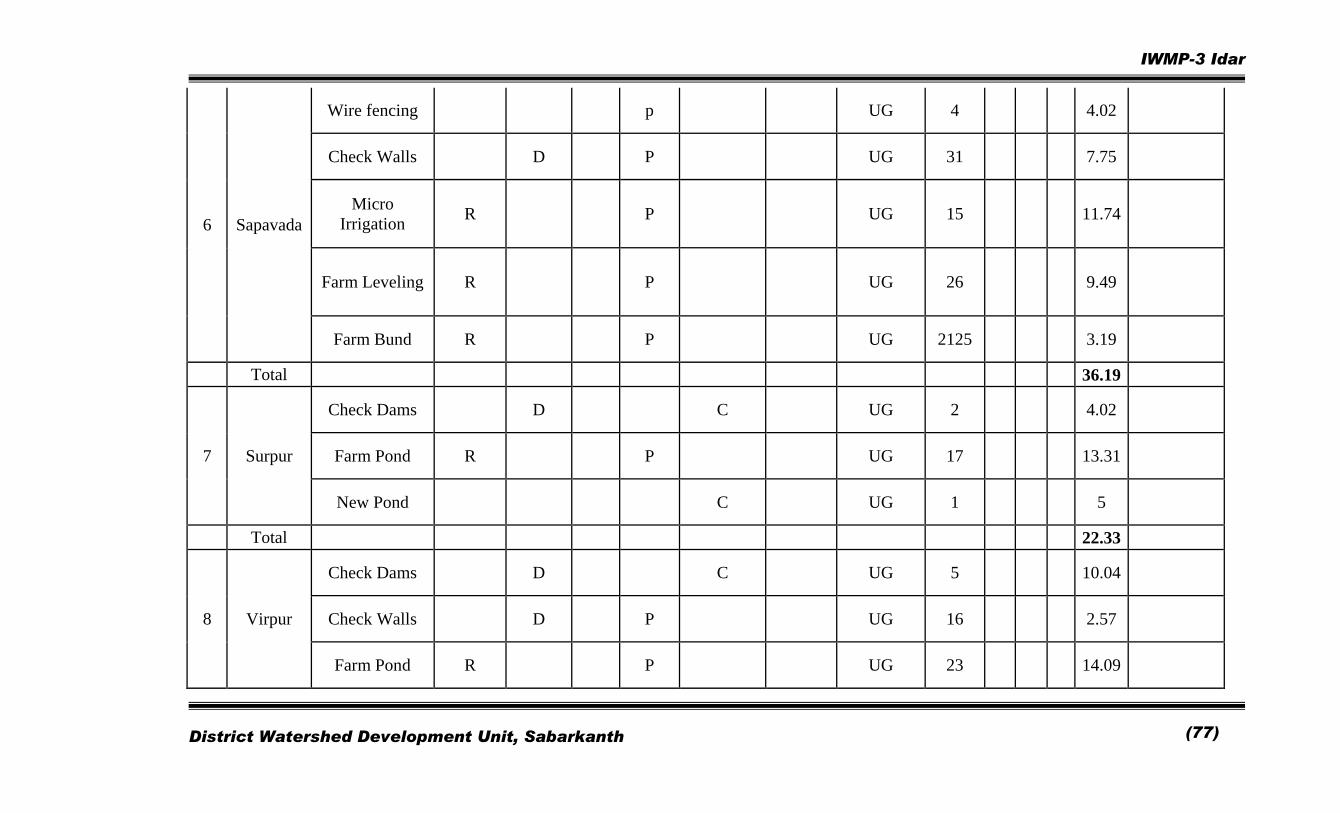
IWMP-3 Idar
District Watershed Development Unit, Sabarkanth
(77)
6 Sapavada
Wire fencing p UG 4 4.02
Check Walls D P UG 31 7.75
Micro
Irrigation R P UG 15 11.74
Farm Leveling R P UG 26 9.49
Farm Bund R P UG 2125 3.19
Total 36.19
7 Surpur
Check Dams D C UG 2 4.02
Farm Pond R P UG 17 13.31
New Pond C UG 1 5
Total 22.33
8 Virpur
Check Dams D C UG 5 10.04
Check Walls D P UG 16 2.57
Farm Pond R P UG 23 14.09
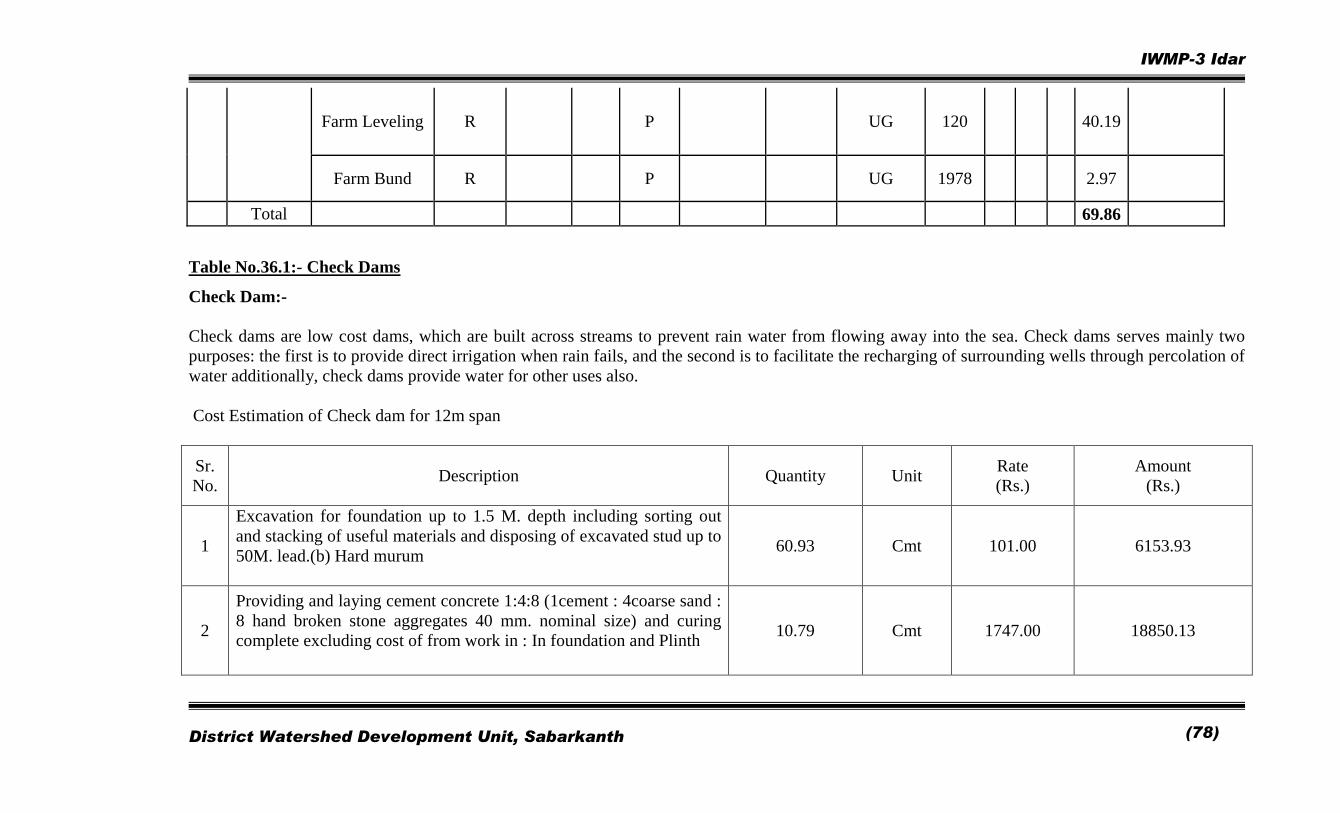
IWMP-3 Idar
District Watershed Development Unit, Sabarkanth
(78)
Farm Leveling R P UG 120 40.19
Farm Bund R P UG 1978 2.97
Total 69.86
Table No.36.1:- Check Dams
Check Dam:-
Check dams are low cost dams, which are built across streams to prevent rain water from flowing away into the sea. Check dams serves mainly two
purposes: the first is to provide direct irrigation when rain fails, and the second is to facilitate the recharging of surrounding wells through percolation of
water additionally, check dams provide water for other uses also.
Cost Estimation of Check dam for 12m span
Sr.
No. Description Quantity Unit
Rate
(Rs.)
Amount
(Rs.)
1
Excavation for foundation up to 1.5 M. depth including sorting out
and stacking of useful materials and disposing of excavated stud up to
50M. lead.(b) Hard murum
60.93 Cmt 101.00 6153.93
2
Providing and laying cement concrete 1:4:8 (1cement : 4coarse sand :
8 hand broken stone aggregates 40 mm. nominal size) and curing
complete excluding cost of from work in : In foundation and Plinth
10.79 Cmt 1747.00 18850.13
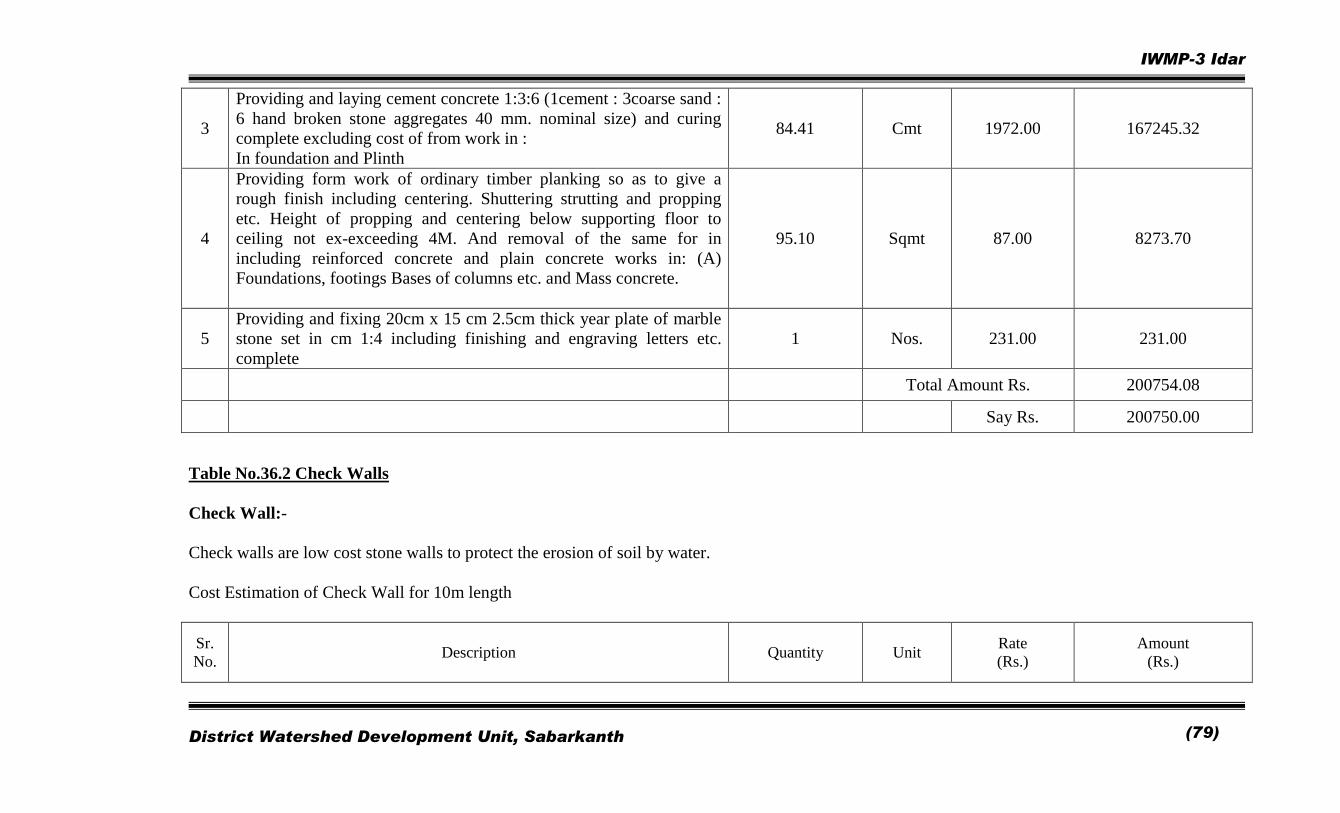
IWMP-3 Idar
District Watershed Development Unit, Sabarkanth
(79)
3
Providing and laying cement concrete 1:3:6 (1cement : 3coarse sand :
6 hand broken stone aggregates 40 mm. nominal size) and curing
complete excluding cost of from work in :
In foundation and Plinth
84.41 Cmt 1972.00 167245.32
4
Providing form work of ordinary timber planking so as to give a
rough finish including centering. Shuttering strutting and propping
etc. Height of propping and centering below supporting floor to
ceiling not ex-exceeding 4M. And removal of the same for in
including reinforced concrete and plain concrete works in: (A)
Foundations, footings Bases of columns etc. and Mass concrete.
95.10 Sqmt 87.00 8273.70
5
Providing and fixing 20cm x 15 cm 2.5cm thick year plate of marble
stone set in cm 1:4 including finishing and engraving letters etc.
complete
1 Nos. 231.00 231.00
Total Amount Rs. 200754.08
Say Rs. 200750.00
Table No.36.2 Check Walls
Check Wall:-
Check walls are low cost stone walls to protect the erosion of soil by water.
Cost Estimation of Check Wall for 10m length
Sr.
No. Description Quantity Unit
Rate
(Rs.)
Amount
(Rs.)
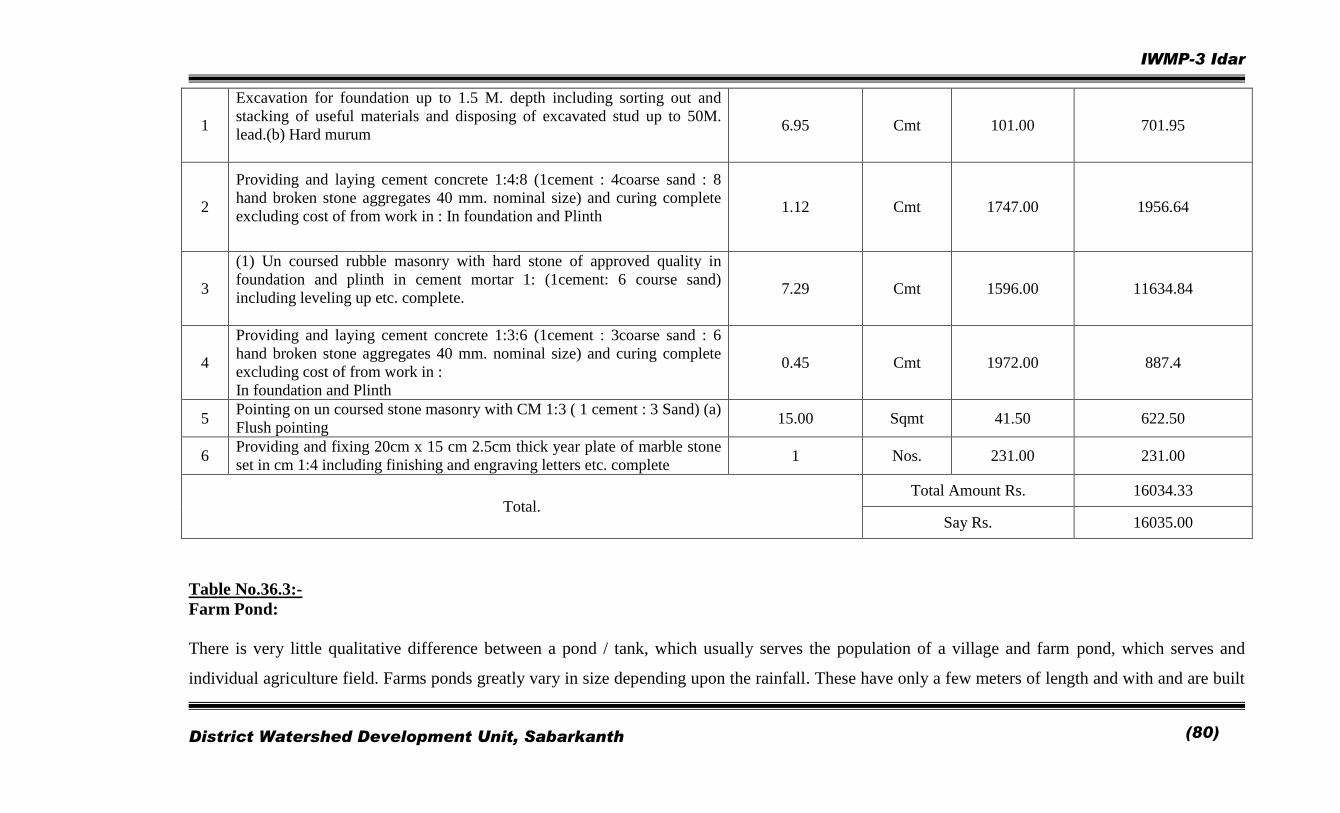
IWMP-3 Idar
District Watershed Development Unit, Sabarkanth
(80)
1
Excavation for foundation up to 1.5 M. depth including sorting out and
stacking of useful materials and disposing of excavated stud up to 50M.
lead.(b) Hard murum
6.95 Cmt 101.00 701.95
2
Providing and laying cement concrete 1:4:8 (1cement : 4coarse sand : 8
hand broken stone aggregates 40 mm. nominal size) and curing complete
excluding cost of from work in : In foundation and Plinth
1.12 Cmt 1747.00 1956.64
3
(1) Un coursed rubble masonry with hard stone of approved quality in
foundation and plinth in cement mortar 1: (1cement: 6 course sand)
including leveling up etc. complete.
7.29 Cmt 1596.00 11634.84
4
Providing and laying cement concrete 1:3:6 (1cement : 3coarse sand : 6
hand broken stone aggregates 40 mm. nominal size) and curing complete
excluding cost of from work in :
In foundation and Plinth
0.45 Cmt 1972.00 887.4
5 Pointing on un coursed stone masonry with CM 1:3 ( 1 cement : 3 Sand) (a)
Flush pointing 15.00 Sqmt 41.50 622.50
6 Providing and fixing 20cm x 15 cm 2.5cm thick year plate of marble stone
set in cm 1:4 including finishing and engraving letters etc. complete 1 Nos. 231.00 231.00
Total. Total Amount Rs. 16034.33
Say Rs. 16035.00
Table No.36.3:-
Farm Pond:
There is very little qualitative difference between a pond / tank, which usually serves the population of a village and farm pond, which serves and
individual agriculture field. Farms ponds greatly vary in size depending upon the rainfall. These have only a few meters of length and with and are built
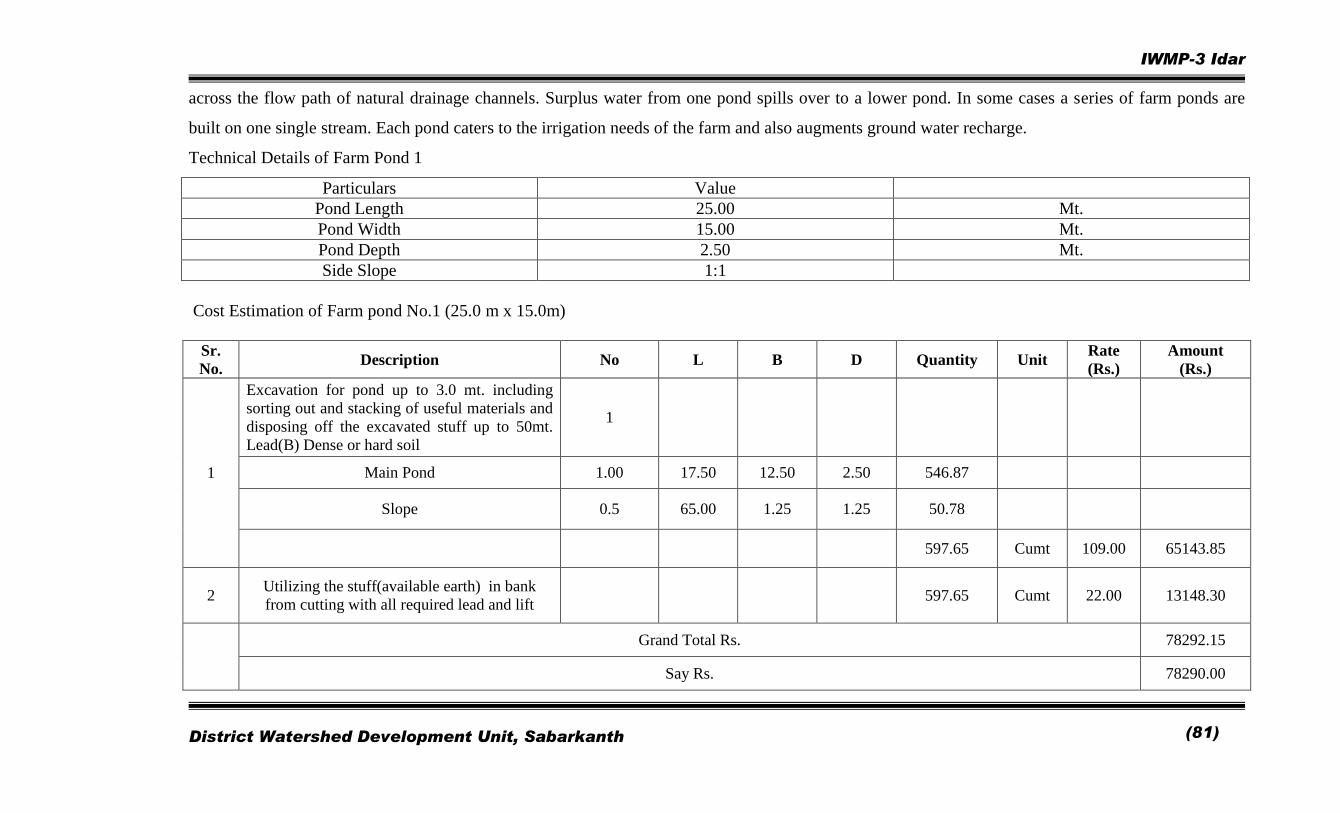
IWMP-3 Idar
District Watershed Development Unit, Sabarkanth
(81)
across the flow path of natural drainage channels. Surplus water from one pond spills over to a lower pond. In some cases a series of farm ponds are
built on one single stream. Each pond caters to the irrigation needs of the farm and also augments ground water recharge.
Technical Details of Farm Pond 1
Particulars Value
Pond Length 25.00 Mt.
Pond Width 15.00 Mt.
Pond Depth 2.50 Mt.
Side Slope 1:1
Cost Estimation of Farm pond No.1 (25.0 m x 15.0m)
Sr.
No. Description No L B D Quantity Unit
Rate
(Rs.)
Amount
(Rs.)
1
Excavation for pond up to 3.0 mt. including
sorting out and stacking of useful materials and
disposing off the excavated stuff up to 50mt.
Lead(B) Dense or hard soil
1
Main Pond 1.00 17.50 12.50 2.50 546.87
Slope 0.5 65.00 1.25 1.25 50.78
597.65 Cumt 109.00 65143.85
2 Utilizing the stuff(available earth) in bank
from cutting with all required lead and lift 597.65 Cumt 22.00 13148.30
Grand Total Rs. 78292.15
Say Rs. 78290.00
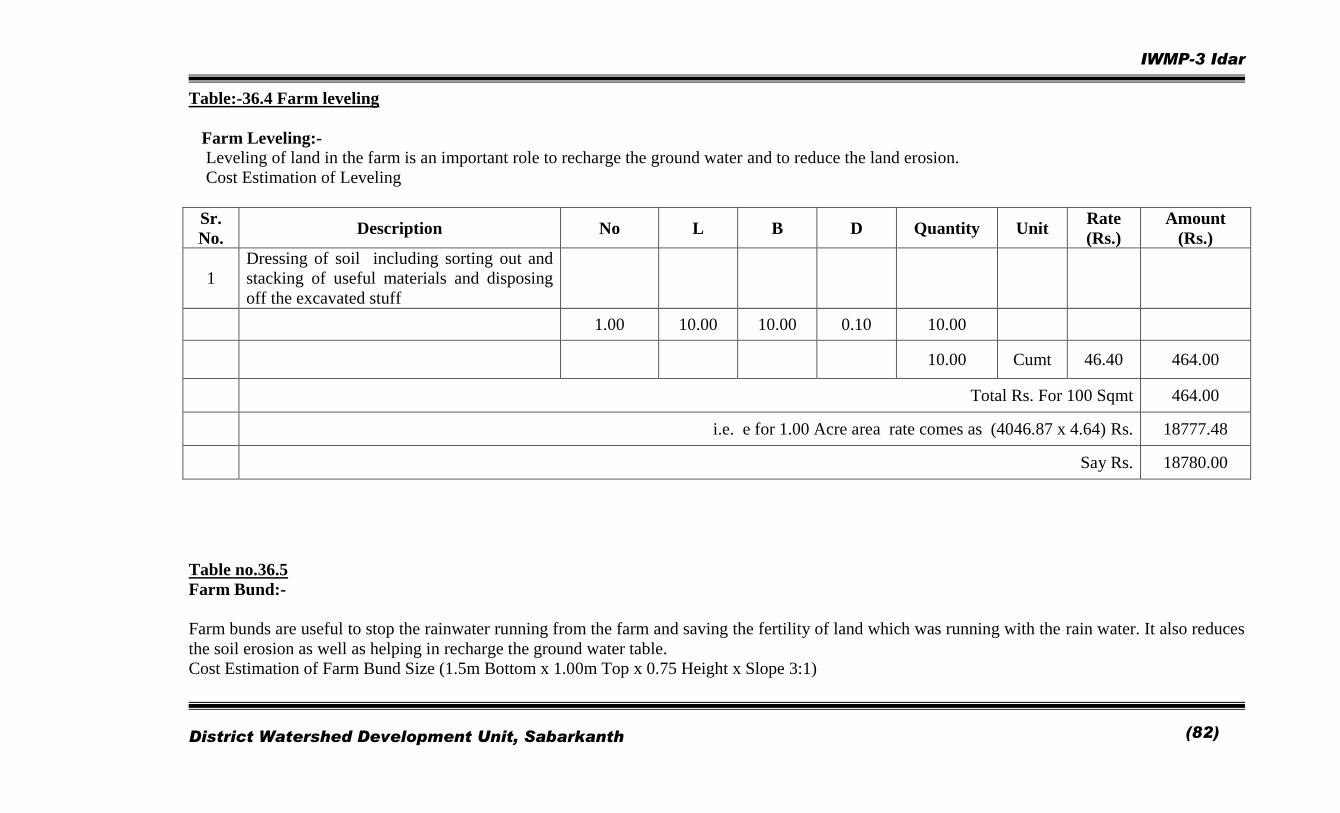
IWMP-3 Idar
District Watershed Development Unit, Sabarkanth
(82)
Table:-36.4 Farm leveling
Farm Leveling:-
Leveling of land in the farm is an important role to recharge the ground water and to reduce the land erosion.
Cost Estimation of Leveling
Sr.
No. Description No L B D Quantity Unit
Rate
(Rs.)
Amount
(Rs.)
1
Dressing of soil including sorting out and
stacking of useful materials and disposing
off the excavated stuff
1.00 10.00 10.00 0.10 10.00
10.00 Cumt 46.40 464.00
Total Rs. For 100 Sqmt 464.00
i.e. e for 1.00 Acre area rate comes as (4046.87 x 4.64) Rs. 18777.48
Say Rs. 18780.00
Table no.36.5
Farm Bund:-
Farm bunds are useful to stop the rainwater running from the farm and saving the fertility of land which was running with the rain water. It also reduces
the soil erosion as well as helping in recharge the ground water table.
Cost Estimation of Farm Bund Size (1.5m Bottom x 1.00m Top x 0.75 Height x Slope 3:1)

IWMP-3 Idar
District Watershed Development Unit, Sabarkanth
(83)
Sr.
No. Description No L B D Quantity Unit
Rate
(Rs.)
Amount
(Rs.)
1 Earthwork for bund including making the
proper slope etc complete with all lead and lift
For 50m length 1 50.00 1.00 1.00 50.00
Side slopes 2 x 0.5 50.00 0.25 0.75 9.38
59.38 Cumt 126.00 7481.88
Total Rs. For 50.00 Rmt 7481.88
i.e. for 1.00 Rmt rate comes as (7481.88 / 50.00) Rs. 149.64
Say Rs. 150.00
Table no.36.6
Wire Fencing:-
To protect the fodder and afforastaion from demolition by animals in gauchar land the periphery of the land covered with the wire fencing .
Cost Estimation of Wire Fencing
Sr no Item Rate Per
1
Providing and fixing 1.20 meter high fencing with 2.0 meter
ling M.S. Angle posts 40 mm. X 40 mm. X 6 mm. And oil
painting 3 coats fixed at 2.5 mt. C/c with five horizontal lines
and two diagonals of galvanized steel barbed wire weighing
9.38 Kg. Per 100 meter, strained and fixed to posts with G.I.
staples, including fixing posts in ground with 0.5m x 0.5m
block in C.C.1:5:10 etc. complete.
313 /- Rmt.
Rate as per Govt. SOR R & B Page No.85 Item
no. 1.22.20
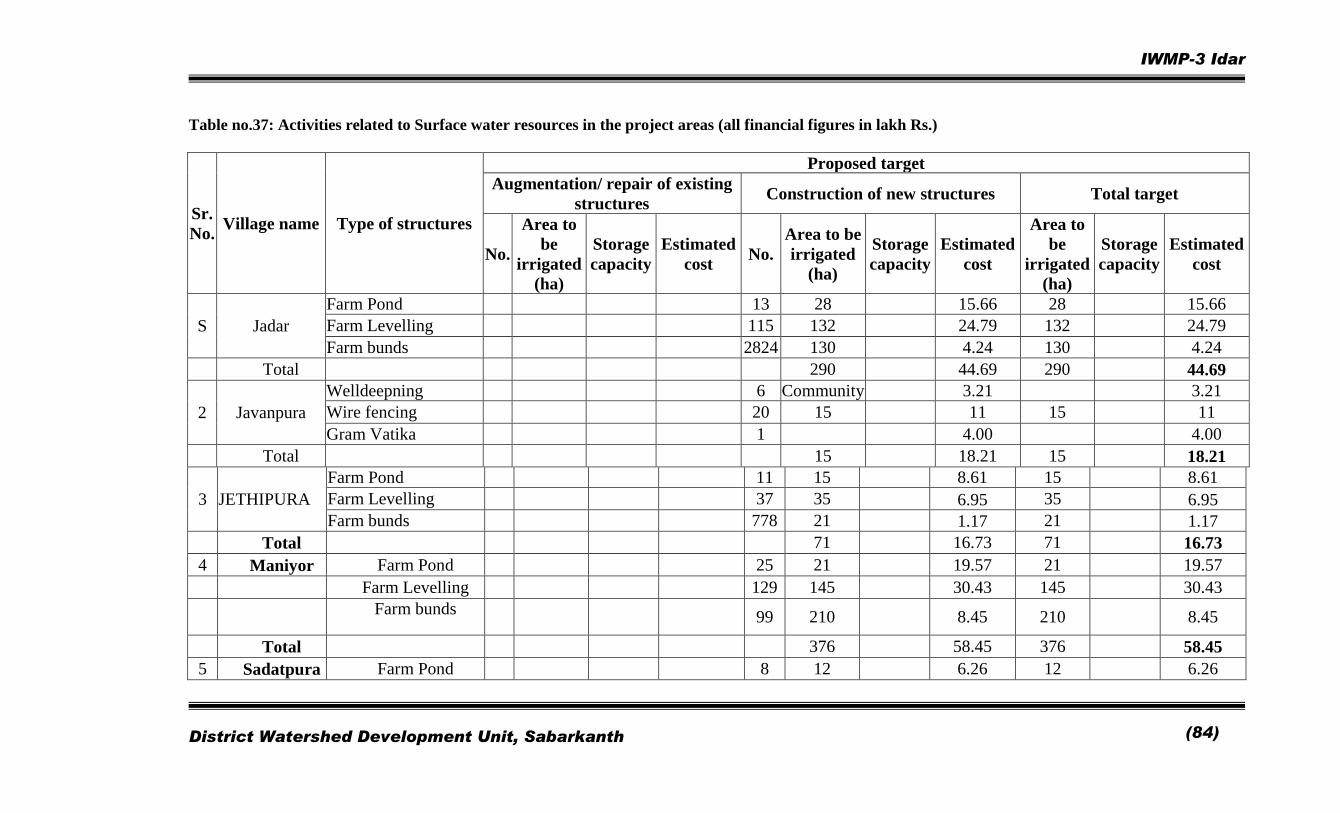
IWMP-3 Idar
District Watershed Development Unit, Sabarkanth
(84)
Table no.37: Activities related to Surface water resources in the project areas (all financial figures in lakh Rs.)
Sr.
No. Village name Type of structures
Proposed target
Augmentation/ repair of existing
structures Construction of new structures Total target
No.
Area to
be
irrigated
(ha)
Storage
capacity
Estimated
cost No.
Area to be
irrigated
(ha)
Storage
capacity
Estimated
cost
Area to
be
irrigated
(ha)
Storage
capacity
Estimated
cost
S Jadar
Farm Pond 13 28 15.66 28 15.66
Farm Levelling 115 132 24.79 132 24.79
Farm bunds 2824 130 4.24 130 4.24
Total 290 44.69 290 44.69
2 Javanpura
Welldeepning 6 Community 3.21 3.21
Wire fencing 20 15 11 15 11
Gram Vatika 1 4.00 4.00
Total 15 18.21 15 18.21
3 JETHIPURA
Farm Pond 11 15 8.61 15 8.61
Farm Levelling 37 35 6.95 35 6.95
Farm bunds 778 21 1.17 21 1.17
Total 71 16.73 71 16.73
4 Maniyor Farm Pond 25 21 19.57 21 19.57
Farm Levelling 129 145 30.43 145 30.43
Farm bunds 99 210 8.45 210 8.45
Total 376 58.45 376 58.45
5 Sadatpura Farm Pond 8 12 6.26 12 6.26
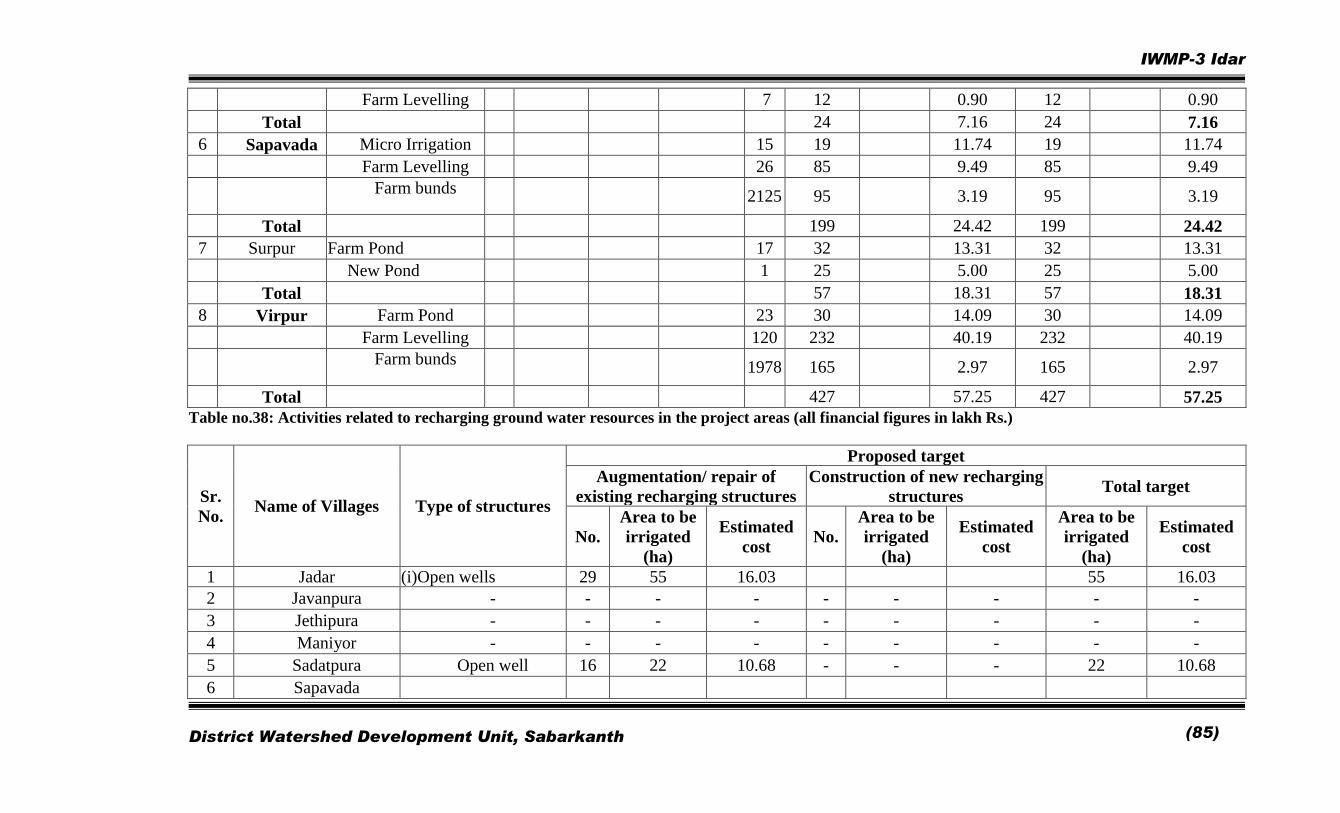
IWMP-3 Idar
District Watershed Development Unit, Sabarkanth
(85)
Farm Levelling 7 12 0.90 12 0.90
Total 24 7.16 24 7.16
6 Sapavada Micro Irrigation 15 19 11.74 19 11.74
Farm Levelling 26 85 9.49 85 9.49
Farm bunds 2125 95 3.19 95 3.19
Total 199 24.42 199 24.42
7 Surpur Farm Pond 17 32 13.31 32 13.31
New Pond 1 25 5.00 25 5.00
Total 57 18.31 57 18.31
8 Virpur Farm Pond 23 30 14.09 30 14.09
Farm Levelling 120 232 40.19 232 40.19
Farm bunds 1978 165 2.97 165 2.97
Total 427 57.25 427 57.25
Table no.38: Activities related to recharging ground water resources in the project areas (all financial figures in lakh Rs.)
Sr.
No. Name of Villages Type of structures
Proposed target
Augmentation/ repair of
existing recharging structures
Construction of new recharging
structures Total target
No.
Area to be
irrigated
(ha)
Estimated
cost No.
Area to be
irrigated
(ha)
Estimated
cost
Area to be
irrigated
(ha)
Estimated
cost
1 Jadar (i)Open wells 29 55 16.03 55 16.03
2 Javanpura - - - - - - - - -
3 Jethipura - - - - - - - - -
4 Maniyor - - - - - - - - -
5 Sadatpura Open well 16 22 10.68 - - - 22 10.68
6 Sapavada
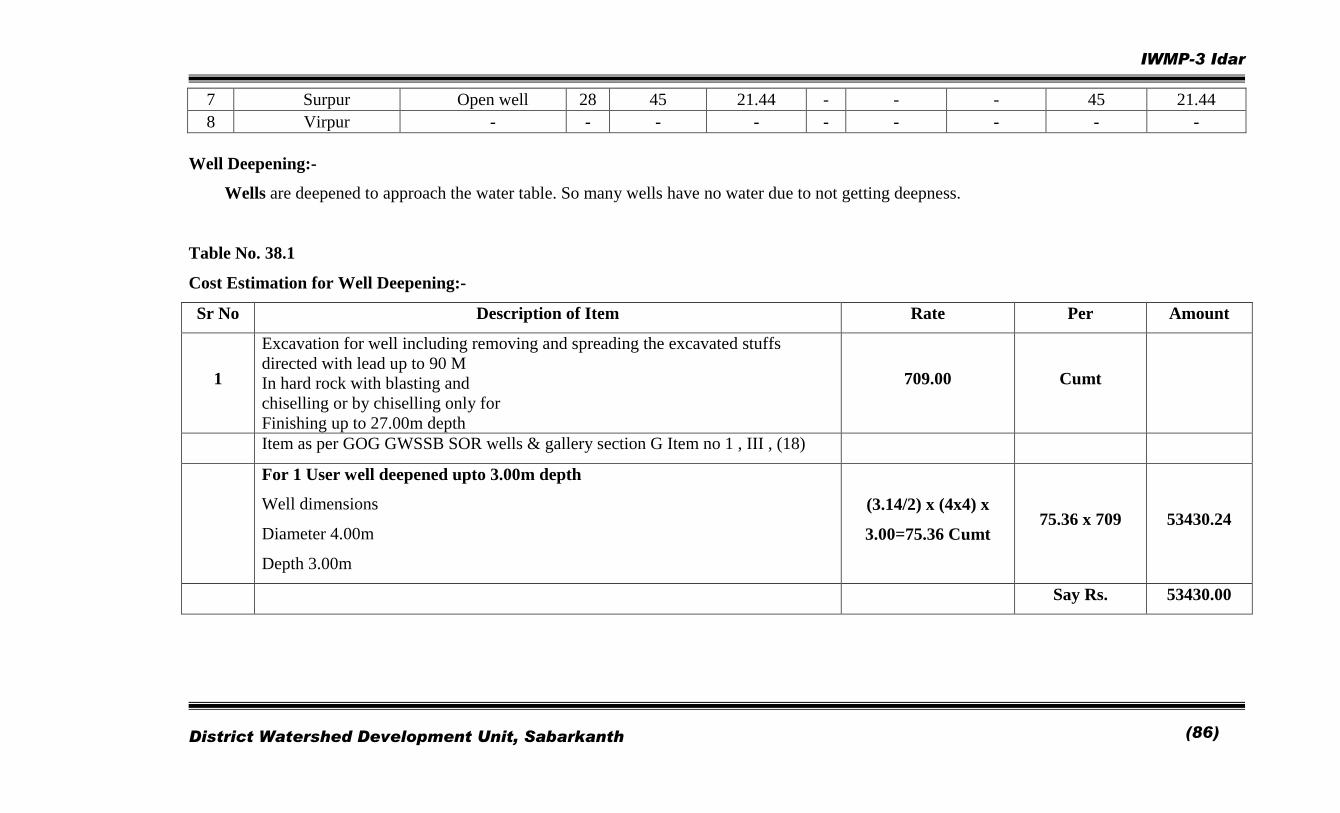
IWMP-3 Idar
District Watershed Development Unit, Sabarkanth
(86)
7 Surpur Open well 28 45 21.44 - - - 45 21.44
8 Virpur - - - - - - - - -
Well Deepening:-
Wells are deepened to approach the water table. So many wells have no water due to not getting deepness.
Table No. 38.1
Cost Estimation for Well Deepening:-
Sr No Description of Item Rate Per Amount
1
Excavation for well including removing and spreading the excavated stuffs
directed with lead up to 90 M
In hard rock with blasting and
chiselling or by chiselling only for
Finishing up to 27.00m depth
709.00 Cumt
Item as per GOG GWSSB SOR wells & gallery section G Item no 1 , III , (18)
For 1 User well deepened upto 3.00m depth
Well dimensions
Diameter 4.00m
Depth 3.00m
(3.14/2) x (4x4) x
3.00=75.36 Cumt 75.36 x 709 53430.24
Say Rs. 53430.00

IWMP-3 Idar
District Watershed Development Unit, Sabarkanth
(87)
Table no.39: Details of activities related to livelihood, production system and micro-enterprises
Sr.
No Village Activity/ Type of work Activity to be Carried out
Type of land Executing
agency Target
(i)
Private
(ii)
Community
(iii)
Others
(pl.
specify)
(i) UG Estimated
cost
(Rs. Lakh)
Expected
month & year
of completion
(mm/yyyy)
(ii)SHG
(iii) Others
(pl. specify)
1 Jadar
Agriculture productivity
enhancement
Crop demonstration (Cotton
with Drip) WC 2.4
Vegetable Farming
1.91
Low cost Green house
WC 0.7
Kitchen Garden
WC 0.25
Horticultural Plantation
WC 4.42
Vermi compost
SHG 4.72
Nursery raising Teak Nursery Raising
SHG 3
Neem Nursery Raising
SHG 2.4
Animal
Husbandry/dairy
development
Animal Nutrient
WC 2.9
Cattle Camp
WC 1.6
Fodder Bank Development
SHG 5
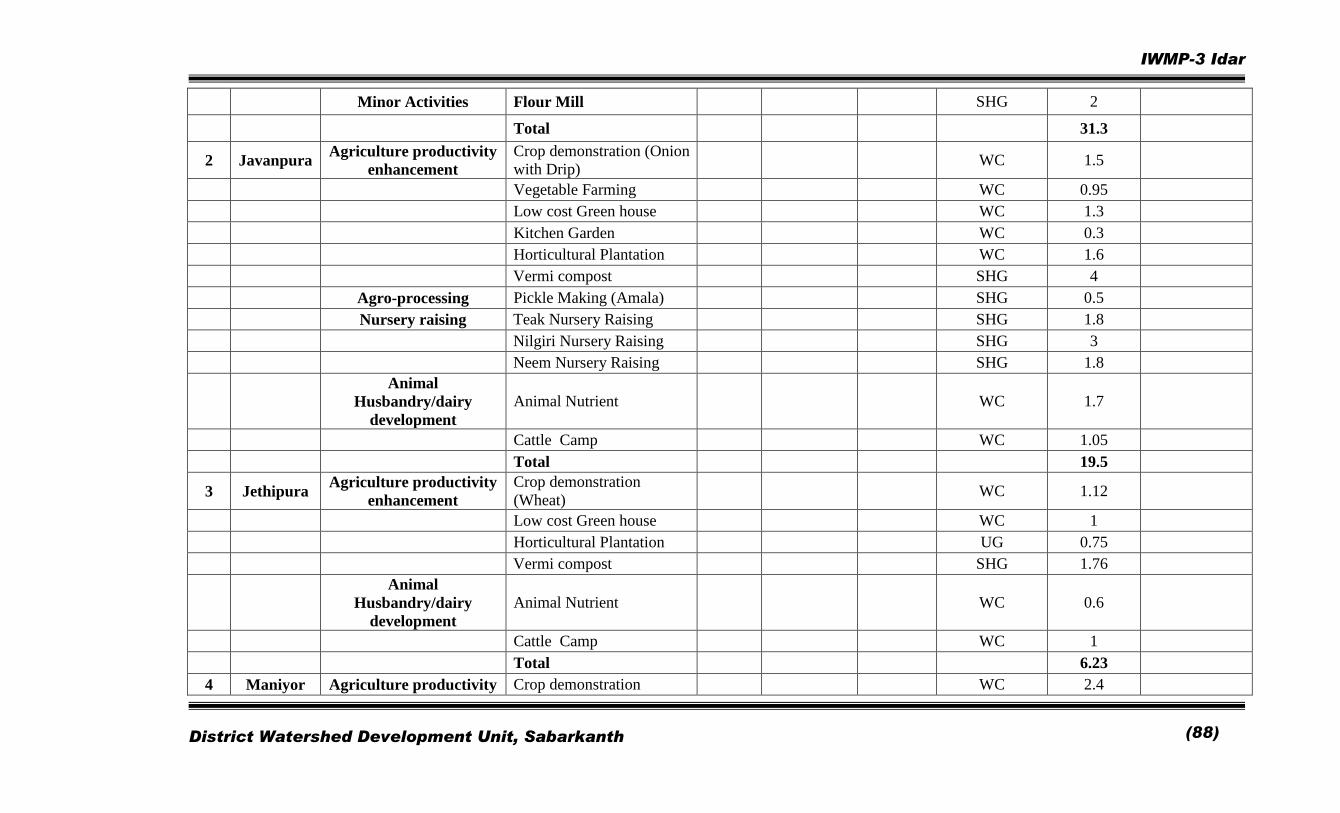
IWMP-3 Idar
District Watershed Development Unit, Sabarkanth
(88)
Minor Activities Flour Mill
SHG 2
Total
31.3
2 Javanpura Agriculture productivity
enhancement
Crop demonstration (Onion
with Drip) WC 1.5
Vegetable Farming
WC 0.95
Low cost Green house
WC 1.3
Kitchen Garden
WC 0.3
Horticultural Plantation
WC 1.6
Vermi compost
SHG 4
Agro-processing Pickle Making (Amala)
SHG 0.5
Nursery raising Teak Nursery Raising
SHG 1.8
Nilgiri Nursery Raising
SHG 3
Neem Nursery Raising
SHG 1.8
Animal
Husbandry/dairy
development
Animal Nutrient
WC 1.7
Cattle Camp
WC 1.05
Total
19.5
3 Jethipura Agriculture productivity
enhancement
Crop demonstration
(Wheat) WC 1.12
Low cost Green house
WC 1
Horticultural Plantation
UG 0.75
Vermi compost
SHG 1.76
Animal
Husbandry/dairy
development
Animal Nutrient
WC 0.6
Cattle Camp
WC 1
Total
6.23
4 Maniyor Agriculture productivity Crop demonstration
WC 2.4
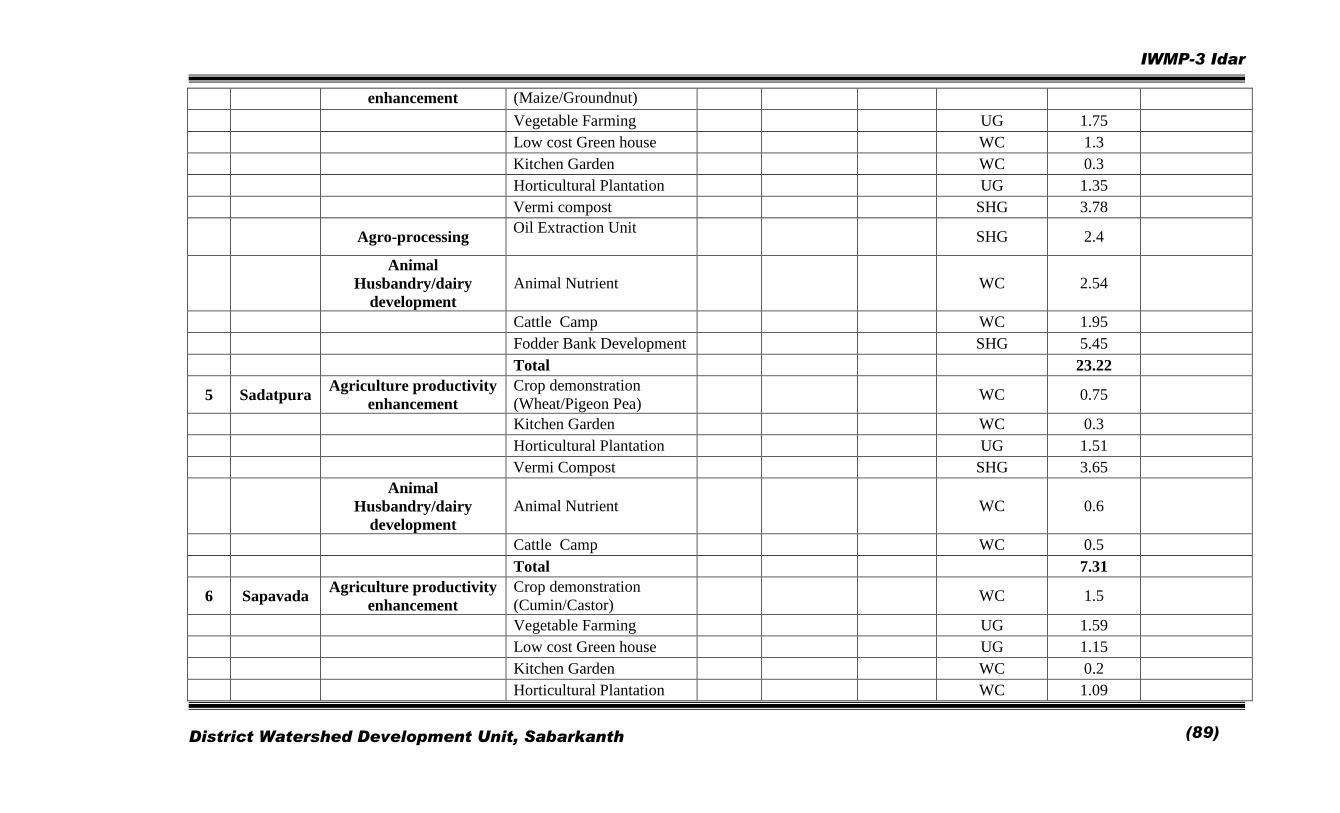
IWMP-3 Idar
District Watershed Development Unit, Sabarkanth
(89)
enhancement (Maize/Groundnut)
Vegetable Farming
UG 1.75
Low cost Green house
WC 1.3
Kitchen Garden
WC 0.3
Horticultural Plantation
UG 1.35
Vermi compost
SHG 3.78
Agro-processing Oil Extraction Unit
SHG 2.4
Animal
Husbandry/dairy
development
Animal Nutrient
WC 2.54
Cattle Camp
WC 1.95
Fodder Bank Development
SHG 5.45
Total
23.22
5 Sadatpura Agriculture productivity
enhancement
Crop demonstration
(Wheat/Pigeon Pea) WC 0.75
Kitchen Garden
WC 0.3
Horticultural Plantation
UG 1.51
Vermi Compost
SHG 3.65
Animal
Husbandry/dairy
development
Animal Nutrient
WC 0.6
Cattle Camp
WC 0.5
Total
7.31
6 Sapavada Agriculture productivity
enhancement
Crop demonstration
(Cumin/Castor) WC 1.5
Vegetable Farming
UG 1.59
Low cost Green house
UG 1.15
Kitchen Garden
WC 0.2
Horticultural Plantation
WC 1.09
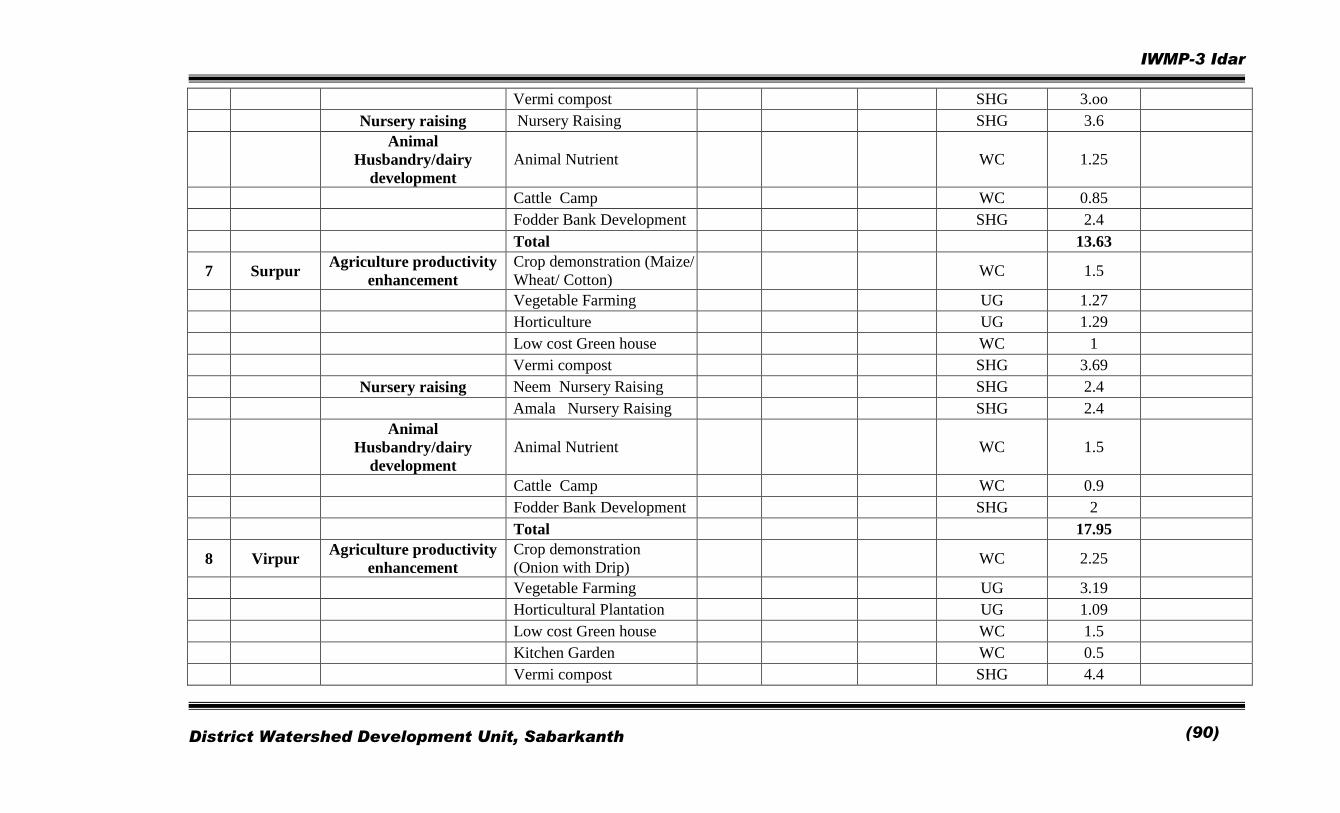
IWMP-3 Idar
District Watershed Development Unit, Sabarkanth
(90)
Vermi compost
SHG 3.oo
Nursery raising Nursery Raising
SHG 3.6
Animal
Husbandry/dairy
development
Animal Nutrient
WC 1.25
Cattle Camp
WC 0.85
Fodder Bank Development
SHG 2.4
Total
13.63
7 Surpur Agriculture productivity
enhancement
Crop demonstration (Maize/
Wheat/ Cotton) WC 1.5
Vegetable Farming
UG 1.27
Horticulture
UG 1.29
Low cost Green house
WC 1
Vermi compost
SHG 3.69
Nursery raising Neem Nursery Raising
SHG 2.4
Amala Nursery Raising
SHG 2.4
Animal
Husbandry/dairy
development
Animal Nutrient
WC 1.5
Cattle Camp
WC 0.9
Fodder Bank Development
SHG 2
Total
17.95
8 Virpur Agriculture productivity
enhancement
Crop demonstration
(Onion with Drip) WC 2.25
Vegetable Farming
UG 3.19
Horticultural Plantation
UG 1.09
Low cost Green house
WC 1.5
Kitchen Garden
WC 0.5
Vermi compost
SHG 4.4
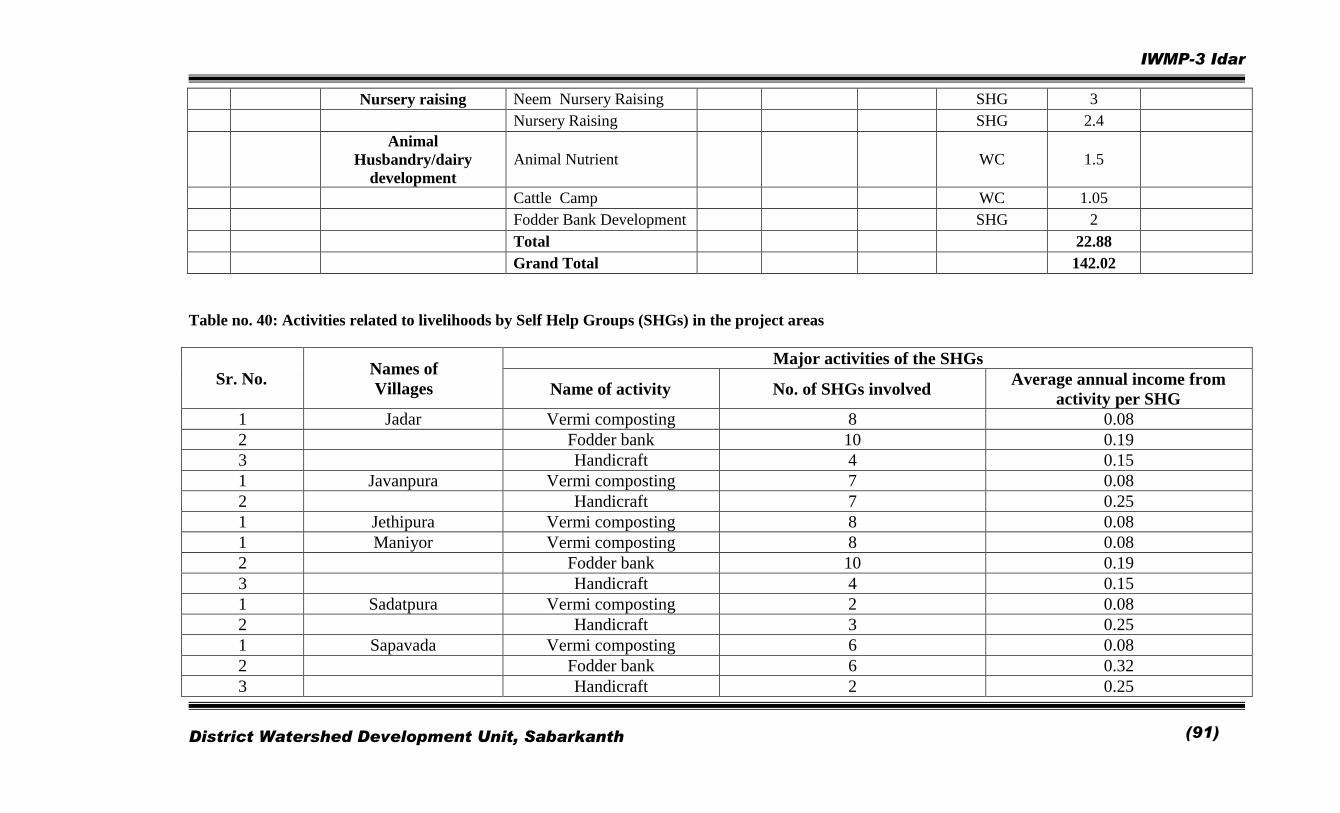
IWMP-3 Idar
District Watershed Development Unit, Sabarkanth
(91)
Nursery raising Neem Nursery Raising
SHG 3
Nursery Raising
SHG 2.4
Animal
Husbandry/dairy
development
Animal Nutrient
WC 1.5
Cattle Camp
WC 1.05
Fodder Bank Development
SHG 2
Total
22.88
Grand Total
142.02
Table no. 40: Activities related to livelihoods by Self Help Groups (SHGs) in the project areas
Sr. No. Names of
Villages
Major activities of the SHGs
Name of activity No. of SHGs involved Average annual income from
activity per SHG
1 Jadar Vermi composting 8 0.08
2 Fodder bank 10 0.19
3 Handicraft 4 0.15
1 Javanpura Vermi composting 7 0.08
2 Handicraft 7 0.25
1 Jethipura Vermi composting 8 0.08
1 Maniyor Vermi composting 8 0.08
2 Fodder bank 10 0.19
3 Handicraft 4 0.15
1 Sadatpura Vermi composting 2 0.08
2 Handicraft 3 0.25
1 Sapavada Vermi composting 6 0.08
2 Fodder bank 6 0.32
3 Handicraft 2 0.25

IWMP-3 Idar
District Watershed Development Unit, Sabarkanth
(92)
1 Surpur Vermi composting 6 0.08
3 Handicraft 6 0.25
1 Virpur Vermi composting 8 0.08
2 Fodder bank 6 0.32
3 Handicraft 2 0.15
Production System –
Production System-1: Fodder bank for Jadar watershed
Introduction :
“The fodder bank technology is a farming practice whereby leguminous shrubs and grass species are grown on a farm to provide fodder for livestock
sector.” It provides a wide range of animal products that are rich in high quality proteins and have the potential as good and sustainable sources of
income in many areas. However, local of fodder in terms of quality and quantity, is one of the major constrains towards the low productivity of cattle in
Jadar watershed Project.
The fodder bank ensures fodder availability which in turn reduces the distressed migration of the people resulting in sustainable livelihood opportunities
and enhances natural resource security in the project area.
Objective of a fodder bank
1. Build a local fodder bank and organize the distribution of fodder during drought and scarce situation.
2. Establish and maintain village fodder farm in the community grazing area, and allocate the community land for fodder production, in
association with dairy co-operatives.
IWMP-3 Idar
District Watershed Development Unit, Sabarkanth
(93)
3. Control regulates and charge in the community grazing and pastures lands.
4. Undertake the distribution of fodder seeds and slips in the village.
Primary problem of the project
Jadar village comes under totally rain fed agriculture because of this migration percentage is very high. Soil is very suitable for fodder crop mainly
sorghum but due the scarcity of irrigation water only one crop can be taken throughout the year. So fodder bank play an important role to solve this
problem. Majority of farmers own less than 2.5ha of land for food and fodder production but lack of irrigation water has made these lands unproductive.
The concept of fodder bank can overcome the problem of seasonal feed shortage, migration and poor animal performance.
It is the milk animal, which is the worst affected during these periods of drought, due to lack of productivity of sufficient fodder and water. As a result,
the poor and force to let go with their animals in search of fodder and green pastures to other parts of the state. This eventually this leads to colossal loss
of income generating assets, poor demographic profile of village and low education level of their children.
Even in good years, during the harvesting season, the poor tend to sell their crop residue or fodder to earn cash. At such time when supply is higher than
demand, they are not able to sell fodder at remunerative prices. The same fodder is bought back by them, mostly at higher prices during the month of
scarcity.
To meet the critical needs of fodder, especially for the poor families and protect them from inordinately high prices during the summer months, fodder
banks are proposed to be setup at the village level
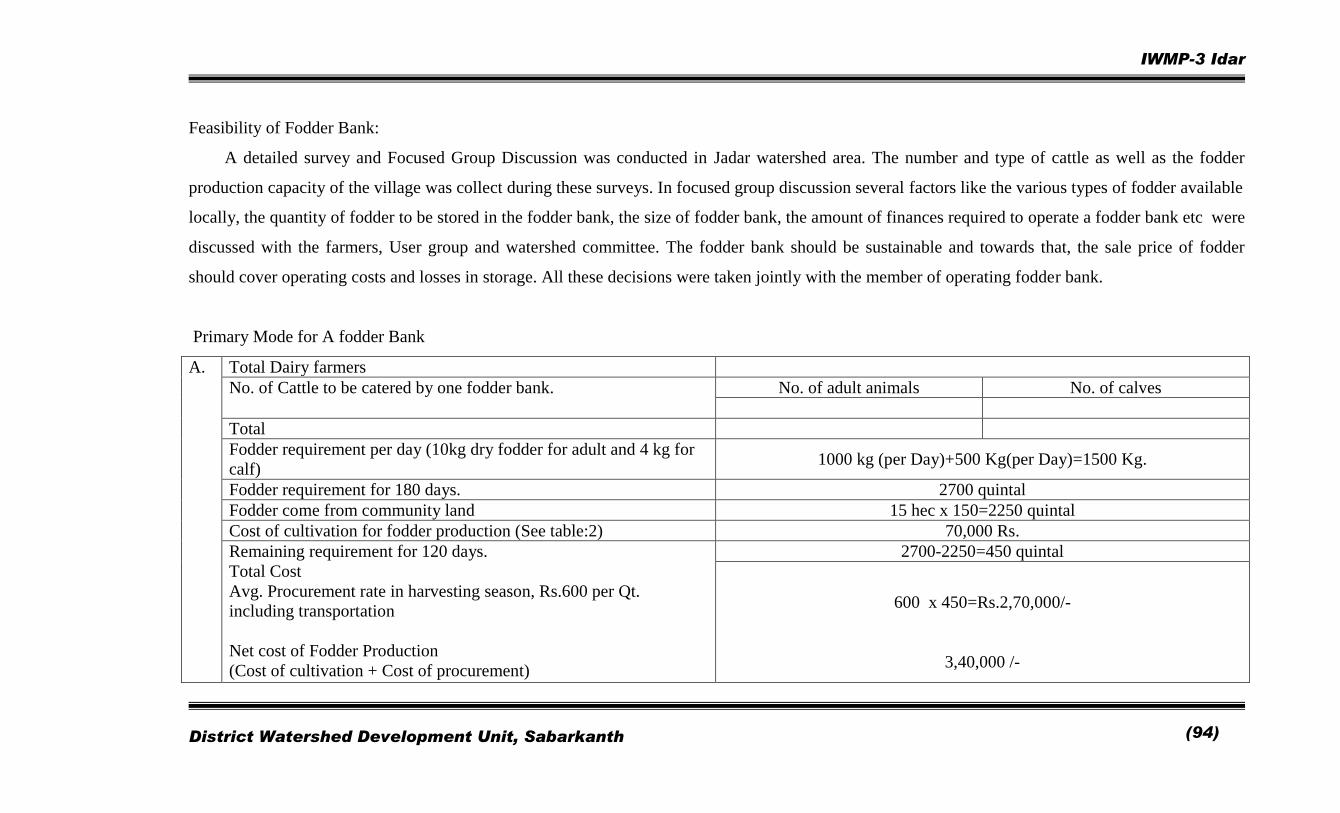
IWMP-3 Idar
District Watershed Development Unit, Sabarkanth
(94)
Feasibility of Fodder Bank:
A detailed survey and Focused Group Discussion was conducted in Jadar watershed area. The number and type of cattle as well as the fodder
production capacity of the village was collect during these surveys. In focused group discussion several factors like the various types of fodder available
locally, the quantity of fodder to be stored in the fodder bank, the size of fodder bank, the amount of finances required to operate a fodder bank etc were
discussed with the farmers, User group and watershed committee. The fodder bank should be sustainable and towards that, the sale price of fodder
should cover operating costs and losses in storage. All these decisions were taken jointly with the member of operating fodder bank.
Primary Mode for A fodder Bank
A. Total Dairy farmers
No. of Cattle to be catered by one fodder bank. No. of adult animals No. of calves
Total
Fodder requirement per day (10kg dry fodder for adult and 4 kg for
calf) 1000 kg (per Day)+500 Kg(per Day)=1500 Kg.
Fodder requirement for 180 days. 2700 quintal
Fodder come from community land 15 hec x 150=2250 quintal
Cost of cultivation for fodder production (See table:2) 70,000 Rs.
Remaining requirement for 120 days.
Total Cost
Avg. Procurement rate in harvesting season, Rs.600 per Qt.
including transportation
Net cost of Fodder Production
(Cost of cultivation + Cost of procurement)
2700-2250=450 quintal
600 x 450=Rs.2,70,000/-
3,40,000 /-
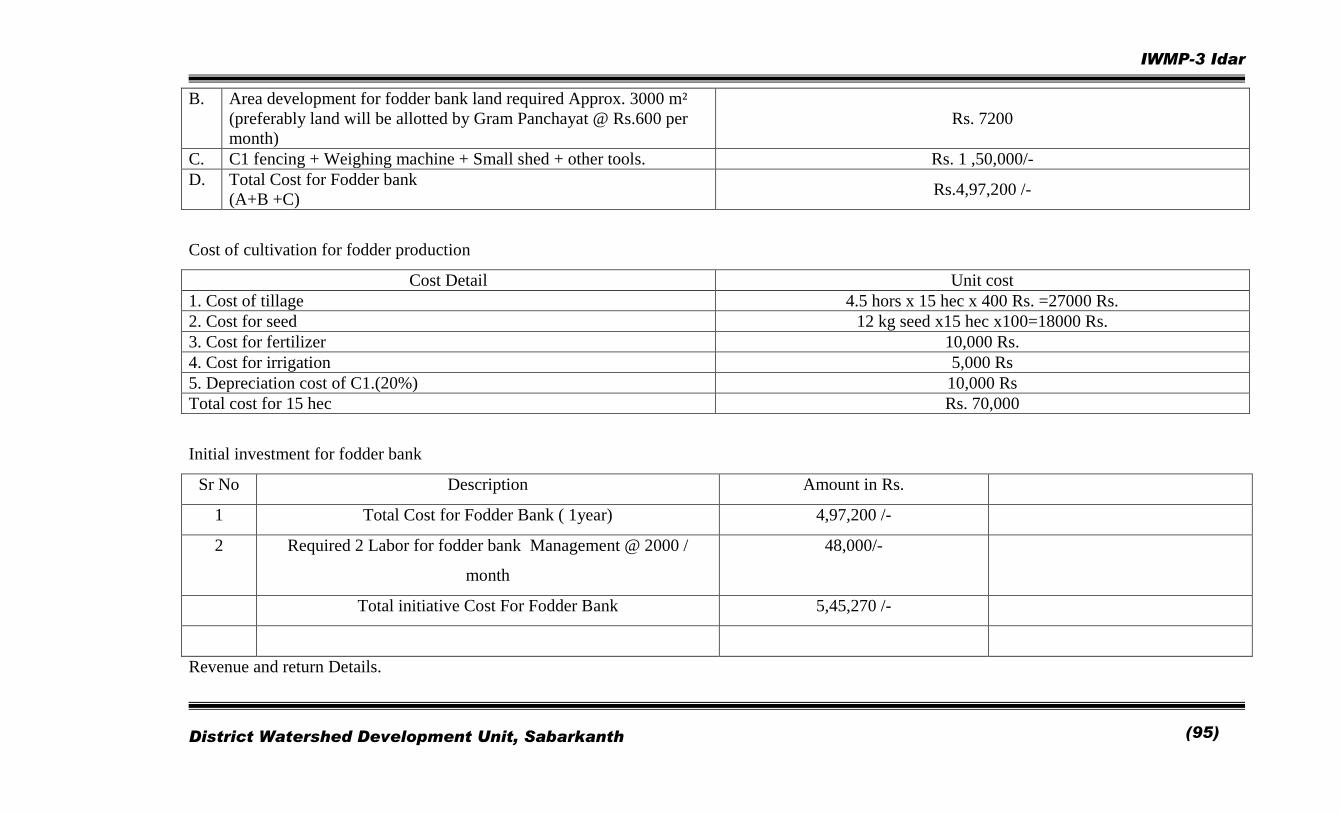
IWMP-3 Idar
District Watershed Development Unit, Sabarkanth
(95)
B. Area development for fodder bank land required Approx. 3000 m²
(preferably land will be allotted by Gram Panchayat @ Rs.600 per
month)
Rs. 7200
C. C1 fencing + Weighing machine + Small shed + other tools. Rs. 1 ,50,000/-
D. Total Cost for Fodder bank
(A+B +C) Rs.4,97,200 /-
Cost of cultivation for fodder production
Cost Detail Unit cost
1. Cost of tillage 4.5 hors x 15 hec x 400 Rs. =27000 Rs.
2. Cost for seed 12 kg seed x15 hec x100=18000 Rs.
3. Cost for fertilizer 10,000 Rs.
4. Cost for irrigation 5,000 Rs
5. Depreciation cost of C1.(20%) 10,000 Rs
Total cost for 15 hec Rs. 70,000
Initial investment for fodder bank
Sr No Description Amount in Rs.
1 Total Cost for Fodder Bank ( 1year) 4,97,200 /-
2 Required 2 Labor for fodder bank Management @ 2000 /
month
48,000/-
Total initiative Cost For Fodder Bank 5,45,270 /-
Revenue and return Details.
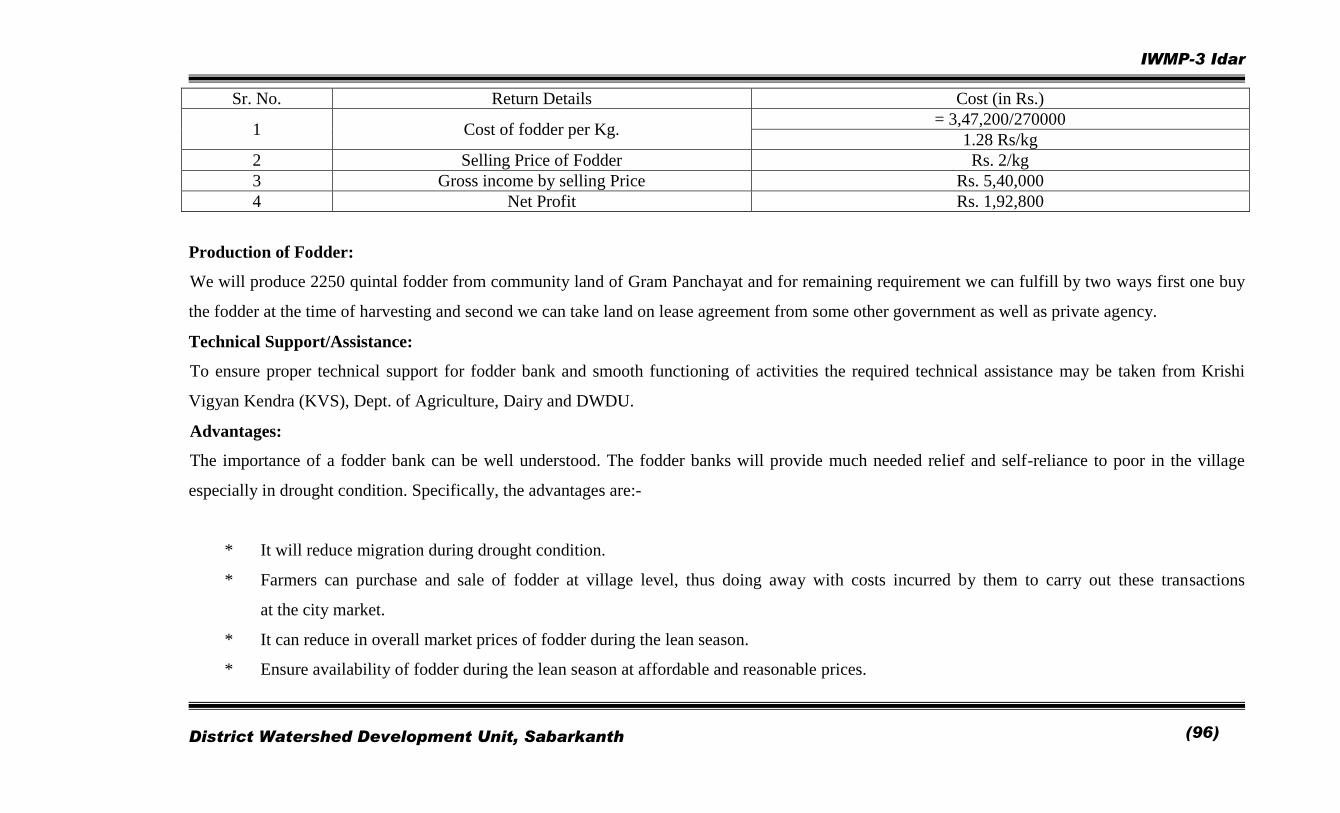
IWMP-3 Idar
District Watershed Development Unit, Sabarkanth
(96)
Sr. No. Return Details Cost (in Rs.)
1 Cost of fodder per Kg. = 3,47,200/270000
1.28 Rs/kg
2 Selling Price of Fodder Rs. 2/kg
3 Gross income by selling Price Rs. 5,40,000
4 Net Profit Rs. 1,92,800
Production of Fodder:
We will produce 2250 quintal fodder from community land of Gram Panchayat and for remaining requirement we can fulfill by two ways first one buy
the fodder at the time of harvesting and second we can take land on lease agreement from some other government as well as private agency.
Technical Support/Assistance:
To ensure proper technical support for fodder bank and smooth functioning of activities the required technical assistance may be taken from Krishi
Vigyan Kendra (KVS), Dept. of Agriculture, Dairy and DWDU.
Advantages:
The importance of a fodder bank can be well understood. The fodder banks will provide much needed relief and self-reliance to poor in the village
especially in drought condition. Specifically, the advantages are:-
* It will reduce migration during drought condition.
* Farmers can purchase and sale of fodder at village level, thus doing away with costs incurred by them to carry out these transactions
at the city market.
* It can reduce in overall market prices of fodder during the lean season.
* Ensure availability of fodder during the lean season at affordable and reasonable prices.
IWMP-3 Idar
District Watershed Development Unit, Sabarkanth
(97)
* Reduced distress sale of cattle due to non – availability and / or non-affordability of fodder.
* Higher income for the poor as cattle will have enough fodder even during the lean season
* Increase employment opportunities at the village level associate with the sale, purchase and storage of fodder.
Productive System 2:
Vermi composting unit for Jadar village
Introduction:
The Process of composting crop residues using earthworms comprise spreading the agriculture wastes and cow dung in layers as 1.5 m wide and
0.9 m high beds of required length. Earthworms are introduced in between the layers @ 350 worms per m3 of bed volume. The beds are
maintained at about 450 – 50% moisture content and a temperature of 20 – 30° C by sprinkling water over the beds. The earthworms being
voracious eaters consume the biodegradable matter and give our a part of the matter as excreta or vermin-castings. The vermin-casting containing
nutrients are rich manure for the plants.
About the Worms:-
Eisenia fetid, Edrilus Eugenie, and Perionx excavatius are some of the species for rearing to convert organic wastes into manure. The worms feed
on any biodegradable matter ranging from coir waste to kitchen garbage and Vermi composting units are ideally suited to locations / units with
generation of considerable quantities of organic wastes. One earthworm reaching reproductive age of about six weeks lay one egg capsule
(containing 7 embryos) every 7 – 10 days. Three to seven worms emerge out of each capsule. Thus, the multiplication of worms under optimum
growth conditions is very fast. The farms live for about 2 years. Fully grown worms could be separated and dried in an oven to make ‘worm
meal’ which is rich source of protein (70%) for use in animal feed.
Location:-
IWMP-3 Idar
District Watershed Development Unit, Sabarkanth
(98)
Jadar village has lots of animals so it can become good vermin compost centre as well as good source of livelihood. Vermi composting very suitable for
fruit, flower and vegetable as well as creel crops. It increases quality and quantity of production in per unit area.
Use:-
Vermicompost is nothing but the excreta of earthworms, which is rich in humus and nutrients. We can rear earthworms artificially in a brick tank or
near the stem / trunk of trees (specially horticultural trees). By feeding these earthworms with biomass and watching properly the food (bio-mass) of
earthworms, we can produce the required quantities of vermicompost.
Advantages of vermicompost:
01. Vermicompost is rich in all essential plant nutrients.
02. Provides excellent effect on overall plant growth, encourages the growth of new shoots / leaves and improves
the quality and shelf life of the produce.
03. Vermicompost is free flowing, easy to apply, handle and store and does not have bad odor.
04. It improves soil structure, texture, aeration, and water holding capacity and prevents soil erosion.
05. Vermicompost is rich in beneficial micro flora such as a fixers, P- solubilizers, and cellulose decomposing micro-flora
etc in addition to improve soil environment.
06. Vermicompost contains earthworm cocoons and increases the population and activity of earthworm in the soil.
07. It neutralizes the soil protection.
08. It prevents nutrient losses and increases the use efficiency of chemical fertilizers.
09. Vermicompost is free from pathogens, toxic elements, weed seeds etc.
10. Vermicompost minimizes the incidence of pest and diseases.
11. It enhances the decomposition of organic matter in soil.
IWMP-3 Idar
District Watershed Development Unit, Sabarkanth
(99)
12. It contains valuable vitamins, enzymes and hormones like auxins, gibberellins etc.
Nutrient content of vermicompost
Nitrogen- 1.5 – 2.5 % Calcium- 0.5 – 1.0 %
Phosphorus- 0.9 – 1.7 % Magnesium- 0.2 – 0.3 %
Potash- 1.5 – 2.4 % Sulphur- 0.4 - 0.5 %
And other micronutrients with vitamins, enzymes and hormones.
Materials for preparation of Vermicompost:
Any types of biodegradable wastes-
1. Crop residues
2. Weed biomass
3. Vegetable waste
4. Leaf litter
5. Hotel refuse
6. Waste from agro-industries
7. Biodegradable portion of urban and rural wastes.
Methods of preparation
The vermicompost can be prepared in concrete tank. The size of the tank should be 10 ft. length or more depending upon the availability of land
and raw materials, breadth 3- 5ft and height 3 ft. Suitable plastic tube / basin structure may also be needed. The floor of the tank should be
connected with stones and pieces of bricks.
IWMP-3 Idar
District Watershed Development Unit, Sabarkanth
(100)
The available bio-wastes are to be collected and are to be heaped under sun about 7-10 days and be chopped if necessary.
Sprinkling of cow dung slurry to the heap may be done.
A thin layer of half decomposed cow dung (1-2 inches) is to be placed at the bottom.
Place the chopped weed biomass and partially decomposed cow dung layer wise. (10-20 cm) in the tank / pot up to the depth of 2 ½ ft. The bio
waste and cow dung ratio should be 60: 40 on dry wt. Basis.
Release about 2-3 kg earthworms per ton of biomass or 100 nos. earthworms per one sq. ft. area.
Efficient : species:Eisenia, foetidaAmyanthes, diffrigensEudrillus, engineac
Place wire net / bamboo net over the tank to protect earthworm from birds.
Sprinkling of water should be done to maintain 70-80 % moisture content.
Provision of a shed over the compost is essential to prevent entry of rainwater and direct sunshine.
Sprinkling of water should be stopped when 90 % bio-wastes are decomposed. Maturity could be judged visually by observing the formation of
granular structure of the compost at the surface of the tank.
Harvest the vermicompost by scrapping layer wise from the top of the tank and heap under shed. This will help in separation of earthworms from
the compost. Sieving may also be done to separate the earthworms and cocoons.
Model for A Vermi-compost Unit ( For 1 Cycle)
Area (10 x 1.25 m= 12.50 Sqmt)
Sr.
No. Particulars Quantity
Per
Rate (Rs.) Amount (Rs.)
1 Concrete pillars (3m long) 10 No 100 1000
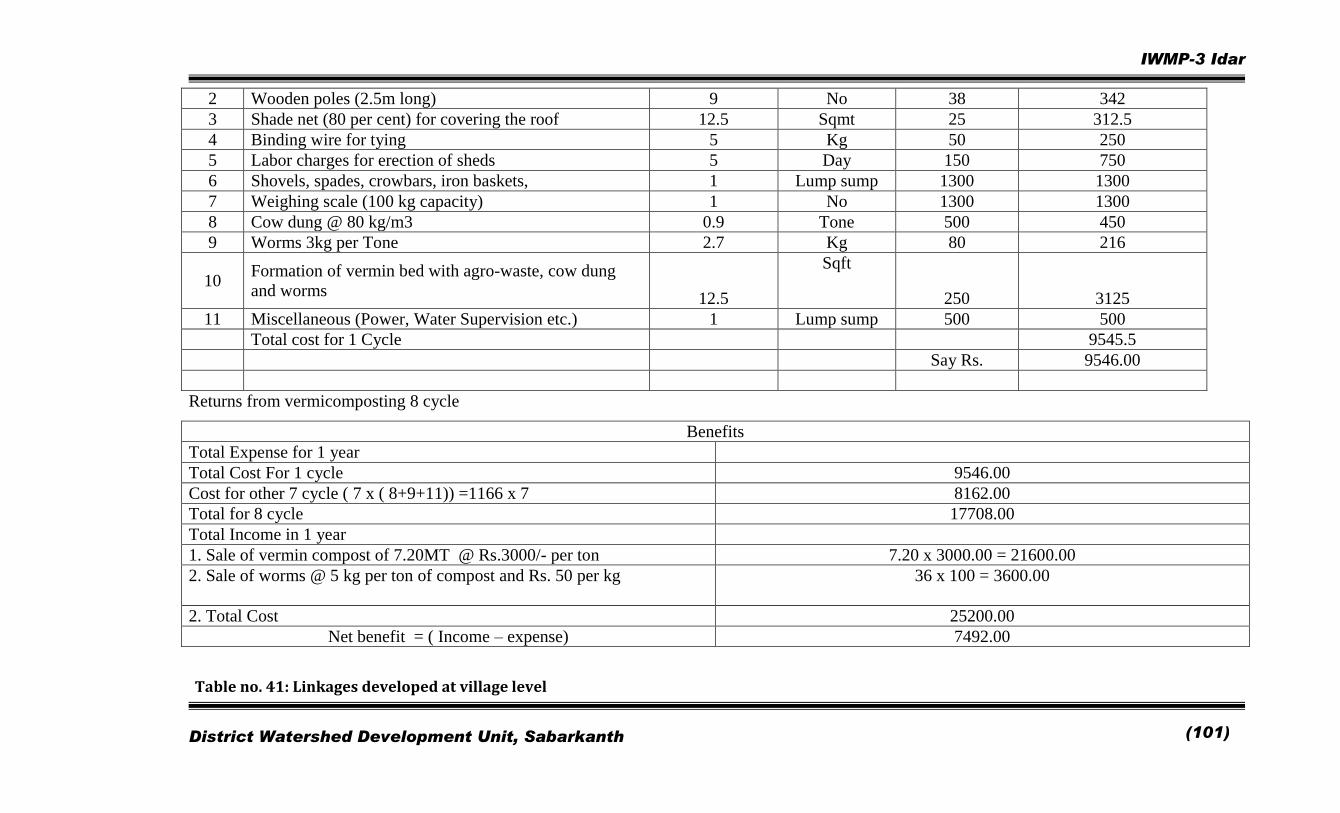
IWMP-3 Idar
District Watershed Development Unit, Sabarkanth
(101)
2 Wooden poles (2.5m long) 9 No 38 342
3 Shade net (80 per cent) for covering the roof 12.5 Sqmt 25 312.5
4 Binding wire for tying 5 Kg 50 250
5 Labor charges for erection of sheds 5 Day 150 750
6 Shovels, spades, crowbars, iron baskets, 1 Lump sump 1300 1300
7 Weighing scale (100 kg capacity) 1 No 1300 1300
8 Cow dung @ 80 kg/m3 0.9 Tone 500 450
9 Worms 3kg per Tone 2.7 Kg 80 216
10 Formation of vermin bed with agro-waste, cow dung
and worms 12.5
Sqft
250 3125
11 Miscellaneous (Power, Water Supervision etc.) 1 Lump sump 500 500
Total cost for 1 Cycle 9545.5
Say Rs. 9546.00
Returns from vermicomposting 8 cycle
Benefits
Total Expense for 1 year
Total Cost For 1 cycle 9546.00
Cost for other 7 cycle ( 7 x ( 8+9+11)) =1166 x 7 8162.00
Total for 8 cycle 17708.00
Total Income in 1 year
1. Sale of vermin compost of 7.20MT @ Rs.3000/- per ton 7.20 x 3000.00 = 21600.00
2. Sale of worms @ 5 kg per ton of compost and Rs. 50 per kg
36 x 100 = 3600.00
2. Total Cost 25200.00
Net benefit = ( Income – expense) 7492.00
Table no. 41: Linkages developed at village level
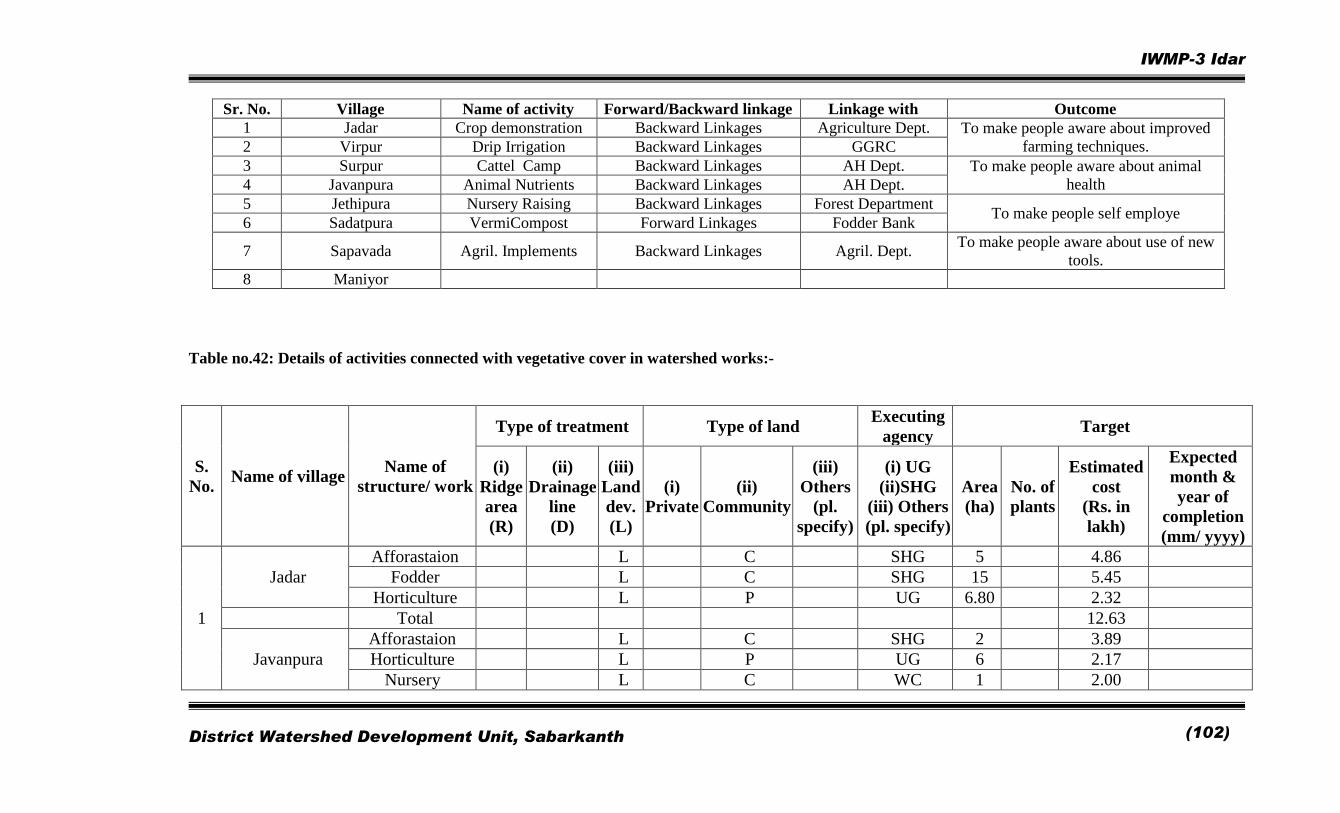
IWMP-3 Idar
District Watershed Development Unit, Sabarkanth
(102)
Sr. No. Village Name of activity Forward/Backward linkage Linkage with Outcome
1 Jadar Crop demonstration Backward Linkages Agriculture Dept. To make people aware about improved
farming techniques. 2 Virpur Drip Irrigation Backward Linkages GGRC
3 Surpur Cattel Camp Backward Linkages AH Dept. To make people aware about animal
health 4 Javanpura Animal Nutrients Backward Linkages AH Dept.
5 Jethipura Nursery Raising Backward Linkages Forest Department To make people self employe
6 Sadatpura VermiCompost Forward Linkages Fodder Bank
7 Sapavada Agril. Implements Backward Linkages Agril. Dept. To make people aware about use of new
tools.
8 Maniyor
Table no.42: Details of activities connected with vegetative cover in watershed works:-
S.
No. Name of village
Name of
structure/ work
Type of treatment Type of land Executing
agency Target
(i)
Ridge
area
(R)
(ii)
Drainage
line
(D)
(iii)
Land
dev.
(L)
(i)
Private
(ii)
Community
(iii)
Others
(pl.
specify)
(i) UG
(ii)SHG
(iii) Others
(pl. specify)
Area
(ha)
No. of
plants
Estimated
cost
(Rs. in
lakh)
Expected
month &
year of
completion
(mm/ yyyy)
1
Jadar
Afforastaion L C SHG 5 4.86
Fodder L C SHG 15 5.45
Horticulture L P UG 6.80 2.32
Total 12.63
Javanpura
Afforastaion L C SHG 2 3.89
Horticulture L P UG 6 2.17
Nursery L C WC 1 2.00
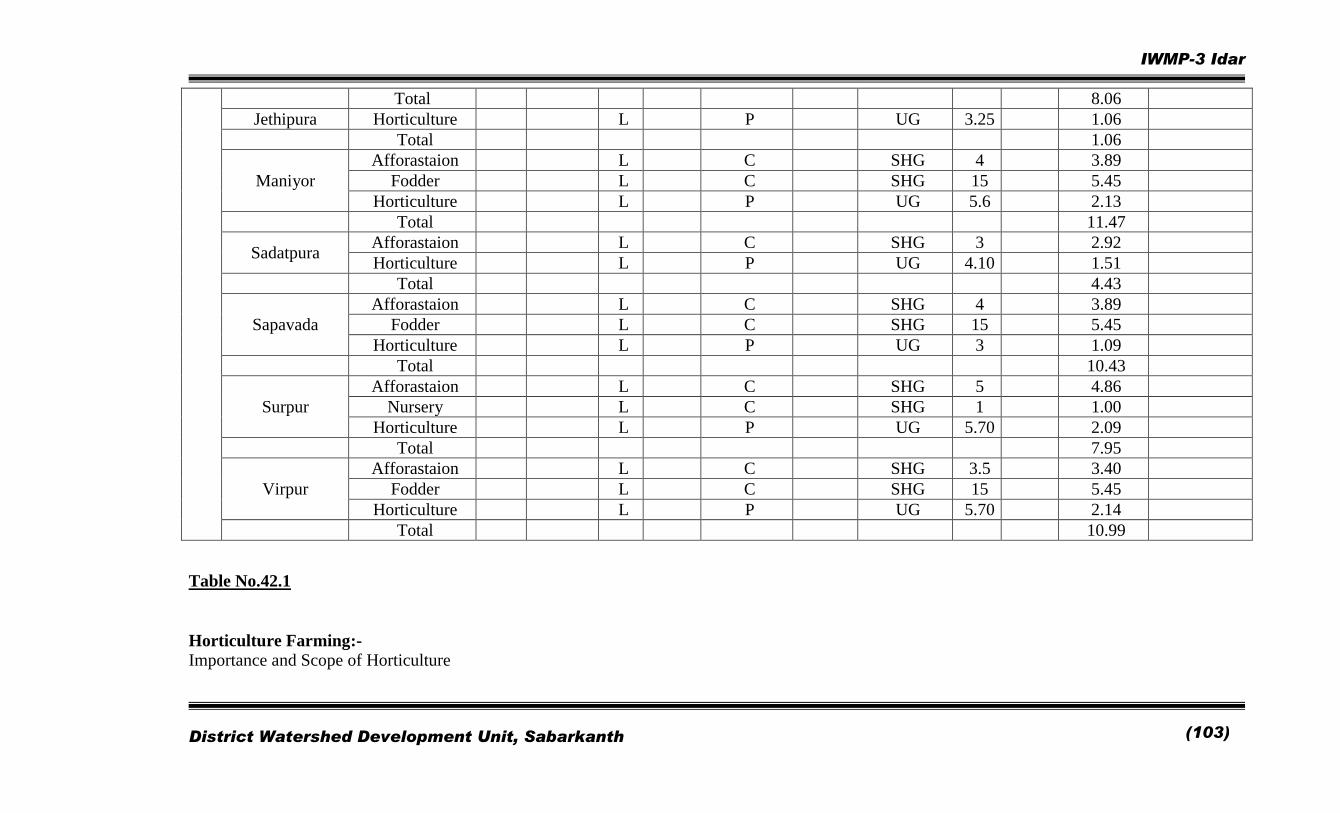
IWMP-3 Idar
District Watershed Development Unit, Sabarkanth
(103)
Total 8.06
Jethipura Horticulture L P UG 3.25 1.06
Total 1.06
Maniyor
Afforastaion L C SHG 4 3.89
Fodder L C SHG 15 5.45
Horticulture L P UG 5.6 2.13
Total 11.47
Sadatpura Afforastaion L C SHG 3 2.92
Horticulture L P UG 4.10 1.51
Total 4.43
Sapavada
Afforastaion L C SHG 4 3.89
Fodder L C SHG 15 5.45
Horticulture L P UG 3 1.09
Total 10.43
Surpur
Afforastaion L C SHG 5 4.86
Nursery L C SHG 1 1.00
Horticulture L P UG 5.70 2.09
Total 7.95
Virpur
Afforastaion L C SHG 3.5 3.40
Fodder L C SHG 15 5.45
Horticulture L P UG 5.70 2.14
Total 10.99
Table No.42.1
Horticulture Farming:-
Importance and Scope of Horticulture

IWMP-3 Idar
District Watershed Development Unit, Sabarkanth
(104)
India with diverse soil and climate comprising several agro-ecological regions provides ample opportunity to grow a variety of horticulture crops. These
crops form a significant part of total agricultural produce in the country comprising of fruits, vegetables, root and tuber crops, flowers, ornamental
plants, medicinal and aromatic plants, spices, condiments, plantation crops and mushrooms.
It is estimated that all the horticulture crops put together cover nearly 11-6 million hectares area with an annual production of 91 million tones.
Though these crops occupy hardly 7% of the cropped area they contribute over 18% to the gross agricultural output in the country.
Horticultural crops play a unique role in India’s economy by improving the income of the rural people. Cultivation of these crops is labor intensive
and as such they generate lot of employment opportunities for the rural population. Fruits and vegetables are also rich source of vitamins, minerals,
proteins, and carbohydrates etc. which are essential in human nutrition. Hence, these are referred to as protective foods and assumed great importance as
nutritional security of the people. Thus, cultivation of horticultural crops plays a vital role in the prosperity of a nation and is directly linked with the
health and happiness of the people.
Cost Estimation of Horticultural Farming
Sr.
No. Description
Spacing in
Meter
No of Plants
per Ha Rate per plant
Inputs per
plant
Amount of
plants per Ha
Amount of
Inputs per
Ha
Total
Amount per
Ha
1 Mango Farming 10 x 10 100 150.00 180.00 15000.00 7200.00 22200.00
2 Lemon Farming 6 x 6 277 35.00 65.00 9695.00 18005.00 27700.00
3 Pomegranate ( Dadam) 5 x 5 667 30.00 75.00 20010.00 50025.00 70035.00
Table:-42.2 Afforastaion:
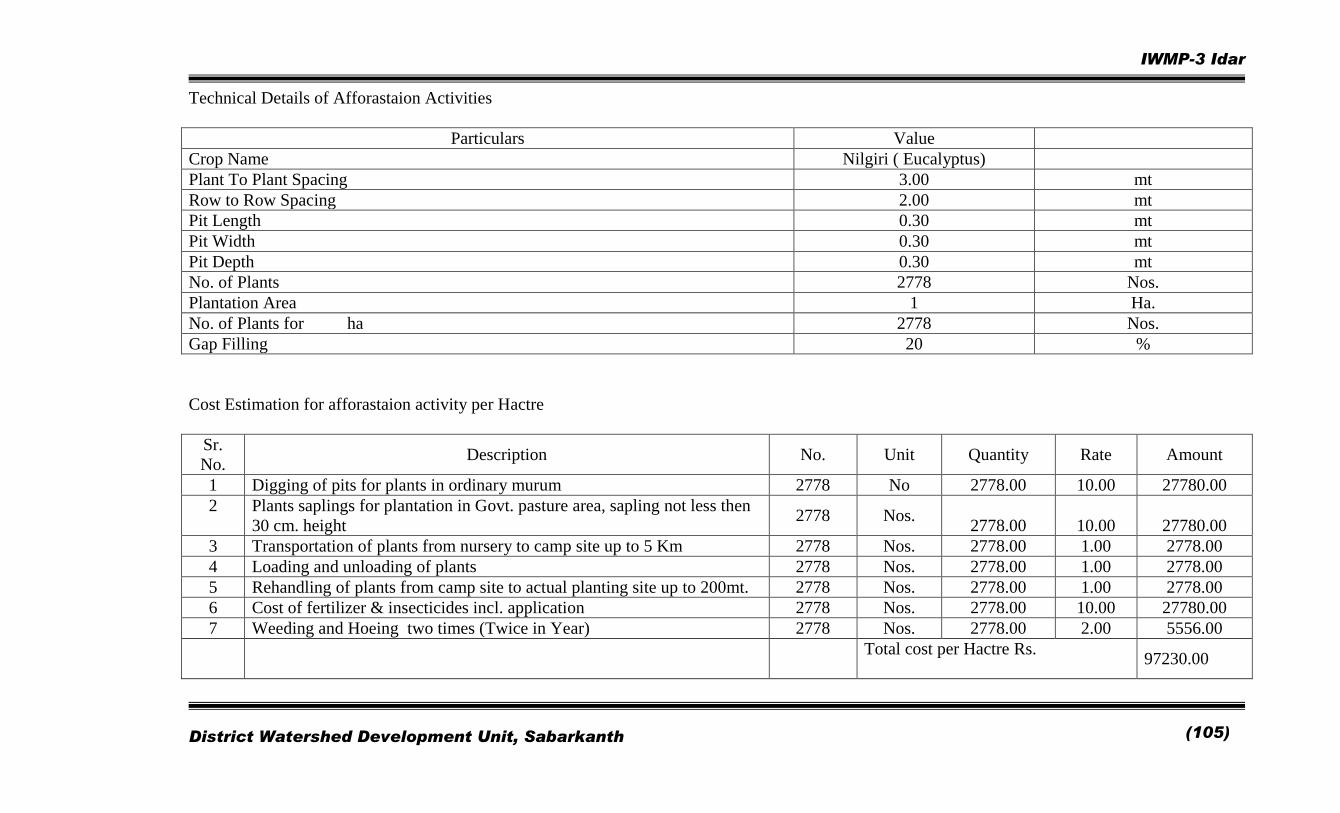
IWMP-3 Idar
District Watershed Development Unit, Sabarkanth
(105)
Technical Details of Afforastaion Activities
Particulars Value
Crop Name Nilgiri ( Eucalyptus)
Plant To Plant Spacing 3.00 mt
Row to Row Spacing 2.00 mt
Pit Length 0.30 mt
Pit Width 0.30 mt
Pit Depth 0.30 mt
No. of Plants 2778 Nos.
Plantation Area 1 Ha.
No. of Plants for ha 2778 Nos.
Gap Filling 20 %
Cost Estimation for afforastaion activity per Hactre
Sr.
No. Description No. Unit Quantity Rate Amount
1 Digging of pits for plants in ordinary murum 2778 No 2778.00 10.00 27780.00
2 Plants saplings for plantation in Govt. pasture area, sapling not less then
30 cm. height 2778 Nos.
2778.00 10.00 27780.00
3 Transportation of plants from nursery to camp site up to 5 Km 2778 Nos. 2778.00 1.00 2778.00
4 Loading and unloading of plants 2778 Nos. 2778.00 1.00 2778.00
5 Rehandling of plants from camp site to actual planting site up to 200mt. 2778 Nos. 2778.00 1.00 2778.00
6 Cost of fertilizer & insecticides incl. application 2778 Nos. 2778.00 10.00 27780.00
7 Weeding and Hoeing two times (Twice in Year) 2778 Nos. 2778.00 2.00 5556.00
Total cost per Hactre Rs.
97230.00
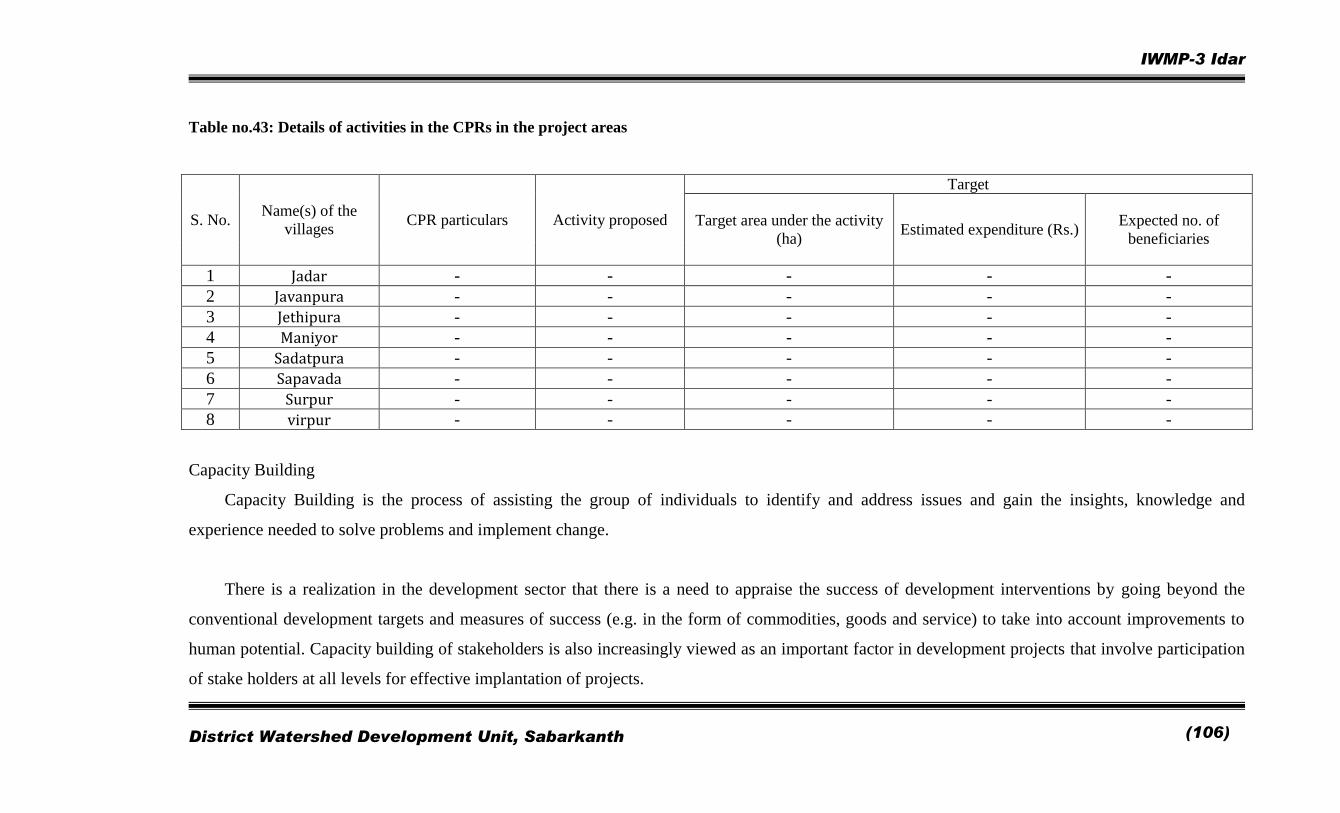
IWMP-3 Idar
District Watershed Development Unit, Sabarkanth
(106)
Table no.43: Details of activities in the CPRs in the project areas
S. No. Name(s) of the
villages CPR particulars Activity proposed
Target
Target area under the activity
(ha) Estimated expenditure (Rs.)
Expected no. of
beneficiaries
1 Jadar - - - - -
2 Javanpura - - - - -
3 Jethipura - - - - -
4 Maniyor - - - - -
5 Sadatpura - - - - -
6 Sapavada - - - - -
7 Surpur - - - - -
8 virpur - - - - -
Capacity Building
Capacity Building is the process of assisting the group of individuals to identify and address issues and gain the insights, knowledge and
experience needed to solve problems and implement change.
There is a realization in the development sector that there is a need to appraise the success of development interventions by going beyond the
conventional development targets and measures of success (e.g. in the form of commodities, goods and service) to take into account improvements to
human potential. Capacity building of stakeholders is also increasingly viewed as an important factor in development projects that involve participation
of stake holders at all levels for effective implantation of projects.
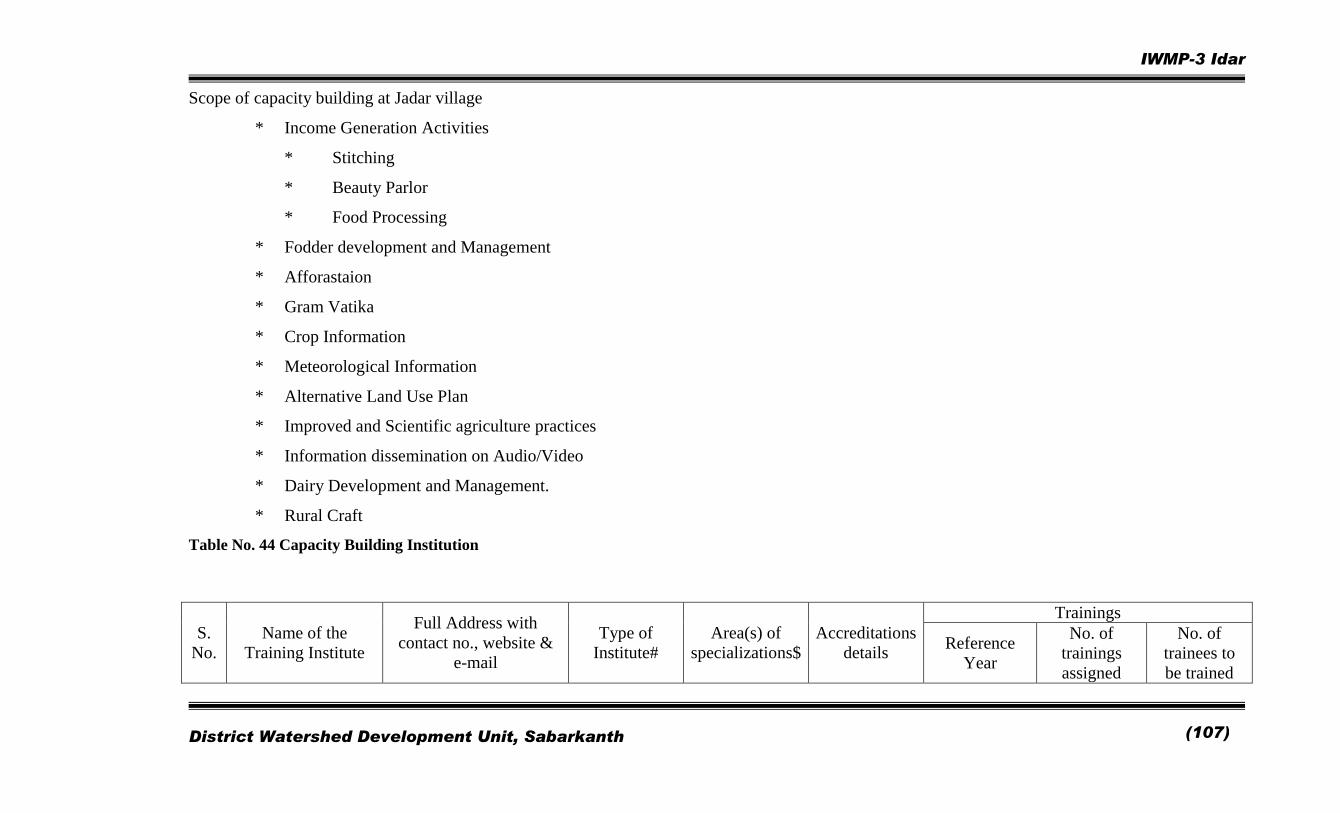
IWMP-3 Idar
District Watershed Development Unit, Sabarkanth
(107)
Scope of capacity building at Jadar village
* Income Generation Activities
* Stitching
* Beauty Parlor
* Food Processing
* Fodder development and Management
* Afforastaion
* Gram Vatika
* Crop Information
* Meteorological Information
* Alternative Land Use Plan
* Improved and Scientific agriculture practices
* Information dissemination on Audio/Video
* Dairy Development and Management.
* Rural Craft
Table No. 44 Capacity Building Institution
S.
No.
Name of the
Training Institute
Full Address with
contact no., website &
Type of
Institute#
Area(s) of
specializations$
Accreditations
details
Trainings
Reference
Year
No. of
trainings
assigned
No. of
trainees to
be trained
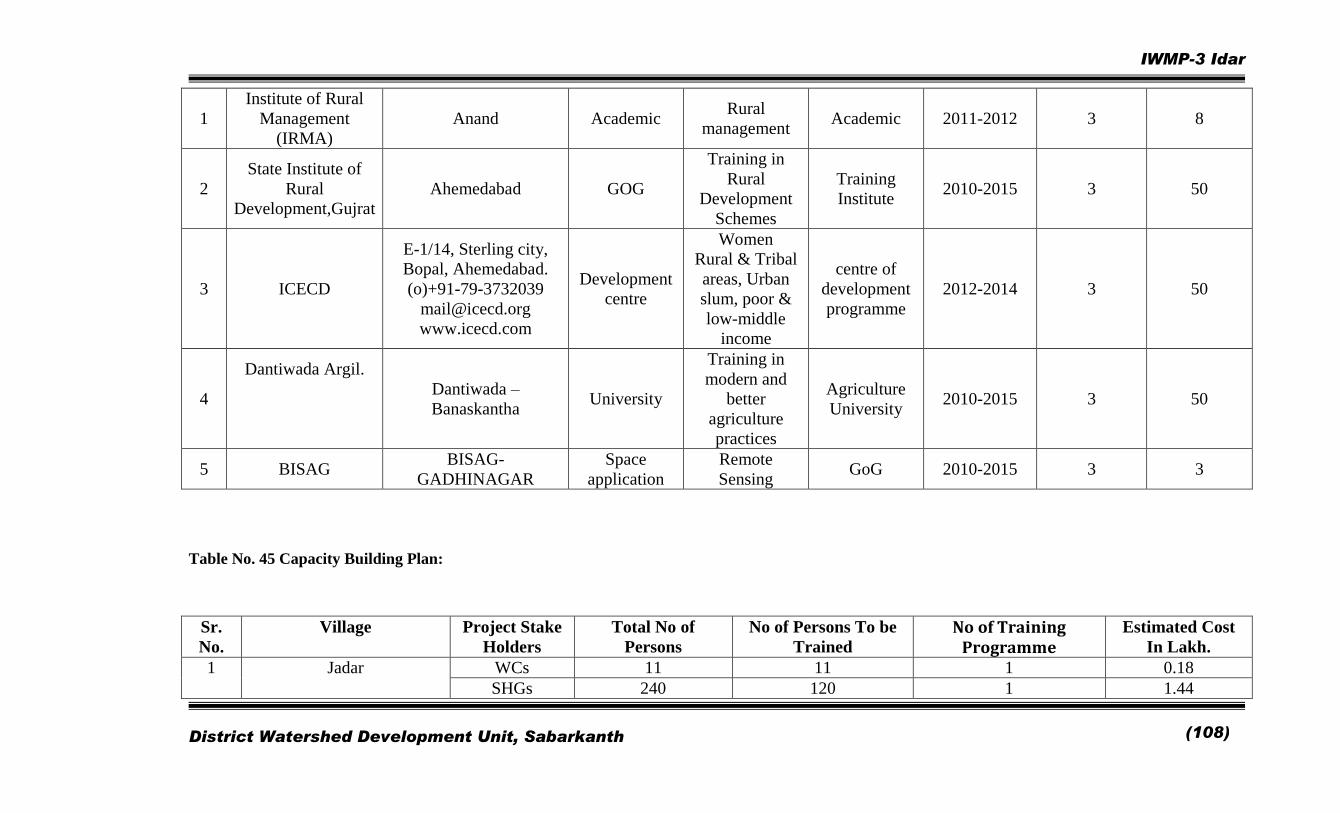
IWMP-3 Idar
District Watershed Development Unit, Sabarkanth
(108)
1
Institute of Rural
Management
(IRMA)
Anand Academic Rural
management Academic 2011-2012 3 8
2
State Institute of
Rural
Development,Gujrat
Ahemedabad GOG
Training in
Rural
Development
Schemes
Training
Institute 2010-2015 3 50
3 ICECD
E-1/14, Sterling city,
Bopal, Ahemedabad.
(o)+91-79-3732039
www.icecd.com
Development
centre
Women
Rural & Tribal
areas, Urban
slum, poor &
low-middle
income
centre of
development
programme
2012-2014 3 50
4
Dantiwada Argil.
Dantiwada –
Banaskantha University
Training in
modern and
better
agriculture
practices
Agriculture
University 2010-2015 3 50
5 BISAG BISAG-
GADHINAGAR
Space
application
Remote
Sensing GoG 2010-2015 3 3
Table No. 45 Capacity Building Plan:
Sr.
No.
Village Project Stake
Holders
Total No of
Persons
No of Persons To be
Trained
No of Training Programme
Estimated Cost
In Lakh.
1 Jadar WCs 11 11 1 0.18
SHGs 240 120 1 1.44
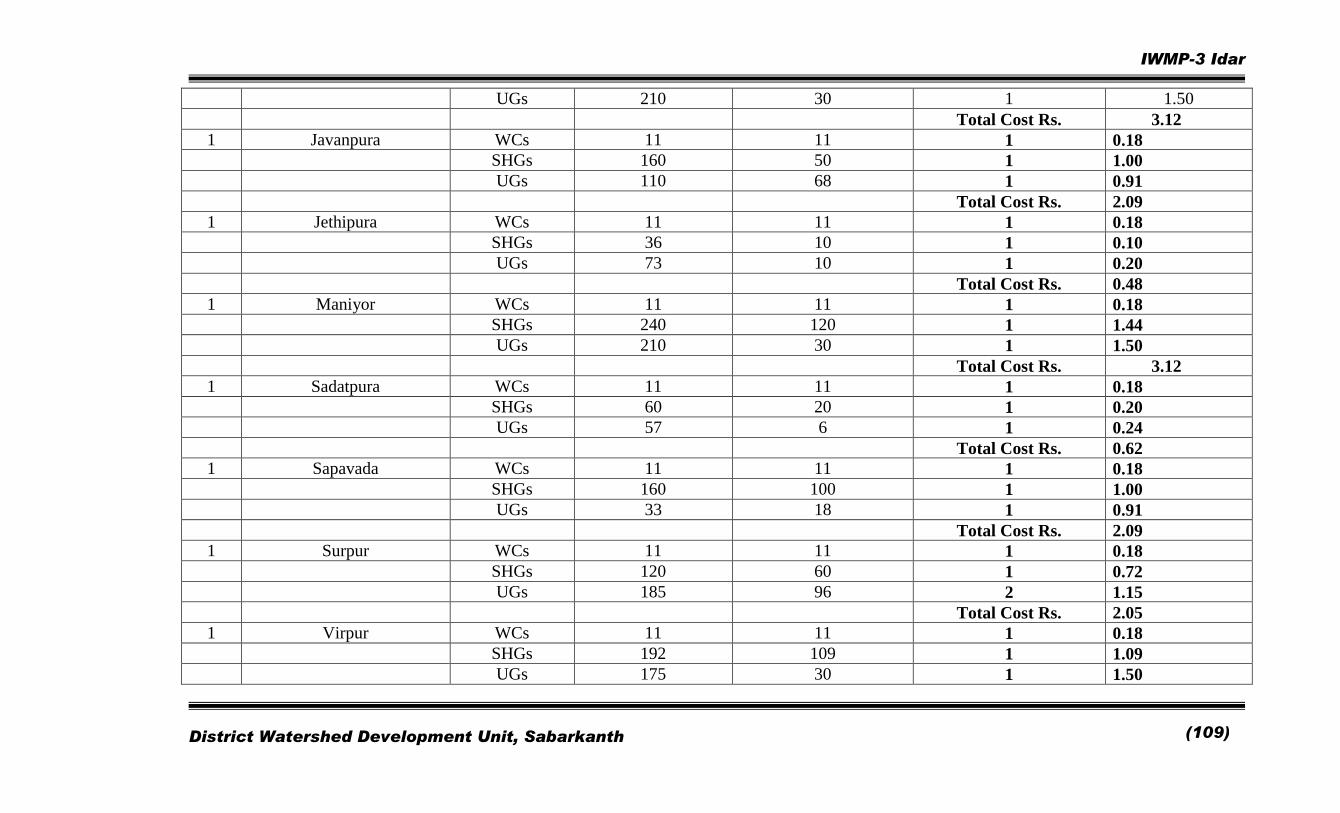
IWMP-3 Idar
District Watershed Development Unit, Sabarkanth
(109)
UGs 210 30 1 1.50
Total Cost Rs. 3.12
1 Javanpura WCs 11 11 1 0.18
SHGs 160 50 1 1.00
UGs 110 68 1 0.91
Total Cost Rs. 2.09
1 Jethipura WCs 11 11 1 0.18
SHGs 36 10 1 0.10
UGs 73 10 1 0.20
Total Cost Rs. 0.48
1 Maniyor WCs 11 11 1 0.18
SHGs 240 120 1 1.44
UGs 210 30 1 1.50
Total Cost Rs. 3.12
1 Sadatpura WCs 11 11 1 0.18
SHGs 60 20 1 0.20
UGs 57 6 1 0.24
Total Cost Rs. 0.62
1 Sapavada WCs 11 11 1 0.18
SHGs 160 100 1 1.00
UGs 33 18 1 0.91
Total Cost Rs. 2.09
1 Surpur WCs 11 11 1 0.18
SHGs 120 60 1 0.72
UGs 185 96 2 1.15
Total Cost Rs. 2.05
1 Virpur WCs 11 11 1 0.18
SHGs 192 109 1 1.09
UGs 175 30 1 1.50
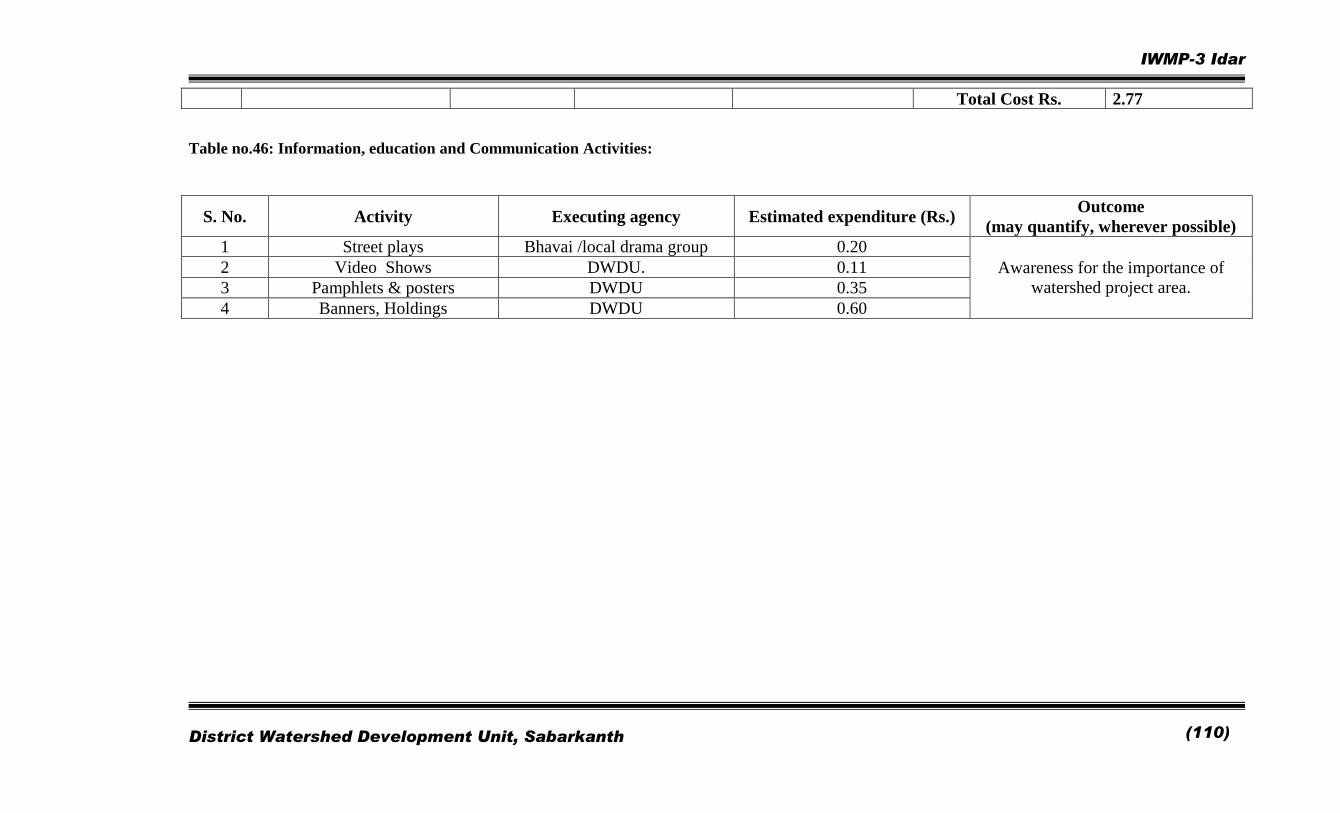
IWMP-3 Idar
District Watershed Development Unit, Sabarkanth
(110)
Total Cost Rs. 2.77
Table no.46: Information, education and Communication Activities:
S. No. Activity Executing agency Estimated expenditure (Rs.) Outcome
(may quantify, wherever possible)
1 Street plays Bhavai /local drama group 0.20
Awareness for the importance of
watershed project area.
2 Video Shows DWDU. 0.11
3 Pamphlets & posters DWDU 0.35
4 Banners, Holdings DWDU 0.60
IWMP-3 Idar
District Watershed Development Unit, Sabarkanth
(111)
CHAPTER – 5
Budgeting
Table no. 47: Budget at a glance for the Project
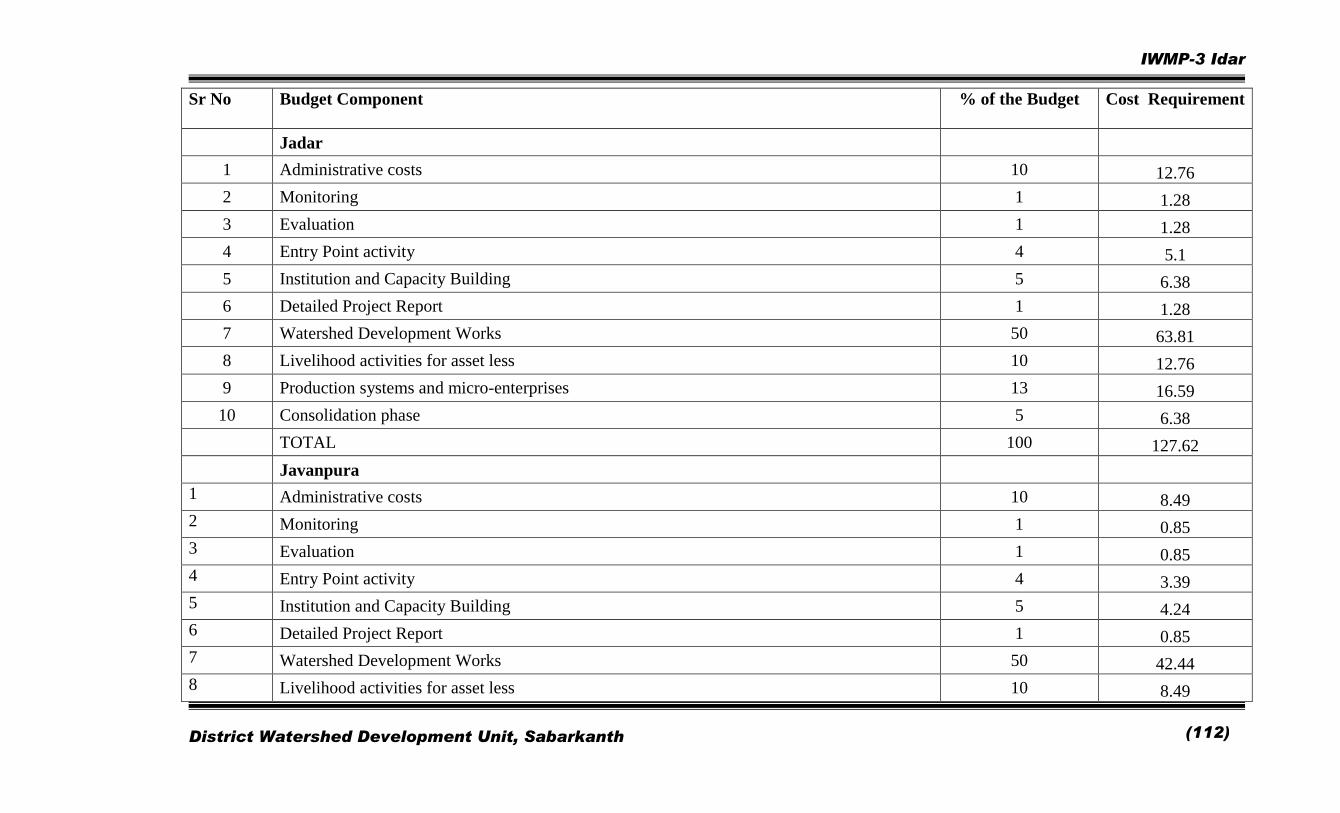
IWMP-3 Idar
District Watershed Development Unit, Sabarkanth
(112)
Sr No Budget Component
% of the Budget Cost Requirement
Jadar
1 Administrative costs 10 12.76
2 Monitoring 1 1.28
3 Evaluation 1 1.28
4 Entry Point activity 4 5.1
5 Institution and Capacity Building 5 6.38
6 Detailed Project Report 1 1.28
7 Watershed Development Works 50 63.81
8 Livelihood activities for asset less 10 12.76
9 Production systems and micro-enterprises 13 16.59
10 Consolidation phase 5 6.38
TOTAL 100 127.62
Javanpura
1 Administrative costs 10 8.49
2 Monitoring 1 0.85
3 Evaluation 1 0.85
4 Entry Point activity 4 3.39
5 Institution and Capacity Building 5 4.24
6 Detailed Project Report 1 0.85
7 Watershed Development Works 50 42.44
8 Livelihood activities for asset less 10 8.49
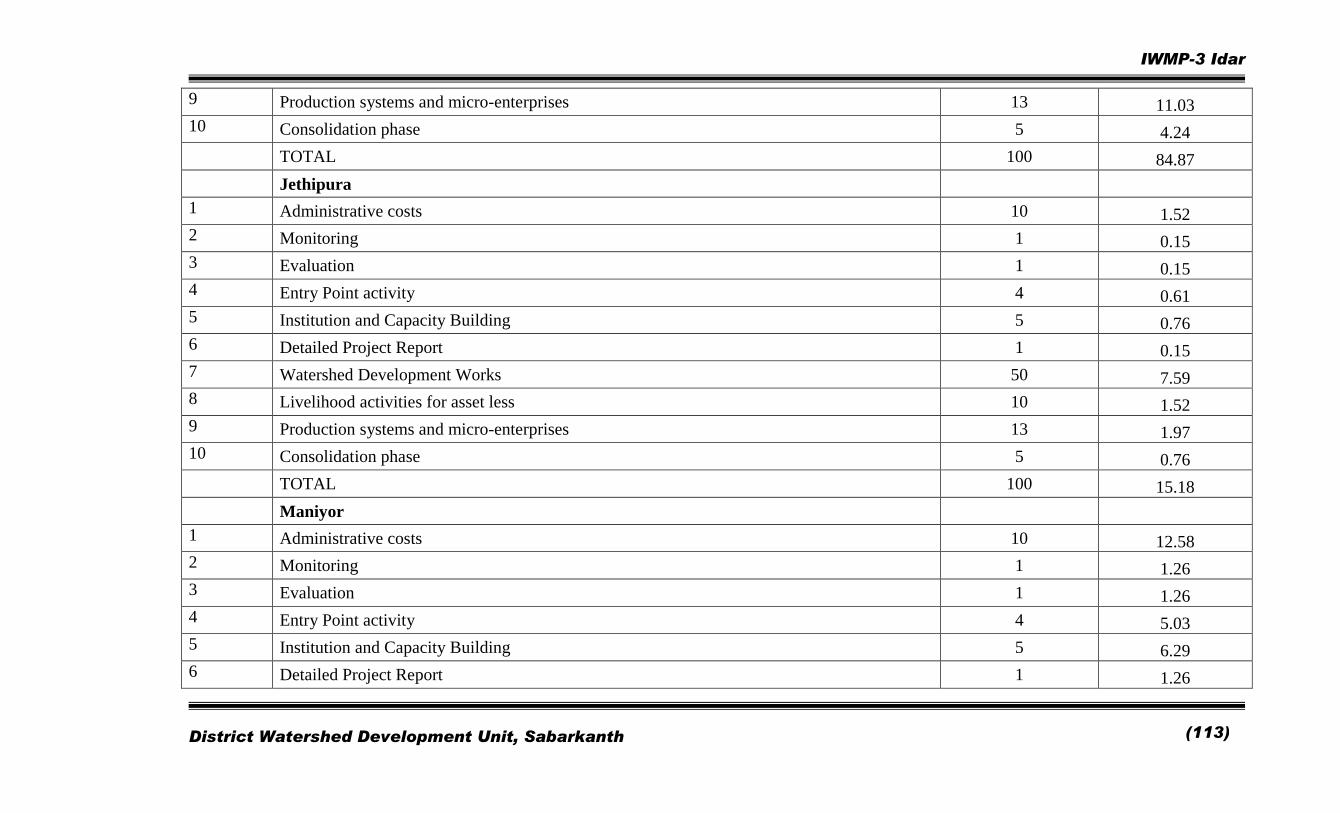
IWMP-3 Idar
District Watershed Development Unit, Sabarkanth
(113)
9 Production systems and micro-enterprises 13 11.03
10 Consolidation phase 5 4.24
TOTAL 100 84.87
Jethipura
1 Administrative costs 10 1.52
2 Monitoring 1 0.15
3 Evaluation 1 0.15
4 Entry Point activity 4 0.61
5 Institution and Capacity Building 5 0.76
6 Detailed Project Report 1 0.15
7 Watershed Development Works 50 7.59
8 Livelihood activities for asset less 10 1.52
9 Production systems and micro-enterprises 13 1.97
10 Consolidation phase 5 0.76
TOTAL 100 15.18
Maniyor
1 Administrative costs 10 12.58
2 Monitoring 1 1.26
3 Evaluation 1 1.26
4 Entry Point activity 4 5.03
5 Institution and Capacity Building 5 6.29
6 Detailed Project Report 1 1.26
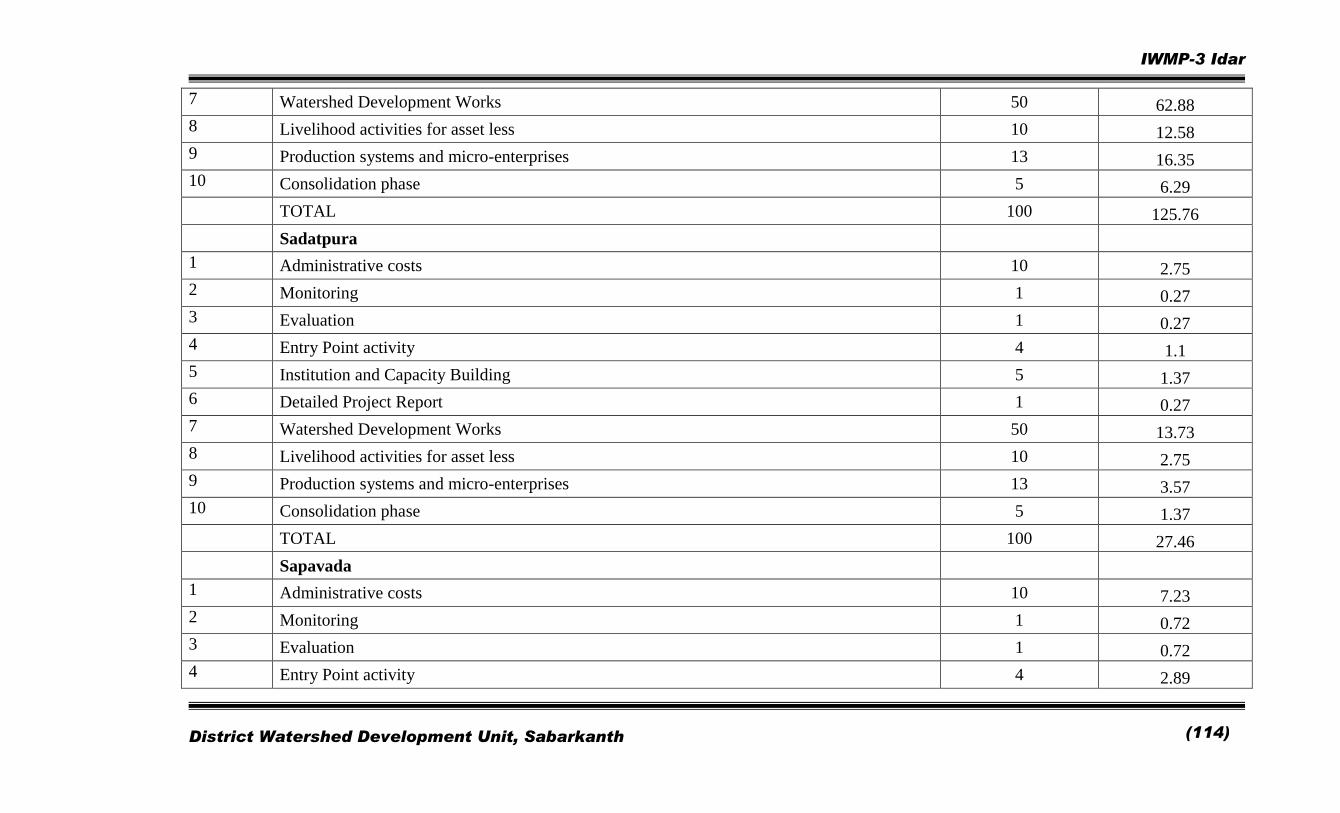
IWMP-3 Idar
District Watershed Development Unit, Sabarkanth
(114)
7 Watershed Development Works 50 62.88
8 Livelihood activities for asset less 10 12.58
9 Production systems and micro-enterprises 13 16.35
10 Consolidation phase 5 6.29
TOTAL 100 125.76
Sadatpura
1 Administrative costs 10 2.75
2 Monitoring 1 0.27
3 Evaluation 1 0.27
4 Entry Point activity 4 1.1
5 Institution and Capacity Building 5 1.37
6 Detailed Project Report 1 0.27
7 Watershed Development Works 50 13.73
8 Livelihood activities for asset less 10 2.75
9 Production systems and micro-enterprises 13 3.57
10 Consolidation phase 5 1.37
TOTAL 100 27.46
Sapavada
1 Administrative costs 10 7.23
2 Monitoring 1 0.72
3 Evaluation 1 0.72
4 Entry Point activity 4 2.89
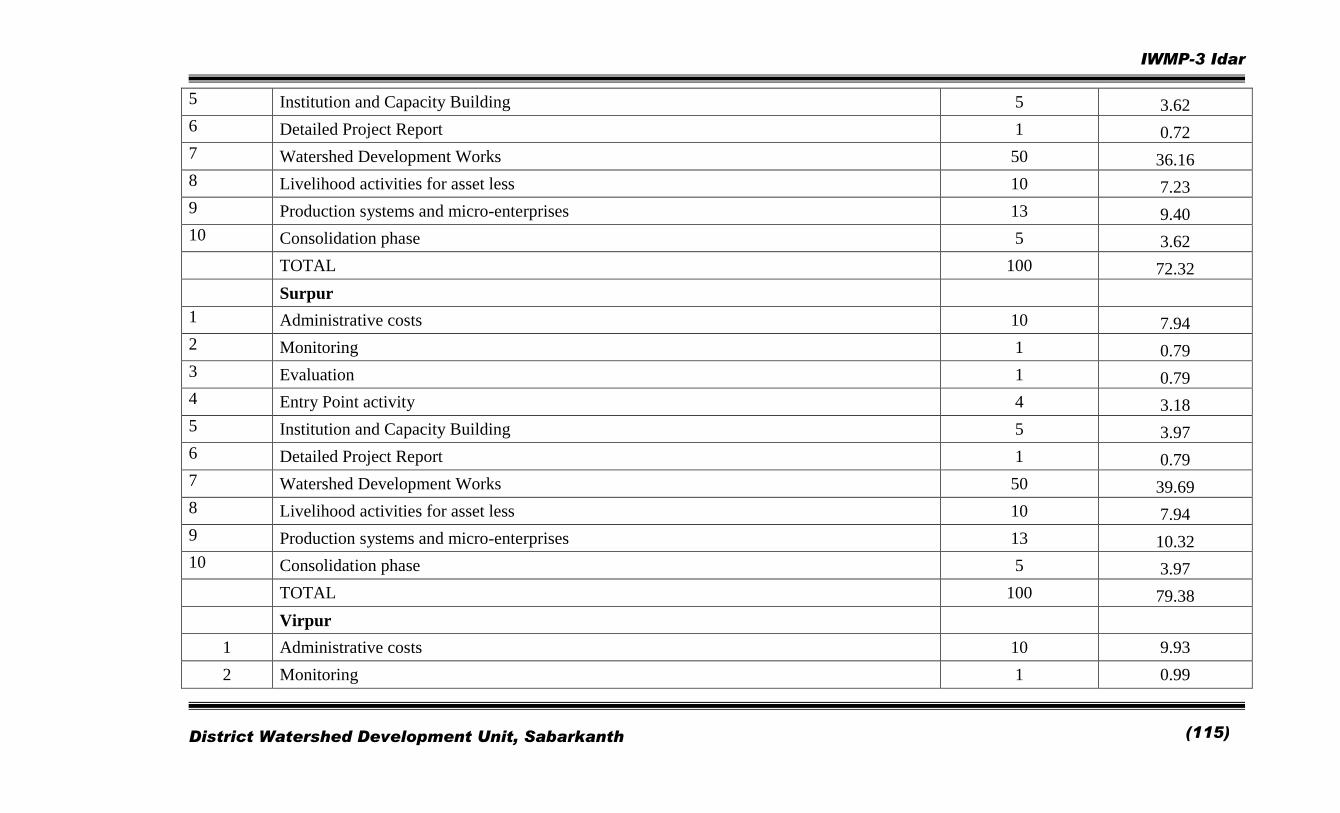
IWMP-3 Idar
District Watershed Development Unit, Sabarkanth
(115)
5 Institution and Capacity Building 5 3.62
6 Detailed Project Report 1 0.72
7 Watershed Development Works 50 36.16
8 Livelihood activities for asset less 10 7.23
9 Production systems and micro-enterprises 13 9.40
10 Consolidation phase 5 3.62
TOTAL 100 72.32
Surpur
1 Administrative costs 10 7.94
2 Monitoring 1 0.79
3 Evaluation 1 0.79
4 Entry Point activity 4 3.18
5 Institution and Capacity Building 5 3.97
6 Detailed Project Report 1 0.79
7 Watershed Development Works 50 39.69
8 Livelihood activities for asset less 10 7.94
9 Production systems and micro-enterprises 13 10.32
10 Consolidation phase 5 3.97
TOTAL 100 79.38
Virpur
1 Administrative costs 10 9.93
2 Monitoring 1 0.99
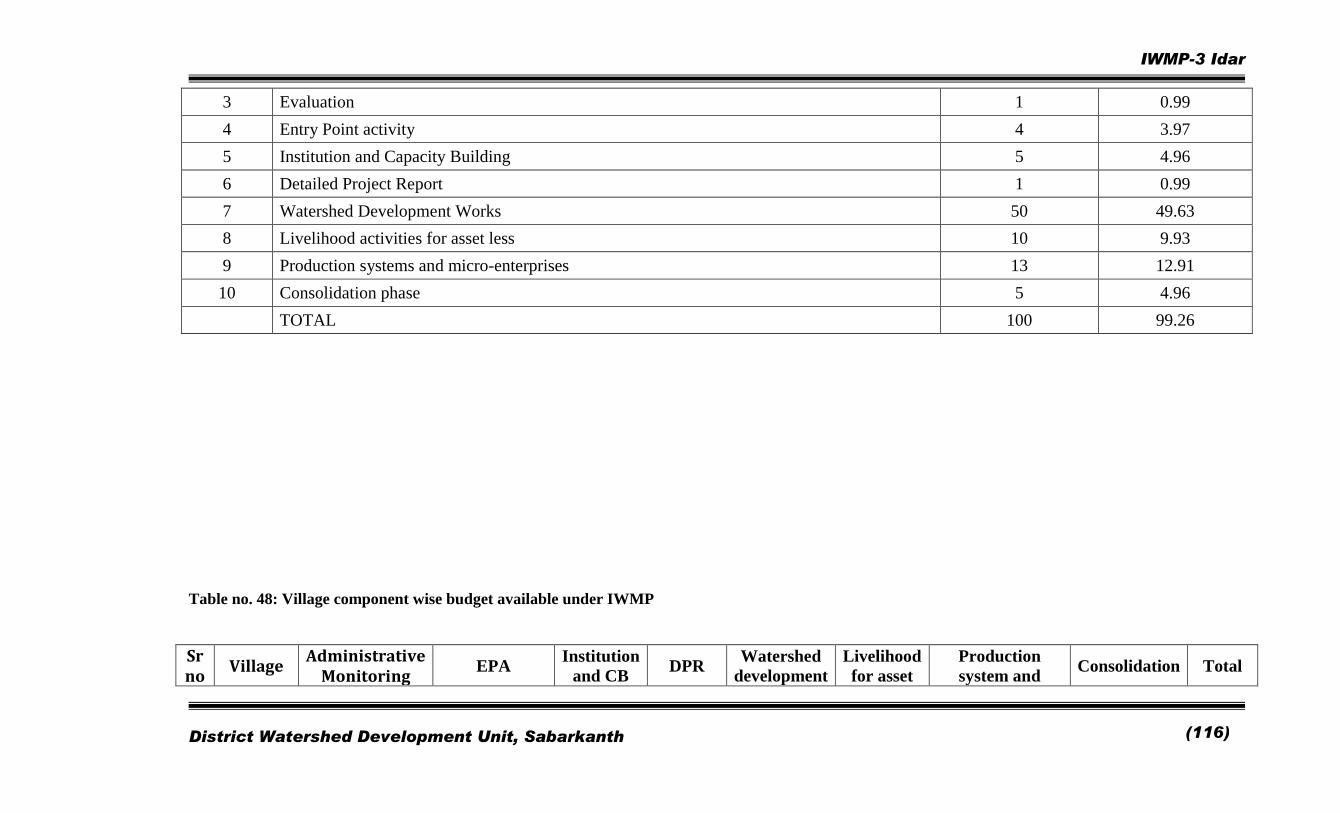
IWMP-3 Idar
District Watershed Development Unit, Sabarkanth
(116)
3 Evaluation 1 0.99
4 Entry Point activity 4 3.97
5 Institution and Capacity Building 5 4.96
6 Detailed Project Report 1 0.99
7 Watershed Development Works 50 49.63
8 Livelihood activities for asset less 10 9.93
9 Production systems and micro-enterprises 13 12.91
10 Consolidation phase 5 4.96
TOTAL 100 99.26
Table no. 48: Village component wise budget available under IWMP
Sr no
Village Administrative
Monitoring EPA
Institution
and CB DPR
Watershed
development
Livelihood
for asset
Production
system and Consolidation Total
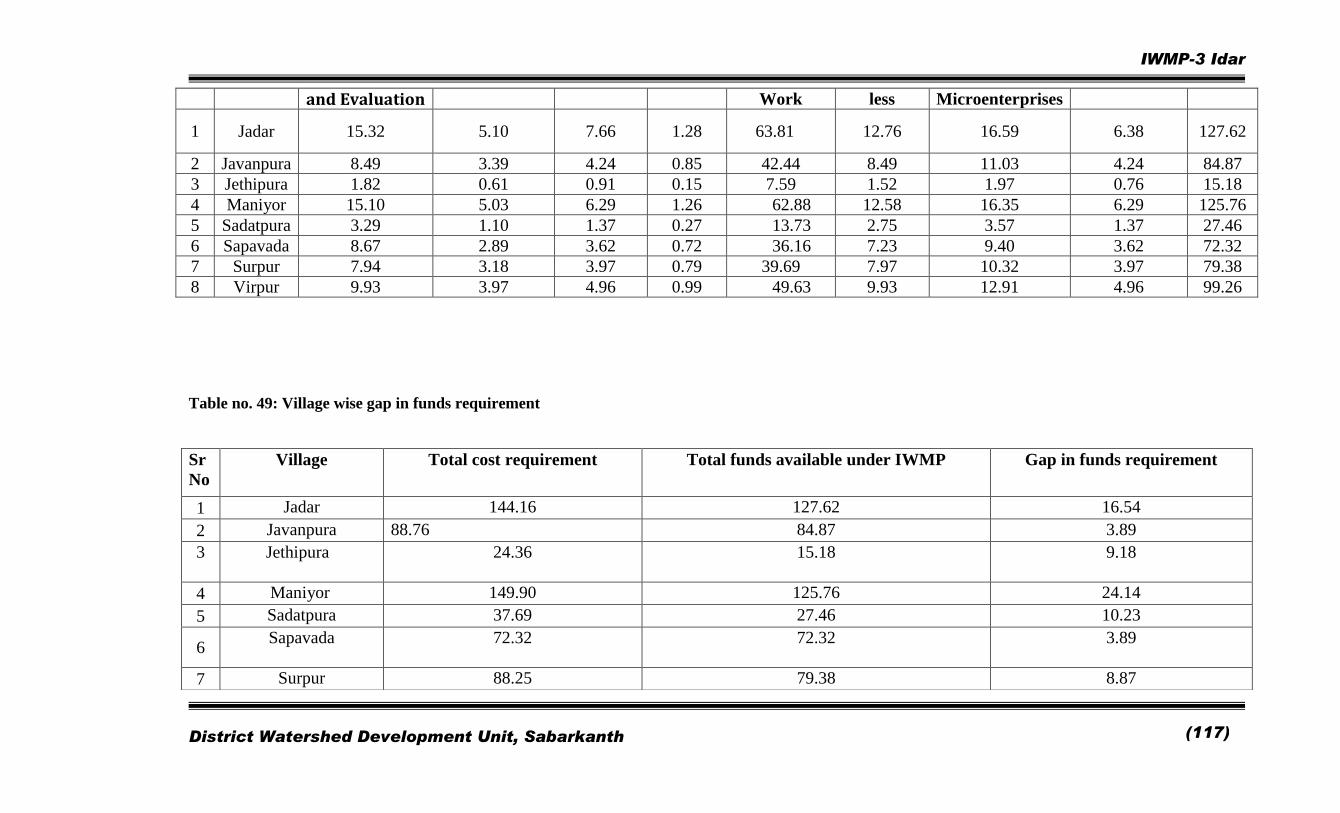
IWMP-3 Idar
District Watershed Development Unit, Sabarkanth
(117)
and Evaluation Work less Microenterprises
1 Jadar 15.32 5.10 7.66 1.28 63.81 12.76 16.59 6.38 127.62
2 Javanpura 8.49 3.39 4.24 0.85 42.44 8.49 11.03 4.24 84.87
3 Jethipura 1.82 0.61 0.91 0.15 7.59 1.52 1.97 0.76 15.18
4 Maniyor 15.10 5.03 6.29 1.26 62.88 12.58 16.35 6.29 125.76
5 Sadatpura 3.29 1.10 1.37 0.27 13.73 2.75 3.57 1.37 27.46
6 Sapavada 8.67 2.89 3.62 0.72 36.16 7.23 9.40 3.62 72.32
7 Surpur 7.94 3.18 3.97 0.79 39.69 7.97 10.32 3.97 79.38
8 Virpur 9.93 3.97 4.96 0.99 49.63 9.93 12.91 4.96 99.26
Table no. 49: Village wise gap in funds requirement
Sr
No
Village Total cost requirement Total funds available under IWMP Gap in funds requirement
1 Jadar 144.16 127.62 16.54
2 Javanpura 88.76 84.87 3.89
3
Jethipura 24.36 15.18 9.18
4 Maniyor 149.90 125.76 24.14
5 Sadatpura 37.69 27.46 10.23
6 Sapavada 72.32 72.32 3.89
7 Surpur 88.25 79.38 8.87
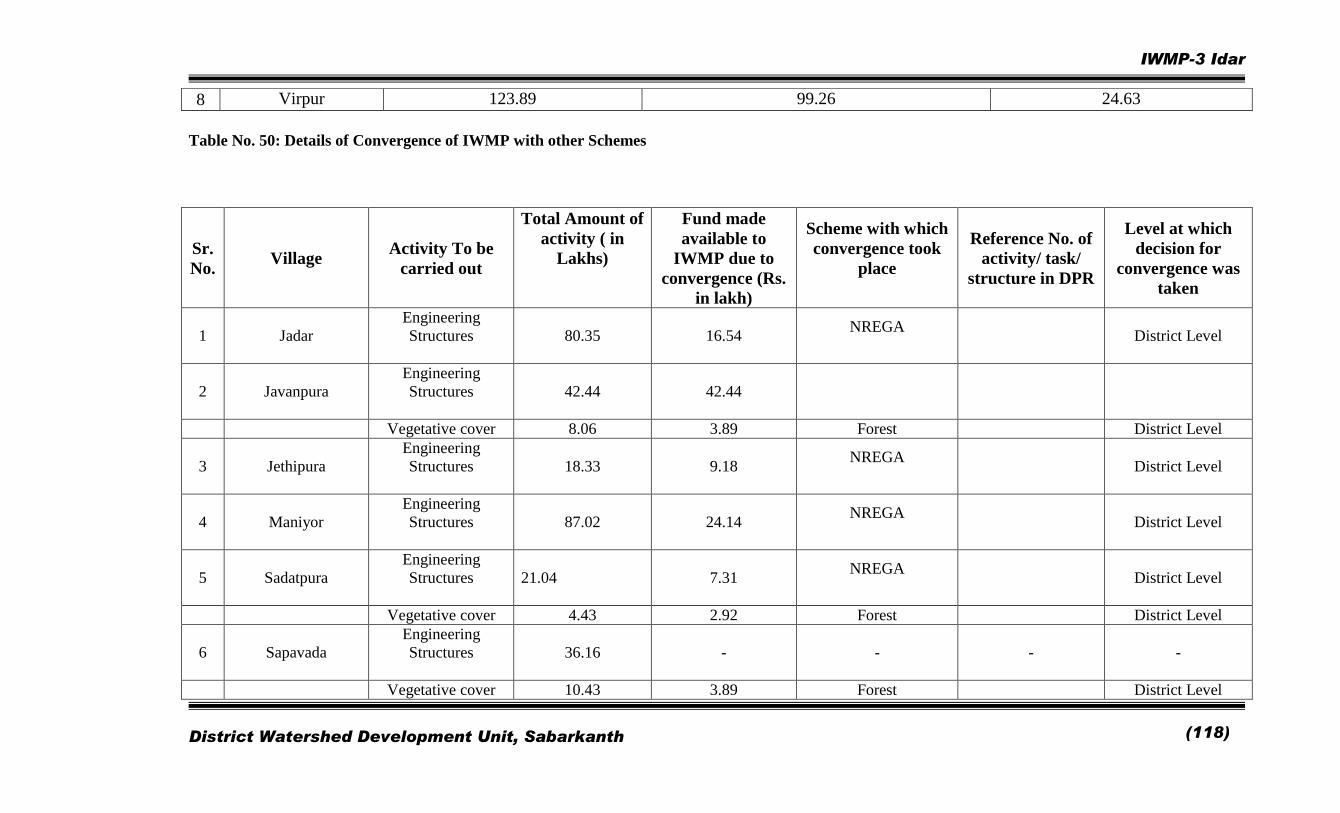
IWMP-3 Idar
District Watershed Development Unit, Sabarkanth
(118)
Table No. 50: Details of Convergence of IWMP with other Schemes
Sr.
No. Village
Activity To be
carried out
Total Amount of
activity ( in
Lakhs)
Fund made
available to
IWMP due to
convergence (Rs.
in lakh)
Scheme with which
convergence took
place
Reference No. of
activity/ task/
structure in DPR
Level at which
decision for
convergence was
taken
1 Jadar
Engineering
Structures
80.35 16.54 NREGA
District Level
2 Javanpura
Engineering
Structures
42.44 42.44
Vegetative cover 8.06 3.89 Forest District Level
3 Jethipura
Engineering
Structures
18.33 9.18 NREGA
District Level
4 Maniyor
Engineering
Structures
87.02 24.14 NREGA
District Level
5 Sadatpura
Engineering
Structures
21.04 7.31 NREGA
District Level
Vegetative cover 4.43 2.92 Forest District Level
6 Sapavada
Engineering
Structures
36.16 - - - -
Vegetative cover 10.43 3.89 Forest District Level
8 Virpur 123.89 99.26 24.63
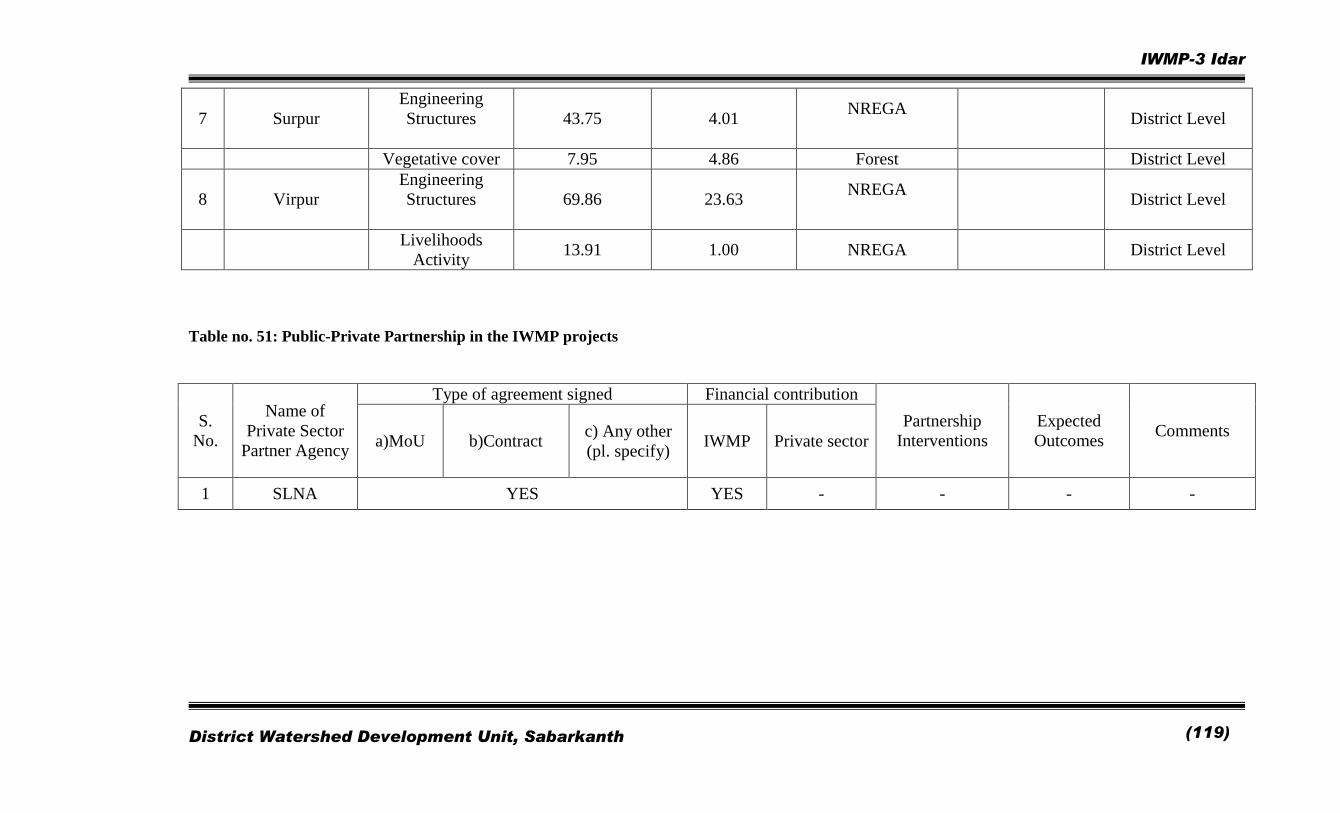
IWMP-3 Idar
District Watershed Development Unit, Sabarkanth
(119)
7 Surpur
Engineering
Structures
43.75 4.01 NREGA
District Level
Vegetative cover 7.95 4.86 Forest District Level
8 Virpur
Engineering
Structures
69.86 23.63 NREGA
District Level
Livelihoods
Activity 13.91 1.00 NREGA District Level
Table no. 51: Public-Private Partnership in the IWMP projects
S.
No.
Name of
Private Sector
Partner Agency
Type of agreement signed Financial contribution
Partnership
Interventions
Expected
Outcomes Comments
a)MoU b)Contract c) Any other
(pl. specify) IWMP Private sector
1 SLNA YES YES - - - -

IWMP-3 Idar
District Watershed Development Unit, Sabarkanth
(120)
CHAPTER – 6
EXPECTED OUTCOMES
Expected Outcome
Employment
Employment has always been a problem in the village. The principal occupations of the people are dry land agriculture, animal husbandry and casual
labor work. However, rain fall being very limited and erratic, agriculture suffers, i.e. at best they can take only a single crop, which keeps them partially
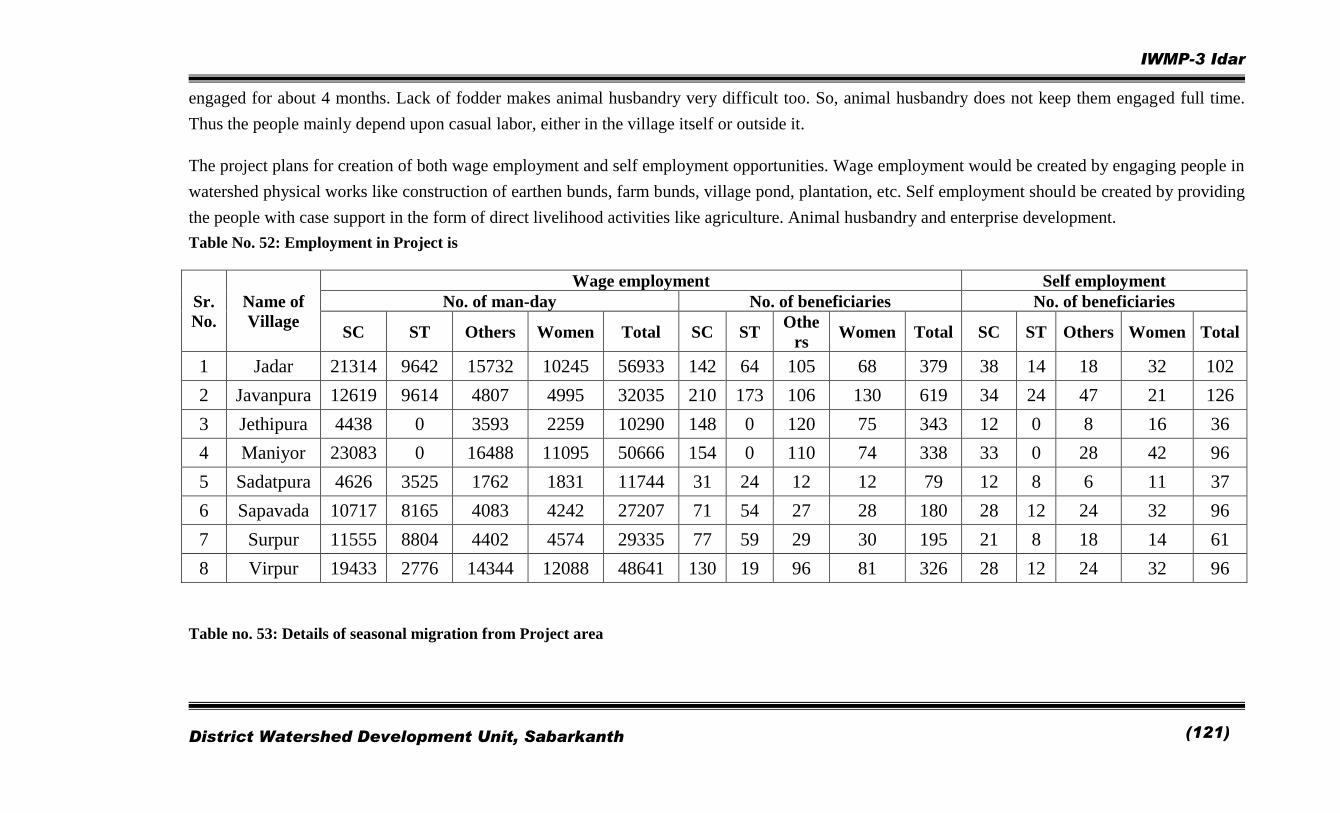
IWMP-3 Idar
District Watershed Development Unit, Sabarkanth
(121)
engaged for about 4 months. Lack of fodder makes animal husbandry very difficult too. So, animal husbandry does not keep them engaged full time.
Thus the people mainly depend upon casual labor, either in the village itself or outside it.
The project plans for creation of both wage employment and self employment opportunities. Wage employment would be created by engaging people in
watershed physical works like construction of earthen bunds, farm bunds, village pond, plantation, etc. Self employment should be created by providing
the people with case support in the form of direct livelihood activities like agriculture. Animal husbandry and enterprise development.
Table No. 52: Employment in Project is
Sr.
No.
Name of
Village
Wage employment Self employment
No. of man-day No. of beneficiaries No. of beneficiaries
SC ST Others Women Total SC ST Othe
rs Women Total SC ST Others Women Total
1 Jadar 21314 9642 15732 10245 56933 142 64 105 68 379 38 14 18 32 102
2 Javanpura 12619 9614 4807 4995 32035 210 173 106 130 619 34 24 47 21 126
3 Jethipura 4438 0 3593 2259 10290 148 0 120 75 343 12 0 8 16 36
4 Maniyor 23083 0 16488 11095 50666 154 0 110 74 338 33 0 28 42 96
5 Sadatpura 4626 3525 1762 1831 11744 31 24 12 12 79 12 8 6 11 37
6 Sapavada 10717 8165 4083 4242 27207 71 54 27 28 180 28 12 24 32 96
7 Surpur 11555 8804 4402 4574 29335 77 59 29 30 195 21 8 18 14 61
8 Virpur 19433 2776 14344 12088 48641 130 19 96 81 326 28 12 24 32 96
Table no. 53: Details of seasonal migration from Project area
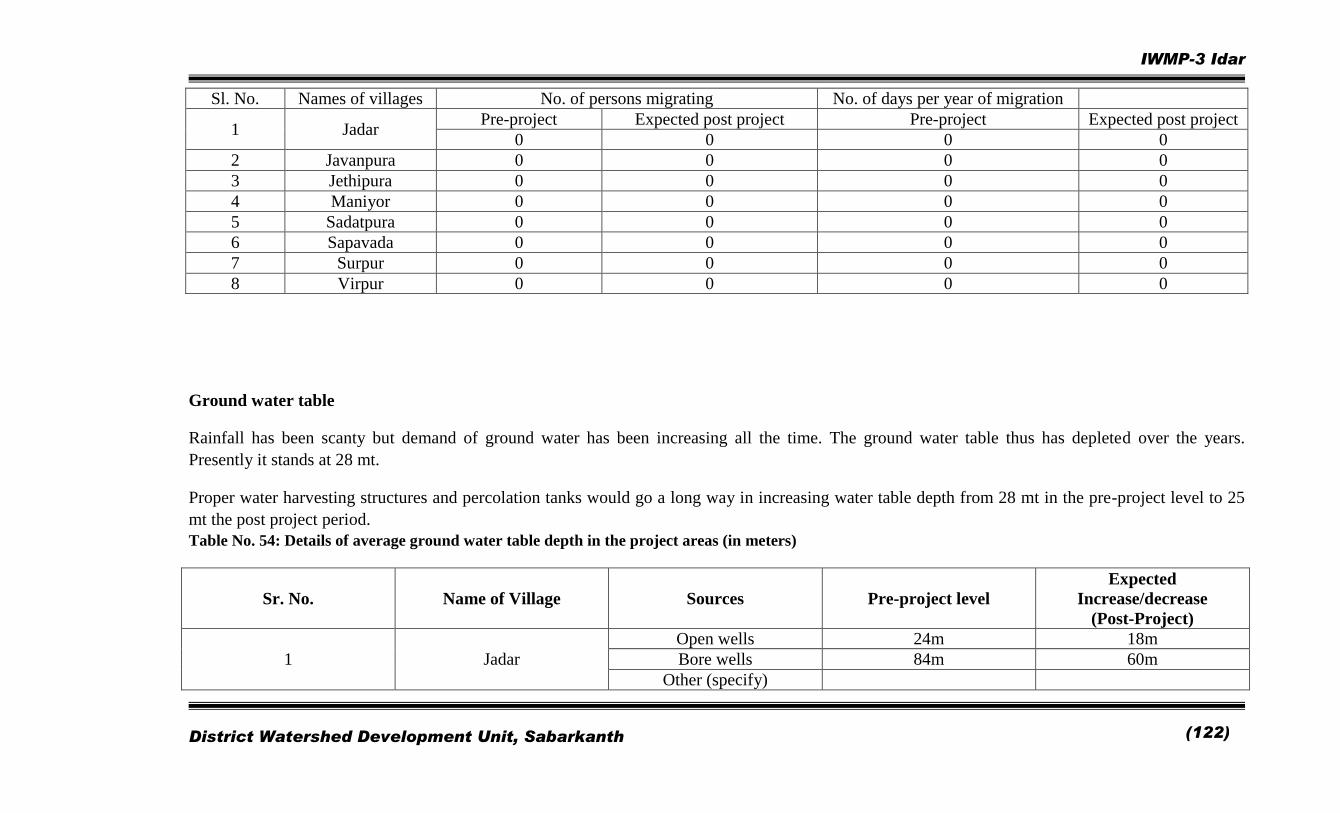
IWMP-3 Idar
District Watershed Development Unit, Sabarkanth
(122)
Sl. No. Names of villages No. of persons migrating No. of days per year of migration
1 Jadar Pre-project Expected post project Pre-project Expected post project
0 0 0 0
2 Javanpura 0 0 0 0
3 Jethipura 0 0 0 0
4 Maniyor 0 0 0 0
5 Sadatpura 0 0 0 0
6 Sapavada 0 0 0 0
7 Surpur 0 0 0 0
8 Virpur 0 0 0 0
Ground water table
Rainfall has been scanty but demand of ground water has been increasing all the time. The ground water table thus has depleted over the years.
Presently it stands at 28 mt.
Proper water harvesting structures and percolation tanks would go a long way in increasing water table depth from 28 mt in the pre-project level to 25
mt the post project period.
Table No. 54: Details of average ground water table depth in the project areas (in meters)
Sr. No. Name of Village Sources Pre-project level
Expected
Increase/decrease
(Post-Project)
1 Jadar
Open wells 24m 18m
Bore wells 84m 60m
Other (specify)
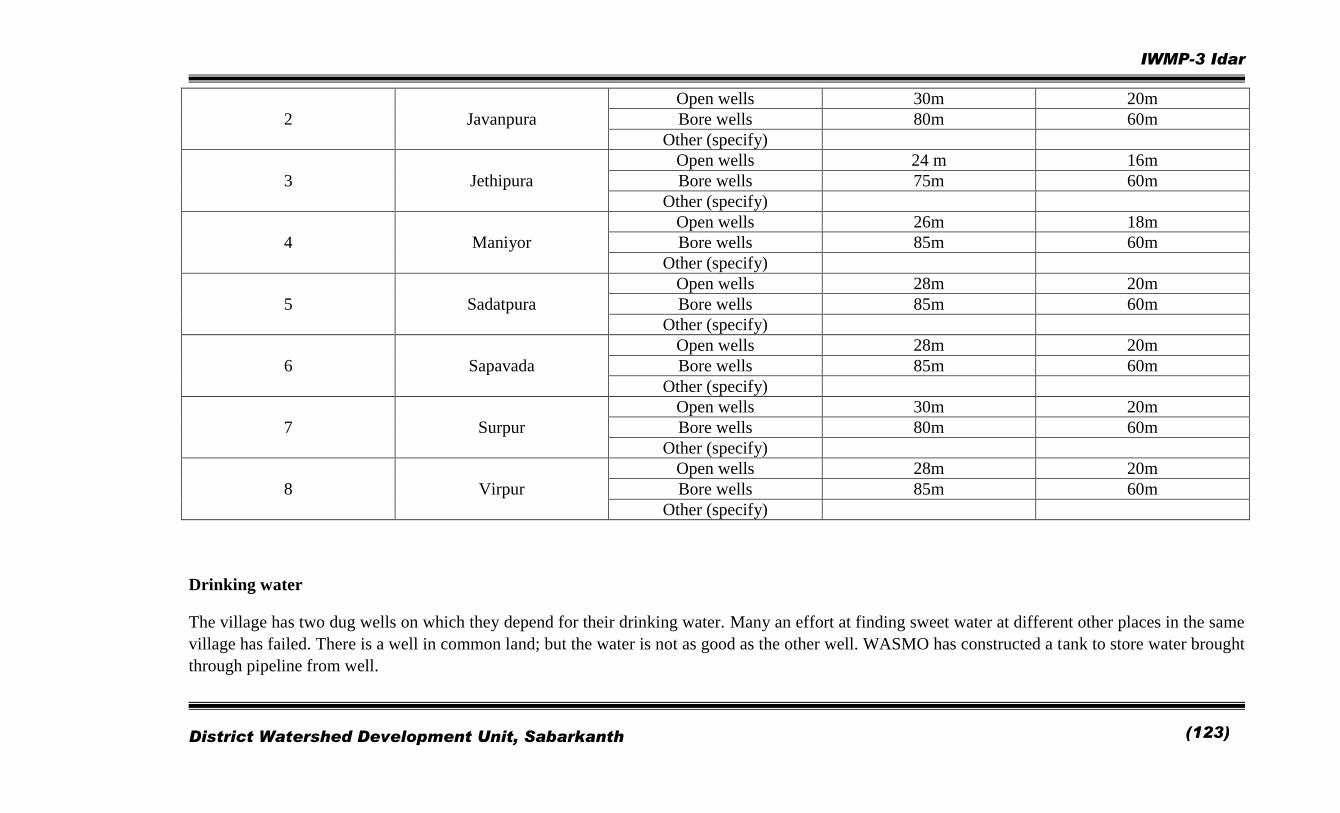
IWMP-3 Idar
District Watershed Development Unit, Sabarkanth
(123)
2 Javanpura
Open wells 30m 20m
Bore wells 80m 60m
Other (specify)
3 Jethipura
Open wells 24 m 16m
Bore wells 75m 60m
Other (specify)
4 Maniyor
Open wells 26m 18m
Bore wells 85m 60m
Other (specify)
5 Sadatpura
Open wells 28m 20m
Bore wells 85m 60m
Other (specify)
6 Sapavada
Open wells 28m 20m
Bore wells 85m 60m
Other (specify)
7 Surpur
Open wells 30m 20m
Bore wells 80m 60m
Other (specify)
8 Virpur
Open wells 28m 20m
Bore wells 85m 60m
Other (specify)
Drinking water
The village has two dug wells on which they depend for their drinking water. Many an effort at finding sweet water at different other places in the same
village has failed. There is a well in common land; but the water is not as good as the other well. WASMO has constructed a tank to store water brought
through pipeline from well.
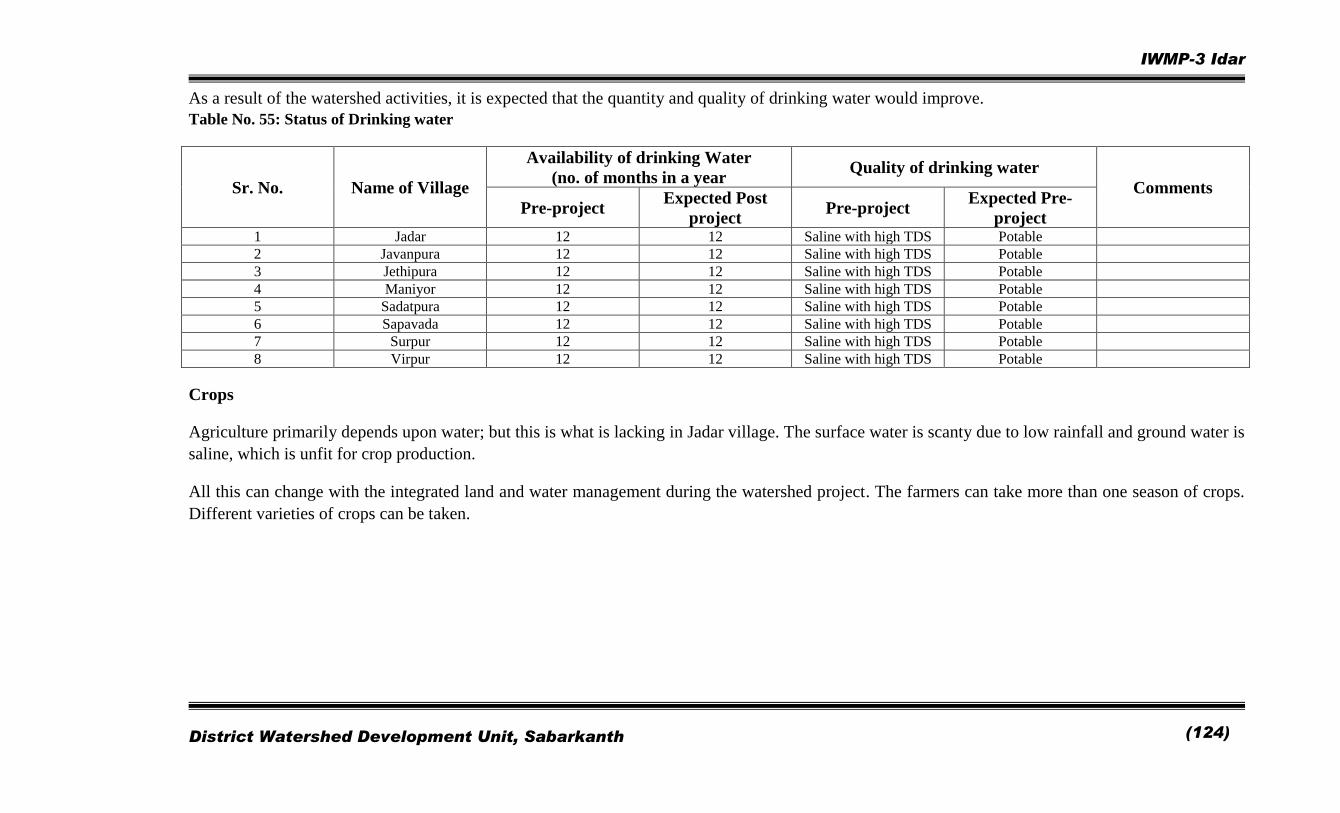
IWMP-3 Idar
District Watershed Development Unit, Sabarkanth
(124)
As a result of the watershed activities, it is expected that the quantity and quality of drinking water would improve.
Table No. 55: Status of Drinking water
Sr. No. Name of Village
Availability of drinking Water
(no. of months in a year Quality of drinking water
Comments
Pre-project Expected Post
project Pre-project
Expected Pre-
project 1 Jadar 12 12 Saline with high TDS Potable
2 Javanpura 12 12 Saline with high TDS Potable
3 Jethipura 12 12 Saline with high TDS Potable
4 Maniyor 12 12 Saline with high TDS Potable
5 Sadatpura 12 12 Saline with high TDS Potable
6 Sapavada 12 12 Saline with high TDS Potable
7 Surpur 12 12 Saline with high TDS Potable
8 Virpur 12 12 Saline with high TDS Potable
Crops
Agriculture primarily depends upon water; but this is what is lacking in Jadar village. The surface water is scanty due to low rainfall and ground water is
saline, which is unfit for crop production.
All this can change with the integrated land and water management during the watershed project. The farmers can take more than one season of crops.
Different varieties of crops can be taken.
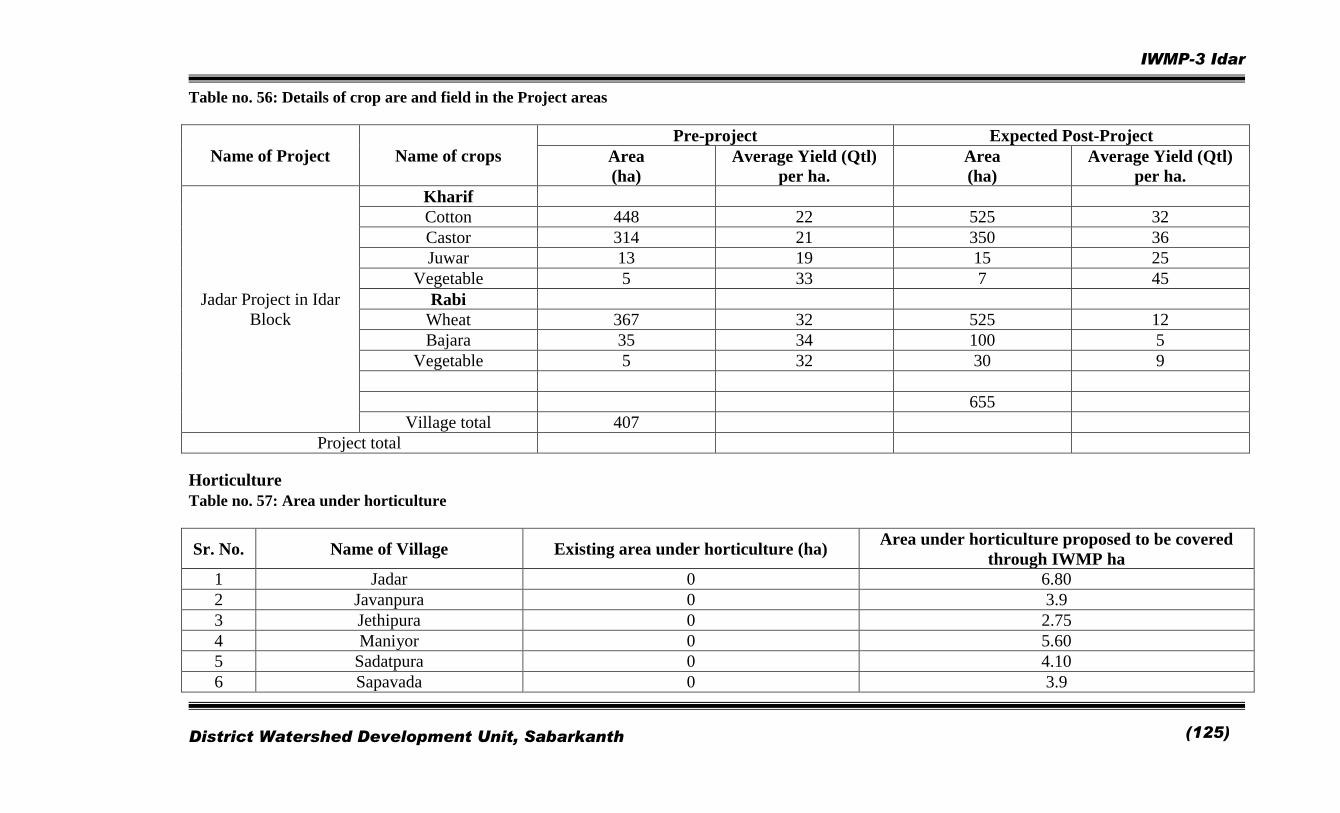
IWMP-3 Idar
District Watershed Development Unit, Sabarkanth
(125)
Table no. 56: Details of crop are and field in the Project areas
Name of Project Name of crops
Pre-project Expected Post-Project
Area
(ha)
Average Yield (Qtl)
per ha.
Area
(ha)
Average Yield (Qtl)
per ha.
Jadar Project in Idar
Block
Kharif
Cotton 448 22 525 32
Castor 314 21 350 36
Juwar 13 19 15 25
Vegetable 5 33 7 45
Rabi
Wheat 367 32 525 12
Bajara 35 34 100 5
Vegetable 5 32 30 9
655
Village total 407
Project total
Horticulture
Table no. 57: Area under horticulture
Sr. No. Name of Village Existing area under horticulture (ha) Area under horticulture proposed to be covered
through IWMP ha
1 Jadar 0 6.80
2 Javanpura 0 3.9
3 Jethipura 0 2.75
4 Maniyor 0 5.60
5 Sadatpura 0 4.10
6 Sapavada 0 3.9
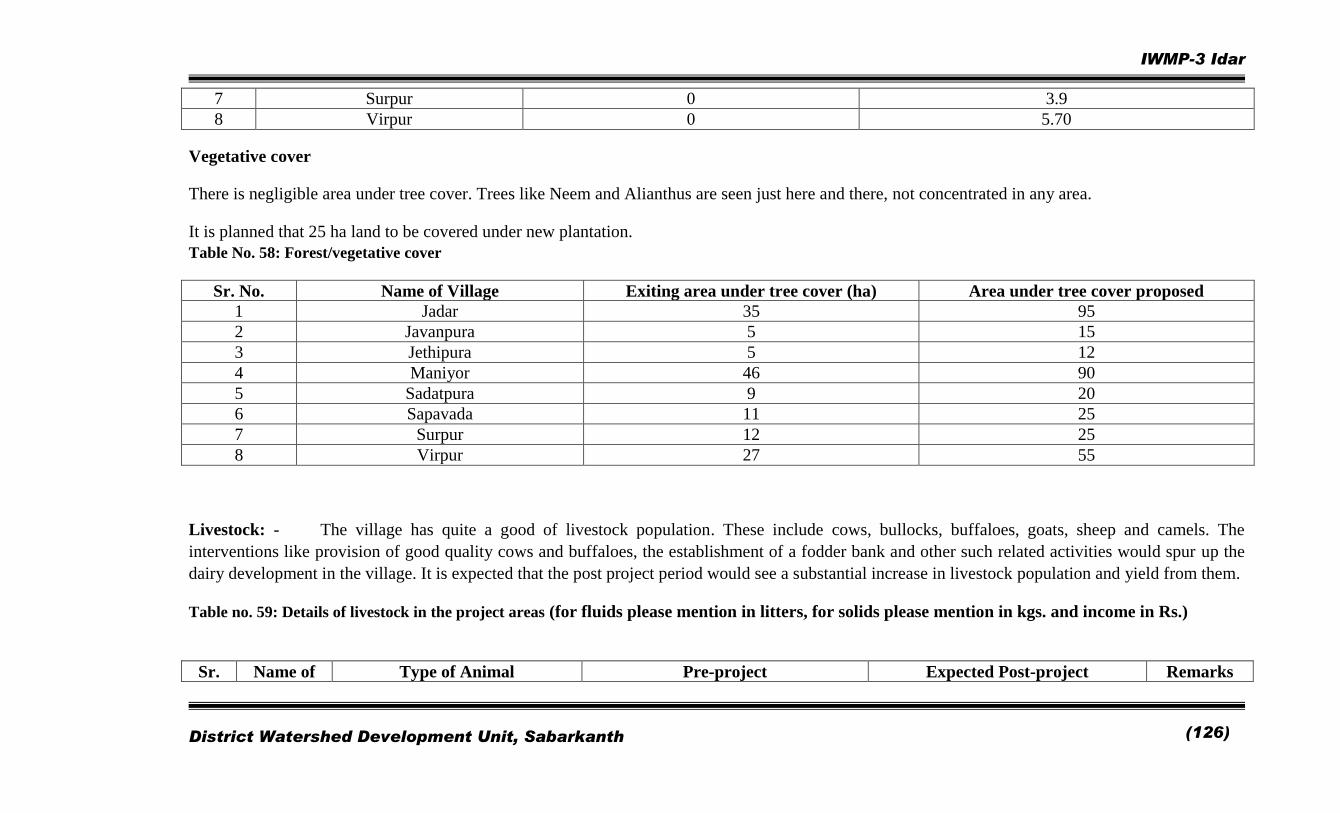
IWMP-3 Idar
District Watershed Development Unit, Sabarkanth
(126)
7 Surpur 0 3.9
8 Virpur 0 5.70
Vegetative cover
There is negligible area under tree cover. Trees like Neem and Alianthus are seen just here and there, not concentrated in any area.
It is planned that 25 ha land to be covered under new plantation.
Table No. 58: Forest/vegetative cover
Sr. No. Name of Village Exiting area under tree cover (ha) Area under tree cover proposed
1 Jadar 35 95
2 Javanpura 5 15
3 Jethipura 5 12
4 Maniyor 46 90
5 Sadatpura 9 20
6 Sapavada 11 25
7 Surpur 12 25
8 Virpur 27 55
Livestock: - The village has quite a good of livestock population. These include cows, bullocks, buffaloes, goats, sheep and camels. The
interventions like provision of good quality cows and buffaloes, the establishment of a fodder bank and other such related activities would spur up the
dairy development in the village. It is expected that the post project period would see a substantial increase in livestock population and yield from them.
Table no. 59: Details of livestock in the project areas (for fluids please mention in litters, for solids please mention in kgs. and income in Rs.)
Sr. Name of Type of Animal Pre-project Expected Post-project Remarks

IWMP-3 Idar
District Watershed Development Unit, Sabarkanth
(127)
No. Village No. Yield Income No. Yield Income
1 Jadar Milk-animal
Cow (per animal/day) 245 1960 29400 300 3000 45000
Buffalo (per animal/day) 925 9250 185000 1000 12000 240000
2 Javanpura Milk-animal
Cow (per animal/day) 30 16500 495000
Buffalo (per animal/day) 30 31500 945000
3 Jethipura Milk-animal
Cow (per animal/day) 150 1200 18000 225 2250 36000
Buffalo (per animal/day) 65 650 13000 95 1140 23940
4 Maniyor Milk-animal
Cow (per animal/day) 166 1328 19920 200 2000 30000
Buffalo (per animal/day) 345 3450 69000 450 5400 108000
5 Sadatpura Milk-animal
Cow (per animal/day) 115 920 13800 200 2000 30000
Buffalo (per animal/day) 318 3180 63600 400 4800 96000
6 Sapavada Milk-animal
Cow (per animal/day) 400 3200 48000 500 5000 75000
Buffalo (per animal/day) 235 2350 47000 325 3900 78000
7 Surpur Milk-animal
Cow (per animal/day) 400 4000 60000 500 6000 108000
Buffalo (per animal/day) 235 1880 37600 350 3500 80500
8 Virpur Milk-animal
Cow (per animal/day) 250 2500 37500 350 3850 57750
Buffalo (per animal/day) 1000 8000 160000 1200 12000 240000
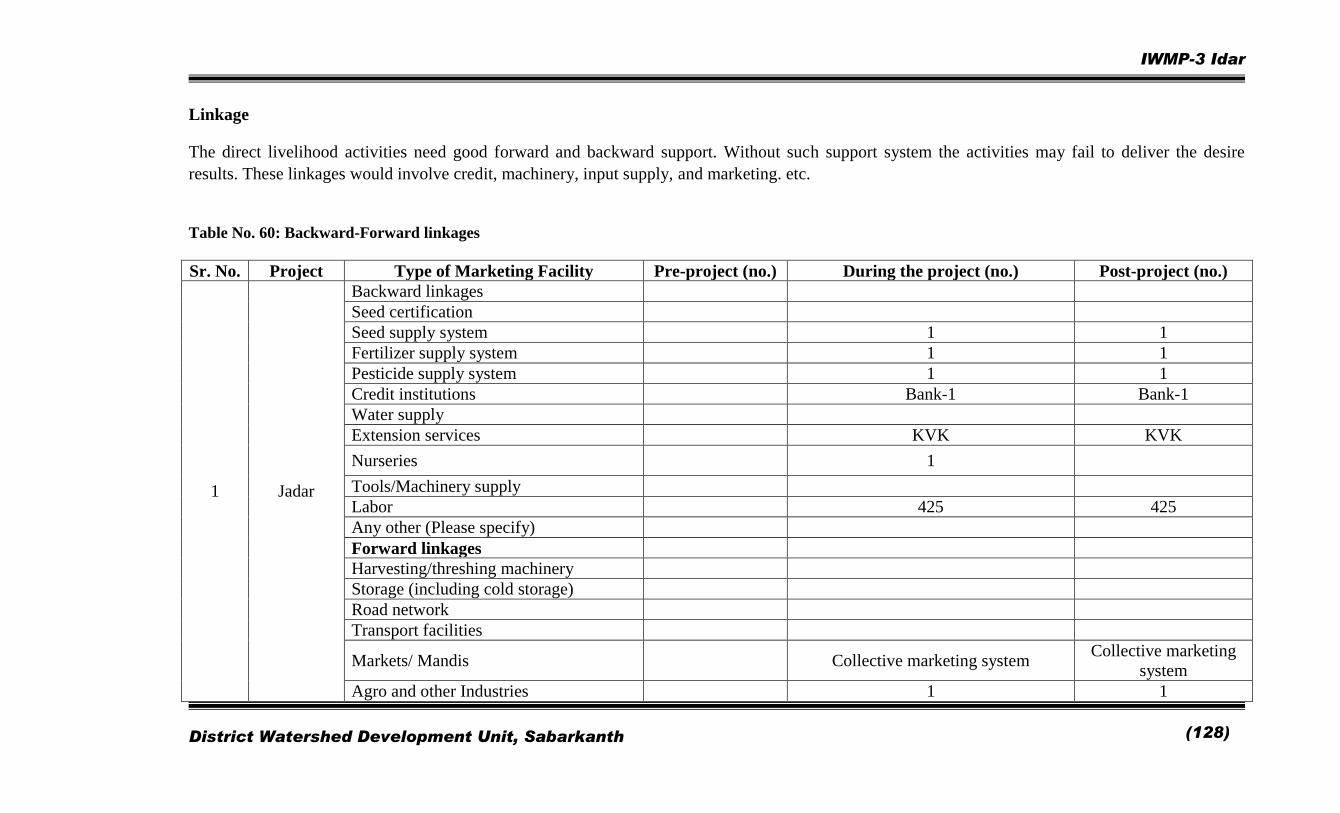
IWMP-3 Idar
District Watershed Development Unit, Sabarkanth
(128)
Linkage
The direct livelihood activities need good forward and backward support. Without such support system the activities may fail to deliver the desire
results. These linkages would involve credit, machinery, input supply, and marketing. etc.
Table No. 60: Backward-Forward linkages
Sr. No. Project Type of Marketing Facility Pre-project (no.) During the project (no.) Post-project (no.)
1 Jadar
Backward linkages
Seed certification
Seed supply system 1 1
Fertilizer supply system 1 1
Pesticide supply system 1 1
Credit institutions Bank-1 Bank-1
Water supply
Extension services KVK KVK
Nurseries 1
Tools/Machinery supply
Labor 425 425
Any other (Please specify)
Forward linkages
Harvesting/threshing machinery
Storage (including cold storage)
Road network
Transport facilities
Markets/ Mandis Collective marketing system Collective marketing
system
Agro and other Industries 1 1
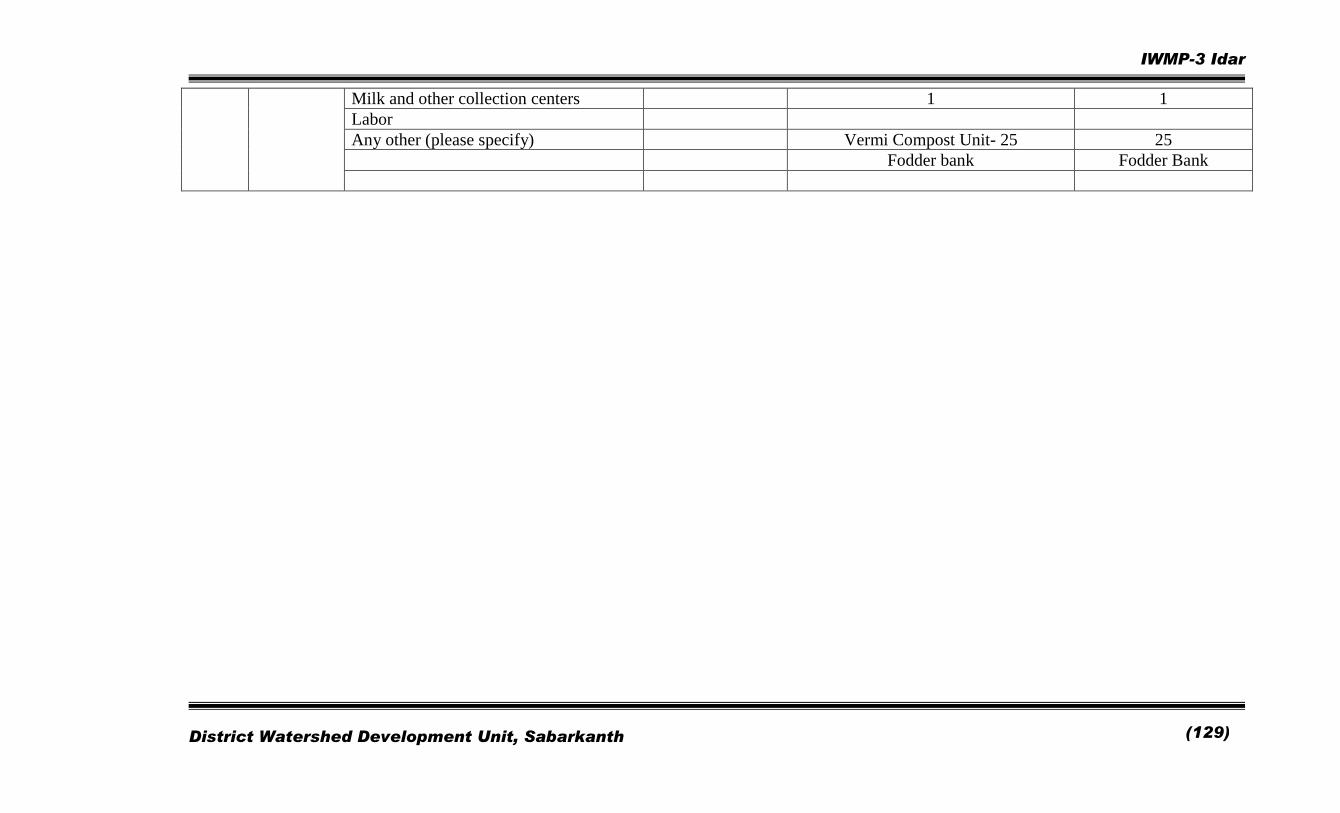
IWMP-3 Idar
District Watershed Development Unit, Sabarkanth
(129)
Milk and other collection centers 1 1
Labor
Any other (please specify) Vermi Compost Unit- 25 25
Fodder bank Fodder Bank
IWMP-3 Idar
District Watershed Development Unit, Sabarkanth
(130)
CHAPTER – 7
QUALITY AND SUSTAINABILITY ISSUES
IWMP-3 Idar
District Watershed Development Unit, Sabarkanth
(131)
Quality and Sustainability Issues
Plans for Monitoring and Evaluation
A Web-based GIS System is being developed for monitoring and Jadaruating the project in its planning & implementation phase. The system
would be available on a public domain and can be accessed by all the stakeholders of the project. The system shows the entire state of Gujarat and all of
those areas selected over the next 18 years. Filtering allows the user to zoom onto one particular project. Details related to soil type, and-use
classification, inhabitation etc., can be obtained village-wise. Furthermore, survey-number wise details related to ownership, irrigation source, field etc.,
can also be accessed by the users of the system. This system is being used for pooling up the details obtained from the DPR. In other words, the DPR is
made available online in the from of a database which will help the stakeholders know areas of importance viz., already treated areas/historical works in
the area, proposed areas for treatment etc., for further treatment and planning. The system would also show the satellite imageries of various years from
the project inception stage to the project closing stage. This allows the user to Jadaruate the effectiveness of the treatment and thereby plans corrective
measure for the project area. The system would serve as an aiding tool to the planners and Jadaruators for judging the efficacy of the project.
Yet another component of the web-based GIS system is the Mobile base Monitoring Jadaruation System, which will help the ground staff alias
WDTs (Watershed Development Team) to transmit information from the ground level to the central server. Also, any higher-up official in charge of the
project can obtain information regarding the project area on their mobile phone by means of an SMS. The system works in the following manner. The
WDT equipped with a GPS instrument marks the latitude-longitude information of various treatment areas during the DPR. The probable site is then
transferred onto the central server. During the works phase, any progress in treatment areas in reported to the server by means of the SMS by the WDT.
Similarly, any nodal officer or higher-up official can view the progress in a project by means of summarized reports generated over frequent periods of
time
Plans For Project management:
The Project management of any watershed programme is very important. It mainly depends upon the community organization and the village
level institutes. In Jadar, watershed committee and various user group have been formulated for post project operation and maintenance of assets created
during project period. Major emphasis will be on equity and sustainable benefit of the project even after implementation stage. A proper line-up will be
build during project period with various institutes and capacity building organization. They will act as a major kingpin during post implementation for
IWMP-3 Idar
District Watershed Development Unit, Sabarkanth
(132)
Scaling up the successful experience during project.
Watershed Development Fund:
The major source of financial assistance after post implementation period is watershed Development Fund. The contribution of it will comes
mainly fund the following.
User Charges:
Various user groups will be formed in village. These user groups will collect user charges according to the designated rules formed during the
formation of user group. These funds will be transferred to the WDF funds as per these formulated rules. The secretary of watershed committee (WC)
shall maintain the record of the following.
IWMP-3 Idar
District Watershed Development Unit, Sabarkanth
(133)