Embed Size (px)
Citation preview
International Transaction Journal of Engineering, Management, & Applied Sciences & Technologies
http://TuEngr.com
Effect of Modeling Parameters on System Hydrodynamics of Air Reactor in Chemical Looping Combustion Using CFD Simulation
Piriya Laiarpatorn a, Pornpote Piumsomboon a,b, Benjapon Chalermsinsuwan a,b,*
a Department of Chemical Technology, Faculty of Science, Chulalongkorn University, THAILAND b Center of Excellence on Petrochemical and Materials Technology, Chulalongkorn University, THAILAND A R T I C L E I N F O
A B S T RA C T
Article history: Received 25 October 2013 Received in revised form 25 October 2013 Accepted 25 October 2013 Available online 25 October 2013 Keywords: Computational fluid dynamics; Chemical looping combustion; Modeling parameter; Multiphase flow
The system hydrodynamics or flow behavior of gas and solid particles was simulated using computational fluid dynamic (CFD) model inside air reactor of chemical looping combustion (CLC). The two fluid model or Euler-Euler model was selected to use together with the kinetic theory of granular flow model (KGTF). In this study, the effect of modeling parameters including drag coefficient model, specularity coefficient and restitution coefficient between solid particles were explored. The EMMS drag model gave the highest solid volume fraction inside the system due to the particle cluster assumption in the model development. The specularity coefficient and restitution coefficient between solid particles had slightly effect on the results. In addition, the obtained results were compared with literature experiment by Shuai et al. (2012). The radial profiles of solid concentration from CFD simulation were consistent with the experimental data. The conventional core-annulus flow structure was still observed in the air reactor.
2014 INT TRANS J ENG MANAG SCI TECH.
1. Introduction Nowadays, the amount of released CO2 into the atmosphere is the main reason for global
warming problem. The recent literature shows that the circulating fluidized bed (CFB)
2014 International Transaction Journal of Engineering, Management, & Applied Sciences & Technologies.
*Corresponding author (B.Chalermsinsuwan). E-mail address: [email protected] 2014. International Transaction Journal of Engineering, Management, & Applied Sciences & Technologies. Volume 5 No.1 ISSN 2228-9860 eISSN 1906-9642. Online available at http://tuengr.com/V05/0039.pdf .
39

technology has been widely applied in many industrial purposes. One of the applications is to
use CFB technology for CO2 capture from power generation using the chemical looping
combustion (CLC) (Shuai et al., 2012). In other CO2 capture processes, the separation of CO2
from the N2 requires significant energy and expense. However, CO2 separation is easily
achieved in CLC which provides a self sequestration of CO2 stream (Mahalatkar et al.,
2011a). The typical CLC is consisting of two fluidized bed reactors connecting together
(Shuai et al., 2012; Samruamphianskun et al., 2012). Fuel reactor is used for providing
oxygen from metal bed material for combustion reaction while air reactor is employed for
reducing the metal bed material before sending them back to the fuel reactor. Generally, the
metal bed material is an oxygen carrier for oxidizing or transferring oxygen in the air reactor.
For the research study about computational fluid dynamics simulation (CFD), Mahalatkar et
al. (2011b) successfully studied the CFD modeling of methane combustion in fuel reactor of
CLC system. The result demonstrated that CFD modeling could be an effective approach for
the designing of such reactor. Their CFD model precisely predicted the trends of flue gas
concentrations. For the CFD simulation of air reactor in CLC, Shuai et al. (2012) simulated
CFB with cluster structure-dependent (CSD) drag coefficient model. They observed that the
CSD drag coefficient model accurately predicted dynamic formation and dissolution of solid
particle clusters. The derivation of this model is based on the particle cluster concept in a
heterogeneous gas-solid particles flow system. Then, the model was used to predict system
hydrodynamics in CLC. The contour of solid particles was dense near the wall and dilute at
the center which generally called the core-annulus flow structure. Lu et al. (2011) revealed
that EMMS-based drag coefficient showed good physical predictability flow behavior of both
Geldart A and B in the riser. Still, in the previous literature, the suitable or optimum operating
condition for simulation of air reactor in CLC reactor system was not clearly studied.
In this study, the flow behavior of gas and solid particles was investigated using CFD
model inside air reactor of CLC. The main objective was to explain the obtained system
hydrodynamics dynamics inside CLC system. The selected numerical model to simulate flow
behavior of gas and solid particles was the two-fluid model or Euler-Euler model. This model
treats each phases as fully interpenetrating continua (Cruz et al., 2006; Samruamphianskun et
al., 2012). Different modeling parameters were varied to explore the effect of each parameter.
The obtained CFD simulation results were validated with the experimental results published
in the literature study.
40 Piriya Laiarpatorn, Pornpote Piumsomboon, and Benjapon Chalermsinsuwan

2. Methodology In this simulation, the ANSYS FLUENT 14.0 was used. The two-dimensional air reactor in
CLC had 0.0762 m diameter and 6.10 m height. For two-dimensional system, the solid particles
were fed from two system sides into the air reactor and flowed out at the top of the air reactor.
The physical properties and simulation settings are listed in Table 1 (Shuai et al., 2011a; 2012).
The solid particle was laid in Geldart A classification. Here, six drag coefficient models, four
different specularity coefficients and four different solid particle-solid particle restitution
coefficients were compared with the experimental results by Shuai et al. (2012).
Table 1: Parameters used in this study CFD simulation.
Description Value Diameter of the air reactor (m) Height of the air reactor (m) Operating pressure (atm) Operating temperature (K) Gas viscosity (kg/m s) Gas density (kg/m3) Solid particle density (kg/m3) Solid particle diameter (μm) Solid particle-solid particle coefficient of restitution (-) Wall-solid particle coefficient of restitution (-) Specularity coefficient (-) Maximum solid volume fraction (-)
0.0762 6.10
1 293.15
1.85×10⁻⁵ 1.20 1,600
70
0.97 (vary)
0.90 0.00001 (vary)
0.40
The computational domain was drawn using the commercial computer aided design (CAD)
program, GAMBIT (Samruamphianskun et al., 2012). The used computational domain of the
air reactor in CLC had 3,500, 6,500, 9,500 and 12,500 cells as shown in Figure 1.
Figure 1: The computational domains of air reactor in CLC with (a) 3,500 cells, (b) 6,500 cells,
(c) 9,500 cells and (d) 12,500 cells.
2.1 Mathematical model In this study, the used numerical model of gas-solid particle two-phase flow was the
*Corresponding author (B.Chalermsinsuwan). E-mail address: [email protected] 2014. International Transaction Journal of Engineering, Management, & Applied Sciences & Technologies. Volume 5 No.1 ISSN 2228-9860 eISSN 1906-9642. Online available at http://tuengr.com/V05/0039.pdf .
41

Euler-Euler (Eulerian) model. With this model, the conservation equations of mass and
momentum for the gas and solid particle phases were separately considered based on their
system hydrodynamic properties. For hydrodynamics study, the energy conservation for the gas
and solid phases was ignored (Shuai et al., 2011b; Chalermsinsuwan et al., 2012). The
temperature of gas phase and solid particle phase then was assumed to be a constant. The
conservation equations of mass, momentum and solid particle phase fluctuating energy with
their constitutive equations are summarized below. In this study, the constitutive equations
based on the kinetic theory of granular flow were needed to close the conservation equations.
2.1.1 Conservation equations
The mass conservation is balanced by the convective mass flux for the gas phase (g) and
the solid particle phase (s):
𝜕𝜕𝑡�𝜀𝑔𝜌𝑔� + ∇�𝜀𝑔𝜌𝑔𝑉𝑔� = 0 (1)
𝜕𝜕𝑡
(𝜀𝑠𝜌𝑠) + ∇(𝜀𝑠𝜌𝑠𝑉𝑠) = 0 (2)
where 𝜀 is the concentration of each phase, V is the velocity, 𝜌 is the density and t is the
time. Here, the mass exchange between the phases due to chemical reaction was not considered.
The momentum conservation equation is balanced by the convective mass fluxes and the
other forces such as pressure, gravity, stress tensor and momentum interphase exchange
coefficient.
𝜕𝜕𝑡�𝜀𝑔𝜌𝑔𝑉𝑔� + ∇�𝜀𝑔𝜌𝑔𝑉𝑔𝑉𝑔� = −𝜀𝑔∇𝑃 + ∇𝜏𝑔 + 𝜀𝑔𝜌𝑔𝑔 − 𝛽𝑔𝑠�𝑉𝑔 − 𝑉𝑠� (3)
𝜕𝜕𝑡
(𝜀𝑠𝜌𝑠𝑉𝑠) + ∇(𝜀𝑠𝜌𝑠𝑉𝑠𝑉𝑠) = −𝜀𝑠∇𝑃 + ∇𝜏𝑠 + 𝜀𝑠𝜌𝑠𝑔 + 𝛽𝑔𝑠�𝑉𝑔 − 𝑉𝑠� (4)
where g is the gravity acceleration, P is the pressure, 𝛽 is the interphase momentum
transfer coefficient or drag model and 𝜏 is the stress tensor.
The fluctuating kinetic energy conservation equation for the solid particles, as derived
from the kinetic theory of granular flow (Gidaspow, 1994; Gidaspow and Jiradilok, 2009;
Chalermsinsuwan et al., 2012), can be expressed as:
42 Piriya Laiarpatorn, Pornpote Piumsomboon, and Benjapon Chalermsinsuwan
32�𝜕𝜕𝑡
(𝜀𝑠𝜌𝑠𝜃) + ∇(𝜀𝑠𝜌𝑠𝜃)𝑉𝑠� = (−∇𝑃𝑠𝐼 + 𝜏𝑠) ∶ ∇𝑉𝑠 + ∇(𝐾𝑠∇𝜃) − 𝛾𝑠 (5)
where 𝜃 is the solid fluctuating kinetic energy, 𝐾𝑠 is the conductivity of solid fluctuating
kinetic energy, I is unit vector and 𝛾𝑠 is the collisional dissipation of solid fluctuating kinetic
energy.
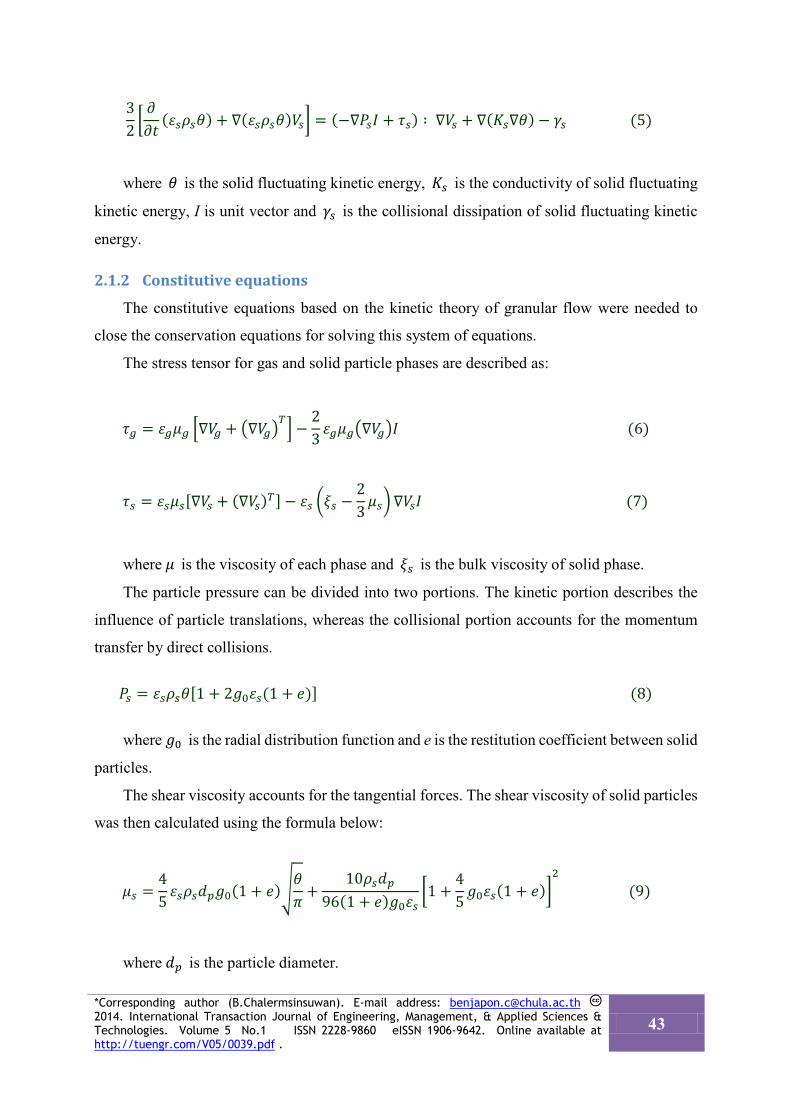
2.1.2 Constitutive equations
The constitutive equations based on the kinetic theory of granular flow were needed to
close the conservation equations for solving this system of equations.
The stress tensor for gas and solid particle phases are described as:
𝜏𝑔 = 𝜀𝑔𝜇𝑔 �∇𝑉𝑔 + �∇𝑉𝑔�𝑇� −
23𝜀𝑔𝜇𝑔�∇𝑉𝑔�𝐼 (6)
𝜏𝑠 = 𝜀𝑠𝜇𝑠[∇𝑉𝑠 + (∇𝑉𝑠)𝑇] − 𝜀𝑠 �𝜉𝑠 −23𝜇𝑠� ∇𝑉𝑠𝐼 (7)
where 𝜇 is the viscosity of each phase and 𝜉𝑠 is the bulk viscosity of solid phase.
The particle pressure can be divided into two portions. The kinetic portion describes the
influence of particle translations, whereas the collisional portion accounts for the momentum
transfer by direct collisions.
𝑃𝑠 = 𝜀𝑠𝜌𝑠𝜃[1 + 2𝑔0𝜀𝑠(1 + 𝑒)] (8)
where 𝑔0 is the radial distribution function and e is the restitution coefficient between solid
particles.
The shear viscosity accounts for the tangential forces. The shear viscosity of solid particles
was then calculated using the formula below:
𝜇𝑠 =45𝜀𝑠𝜌𝑠𝑑𝑝𝑔0(1 + 𝑒)�
𝜃𝜋
+10𝜌𝑠𝑑𝑝
96(1 + 𝑒)𝑔0𝜀𝑠�1 +
45𝑔0𝜀𝑠(1 + 𝑒)�
2
(9)
where 𝑑𝑝 is the particle diameter.
*Corresponding author (B.Chalermsinsuwan). E-mail address: [email protected] 2014. International Transaction Journal of Engineering, Management, & Applied Sciences & Technologies. Volume 5 No.1 ISSN 2228-9860 eISSN 1906-9642. Online available at http://tuengr.com/V05/0039.pdf .
43

The bulk viscosity formulates the resistance of solid particles to comparison and
expansion.
𝜉𝑠 =43𝜀𝑠𝜌𝑠𝑑𝑝𝑔0(1 + 𝑒)�
𝜃𝜋
(10)
The radial distribution function is the probability of collisions between solid particles when
they become dense:
𝑔0 = �1 − �𝜀𝑠
𝜀𝑠,𝑚𝑎𝑥�13�
�
−1
(11)
where 𝜀𝑠,𝑚𝑎𝑥 is the volume fraction of solid phase at maximum packing condition.
The conductivity of the solid fluctuating kinetic energy specifies the diffusion of granular
energy as:
𝐾𝑠 =150𝜌𝑠𝑑𝑝√𝜃𝜋384(1 + 𝑒)𝑔0
�1 +65𝜀𝑠𝑔0(1 + 𝑒)�
2
+ 2𝜌𝑠𝜀𝑠2𝑑𝑝(1 + 𝑒)𝑔0�𝜃𝜋
(12)
The rate of dissipation of fluctuation kinetic energy due to solid particle collision is
expressed as:
𝛾𝑠 = 3(1 − 𝑒2)𝜀𝑠2𝜌𝑠𝑔0𝜃 �4𝑑𝑝�𝜃𝜋� (13)
2.1.3 Drag coefficient model
In this study, the commercial ANSYS FLUENT 14.0 program with six drag or interphase
exchanged coefficient models was explored. The drag coefficient model is the mathematical
function which represents the dynamics of solid particles that is described by the product of the
interphase momentum exchange coefficient and the slip velocity in the momentum transport
equations. The high and low values of drag coefficient model imply more and less
anti-translation force of solid particles inside the system, respectively. In this study, the
employed drag models were Wen and Yu model, Gidaspow model, Huilin-Gidaspow model,
Gibilaro model, Syamlal and O’Brien model and EMMS model (Fluent, Inc., 2011a, 2011b).
44 Piriya Laiarpatorn, Pornpote Piumsomboon, and Benjapon Chalermsinsuwan

The Syamlal-O’Brien model is based on measurements of the terminal velocities of solid
particles in fluidized or settling beds, with correlations that are a function of the volume
fraction and relative Reynolds number (Fluent, Inc., 2011a, 2011b).
𝛽𝑔𝑠 =34
(1 − 𝜀𝑔)𝜀𝑔𝑉𝑟,𝑠2 𝑑𝑝
𝜌𝑔𝑅𝑒𝑠𝑉𝑟,𝑠
𝐶𝐷�𝑉𝑔 − 𝑉𝑠� (14)
With
𝑉𝑟,𝑠 = 0.5 �𝐴 − 0.06𝑅𝑒𝑠 + �(0.06𝑅𝑒𝑠)2 + 0.12𝑅𝑒𝑠(2𝐵 − 𝐴) + 𝐴2� (15)
where 𝑉𝑟,𝑠 is terminal velocity correlation for the solid particle phase.
𝑅𝑒𝑠 =𝜀𝑔�𝑉𝑔 − 𝑉𝑠�𝑑𝑝
𝜇𝑔;𝐶𝐷 = �0.63 +
4.8�𝑅𝑒𝑠/𝑉𝑟,𝑠
�2
(16)
𝐴 = 𝜀𝑔4.14; for𝜀𝑔 ≤ 0.85, 𝐵 = 0.8𝜀𝑔1.28 and for 𝜀𝑔 > 0.85, 𝐵 = 𝜀𝑔2.65
The Wen and Yu model is appropriate for dilute system simulation (Wen and Yu, 1966).
𝛽𝑔𝑠 = 3
4(1−𝜀𝑔)𝜀𝑔
𝑑𝑝𝜌𝑔�𝑉𝑔 − 𝑉𝑠�𝐶𝐷0𝜀𝑔−2.65 (17),
where 𝐶𝐷 = 24𝜀𝑔𝑅𝑒𝑠
[1 + 0.15 ��1 − 𝜀𝑔�𝑅𝑒𝑠�0.687
,𝑅𝑒𝑠 = 𝜌𝑔𝑑𝑝�𝑉𝑠−𝑉𝑔�𝜇𝑔
The Gidaspow model is a combination of the Wen and Yu model equation for dilute phase
calculation and the Ergun equation for dense phase calculation (Gidaspow et al., 1992; Huilin
et al., 2003).
For 𝜀𝑔 > 0.8:
𝛽𝑔𝑠 =34�1 − 𝜀𝑔�𝜀𝑔
𝑑𝑝𝜌𝑔𝐶𝐷𝜀𝑔−2.65�𝑉𝑠 − 𝑉𝑔� (18)
For 𝜀𝑔 ≤ 0.8
𝛽𝑔𝑠 =150(1 − 𝜀𝑔)2𝜇𝑔
𝜀𝑔𝑑𝑝2+
1.75𝜌𝑔�1 − 𝜀𝑔��𝑉𝑠 − 𝑉𝑔�𝑑𝑝
(19)
*Corresponding author (B.Chalermsinsuwan). E-mail address: [email protected] 2014. International Transaction Journal of Engineering, Management, & Applied Sciences & Technologies. Volume 5 No.1 ISSN 2228-9860 eISSN 1906-9642. Online available at http://tuengr.com/V05/0039.pdf .
45

Huilin-Gidaspow model is also a combination of the Wen and Yu model and Ergun
equation. However, the smooth switch is provided by the function when the solid volume
fraction is less than 0.2. (Du et al., 2006):
𝛽𝑔𝑠 = Ψ𝛽𝑔𝑠−𝐸𝑟𝑔𝑢𝑛| + (1 −Ψ)𝛽𝑔𝑠−𝑊𝑒𝑛 𝑎𝑛𝑑 𝑌𝑢 (20)
Where Ψ = 12
+ arctan (262.5�1−𝜀𝑔�−0.2))𝜋
Gibilaro model provides the continuous single compact equation over the entire range of
voidages for a fluidized bed system (Du et al., 2006):
𝛽𝑔𝑠 = �18𝑅𝑒
+ 0.33�𝜌𝑓�𝑉𝑠 − 𝑉𝑔�
𝑑𝑝�1 − 𝜀𝑔�𝜀𝑔 − 1.8 (21)
with 𝑅𝑒 = 𝜀𝑔𝜌𝑔𝑑𝑝�𝑉𝑠−𝑉𝑔�𝜇𝑔
The last drag model is energy minimization multi-scale (EMMS) model that develops
based on the particle cluster concept. This drag model includes the effect of heterogeneous
structure parameters into the momentum interphase coefficient model (Chalermsinsuwan et al,
2009; 2010).
For 𝜀𝑔 ≤ 0.74:
𝛽𝑔𝑠 = 150�1 − 𝜀𝑔�
2𝜇𝑔
𝜀𝑔𝑑𝑝2+ 1.75
�1 − 𝜀𝑔�𝜌𝑔�𝑉𝑔 − 𝑉𝑠�𝑑𝑝
(22)
For 𝜀𝑔 > 0.74:
𝛽𝑔𝑠 =34�1 − 𝜀𝑔�𝜀𝑔
𝑑𝑝𝜌𝑔�𝑉𝑔 − 𝑉𝑠�𝐶𝐷0𝜔�𝜀𝑔� (23)
With
0.74 < 𝜀𝑔 ≤ 0.82;
𝜔�𝜀𝑔� = −0.5769 +0.0214
4�𝜀𝑔 − 0.7463�2
+ 0.0044 (24)
46 Piriya Laiarpatorn, Pornpote Piumsomboon, and Benjapon Chalermsinsuwan
0.82 < 𝜀𝑔 ≤ 0.97;
𝜔�𝜀𝑔� = −0.0101 +0.0038
4�𝜀𝑔 − 0.7789�2
+ 0.0040 (25)
𝜀𝑔 > 0.97;
𝜔�𝜀𝑔� = −31.8295 + 32.8295𝜀𝑔 (26)
3. Results and discussion In this CFD simulation, the system hydrodynamics or flow behavior of solid particles
inside air reactor of CLC was discussed and compared with experimental data by Shuai et al. (2012). In addition, the effects of various modeling parameters were discussed.
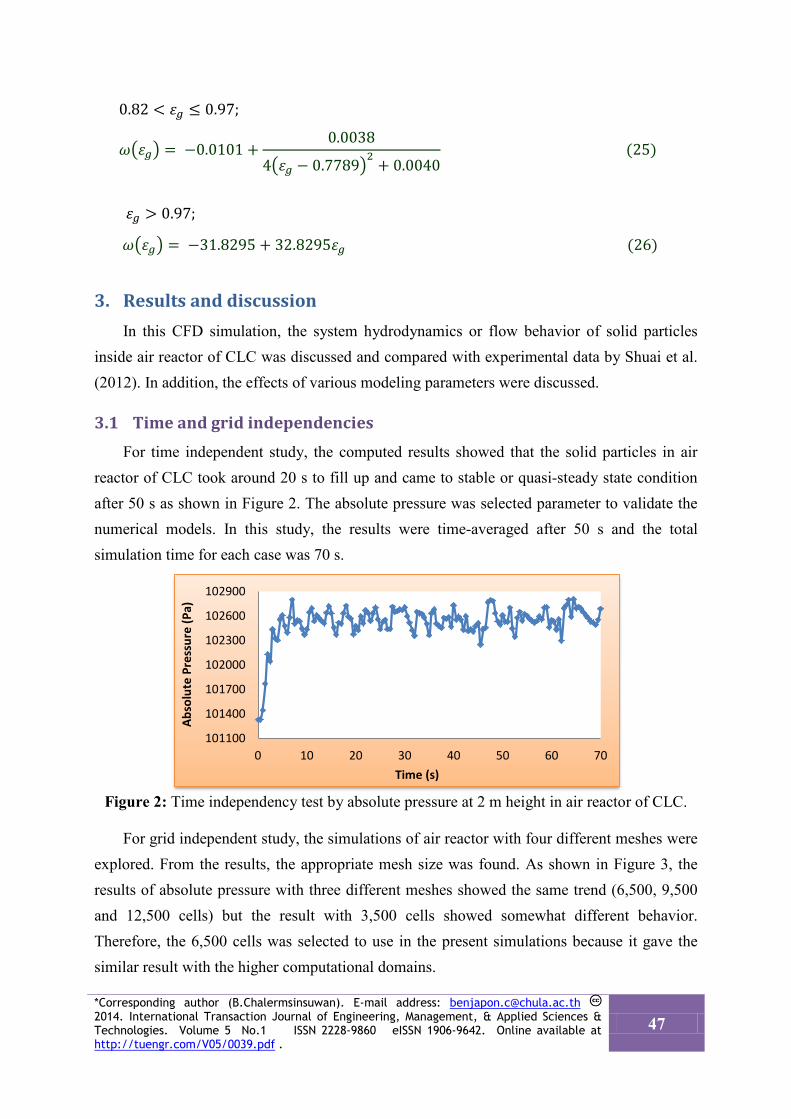
3.1 Time and grid independencies For time independent study, the computed results showed that the solid particles in air
reactor of CLC took around 20 s to fill up and came to stable or quasi-steady state condition after 50 s as shown in Figure 2. The absolute pressure was selected parameter to validate the numerical models. In this study, the results were time-averaged after 50 s and the total simulation time for each case was 70 s.
Figure 2: Time independency test by absolute pressure at 2 m height in air reactor of CLC.
For grid independent study, the simulations of air reactor with four different meshes were
explored. From the results, the appropriate mesh size was found. As shown in Figure 3, the results of absolute pressure with three different meshes showed the same trend (6,500, 9,500 and 12,500 cells) but the result with 3,500 cells showed somewhat different behavior. Therefore, the 6,500 cells was selected to use in the present simulations because it gave the similar result with the higher computational domains.
101100
101400
101700
102000
102300
102600
102900
0 10 20 30 40 50 60 70
Abso
lute
Pre
ssur
e (P
a)
Time (s)
*Corresponding author (B.Chalermsinsuwan). E-mail address: [email protected] 2014. International Transaction Journal of Engineering, Management, & Applied Sciences & Technologies. Volume 5 No.1 ISSN 2228-9860 eISSN 1906-9642. Online available at http://tuengr.com/V05/0039.pdf .
47

Figure 3: Grid independency test by axial absolute pressure profile in air reactor of CLC.
Figure 4: Effect of six drag coefficient models on concentration of solid particles for (a) radial
direction at 5 m height and (b) axial direction.
0
1
2
3
4
5
6
80000 90000 100000 110000 120000
Heig
ht (m
)
Absolute pressure (Pa)
3500
6500
9500
12500
0.00
0.05
0.10
0.15
0.20
0.0 0.2 0.4 0.6 0.8 1.0
Conc
entr
atio
n of
solid
par
itcle
s (-)
Dimensionless radial distance (-)
GibilaroGidaspowHuilin-GidaspowEMMSSyamlal-O'BrienWen- Yu
a
0
1
2
3
4
5
6
7
0.00 0.05 0.10 0.15 0.20
Heig
ht (m
)
Concentration of solid particles (-)
GibilaroGidaspowHuilin-GidaspowEMMSSyamlal-O'BrienWen- Yu
b
48 Piriya Laiarpatorn, Pornpote Piumsomboon, and Benjapon Chalermsinsuwan

3.2 Effect of drag coefficient model Figure 4 shows the effect of six drag coefficient models on concentration of solid particles
for (a) radial direction at 5 m height and (b) axial direction along the height of air reactor. From
Figure 4(a), the obtained results with EMMS drag model showed higher concentration of solid
particles comparing with the other drag coefficient models. The reason can be explained by the
EMMS drag model is developed based on the solid particle cluster concept. The Geldart A solid
particle generally agglomerates together assolid particle cluster (Chalermsinsuwan et al.,
2009). The concentration profile of solid particles showed the high value near the wall region
than the one at the center region which is commonly called core-annulus flow structure. From
Figure 4(b), all the drag model simulations showed the high averaged concentration of solid
particles at the bottom region. Then, the concentration of solid particles decreased along the
height of air reactor. Again, the EMMS drag model showed higher concentration of solid
particles than the other drag models.
3.3 Effect of modeling parameters In this section, the simulations with EMMS drag model were used to compare different
modeling parameters. The effect of specularity coefficient and the solid particle-solid particle
restitution coefficient were explored. The other parameters were set according to Table 1. The
concentration of solid particle is the factor that can be used to represent the system
hydrodynamics.
3.3.1 Specularity coefficient
The specularity coefficient is the modeling parameter that describes the collision fraction
of solid particles which transfer momentum to the wall. The value of specularity coefficient
varies between zero and one. A value of zero means that a smooth wall is used or a free-slip
boundary condition is applied at the wall and a value of one means that a rough wall is used or
a partial-slip boundary condition is applied at the wall (Chalermsinsuwan et al., 2012). Chen
and Wheeler (2013) reported that air velocities were very sensitive to the specularity
coefficient values less than 0.10. Zhou et al. (2013) studied the effect of wall boundary
condition in CFB risers. Their specularity coefficient had a pronounced influence on flow
behavior when the EMMS-based drag model was used and a small specularity coefficient
could result in better agreement with the experimental data.
*Corresponding author (B.Chalermsinsuwan). E-mail address: [email protected] 2014. International Transaction Journal of Engineering, Management, & Applied Sciences & Technologies. Volume 5 No.1 ISSN 2228-9860 eISSN 1906-9642. Online available at http://tuengr.com/V05/0039.pdf .
49

Figure 5: Effect of four specularity coefficients on concentration of solid particles for (a) radial
direction at 5 m height and (b) axial direction.
Figure 5 shows the effect of four different specularity coefficients on concentration of solid
particles for (a) radial direction at 5 m height and (b) axial direction along the height of air
reactor. The selected specularity coefficient values were 0.00001, 0.0001, 0.001 and 0.01. At 5
m height, the system flows were already settled in fully developed condition. The effect of
specularity coefficients was seen near the system wall. The high specularity coefficient value
(𝜑 = 0.01) gave higher concentration of solid particles due to the strong friction between solid
particles and wall. The low specularity coefficient value (𝜑 = 0.00001) means that the wall is
in free-slip condition. With this condition, there is no friction between solid particles and wall.
The solid particles then could freely move along the wall and had a lower concentration of solid
0.00
0.05
0.10
0.15
0.20
0.0 0.2 0.4 0.6 0.8 1.0
Conc
entr
atio
n of
solid
par
ticle
s (-)
Dimensionless radial distance (-)
specularity coeff.=0.00001specularity coeff.=0.0001specularity coeff.=0.001specularity coeff.=0.01
0
1
2
3
4
5
6
0.00 0.05 0.10 0.15 0.20
Heig
ht (m
)
Concentration of solid particles (-)
specularity coeff.=0.00001specularity coeff.=0.0001specularity coeff.=0.001specularity coeff.=0.01
a
b
50 Piriya Laiarpatorn, Pornpote Piumsomboon, and Benjapon Chalermsinsuwan
particles. The obtained results were agreed well with Zhou et al. (2013). From Figure 5(b), all
the results with different specularity coefficients had the S-shaped profiles. The concentration
of solid particles was decrease along the column height. At the bottom and top of the air reactor,
the concentration of solid particles was high and low, respectively. There was no significant
difference in the concentration of solid particles with different specularity coefficients.
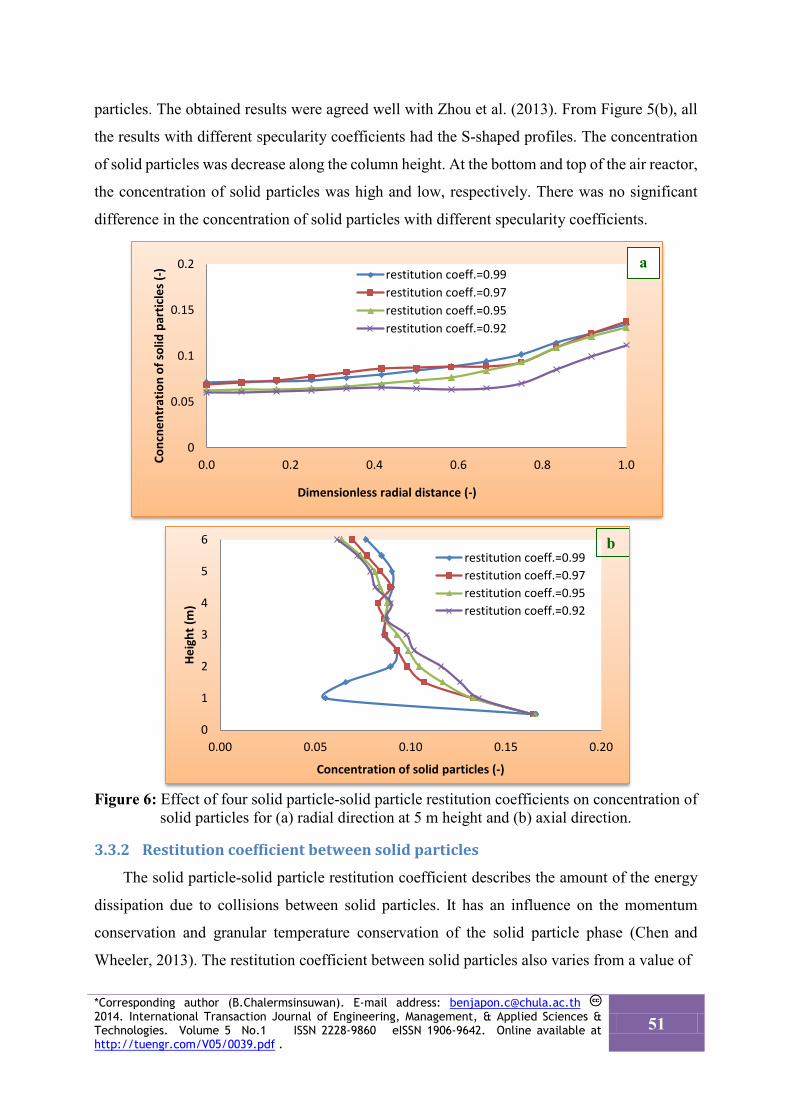
Figure 6: Effect of four solid particle-solid particle restitution coefficients on concentration of
solid particles for (a) radial direction at 5 m height and (b) axial direction.
3.3.2 Restitution coefficient between solid particles
The solid particle-solid particle restitution coefficient describes the amount of the energy
dissipation due to collisions between solid particles. It has an influence on the momentum
conservation and granular temperature conservation of the solid particle phase (Chen and
Wheeler, 2013). The restitution coefficient between solid particles also varies from a value of
0
0.05
0.1
0.15
0.2
0.0 0.2 0.4 0.6 0.8 1.0Conc
nent
ratio
n of
solid
par
ticle
s (-)
Dimensionless radial distance (-)
restitution coeff.=0.99restitution coeff.=0.97restitution coeff.=0.95restitution coeff.=0.92
0
1
2
3
4
5
6
0.00 0.05 0.10 0.15 0.20
Heig
ht (m
)
Concentration of solid particles (-)
restitution coeff.=0.99restitution coeff.=0.97restitution coeff.=0.95restitution coeff.=0.92
b
a
*Corresponding author (B.Chalermsinsuwan). E-mail address: [email protected] 2014. International Transaction Journal of Engineering, Management, & Applied Sciences & Technologies. Volume 5 No.1 ISSN 2228-9860 eISSN 1906-9642. Online available at http://tuengr.com/V05/0039.pdf .
51

Figure 7: Distribution of solid particle concentration comparing with the experimental data by
Shuai et al. (2012) at (a) 3.5 m and (b) 4.5 m heights of air reactor in CLC.
zero to one. A value of zero means that solid fluctuating kinetic energy is laid in inelastic collision while a value of one means that solid particle turbulent kinetic energy is laid in elastic collision. Chen and Wheeler (2013) examined the influence of solid particle-solid particle restitution coefficient. They noted that the free slip condition could not describe the real observed situation.
Figure 6 illustrates the effect of four different solid particle-solid particle restitution
coefficients on the concentration of solid particles. The selected restitution coefficient varied among the values of 0.92, 0.95, 0.97 and 0.99. With the EMMS model and specularity coefficient value of 0.001, the overall trends of the concentration of solid particles were almost the same for different solid particle-solid particle restitution coefficient values. From Figure 6(a), the trends of all concentration of solid particles were similar that was high at the wall and low at the center. However, the high (e = 0.99) and low (e = 0.92) values of solid particle-solid particle restitution coefficient gave little higher and lower concentrations of solid particles due
0.00
0.10
0.20
0.30
0.40
0.50
0.00 0.20 0.40 0.60 0.80 1.00Conc
entr
atio
n of
solid
par
ticle
s (-)
Dimensionless radial distance (-)
Experimental data by Shuai et al., 2011simulation
0.00
0.10
0.20
0.30
0.40
0.50
0.00 0.20 0.40 0.60 0.80 1.00
Conc
entr
atio
n of
solid
par
ticle
s (-)
Dimensionless radial distance (-)
Experimental data by Shuai et al., 2011simulation
experimental data by Shuai et al. (2012)
experimental data by Shuai et al. (2012)
a
b
52 Piriya Laiarpatorn, Pornpote Piumsomboon, and Benjapon Chalermsinsuwan
to the amount of elastic solid particle collision and energy loss. This explanation is confirmed in Figure 6(b) which shows high concentration of solid particles at the bottom and low at the top of the air reactor. The result supports to the experimental data by Chen and Wheeler (2013) that high value of solid particle-solid particle restitution coefficient resulted in high concentration of solid particles in the top section.
3.4 Comparison with Shuai et al. (2012) experiments In order to compare the quantitative result with the results by Shuai et al. (2012), the result
with optimum modeling condition was shown in Figure 7. The suitable condition that got closely quantitative result with the experimental data used the EMMS drag model with the specularity coefficient of 0.01 and the solid particle-solid particle restitution coefficient of 0.97. The results gave high and low concentrations of solid particles at the wall and center, respectively. The profile of concentration of solid particles was the conventional core-annulus flow structure.
4. Conclusion This study used CFD commercial program, ANSYS FLUENT 14.0, to simulate the flow
behavior of gas and solid particles in the air reactor of CLC with different modeling parameters. The drag coefficient model, specularity coefficient and solid particle-solid particle restitution coefficient were explored. The solid volume fraction result with EMMS drag model was higher than the other drag models due to the effect of solid particle cluster in model development. The specularity coefficient and restitution coefficient between solid particles had slightly effect on the results. The EMMS drag model, the specularity coefficient of 0.01 and solid particle-solid particle restitution coefficient of 0.97 gave similar result with the experiment by Shuai et al. (2012). It correctly predicted the trends of the observed radial concentration of solid particles. Then, the system hydrodynamics of solid particles was shown. All the results had the similar trend that dense solid particles were formed near the wall and dilute solid particles were occurred at the center. The simulation showed the formation of the core-annular flow structure in the air reactor (Huilin and Gidaspow, 2003).
5. Acknowledgements This study was financially supported by the Grants from PETRO-MAT and SC-CU, also
partially supported by TRF and CHED (MRG5580140), the Grants for Development of New Faculty Staff by CU and the CU Graduate School Thesis Grant.
*Corresponding author (B.Chalermsinsuwan). E-mail address: [email protected] 2014. International Transaction Journal of Engineering, Management, & Applied Sciences & Technologies. Volume 5 No.1 ISSN 2228-9860 eISSN 1906-9642. Online available at http://tuengr.com/V05/0039.pdf .
53

6. References Chalermsinsuwan, B., P. Piumsomboon, D. Gidaspow. (2009) Kinetic theory based
computation of PSRI riser: Part I–Estimate of mass transfer coefficient. Chemical Engineering Science, 64, 1195–1211.
Chalermsinsuwan, B., P. Kuchonthara and P. Piumsomboon. (2010) CFD modeling of tapered circulating fluidized bed reactor risers: Hydrodynamic descriptions and chemical reaction responses. Chemical Engineering and Processing, 49, 1144–1160.
Chalermsinsuwan, B., T. Chanchuey, W. Buakhao, D.Gidaspow and P. Piumsomboon. (2012) Computational fluid dynamics of circulating fluidized bed downer: Study of modeling parameters and system hydrodynamic characteristics. Chemical Engineering Journal, 189-190, 314–335.
Chen X. and C. Wheeler. (2013) Computational Fluid Dynamics (CFD) modelling of transfer chutes: A study of the influence of model parameters. Chemical Engineering Science, 95, 194–202.
Cruz, E., F.R. Steward and T. Pugsley. (2006) New closure models for CFD modeling of high-density circulating fluidized beds. Powder Technology, 169, 115–122.
Du, W., X. Bao, J. Xu and W. Wei. (2006) Computational fluid dynamic (CFD) modeling of spouted bed: Assessment of drag coefficient correlations. Chemical Engineering Science, 61, 1401–1420.
Fluent Inc. (2011a) Fluent 14.0 User's Guide, Fluent Inc., USA.
Fluent Inc. (2011b) Fluent 14.0 Theory Guide, Fluent Inc., USA.
Gidaspow, D., R. Bezburuah, and J. Ding. (1992) Hydrodynamics of Circulating Fluidized Beds, Kinetic Theory Approach. In Fluidization VII, Proceedings of the 7th Engineering Foundation Conference on Fluidization, 75–82.
Gidaspow, D. (1994) Multiphase Flow, Fluidization: Continuum, Kinetic Theory Description. Acedemic Press, Boston.
Gidaspow, D. and V. Jiradilok. (2009) Computational Techniques the Multiphase CFD Approach to Fluidization and Green Energy Technologies. Energy Science, New York.
Huilin L. and D. Gidaspow. (2003) Hydrodynamics of binary fluidization in a riser: CFD simulation using two granular temperatures. Chemical Engineering Science, 58, 3777–3792.
Huilin, L., D. Gidaspow, J. Bouillard, L.Wentie. (2003) Hydrodynamic simulation of gas-solid flow in a riser using kinetic theory of granular flow. Chemical Engineering Journal, 95, 1–13.
Lu, B., W. Wang and J. Li. (2011) Eulerian simulation of gas-solid flows with particles of Geldart group A, B and D using EMMS-based meso-scale model. Chemical Engineering Science, 66. 4624–4635.
Mahalatkar, K., J. Kuhlman, E. Huckaby and T. O’Brien. (2011a) Computational fluid dynamic simulations of chemical looping fuel reactors utilizing gaseous fuels. Chemical Engineering Science, 66, 469–479.
54 Piriya Laiarpatorn, Pornpote Piumsomboon, and Benjapon Chalermsinsuwan

Mahalatkar, K., J. Kuhlman, E. Huckaby and T. O’Brien. (2011b) CFD simulation of a chemical-looping fuel reactor utilizing solid fuel. Chemical Engineering Science, 66, 3617–3627.
Samruamphianskun, T., P. Piumsomboon and B. Chalermsinsuwan. (2012) Effect of ring baffle configurations in a circulating fkuidized bed riser using CFD simulation and experimental design analysis. Chemical Engineering Journal, 210, 237–251.
Shuai, W., L. Huilin, L. Guodong, S. Zhiheng, X. Pengfei and D. Gidaspow. (2011a) Modeling of cluster structure-dependent drag with Eulerian approach for circulating fluidized beds. Powder Technology, 208, 98–110.
Shuai, W., L. Guodong, L. Huilin, C. Juhui, H. Yurong and W. Jiaxing. (2011b) Fluid dynamic simulation in a chemical looping combustion with two interconnected fluidized beds. Fuel Processing Technology, 92, 385–393.
Shuai, W., G. Jianmin, L. Huilin, L. Goudong, X. Pengfei and S. Liyan. (2012) Simulation of flow behavior of particles by cluster structure-dependent drag coefficient model for chemical looping combustion process: Air reactor. Fuel Processing Technology, 104, 219–233.
Wen, C.-Y. and Y. H. Yu. (1966) Mechanics of Fluidization. Chemical Engineering Progress Symposium Series, 62, 100–111.
Zhou, X., J. Gao, C. Xu and X. Lan. (2013) Effect of wall boundary condition on CFD simulation of CFB risers. Particuology, 11, 556–565.
Piriya Laiarpatorn is a master degree student of Department of Chemical Technology at Faculty of Science, Chulalongkorn University. She received her B.Eng. from Chiangmai University in 2012. Her research interest relates to computational fluid dynamics simulation.
Dr. Pornpote Piumsomboon is an Associate Professor of Department of Chemical Technology at Faculty of Science, Chulalongkorn University. He hold a B.Sc. in chemical engineering from Chulalongkorn University, M.E. in chemical engineering and industrial engineering from Lamar University in USA and Ph.D. degree in chemical engineering from the University of New Brunswick in Canada. His research interest relates to proton exchange membrane fuel cell and circulating fluidized bed technology. He has published more than 30 articles in professional journals and published 2 books.
Dr. Benjapon Chalermsinsuwan is an Assistant Professor of Department of Chemical Technology at Faculty of Science, Chulalongkorn University. He hold a B.Sc. in chemical engineering from Chulalongkorn university and Ph.D. degree in chemical technology from Chulalongkorn university. His research interest relates to computational fluid dynamics simulation, experimental design and analysis, carbon dioxide capture and circulating fluidized bed technology.
Peer Review: This article has been internationally peer-reviewed and accepted for publication according to the guidelines in the journal’s website. Note: Original version of this article was accepted and presented at the Third International-Thai Chemical Engineering and Applied Chemistry (TIChE) Conference, jointly organized by Department of Chemical Engineering, Faculty of Engineering, Khon Kaen University and Thai Institute of Chemical Engineering and Applied Chemistry, at Pullman Khon Kaen Raja Orchid Hotel, Khon Kaen, THAILAND, October 17-18, 2013.
*Corresponding author (B.Chalermsinsuwan). E-mail address: [email protected] 2014. International Transaction Journal of Engineering, Management, & Applied Sciences & Technologies. Volume 5 No.1 ISSN 2228-9860 eISSN 1906-9642. Online available at http://tuengr.com/V05/0039.pdf .
55