Embed Size (px)
Citation preview
i
MODELING PARAMETERS FOR THE NONLINEAR SEISMIC ANALYSIS OF REINFORCED CONCRETE COLUMNS RETROFITTED USING FRP OR STEEL JACKETING
by
José C. Alvarez and Sergio F. Breña
Department of Civil and Environmental Engineering University of Massachusetts Amherst
Report submitted to the Concrete Research Council of the
ACI Foundation (CRC Project Report no. 71)
October 2017

ii
Acknowledgment
Funding for this research project was provided by the Concrete Research Council
of the ACI Foundation. This support is greatly appreciated. The first author would like to
express gratitude for the additional support provided by the NEAGEP at the University of
Massachusetts Amherst, which enabled him to complete his PhD Degree.
iii
Abstract
The use of nonlinear analysis procedures in the analysis of reinforced concrete
buildings subjected to seismic retrofitting is commonly used for design. To
approximately capture the nonlinear response of structural elements, backbone (envelope)
curves are used. Procedures to construct backbone curves for existing components of
frames (beams, joints, and columns) have been extensively researched over the years. In
contrast, recommendations to construct backbone curves for retrofitted components are
largely lacking. The research in this project was intended to assist in filling this gap in
knowledge.
This report presents recommendations to construct backbone curves of circular
and rectangular retrofitted columns using jacketing materials within the context of
ASCE/SEI 41-13 and ACI 369R-11. The recommendations are based on a study of the
characteristics of the hysteretic response of jacketed columns determined through past
laboratory testing. Backbone curves were constructed using these data and determining
key parameters that the multi-linear characteristics of these envelope curves. Drift and
lateral strength at three key points that were used to approximately define the backbone
curve of jacketed columns were selected. The three points selected for this study
correspond to yielding, strength and residual strength after loss of lateral-load carrying
capacity.
Force and drift at yield, strength, and residual strength were determined using
two different methods. Force values at yield and peak strength were computed using
accepted sectional models that use nominal material properties. The results from these
models were compared with values extracted from tests of jacketed columns available in
the literature. The residual strength was approximately defined as 20% of the peak
strength. Drift values at the three key points were established from a statistical study of
measured values of laboratory tests found in the literature. The drift data were fit to three
different probability distributions and the one that best fit the laboratory data was used to
construct fragility curves for plastic drift of jacketed columns. These curves were then
used to propose the value of drift at the probability of exceedance of 0.5.

iv
The research presented in this report can be used to develop backbone curves of
jacketed columns using steel or FRP jackets consistent with ACI 369.1-11 and ASCE/SEI
41-13. It is hoped that the study will facilitate future updates to these documents by
including nonlinear modeling procedures for jacketed columns.
v
Table of Contents
CHAPTER 1 Introduction ............................................................................................8 1.1 Motivation .............................................................................................................9 1.2 Research Objective .............................................................................................10 CHAPTER 2 DATABASE OF JACKETED COLUMNS AND BACKBONE
PARAMETERS ...........................................................................................................11 2.1 Jacket Retrofit Configurations ............................................................................11 2.2 Description of Jacketed Column Database .........................................................12 2.3 Construction of Backbone Curves from Measured Hysteresis Curves ...............15 CHAPTER 3 models to determine yield and peak force of jacketed columns ...........19 3.1 Calculation of Yield and Nominal Moments of Jacketed Columns ...................19 CHAPTER 4 Non-Linear Deformation Parameters Of Jacketed Columns ................31 4.1 Histograms and Statistical Properties of Jacketed Columns in Database ...........31 4.2 Matching Data to a Statistical Distribution .........................................................34 4.3 Drifts Determined from Selected Statistical Distributions .................................39 4.4 Recommended Parameter a Values for Jacketed Columns ................................40 CHAPTER 5 Summary and Conclusions ...................................................................43 5.1 Characterization of Jacketed Column Behavior .................................................43 CHAPTER 6 REFERENCES .....................................................................................45
vi
LIST OF TABLES
Table 2-1 Database maximum and minimun parameters for circular columns ............................................. 14 Table 2-2 Database maximum and minimun parameters for rectangular columns ....................................... 14 Table 3-1 Comparison of circular column data by jacketing type ................................................................. 29 Table 3-2 – Comparison of rectangular column data by jacketing type ........................................................ 30 Table 3-3 – Overall summary of statistical data for all columns in database ................................................ 30 Table 4-1 Fitting parameters for Weibull distribution at the different deformation levels ............................ 39 Table 4-2 Deformation parameters at different levels of probability ............................................................ 40 Table 4-5 Proposed modeling parameters for FRP- and steel-jacketed columns .......................................... 41
vii
LIST OF FIGURES
Figure 1-1 Reinforced concrete column crushing……………………………………………………………9 Figure 1-1 Reinforced concrete column crushing……………………………………………………………9
............................................................................................................................................................ vii Figure 1-1 Reinforced concrete column crushing ........................................................................................... 9 Figure 2-1 Typical jacket configurations ...................................................................................................... 12 Figure 2-2 Classification of columns in database ......................................................................................... 13 Figure 2-3 Backbone curve generated from experimental data .................................................................... 16 Figure 2-4 Simplified backbone curve obtained from measured hysteretic response: (a) hysteresis curve
with superimposed backbone (b) simplified nonlinear backbone curve and nonlinear parameters ..... 17 Figure 2-5 Mean force-deformation relationship of jacketed columns from database ................................. 18 Figure 2-6 Proposed simplified force-deformation relationship of jacketed columns .................................. 18 Figure 3-1 Circular jacketed column equivalent hoop spacing 's' ................................................................. 20 Figure 3-2 Rectangular jacketed column equivalent hoop spacing 's' ........................................................... 20 Figure 3-3 Confinement of concrete by circular hoops ................................................................................. 21 Figure 3-4 Circular column effective confined area ...................................................................................... 22 Figure 3-5 Confinement dimensions of jacketed column vs internal reinforcement ..................................... 23 Figure 3-6 Confined area of a rectangular cross section ............................................................................... 23 Figure 3-7 Rectangular columns effectively confined area ........................................................................... 24 Figure 3-8 Confinement dimensions of jacketed columns vs internal reinforcement ................................... 25 Figure 3-9 Assumed uniaxial stress-strain models ........................................................................................ 27 Figure 3-10 Jacketed column moment curvature analysis ............................................................................. 28 Figure 3-11 Comparison between calculated and experimental jacketed column strength: (a) and (b) shear
at yield; (c) and (d) shear at peak strength ........................................................................................... 29 Figure 4-1 Histograms from deformations parameters (yield, peak, a) ......................................................... 32 Figure 4-2 Empirical CDF comparison between circular and rectangular columns retrofitted with steel or
FRP ...................................................................................................................................................... 34 Figure 4-3 Distribution comparisons with a values data ............................................................................... 37 Figure 4-4 Empirical data cdf with the final distributions ............................................................................. 39 Figure 4-5 Comparison of the backbone force-deformation behavior of a code-conforming and two
different jacketed columns ................................................................................................................... 42
8
CHAPTER 1 INTRODUCTION
Experimental research on jacketed reinforced concrete (RC) columns has demonstrated
that the behavior of retrofitted RC columns can be adequate to resist seismic loading. Increases
in strength and ductility have been achieved when jackets are applied to deficient columns with
details typical of pre-1971 code provisions. Typically, deficiencies found in older columns
include low shear strength, insufficient core confinement, and short lap-splices within the plastic
hinge region. Columns with these deficiencies usually exhibit brittle failures at limited
displacement ductility (μΔ) with values typically lower than 2, a displacement ductility that is
insufficient to dissipate considerable energy during the incidence of seismic loading. Jacketed
columns have been observed to develop μΔ of 4 or greater.
The jacket materials selected to study in this research are constructed using steel or fiber
reinforced polymer (FRP) materials. These two jacket types have been widely used and accepted
to retrofit columns with deficient detailing. The mechanical properties of steel and the material
deformation capacity are beneficial to column jacketing. The mechanical properties of FRP
materials, including its high unidirectional strength and high elastic modulus, and its light weight
makes FRP jackets attractive for use in columns. Both types of jackets are applied externally and
minimally affect the size of retrofitted components.
To adequately capture the nonlinear hysteretic behavior of jacketed RC columns, an
understanding of the interaction between the jacket materials and the existing column is required.
To this date there are no common recommendations to model the hysteretic behavior of jacketed
columns. Furthermore, jacket parameters needed to develop a specified displacement ductility
are difficult to define. Defining the influenced of these parameters is important to develop
backbone curves that envelope the hysteretic curves that describe the nonlinear behavior of
jacketed columns.
Jacketed RC columns have a composite behavior which can be complicated to model in a
finite element analysis (FEA) program accurately. Past studies have developed different
numerical and physical models that attempt to capture the confining effects and shear strength of
jacketed columns. The models use procedures developed specifically from the experimental
testing that was conducted in each study. The goal of this study is to provide recommendations to
9
model jacketed RC columns with different detailing and jacketing materials so that backbone
curves can be constructed. To construct force-deformation backbone curves, the strength and
ductility at key points of the backbone needs definition. This study will attempt to develop
procedures that will assist in the definition of the coordinates (force-displacement) of backbone
curves for jacketed columns. The force-deformation curves can then be used in combination with
hysteretic rules to model the nonlinear behavior of jacketed columns.
1.1 Motivation
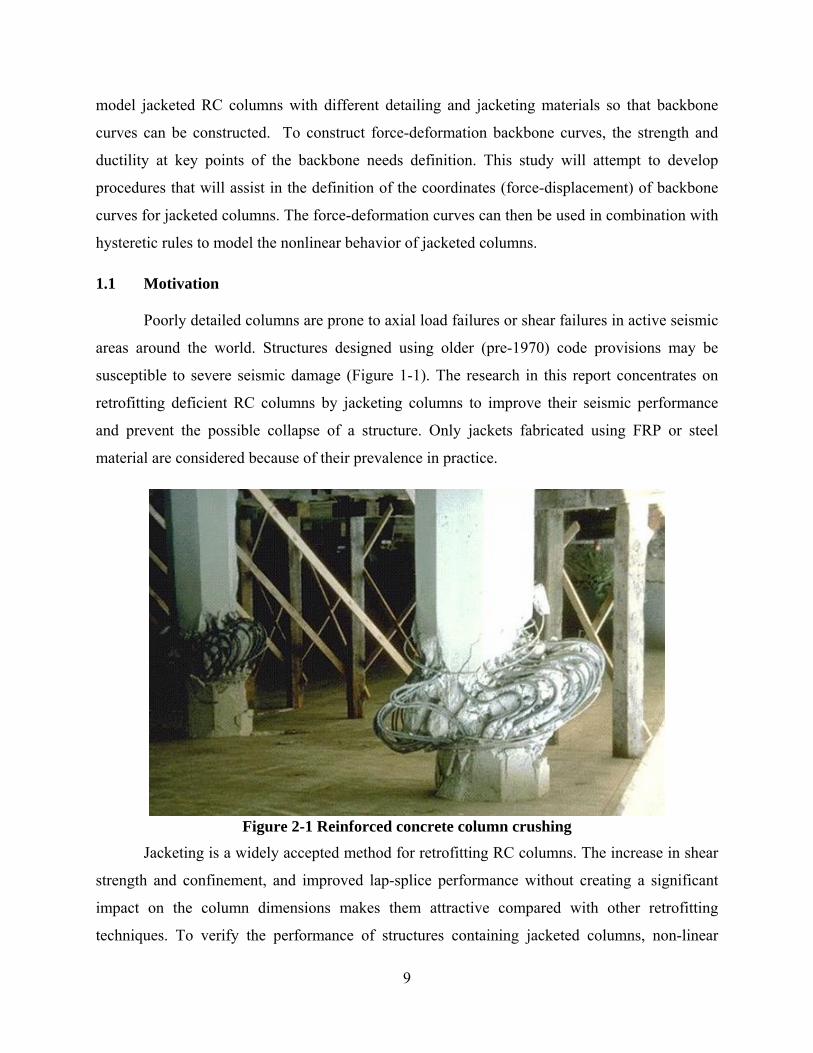
Poorly detailed columns are prone to axial load failures or shear failures in active seismic
areas around the world. Structures designed using older (pre-1970) code provisions may be
susceptible to severe seismic damage (Figure 1-1). The research in this report concentrates on
retrofitting deficient RC columns by jacketing columns to improve their seismic performance
and prevent the possible collapse of a structure. Only jackets fabricated using FRP or steel
material are considered because of their prevalence in practice.
Figure 2-1 Reinforced concrete column crushing
Jacketing is a widely accepted method for retrofitting RC columns. The increase in shear
strength and confinement, and improved lap-splice performance without creating a significant
impact on the column dimensions makes them attractive compared with other retrofitting
techniques. To verify the performance of structures containing jacketed columns, non-linear
10
modeling parameters for jacketed columns that incorporate the effects of jacketing materials and
column cross-section geometry are needed. To develop these nonlinear modeling parameters,
this research study focused on developing a database containing test results from jacketed
columns to extract key points in the hysteretic behavior of these components measured during
the tests. Models of jacketed columns that have been proposed by previous researchers are also
included in the literature review.
1.2 Research Objective
The main objective of this research was to develop recommendations that can be used to
construct backbone curves of jacketed columns using FRP or steel jackets. These backbone
curves could then be used to model the nonlinear behavior of frames containing jacketed
columns to assess the behavior of retrofitted structures. The study concentrated on developing
backbone curves consistent with ASCE/SEI 41-06 and ACI 369.1-11 so that the procedure can be
easily adopted into future editions of these documents.
11
CHAPTER 2 DATABASE OF JACKETED COLUMNS AND
BACKBONE PARAMETERS
This chapter presents the procedure that was followed to construct a database of force-
deformation backbone curves of jacketed reinforced concrete (RC) columns based on a large
number of column specimens that were collected from the literature. The chapter begins with a
brief description of the jacketing configurations and column characteristics used in the literature
followed by a description of the column parameters in the database, and a description of the
column backbone and key parameters included in the database.
2.1 Jacket Retrofit Configurations
Column retrofits using jacketing are intended to correct deficiencies in column original
designs that may negatively impact their deformation capacity. The most common deficiencies
encountered in columns designed with pre-1970s provisions are: short lap splices of longitudinal
bars in plastic hinge regions, low shear strength, and insufficient confinement of the column
core. Past researchers (Seible et al. 1997, Aboutaha 1999, Xiao 1997, Priestly et al. 1996, Chai et
al. 1991, Harries et al. 2006, Elsnadedy and Haroun 2006) have based the recommendations for
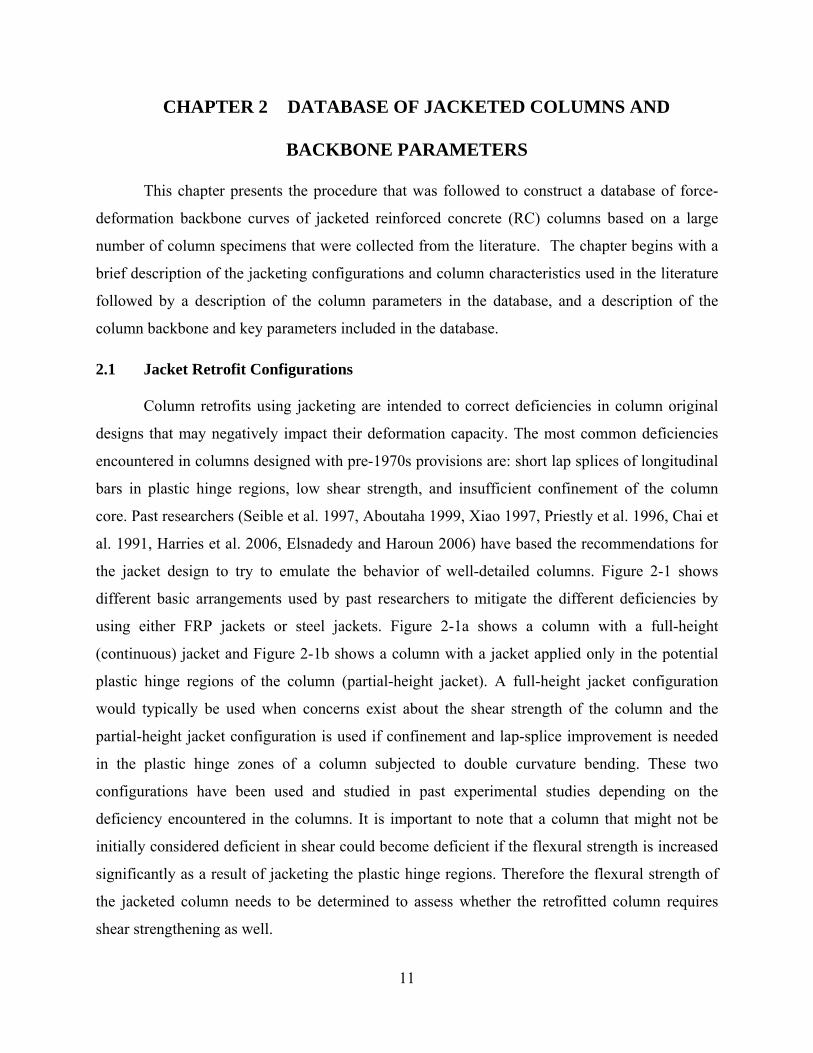
the jacket design to try to emulate the behavior of well-detailed columns. Figure 2-1 shows
different basic arrangements used by past researchers to mitigate the different deficiencies by
using either FRP jackets or steel jackets. Figure 2-1a shows a column with a full-height
(continuous) jacket and Figure 2-1b shows a column with a jacket applied only in the potential
plastic hinge regions of the column (partial-height jacket). A full-height jacket configuration
would typically be used when concerns exist about the shear strength of the column and the
partial-height jacket configuration is used if confinement and lap-splice improvement is needed
in the plastic hinge zones of a column subjected to double curvature bending. These two
configurations have been used and studied in past experimental studies depending on the
deficiency encountered in the columns. It is important to note that a column that might not be
initially considered deficient in shear could become deficient if the flexural strength is increased
significantly as a result of jacketing the plastic hinge regions. Therefore the flexural strength of
the jacketed column needs to be determined to assess whether the retrofitted column requires
shear strengthening as well.
12
(a) (b)
(c)
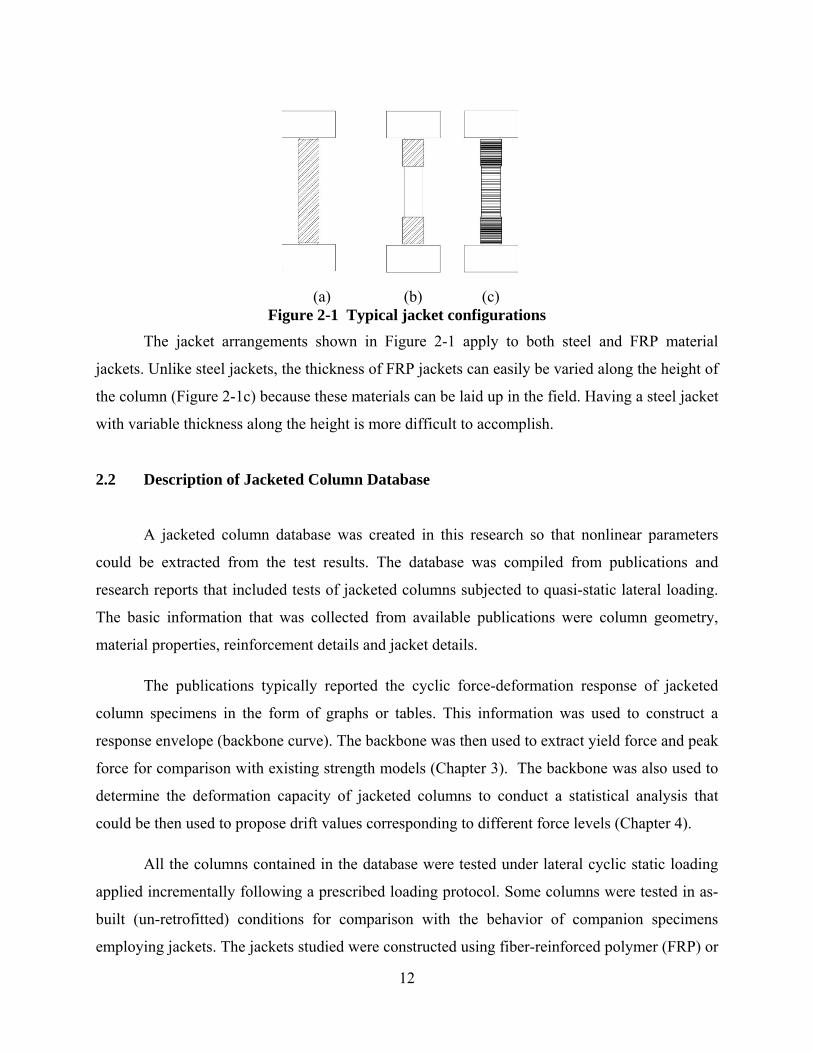
Figure 2-1 Typical jacket configurations
The jacket arrangements shown in Figure 2-1 apply to both steel and FRP material
jackets. Unlike steel jackets, the thickness of FRP jackets can easily be varied along the height of
the column (Figure 2-1c) because these materials can be laid up in the field. Having a steel jacket
with variable thickness along the height is more difficult to accomplish.
2.2 Description of Jacketed Column Database
A jacketed column database was created in this research so that nonlinear parameters
could be extracted from the test results. The database was compiled from publications and
research reports that included tests of jacketed columns subjected to quasi-static lateral loading.
The basic information that was collected from available publications were column geometry,
material properties, reinforcement details and jacket details.
The publications typically reported the cyclic force-deformation response of jacketed
column specimens in the form of graphs or tables. This information was used to construct a
response envelope (backbone curve). The backbone was then used to extract yield force and peak
force for comparison with existing strength models (Chapter 3). The backbone was also used to
determine the deformation capacity of jacketed columns to conduct a statistical analysis that
could be then used to propose drift values corresponding to different force levels (Chapter 4).
All the columns contained in the database were tested under lateral cyclic static loading
applied incrementally following a prescribed loading protocol. Some columns were tested in as-
built (un-retrofitted) conditions for comparison with the behavior of companion specimens
employing jackets. The jackets studied were constructed using fiber-reinforced polymer (FRP) or
13
steel materials. Columns were loaded in either single curvature bending (cantilever) or double
curvature bending (fixed-fixed). These boundary conditions were meant to replicate the
conditions of bridge columns or frame columns. Although this research is primarily directed to
frame column retrofits the tests intended to simulate bridge column behavior (single curvature)
were still included in the database because these columns may be considered representative of a
column in a frame up to the point of inflection.
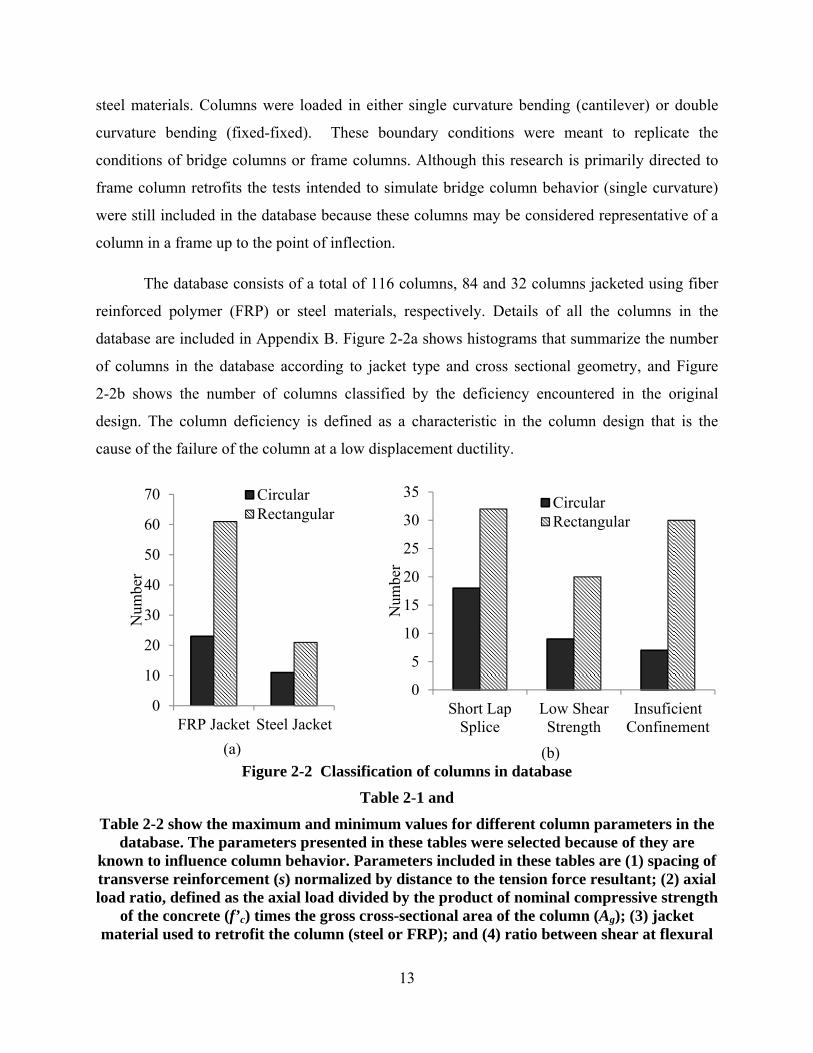
The database consists of a total of 116 columns, 84 and 32 columns jacketed using fiber
reinforced polymer (FRP) or steel materials, respectively. Details of all the columns in the
database are included in Appendix B. Figure 2-2a shows histograms that summarize the number
of columns in the database according to jacket type and cross sectional geometry, and Figure
2-2b shows the number of columns classified by the deficiency encountered in the original
design. The column deficiency is defined as a characteristic in the column design that is the
cause of the failure of the column at a low displacement ductility.
(a) (b)
Figure 2-2 Classification of columns in database
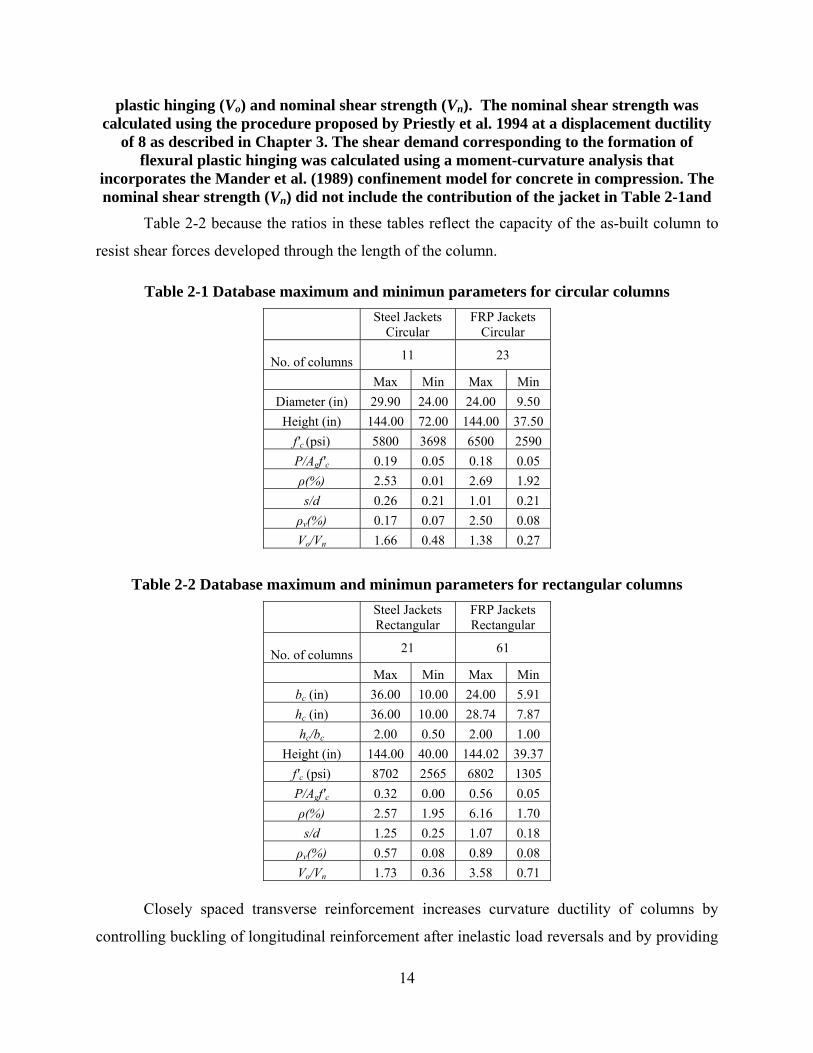
Table 2-1 and
Table 2-2 show the maximum and minimum values for different column parameters in the database. The parameters presented in these tables were selected because of they are
known to influence column behavior. Parameters included in these tables are (1) spacing of transverse reinforcement (s) normalized by distance to the tension force resultant; (2) axial load ratio, defined as the axial load divided by the product of nominal compressive strength
of the concrete (f’c) times the gross cross-sectional area of the column (Ag); (3) jacket material used to retrofit the column (steel or FRP); and (4) ratio between shear at flexural
0
10
20
30
40
50
60
70
FRP Jacket Steel Jacket
Num
ber
CircularRectangular
0
5
10
15
20
25
30
35
Short LapSplice
Low ShearStrength
InsuficientConfinement
Num
ber
CircularRectangular
14
plastic hinging (Vo) and nominal shear strength (Vn). The nominal shear strength was calculated using the procedure proposed by Priestly et al. 1994 at a displacement ductility
of 8 as described in Chapter 3. The shear demand corresponding to the formation of flexural plastic hinging was calculated using a moment-curvature analysis that
incorporates the Mander et al. (1989) confinement model for concrete in compression. The nominal shear strength (Vn) did not include the contribution of the jacket in Table 2-1and
Table 2-2 because the ratios in these tables reflect the capacity of the as-built column to
resist shear forces developed through the length of the column.
Table 2-1 Database maximum and minimun parameters for circular columns
Steel Jackets Circular
FRP Jackets Circular
No. of columns 11 23
Max Min Max Min
Diameter (in) 29.90 24.00 24.00 9.50
Height (in) 144.00 72.00 144.00 37.50
f'c (psi) 5800 3698 6500 2590
P/Agf'c 0.19 0.05 0.18 0.05
ρ(%) 2.53 0.01 2.69 1.92
s/d 0.26 0.21 1.01 0.21
ρv(%) 0.17 0.07 2.50 0.08
Vo/Vn 1.66 0.48 1.38 0.27
Table 2-2 Database maximum and minimun parameters for rectangular columns
Steel Jackets Rectangular
FRP Jackets Rectangular
No. of columns 21 61
Max Min Max Min
bc (in) 36.00 10.00 24.00 5.91
hc (in) 36.00 10.00 28.74 7.87
hc/bc 2.00 0.50 2.00 1.00
Height (in) 144.00 40.00 144.02 39.37
f'c (psi) 8702 2565 6802 1305
P/Agf'c 0.32 0.00 0.56 0.05
ρ(%) 2.57 1.95 6.16 1.70
s/d 1.25 0.25 1.07 0.18
ρv(%) 0.57 0.08 0.89 0.08
Vo/Vn 1.73 0.36 3.58 0.71
Closely spaced transverse reinforcement increases curvature ductility of columns by
controlling buckling of longitudinal reinforcement after inelastic load reversals and by providing
15
confinement of the concrete core. Axial load ratio (P/Agf’c) affects column behavior and may
accentuate some of the deficiencies encountered in older columns. Columns subjected to high
axial load ratios (P/Agf’c > 0.15) in combination with high lateral loads, may be affected by P-Δ
effects that would limit the displacement capacity of these columns. On the other hand, columns
with low levels of axial load (P/Agf’c ≤ 0.15) could have a higher tension stress in the
longitudinal bars, causing yielding at lower lateral displacement that could generate early onset
of longitudinal bar slip for the same lateral load.
For the purposes of this research, a short lap splice is defined as a splice of the
longitudinal reinforcement in the column within the plastic region of only 20 to 24 longitudinal
bar diameters (db). These lengths have been found to be insufficient to avoid bar slippage when a
column is subjected to inelastic load reversals. In older columns, splices were usually located
within the plastic hinge zone of columns (above the foundation or above the floors) for ease of
construction. Splices need to be sized to transfer tension forces in the presence of cyclic loading
and contain closely spaced transverse reinforcement through the splice length to prevent splitting
of concrete.
Widely spaced transverse reinforcement may cause columns to have low shear strength at
large displacements. Shear critical columns are those that fail in shear at low displacement
ductility before the development of the plastic hinges (Vo > Vn , μΔ < 2). Ductile shear design of
columns in seismic regions should therefore be done with consideration of the flexural strength
of the column to ensure that plastic hinging can occur and that the capacity of the column can be
maintained.
2.3 Construction of Backbone Curves from Measured Hysteresis Curves
Column behavior from tests in the literature was reported as hysteresis force-deformation
curves. From these hysteresis curves backbone (envelope) curves were constructed by digitizing
data from the figures obtained from the original test references. The backbone curves were
constructed using the force and displacement values measured during the first cycle at each
displacement level. In some cases the authors of a paper directly reported backbone curves; these
plots were digitized to obtain the force-deformation relationships instead of extracting them from
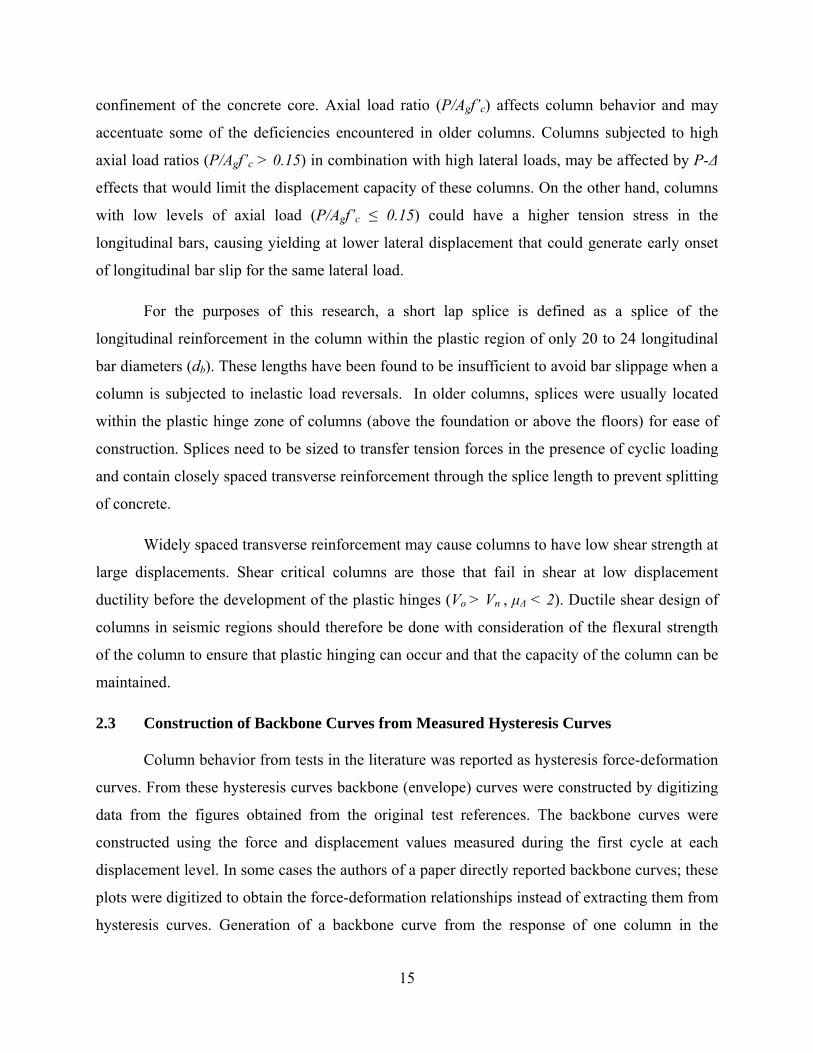
hysteresis curves. Generation of a backbone curve from the response of one column in the
16
database is illustrated in Figure 2-3. The backbone curves obtained for all the columns in the
database are presented in Appendix A.
Figure 2-3 Backbone curve generated from experimental data
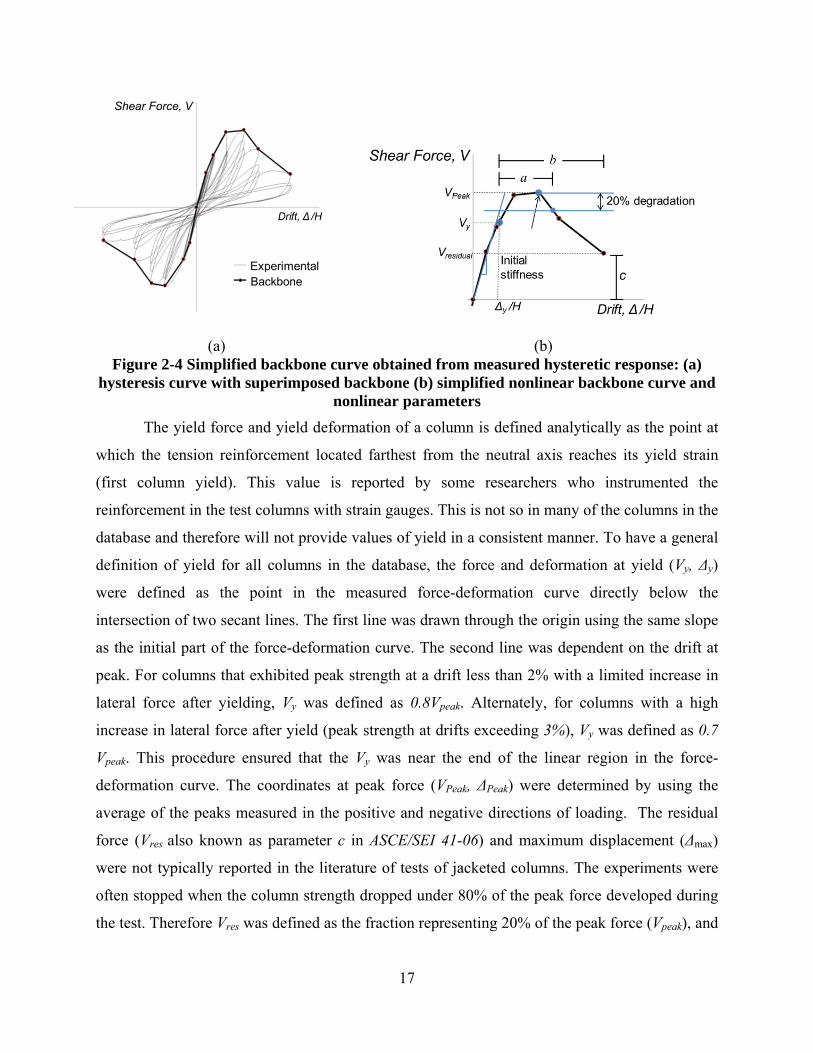
From each backbone curve, key points were extracted (Figure 2-4). The selected points
are the yield strength and corresponding deformation, peak strength, plastic deformation to 20%
loss in lateral strength (Parameter a), deformation from yield to loss of axial carrying capacity
(Parameter b), residual strength (c) and maximum deformation. Parameter a was defined as the
difference between the deformation at lateral strength degradation of 20% and the deformation at
yield. In tests stopped before reaching a 20% drop in force from peak, Parameter a was defined
as the maximum deformation imposed during the test. Parameter b, which corresponds to loss of
axial capacity accompanied by a drop in lateral strength, could not be obtained from the literature
because tests were typically stopped prior to reaching this level of strength degradation.
Therefore, Parameter b was determined as the deformation corresponding to a degradation of
25% from the peak lateral load, Vpeak. In cases where columns did not exhibit a strength
degradation of more than 20%, Parameter b could not be determined and was set equal to the
value in ACI 369R-11 for existing columns.
17
(a) (b) Figure 2-4 Simplified backbone curve obtained from measured hysteretic response: (a)
hysteresis curve with superimposed backbone (b) simplified nonlinear backbone curve and nonlinear parameters
The yield force and yield deformation of a column is defined analytically as the point at
which the tension reinforcement located farthest from the neutral axis reaches its yield strain
(first column yield). This value is reported by some researchers who instrumented the
reinforcement in the test columns with strain gauges. This is not so in many of the columns in the
database and therefore will not provide values of yield in a consistent manner. To have a general
definition of yield for all columns in the database, the force and deformation at yield (Vy, Δy)
were defined as the point in the measured force-deformation curve directly below the
intersection of two secant lines. The first line was drawn through the origin using the same slope
as the initial part of the force-deformation curve. The second line was dependent on the drift at
peak. For columns that exhibited peak strength at a drift less than 2% with a limited increase in
lateral force after yielding, Vy was defined as 0.8Vpeak. Alternately, for columns with a high
increase in lateral force after yield (peak strength at drifts exceeding 3%), Vy was defined as 0.7
Vpeak. This procedure ensured that the Vy was near the end of the linear region in the force-
deformation curve. The coordinates at peak force (VPeak, ΔPeak) were determined by using the
average of the peaks measured in the positive and negative directions of loading. The residual
force (Vres also known as parameter c in ASCE/SEI 41-06) and maximum displacement (Δmax)
were not typically reported in the literature of tests of jacketed columns. The experiments were
often stopped when the column strength dropped under 80% of the peak force developed during
the test. Therefore Vres was defined as the fraction representing 20% of the peak force (Vpeak), and
18
max was defined conservatively as the maximum displacement reported for each tested column.
It is expected that the majority of the columns would still be able to support larger
displacements. Furthermore some tests were stopped because of limits on the testing equipment
and not the column strength. Error! Reference source not found. In ACI 369R-11 parameters a,
b and c were determined from mean backbone values derived from a large number of reinforced
column experiments (Elwood et al. 2007). Therefore mean values were also used to define the
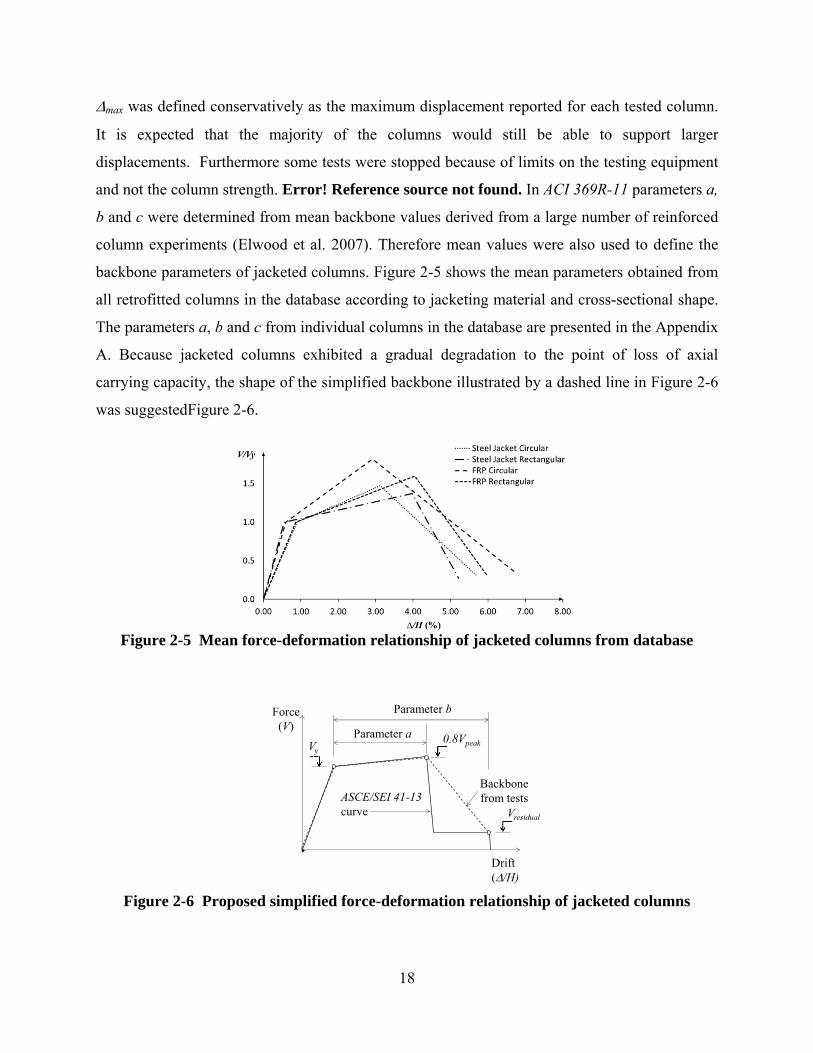
backbone parameters of jacketed columns. Figure 2-5 shows the mean parameters obtained from
all retrofitted columns in the database according to jacketing material and cross-sectional shape.
The parameters a, b and c from individual columns in the database are presented in the Appendix
A. Because jacketed columns exhibited a gradual degradation to the point of loss of axial
carrying capacity, the shape of the simplified backbone illustrated by a dashed line in Figure 2-6
was suggestedFigure 2-6.
Figure 2-5 Mean force-deformation relationship of jacketed columns from database
Figure 2-6 Proposed simplified force-deformation relationship of jacketed columns
Parameter a
Parameter b
Drift (/H)
Force (V)
Vy0.8Vpeak
Vresidual
ASCE/SEI 41-13 curve
Backbone from tests
19
CHAPTER 3 MODELS TO DETERMINE YIELD AND PEAK FORCE
OF JACKETED COLUMNS
This chapter focuses on recommendations to determine the yield and peak force for
jacketed columns. In this chapter the forces in jacketed columns obtained from the proposed
models are compared with values extracted from the jacketed column database.
3.1 Calculation of Yield and Nominal Moments of Jacketed Columns
Cross-sectional models are typically used to estimate yield and nominal moment of
reinforced concrete components. Cross-sectional strength can be calculated using fiber models
wherein the cross section is divided into fibers and, for a given curvature of the cross section, the
force in each fiber is calculated using the corresponding uniaxial material stress-strain laws. The
model works by establishing equilibrium of internal forces to obtain the neutral axis location.
Once the neutral axis depth in the cross section is established the forces in these fibers are used
to calculate the internal moment developed by the cross section. The main purpose of the
techniques described in this section was to develop a methodology that could be implemented
into existing software that is used to compute the sectional strength of reinforced concrete (RC)
columns containing internal reinforcement only.
Yield and nominal moments of a jacketed column cross section are affected by the jacket.
Column jackets develop confining stresses in the concrete that have the effect of increasing the
ultimate stress and ultimate strain of concrete. These confining stresses also provide a clamping
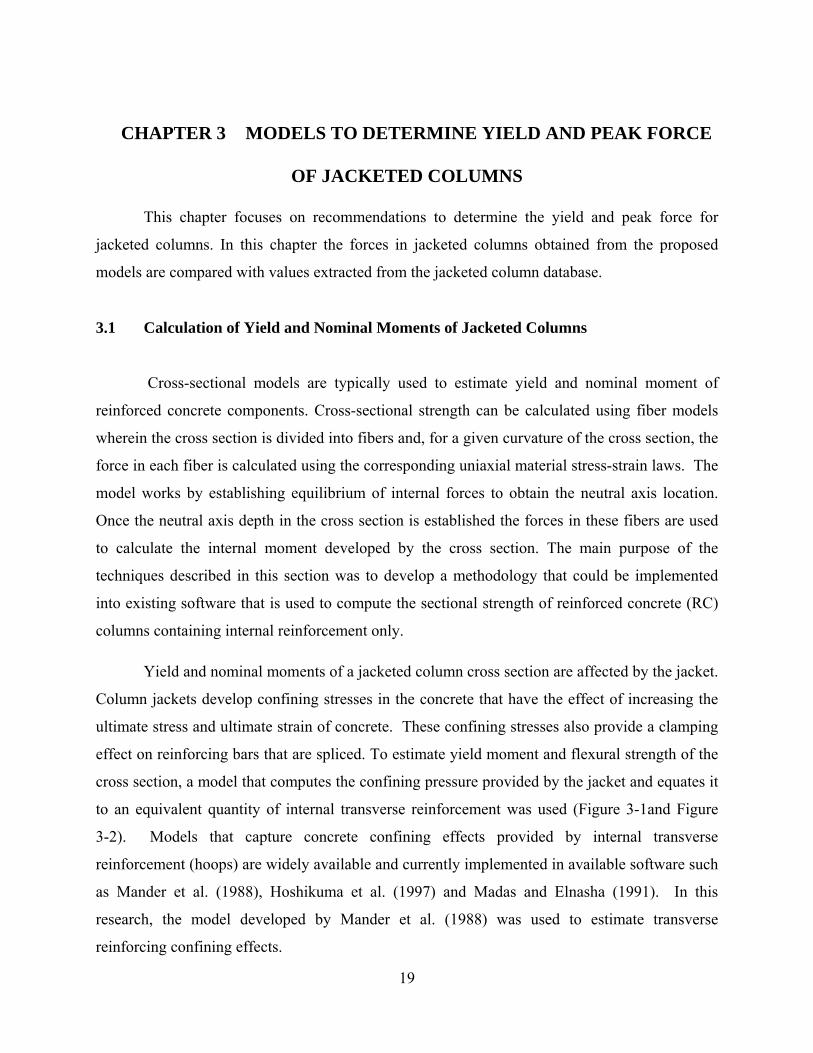
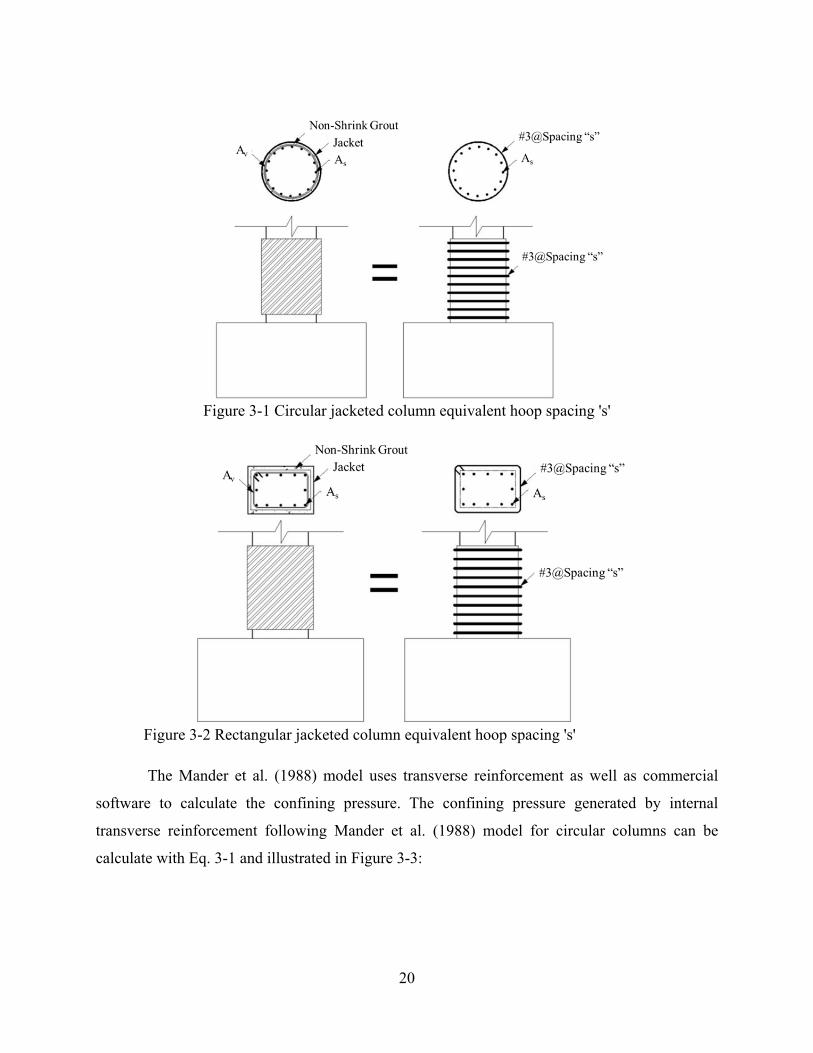
effect on reinforcing bars that are spliced. To estimate yield moment and flexural strength of the
cross section, a model that computes the confining pressure provided by the jacket and equates it
to an equivalent quantity of internal transverse reinforcement was used (Figure 3-1and Figure
3-2). Models that capture concrete confining effects provided by internal transverse
reinforcement (hoops) are widely available and currently implemented in available software such
as Mander et al. (1988), Hoshikuma et al. (1997) and Madas and Elnasha (1991). In this
research, the model developed by Mander et al. (1988) was used to estimate transverse
reinforcing confining effects.
20
Figure 3-1 Circular jacketed column equivalent hoop spacing 's'
Figure 3-2 Rectangular jacketed column equivalent hoop spacing 's'
The Mander et al. (1988) model uses transverse reinforcement as well as commercial
software to calculate the confining pressure. The confining pressure generated by internal
transverse reinforcement following Mander et al. (1988) model for circular columns can be
calculate with Eq. 3-1 and illustrated in Figure 3-3:
21
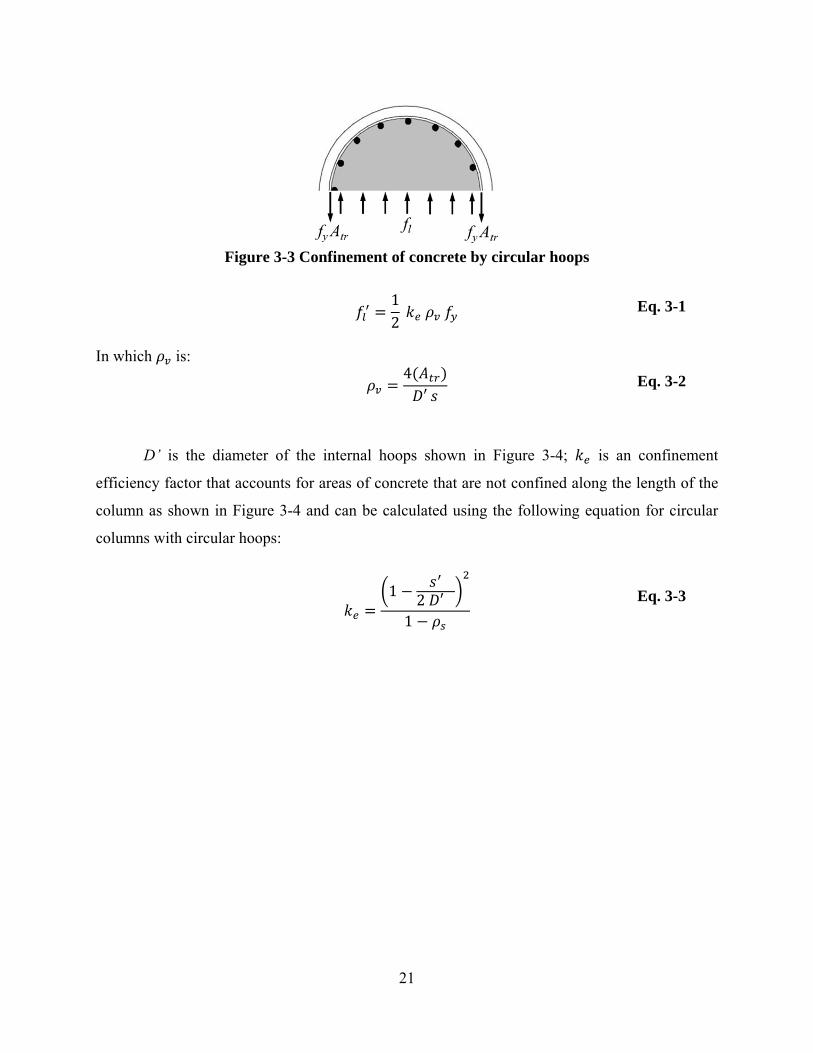
Figure 3-3 Confinement of concrete by circular hoops
12
Eq. 3-1
In which is:
4
′Eq. 3-2
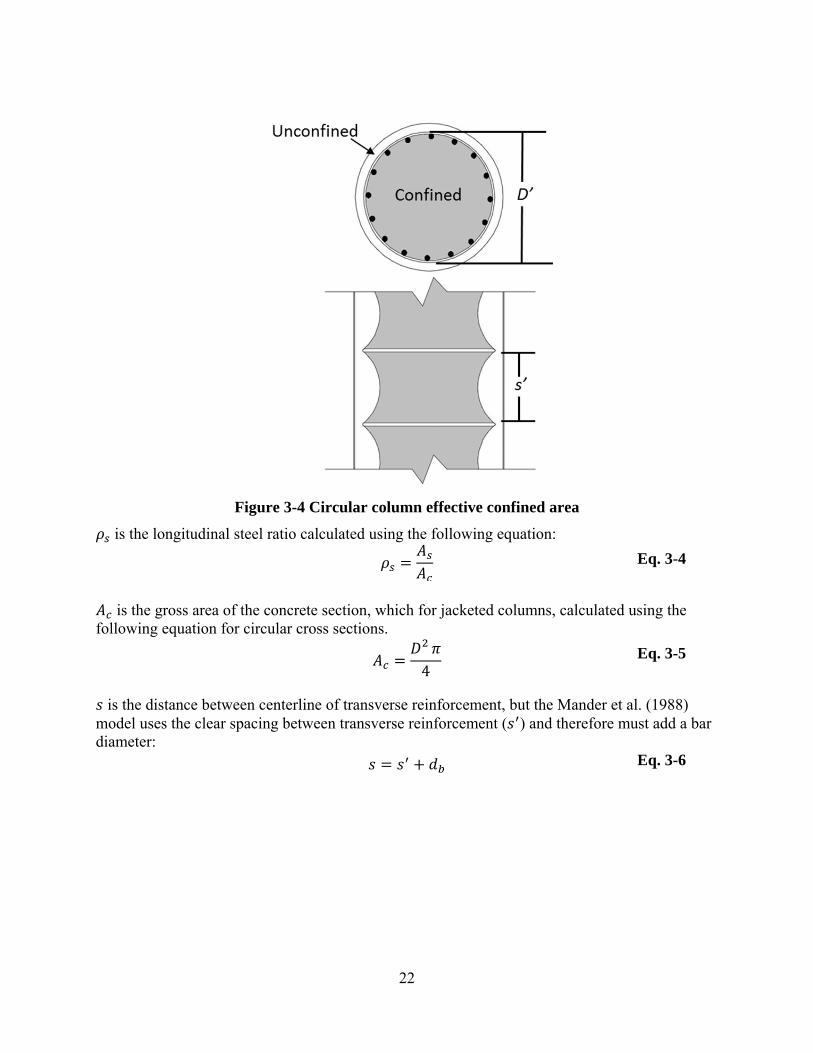
D’ is the diameter of the internal hoops shown in Figure 3-4; is an confinement
efficiency factor that accounts for areas of concrete that are not confined along the length of the
column as shown in Figure 3-4 and can be calculated using the following equation for circular
columns with circular hoops:
1 2 ′1
Eq. 3-3
22
Figure 3-4 Circular column effective confined area
is the longitudinal steel ratio calculated using the following equation:
Eq. 3-4
is the gross area of the concrete section, which for jacketed columns, calculated using the
following equation for circular cross sections.
4
Eq. 3-5
is the distance between centerline of transverse reinforcement, but the Mander et al. (1988)
model uses the clear spacing between transverse reinforcement ( ) and therefore must add a bar diameter:
Eq. 3-6
23
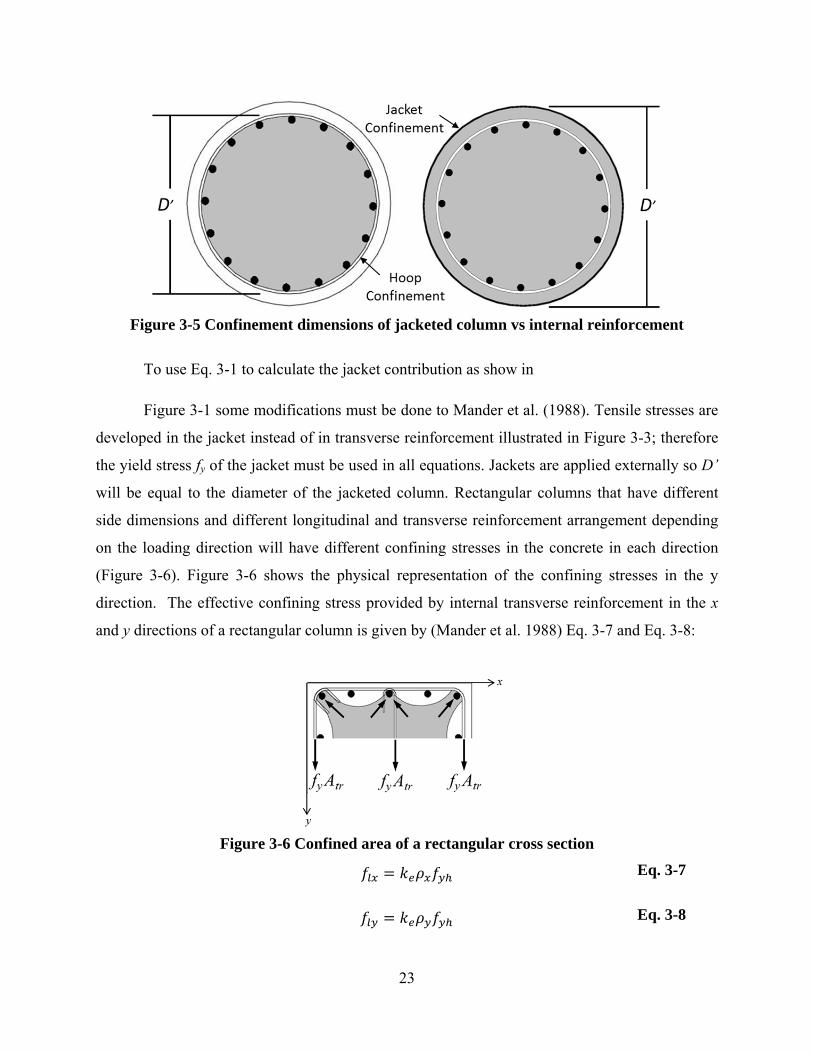
Figure 3-5 Confinement dimensions of jacketed column vs internal reinforcement
To use Eq. 3-1 to calculate the jacket contribution as show in
Figure 3-1 some modifications must be done to Mander et al. (1988). Tensile stresses are
developed in the jacket instead of in transverse reinforcement illustrated in Figure 3-3; therefore
the yield stress fy of the jacket must be used in all equations. Jackets are applied externally so D’
will be equal to the diameter of the jacketed column. Rectangular columns that have different
side dimensions and different longitudinal and transverse reinforcement arrangement depending
on the loading direction will have different confining stresses in the concrete in each direction
(Figure 3-6). Figure 3-6 shows the physical representation of the confining stresses in the y
direction. The effective confining stress provided by internal transverse reinforcement in the x
and y directions of a rectangular column is given by (Mander et al. 1988) Eq. 3-7 and Eq. 3-8:
Figure 3-6 Confined area of a rectangular cross section
Eq. 3-7
Eq. 3-8
24
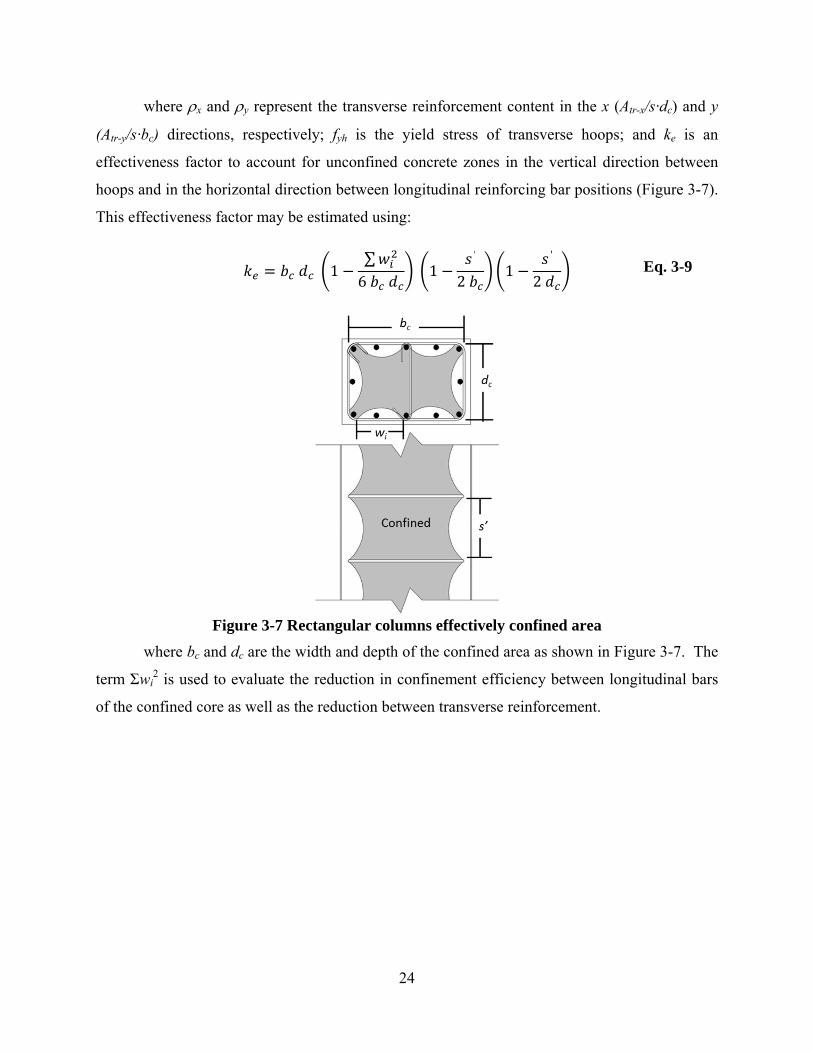
where x and y represent the transverse reinforcement content in the x (Atr-x/s·dc) and y
(Atr-y/s·bc) directions, respectively; fyh is the yield stress of transverse hoops; and ke is an
effectiveness factor to account for unconfined concrete zones in the vertical direction between
hoops and in the horizontal direction between longitudinal reinforcing bar positions (Figure 3-7).
This effectiveness factor may be estimated using:
1∑6
1′
21
′
2Eq. 3-9
Figure 3-7 Rectangular columns effectively confined area
where bc and dc are the width and depth of the confined area as shown in Figure 3-7. The
term Σwi2 is used to evaluate the reduction in confinement efficiency between longitudinal bars
of the confined core as well as the reduction between transverse reinforcement.
25
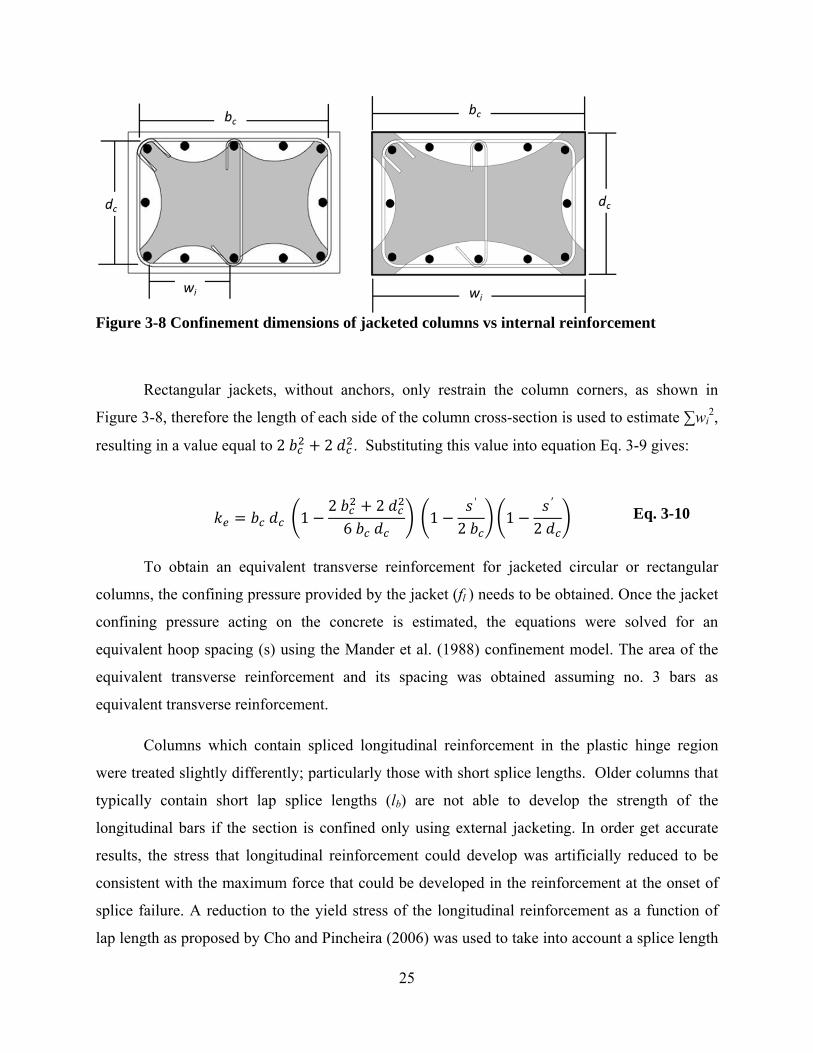
Figure 3-8 Confinement dimensions of jacketed columns vs internal reinforcement
Rectangular jackets, without anchors, only restrain the column corners, as shown in
Figure 3-8, therefore the length of each side of the column cross-section is used to estimate ∑wi2,
resulting in a value equal to 2 2 . Substituting this value into equation Eq. 3-9 gives:
12 26
1′
21
′
2 Eq. 3-10
To obtain an equivalent transverse reinforcement for jacketed circular or rectangular
columns, the confining pressure provided by the jacket (fl ) needs to be obtained. Once the jacket
confining pressure acting on the concrete is estimated, the equations were solved for an
equivalent hoop spacing (s) using the Mander et al. (1988) confinement model. The area of the
equivalent transverse reinforcement and its spacing was obtained assuming no. 3 bars as
equivalent transverse reinforcement.
Columns which contain spliced longitudinal reinforcement in the plastic hinge region
were treated slightly differently; particularly those with short splice lengths. Older columns that
typically contain short lap splice lengths (lb) are not able to develop the strength of the
longitudinal bars if the section is confined only using external jacketing. In order get accurate
results, the stress that longitudinal reinforcement could develop was artificially reduced to be
consistent with the maximum force that could be developed in the reinforcement at the onset of
splice failure. A reduction to the yield stress of the longitudinal reinforcement as a function of
lap length as proposed by Cho and Pincheira (2006) was used to take into account a splice length
26
shorter than the development length (ld) corresponding to reinforcing bar yielding. In Eq. 3-11
the design development length is decreased using a factor of 0.8, because development length
equations in ACI 318-11 section 12.2 already contain a safety factor of 1.25. The relation
between reinforcing bar stress developed as a function of lap splice length is not linear as
indicated by the 2/3 power affecting the normalized lap length term in (Eq. 3-11).
l
0.8
/
Eq. 3-11
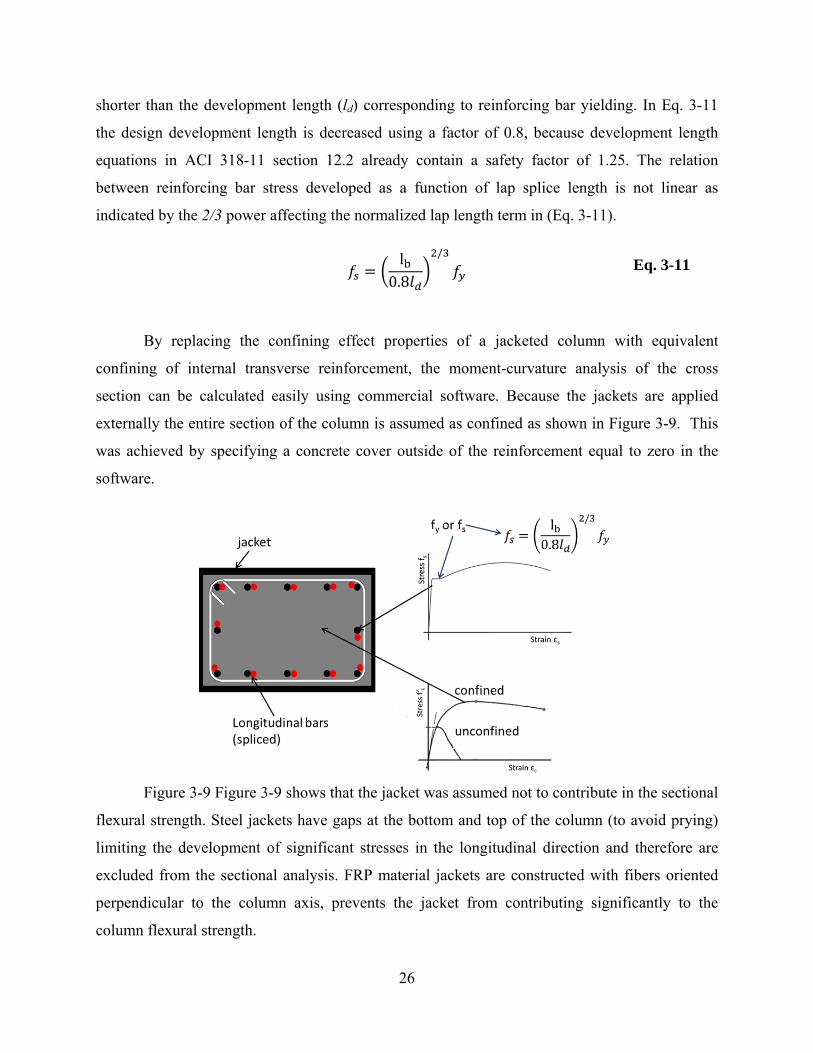
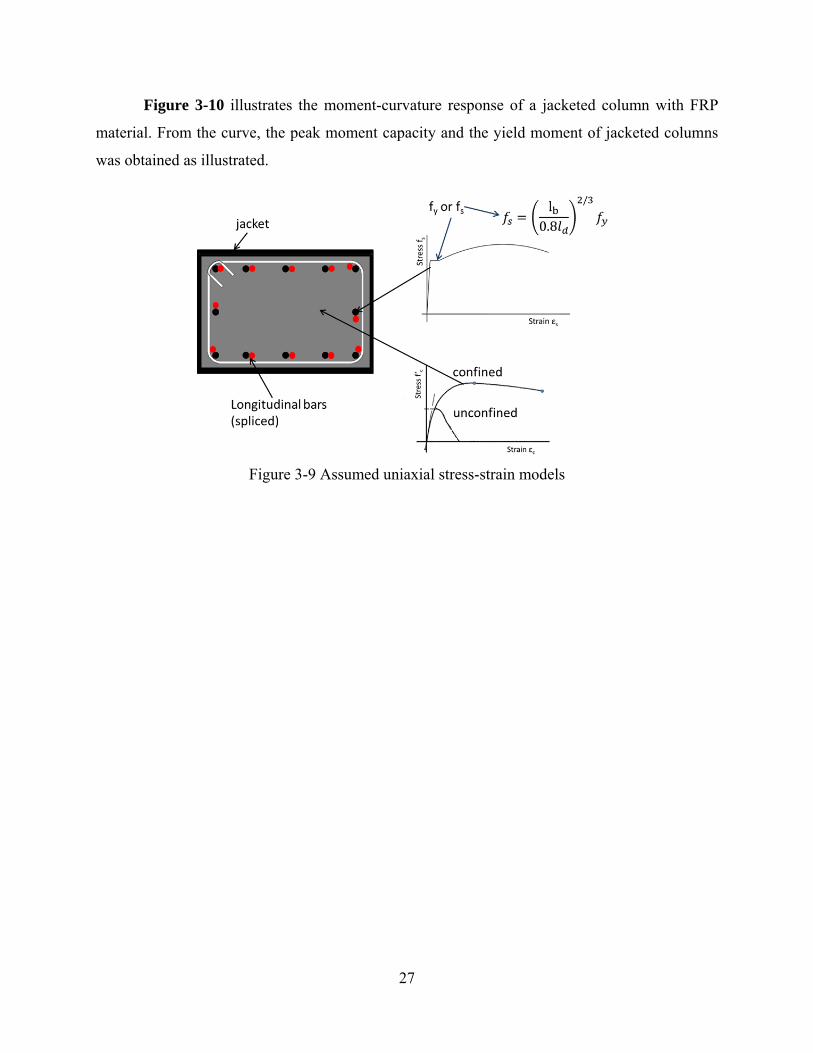
By replacing the confining effect properties of a jacketed column with equivalent
confining of internal transverse reinforcement, the moment-curvature analysis of the cross
section can be calculated easily using commercial software. Because the jackets are applied
externally the entire section of the column is assumed as confined as shown in Figure 3-9. This
was achieved by specifying a concrete cover outside of the reinforcement equal to zero in the
software.
Figure 3-9 Figure 3-9 shows that the jacket was assumed not to contribute in the sectional
flexural strength. Steel jackets have gaps at the bottom and top of the column (to avoid prying)
limiting the development of significant stresses in the longitudinal direction and therefore are
excluded from the sectional analysis. FRP material jackets are constructed with fibers oriented
perpendicular to the column axis, prevents the jacket from contributing significantly to the
column flexural strength.
27
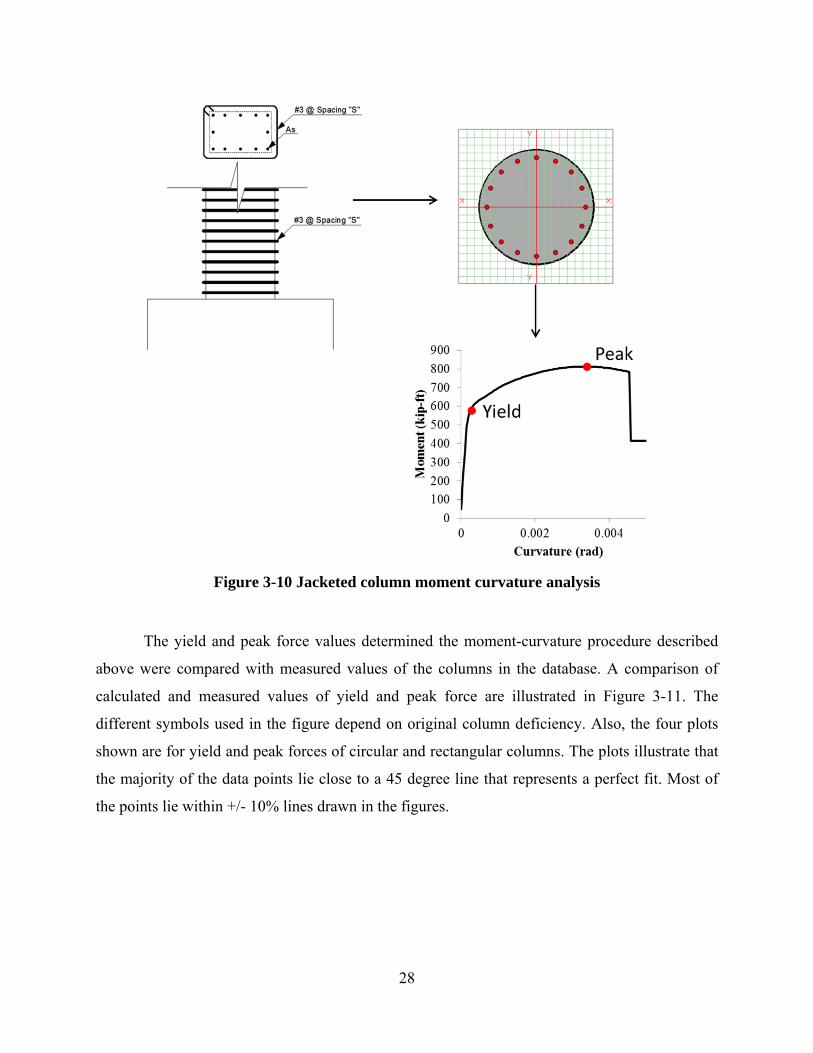
Figure 3-10 illustrates the moment-curvature response of a jacketed column with FRP
material. From the curve, the peak moment capacity and the yield moment of jacketed columns
was obtained as illustrated.
Figure 3-9 Assumed uniaxial stress-strain models
28
Figure 3-10 Jacketed column moment curvature analysis
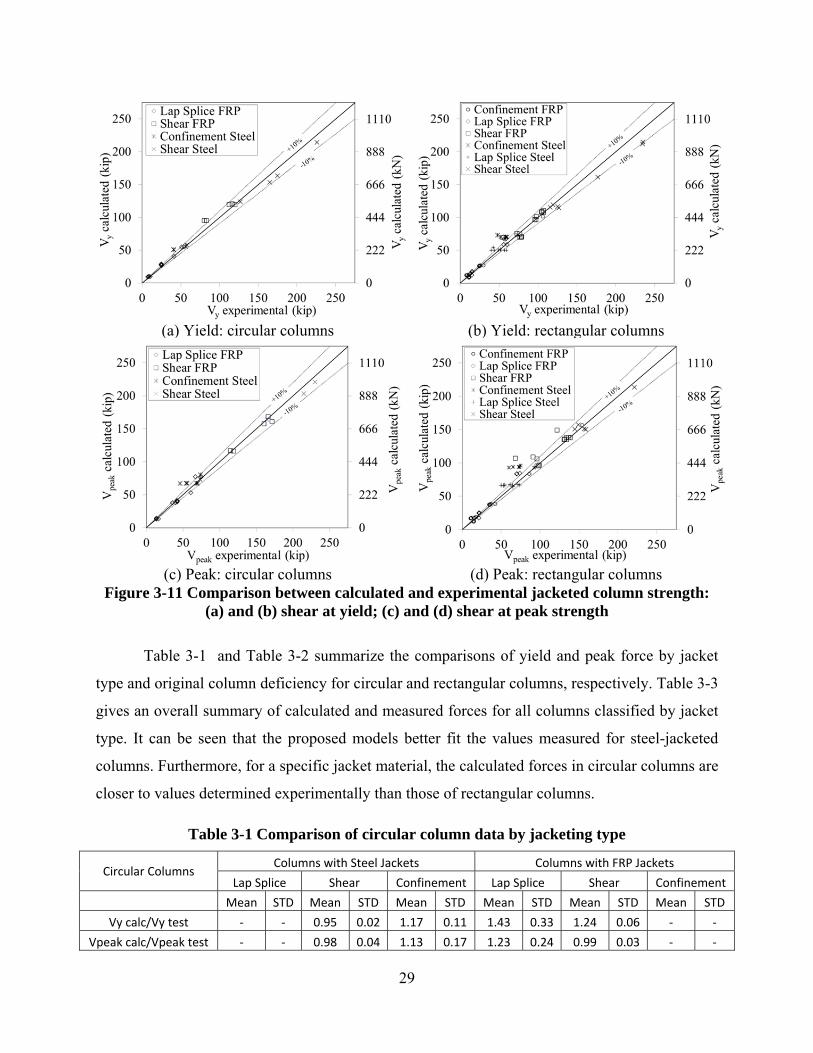
The yield and peak force values determined the moment-curvature procedure described
above were compared with measured values of the columns in the database. A comparison of
calculated and measured values of yield and peak force are illustrated in Figure 3-11. The
different symbols used in the figure depend on original column deficiency. Also, the four plots
shown are for yield and peak forces of circular and rectangular columns. The plots illustrate that
the majority of the data points lie close to a 45 degree line that represents a perfect fit. Most of
the points lie within +/- 10% lines drawn in the figures.
29
(a) Yield: circular columns (b) Yield: rectangular columns
(c) Peak: circular columns (d) Peak: rectangular columns Figure 3-11 Comparison between calculated and experimental jacketed column strength:
(a) and (b) shear at yield; (c) and (d) shear at peak strength
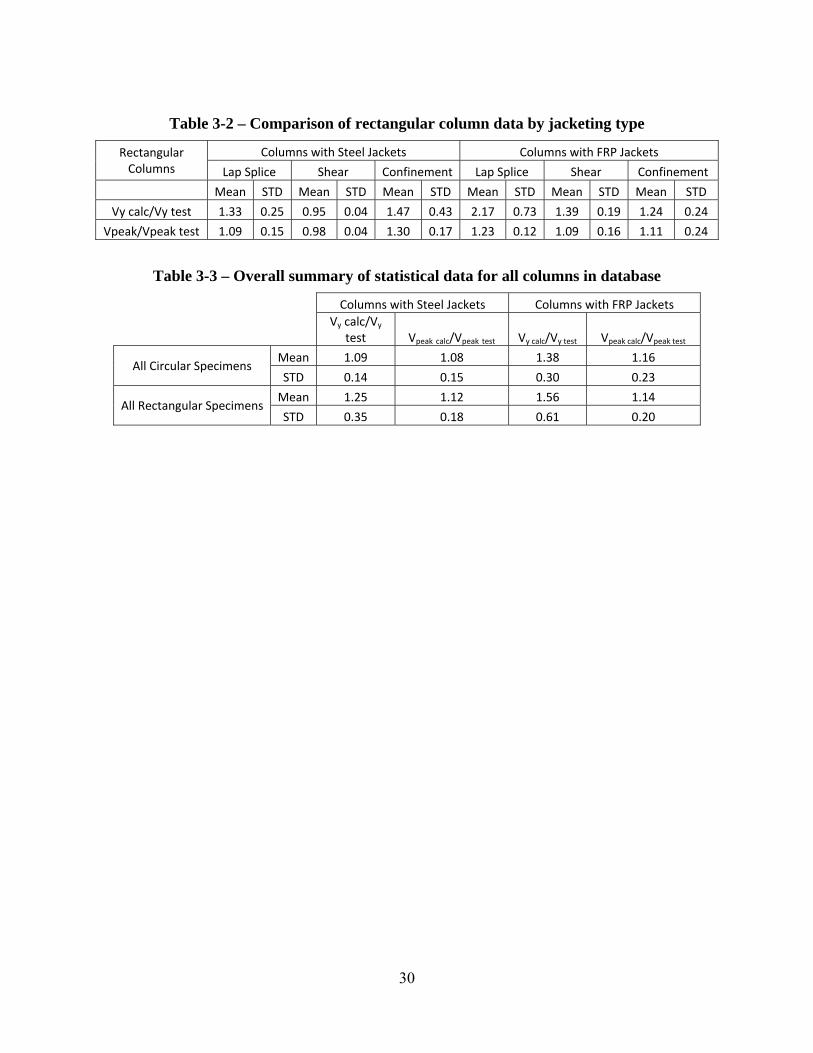
Table 3-1 and Table 3-2 summarize the comparisons of yield and peak force by jacket
type and original column deficiency for circular and rectangular columns, respectively. Table 3-3
gives an overall summary of calculated and measured forces for all columns classified by jacket
type. It can be seen that the proposed models better fit the values measured for steel-jacketed
columns. Furthermore, for a specific jacket material, the calculated forces in circular columns are
closer to values determined experimentally than those of rectangular columns.
Table 3-1 Comparison of circular column data by jacketing type
Circular Columns Columns with Steel Jackets Columns with FRP Jackets
Lap Splice Shear Confinement Lap Splice Shear Confinement
Mean STD Mean STD Mean STD Mean STD Mean STD Mean STD
Vy calc/Vy test ‐ ‐ 0.95 0.02 1.17 0.11 1.43 0.33 1.24 0.06 ‐ ‐
Vpeak calc/Vpeak test ‐ ‐ 0.98 0.04 1.13 0.17 1.23 0.24 0.99 0.03 ‐ ‐
30
Table 3-2 – Comparison of rectangular column data by jacketing type
Rectangular Columns
Columns with Steel Jackets Columns with FRP Jackets
Lap Splice Shear Confinement Lap Splice Shear Confinement
Mean STD Mean STD Mean STD Mean STD Mean STD Mean STD
Vy calc/Vy test 1.33 0.25 0.95 0.04 1.47 0.43 2.17 0.73 1.39 0.19 1.24 0.24
Vpeak/Vpeak test 1.09 0.15 0.98 0.04 1.30 0.17 1.23 0.12 1.09 0.16 1.11 0.24
Table 3-3 – Overall summary of statistical data for all columns in database
Columns with Steel Jackets Columns with FRP Jackets
Vy calc/Vy
test Vpeak calc/Vpeak test Vy calc/Vy test Vpeak calc/Vpeak test
All Circular Specimens Mean 1.09 1.08 1.38 1.16
STD 0.14 0.15 0.30 0.23
All Rectangular Specimens Mean 1.25 1.12 1.56 1.14
STD 0.35 0.18 0.61 0.20
31
CHAPTER 4 NON-LINEAR DEFORMATION PARAMETERS OF
JACKETED COLUMNS
This chapter presents the procedure that was followed to estimate non-linear deformation
parameters for FRP- or steel-jacketed columns. Because of the large variety of testing
configurations and retrofitting arrangements, and because of the lack of physical models that
describe column lateral deformations laterally, a statistical approach was followed to estimate
jacketed column deformations at different levels.
4.1 Histograms and Statistical Properties of Jacketed Columns in Database
The laboratory tests had different arrangements and column sizes, so deformations
measured during the tests were normalized by height to obtain drift (Δ/ ). The deformation data
was then classified by jacketing materials, 84 and 32 columns retrofitted using FRP and steel
materials, respectively.
The deformation parameters were studied statistically to determine deformation values
for jacketed columns. Some physical constraints had to be applied to the statistical analysis to
reflect physical behavior of jacketed columns. The constraints included are:
- Deformations cannot be negative
- Yield deformation is equal or lower than the deformation at peak (Δ Δ ).
- The maximum deformation cannot exceed a drift of 10%
- The yield deformation should remain below a 2% drift
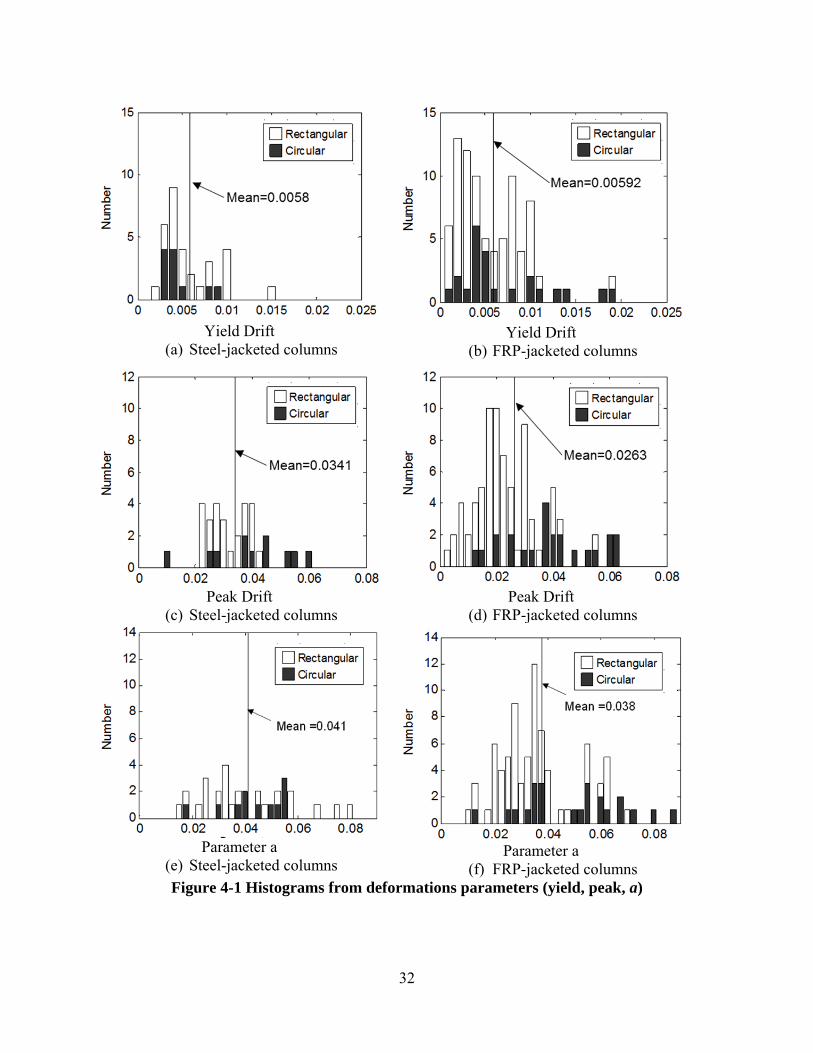
Figure 4-1 shows histograms of deformations at yield and peak of jacketed columns and
the corresponding Parameter a. From these results it can be observed that both jacket materials
resulted in similar yield deformations of jacketed columns but notably different values of peak
deformation.
32
Yield Drift (a) Steel-jacketed columns
Yield Drift (b) FRP-jacketed columns
Peak Drift (c) Steel-jacketed columns
Peak Drift (d) FRP-jacketed columns
Parameter a (e) Steel-jacketed columns
Parameter a (f) FRP-jacketed columns
Figure 4-1 Histograms from deformations parameters (yield, peak, a)
33
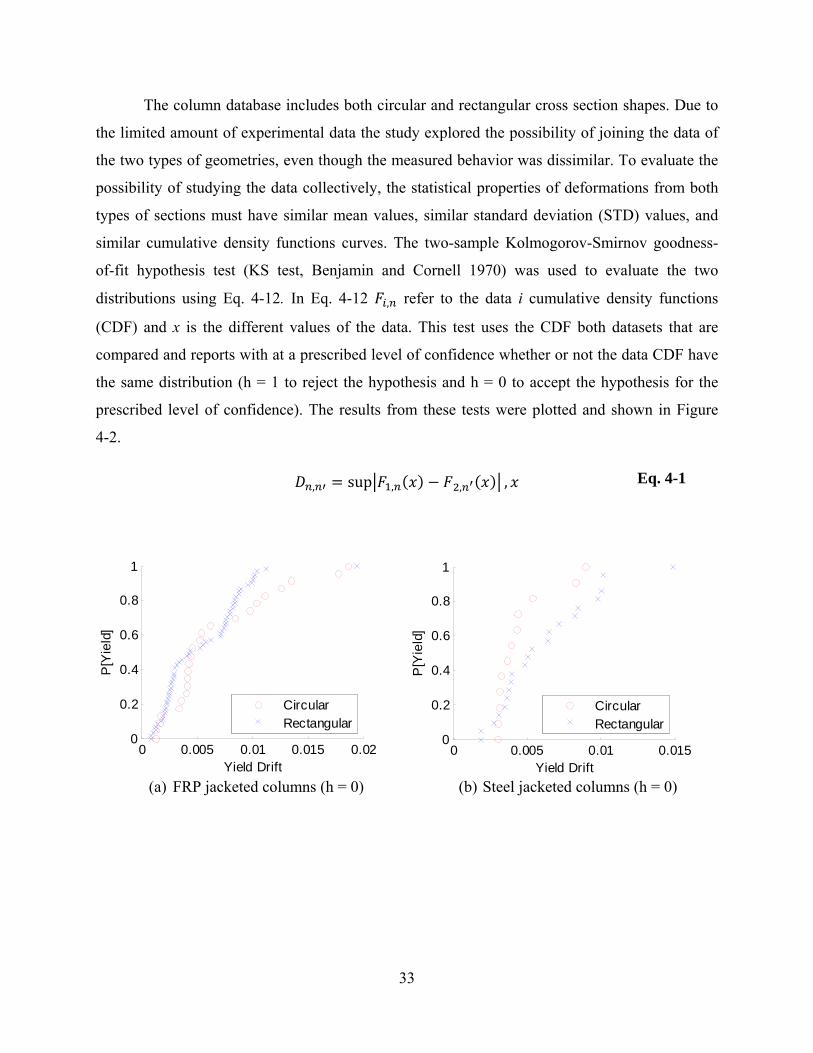
The column database includes both circular and rectangular cross section shapes. Due to
the limited amount of experimental data the study explored the possibility of joining the data of
the two types of geometries, even though the measured behavior was dissimilar. To evaluate the
possibility of studying the data collectively, the statistical properties of deformations from both
types of sections must have similar mean values, similar standard deviation (STD) values, and
similar cumulative density functions curves. The two-sample Kolmogorov-Smirnov goodness-
of-fit hypothesis test (KS test, Benjamin and Cornell 1970) was used to evaluate the two
distributions using Eq. 4-12. In Eq. 4-12 , refer to the data i cumulative density functions
(CDF) and x is the different values of the data. This test uses the CDF both datasets that are
compared and reports with at a prescribed level of confidence whether or not the data CDF have
the same distribution (h = 1 to reject the hypothesis and h = 0 to accept the hypothesis for the
prescribed level of confidence). The results from these tests were plotted and shown in Figure
4-2.
, sup , , , Eq. 4-1
(a) FRP jacketed columns (h = 0) (b) Steel jacketed columns (h = 0)
0 0.005 0.01 0.015 0.020
0.2
0.4
0.6
0.8
1
Yield Drift
P[Y
ield
]
CircularRectangular
0 0.005 0.01 0.0150
0.2
0.4
0.6
0.8
1S S 0
Yield Drift
P[Y
ield
]
CircularRectangular
34
(c) FRP jacketed columns (h = 1) (d) Steel jacketed columns (h = 1)
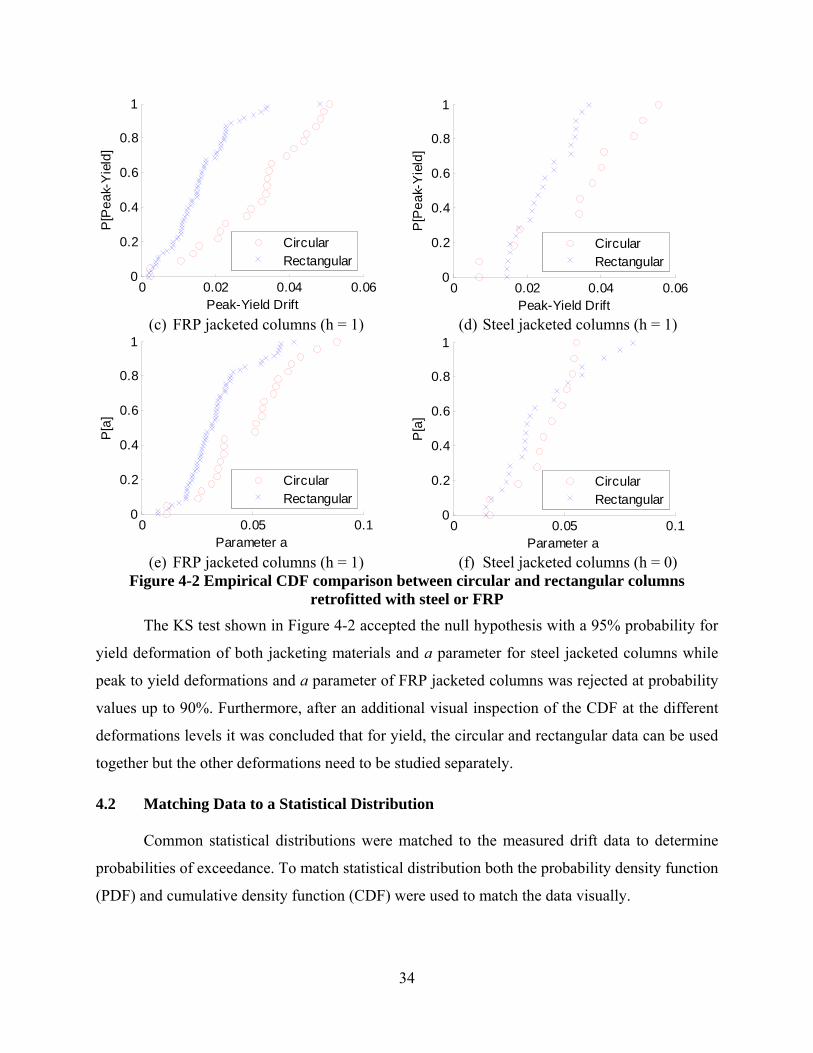
(e) FRP jacketed columns (h = 1) (f) Steel jacketed columns (h = 0) Figure 4-2 Empirical CDF comparison between circular and rectangular columns
retrofitted with steel or FRP
The KS test shown in Figure 4-2 accepted the null hypothesis with a 95% probability for
yield deformation of both jacketing materials and a parameter for steel jacketed columns while
peak to yield deformations and a parameter of FRP jacketed columns was rejected at probability
values up to 90%. Furthermore, after an additional visual inspection of the CDF at the different
deformations levels it was concluded that for yield, the circular and rectangular data can be used
together but the other deformations need to be studied separately.
4.2 Matching Data to a Statistical Distribution
Common statistical distributions were matched to the measured drift data to determine
probabilities of exceedance. To match statistical distribution both the probability density function
(PDF) and cumulative density function (CDF) were used to match the data visually.
0 0.02 0.04 0.060
0.2
0.4
0.6
0.8
1
Peak-Yield Drift
P[P
ea
k-Y
ield
]
CircularRectangular
0 0.02 0.04 0.060
0.2
0.4
0.6
0.8
1
Peak-Yield Drift
P[P
ea
k-Y
ield
]
CircularRectangular
0 0.05 0.10
0.2
0.4
0.6
0.8
1
Parameter a
P[a
]
CircularRectangular
0 0.05 0.10
0.2
0.4
0.6
0.8
1
Parameter a
P[a
]
CircularRectangular
35
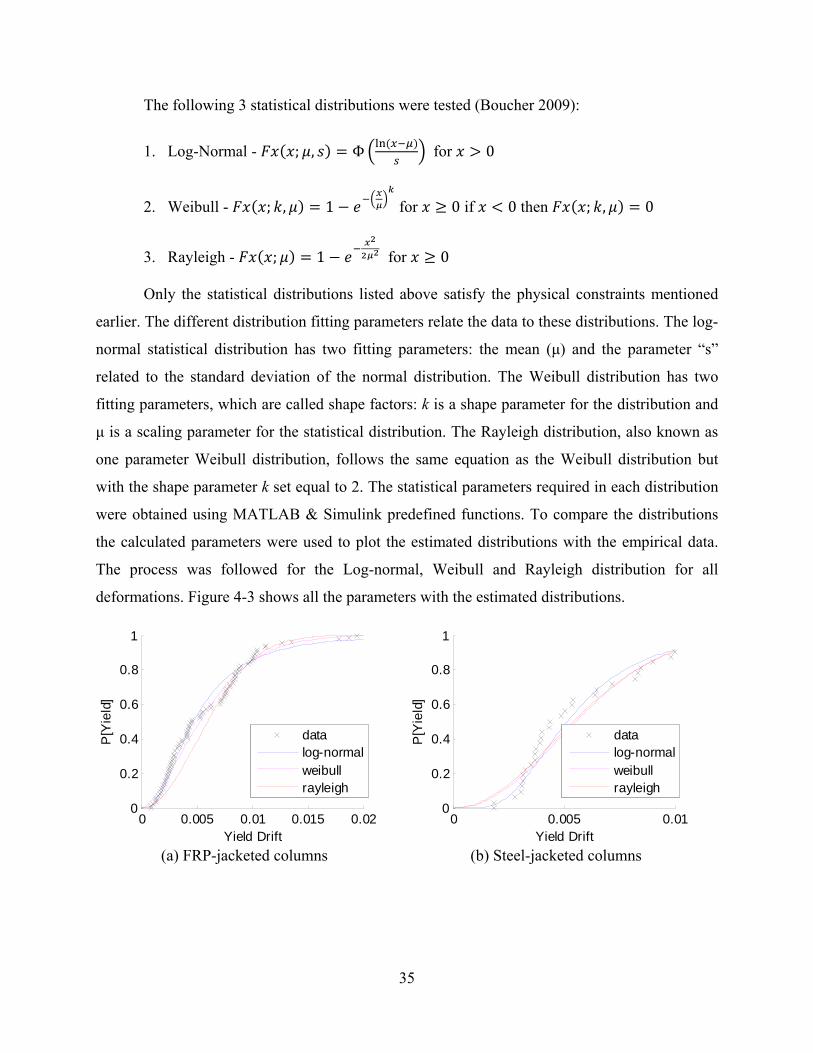
The following 3 statistical distributions were tested (Boucher 2009):
1. Log-Normal - ; , Φ for 0
2. Weibull - ; , 1 for 0 if 0 then ; , 0
3. Rayleigh - ; 1 for 0
Only the statistical distributions listed above satisfy the physical constraints mentioned
earlier. The different distribution fitting parameters relate the data to these distributions. The log-
normal statistical distribution has two fitting parameters: the mean (μ) and the parameter “s”
related to the standard deviation of the normal distribution. The Weibull distribution has two
fitting parameters, which are called shape factors: k is a shape parameter for the distribution and
μ is a scaling parameter for the statistical distribution. The Rayleigh distribution, also known as
one parameter Weibull distribution, follows the same equation as the Weibull distribution but
with the shape parameter k set equal to 2. The statistical parameters required in each distribution
were obtained using MATLAB & Simulink predefined functions. To compare the distributions
the calculated parameters were used to plot the estimated distributions with the empirical data.
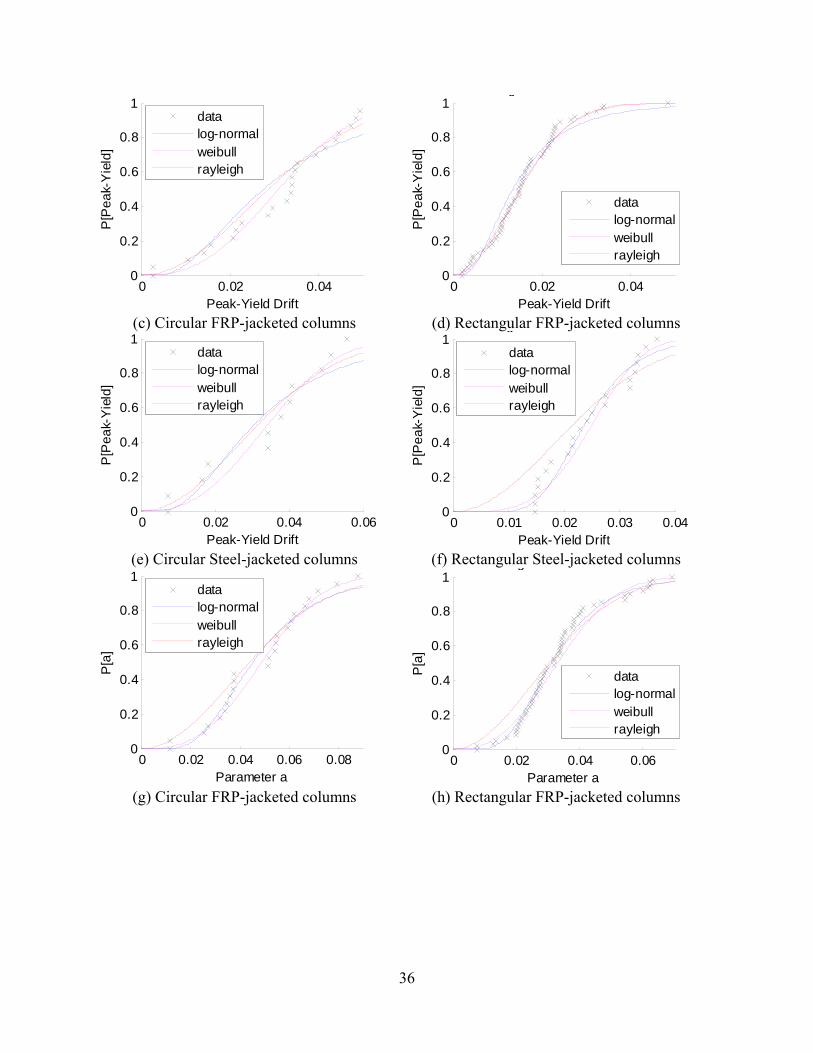
The process was followed for the Log-normal, Weibull and Rayleigh distribution for all
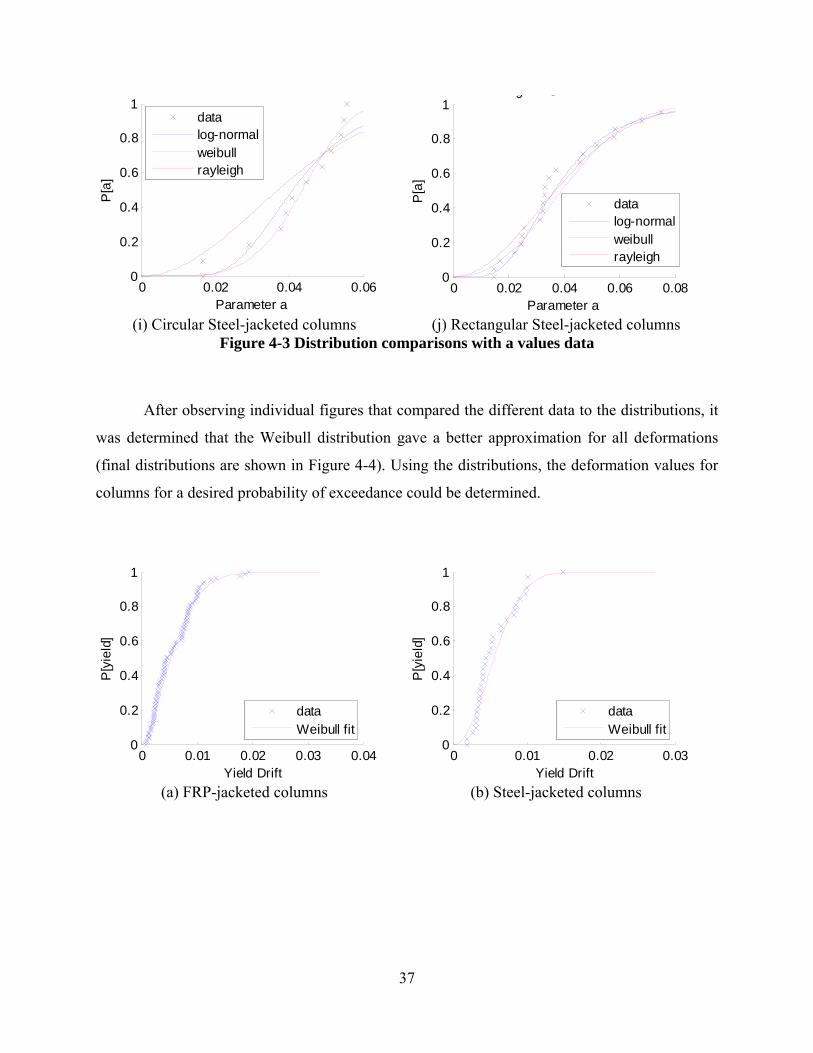
deformations. Figure 4-3 shows all the parameters with the estimated distributions.
(a) FRP-jacketed columns (b) Steel-jacketed columns
0 0.005 0.01 0.015 0.020
0.2
0.4
0.6
0.8
1
Yield Drift
P[Y
ield
]
datalog-normalweibullrayleigh
0 0.005 0.010
0.2
0.4
0.6
0.8
1
Yield Drift
P[Y
ield
]
datalog-normalweibullrayleigh
36
(c) Circular FRP-jacketed columns (d) Rectangular FRP-jacketed columns
(e) Circular Steel-jacketed columns (f) Rectangular Steel-jacketed columns
(g) Circular FRP-jacketed columns (h) Rectangular FRP-jacketed columns
0 0.02 0.040
0.2
0.4
0.6
0.8
1
Peak-Yield Drift
P[P
ea
k-Y
ield
]
datalog-normalweibullrayleigh
0 0.02 0.040
0.2
0.4
0.6
0.8
1
Peak-Yield Drift
P[P
ea
k-Y
ield
]
g
datalog-normalweibullrayleigh
0 0.02 0.04 0.060
0.2
0.4
0.6
0.8
1
Peak-Yield Drift
P[P
ea
k-Y
ield
]
datalog-normalweibullrayleigh
0 0.01 0.02 0.03 0.040
0.2
0.4
0.6
0.8
1
Peak-Yield Drift
P[P
ea
k-Y
ield
]
g
datalog-normalweibullrayleigh
0 0.02 0.04 0.06 0.080
0.2
0.4
0.6
0.8
1
Parameter a
P[a
]
datalog-normalweibullrayleigh
0 0.02 0.04 0.060
0.2
0.4
0.6
0.8
1
Parameter a
P[a
]
g
datalog-normalweibullrayleigh
37
(i) Circular Steel-jacketed columns (j) Rectangular Steel-jacketed columns Figure 4-3 Distribution comparisons with a values data
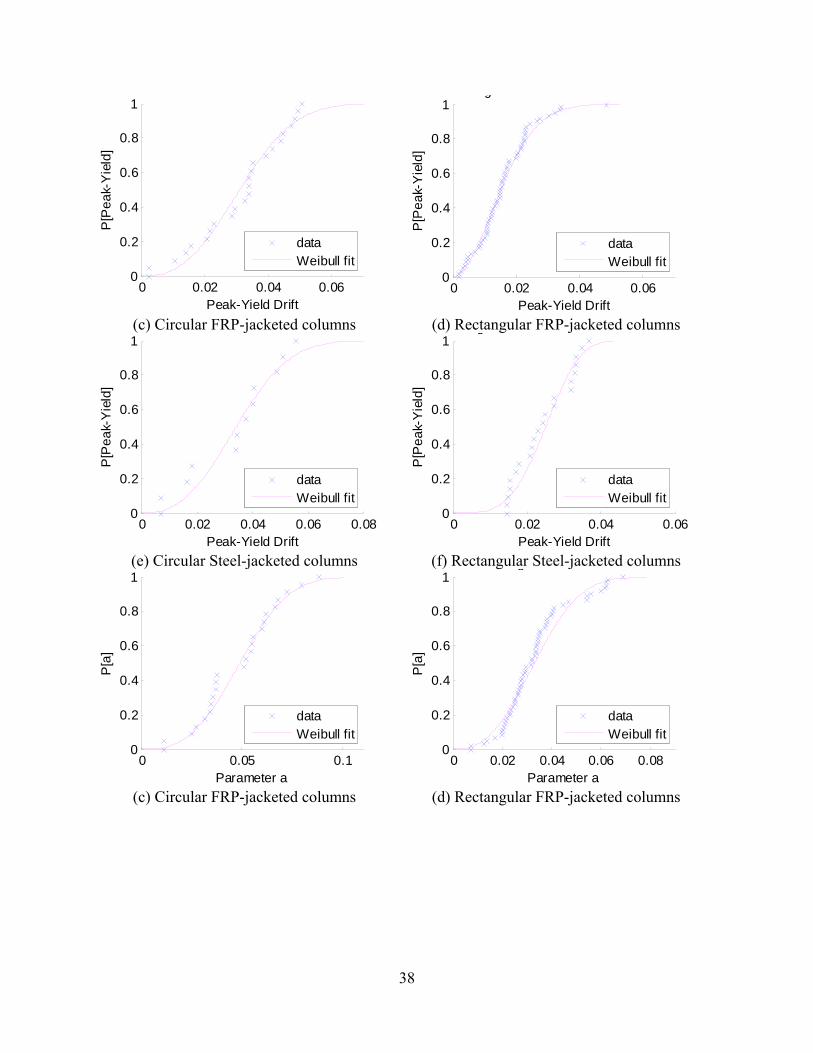
After observing individual figures that compared the different data to the distributions, it
was determined that the Weibull distribution gave a better approximation for all deformations
(final distributions are shown in Figure 4-4). Using the distributions, the deformation values for
columns for a desired probability of exceedance could be determined.
(a) FRP-jacketed columns (b) Steel-jacketed columns
0 0.02 0.04 0.060
0.2
0.4
0.6
0.8
1
Parameter a
P[a
]
datalog-normalweibullrayleigh
0 0.02 0.04 0.06 0.080
0.2
0.4
0.6
0.8
1
Parameter a
P[a
]
g S
datalog-normalweibullrayleigh
0 0.01 0.02 0.03 0.040
0.2
0.4
0.6
0.8
1
Yield Drift
P[y
ield
]
dataWeibull fit
0 0.01 0.02 0.030
0.2
0.4
0.6
0.8
1
Yield Drift
P[y
ield
]
dataWeibull fit
38
(c) Circular FRP-jacketed columns (d) Rectangular FRP-jacketed columns
(e) Circular Steel-jacketed columns (f) Rectangular Steel-jacketed columns
(c) Circular FRP-jacketed columns (d) Rectangular FRP-jacketed columns
0 0.02 0.04 0.060
0.2
0.4
0.6
0.8
1
Peak-Yield Drift
P[P
ea
k-Y
ield
]
dataWeibull fit
0 0.02 0.04 0.060
0.2
0.4
0.6
0.8
1
Peak-Yield Drift
P[P
ea
k-Y
ield
]
g
dataWeibull fit
0 0.02 0.04 0.06 0.080
0.2
0.4
0.6
0.8
1
Peak-Yield Drift
P[P
ea
k-Y
ield
]
dataWeibull fit
0 0.02 0.04 0.060
0.2
0.4
0.6
0.8
1
Peak-Yield Drift
P[P
ea
k-Y
ield
]
g
dataWeibull fit
0 0.05 0.10
0.2
0.4
0.6
0.8
1
Parameter a
P[a
]
dataWeibull fit
0 0.02 0.04 0.06 0.080
0.2
0.4
0.6
0.8
1
Parameter a
P[a
]
g
dataWeibull fit
39
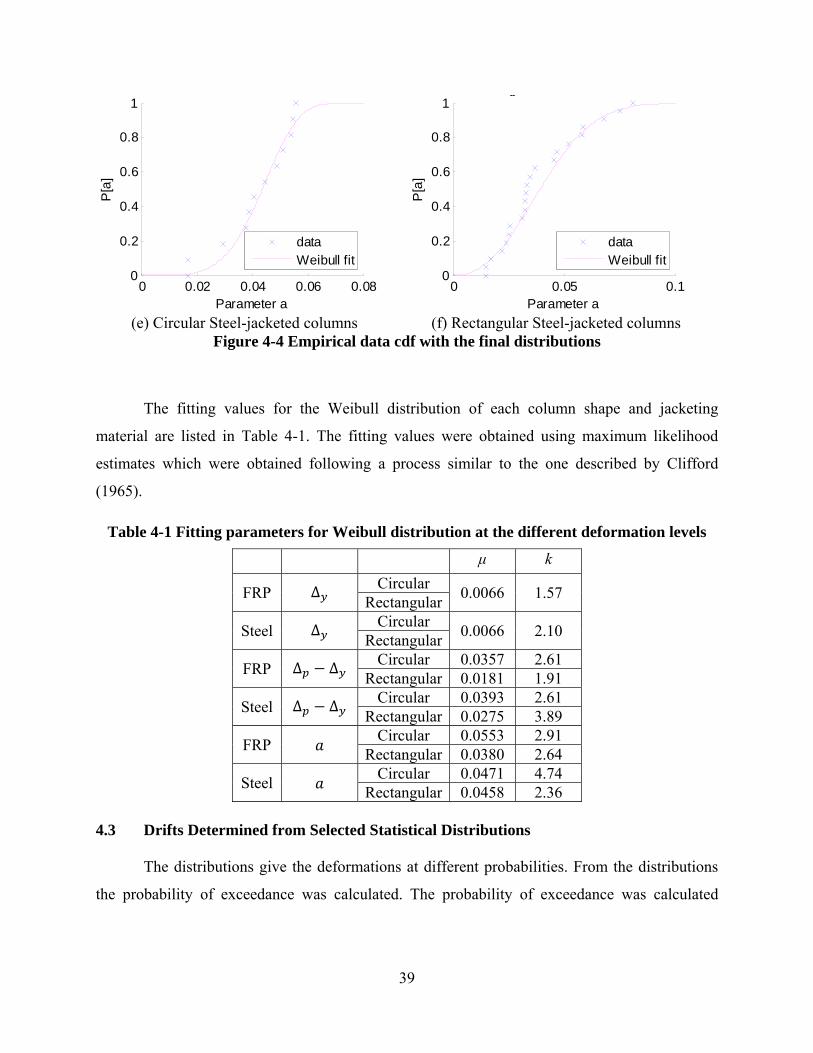
(e) Circular Steel-jacketed columns (f) Rectangular Steel-jacketed columns Figure 4-4 Empirical data cdf with the final distributions
The fitting values for the Weibull distribution of each column shape and jacketing
material are listed in Table 4-1. The fitting values were obtained using maximum likelihood
estimates which were obtained following a process similar to the one described by Clifford
(1965).
Table 4-1 Fitting parameters for Weibull distribution at the different deformation levels
μ k
FRP Δ Circular 0.0066 1.57
Rectangular
Steel Δ Circular 0.0066 2.10
Rectangular
FRP Δ Δ Circular 0.0357 2.61 Rectangular 0.0181 1.91
Steel Δ Δ Circular 0.0393 2.61 Rectangular 0.0275 3.89
FRP Circular 0.0553 2.91
Rectangular 0.0380 2.64
Steel Circular 0.0471 4.74
Rectangular 0.0458 2.36 4.3 Drifts Determined from Selected Statistical Distributions
The distributions give the deformations at different probabilities. From the distributions
the probability of exceedance was calculated. The probability of exceedance was calculated
0 0.02 0.04 0.06 0.080
0.2
0.4
0.6
0.8
1
Parameter a
P[a
]
dataWeibull fit
0 0.05 0.10
0.2
0.4
0.6
0.8
1
Parameter a
P[a
]
g
dataWeibull fit
40
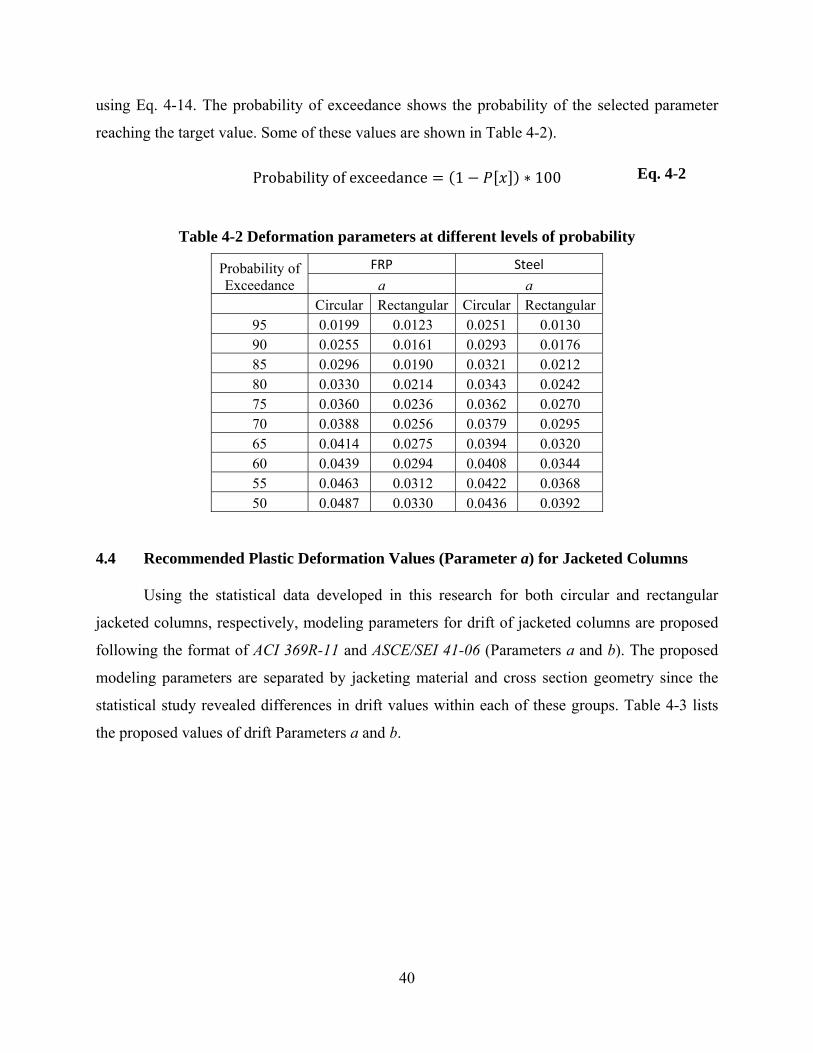
using Eq. 4-14. The probability of exceedance shows the probability of the selected parameter
reaching the target value. Some of these values are shown in Table 4-2).
Probability of exceedance 1 ∗ 100 Eq. 4-2
Table 4-2 Deformation parameters at different levels of probability
Probability of Exceedance
FRP Steel
a a Circular Rectangular Circular Rectangular
95 0.0199 0.0123 0.0251 0.0130 90 0.0255 0.0161 0.0293 0.0176 85 0.0296 0.0190 0.0321 0.0212 80 0.0330 0.0214 0.0343 0.0242 75 0.0360 0.0236 0.0362 0.0270 70 0.0388 0.0256 0.0379 0.0295 65 0.0414 0.0275 0.0394 0.0320 60 0.0439 0.0294 0.0408 0.0344 55 0.0463 0.0312 0.0422 0.0368 50 0.0487 0.0330 0.0436 0.0392
4.4 Recommended Plastic Deformation Values (Parameter a) for Jacketed Columns
Using the statistical data developed in this research for both circular and rectangular
jacketed columns, respectively, modeling parameters for drift of jacketed columns are proposed
following the format of ACI 369R-11 and ASCE/SEI 41-06 (Parameters a and b). The proposed
modeling parameters are separated by jacketing material and cross section geometry since the
statistical study revealed differences in drift values within each of these groups. Table 4-3 lists
the proposed values of drift Parameters a and b.
41
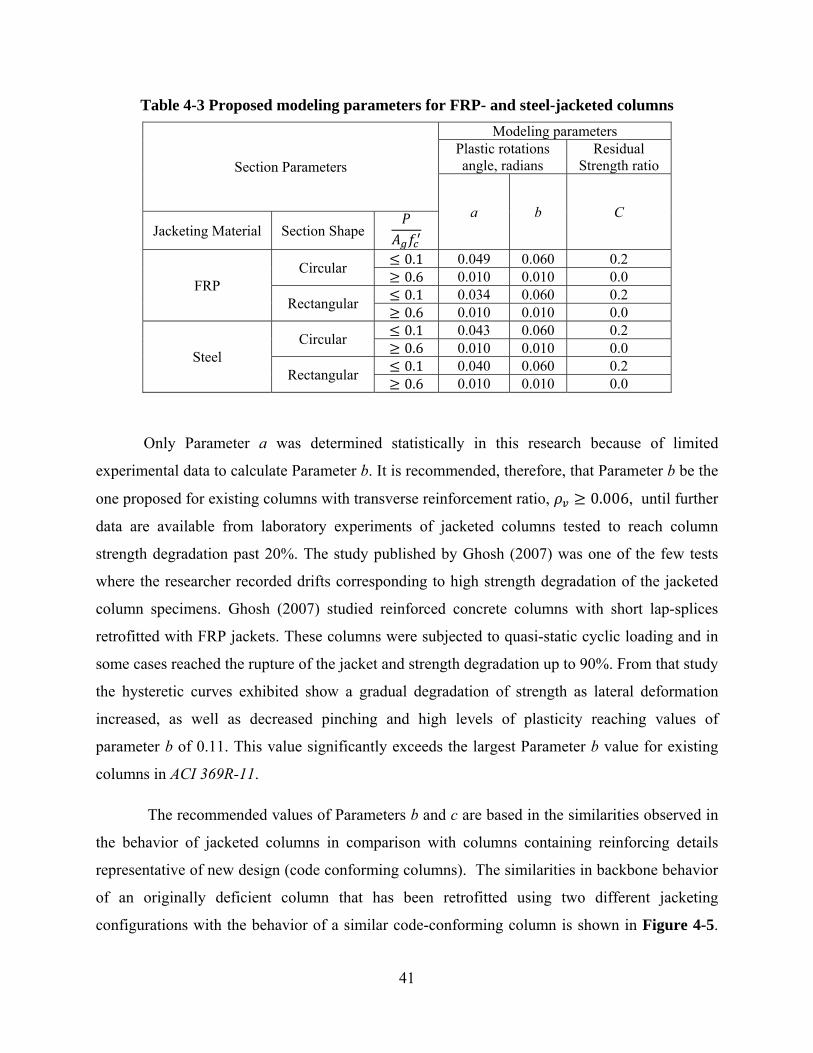
Table 4-3 Proposed modeling parameters for FRP- and steel-jacketed columns
Section Parameters
Modeling parameters Plastic rotations angle, radians
Residual Strength ratio
a b C Jacketing Material Section Shape
FRP Circular
0.1 0.049 0.060 0.2 0.6 0.010 0.010 0.0
Rectangular 0.1 0.034 0.060 0.2 0.6 0.010 0.010 0.0
Steel Circular
0.1 0.043 0.060 0.2 0.6 0.010 0.010 0.0
Rectangular 0.1 0.040 0.060 0.2 0.6 0.010 0.010 0.0
Only Parameter a was determined statistically in this research because of limited
experimental data to calculate Parameter b. It is recommended, therefore, that Parameter b be the
one proposed for existing columns with transverse reinforcement ratio, 0.006, until further
data are available from laboratory experiments of jacketed columns tested to reach column
strength degradation past 20%. The study published by Ghosh (2007) was one of the few tests
where the researcher recorded drifts corresponding to high strength degradation of the jacketed
column specimens. Ghosh (2007) studied reinforced concrete columns with short lap-splices
retrofitted with FRP jackets. These columns were subjected to quasi-static cyclic loading and in
some cases reached the rupture of the jacket and strength degradation up to 90%. From that study
the hysteretic curves exhibited show a gradual degradation of strength as lateral deformation
increased, as well as decreased pinching and high levels of plasticity reaching values of
parameter b of 0.11. This value significantly exceeds the largest Parameter b value for existing
columns in ACI 369R-11.
The recommended values of Parameters b and c are based in the similarities observed in
the behavior of jacketed columns in comparison with columns containing reinforcing details
representative of new design (code conforming columns). The similarities in backbone behavior
of an originally deficient column that has been retrofitted using two different jacketing
configurations with the behavior of a similar code-conforming column is shown in Figure 4-5.
42
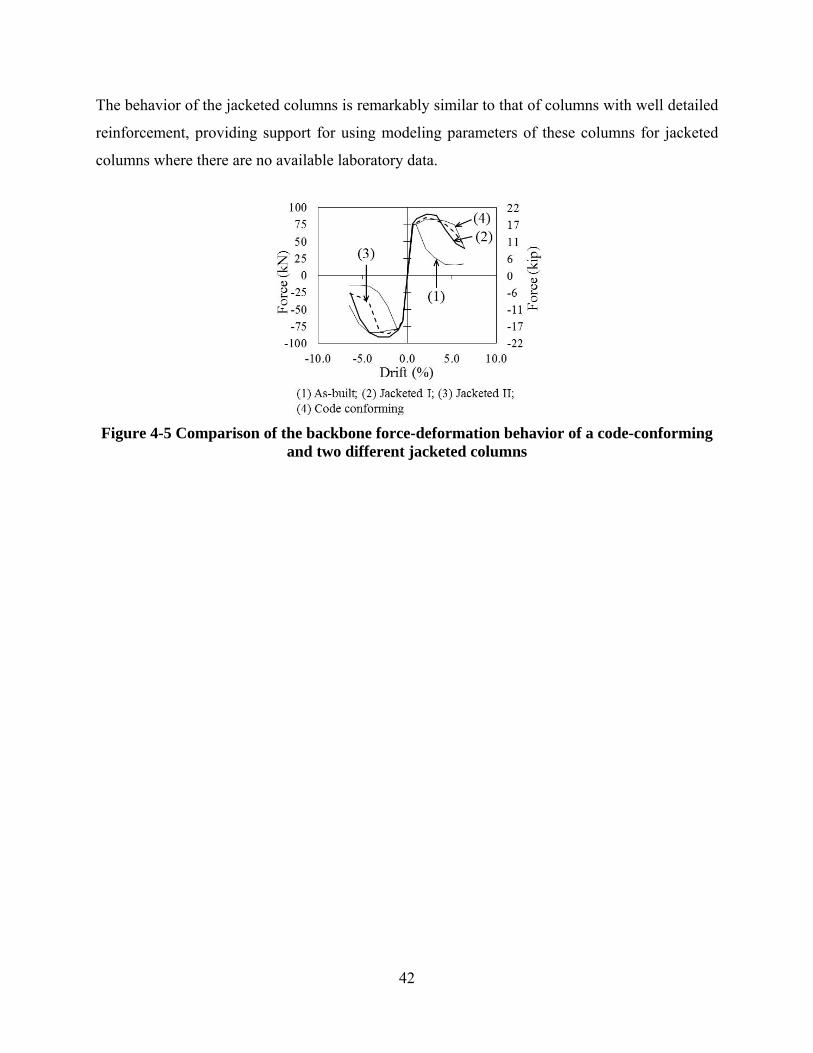
The behavior of the jacketed columns is remarkably similar to that of columns with well detailed
reinforcement, providing support for using modeling parameters of these columns for jacketed
columns where there are no available laboratory data.
Figure 4-5 Comparison of the backbone force-deformation behavior of a code-conforming
and two different jacketed columns
43
CHAPTER 5 SUMMARY AND CONCLUSIONS
This research concentrated on determining nonlinear modeling parameters for
jacketed reinforced concrete columns based on behavior measured during laboratory
tests. The jacketing materials studied included either fiber reinforced polymers (FRP) or
steel. By eliminating detailing and design deficiencies of existing columns, jacketing
increases displacement ductility, stiffness and strength while largely maintaining the
original column dimensions. The laboratory experiments used in this research included
columns with different amounts of longitudinal steel reinforcement, column geometry
and loading protocols. The test details were meant to capture three types of reinforced
column deficiencies: low shear strength, insufficient confinement of the concrete core
and short lap-splices within the plastic hinge regions.
A database of jacketed columns was assembled to study the behavior of these
elements under quasi-static lateral loading. A procedure to calculate yield and peak
strength of jacketed columns is discussed in Chapter 3. The lateral deformation capacity
(drift) of jacketed columns was determined using a statistical study as discussed in
Chapter 4.
5.1 Characterization of Jacketed Column Behavior
The study of a database of jacketed columns revealed that jacketing eliminated the
potential for shear failure within the jacketed region and the section would be flexure
dominated. The flexural strength of a jacketed column can then be estimated using a fiber
model. The fiber model must include the confining effect of the jacket on the concrete.
Using this procedure, the jacketed column strength (yield and peak) was estimated within
approximately ±10%.
Plastic drift capacity was estimated using a statistical study. The drift capacity of
circular jacketed columns is significantly different from that of rectangular jacketed
columns. Therefore jacketed column deformations were studied separately as a function
of column geometry. The type of jacket (FRP or steel) also affected the calculated drift
capacities so columns were also separated according to jacket type. A Weibull statistical
distribution best described the distribution of Parameter a found in columns from the
44
jacketed column database. A proposed set of modeling parameters for drift (Parameters a
and b) were proposed on this study; Parameter c that represents the residual column
strength at large deformations was proposed to be 0.2 times the peak strength as is
commonly used for existing columns.

45
CHAPTER 6 REFERENCES
Aboutaha, R. S., Engelhardt, M. D., Jirsa, J. O., and Kreger, M. E.. "Rehabilitation of Shear Critical Concrete Columns by Use of Rectangular Steel Jackets". ACI Structural Journal. V. 96, No. 1, 1999, pp. 68-78. Aboutaha, R. S., Engelhardt, M. D., Jirsa, J. O., and Kreger, M. E.. “Retrofit of Concrete Columns with Inadequate Lap Splices by the Use of Rectangular Steel Jackets”. Earthquake Spectra, V. 12, No. 4, 1996, pp. 693-714. Aboutaha, R. S., Engelhardt, M. D., Jirsa, J. O., & Kreger, M. E.. “Experimental Investigation of Seismic Repair of Lap Splice Failures in Damaged Concrete Columns”. ACI Structural Journal, V. 96, No. 2, 1999, pp. 297-307. ACI Committee 369. 2011. “Guide for Seismic Rehabilitation of Existing Concrete Frame Buildings”, ACI 369R-11, American Concrete Institute, Farmington Hills, MI. ACI Committee 440. 2008. “Guide for the Design and Construction of Externally Bonded FRP Systems for Strengthening Concrete Structures”. ACI 440.2R-08, American Concrete Institute, Farmington Hills, MI. Alcocer, S. M., and Durán-Hernández, R. “Seismic Performance of a RC Building with Columns Rehabilitated with Steel Angles and Straps. Innovations in Design with Emphasis on Seismic, Wind, and Environmental Loading”. Quality Control and Innovations in Materials/Hot Weather Concreting. 2002, pp. 531-552. Alvarez, J. C., & Brena, S. F.. “Non-linear Modeling Parameters for Jacketed Columns Used in Seismic Rehabilitation of RC Buildings”. ACI Special Publication, 2014, SP297-6 ASCE. 2006. “Seismic Rehabilitation of Existing Buildings”, ASCE/SEI 41-06, American Society of Civil Engineers, Reston, VA. Breña, S. F., and Schlick, B. M.. "Hysteretic Behavior of Bridge Columns with FRP-Jacketed Lap Splices Designed for Moderate Ductility Enhancement".Journal of Composites for Construction. V. 11, No. 6, 2007, pp. 565-574. Bucher, C., 2009. “Computational Analysis of Randomness in Structural Mechanics”. Structures and Infrastructures Book Series . V. 3. CRC Press. Chai, Y. H., Nigel Priestley, M. J. N., Seible, F., California., and University of California, San Diego.. “Seismic Retrofit of Circular Bridge Columns for Enhanced Flexural Performance”. ACI Structural Journal, V. 88, No. 5, 1991, pp. 572-584.
46
Cho, J.-Y., and Pincheira, J. A., “Inelastic Analysis of Reinforced Concrete Columns with Short Lap Splices Subjected to Reversed Cyclic Loads,” ACI Structural Journal, V. 103, No. 2, 2006, pp. 280-290. Ciampi, V., MA Crisfield, Non-linear Finite Element Analysis of Solids and Structures. Meccanica, V. 32, No. 6, 1997, pp.586-587. Cook, R. D. (2007). “Concepts and applications of finite element analysis”. John Wiley & Sons. Esmaeily, A., and Xiao, Y.. “Seismic Behavior of Bridge Columns Subjected to Various Loading Patterns”. California: Pacific Earthquake Engineering Research Center (PEER), 2002/15. Esmaeily, A., and Xiao, Y.. “Behavior of Reinforced Concrete Columns Under Variable Axial Loads: Analysis”. ACI Structural Journal, V. 102, No. 5, 2005, pp. 736-744. Galal, K., Arafa, A., and Ghobarah, A.. "Retrofit of RC Square Short Columns". Engineering Structures. V. 27, No. 5, 2005, pp. 801-813. Ghosh, K. K., & Sheikh, S. A.. “Seismic upgrade with carbon fiber-reinforced polymer of columns containing lap-spliced reinforcing bars.” ACI Structural Journal, V. 104, No. 2, 2007, pp. 227-236 Harajli, M. H.. "Behavior of Gravity Load-Designed Rectangular Concrete Columns Confined with Fiber Reinforced Polymer Sheets". Journal of Composites for Construction. V. 9, No. 1, 2005, pp. 4-14. Harajli, M. H., and Rteil, A. A.. "Effect of Confinement Using Fiber-Reinforced Polymer or Fiber-Reinforced Concrete on Seismic Performance of Gravity Load-Designed Columns". ACI Structural Journal. V. 101, No. 1, 2004, pp. 47-56. Harajli M.H., and Dagher F.. "Seismic Strengthening of Bond-Critical Regions in Rectangular Reinforced Concrete Columns Using Fiber-Reinforced Polymer Wraps". ACI Structural Journal. V. 105, No. 1, 2008, pp. 68-77. Harries, K. A., Ricles, J. R., Pessiki, S., & Sause, R.. “Seismic retrofit of lap splices in nonductile square columns using carbon fiber-reinforced jackets”. ACI Structural Journal, V. 103, No. 6, 2006. Haroun, M. A., and Elsanadedy, H. M.. "Fiber-Reinforced Plastic Jackets for Ductility Enhancement of Reinforced Concrete Bridge Columns with Poor Lap-Splice Detailing". Journal of Bridge Engineering. V. 10, No. 6, 2005, pp. 749-757.
47
Haroun, M. A., and Elsanadedy, H. M.. "Behavior of Cyclically Loaded Squat Reinforced Concrete Bridge Columns Upgraded with Advanced Composite-Material Jackets". Journal of Bridge Engineering. V. 10, No. 6, 2005, pp. 741-748. Hwang, J.-S., Li, Y.-F., Chen, S.-H., and Hsieh, Y.-M.. “A Study of Reinforced Concrete Bridge Columns Retrofitted by Steel Jackets”. Journal of the Chinese Institute of Engineers, V. 28, No. 2, 2005, pp. 319-328. Hoshikuma, J., K. Kawashima, K. Nagaya, and A. W. Taylor. "Stress-Strain Model for Confined Reinforced Concrete in Bridge Piers". Journal of Structural Engineering V.123, No. 5, 1997, pp. 624-633. Iacobucci, R. D., Sheikh, S. A., and Bayrak, O.. "Retrofit of Square Concrete Columns with Carbon Fiber-Reinforced Polymer for Seismic Resistance". ACI Structural Journal. V. 100, No. 6, 2003, pp. 785-794. Lam, L., and Teng, J.. “Design-Oriented Stress- Strain Model for FRP-Confined Concrete,” Construction and Building Materials, V. 17, 2003a, pp. 471-489. Lam, L., and Teng, J.. “Design-Oriented Stress- Strain Model for FRP-Confined Concrete in Rectangular Columns,” Journal of Reinforced Plastics and Composites, V. 22, No. 13, 2003b, pp. 1149-1186. Mander, J. B., Nigel Priestley, M. J., and Park, R.. “Theoretical Stress-Strain Model for Confined Concrete”. Journal of Structural Engineering, V. 114, No. 8, pp. 1804-1826. Memon, M. S., and Sheikh, S. A. 2005. "Seismic Resistance of Square Concrete Columns Retrofitted with Glass Fiber-Reinforced Polymer". ACI Structural Journal, V. 102, no. 5, 1988, pp. 774-783. Ozcan, O., Binici, B., & Ozcebe, G.. “Seismic strengthening of rectangular reinforced concrete columns using fiber reinforced polymers”. Engineering Structures, V. 32 No. 4, 2010, pp. 964-973. Pekelnicky, R., & Poland, C. 2013. ASCE 41-13: “Seismic Evaluation and Retrofit of Existing Buildings”, SEAOC 2012 Convention Proceedings, 2012. Priestley, M.J.N., Seible, F. Xiao, Y., and Verma, R.. “Steel Jacket Retrofitting of Reinforced Concrete Bridge Columns for Enhanced Shear Strength – Part 1: Theoretical Considerations and Test Design.” ACI Structural Journal, V. 91, No. 4, 1994, pp. 394-405. Priestley, M. J.N., Seible, F., Xiao, Y., and Verma, R.. “Steel Jacket Retrofitting of Reinforced Concrete Bridge Columns for Enhanced Shear Strength Part 2: Test Results and Comparison with Theory”. ACI Structural Journal, V. 91, No. 5, 1994, pp. 537-551.
48
Seible, F., Priestley, M. J. N., Hegemier, G. A., and Innamorato, D.. "Seismic Retrofit of RC Columns with Continuous Carbon Fiber Jackets". Journal of Composites for Construction. V. 1, No. 2, 1997, pp. 52-62. Sezen, H. and Setzler, E. J.. “Reinforcement Slip in Reinforced Concrete Columns”. ACI Struuctural Journal, V. 105, No. 3, 2008, pp. 280-289. Wu, Y.-F., Wang, L., and Liu, T.. "Experimental Investigation on Seismic Retrofitting of Square RC Columns by Carbon FRP Sheet Confinement Combined with Transverse Short Glass FRP Bars in Bored Holes". Journal of Composites for Construction. V. 12, No. 1, 2008, pp. 53-60. Xiao, Y., and Wu., H.. "Retrofit of Reinforced Concrete Columns Using Partially Stiffened Steel Jackets". Journal of Structural Engineering. V. 129, No. 6, 2003, pp. 725-732. Xiao, Y., and Ma, R.. "Seismic Retrofit of RC Circular Columns Using Prefabricated Composite Jacketing". Journal of Structural Engineering. V. 123, No. 10, 1997, pp. 1357-1364. Youm, K.-S., Lee, H.-E., and Choi, S.. "Seismic Performance of Repaired RC Columns". Magazine of Concrete Research. V. 58, No. 5, 2006, pp. 267-276.
49
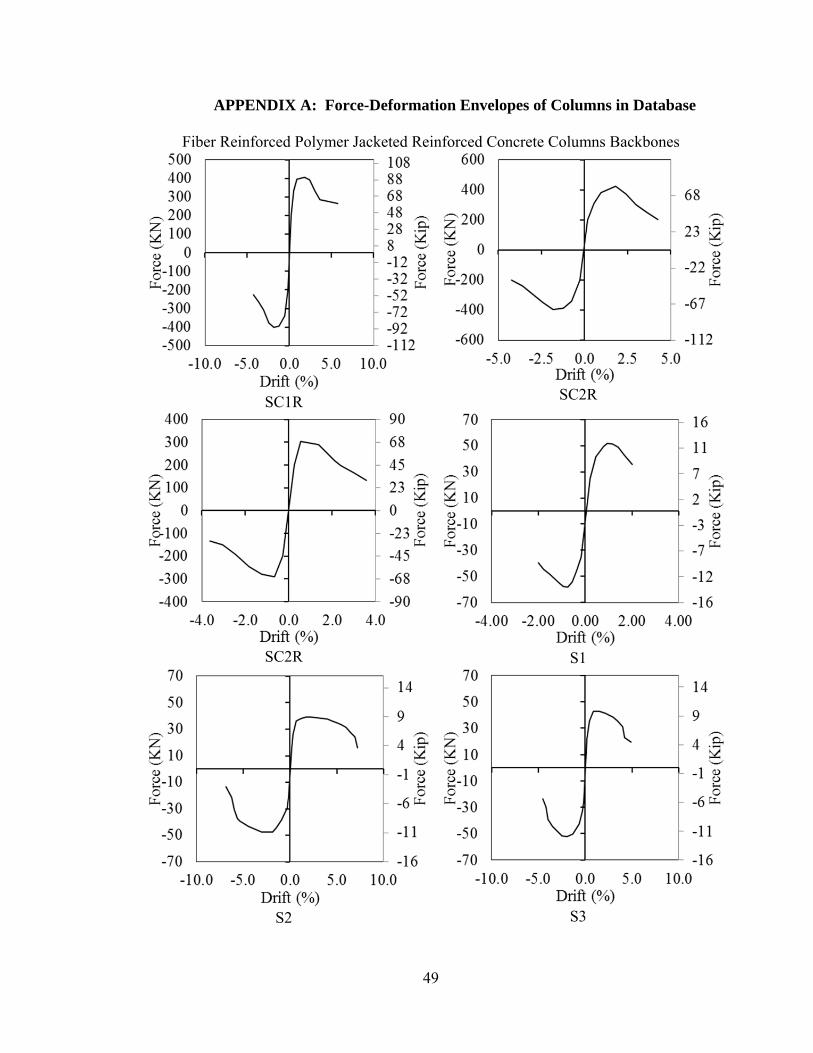
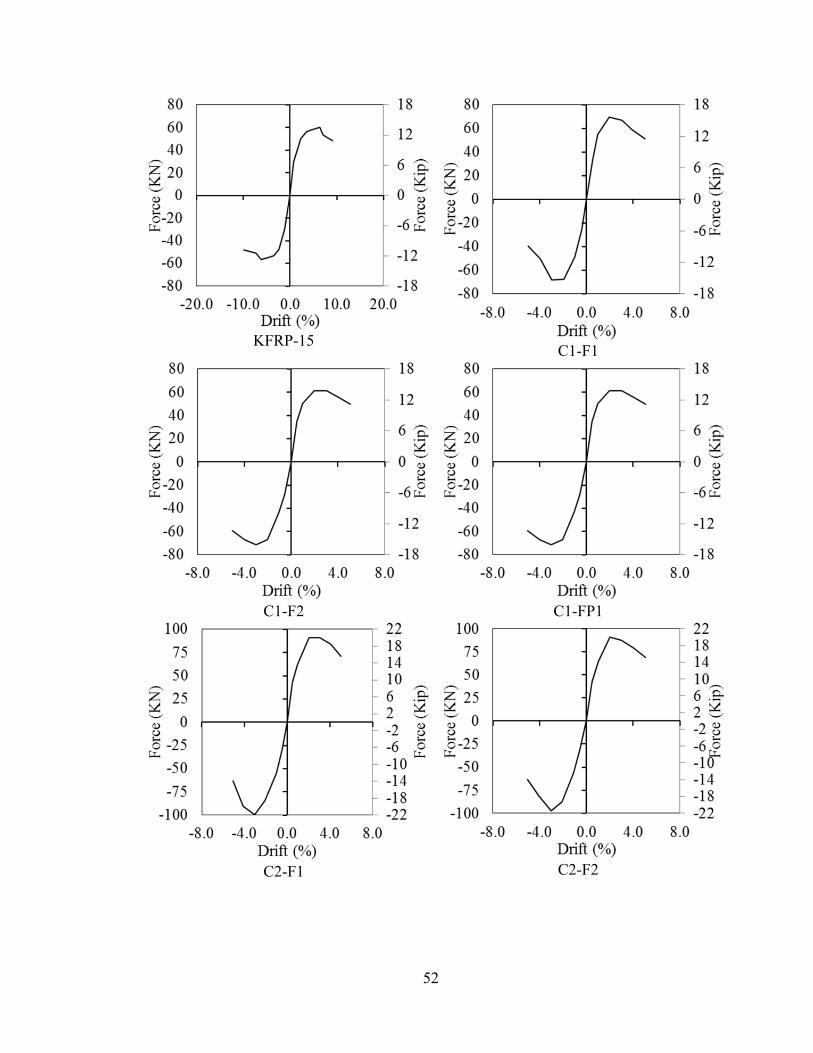
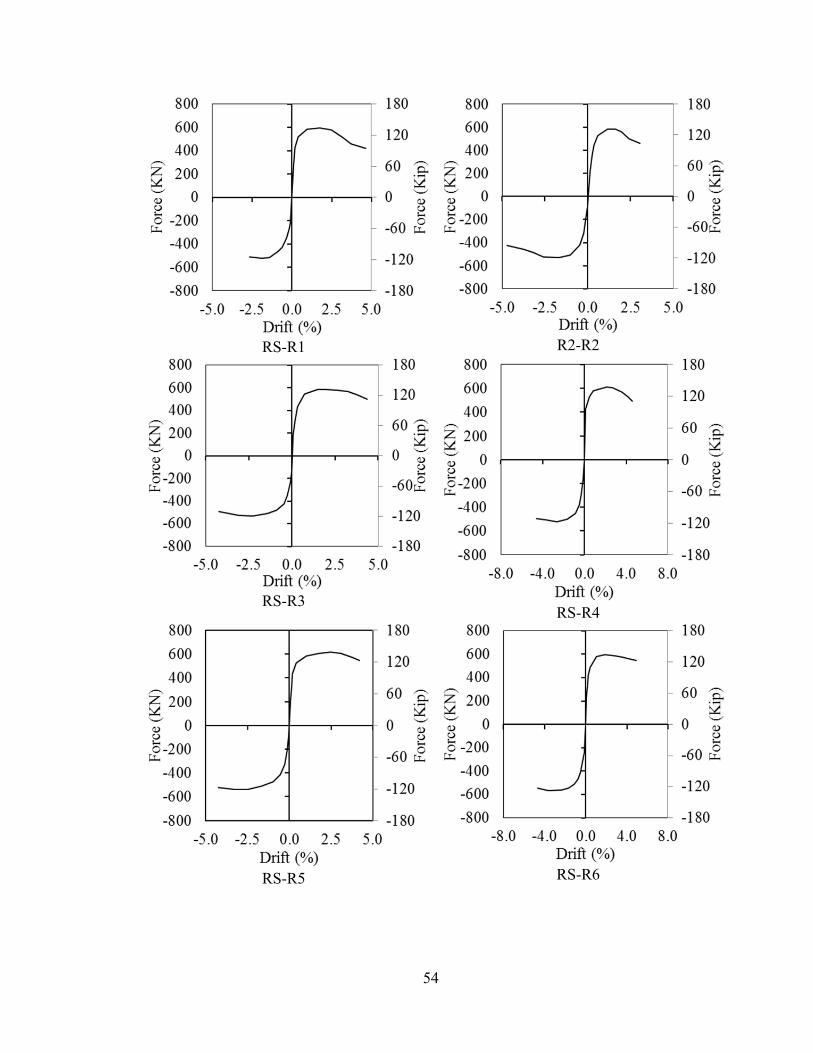
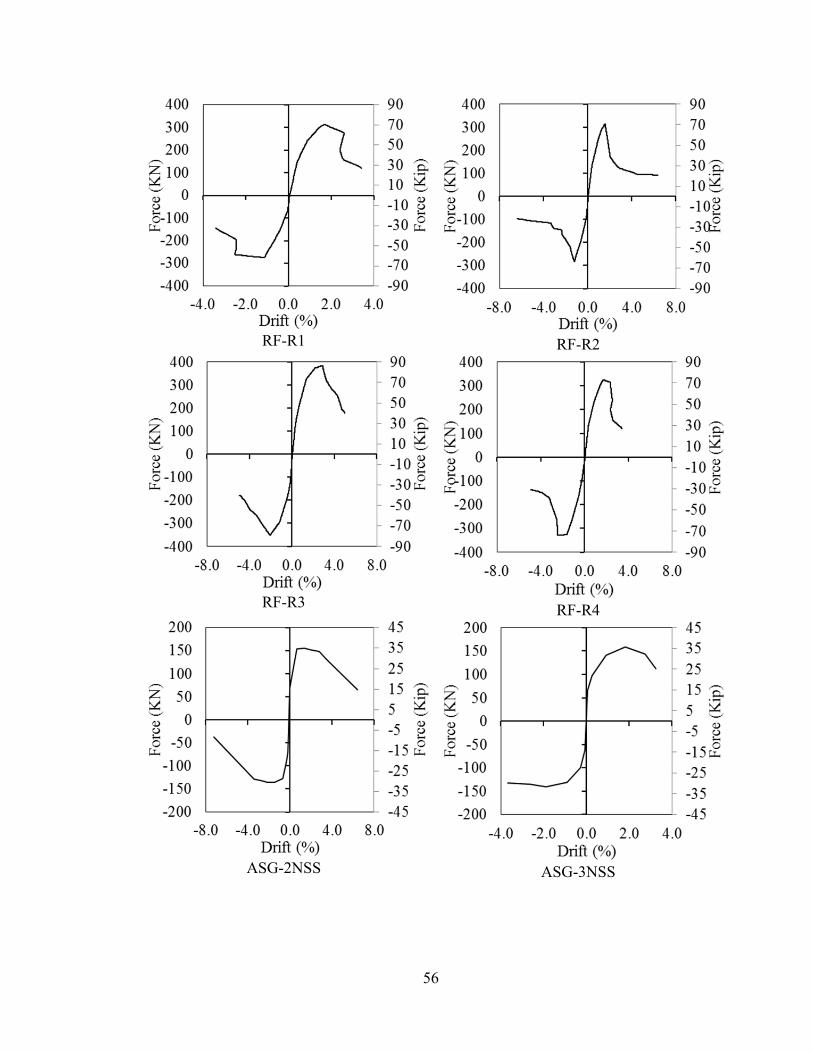
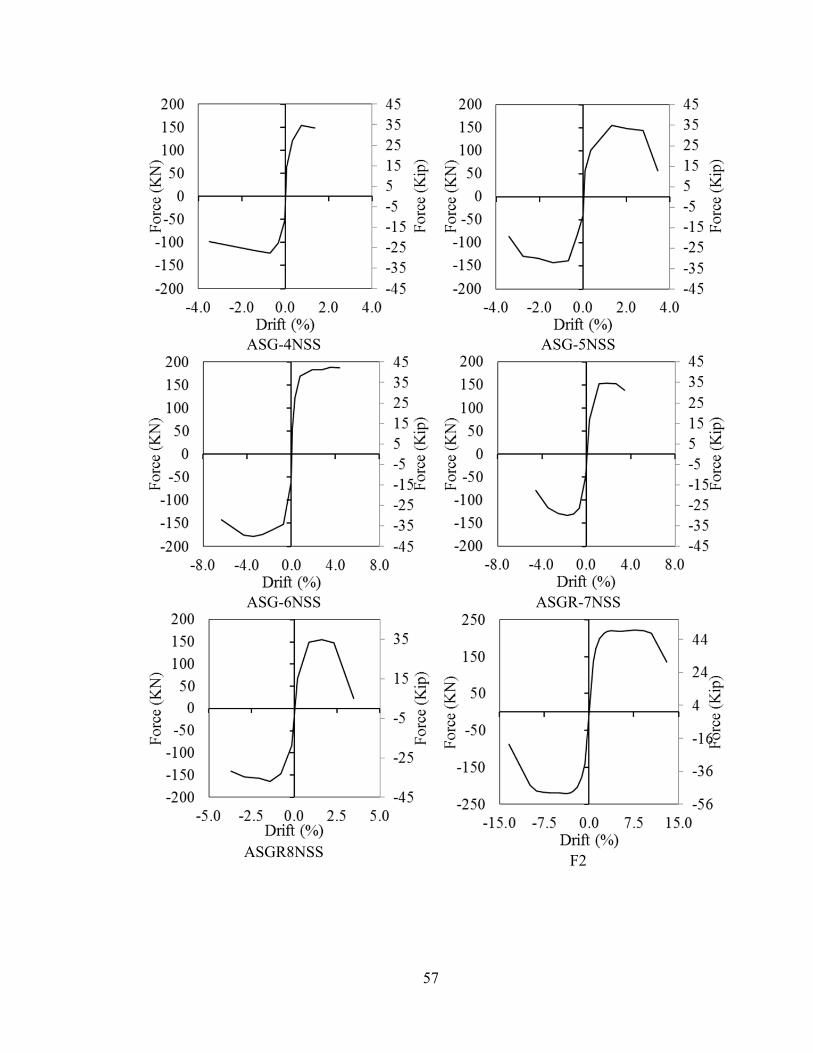
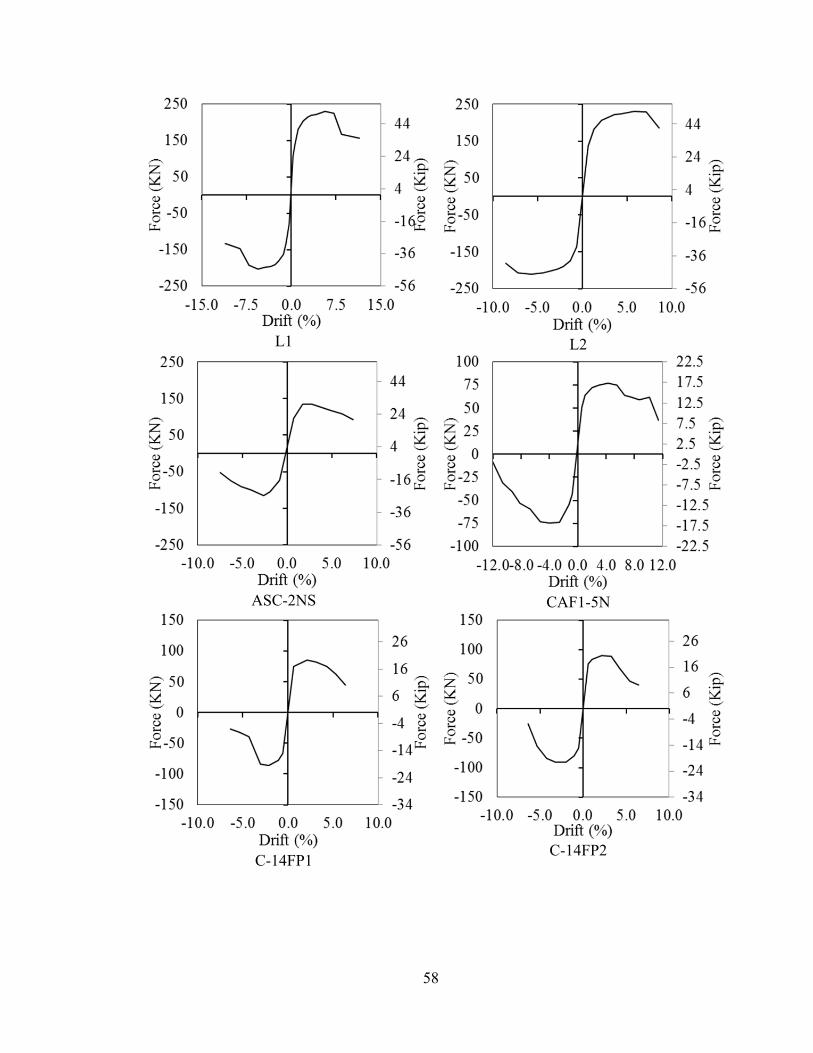
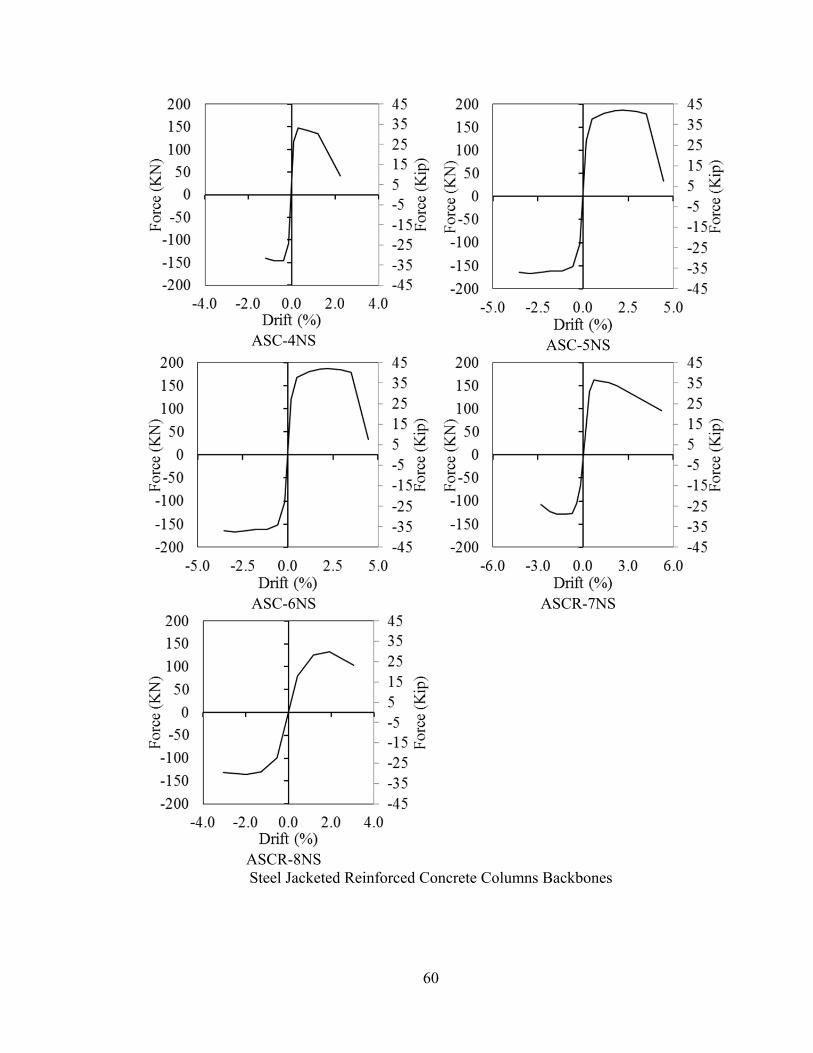
APPENDIX A: Force-Deformation Envelopes of Columns in Database
Fiber Reinforced Polymer Jacketed Reinforced Concrete Columns Backbones
SC1R SC2R
SC2R S1
S2 S3
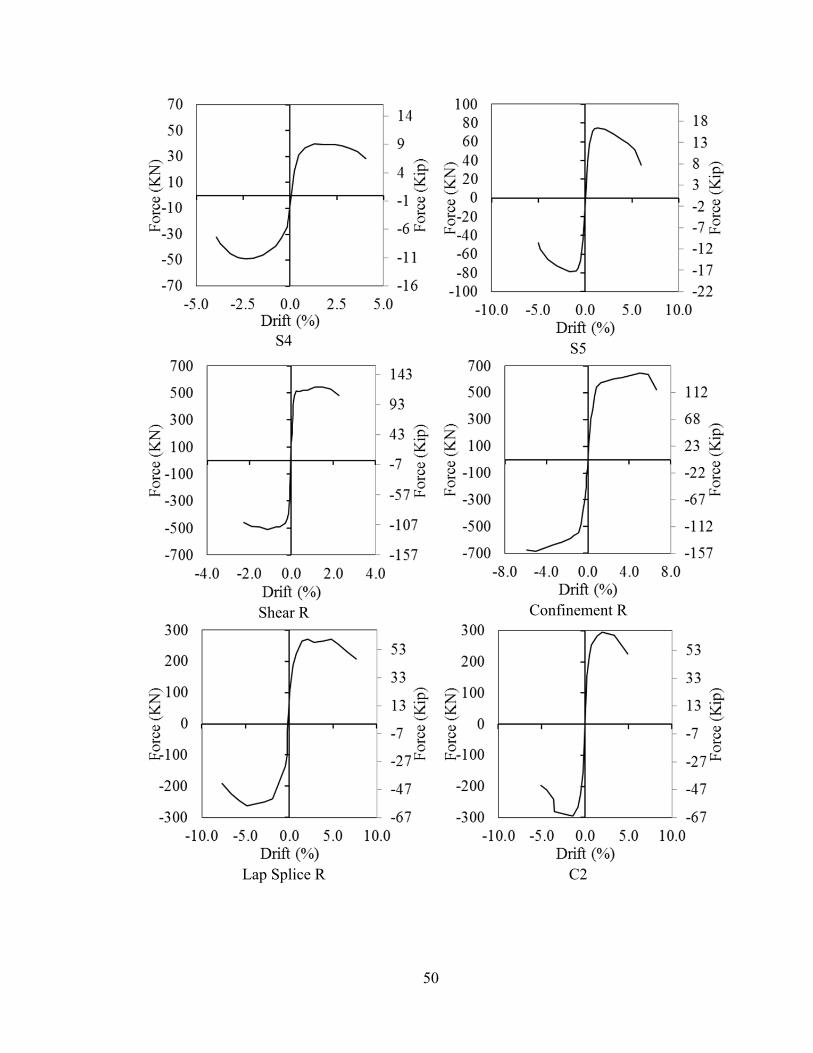
50
S4 S5
Shear R Confinement R
Lap Splice R C2
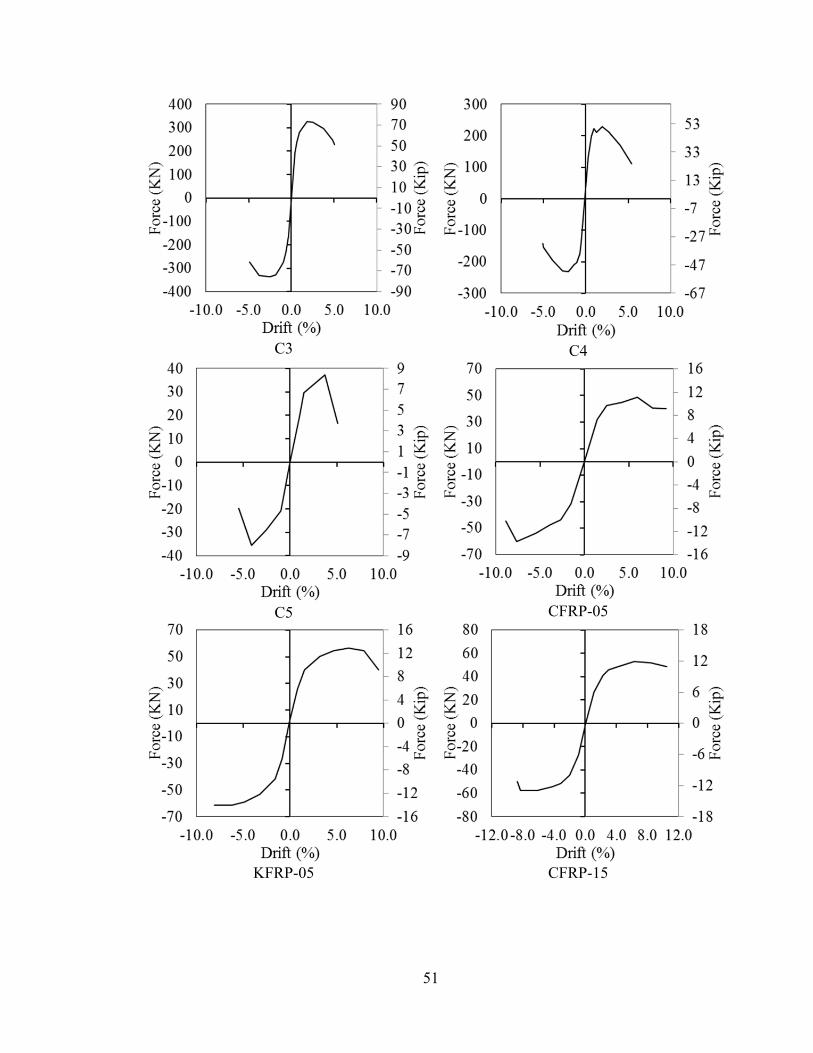
51
C3 C4
C5 CFRP-05
KFRP-05 CFRP-15
52
KFRP-15 C1-F1
C1-F2 C1-FP1
C2-F1 C2-F2

53
C2-FP1 C2-FP2
CS-R1 CS-R2
CS-R3 CS-R4
54
RS-R1 R2-R2
RS-R3 RS-R4
RS-R5 RS-R6
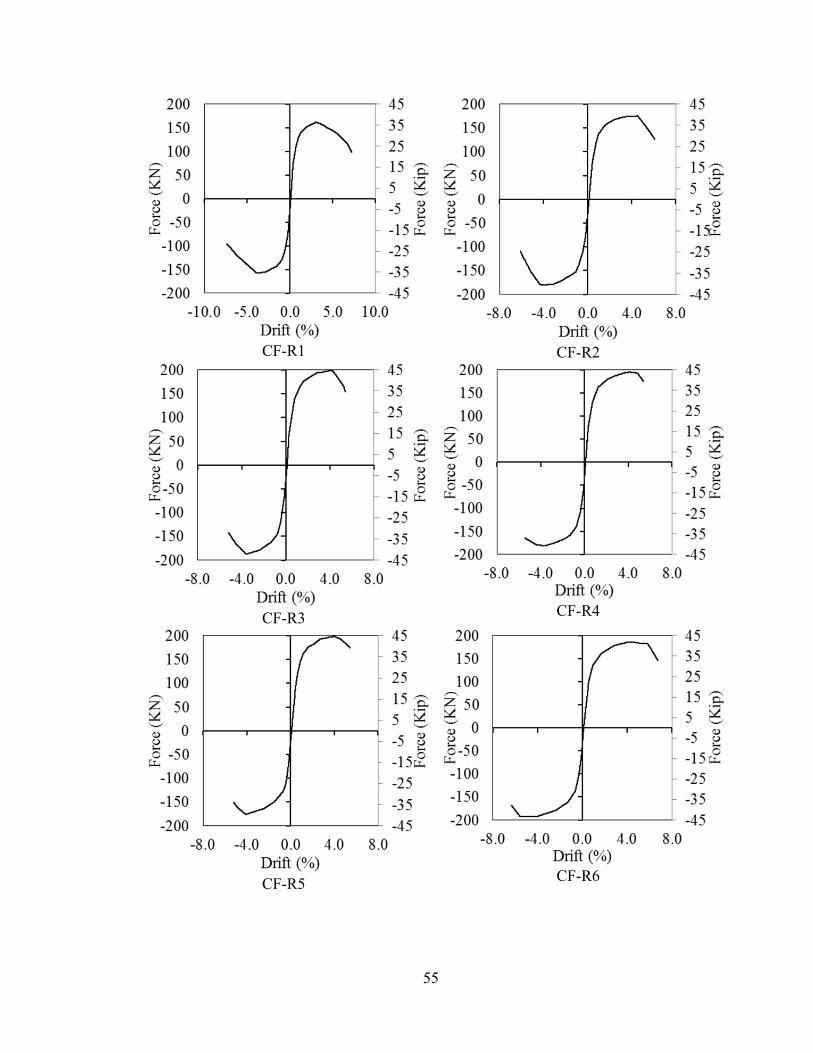
55
CF-R1 CF-R2
CF-R3 CF-R4
CF-R5 CF-R6
56
RF-R1 RF-R2
RF-R3 RF-R4
ASG-2NSS ASG-3NSS
57
ASG-4NSS ASG-5NSS
ASG-6NSS ASGR-7NSS
ASGR8NSS F2
58
L1 L2
ASC-2NS CAF1-5N
C-14FP1 C-14FP2
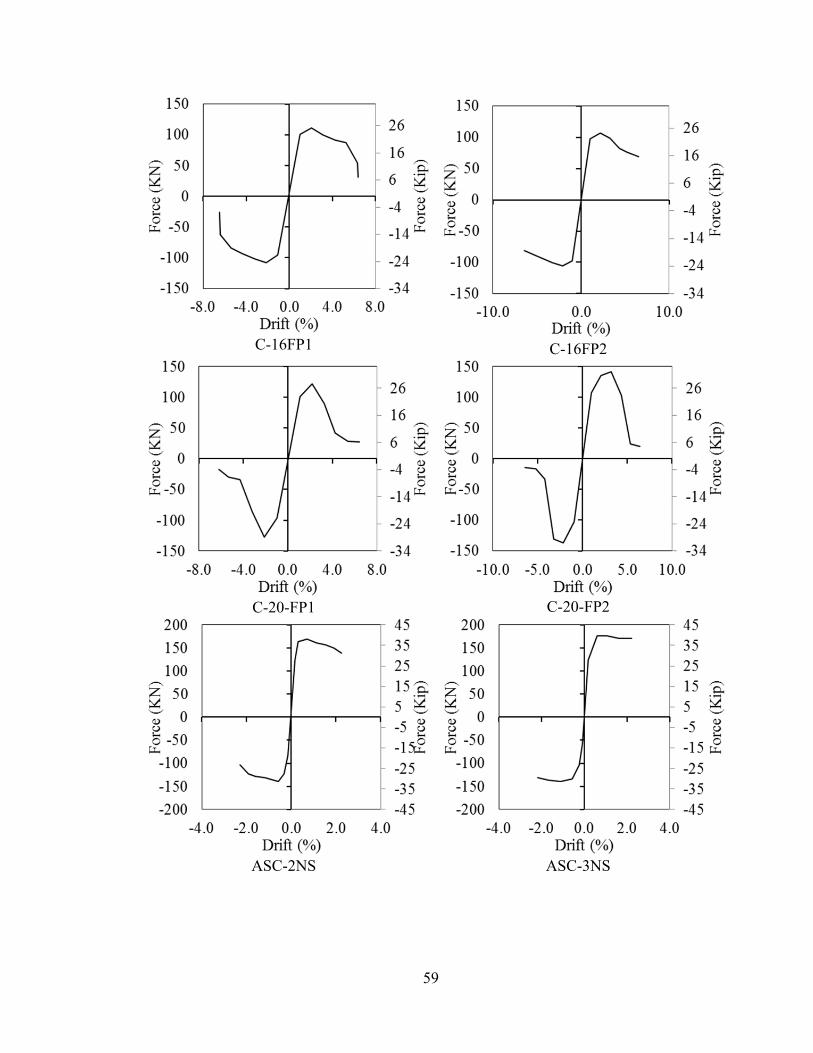
59
C-16FP1 C-16FP2
C-20-FP1 C-20-FP2
ASC-2NS ASC-3NS
60
ASC-4NS ASC-5NS
ASC-6NS ASCR-7NS
ASCR-8NS
Steel Jacketed Reinforced Concrete Columns Backbones
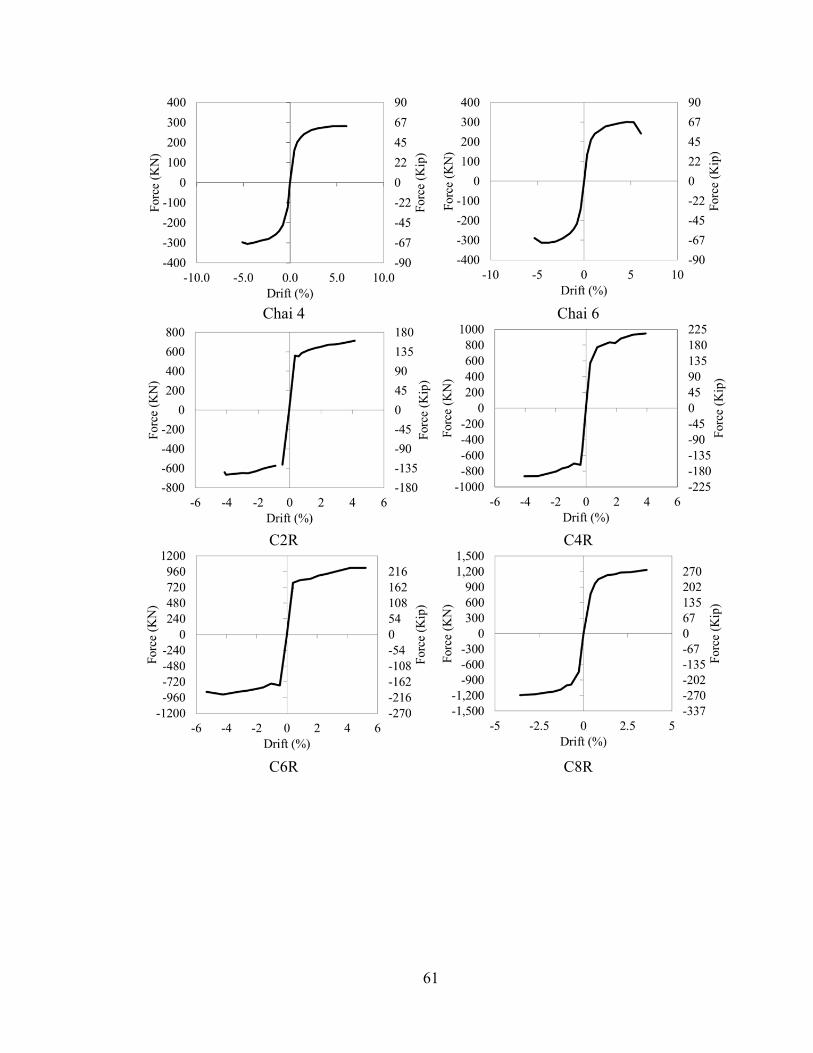
61
Chai 4 Chai 6
C2R C4R
C6R C8R
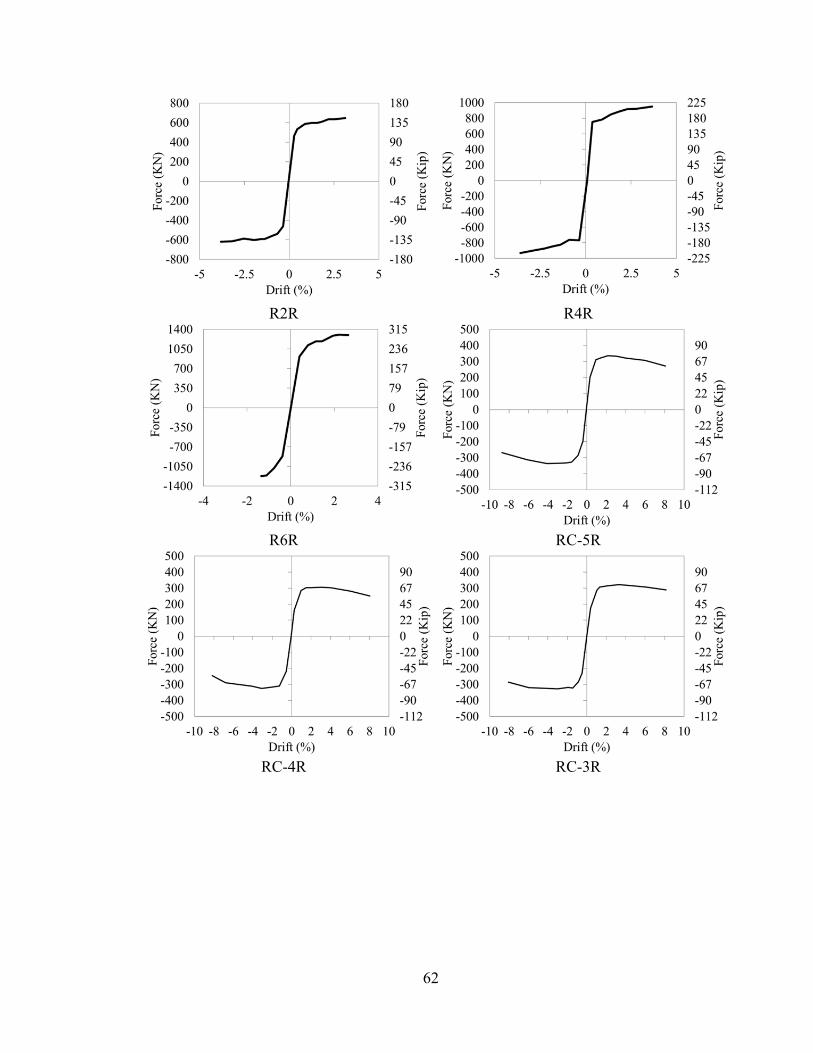
62
R2R R4R
R6R RC-5R
RC-4R RC-3R
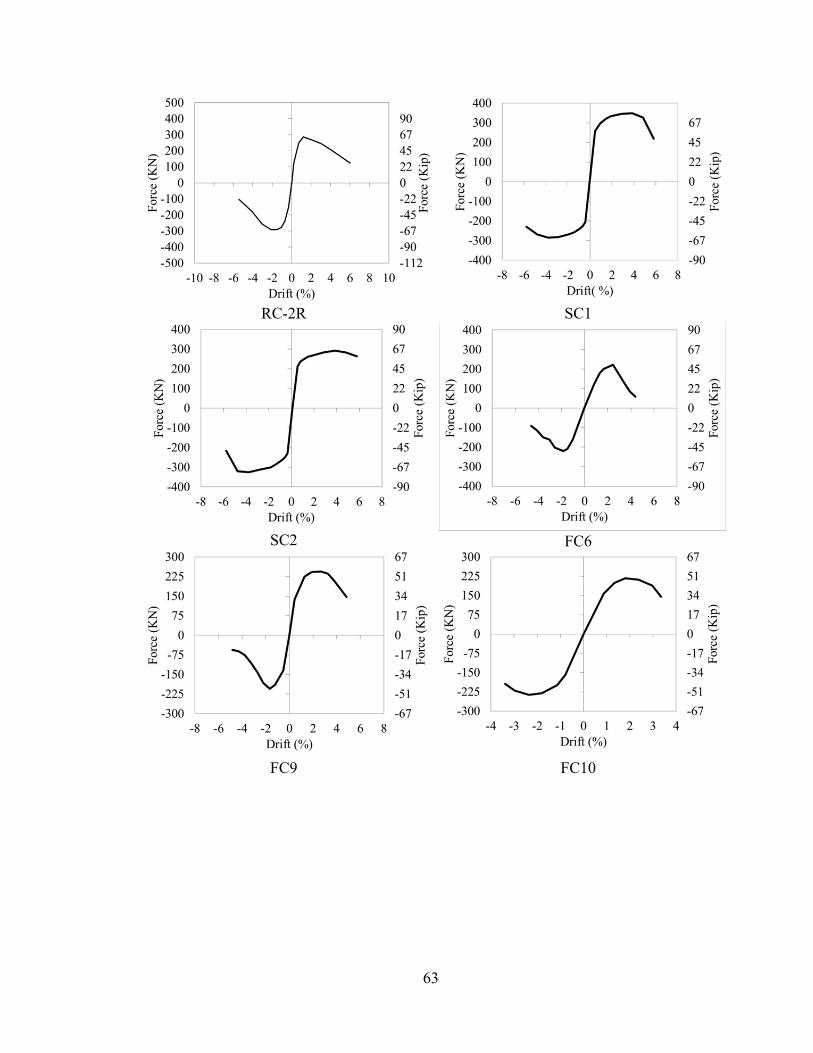
63
RC-2R SC1
SC2 FC6
FC9 FC10
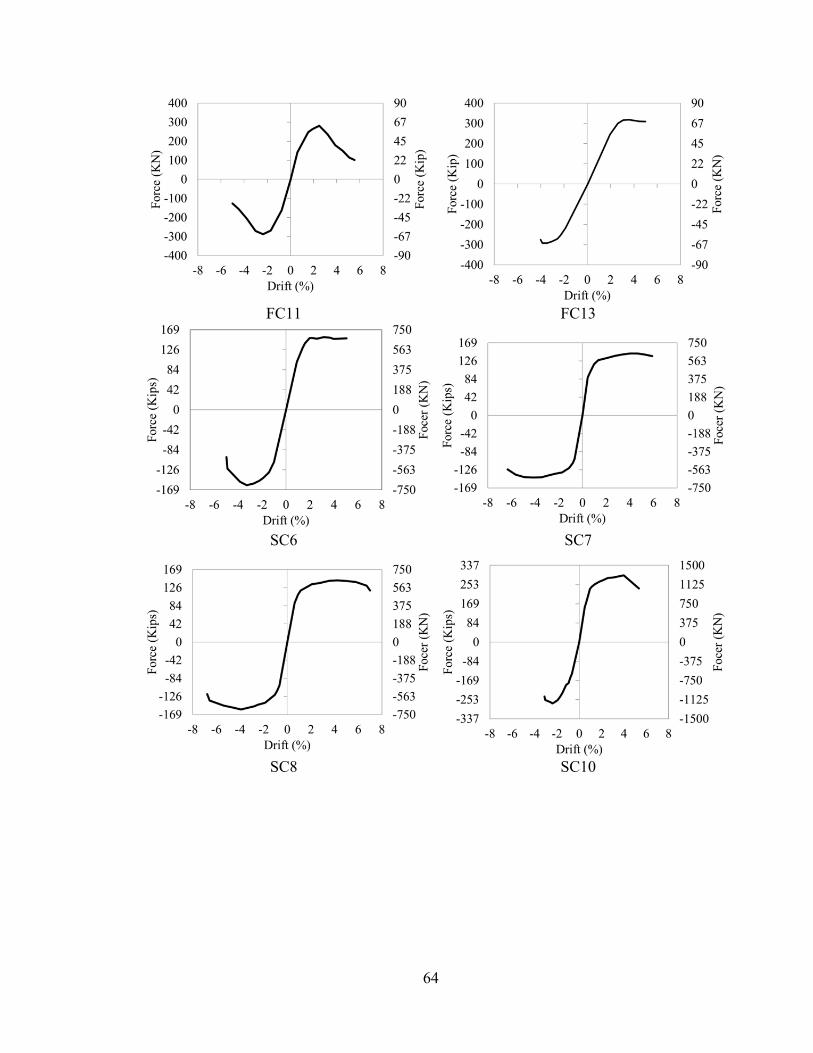
64
FC11 FC13
SC6 SC7
SC8 SC10
65
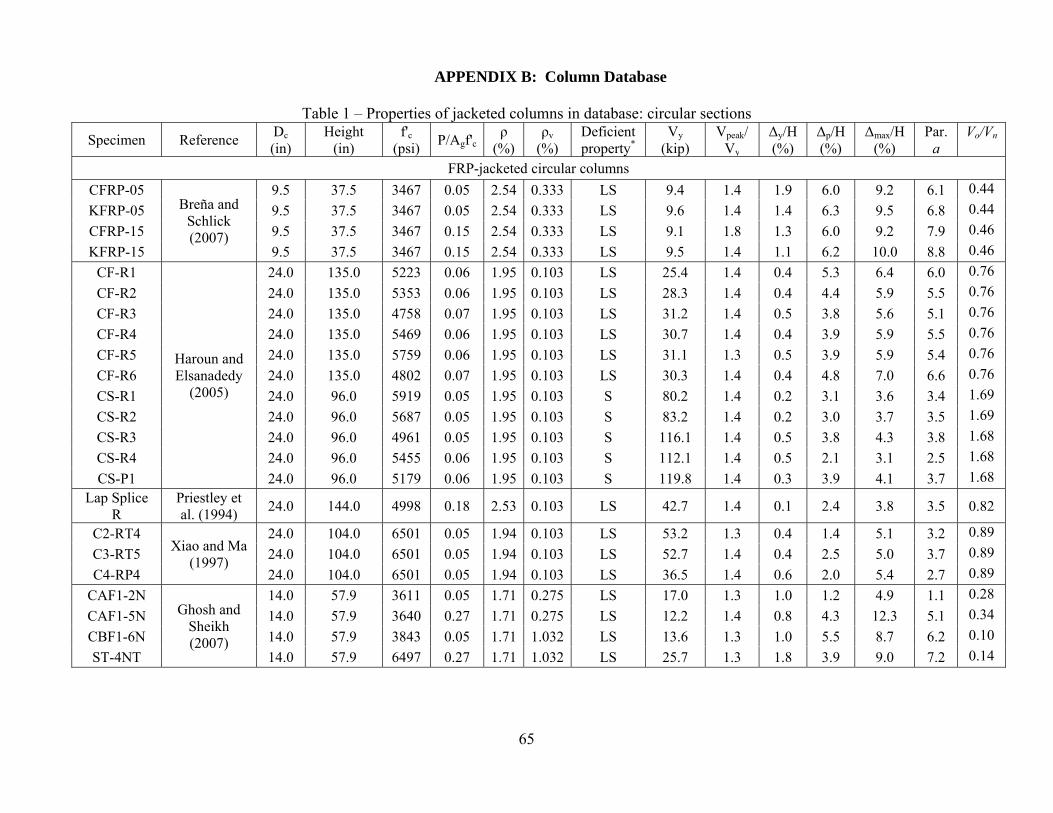
APPENDIX B: Column Database
Table 1 – Properties of jacketed columns in database: circular sections
Specimen Reference Dc (in)
Height (in)
f'c (psi)
P/Agf'cρ
(%) ρv
(%) Deficient property*
Vy (kip)
Vpeak/Vy
Δy/H (%)
Δp/H (%)
Δmax/H (%)
Par. a
Vo/Vn
FRP-jacketed circular columns
CFRP-05 Breña and
Schlick (2007)
9.5 37.5 3467 0.05 2.54 0.333 LS 9.4 1.4 1.9 6.0 9.2 6.1 0.44
KFRP-05 9.5 37.5 3467 0.05 2.54 0.333 LS 9.6 1.4 1.4 6.3 9.5 6.8 0.44
CFRP-15 9.5 37.5 3467 0.15 2.54 0.333 LS 9.1 1.8 1.3 6.0 9.2 7.9 0.46
KFRP-15 9.5 37.5 3467 0.15 2.54 0.333 LS 9.5 1.4 1.1 6.2 10.0 8.8 0.46
CF-R1
Haroun and Elsanadedy
(2005)
24.0 135.0 5223 0.06 1.95 0.103 LS 25.4 1.4 0.4 5.3 6.4 6.0 0.76
CF-R2 24.0 135.0 5353 0.06 1.95 0.103 LS 28.3 1.4 0.4 4.4 5.9 5.5 0.76
CF-R3 24.0 135.0 4758 0.07 1.95 0.103 LS 31.2 1.4 0.5 3.8 5.6 5.1 0.76
CF-R4 24.0 135.0 5469 0.06 1.95 0.103 LS 30.7 1.4 0.4 3.9 5.9 5.5 0.76
CF-R5 24.0 135.0 5759 0.06 1.95 0.103 LS 31.1 1.3 0.5 3.9 5.9 5.4 0.76
CF-R6 24.0 135.0 4802 0.07 1.95 0.103 LS 30.3 1.4 0.4 4.8 7.0 6.6 0.76
CS-R1 24.0 96.0 5919 0.05 1.95 0.103 S 80.2 1.4 0.2 3.1 3.6 3.4 1.69
CS-R2 24.0 96.0 5687 0.05 1.95 0.103 S 83.2 1.4 0.2 3.0 3.7 3.5 1.69
CS-R3 24.0 96.0 4961 0.05 1.95 0.103 S 116.1 1.4 0.5 3.8 4.3 3.8 1.68
CS-R4 24.0 96.0 5455 0.06 1.95 0.103 S 112.1 1.4 0.5 2.1 3.1 2.5 1.68
CS-P1 24.0 96.0 5179 0.06 1.95 0.103 S 119.8 1.4 0.3 3.9 4.1 3.7 1.68
Lap Splice R
Priestley et al. (1994)
24.0 144.0 4998 0.18 2.53 0.103 LS 42.7 1.4 0.1 2.4 3.8 3.5 0.82
C2-RT4 Xiao and Ma
(1997)
24.0 104.0 6501 0.05 1.94 0.103 LS 53.2 1.3 0.4 1.4 5.1 3.2 0.89
C3-RT5 24.0 104.0 6501 0.05 1.94 0.103 LS 52.7 1.4 0.4 2.5 5.0 3.7 0.89
C4-RP4 24.0 104.0 6501 0.05 1.94 0.103 LS 36.5 1.4 0.6 2.0 5.4 2.7 0.89
CAF1-2N Ghosh and
Sheikh (2007)
14.0 57.9 3611 0.05 1.71 0.275 LS 17.0 1.3 1.0 1.2 4.9 1.1 0.28
CAF1-5N 14.0 57.9 3640 0.27 1.71 0.275 LS 12.2 1.4 0.8 4.3 12.3 5.1 0.34
CBF1-6N 14.0 57.9 3843 0.05 1.71 1.032 LS 13.6 1.3 1.0 5.5 8.7 6.2 0.10
ST-4NT 14.0 57.9 6497 0.27 1.71 1.032 LS 25.7 1.3 1.8 3.9 9.0 7.2 0.14
66
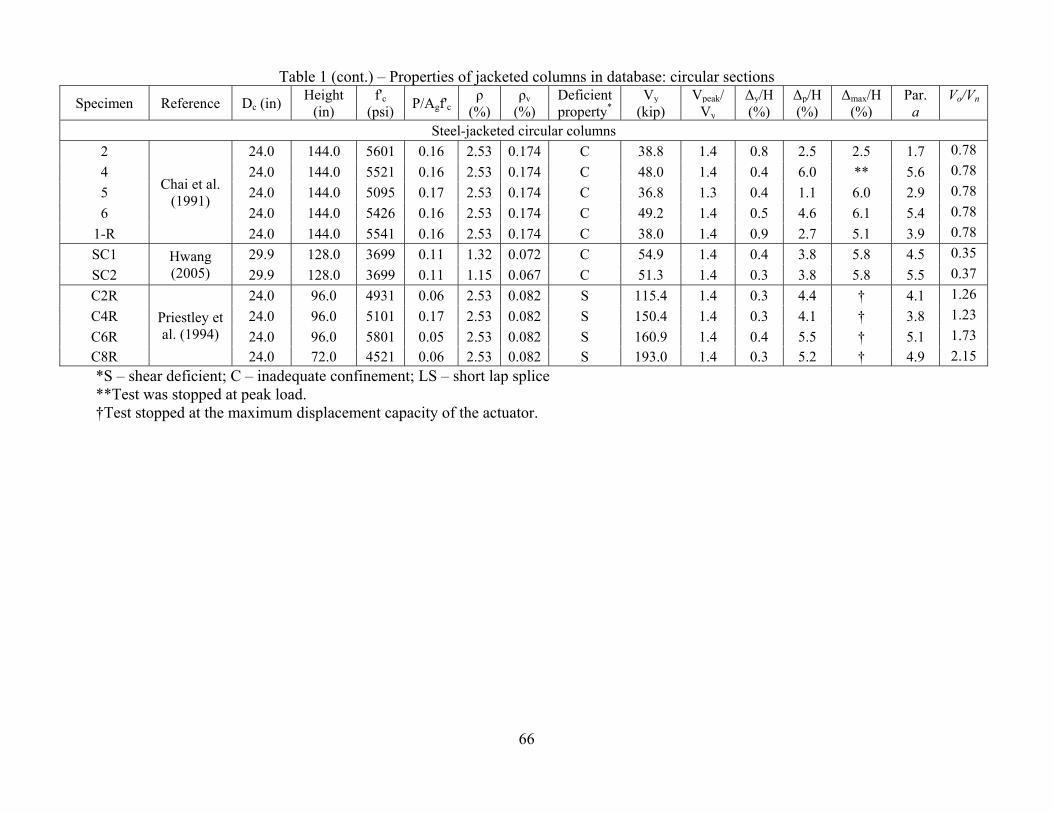
Table 1 (cont.) – Properties of jacketed columns in database: circular sections
Specimen Reference Dc (in) Height
(in) f'c
(psi) P/Agf'c
ρ (%)
ρv
(%) Deficient property*
Vy (kip)
Vpeak/Vy
Δy/H (%)
Δp/H (%)
Δmax/H (%)
Par. a
Vo/Vn
Steel-jacketed circular columns
2
Chai et al. (1991)
24.0 144.0 5601 0.16 2.53 0.174 C 38.8 1.4 0.8 2.5 2.5 1.7 0.78
4 24.0 144.0 5521 0.16 2.53 0.174 C 48.0 1.4 0.4 6.0 ** 5.6 0.78
5 24.0 144.0 5095 0.17 2.53 0.174 C 36.8 1.3 0.4 1.1 6.0 2.9 0.78
6 24.0 144.0 5426 0.16 2.53 0.174 C 49.2 1.4 0.5 4.6 6.1 5.4 0.78
1-R 24.0 144.0 5541 0.16 2.53 0.174 C 38.0 1.4 0.9 2.7 5.1 3.9 0.78
SC1 Hwang (2005)
29.9 128.0 3699 0.11 1.32 0.072 C 54.9 1.4 0.4 3.8 5.8 4.5 0.35
SC2 29.9 128.0 3699 0.11 1.15 0.067 C 51.3 1.4 0.3 3.8 5.8 5.5 0.37
C2R
Priestley et al. (1994)
24.0 96.0 4931 0.06 2.53 0.082 S 115.4 1.4 0.3 4.4 † 4.1 1.26
C4R 24.0 96.0 5101 0.17 2.53 0.082 S 150.4 1.4 0.3 4.1 † 3.8 1.23
C6R 24.0 96.0 5801 0.05 2.53 0.082 S 160.9 1.4 0.4 5.5 † 5.1 1.73
C8R 24.0 72.0 4521 0.06 2.53 0.082 S 193.0 1.4 0.3 5.2 † 4.9 2.15
*S – shear deficient; C – inadequate confinement; LS – short lap splice **Test was stopped at peak load. †Test stopped at the maximum displacement capacity of the actuator.
67
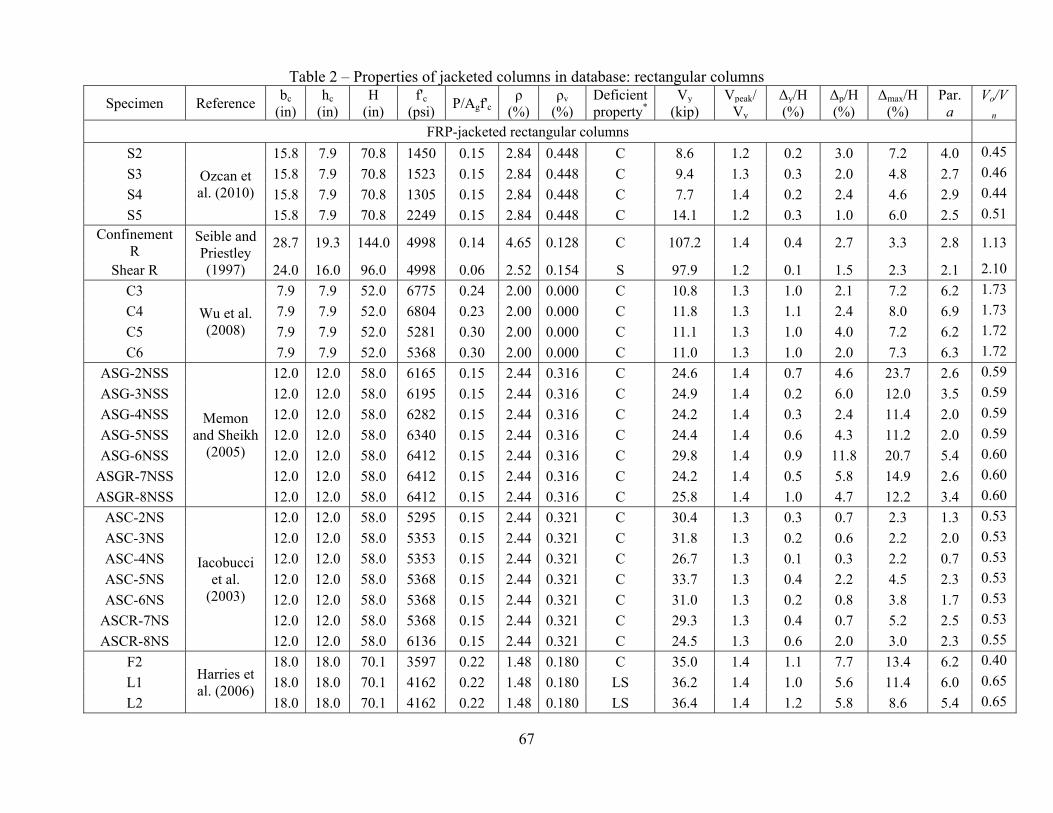
Table 2 – Properties of jacketed columns in database: rectangular columns
Specimen Reference bc
(in) hc
(in) H
(in) f'c
(psi) P/Agf'c
ρ (%)
ρv
(%) Deficient property*
Vy (kip)
Vpeak/Vy
Δy/H (%)
Δp/H (%)
Δmax/H (%)
Par. a
Vo/Vn
FRP-jacketed rectangular columns
S2
Ozcan et al. (2010)
15.8 7.9 70.8 1450 0.15 2.84 0.448 C 8.6 1.2 0.2 3.0 7.2 4.0 0.45
S3 15.8 7.9 70.8 1523 0.15 2.84 0.448 C 9.4 1.3 0.3 2.0 4.8 2.7 0.46
S4 15.8 7.9 70.8 1305 0.15 2.84 0.448 C 7.7 1.4 0.2 2.4 4.6 2.9 0.44
S5 15.8 7.9 70.8 2249 0.15 2.84 0.448 C 14.1 1.2 0.3 1.0 6.0 2.5 0.51
Confinement R
Seible and Priestley (1997)
28.7 19.3 144.0 4998 0.14 4.65 0.128 C 107.2 1.4 0.4 2.7 3.3 2.8 1.13
Shear R 24.0 16.0 96.0 4998 0.06 2.52 0.154 S 97.9 1.2 0.1 1.5 2.3 2.1 2.10
C3
Wu et al. (2008)
7.9 7.9 52.0 6775 0.24 2.00 0.000 C 10.8 1.3 1.0 2.1 7.2 6.2 1.73
C4 7.9 7.9 52.0 6804 0.23 2.00 0.000 C 11.8 1.3 1.1 2.4 8.0 6.9 1.73
C5 7.9 7.9 52.0 5281 0.30 2.00 0.000 C 11.1 1.3 1.0 4.0 7.2 6.2 1.72
C6 7.9 7.9 52.0 5368 0.30 2.00 0.000 C 11.0 1.3 1.0 2.0 7.3 6.3 1.72
ASG-2NSS
Memon and Sheikh
(2005)
12.0 12.0 58.0 6165 0.15 2.44 0.316 C 24.6 1.4 0.7 4.6 23.7 2.6 0.59
ASG-3NSS 12.0 12.0 58.0 6195 0.15 2.44 0.316 C 24.9 1.4 0.2 6.0 12.0 3.5 0.59
ASG-4NSS 12.0 12.0 58.0 6282 0.15 2.44 0.316 C 24.2 1.4 0.3 2.4 11.4 2.0 0.59
ASG-5NSS 12.0 12.0 58.0 6340 0.15 2.44 0.316 C 24.4 1.4 0.6 4.3 11.2 2.0 0.59
ASG-6NSS 12.0 12.0 58.0 6412 0.15 2.44 0.316 C 29.8 1.4 0.9 11.8 20.7 5.4 0.60
ASGR-7NSS 12.0 12.0 58.0 6412 0.15 2.44 0.316 C 24.2 1.4 0.5 5.8 14.9 2.6 0.60
ASGR-8NSS 12.0 12.0 58.0 6412 0.15 2.44 0.316 C 25.8 1.4 1.0 4.7 12.2 3.4 0.60
ASC-2NS
Iacobucci et al.
(2003)
12.0 12.0 58.0 5295 0.15 2.44 0.321 C 30.4 1.3 0.3 0.7 2.3 1.3 0.53
ASC-3NS 12.0 12.0 58.0 5353 0.15 2.44 0.321 C 31.8 1.3 0.2 0.6 2.2 2.0 0.53
ASC-4NS 12.0 12.0 58.0 5353 0.15 2.44 0.321 C 26.7 1.3 0.1 0.3 2.2 0.7 0.53
ASC-5NS 12.0 12.0 58.0 5368 0.15 2.44 0.321 C 33.7 1.3 0.4 2.2 4.5 2.3 0.53
ASC-6NS 12.0 12.0 58.0 5368 0.15 2.44 0.321 C 31.0 1.3 0.2 0.8 3.8 1.7 0.53
ASCR-7NS 12.0 12.0 58.0 5368 0.15 2.44 0.321 C 29.3 1.3 0.4 0.7 5.2 2.5 0.53
ASCR-8NS 12.0 12.0 58.0 6136 0.15 2.44 0.321 C 24.5 1.3 0.6 2.0 3.0 2.3 0.55
F2 Harries et al. (2006)
18.0 18.0 70.1 3597 0.22 1.48 0.180 C 35.0 1.4 1.1 7.7 13.4 6.2 0.40
L1 18.0 18.0 70.1 4162 0.22 1.48 0.180 LS 36.2 1.4 1.0 5.6 11.4 6.0 0.65
L2 18.0 18.0 70.1 4162 0.22 1.48 0.180 LS 36.4 1.4 1.2 5.8 8.6 5.4 0.65
68
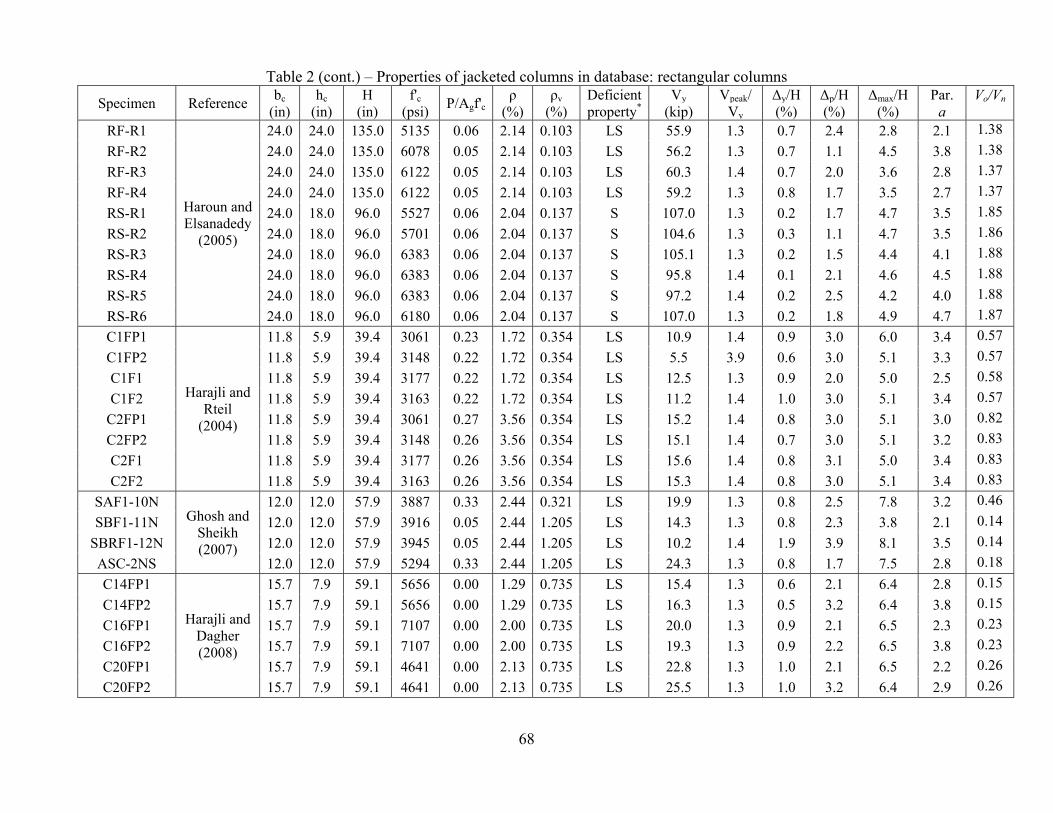
Table 2 (cont.) – Properties of jacketed columns in database: rectangular columns
Specimen Reference bc
(in) hc
(in) H
(in) f'c
(psi) P/Agf'c
ρ (%)
ρv
(%) Deficient property*
Vy (kip)
Vpeak/Vy
Δy/H (%)
Δp/H (%)
Δmax/H (%)
Par. a
Vo/Vn
RF-R1
Haroun and Elsanadedy
(2005)
24.0 24.0 135.0 5135 0.06 2.14 0.103 LS 55.9 1.3 0.7 2.4 2.8 2.1 1.38
RF-R2 24.0 24.0 135.0 6078 0.05 2.14 0.103 LS 56.2 1.3 0.7 1.1 4.5 3.8 1.38
RF-R3 24.0 24.0 135.0 6122 0.05 2.14 0.103 LS 60.3 1.4 0.7 2.0 3.6 2.8 1.37
RF-R4 24.0 24.0 135.0 6122 0.05 2.14 0.103 LS 59.2 1.3 0.8 1.7 3.5 2.7 1.37
RS-R1 24.0 18.0 96.0 5527 0.06 2.04 0.137 S 107.0 1.3 0.2 1.7 4.7 3.5 1.85
RS-R2 24.0 18.0 96.0 5701 0.06 2.04 0.137 S 104.6 1.3 0.3 1.1 4.7 3.5 1.86
RS-R3 24.0 18.0 96.0 6383 0.06 2.04 0.137 S 105.1 1.3 0.2 1.5 4.4 4.1 1.88
RS-R4 24.0 18.0 96.0 6383 0.06 2.04 0.137 S 95.8 1.4 0.1 2.1 4.6 4.5 1.88
RS-R5 24.0 18.0 96.0 6383 0.06 2.04 0.137 S 97.2 1.4 0.2 2.5 4.2 4.0 1.88
RS-R6 24.0 18.0 96.0 6180 0.06 2.04 0.137 S 107.0 1.3 0.2 1.8 4.9 4.7 1.87
C1FP1
Harajli and Rteil
(2004)
11.8 5.9 39.4 3061 0.23 1.72 0.354 LS 10.9 1.4 0.9 3.0 6.0 3.4 0.57
C1FP2 11.8 5.9 39.4 3148 0.22 1.72 0.354 LS 5.5 3.9 0.6 3.0 5.1 3.3 0.57
C1F1 11.8 5.9 39.4 3177 0.22 1.72 0.354 LS 12.5 1.3 0.9 2.0 5.0 2.5 0.58
C1F2 11.8 5.9 39.4 3163 0.22 1.72 0.354 LS 11.2 1.4 1.0 3.0 5.1 3.4 0.57
C2FP1 11.8 5.9 39.4 3061 0.27 3.56 0.354 LS 15.2 1.4 0.8 3.0 5.1 3.0 0.82
C2FP2 11.8 5.9 39.4 3148 0.26 3.56 0.354 LS 15.1 1.4 0.7 3.0 5.1 3.2 0.83
C2F1 11.8 5.9 39.4 3177 0.26 3.56 0.354 LS 15.6 1.4 0.8 3.1 5.0 3.4 0.83
C2F2 11.8 5.9 39.4 3163 0.26 3.56 0.354 LS 15.3 1.4 0.8 3.0 5.1 3.4 0.83
SAF1-10N Ghosh and
Sheikh (2007)
12.0 12.0 57.9 3887 0.33 2.44 0.321 LS 19.9 1.3 0.8 2.5 7.8 3.2 0.46
SBF1-11N 12.0 12.0 57.9 3916 0.05 2.44 1.205 LS 14.3 1.3 0.8 2.3 3.8 2.1 0.14
SBRF1-12N 12.0 12.0 57.9 3945 0.05 2.44 1.205 LS 10.2 1.4 1.9 3.9 8.1 3.5 0.14
ASC-2NS 12.0 12.0 57.9 5294 0.33 2.44 1.205 LS 24.3 1.3 0.8 1.7 7.5 2.8 0.18
C14FP1
Harajli and Dagher (2008)
15.7 7.9 59.1 5656 0.00 1.29 0.735 LS 15.4 1.3 0.6 2.1 6.4 2.8 0.15
C14FP2 15.7 7.9 59.1 5656 0.00 1.29 0.735 LS 16.3 1.3 0.5 3.2 6.4 3.8 0.15
C16FP1 15.7 7.9 59.1 7107 0.00 2.00 0.735 LS 20.0 1.3 0.9 2.1 6.5 2.3 0.23
C16FP2 15.7 7.9 59.1 7107 0.00 2.00 0.735 LS 19.3 1.3 0.9 2.2 6.5 3.8 0.23
C20FP1 15.7 7.9 59.1 4641 0.00 2.13 0.735 LS 22.8 1.3 1.0 2.1 6.5 2.2 0.26
C20FP2 15.7 7.9 59.1 4641 0.00 2.13 0.735 LS 25.5 1.3 1.0 3.2 6.4 2.9 0.26
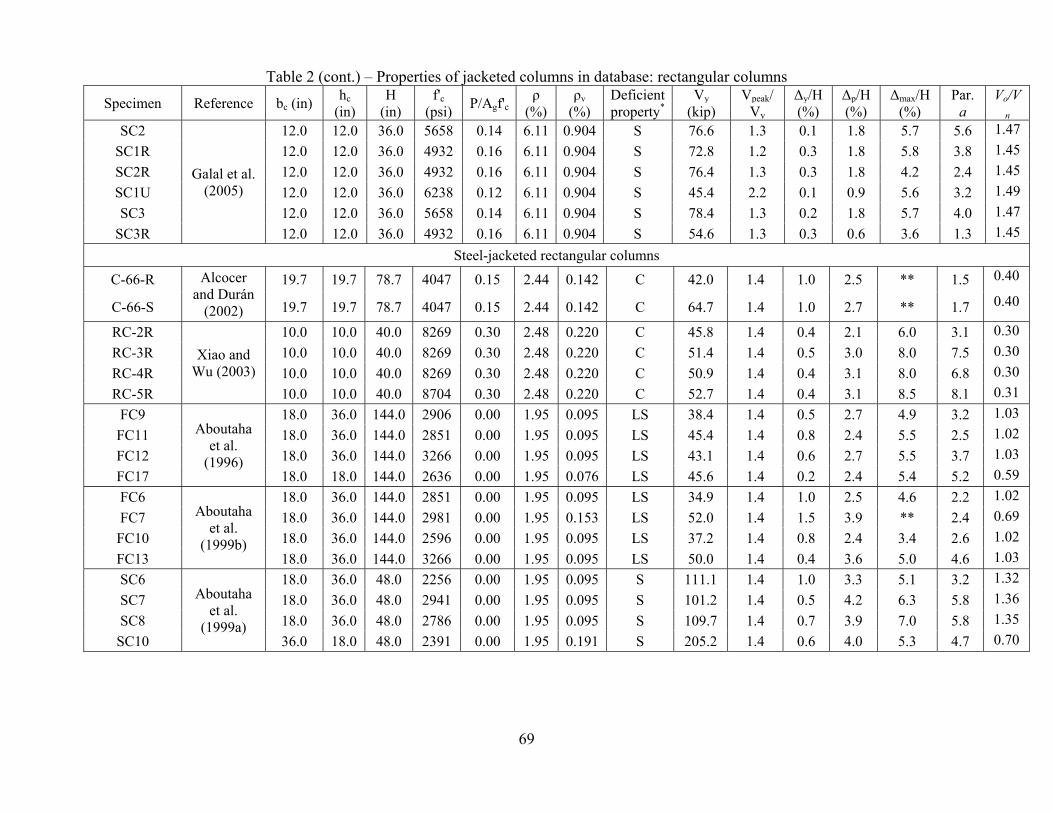
69
Table 2 (cont.) – Properties of jacketed columns in database: rectangular columns
Specimen Reference bc (in) hc
(in) H
(in) f'c
(psi) P/Agf'c
ρ (%)
ρv
(%) Deficient property*
Vy (kip)
Vpeak/Vy
Δy/H (%)
Δp/H (%)
Δmax/H (%)
Par. a
Vo/Vn
SC2
Galal et al. (2005)
12.0 12.0 36.0 5658 0.14 6.11 0.904 S 76.6 1.3 0.1 1.8 5.7 5.6 1.47
SC1R 12.0 12.0 36.0 4932 0.16 6.11 0.904 S 72.8 1.2 0.3 1.8 5.8 3.8 1.45
SC2R 12.0 12.0 36.0 4932 0.16 6.11 0.904 S 76.4 1.3 0.3 1.8 4.2 2.4 1.45
SC1U 12.0 12.0 36.0 6238 0.12 6.11 0.904 S 45.4 2.2 0.1 0.9 5.6 3.2 1.49
SC3 12.0 12.0 36.0 5658 0.14 6.11 0.904 S 78.4 1.3 0.2 1.8 5.7 4.0 1.47
SC3R 12.0 12.0 36.0 4932 0.16 6.11 0.904 S 54.6 1.3 0.3 0.6 3.6 1.3 1.45
Steel-jacketed rectangular columns
C-66-R Alcocer and Durán
(2002)
19.7 19.7 78.7 4047 0.15 2.44 0.142 C 42.0 1.4 1.0 2.5 ** 1.5 0.40
C-66-S 19.7 19.7 78.7 4047 0.15 2.44 0.142 C 64.7 1.4 1.0 2.7 ** 1.7 0.40
RC-2R
Xiao and Wu (2003)
10.0 10.0 40.0 8269 0.30 2.48 0.220 C 45.8 1.4 0.4 2.1 6.0 3.1 0.30
RC-3R 10.0 10.0 40.0 8269 0.30 2.48 0.220 C 51.4 1.4 0.5 3.0 8.0 7.5 0.30
RC-4R 10.0 10.0 40.0 8269 0.30 2.48 0.220 C 50.9 1.4 0.4 3.1 8.0 6.8 0.30
RC-5R 10.0 10.0 40.0 8704 0.30 2.48 0.220 C 52.7 1.4 0.4 3.1 8.5 8.1 0.31
FC9 Aboutaha
et al. (1996)
18.0 36.0 144.0 2906 0.00 1.95 0.095 LS 38.4 1.4 0.5 2.7 4.9 3.2 1.03
FC11 18.0 36.0 144.0 2851 0.00 1.95 0.095 LS 45.4 1.4 0.8 2.4 5.5 2.5 1.02
FC12 18.0 36.0 144.0 3266 0.00 1.95 0.095 LS 43.1 1.4 0.6 2.7 5.5 3.7 1.03
FC17 18.0 18.0 144.0 2636 0.00 1.95 0.076 LS 45.6 1.4 0.2 2.4 5.4 5.2 0.59
FC6 Aboutaha
et al. (1999b)
18.0 36.0 144.0 2851 0.00 1.95 0.095 LS 34.9 1.4 1.0 2.5 4.6 2.2 1.02
FC7 18.0 36.0 144.0 2981 0.00 1.95 0.153 LS 52.0 1.4 1.5 3.9 ** 2.4 0.69
FC10 18.0 36.0 144.0 2596 0.00 1.95 0.095 LS 37.2 1.4 0.8 2.4 3.4 2.6 1.02
FC13 18.0 36.0 144.0 3266 0.00 1.95 0.095 LS 50.0 1.4 0.4 3.6 5.0 4.6 1.03
SC6 Aboutaha
et al. (1999a)
18.0 36.0 48.0 2256 0.00 1.95 0.095 S 111.1 1.4 1.0 3.3 5.1 3.2 1.32
SC7 18.0 36.0 48.0 2941 0.00 1.95 0.095 S 101.2 1.4 0.5 4.2 6.3 5.8 1.36
SC8 18.0 36.0 48.0 2786 0.00 1.95 0.095 S 109.7 1.4 0.7 3.9 7.0 5.8 1.35
SC10 36.0 18.0 48.0 2391 0.00 1.95 0.191 S 205.2 1.4 0.6 4.0 5.3 4.7 0.70
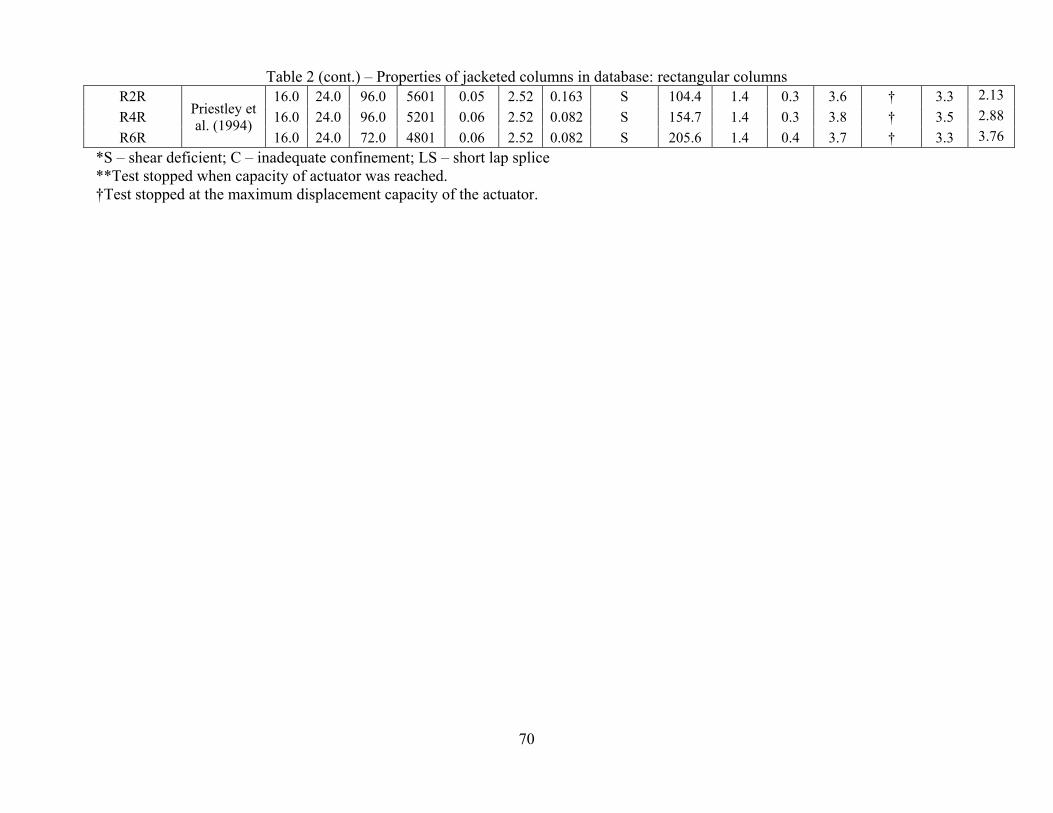
70
Table 2 (cont.) – Properties of jacketed columns in database: rectangular columns R2R
Priestley et al. (1994)
16.0 24.0 96.0 5601 0.05 2.52 0.163 S 104.4 1.4 0.3 3.6 † 3.3 2.13
R4R 16.0 24.0 96.0 5201 0.06 2.52 0.082 S 154.7 1.4 0.3 3.8 † 3.5 2.88
R6R 16.0 24.0 72.0 4801 0.06 2.52 0.082 S 205.6 1.4 0.4 3.7 † 3.3 3.76
*S – shear deficient; C – inadequate confinement; LS – short lap splice **Test stopped when capacity of actuator was reached. †Test stopped at the maximum displacement capacity of the actuator.