Embed Size (px)
Citation preview

www.itema-conference.com
Fourth International Scientifi c Conferenceon Recent Advances in Information Technology,
Tourism, Economics, Management and Agriculture
ITEMA 2020
CONFERENCEPROCEEDINGS


FOURTH INTERNATIONAL SCIENTIFIC CONFERENCE
ITEMA 2020
Recent Advances in Information Technology, Tourism, Economics,
Management and Agriculture
CONFERENCE PROCEEDINGS
Online-Virtual
October 8, 2020

Fourth International Scientific Conference ITEMA
Recent Advances in Information Technology, Tourism, Economics, Management and Agriculture
ISSN 2683-5991
Conference Proceedings (part of ITEMA conference collection)
Editor:
Vuk BEVANDA, PhD, Associate Professor, Faculty of Social Sciences, Belgrade, Serbia
Scientific Committee:
1. Dejan Filipović, PhD, Full - Time Professor, Dean, Faculty of Geography, University of Belgrade, Belgrade, Serbia
2. Zhanna Mingaleva, PhD, Professor, Perm National Research Polytechnic University, Perm, Russia
3. Duško Tomić, PhD, Full - Time Professor, American University in the Emirates, Dubai, United Arab Emirates
4. Branko Ljutić, PhD, Full - Time Professor
5. Miodrag Simović, PhD, Full - Time Professor, Faculty of Law, Banja Luka, Judge of the Constitutional Court of
Bosnia and Herzegovina, Bosnia and Herzegovina
6. Gordana Marjanović, PhD, Associate Professor, Faculty of Economics, University of Kragujevac, Kragujevac, Serbia
7. Sandra Jednak, PhD, Associate Professor, Faculty of Organizational Sciences, University of Belgrade, Belgrade,
Serbia
8. Brilanda Bushati, PhD, Associate Professor, University of Shkodra “Luigj Gurakuqi”, Economic Faculty, Shkodër,
Albania
9. Pece Nedanovski, PhD, Full - Time Professor, Ss. Cyril and Methodius University, Faculty of Economics, Skopje,
North Macedonia
10. Zoran Ćirić, PhD, Associate Professor, Faculty of Economics, University of Novi Sad, Subotica, Serbia
11. Zafer Çalışkan, PhD, Associate Professor, Hacettepe University, Department of Economics, Ankara, Turkey
12. Gordana Dozet, PhD, Associate Professor, Faculty of Biopharming, Backa Topola, Serbia
13. Karolina Olszewska, PhD, Assistant Professor, Faculty of Social Sciences, Institute of International Studies, Wrocław,
Poland
14. Nikolina Ljepava, PhD, Assistant Professor, MBA Program Director, American University in the Emirates, Dubai,
United Arab Emirates
15. Veneta Krasteva, PhD, Assistant Professor, Institute for the Study of Societies and Knowledge, Bulgarian Academy of
Sciences, Sofia, Bulgaria
16. Robert Jurča, PhD, Assistant Professor, European Polytechnic Institute, Kunovice, Czech Republic
17. Željko Sudarić, PhD, Senior Lecturer, College of Applied Sciences “Lavoslav Ružička”, Vukovar, Croatia
18. Yasin Galip Gençer, PhD, Assistant Professor, Yalova University, Yalova, Turkey
19. Nada Kosanović, PhD, Institute for the Application of Science in Agriculture, Belgrade, Serbia
20. Irena Andreeska, PhD, Associate Professor, University for Tourism and Management - Skopje and Euro College –
Kumanovo, North Macedonia
21. Branka Remenarić, PhD, Lecturer, Zagreb School of Economics and Management, Zagreb, Croatia
Organizational Committee:
Anton Vorina, PhD, Professor
Nikolina Vrcelj, PhD candidate
Nevena Bevanda, PhD student
Ivana Mirčević, BSc
Uroš Mirčević, Ing.
Goran Stevanović, BSc
Published by:
Association of Economists and Managers of the Balkans,
Ustanicka 179/2 St. 11000 Belgrade, Serbia
+381 62 8125 779
Printed by: SKRIPTA International, Belgrade
Cover image by: Gerd Altmann from Pixabay
Belgrade, 2020
ISBN 978-86-80194-36-3
ISSN 2683-5991
DOI: https://doi.org/10.31410/ITEMA.2020
Disclaimer: The author(s) of each paper appearing in this
publication is/are solely responsible for the content thereof; the
findings, interpretations and conclusions expressed in the
papers are those of the authors and do not reflect the view of
the editor, reviewers, scientific committee members, the
publisher, conference partners or anyone else involved in
creating, producing or delivering this publication.
This work is licensed under a Creative Commons
Attribution-NonCommercial 4.0 International License.
CIP - Katalogizacija u publikaciji
Narodna biblioteka Srbije, Beograd
330(082)
004(082)
005(082)
338.48(082)
631(082)
616.98:578.834]:33(082)
INTERNATIONAL Scientific Conference ITEMA 2020 Recent
Advances in Information Technology, Tourism, Economics,
Management and Agriculture (2020, 4)
Conference Proceedings / Fourth International Scientific Conference
ITEMA 2020 Recent Advances in Information Technology, Tourism,
Economics, Management and Agriculture, October 8, 2020 Online-
Virtual ; [organized by Association of Economists and Managers of the
Balkans ; editor Vuk Bevanda]. - Belgrade : Association of Economists
and Managers of the Balkans, 2021 (Belgrade : Skripta International). -
ilustr., XIV, 298 str. ; 30 cm. - (ITEMA conference collection, ISSN
2683-5991)
Tiraž 100. - Napomene i bibliografske reference uz tekst. -
Bibliografija uz svaki rad. - Registri.
ISBN 978-86-80194-36-3
a) Informaciona tehnologija -- Zbornici b) Ekonomija -- Zbornici v)
Menadžment -- Zbornici g) Turizam -- Zbornici d) Poljoprivreda --
Zbornici đ) Korona virus -- Ekonomski aspekt – Zbornici
COBISS.SR-ID 35796233

III
CONTENTS
INDEX OF AUTHORS .......................................................................................................VII INDEX .................................................................................................................................... IX PREFACE .............................................................................................................................. XI AUTHORS’ AFFILIATION ............................................................................................. XIII
EVALUATING GREEN IT IN LOCAL ADMINISTRATION ..........................................1 Manuel Landum
M. M. M. Moura Leonilde Reis
A NEW APPROACH IN QUANTIFYING USER EXPERIENCE IN
WEB-ORIENTED APPLICATIONS ....................................................................................9 Vasilije Vasilijević Nenad Kojić Natalija Vugdelija
COMPARATIVE ANALYSIS OF WEB APPLICATION PERFORMANCE
IN CASE OF USING REST VERSUS GRAPHQL ............................................................17 Milena Vesić Nenad Kojić
USE OF “OWASP TOP 10” IN WEB APPLICATION SECURITY ...............................25 Nikola Nedeljković
Natalija Vugdelija Nenad Kojić
A FRAME OF REFERENCE FOR RESEARCH OF A BLOCKCHAIN-
BASED SOLUTION TO CORPORATE GRC-MANAGEMENT ...................................31 Le Chen
GRAPH DATABASE MANAGEMENT SYSTEMS AND GRAPH THEORY ..............39 Kornelije Rabuzin
Sonja Ristić Robert Kudelić
SMALL AND MEDIUM-SIZED ENTERPRISES IN TOURISM AND
THEIR IMPACT ON REGIONAL DEVELOPMENT .....................................................47 Katarína Kráľová Jana Sochuľáková Dagmar Petrušová
THE MARKETING MIX - A BASIC TOOL IN THE MANAGEMENT OF THE
TOURIST DESTINATION ..................................................................................................55 Delia Fratu
THE IMPORTANCE OF ACQUIRING INTERCULTURAL
COMMUNICATIVE COMPETENCE FOR PRESENT AND
FUTURE TOURIST PROFESSIONALS IN MONTENEGRO .......................................69 Gordana Mušura
ECONOMIC BENEFITS OF ŠUMAVA NATIONAL PARK ..........................................73 Josef Stemberk
THE ROLE OF INTERNATIONAL AND PROFESSIONAL
ORGANISATIONS’ IN DEFINING STATE-OWNED ENTERPRISES ........................83 Ioana Andreea Ciolomic Ioana Natalia Beleiu

IV
ITEMA 2020
Conference Proceedings
TESTING THE EMPIRICS OF WEAK FORM OF EFFICIENT
MARKET HYPOTHESIS: EVIDENCE FROM LAC REGION MARKETS ................91 Hortense Santos Rui Dias Paula Heliodoro
Paulo Alexandre
THE IMPACT OF THE COVID-19 ON THE FINANCIAL
MARKETS: EVIDENCE FROM G7.................................................................................103 Paula Heliodoro Rui Dias
Paulo Alexandre Maria Manuel
THE DOW JONES INDUSTRIAL AVERAGE (DJIA) STOCK
MARKET INDEX AND THE CHAOTIC GROWTH MODEL ....................................113 Vesna Jablanovic
RANDOM STRATEGY VERSUS TECHNICAL ANALYSIS
STRATEGY IN THE US MARKET .................................................................................121 Miroslav Svoboda
Martina Sponerová
CASH FLOW FORECASTING FOR INTERNATIONAL PROJECTS
IN THE PROCESS OF CAPITAL BUDGETING DURING
THE COVID-19 PANDEMIC ............................................................................................129 Biljana Pejović Dragana Trifunović
Aleksandra Živaljević
ANALYSIS OF RESEARCH AND DEVELOPMENT
EXPENDITURE IN EUROPEAN UNION COUNTRIES ..............................................137 Ľubica Hurbánková
EUROPEAN UNION, ROMANIA AND RAILWAY TRANSPORT .............................143 Clara Elena Muț Ciprian Beniamin Benea
Adrian Negrea Secara-Onita Adina
Catarig Andra
BASIC ELEMENTS OF THE FINANCIAL FUNCTION IN
BUSINESS ENTITIES ........................................................................................................151 Slobodan Bracanović
HUNGARIAN IFRS IMPLEMENTATION FROM TAX PERSPECTIVE .................159 Gábor Fehér Éva Karai
CLASSIFICATION OF FINANCIAL MECHANISMS OF
HEALTHCARE SYSTEMS IN THE COUNTRIES OF EUROPEAN UNION ...........169 Nadiya Dubrovina Stanislav Filip Vira Dubrovina
PREPARING SCHOOL GRADUATES FOR THE LABOUR MARKET ...................177 Mária Nováková
Silvia Capíková

V
CONTENTS
THE INFLUENCE OF KNOWLEDGE MANAGEMENT ON
THE DEVELOPMENT OF INNOVATION IN THE ENTERPRISES IN
THE REPUBLIC OF NORTH MACEDONIA-SELECTED RESULTS .......................185 Marija Pendevska
OPERATION MANAGEMENT USING ITIL AND COBIT
FRAMEWORK ....................................................................................................................201 Joaquina Marchão Paula Ventura
HOW DATA ANALYTICS HELPS MANAGEMENT IN GLOBAL
PANDEMIC SITUATION ..................................................................................................209 Dimitar Dimitrov Radko Radev
PURCHASING BUSINESS IN THE CONDITIONS OF THE
PANDEMIC CRISIS ...........................................................................................................219 Sandra Mrvica Mađarac Zvonimir Filipović Marko Eljuga
THE NECESSITY OF PSYCHOHYGIENE IN THE WORK OF TRADERS .............225 Zuzana Birknerová
Dagmara Ratnayake Kaščáková
SOCIAL NETWORKS, COGNITIVE BIASES AND FAKE NEWS:
CAN A SIMPLE COMPUTER MODEL EXPLAIN A COMPLEX
PHENOMENON? ................................................................................................................231 Blaž Rodič
CHALLENGES IN MANAGING INTELLECTUAL PROPERTY
RIGHTS DURING CORONAVIRUS PANDEMIC ........................................................239 Mario Lukinović Larisa Jovanović
Vladimir Šašo
KEYWORD ANALYSIS WITH USING STATISTICAL METHODS .........................251 Dominika Krasňaská
Mária Vojtková
GREENHOUSE GAS EMISSIONS PRODUCED IN AGRICULTURE
SECTOR IN EU ...................................................................................................................257 Mariana Dubravská
Elena Širá
HOUSEHOLD/INDIVIDUALS IN THE PROCESS OF PRODUCTION
AND DELIVERY OF ELECTRICITY FROM RENEWABLE
ENERGY SOURCES – PHOTOVOLTAIC SYSTEMS ..................................................267 Serjoza Markov
LEVELS OF SOME PRIORITY SUBSTANCES ON
ADRIATIC SEA, ALBANIA ..............................................................................................277 Aurel Nuro Bledar Murtaj
HEAVY METAL ACCUMULATION AND CHEMICAL COMPOSITION
OF ESSENTIAL OILS OF LEMON BALM (MELISSA OFFICINALIS L.)
CULTIVATED ON HEAVY METAL CONTAMINATED SOILS ...............................287 Violina Angelova


VII
INDEX OF AUTHORS
A L Vesna Jablanovic, 113
Adrian Negrea, 143 Larisa Jovanović, 239 Violina Angelova, 287
Aleksandra Živaljević, 129 Le Chen, 31 Vira Dubrovina, 169
Aurel Nuro, 277 Leonilde Reis, 1, 201 Vladimir Šašo, 239
Ľubica Hurbánková, 137
B Z
Biljana Pejović, 129 M Zuzana Birknerová, 225
Blaž Rodič, 231 M. M. M. Moura, 1 Zvonimir Filipović, 219
Bledar Murtaj, 277 Manuel Landum, 1
Maria Manuel, 103
C Mária Nováková, 177
Catarig Andra, 143 Mária Vojtková, 251
Ciprian Beniamin Benea, 143 Mariana Dubravská, 257
Clara Elena Muț, 143 Marija Pendevska, 185
Mario Lukinović, 239
D Marko Eljuga, 219
Dagmar Petrušová, 47 Martina Sponerová, 121
Dagmara Ratnayake Kaščáková, Milena Vesić, 17
225 Miroslav Svoboda, 121
Delia Fratu, 55
Dimitar Dimitrov, 209 N
Dominika Krasňaská, 251 Nadiya Dubrovina, 169
Dragana Trifunović, 129 Natalija Vugdelija, 9, 25
Nenad Kojić, 9, 17, 25
E Nikola Nedeljković, 25
Elena Širá, 257
Éva Karai, 159 P
Paula Heliodoro, 91, 103
G Paula Ventura, 201
Gábor Fehér, 159 Paulo Alexandre, 91, 103
Gordana Mušura, 69
R
H Radko Radev, 209
Hortense Santos, 91 Robert Kudelić, 39
Rui Dias, 91, 103
I
Ioana Andreea Ciolomic, 83 S
Ioana Natalia Beleiu, 83 Sandra Mrvica Mađarac, 219
Secara-Onita Adina, 143
J Serjoza Markov, 267
Jana Sochuľáková, 47 Silvia Capíková, 177
Joaquina Marchão, 201 Slobodan Bracanović, 151
Josef Stemberk, 73 Sonja Ristić, 39
Stanislav Filip, 169
K
Katarína Kráľová, 47 V
Kornelije Rabuzin, 39 Vasilije Vasilijević, 9


IX
INDEX
A Emergent phenomena, 231 K
Acceptance, 73 Essential oil composition, 287 Keyword categories, 251
Accounting, 151 EU, 257 Keywords, 251
Agent-based modelling, 231 Europe 2020, 257 Knowledge management, 185
Agriculture, 257 European union countries, 137
Arbitration, 91, 103 L
Attributes, 225 F Labour market, 177 Fake news, 231 LAC region, 91
B Finance, 151 Land transport, 143 Backtesting, 121 Flow, 151 Lemon balm, 287 Blockchain, 31 Foreign exchange markets, 121 Listed companies, 159 Business process, 201 Function, 151 Long memories, 91, 103 Funding, 169 Long-life learning, 69
C
Capital budgeting, 129 G M
Capital, 151 G7, 103 Management, 209 Cash flows, 129 GC/ECD, 277 Market, 151 Chaos, 113 Generics, 239 Marketing mix, 55 Classification, 169 Globalization, 69 Measuring, 9 Closed innovation, 185 Governance, 83 Moving average, 121 Cluster analysis, 169 GraphQL, 17 MS SQL server, 39 COBIT, 201 Green IT, 1
Cognitive bias, 231 Greenhouse gas emissions, 257 N
Company, 219 Neo4j, 39 Contaminated soils, 287 H New knowledge creation, 185 Contribution method, 137 Healthcare system, 169
Coronavirus pandemic, 239 Heavy metals, 287 O
Corporate GRC-management,31 Open innovation, 185 Corporate income taxation, 159 I Oracle, 39 Corporate management, 209 IFRS, 159 Organization, 219 COVID-19, 91, 103, 239 Incremental innovation, 185 Organochlorine pesticides,277 Cybersecurity, 239 Information and communication
Cypher, 39 technologies, 1 P
Innovation, 185, 239 PAH; 277
D Intellectual property, 239 Pandemic crisis, 219 Data analysis, 209 Intercultural approach in Pandemic, 129 Destination, 55 foreign language teaching, 69 Patents, 239 Digital transformation, 31 Intercultural awareness and PCBs; 277 Discount rate, 129 sensitivity, 69 Performance, 9, 17 Disinformation, 231 Intercultural communication, 69 Persistence, 103 DJIA index, 113 Intercultural speaker, 69 Place marketing, 55 Drugs, 239 International and professional Psychohygiene, 225 organisations, 83 Purchasing business, 219
E Investment decisions, 121
Economic benefits, 73 ITIL, 201 R
Electricity, 267 ITSM, 201 Radical innovation, 185 Elliot waves, 113 Railway transport, 143
X
ITEMA 2020
Conference Proceedings
Regional development, 47 T
Regional disparities, 47 Tourism, 47, 55
Relative strength index, 121 Traders, 225
Republic of North Macedonia,
267 U
Research and development US market, 121
expenditure, 137
REST, 17 V
Vaccines, 239
S Virtual, 151
School graduates, 177
Service operation, 201 W
Skills, 177 Water analyzes; 277
Small and medium Weaknesses of the web
enterprises, 47 application, 25
Social networks, 231 Web attack, 25
Social psychology, 231 Web page, 17
Software, 31 Web security, 25
Solar energy, 267 Web sites, 9
Stability, 113 Web vitals, 9
State-owned enterprises, 83
Statistical methods, 251
Šumava national park, 73
Supply, 219
Sustainability, 1
Sustainable future, 143

XI
PREFACE
Association of Economists and Managers of the Balkans headquartered in Belgrade – Serbia
organized the Fourth International Scientific Conference on Recent Advances in Information
Technology, Tourism, Economics, Management and Agriculture - ITEMA 2020
online/virtually (due to the COVID-19 pandemic) on October 8, 2020 via Zoom platform.
The aim of the ITEMA 2020 conference was to bring together the academic community
(experts, scientists, engineers, researchers, students and others) and publication of their papers
with the purpose of popularization of science and their personal and collective affirmation. The
unique program combined presentation of the latest scientific developments in Information
Technologies, Tourism, Economics, Management and Agriculture, interactive discussions and
other forms of interpersonal exchange of experiences.
Within publications from the ITEMA 2020 conference:
• 12 double peer-reviewed papers have been published in the ITEMA 2020 - Recent
Advances in Information Technology, Tourism, Economics, Management and
Agriculture - Selected Papers,
• 34 double peer-reviewed papers have been published in the ITEMA 2020 - Recent
Advances in Information Technology, Tourism, Economics, Management and
Agriculture – Conference Proceedings,
• 63 abstracts have been published in the ITEMA 2020 - Recent Advances in Information
Technology, Tourism, Economics, Management and Agriculture - Book of Abstracts.
ITEMA 2020 publications have more than 500 pages. All papers have been scanned with the
Crosscheck (powered by Turnitin) and have ORCID iD integration. Besides that, some papers
have been accepted for publication in the conference partner journals namely:
1. Balkans Journal of Emerging Trends in Social Sciences (Balkans JETSS) is an
international scientific journal, published by the Association of Economists and
Managers of the Balkans. Aims and scope are economics, management, law and tourism.
Balkans JETSS has the following indexations: Google Scholar, CEEOL (Central and
Eastern European Online Library), Index Copernicus, ProQuest´s Serial Solutions,
Summon, Primo Central, Alma, EBSCO´s EDS Discovery Service and Knowledge Base,
TDNet and OCLC.
2. Journal of Innovative Business and Management is published by the DOBA Faculty,
Maribor (Slovenia) and is referred in international scientific journal bases DOAJ, Google
Scholar, EconPapers, ResearchGate and RePec. It has been published since 2009 and
since then it has been attracting more and more interest among the readers, who
predominantly come from academia and business practice.
3. Journal of Sustainable Development (JSD) is an international journal published by the
Integrated Business Faculty – Skopje, North Macedonia. JSD area includes three pillars
of economic, social and environmental development issues. All these aspects are
considered relevant for publishing in the JSD. The journal is officially listed in the
respected EBSCO database, CEEOL database, as well as the databases of Business
Source Complete and Sustainability Reference Center. All articles published in the
journal are also indexed in these databases.
4. JFEAS is published by the Çukurova University, Faculty of Economics and
Administrative Sciences from Turkey twice a year as an open source. This international
journal is dedicated to the wide scope of themes of economics, business, public finance,

XII
ITEMA 2020
Conference Proceedings
econometrics, international relations, labor economics and the theoretical,
methodological and applications between these disciplines, and others in Turkish and
English. The journal is indexed in DOAJ, DRJI and Index Copernicus.
5. Central European Journal of Geography and Sustainable Development (CEJGSD) starting with 2018 publishes relevant academic research papers in geography, sustainable
development and other related areas. Journal has a reputable international editorial board
comprising experts from Italy, Poland, Slovakia, Serbia, Bulgaria, Hungary, Romania,
Israel, Russian Federation, and Turkey. CEJGSD has indexation in Ulrich’s Periodicals
Directory, ELSEVIER Social Science Research Network (SSRN) and Scientific
Publishing & Information Online (SCIPIO).
Participation in the conference took 114 researchers with the paper representing 20 different
countries from different universities, eminent faculties, scientific institutes, colleges, and
various ministries, local governments, public and private enterprises, multinational companies,
associations, etc.

XIII
AUTHORS’ AFFILIATION
Albania
Tirana University, Faculty of Natural Sciences,
Department of Chemistry, Blv. "Zog I", Nr. 25,
Tirana
Bosnia and Herzegovina
Drina Insurance a.d. Milici, Republic of Srpska
University of East Sarajevo, Faculty of
Transportation Doboj, Doboj, Republic of
Srpska
Bulgaria
Agricultural University, Department of
Chemistry – Plovdiv
University of National and World Economy
(UNWE), bul. 8th December, Students town,
1700 Sofia
Croatia
Agro – Honor d.o.o., Vrbaska 1c, Osijek
College of Applied Sciences “Lavoslav
Ružička” in Vukovar, Županijska 50, Vukovar
Institute for Tourism, Vrhovec, 5 10000 Zagreb
PIK Vrbovec plus d.o.o., Gospodarska zona 20,
Antunovac
Polytechnic Nikola Tesla in Gospić, Bana Ivana
Karlovića 16, Gospić,
The Institute of Economics, Zagreb, Trg J.F.
Kennedyja 7, 10000 Zagreb
University of Rijeka, Faculty of Economics and
Business, Rijeka
University of Rijeka, Faculty of Tourism and
Hospitality Management, Ika, Primorska 42,
Opatija
University of Split, Faculty of Economics,
Business and Tourism, Cvite Fiskovica 5,
21000 Split
University of Zadar, Department of Economics,
Splitska ulica 1, 23000 Zadar
University of Zagreb, Faculty of organization
and informatics, Pavlinska 2, Varaždin
Czech Republic
Jan Evangelista Purkyně University in Ústí nad
Labem: Ústí nad Labem, Pasteurova 1, 400 96
Ústí nad Labem
Masaryk University, Faculty of Economics and
Administration, Department of Finance, Lipová
41a, 603 00 Brno
Mendel University in Brno, Faculty of Business
and Economics, Department of Marketing and
Trade, Zemědělská 1665/1, 613 00 Brno-sever
University Hradec Kralove, Rokitanského 62,
500 03 Hradec Králové III
Hunagry
Budapest Business School, Markó utca 29-31,
1055 Budapest
Corvinus University of Budapest, 1093, Fovam
ter 8, Budapest
Eotvos Lorand University Institut of Business
Economics, Rákóczi út 7, 1088 Budapest
Pázmány Péter Catholic University,
Szentkirályi str. 28. 1088 Budapest
Indonesia
Indonesia University of Education, Jl. Dr.
Setiabudhi No. 229 Bandung 40154 Jawa Barat
Italy
Telematic University Giustino Fortunato, Via
R. Delcogliano, 12 -82100 Benevento
University for Foreigners "Dante Alighieri" of
Reggio Calabria, Via del Torrione 95, Reggio
Calabria
Montenegro
Faculty of Business and Tourism, Akademija
znanja, Budva
North Macedonia
Law Company Cukic & Markov, 33A-01
Aminta Treti str., 1000 Skopje
University "St. Kliment Ohridski"-Bitola,
Faculty of Tourism and Hospitality-Ohrid,
Bulevar Turisticka 8-M4, 6000 Ohrid
Portugal
Polytechnic Institute of Guarda
Polytechnic Institute of Setúbal, Campus do
IPS, Estefanilha, Setúbal
Universidade de Évora, Escola Superior de
Ciências Empresariais – Instituto Politécnico de
Setúbal
Universidade do Algarve, DEEI/FCT, Campus
de Gambelas, Faro, 8005-139 Faro
Republic of Korea
Woosong University, 171 Dongdaejeon-ro
(155-3 Jayang-dong), Dong-gu, Daejeon

XIV
ITEMA 2020
Conference Proceedings
Romania
Babes-Bolyai University, Faculty of Economics
and Business Administration, Cluj-Napoca
Romanian Academy, 125, Calea Victoriei,
sector 1, RO - 010071, Bucharest
SC Interregional SRL - (private railway
transport operator)
School of Advanced Studies of Romanian
Academy (SCOSAAR), 125, Calea Victoriei,
sector 1, RO - 010071, Bucharest
Transilvania University of Brașov, Faculty of
Sociology and Communication, Department of
Social Sciences and Comunication, Eroilor
Blvd., no. 25, Brasov City, Brasov County
Transilvania University of Brașov, Romania
University of Oradea, Strada Universității nr. 1,
Oradea 410087
Russia
Lomonosov Moscow State University,
Kutuzovsky prospect 33-176, Moscow
National Research University Higher School of
Economics, Microdistrict 3rd, 18-91, g.
Moskovskiy, Moscow
Serbia
Academy of Technical and Art Applied Studies
Belgrade (ATUSS) - Department School of
Applied Studies for Information and
Communication Technologies Belgrade,
Zdravka Celara 16, Belgrade
Academy of Technical and Art Applied Studies
Belgrade (ATUSS) – Department ICT College
for vocational studies, Zdravka Čelara 16,
Belgrade
ALFA BK University, Belgrade
Enreach Labs, Omladinskih brigada 90 V,
Belgrade
Faculty of Economics in Priština, Kosovska
Mitrovica
Faculty of Social Sciences, Bulevar umetnosti
2ª, Belgrade
UNION University, Faculty of Law, Belgrade
University „Union Nikola Tesla“, Faculty of
Law, Security and Management "Konstantin
the Great", Zetska 2-4, 1800 Niš
University of Belgrade, Faculty of Agriculture,
Nemanjina 6, 11081 Belgrade
University of Kragujevac, Faculty of Hotel
Management and Tourism, Vojvođanska bb,
6210 Vrnjačka Banja
University of Niš, Faculty of Science and
Mathematics, Višegradska 33, 18000 Niš
University of Novi Sad, Faculty of technical
sciences, Trg D. Obradovića 6, Novi Sad
Slovakia
Alexander Dubček University in Trenčín,
Faculty of Social and Economic Relations,
Študentská 3, 91150 Trenčín
Comenius University in Bratislava, Faculty of
Law, Šafárikovo námestie 6, 810 00 Bratislava
Comenius University in Bratislava, Faculty of
Medicine, Špitálska 24, 813 72 Bratislava,
Slovak Republic
School of Economics and Management in
Public Administration in Bratislava, Furdekova
16, 851 04 Bratislava
University of Economics in Bratislava, Faculty
of Economic and Informatics, Dolnozemská
cesta 1, Bratislava
University of Prešov, Faculty of Management,
Department of Economics and Economy, 080
01 Prešov
University of Prešov, Faculty of Management,
Department of Intercultural Communication,
Konstantinova 16, 080 01, Presov
University of Prešov, Faculty of Management,
Department of Managerial Psychology,
Konstantinova 16, 080 01, Presov
Slovenia
ERUDIO
Faculty of Information Studies, Ljubljanska
cesta 31a, SI-8000 Novo Mesto
Fakulteta za medije
School of Advanced Social Studies Nova
Gorica
University of Primorska, Faculty of
Management, Cankarjeva 5, Koper
Spain
Universitat de Barcelona, Gran Via de les Corts
Catalanes, 585, 08007 Barcelona
Ukraine
Kharkiv Institute of Trade and Economics of
KNTEU, Otakara Yarosha Ln, 8, Kharkiv
United Arab Emirates
Higher Colleges of Technology, Abu Dhabi

1
EVALUATING GREEN IT IN LOCAL ADMINISTRATION
Manuel Landum1
M. M. M. Moura2
Leonilde Reis3
DOI: https://doi.org/10.31410/ITEMA.2020.1
Abstract: This work is prompted by the massive use of Information and Communication
Technologies, the need for alignment with the business, the concern for integrated management
and the need to protect natural resources and the environment. This article aims to present a
framework, multidimensional and multidisciplinary, from the perspective of sustainability, in
the treatment of Green IT, involving environmental issues and social responsibility,
Governance of Information Technologies and Financial Management, in the context of Public
Administration, more specifically in local administration. The methodology used is based on
the literature review, in the field of thematic, and on a case study in development in local
government, in order to analyze the feasibility and suitability with the validation of the
framework. The main results obtained in the case study focus on the use of technology allied
to Green IT, with theoretical reflexes for environmental quality and with possible cost
reduction.
Keywords: Green IT, Information and communication technologies, Sustainability.
INTRODUCTION
ublic administration, and particularly local administration (LA), is encumbered with a
set of rules that make it particularly difficult to implement changes. On the other hand,
the use of information and communication technologies (ICT) to support current
activities is provoking a high rate of change in the business processes of an organization.
Aligned with this, one should note that ecological considerations are a matter of social
responsibility that has been gaining visibility in recent years. Green information technology
(Green IT) is naturally associated with these themes (Chugh, Wibowo, & Grandhi, 2016), and
can be the vehicle for achieving environmental sustainability.
Our concern is the governance of ICT in a local public administration scenario. In fact, there is
a social responsibility that cannot be forsaken in the decisions and actions taken by enterprises
and it is more so when local public administration is concerned. Having drawn a proposal of
good practices that assure the governance of ICT while maintaining the alignment with green
IT (Landum, Moura, & Reis, 2020), we then sought to reconcile the green information
technology and green information systems perspectives. Having reviewed the state of the art
of management practices (Landum, Reis, & Moura, 2020) in what concerns the optimization
the governance of ICT a need was felt for a general model to evaluate alternative measures and
quantify their suitability.
1 Universidade do Algarve, Portugal, DEEI/FCT, Campus de Gambelas, Faro, 8005-139 Faro, Portugal 2 Universidade do Algarve, Portugal, DEEI/FCT, Campus de Gambelas, Faro, 8005-139 Faro, Portugal 3 Polytechnic Institute of Setúbal, Portugal, Campus do IPS, Estefanilha, Setúbal, Portugal
P

2
ITEMA 2020
Conference Proceedings
In the perspective of the author (Landum, 2018), the implementation and optimization of ICT
management practices, in Local Administration (LA), should consider the
reduction/optimization of costs, ubiquity, in the search for greater productivity, guaranteeing
safety standards.
Considering a change, or a new process to be implemented, one can separately evaluate how
that change will impact an ecological dimension. The literature is mostly unanimous
considering that the ecological impact can be equated in terms of carbon footprint, reduction
of the number of products for recycling and sustainable use of resources including energy. The
evaluation on a social dimension translates to how a service is perceived by its end users. In
our present case, one must consider the employees of the ICT department but also the citizens
of the municipality. In what concerns the financial impact of a measure again it is twofold as
one can distinguish direct and indirect costs and how they translate to the global welfare of the
community. A preliminary model for a quantitative evaluation of the alignment with Green IT
of a process or operating change is presented. Following this introduction, in the second section
the impact of Green IT on LA is described, and in the third section, some final remarks and
perspectives of future work are presented.
IMPACT OF GREEN IT ON LOCAL GOVERNMENT
The section presents the theme of Green IT, and the way it has gained status taking into account
the global movement that has developed, emerging with its environmental concerns, the
problem of climate change, sustainability and the promotion of social and environmental
responsibility, linked to technology. Currently the “Green technology plays a fundamental role
in achieving the global sustainable development goals. However, the lack of a widely accepted
classification system for green technology often hinders the development and adoption of green
technology” (Guo, et al., 2020). The European Union (EU), in December 2019, launched the
European Ecological Agreement, which states that “Climate change and environmental
degradation are an existential threat to Europe and the world. To overcome these challenges,
Europe needs a new growth strategy that transforms the Union into a modern, resource-efficient
and competitive economy where there are no net emissions of greenhouse gases by 2050;
economic growth is decoupled from resource use and no person and no place are left behind.
The European Green Deal is our roadmap for making the EU's economy sustainable. This will
happen by turning climate and environmental challenges into opportunities across all policy
areas and making the transition just and inclusive for all” (Commission, 2019).
The EU has defined as a strategy the launch of the green agreement and the aim is that by 2050
there will be no greenhouse gas emissions, currently “it is by no means certain our society has
the capacity to endure – at least in such a way that the nine billion people expected on Earth by
2050 will all be able to achieve a basic quality of life. The planet’s ecosystems are deteriorating,
and the climate is changing. We are consuming so much, and so quickly, that we are already
living far beyond the earth’s capacity to support us” (ERM Group Company, 2020). The author
(Sulaiman, Naqshbandi, & Dezdar, 2015) mentions that “This is a big challenge, and not just
for business and economics. It is a call for massive social, political, technological, cultural and
behavioral transition. We will need governments to set incentives, targets and rules for a level
playing field, civil society actors to hold us to account and to experiment with new ways of
delivering social impact”.
In the face of this challenge, it is necessary and evident that (Cai, Chen, & Bose, 2013) the
adoption of practices and tools that allow the general management, being an increasing

3
EVALUATING GREEN IT IN LOCAL ADMINISTRATION
occurrence in local public organizations. These organizations are shifting the paradigm from
management to sustainability, and LA is developing its projects faster than other levels of the
public sector, notably PA, regarding integrating environmental and sustainability aspects into
operations and strategies. One of the ways to promote the implementation of such practices is
"aware-ness of sustainable ICT practices can help organizations to adopt various strategies in
developing effective sustainability work practices and educating their employees" (Chugh,
Wibowo, & Grandhi, 2016). Aware of the situation, the municipality understudy, strategically
embarked on the renovation of its aged computer park, adopting disruptive technologies,
environmentally friendly and simultaneously self-sustaining. It should be highlighted that one
of the objectives of environmental sustainability is to solve the current needs, without
compromising the needs of future generations and this will only be possible if existing natural
resources are not currently exhausted.
For the authors (Chugh, Wibowo, & Grandhi, 2016) environmental sustainability can be
achieved through the adoption of correct practices in the design, manufacture, use and disposal
of ICT. Green ICT, influenced by user practices or the use of appropriate technology to make
the environment sustainable, should help reduce the environmental footprint of agencies, so
(Moreno & Reis, 2012) they consider that the use of Information Systems (IS) as a means of
supporting and improving the organization's activities is indisputable. IS are a key contribution
to efficient resource management to achieve an organization's objectives. It should be
highlighted that the future of ICT will increasingly be based on the vector of sustainability,
therefore (Meneses, 2019) the numerous emerging technologies that characterize industry 4.0,
namely artificial intelligence, internet of things (IoT), nano-technology, quantum computing,
drones, 3D printing, blockchain, among others, will have uses increasingly focused on
sustainability (i.e. on people, the environment and governance processes).
The Green IT approach is often combined with sustainability, knowing that the “Sustainable
development is a widely debated issue around the world and there has been increasing pressure
on firms to adopt practices that are more environmentally friendly. Among the most crucial
practices are Green Information Technology (IT) practices, as most firms use some form of IT
to perform their daily transactions” (Sulaiman, Naqshbandi, & Dezdar, 2015), i.e. supports
your systems in IT solutions. The concept of Green IT is not equal to IT for Green, but it
complements the two definitions “Green IT is the practice of designing, manufacturing, using
and disposing of computer, servers and associated subsystems efficiently and effectively with
minimal or no impact on the environment, with a strong focus on improving energy efficiency
and equipment utilization through steps such as designing energy efficient chips, virtualization,
reducing data center energy consumption, using renewable energy to power data centers, and
reducing electronic waste” (Cai, Chen, & Bose, 2013), in the perspective of its authors. The
concept of IT for Green is based on the “use of information systems to enhance sustainability
across the economy, with a focus on IT as a solution” (Cai, Chen, & Bose, 2013).
In short, "local governments are faced with the need to be part of the change from the
perspective of sustainability and integrate good practices to improve their own performance"
(Cai, Chen, & Bose, 2013).
EVALUATING GREEN IT
Organizations, more specifically LA, feel the need to find models of good ICT practices, which
can simultaneously be sustainable, contribution to environmental improvement and align with
Green IT, so a schematic plan of a developed Framework is presented, where in this article

4
ITEMA 2020
Conference Proceedings
only a few vectors will be addressed. We consider that evaluating the alignment with Green IT
should include business objectives as well as productivity, reliability, service availability,
optimization of management times, information security, cost reduction, environmental
impact, and customer satisfaction.
Thus, we equate the alignment with Green IT (1)
GreenIT Alignment = 0.3 IT + 0.2 Fin + 0.3 Env + 0.2 Soc (1)
considering the contribution of four dimensions, namely IT, financial (Fin), environmental
(Env) and social (Soc).
It is thus necessary to distribute the contributing valences by the corresponding dimensions and
to translate each of the valences to indicators. In each dimension, the relevant indicators are
evaluated. The positive (+) or negative (-) value of the indicator will convey if it furthers or
hinders the green alignment, respectively, and is presented in the direction column. The relative
relevance of an indicator is conveyed by a weight (in %).
IT valences: Hardware, software, information systems, security, governance.
Financial valences: Direct and/or indirect costs of IT.
Environmental valences: Environmental impact including CO2 emissions, use of natural
resources, contribution to global warming, recycling.
Social valences: satisfaction of the citizen, speed of response, number of trips, time on the
move, image of the municipality.
The IT dimension (IT) aggregates the indicators that convey the operational goals, namely, to
optimize reliability, service availability, optimization of management times, information
security and productivity (Table 1). The financial dimension (Fin) aggregates the indicators
that relate to cost, either capital expenditure (CapEx) or operating expenditure (OPEX) (Table
2). The indicators included in the environmental dimension are presented in Table 3. The
indicators considered in the social dimension convey social satisfaction with the services
provided and the perceived image of the municipality (Table 4).
Table 1. IT indicators
Indicators Direction Weight factor
reliability + 10%
management times - 5%
service availability + 10%
productivity + 15%
quality management + 5%
number of malfunctions - 10%
information security + 20%
ubiquity of access + 10%
reduction of file space on digital support + 5%
number of printing equipment’s - 5%
stock of consumables - 5%

5
EVALUATING GREEN IT IN LOCAL ADMINISTRATION
Table 2. Financial indicators
Indicators Direction Weight factor
cost of infrastructure - 25%
equipment lifetime + 20%
training + 10%
energy costs - 20%
number of printing equipment’s - 15%
consumable costs - 10%
Table 3. Environmental indicators
Indicators Direction Weight factor
energy consumption - 20%
CO2 emissions - 20%
preservation of natural resources + 10%
suitability for recycling + 5%
global warming - 5%
paper file space - 10%
paper use - 5%
deforestation - 15%
number of printing equipment - 5%
stock of consumables - 5%
Table 4. Social indicators
Indicators Direction Weight factor
satisfaction of the citizen + 10%
image of the municipality + 10%
well-being of employees - 10%
time in the circulation of information - 15%
speed in the response to the citizen + 10%
number of trips to the service - 10%
loss of time on travel - 10%
travel costs to citizens - 15%
service times - 10%
Finally, the evaluation of a new process or the global activity will be qualitatively resumed as
presented in
Table 5.
Table 5. Green IT Alignment
Nominal score Qualitative score
<= 20 % Very little aligned
>20% ^ <= 45% Little lined up
>45% ^ <= 75% Aligned
>75% ^ <= 90% Very aligned
>90% ^100% Strongly aligned
6
ITEMA 2020
Conference Proceedings
This model can be used to support strategic decisions and informed choice on changes such as
substituting CRT monitors with LCDs, substituting desktop computers by thin clients or
making services available online can be facilitated.
CONCLUSION
The main conclusions focus on the presentation of indicators underlying the various
dimensions towards the optimization of ICT management practices in LA to contribute to
Green IT. The multidimensional and multidisciplinary Framework has implicitly the possibility
of assigning weights allowing for the specificity of each LA thus contributing, in a sense of
flexibility and suitability, to promote sustainability and contribute to Green IT.
About the impact of Green IT on LA, the paper presents several contributes in this area,
particularly with regard to the quantification of the measures adopted, considering that the
approximations to Green IT can be evaluated by the dimensions IT, Financial, Environmental
and Social. It is also considered that it is added value that the dimensions under study are
comprehensive to include several valences.
As perspectives of future work, it is intended to reflect on the scope of the dimensions under
study as well as to analyze the indicators and relative relevance thus contributing to the creation
of a quantitative model, applicable by PA and LA, to support the decision-making process
while aligning with Green IT.
REFERENCES
Cai, S., Chen, X., & Bose, I. (2013). Exploring the role of IT for environmental sustainability
in China: An empirical analysis. Retrieved: 28th September 2020,
https://www.sciencedirect.com/science/article/pii/S0925527313000480?via%3Dihub
Chugh, R., Wibowo, S., & Grandhi, S. (2016). Environmentally sustainable Information and
Communication Technology usage: awareness and practices of Indian Information and
Communication Technology professionals. Retrieved: 29th September 2020,
https://www.sciencedirect.com/science/article/pii/S0959652616304590
Commission, E. (2019). A European Green Deal - Striving to be the first climate-neutral
continent. Retrieved: 15th September 2020, https://ec.europa.eu/info/strategy/priorities-
2019-2024/european-green-deal_en
ERM Group Company. (2020). Sustainability: Can our society endure? Retrieved: 26th
September 2020, https://sustainability.com/sustainability/
Guo, R., Lv, S., Liao, T., Xi, F., Zhang, J., Zuo, X., Zhang, Y. (2020). Classifying green
technologies for sustainable innovation and investment. Retrieved: 17th September 2020,
https://www.sciencedirect.com/science/article/pii/S0921344919304860
Landum, M. (2018). Conceção de abordagem para otimização das práticas de gestão das TIC.
Retrieved: 17th September 2020,
https://repositorio.ipsantarem.pt/bitstream/10400.15/2634/1/eBook_CAPSI%202018_R
icardoSaoJoao.pdf
Landum, M., Moura, M. M., & Reis, L. (2020). Boas Práticas de TIC em alinhamento com o
Green IT. Retrieved: 22nd September 2020, CISTI'2020 - 15th Iberian Conference on
Information Systems and Technologies:
http://www.aistic.org/cisti2020/oc20/modules/request.php?module=oc_program&action
=summary.php&id=154

7
EVALUATING GREEN IT IN LOCAL ADMINISTRATION
Landum, M., Reis, L., & Moura, M. M. (2020). Concept of approach to optimize ICT
management practices: State of the art. Em L. C. Carvalho, L. Reis, A. Prata, & R. Pereira,
Handbook of Research on Multidisciplinary Approach to Entrepreneurship, Innovation,
and ICTs (pp. pp. 174-199). IGI Global. doi:10.4018/978-1-7998-4099-2.ch009
Meneses, J. W. (2019). A sustentabilidade em 2019. Retrieved: 26th September 2020,
https://www.bcsdportugal.org/noticias/a-sustentabilidade-em-2019
Moreno, J., & Reis, L. (2012). Proposta de implementação de um portal corporativo - Caso
Ana Aeroportos de Portugal, S.A. Retrieved: 25th September 2020,
https://comum.rcaap.pt/bitstream/10400.26/30018/1/Proposta_Implementa%c3%a7%c3
%a3o_Portal_Corporativo_Ana_Aeroportos_XXII_Jornadas_Luso_Espanholas.pdf
Sulaiman, A., Naqshbandi, M. M., & Dezdar, S. (2015). Impact of adoption of Green IT
practices on organizational performance. Retrieved: 26th September 2020,
https://www.researchgate.net/publication/280949290_Impact_of_adoption_of_Green_I
T_practices_on_organizational_performance


9
A NEW APPROACH IN QUANTIFYING USER EXPERIENCE IN WEB-
ORIENTED APPLICATIONS
Vasilije Vasilijević1
Nenad Kojić2
Natalija Vugdelija3
DOI: https://doi.org/10.31410/ITEMA.2020.9
Abstract: The primary goal of every developer is to develop the highest quality web
application. The quality of the application is not only a subjective assessment of the developer,
but objective and representative criteria for measuring performance must be defined. Google
provides a model called Web Vitals with a subset of core Web Vitals that are important for
quantifying user experience on the web. Some of the metrics are LCP (Largest Contentful
Paint, refers to loading), FID (First Input Delay, refers to interactivity) and CLS (Cumulative
Layout Shift, refers to visual stability). This paper will present modern technologies and tools
for measuring the performance of websites and analyze them on a real example of a web
application. The analysis will include the use and measurement of the most important
parameters: Lighthouse, PageSpeed Insights, Chrome DevTools, Search Console, web.dev's
measure tool, the Web Vitals Chrome extension and Chrome UX Report API.
Keywords: Web sites, Measuring, Performance, Web vitals.
INTRODUCTION
ntensive development of the IT industry is a consequence of a large number of consumers
of IT services. Such a drastic growth of IT services is primarily based on the improvement
of network infrastructure, lower prices of hardware and Internet services. The large number
of users who use an increasing number of services has led to the need to improve the entire
network infrastructure and enable quality and fast transmission of signals and services
(Velinov, 2020). This infrastructure is changing the way the Internet is used and now
companies are primarily using websites as a way to present their services and products, and
users to find them. A new concept of digital marketing is being created (Star, 2019) that suits
new consumers and new ways of doing business. A large number of websites leads to the need
for users to opt for some of the offered ones. The user's decision is based on their user
experience and the experience that the site leaves them.
The information found on websites should be easily searchable, clear and accessible on
different types of devices (Rosenfeld, 2015). Thus, the quality of content search has become
extremely important (Drutsa, 2019) because it finds the user what he wants to get in return.
The quality of the search is affected by the quality of the website and a large number of
1 Academy of Technical and Art Applied Studies Belgrade - Department School of Applied Studies for
Information and Communication Technologies, Zdravka Celara 16, Serbia 2 Academy of Technical and Art Applied Studies Belgrade - Department School of Applied Studies for
Information and Communication Technologies, Zdravka Celara 16, Serbia 3 Academy of Technical and Art Applied Studies Belgrade - Department School of Applied Studies for
Information and Communication Technologies, Zdravka Celara 16, Serbia
I
10
ITEMA 2020
Conference Proceedings
techniques and activities are needed for the website to be SEO optimized, and thus have a better
position in web search engines (Patil, 2020). In addition to the technical parameters that
indicate the quality of the website, one of the key roles is the impression of the user after his
arrival on the site. The quality of the user experience is key to the long-term success of any
website. The quality of the user experience is based on performance that can be classified and
analyzed in a number of ways. A large number of authors have contributed to the development
of various tools and techniques for measuring user experience (Castaneda, 2007) and this
process is constantly evolving.
For this reason, Google has created a model for providing development guidelines to
developers in the process of designing and building web applications, which are extremely
important for providing an adequate user experience on the web. This model is called Web
Vitals (www.web.dev/vitals). The indicators defined in this way are an empirical measure of
the actual user experience that Google analyzes and which are based on the key needs of users:
page loading speed, application interactivity, stability, content experience, etc.
In this paper, a set of specific factors called Core Web Vitals will be presented, which represent
a general picture of the experience of web pages from the user's perspective, as well as
techniques and tools for measuring them. The selected factors will be explained and
implemented in a real web application in order to indicate the way in which it is possible to
achieve optimal performance of a website.
The work is organized through four chapters: After the Introduction, a selected set of Core Web
Vitals factors will be presented. The chapter results will show the quality of their
implementation on a real website and at the end will give a conclusion and further guidelines
in the work.
CORE VEB VITALS
As already mentioned, Core Web Vitals are a subset of Web Vitals that are used to measure
specific aspects of the user experience when visiting a website. These parameters can be
measured and displayed in a large number of Google tools. In this paper, some of them that the
authors consider the most important and which in their practice give the most important results
of the user experience will be performed.
LCP (Largest Contentful Paint)) is the largest content color related to reading (loading) and
measurement time when the most effective content of the page is probably displayed. The
satisfaction of the range in which the largest page contents should be displayed is from 0 to 2.5
seconds from the first start of loading the pages.
FID (First Input Delay) represents time needed for web page to respond to user action. It
means, when page is loading, and user tries to communicate with page through some action
(e.g. button click), browser starts to count time needed to handle user request, and that time is
called FID. If possible, that time should be less than 100 milliseconds.
CLS (Cumulative Layout Shift) is a cumulative layout shift that represents quantity of shift
related to elements in a viewport of a web page. If we want, the user not to experience a bad
experience in terms of content stability, the CLS should be less than 0.1.

11
A NEW APPROACH IN QUANTIFYING USER EXPERIENCE IN WEB-ORIENTED APPLICATIONS
L (Lighthouse) is a tool built in Chrome DevTools that serves for detection of problems that
web developers are facing when it’s about Core Web Vitals, Progressive Web Apps, Best
Practices, Accessibility and Search Engine Optimization in development environment. It
provides possibility to generate report based on these categories to get a deeper explanation of
every problem, with tips on how to improve every metric. Report can be generated for both
mobile and desktop results. In order for the measurements to be credible, it is necessary to open
the Lighthouse in Incognito mode.
LCI (Lighthouse CI) allows measurements on pull requests before merge and deployment are
done.
SC (Search Console) is a platform that provides traffic data from Google and helps developers
to detect pages on their website that needs to be improved, based on that data. When SC
generates report for every page, then PSI (Page Speed Insights) can be used to show
opportunities to improve poor performance pages.
PSI (PageSpeed Insights) tool allows developers to enter page URL in order to get results of
Core Web Vitals metrics. It is based on real traffic data and perspective of users that are visiting
page, and also on lab data because Lighthouse is incorporated in generating report, so report
looks similarly, with opportunities for optimization and steps that were passed through
generating report. Performance result is expressed in percentiles. Best performance result is
between 90-100 percentiles. PSI is good when there is a need to share results of metrics with
someone, and also when only performance results are needed.
CUXR (Chrome UX report uses Core Web Vitals data of real users on your or competitors’
website. So, main purpose is to help developers to realize how users are experiencing pages by
tracking metrics of loading, interactivity and stability. That tracking is called RUM (Real User
Monitoring). Developers enter URL and get raw API results from previous 28 days. If they
have a pretty basic knowledge of SQL, they can query that results based on different parameters
on Google BigQuery database. Difference between CUXR and PSI and Lighthouse is that
CUXR does not provide list of issues that you can fix. With CUXR, if there is a need for data
visualization, using CUXR Dashboard it’s very easy to represent results visually with charts.
Dashboard is provided by Data Studio and it connects result data on BigQuery, eliminating
needs to create charts manually.
CDT (Chrome DevTools) are tools that mostly every developer uses in development process.
In Performance panel, now layout shift can be identified in an Experience section. By selecting
Layout Shift there are further information about shifts detected, and if there is a need to see
which element caused shift, get mouse over “Moved from” and “Moved to” fields. Also, on
the bottom of the Performance panel, there is an information about TBT (Total Blocking Time)
which is related to FID.
WDMT (web.dev Measure Tool) is also a tool that uses Lighthouse to generate report about
Core Web Vitals. The procedure is the same, provide URL of your page, and get metrics and
tips that tell you about fixing issues.
WVCE (Web Vitals Chrome Extension) is available in Chrome Web store. It can be added
to Chrome and used for measuring vitals on website including LCP, FID and CLS. When it’s
installed, user need to navigate to URL that wants to measure, and after that, badge icon

12
ITEMA 2020
Conference Proceedings
provided by extension will update to red or green, depending on metric result. Clicking the
icon, user can see further details about every metric.
WVJSL (Web Vitals JavaScript Library) is a way of measuring Web Vitals using JavaScript
API. Library is imported into project with three functions for getting LCP, FID and CLS. To
that functions, developer can pass custom function to send results to database or to do whatever
he wants. This way of measuring matches with all above mentioned tools.
I0 (Image Optimization) The main problem with poor performance is always related to the
images that are used and which are the most difficult type of resource. Image optimization
started by reducing the weight of the images. JPEG 2000 progressive and WebP format are
used for that. With them, incredible savings in image weight is achieved. You should be careful
with the WebP format because it is not supported in all browsers, so use the JPEG format just
in case. Images that are important for uploading are uploaded to the CDN. It is recommended
that all images be on the CDN as well but in this example the other images are hosted locally.
Depending on the device, media queries for images of different sizes are used. Lazy loading
images technique is used to defer images outside the viewport. Using lazy sizes, the off-screen
image storage is accomplished. It is also possible to defer images loaded via CSS using lazy
sizes bgset.
FM (File minification) CSS and JS were minified. Gulp is used to minify these files. It is also
possible to do this via online tools or WebPack using e.g. css-mini-extract-plugin for css
minification. Unused CSS is removed using the purgecss tool. It is necessary to give the path
to the desired CSS file as a parameter, and the output is cleared CSS from parts that are not
used. The important thing is if you use Bootstrap to clean the file from classes that you do not
use. Unused JS and CSS can be found in Google Chrome DevTools, the Sources tab in the
Coverage tab. You can start recording and interact with the whole page, and finally see which
parts of the code are not used, and delete those parts.
GC (Gzip compression) Compression was performed on the server. In addition to gzip, you
can also use Brotli.
TPR (Third-party resources) For the resources, attributes rel = "preconnect", rel = "preload"
or rel = "dns-prefetch" are added.
RBR (Resources that block rendering) CSS resources that block rendering are removed.
CRP (Critical render path) A critical render path needs to be done. Critical CSS is detected
using a tool called PentHouse. It is best to put critical CSS in the style tag in the head section,
to get improved FCP improved.
C (Caching) Asset caching has been done, which does not change often on the server.
DSBR (Delay scripts that block rendering)
Resources that block rendering can be deferred as needed to avoid blocking the main thread.
It is also necessary to add async if we want the script to be downloaded asynchronously.

13
A NEW APPROACH IN QUANTIFYING USER EXPERIENCE IN WEB-ORIENTED APPLICATIONS
RESULTS`
Use case 1 - Example of measuring performances in Lighthouse. When we want to use
Lighthouse, we should go to webpage that we want to test, in Incognito mode, and with Right
Click go to Inspect Elements. Now, we should navigate to the Lighthouse Tab in DevTools
menu on the top.
Figure 1. Measuring performances in Lighthouse
When we got to the Lighthouse, we can choose categories that we want to measure. For our
case, we will select Performance category, then click to Generate Report. After that, we are
getting results of measuring as it is displayed on the Figure 1.
Use case 2 - Search Console is used to identify pages that need to be more optimized for users.
Also, we can see much more information about our website, e.g. performance, mobile usability,
sitemaps, coverage, removals... This is shown on Figure 2.
Figure 2. Measuring performances in Search Console

14
ITEMA 2020
Conference Proceedings
Search Console Core Web Vitals section use CUXR to get data about user experience on our
page.
Use case 3 – Another example of performance measuring is with PageSpeed Insights. Unlike
Lighthouse, here we have real data based on our user experiences. Only thing that we have to
do is to provide URL of your webpage and to type it in input field. Then click Analyze and see
metrics that Google collects from our users, with opportunities how to more optimize our
performance and information about passed audits as shown in Figure 3.
Figure 3. Measuring performances with Page Speed Insights
Use case 4 – If we want to measure Web Vitals on Google web.dev site we can simply go to
their website web.dev/measure and type URL that we want to inspect. Displayed result on
Figure 4 are similar to Lighthouse and PageSpeedInsights.
Figure 4. Measuring performances with web.dev site

15
A NEW APPROACH IN QUANTIFYING USER EXPERIENCE IN WEB-ORIENTED APPLICATIONS
Use case 5 – This is example of Chrome DevTools Performance Panel where we can detect
Layout Shift and Total Blocking Time on our page, Figure 5.
Figure 5. Measuring performances od Layout Shift and Total blocking Time
If we go to DevTools, then go to Performance Tab we should click Record. After that, refresh
our page and stop recording. We will see Layout Shift if exist and in Summary tab we can get
more information about shift Location. Total Blocking Time is displayed in footer of
Performance Tab.
All these examples show a part of the possibility of advanced application of measuring the user
experience of web applications, and in addition to the above, many others can improve the
quality of the final evaluation of the website.
CONCLUSION
This paper presents a set of factors that are an integral part of Core Web Vitals. These factors
represent an empirical indicator of user experience when evaluating websites and are available
in a number of Google tools. As there are a large number of factors that affect the overall user
experience, this paper singles out only some that the authors considered to be the most
important and given explanations, methods of use and results of their application in a test
example of the website.
In general, the results that can be measured are primarily the quality of work of web developers
who participated in the creation of the website. These indicators are highly correlated with the
attention that developers analyze in the user experience. A large number of applications do not
have enviable results and these tools can contribute a lot to paying more attention to these
parameters when they can be easily measured and analyzed.
Further work will be focused on the implementation of additional factors and improving the
user experience of web applications.
16
ITEMA 2020
Conference Proceedings
REFERENCES
Castaneda J. A. & Muñoz-Leiva F.& Luque T. (2007). Web Acceptance Model (WAM):
Moderating effects of user experience, Journal of Information & Management Vol. 44,
Is. 4, (pp. 384-396), Elsevier.
Drutsa, A., Gusev, G., Kharitonov, E., Kulemyakin, D., Serdyukov, P., & Yashkov, I. (2019,
July). Effective Online Evaluation for Web Search. In Proceedings of the 42nd
International ACM SIGIR Conference on Research and Development in Information
Retrieval (pp. 1399-1400).
Karthikeyan, R., Michael, G., & Kumaravel, A. (2017). A HOUSING SELECTION METHOD
FOR DESIGN, IMPLEMENTATION & EVALUATION FOR WEB BASED
RECOMMENDED SYSTEMS. International Journal of Pure and Applied Mathematics,
116(8), 23-28.
Patil, S. A. (2020). Comparative SEO Techniques Analysis on core WebPages and its
Effectiveness in Context of Google Search Engine, International Journal of Scientific
Development and Research, Vol 5, Is.3 (pp. 420-428)
Rosenfeld, L. & Morville, P. & Arango, J. (2015). Information Architecture: For the Web and
Beyond, O'Reilly Media.
Star, D. (2019). Digital Marketing 2020: Grow Your Business with Digital Marketing, Kindle
Edition
Velinov, V. (2020). MODERN NETWORK ARCHITECTURES NETWORK AND SYSTEM
PROTECTION, Kindle Edition
www.web.dev

17
COMPARATIVE ANALYSIS OF WEB APPLICATION
PERFORMANCE IN CASE OF USING REST VERSUS GRAPHQL
Milena Vesić1
Nenad Kojić2
DOI: https://doi.org/10.31410/ITEMA.2020.17
Abstract: Web applications are the most common type of application in modern society since
they can be accessed by a large number of users at any time from any device. The only condition
for their use is an Internet connection. Most applications run using the HTTP protocol and
client-server architecture. This architecture is based on the use of API (Application
programming interface), most often REST architecture (Representational State Transfer). If
there are several different functionalities on the website that fill their content with data from
the web server, for most of them a special HTTP request must be generated with one of the
existing methods (GET, POST, PUT, DELETE). This way of communication can be a big
problem if the connection to the Internet is weak, there are a lot of HTTP requests because you
have to wait for each request to be executed and for the web server to return the data.
In this paper, one implementation of GraphQL is presented. GraphQL is an open-source data
query and manipulation language for APIs. GraphQL enables faster application development
and has less server code. The key advantage is the number of HTTP requests because all the
desired data of the page is obtained with one request. This paper will show a comparative
analysis on the example of a real website in the case of using the REST architecture and
GraphQL in the case of different qualities of Internet connections, code complexity and the
number of required requests.
.
Keywords: Web page, GraphQL, REST, Performance.
INTRODUCTION
eb applications are popular solutions today, because they can be accessed at any time,
from anywhere, from computers or mobile devices, and they can be accessed as well
as Internet pages using a Web browser (Kalmanek, 2010.). Web applications work on
the principle of client-server communication. The client communicates with the server using
the HTTP protocol (Fielding, 1998.), and in most cases using REST (Neumann, 2018.) for
Uniform Resource Identifier (URI). The evolution of Web applications and programming
languages has led to the evolution of communication between client and server (Kalmanek,
2010.). Certainly, the API enables this communication, but not necessarily using the REST
architectural style (Neumann, 2018.). The paper will describe GraphQL (Freeman, 2019.) as a
query language for APIs that allows clients to request what they need and nothing more than
that data. GraphQL is not tied to a specific database or storage mechanism, but supports
existing code and data.
1 Academy of Technical and Art Applied Studies Belgrade (ATUSS) - Department School of Applied
Studies for Information and Communication Technologies Belgrade, Zdravka Celara 16, Serbia 2 Academy of Technical and Art Applied Studies Belgrade (ATUSS) - Department School of Applied
Studies for Information and Communication Technologies Belgrade, Zdravka Celara 16, Serbia
W

18
ITEMA 2020
Conference Proceedings
Web applications can be implemented in one of two basic ways: server-side rendering and
client server architecture. This is independent of which programming language is used, which
technology or code writing architecture. Recently, the client-server architecture is becoming
increasingly popular, which is further supported by the great popularity of front-end
frameworks for programming client-side programming languages.
HTTP request/response (Fielding, 1998.) plays a key role in such communication. The user
experience is based on the design of the application, the content and the speed of the
application. The speed of the application is mostly based on the number of HTTP requests and
the amount of content that is exchanged through them. For this reason, from the point of view
of the speed of application and user experience (Neumann, 2018.), the number of HTTP
requests needs to be minimized as much as possible. On the other hand, SEO techniques and
web application quality assessment by the web search engine also expect a reduced number of
HTTP requests.
The required reduction leads to the need to either change the way the code is written and the
individual HTTP requests to the group. This is possible to some extent because the logic by
which the related data is conditionally retrieved requires sequentiality in the work.
Therefore, reducing the number of HTTP requests is only possible (Neumann, 2018.). The
possible solution is therefore not sought in technologies for reducing requests, but in changing
the way of organization and data structure that is returned from the server side to the client part
of the web application. GraphQL is therefore one of the candidates that can change this
(Freeman, 2019.).
The possibilities of GraphQL will be analyzed in this paper using comparative analysis in
relation to the classic REST way of communication of the client part of the web application
with the server (Brito, 2020.). This will be observed in relation to different Internet speeds, the
volume of data in the database in terms of the number of records in the tables and the number
of generated HTTP requests and the time required to implement these requests on the client
part of the application.
This paper is organized through four chapters: After the Introduction where the basic ideas and
goals are given, the second chapter gives the key features of GraphQL that are basic for its
implementation and represent some of the key features that provide developers the ability to
implement them better than classical REST form of communication. The third chapter
describes the methodology of the observed empirical results, which compares the use of
GraphQL and the classical REST form of communication with the server in different operating
conditions. Finally, a conclusion and further guidance in the investigation.
GRAPHQL
GraphQL is a query language for APIs (Application programming interfaces) and "server
runtime" for executing these queries with existing data (Freeman, 2019.).
The way applications are created has been evaluated in the last twenty years, the biggest change
being perhaps the "single page" applications running in the Browser, unlike the earlier multi-
page applications running on the server. And for client-server communication, the REST
(REpresentational State Transfer) architectural style is still mostly used. REST uses the HTTP
(HyperText Transfer Protocol) transmission protocol and the Uniform Resource Locator

19
COMPARATIVE ANALYSIS OF WEB APPLICATION PERFORMANCE IN CASE OF USING REST
VERSUS GRAPHQL
(URL) addressing mechanism. It communicates with resources using HTTP methods (GET,
POST, PUT, DELETE) to send, retrieve, delete and update.
Using the REST architectural style to display data in different blocks of a single page
application, it would be necessary to send multiple HTTP requests (Brito, 2020.). The
following image shows an example of how many requests would be forwarded to the server to
display all the data on the Gmail homepage. Each block (marked in green) would be populated
with data that would be obtained as a single response for each HTTP request.
This way of communication can be a problem if the connection to the Internet is bad, because
you have to wait for each request to be executed and for the server to return the data. The
difference between REST architectural style and GraphQL is precisely in the number of
requests (Brito, 2020.), GraphQL would get all this data by sending one request.
Another advantage is that GraphQL only retrieves the required data. It enables faster
application development, has less server code because GraphQL is a layer between the client
and the server that does not allow "bad" requests to reach the server side.
GraphQL is not tied to any specific database (Brito, 2019.), it doesn't even have to work with
a database.
The GraphQL service is created by defining the types and fields of those types, as well as
creating functions for each field and each type (https://graphql.org/learn/). When the GraphQL
service starts, it can receive queries that it validates and executes. The received query is first
checked to ensure that it refers only to defined types and fields, and then a function is run to
get the result.
In addition to these feature keys, GraphQL has several very important features that give it a
very significant competitive advantage, some of which are (Freeman, 2019.):
GraphQL addresses the server looking for the values of the explicitly specified object
fields. Unlike SQL where asterisk (*) can be used to select all columns of a table,
GraphQL does not have this option, but only those fields whose values are needed are
listed.
The way they communicate (client-server) is not explicitly specified. The SSH, FTP,
Web Socket, or HTTP method can be used as the most common mode for the transport
mechanism.
Each query can have an operation type (query or mutation) and an operation name. If
they are not specified, then the type of operation will be query, which means that data
is required from the server. Operation names are optional, but make the code more
readable and easier to debug.
The server response always corresponds to the request format which is a characteristic
of GraphQL. The values required do not have to be simple data types (scalar data types
- String, Integer, Float, Boolean or ID), but the value can be an object or a string
(complex data types).
When sending a query, arguments can also be passed. For example, if there is a need to
display data for a specific person, then the ID of that person by whom his record is
unique can also be forwarded by query.
GraphQL allows you to send a set of arguments when sending a query, that is, each
field nested inside the object can have its own arguments.

20
ITEMA 2020
Conference Proceedings
In a system such as REST, only one set of arguments can be passed - query parameters
and the URL segment in the request. In GraphQL, each field and nested object can get
its own set of arguments, making GraphQL a complete replacement for creating
multiple data retrieval APIs. Arguments can even be passed to scalar fields to
implement data transformations once on the server, instead of on each client separately.
Because the result fields match the field name in the query, but do not include
arguments, the same field with different arguments cannot be requested directly. That's
why aliases are needed - they allow you to rename a field result to anything.
Fragments are reusable units, that is, a list of fields of a certain type. When there is a
need to search for the same group of data in a query, then fragments are created. If
fragments were not used in the query, there would be code repetitions. The snippet
concept is often used to break complex application data requirements into smaller parts,
especially when many UI components have to be combined with different fragments
into one initial data set.
Union is a complex data type. It is used in situations where the server is expected to
return results of different types for the search term. It can be compared to if else flow
control. It is most often used in searches.
Working with arguments and their values in most web applications means that these
values are dynamic, not "hardcoded".
It would not be good to pass dynamic arguments directly to a query array, because then
the client-side code would have to dynamically manipulate the query array during
execution and serialize it into a GraphQL-specific format. Instead, GraphQL has a first-
class way to factory-process dynamic values and pass them as a separate dictionary to
variables.
Directives: Directives allow us to dynamically change the structure and form of queries using
variables. The directive can be added to a field or fragment and can affect the execution of the
query in any way the server wants. The core GraphQL specification includes exactly two
directives that must be supported by any GraphQL server implementation that complies with
the specifications:
@include (if: Boolean) The field is included in the result only if the argument is true.
@skip (if: Boolean) The field is skipped if the argument is true.
Directives can be useful for getting out of situations where otherwise string manipulation would
have to be done to add and remove fields in the query. Server implementations can also add
experimental features by defining completely new directives.
Mutations: One important thing is addressed to mutations. Mutations are a type of operation
that is used when it is necessary to change the data on the server, or when writing, modifying
or deleting data.
The difference between queries and mutations is that the functions called by the query are
executed in parallel, while the fields called in the mutation are called one after the other.
Although changes to the server can be made by sending a query, it is better to use mutations
because it is by convention.
Errors: Using REST architectural style the result of the request is either 100% success or 100%
failure. In GraphQL, queries are executed partially, that is, part of the queries will be executed
successfully regardless of the need for a field that cannot receive a response from the server.
In the answer, in addition to the requested data, the property of errors for the requested field

21
COMPARATIVE ANALYSIS OF WEB APPLICATION PERFORMANCE IN CASE OF USING REST
VERSUS GRAPHQL
whose data cannot be returned is also obtained. The reason for this is that REST uses multiple
requests, while GraphQL uses one.
Checking whether the request was successfully executed using the REST architectural style
was done by checking the status code, and if the code would start with the number 2, then the
request was successfully implemented. Using GraphQL the status code will start with the
number 2, but it may happen that part of the query is not successfully implemented. Errors are
processed by checking to see if there is an error property in the response.
This type of error occurs when the search box server is disabled. If the field name is changed
to start with a capital letter P, the answer will be different because something that does not exist
is required.
Scheme: GraphQL services can be written in any language. Because it cannot rely on a specific
programming language syntax, such as JavaScript, GraphQL uses a schema language. The
language of the GraphQL schema is similar to the query language. If the types that will be used
in the application are not known, by setting a query for the __schema field, which is always
available in the basic query type, a list of defined types is obtained.
Some of important things are also addressed to the queries. We can view each field in the
GraphQL query as a function or method of the previous type that returns the next type. In fact,
GraphQL does just that. Each field on each type has a function called a resolver provided by
the GraphQL server programmer. When the field is executed, the corresponding resolver is
called to produce the next value. At the top level of each GraphQL server is a type that
represents all possible entry points in the GraphQL API, often called the Root or Query type.
As each field is resolved, the resulting value is placed in the key / value folder with the field
name (or alias) as the key, and the resolved value as the value. This continues from the bottom
query field all the way to the original query root type field.
Resolve: "Resolve" functions are like small routers. They determine how the types and fields
in the schema are connected on the server side. GraphQL "resolve" functions can contain
arbitrary code, which means that the GraphQL server can communicate with any type of server
code, even with another GraphQL server. For example, the Person type can be stored in an
SQL database, while the City type can be stored in MongoDB, or it can even be serviced by a
micro service.
Perhaps the biggest feature of GraphQL is that it hides all server complexity from the client.
No matter how many server pages the application uses, all the client will see is one GraphQL
endpoint with a simple self-documenting API for the application.
RESULTS
An example of two web-oriented applications is shown to show the difference when using
REST architectural style and GraphQL.
Both data storage applications use the PostgreSQL version 11.4 database. The graphical
interface pgAdmin version 4.24 was used for data manipulation.
A web application that uses GraphQL as a query language, i.e. a way of communicating
between the client and server side, uses the Node.js version 10.15.3 executable as support for

22
ITEMA 2020
Conference Proceedings
the server part of the code, while GraphiQL, the reference implementation of GraphQL IDE,
is used to test servers and queries.
REST architectural style is applied in a web application that uses AJAX requests for client-
server communication, i.e. requests are created in the client part of the application in JavaScript
programming language, while PHP is used as the server programming language.
Both applications should display all the data from the database on the application's home page,
with different client-server communication technologies having a different number of requests
to the server.
Using GraphQL, no matter how many records there are in the database, the number of requests
will always be one, while using the REST architectural style, the number of requests differs
depending on how many records there are within the tables. This happens because one
collection of data, which was received in response to an HTTP request, i.e. its element has its
own data collection for which it is necessary to send a new HTTP request to the server.
Results of comparison of REST and GraphQL in the execution speed of requests at different
flow rates in examples with 10 and 100 records per table in the database. In the example with
10 records per table, using REST architectural style the number of requests is 12, while in the
example with 100 records, the number of requests is 102. Using GraphQL in both examples
the number of requests is 1.
Table 1. Execution time of requests for different flow rates with 10 records per table
Flow rate REST GraphQL
36.59 Mbps 802ms 174ms
10 Mbps 988ms 139ms
128 Kbps 1.61s 907ms
Table 2. Execution time of requests for different flow rates with 100 records per table
Flow rate REST GraphQL
36.59 Mbps 6.48s 122ms
10 Mbps 6.63s 210ms
128 Kbps 11.25s 7.93s
Figure 1. Execution speed of requests at different
flow rates with 10 records per table in the database
Figure 2. Execution speed of requests at different
flow rates with 100 records per table in the database
Results of comparison of REST and GraphQL in the execution speed of requests at different
flow rates in examples with 500 and 1000 records per table in the database. In the example
with 500 records per table, using REST architectural style the number of requests is 502, while

23
COMPARATIVE ANALYSIS OF WEB APPLICATION PERFORMANCE IN CASE OF USING REST
VERSUS GRAPHQL
in the example with 1000 records, the number of requests is 1002. Using GraphQL in both
examples the number of requests is 1.
Figure 3. Execution speed of requests at different
flow rates with 500 records per table in the database
Figure 4. Execution speed of requests at different
flow rates with 1000 records per table in the database
Table 3. Execution time of requests for different flow rates with 500 records per table
Flow rate REST GraphQL
36.59 Mbps 33.98s 211ms
10 Mbps 35.32s 777ms
128 Kbps 55.96s 42.66s
Table 4. Execution time of requests for different flow rates with 1000 records per table
Flow rate REST GraphQL
36.59 Mbps 1.1min 352ms
10 Mbps 1.2min 1.37s
128 Kbps 1.8min 1.4min
CONCLUSION
This paper presents the possibilities of GraphQL and the possibilities of reducing the number
of HTTP requests if it is used and compared with REST technology. The real conditions of
different faster Internet connections, different number of records in the database and all this
from the angle of the total time required to show the user the desired content in the website are
analyzed. It has been shown that the use of GraphQL achieves a large reduction in the total
time and number of HTTP requests, which is very important for the user experience and the
quality of the web application. Further work will focus on analysis with a larger number of
tables and records in the database and implementation with different front-end frameworks.
REFERENCES
Brito, G., & Valente, M. T. (2020, March). REST vs GraphQL: A Controlled Experiment. In
2020 IEEE International Conference on Software Architecture (ICSA) (pp. 81-91). IEEE.
Brito, G., Mombach, T., & Valente, M. T. (2019, February). Migrating to GraphQL: A practical
assessment. In 2019 IEEE 26th International Conference on Software Analysis,
Evolution and Reengineering (SANER) (pp. 140-150). IEEE.
Fielding, R., & Gettys, J. (1998). Hypertext Transfer Protocol-HTTP/1.1.
Freeman, A. (2019). Understanding GraphQL. In Pro React 16 (pp. 679-705). Apress,
Berkeley, CA.
Introduction to GraphQL, https://graphql.org/learn/

24
ITEMA 2020
Conference Proceedings
Kalmanek, C. R., Misra, S., & Yang, Y. R. (Eds.). (2010). Guide to reliable Internet services
and applications. Springer Science & Business Media.
Porcello, E., & Banks, A. (2018). Learning GraphQL: declarative data fetching for modern
web apps. " O'Reilly Media, Inc.".
Neumann, A., Laranjeiro, N., & Bernardino, J. (2018). An analysis of public REST web service
APIs. IEEE Transactions on Services Computing.
Sud, K. (2020). Understanding REST APIs. In Practical hapi (pp. 1-11). Apress, Berkeley, CA.

25
USE OF “OWASP TOP 10” IN WEB APPLICATION SECURITY
Nikola Nedeljković1
Natalija Vugdelija2
Nenad Kojić3
DOI: https://doi.org/10.31410/ITEMA.2020.25
Abstract: Web application security vulnerabilities can lead to various attacks on users, some
of which can have major consequences. It is important to point out the weaknesses that allow
abuse, because often increased risk awareness is the first step in protecting web applications.
Some of the most critical security risks that organizations face today have been analyzed and
uncovered using OWASP Top 10. This paper presents concrete examples of attacks and abuse
of web applications. Through the implementation and analysis of attacks on web applications,
weaknesses that need to be eliminated in order to protect against potential new attacks are
identified. Especially, suggestions to help protect web applications from each type of attack
listed and described are provided.
Keywords: Web security, Web attack, Weaknesses of the web application.
INTRODUCTION
owadays, with many jobs being done online to prevent the spread of Covid-19 virus
infection, the importance of web application security has increased even further.
Normally, a successful business requires some kind of interaction – with other users
or with back-end databases, which could be susceptible to attacks. As stated by Alzahrani,
Alqazzaz, Zhu, Fu and Almashfi (2017) “threats may compromise web applications‘ security
by breaching an enormous amount of information, which could lead to severe economic losses
or cause damages” (p. 237). In addition to reliable transmission systems and secure
communication, another matter of great importance is application-level web security, which,
according to Scott, Sharp (2002) “refers to vulnerabilities inherent in the code of a web-
application itself (irrespective of the technologies in which it is implemented or the security of
the web-server / back-end database on which it is built)” (p. 396). The communication chain
that connects end users is as secure as its weakest link. Therefore, it is important to identify
any vulnerabilities that may lead to abuse during a multimedia session and to provide secure
and reliable communication with appropriate security services and mechanisms. Connecting to
a global, public network requires a global approach to using web applications safely, as is noted
by Andrian, Fauzi (2019) "application security must be applied to all infrastructure that
supports web applications, including the web application itself." (p. 68). The greater the
number of significant transactions performed over the Internet, the more motivated hackers are
to carry out an attack. According to Rafique, Humayun, Gul, Abbas, Javed (2015) “hackers in
recent years are increasingly targeting web applications, since most networks are closely
1 Enreach Labs, Omladinskih brigada 90 V, Belgrade, Serbia 2 Academy of Technical and Art Applied Studies Belgrade (ATUSS) – Department ICT College for
vocational studies, Zdravka Čelara 16, Belgrade, Serbia 3 Academy of Technical and Art Applied Studies Belgrade (ATUSS) – Department ICT College for
vocational studies, Zdravka Čelara 16, Belgrade, Serbia
N

26
ITEMA 2020
Conference Proceedings
monitored through Intrusion Detection Systems (IDS) and firewalls” (p. 29). Web application
developers have a very difficult task to create a quality web application that will be protected
from malicious attacks, especially if we keep in mind that an army of hackers is working to
detect the weaknesses of web applications and that they are very motivated because it often
allows them significant financial gain. This is also indicated by Shahriar (2018) “Despite the
awareness of web application developers about safe programming practices, there are still
many aspects in web applications that can be exploited by an attacker” (p. 1). Additional
problem is that there are many inexperienced developers who are not aware of the potential
consequences of security vulnerabilities in a web application.
USING OWASP TOP 10
The Open Web Application Security Project (OWASP) is a nonprofit community of software
developers, engineers, and freelancers that provides resources and tools for web application
security. Every few years, OWASP publishes a report of the top 10 security risks to web
applications. The top 10 risks were first published in 2003 and since then the report has been
constantly updated and published every 3-4 years. Current version is from 2017. and can be
seen on the OWASP site. Many standards, books and tools list OWASP Top 10 as one of the
best resources in the field of web application security, which also notify Rafique, Humayun,
Gul, Abbas, Javed (2015) “OWASP Top 10 is aimed at analyzing the security of a system by
identifying the vulnerabilities of web applications.” (p. 37).
Information technologies are evolving very fast and we are all witnessing constant changes.
The development of web applications is also very intensive and one might think that the list of
the biggest risks is changing in the same way, but that is not the case. Most of the problems in
the “OWASP Top Ten 2017” are the same, or very similar, as in the first list. The web has
advanced significantly, but the security of web applications has lagged far behind that progress.
As security risks recur, in order to better understand the security of web applications, certain
attack methods are explained in detail.
Listed are some of the OWASP Top Ten (2017) web application security risks
1. A1-Injection: Most web applications use basic systems or functions such as database
or e-mail functionality. An application often uses user input to execute a command. If
the application does not calculate the user input correctly, malicious code can be
inserted, which would lead to the execution of unauthorized commands.
2. A2-Broken Authentication: In many cases, web applications contain functionality for
user authentication and session management. These functions could be incorrectly
implemented which allows attackers to access confidential information. In web
applications, ‘logged in’ users are often identified using a session. The application sees
if the user is logged in using that session, but it also sees malicious code.
3. A3-Sensitive Data Exposure: Leaks of confidential information can have major
consequences. An example when not enough security measures are taken is sending a
login form containing the username and password to the server via http. Some of the
confidential information, in addition to the codes, are credit card details, email
addresses and private data.
4. A8-Insecure Deserialization: The vulnerability applies to applications that use user-
defined input as a serialized object without input validation. It can lead to remote code
execution or to perform attack, including replay attacks, injection attacks, and privilege
escalation attacks.

27
USE OF “OWASP TOP 10” IN WEB APPLICATION SECURITY
5. A9-Using Components with Known Vulnerabilities: Using CMS such as WordPress,
Joomla! and Drupal often contain vulnerabilities that are known to the general public.
Today, there are automatic scanners that use databases to scan a special platform.
6. A10-Insufficient Logging & Monitoring: Detecting an attack on a website is only
possible if there is enough logging and monitoring of the system. Recording should be
by levels of communication with the network, operating system and application.
EXAMPLES OF POSSIBLE ATTACKS
According to the law, one cannot attack without the permission of the owner, and certain
sanctions follow for such an act. Unfortunately, the legal system and supporting institutions
are often unable to monitor the development of cybercrime successfully enough, so the
perpetrators in many cases remain undetected or unpunished. This makes space for attacks by
people who do not plan to commit a crime for personal gain but for various motives, who
sometimes try to find and attack vulnerable systems and applications just for fun and cause
great damage. Attackers intensively explore areas of vulnerability and attacks are increasingly
targeted at web applications. Ethical hackers use their knowledge and skills to analyze and
increase security. In order to better protect the system from future attacks, ethical hackers must
think like real attackers and act like malicious users. Although ethical hackers may abuse their
knowledge at some point, it is easy to distinguish ethical from malicious hackers; according to
Engebretson (2010) „differences can be boiled down to three key points: authorization,
motivation, and intent” (p. 3).
The following are examples of possible attacks that could seriously compromise the
confidentiality, integrity, and availability of data and devices:
1. Example of an attack using social engineering and Cross-site scripting:
Step 1: The attacker sends a special URL to his victim, the text of the message sent
by the attacker can be for example: "Can you tell me exactly what THIS means",
where THIS is a link to the attacker's website.
Step 2: The victim clicks to open the given URL.
Step 3: JavaScript sends a cookie to the attacker's web server.
Step 4: The attacker saved the cookie to a text file.
Step 5: The victim returns to the original site unaware that she has just given a
session cookie to the attacker.
Step 6: The attacker can log in to the site via a session cookie
2. Example of an attack using SQL injection: An attacker searches an application to find
fields for user input. He checks whether this input is used for an SQL query, trying to
provoke an error message by, for example, adding single quotes, which corrupts the
SQL query. If an error occurs, the attacker knows it is vulnerable to SQL injection.
Some of the attempts to obtain useful information are:
a. 1' union select user(), database() – a
b. 1' union select table_schema, table_name from
information_schema.tables where table_schema = '******' -- a
3. Example of an attack bypassing login and security barriers:
a. Sometimes it is enough for the attacker to, browsing a web application and
navigating through the pages, discover access to one of the pages on which
users normally need to be logged in to abuse it.
b. Also, if by browsing through the cookies the attacker finds a cookie of type
login = false, which in many cases is a way for the application to differentiate

28
ITEMA 2020
Conference Proceedings
between logged in and unregistered users, it is enough for the attacker to
change the cookie value to login = true, or in some cases login = (username )
to access the application as a logged in user.
4. Example of an attack using insecurities in a CMS: A large number of CMS-s being used
have a similar appearance and are very recognizable. Also, the name of the CMS used
is written somewhere in the page. By viewing the application code, it is possible to
determine exactly which one it is, if it is not directly indicated. An attacker can use
some of the well-known CMS scanners – wpscan (Wordpress) and joomscan (Joomla)
to find vulnerabilities in the version used by the user. This vulnerability can later be
exploited to attack the system.
METHODS OF DEFENSE
It is important to point out the weaknesses that allow abuse, because often increased risk
awareness is the first step in safeguarding web applications. According to Parimi and Babu
(2020) “Companies will be responsible for the personal data in future” (p. 924).
There are published lists of activities, like the one on the OWASP site, that can prevent attacks
or at least reduce the possibility of abuse. According to Rafique, Humayun, Gul, Abbas, Javed
(2015) “OWASP is major source to construct and validate web security processes and
standards” (p. 28). The following section lists some of the ways to defend against malicious
attacks that are not too demanding for users and that have proven to be very useful in securing
web applications.
1. A1-Injection
a. Use verified server validations of user entries.
b. Use output characters for all dynamic arrays.
c. Use LIMIT and other SQL control commands to reduce the number of results
obtained, thus making the outflow of information as small as possible in case of
a security breach.
2. A2-Broken Authentication
a. Implement multifactor authentication.
b. Do not place an application with basic credentials.
c. Make sure that weak passwords are not being used.
d. Align passwords with standards for creating passwords.
e. Use the same error messages for all errors.
f. Limit the number of incorrect password attempts.
a. Use the server to generate a session ID
3. A3-Sensitive Data Exposure
a. Classify data and arrange them by sensitivity, and store and dispose of those
with the highest sensitivity carefully.
b. Do not store sensitive data locally with the user.
c. Encrypt all sensitive data.
d. Use the latest strong encryption algorithms.
e. Encrypt all data in transit, not only sensitive data.
f. Disable caching for response that contain sensitive data.
g. Verify independently the effectiveness of the server and system configuration.
4. A8-Insecure Deserialization
a. Implement integrity checks such as digital signature.
b. Enforcing strict type constraints during deserialization before object creation.

29
USE OF “OWASP TOP 10” IN WEB APPLICATION SECURITY
c. Isolate code that deserializes.
d. Log deserialization exceptions and failures.
5. A9-Using Components with Known Vulnerabilities
a. Remove unused library and file.
b. Continuously inventory the versions of both client-side and server-side
components and their dependencies using tools.
c. Only obtain components from official sources over secure links.
d. Monitor for libraries and components that are unmaintained or do not create
security patches for older versions.
6. A10-Insufficient Logging & Monitoring
a. Ensure all login, access control failures, and server-side input validation failures
can be logged with sufficient user context to identify suspicious or malicious
accounts.
b. Ensure that logs are generated in a format that can be easily consumed by a
centralized log management solution.
c. Ensure transactions have an audit trail with integrity controls.
d. Establish effective monitoring and alerting such that suspicious activities are
detected.
e. Establish or adopt an incident response and recovery plan.
FUTURE RESEARCH DIRECTIONS
Web applications are being more and more used, so there is a growing awareness of the
importance of their security. More users will begin to see the need for a good security policy.
A comprehensive analysis of potential risks is important for a good security mechanism. It
would be useful to analyze other different types of attacks, such as brute force attacks or attacks
using an insecure file upload. In future research, the impact of attacks on the rest of the risks
from the OWASP Top Ten list should be paid attention to, as well as which of them are easier
and which are more difficult to abuse.
CONCLUSION
Through carrying out and analyzing attacks on web applications, it can be noticed that some
weaknesses are easier to abuse than others, as well as that attacks can be more or less harmful
to the application and its users, which is why it is necessary to develop an appropriate security
policy. Using Components with Known Vulnerabilities is a flaw that can be exploited relatively
easily, and depending on the type of weakness detected, the damage can be either minor or
major. Some of the vulnerabilities that an attacker can most easily take advantage of our
injection and corrupt authentication. By finding an opening for injection, an attacker can easily
add some of the well-known codes, after which he would easily attack the application server
itself. In contrast, the most difficult flaw for an attacker to abuse is insecure deserialization. It
is often difficult to detect and exploit such a flaw, but it is the most harmful to the application
and can have major consequences. Also, injection, corrupt authentication and detection of
sensitive data are security vulnerabilities that lead to the greatest damage to a web application.
These can lead to system crashes, the attacker getting admin rights, sensitive data, such as credit
card data and personal data, being released to the public, and the like. The flaw from the list
which causes the least damage per attack is insufficient monitoring, but with this flaw the future
defense of the system is much more difficult, as is the elimination of the current attack.

30
ITEMA 2020
Conference Proceedings
REFERENCES
Alzahrani, A., Alqazzaz, A., Zhu, Y., Fu, H. and Almashfi, N. (2017). Web Application
Security Tools Analysis, IEEE 3rd international conference on big data security on cloud
(bigdatasecurity), IEEE international conference on high performance and smart
computing (hpsc), and IEEE international conference on intelligent data and security
(ids), Beijing, 2017, (pp. 237-242), doi: 10.1109/BigDataSecurity.2017.47.
Andrian, R., Fauzi, A. (2019). Security Scanner for Web Applications Case Study: Learning
Management System JOIN (Jurnal Online Informatika) Volume 4 No. 2 | December
2019., 63-68
Engebretson, P. (2010) The basics of hacking and penetration testing: ethical hacking and
penetration testing made easy, Elsevier, USA: Syngress
OWASP. (n.d.). Top 10-2017 Top 10. Available at: OWASP:
https://www.owasp.org/index.php/Top_10-2017_Top_10
Parimi, M., R., Babu, S. (2020) Critical Analysis of Software Vulnerabilities through Data
Analytics, Proceedings of the International Conference on Industrial Engineering and
Operations Management Dubai, UAE, March 10-12, 2020, (pp. 923-934)
Rafique, S., Humayun, M., Gul, Z., Abbas, A. and Javed, H. (2015) Systematic Review of Web
Application Security Vulnerabilities Detection Methods. Journal of Computer and
Communications, 3, 28-40. doi: 10.4236/jcc.2015.39004.
Scott, D., Sharp, R. (2002) Abstracting application-level web security WWW '02: Proceedings
of the 11th international conference on World Wide Web May 2002 (pp. 396–407)
https://doi.org/10.1145/511446.511498
Shahriar, H. (2018) Web Security Vulnerabilities: Challenges and Solutions A Tutorial
Proposal for ACM SAC 2018,” (pp. 1–5),

31
A FRAME OF REFERENCE FOR RESEARCH OF A BLOCKCHAIN-
BASED SOLUTION TO CORPORATE GRC-MANAGEMENT
Le Chen1
DOI: https://doi.org/10.31410/ITEMA.2020.31
Abstract: This society has faced many sorts of global challenges, especially the world of
business and technological innovation, there's no greater aroused general argument nowadays
than digital transformation (DT). Among production-oriented Corporates which many of them
have begun to integrate digital technology into most areas of their business. How to well fulfill
Corporate Governance, Risk and Compliance (GRC) while expanding existing businesses in
the dramatic growth in DT environment has become a major challenge for all Corporates.
Through a review of previous studying works and based on existing gaps the author evaluated
whether there could be the feasibility of a blockchain-based technology being integrated as a
solution to Corporate GRC-Management together with the theory of entire personnel's GRC
responsibility system which would be parts of an agenda for the future research on this field
and also contribute to Corporates in an overall strategic height level to embrace the coming
of DT.
Keywords: Digital transformation, Corporate GRC-management, Software, Blockchain.
INTRODUCTION
urrently, many Corporates desire to fully promote DT from top to bottom to develop a
new business model to meet global changing and market requirements, however even
now the existence of the assortment of GRC software products, how much actual value
do they have for Corporate GRC-Management?
PricewaterhouseCoopers mentioned firstly the term “GRC” in 2004, then its diffusion was
confirmed in the report which they stated, “The acronym “GRC” (governance, risk and
compliance) has rapidly penetrated the business community over the last years. ” (Racz et al.,
2010, p. 106). Herein in our paper we referred to the integrated approaches for Corporate GRC-
Management and develop our work thanks to the study contributed by Racz and his research
team, according to them (2010), “The final definition is as follows: ‘ GRC is an integrated,
holistic approach to organization-wide governance, risk and compliance ensuring that an
organization acts ethically correct and in accordance with its risk appetite, internal policies and
external regulations through the alignment of strategy, processes, technology and people,
thereby improving efficiency and effectiveness. ’ ” (p. 112-113). This work was carried out in
order to propose an innovative solution that supports Corporates fulfill the GRC-Management
so as to maximize the safety of organizational operations with an integrated real-time concept
through implement GRC in every process in all the internal organization to ensure all
operations be carried out ethically, correctly, efficiently and effectively.
1 University for Foreigners "Dante Alighieri" of Reggio Calabria, Via del Torrione 95, Reggio Calabria,
Italy
C

32
ITEMA 2020
Conference Proceedings
1. Objectives and research questions
Although the studies of Nicolas Racz, Edgar Weippl, Andreas Seufert focused on analyzing
“comparison with existing GRC software”, but they still stated that, “The products' technology
architectures mainly differ in their degree of integration, which is a key topic in future
developments. Due to the lack of congruence, industry perspectives and existing state-of-the-
art GRC software should only very cautiously be applied in research.” (Racz, N., Weippl, E.,
& Seufert, A. (2011, January, pp. 1-10). This also confirmed that there is still no empirical
research and hypotheses related to perspectives of application of the blockchain technology
into Corporate GRC-Management. To fill this gap, specifically, we should take into account
the following questions:
What is blockchain technology actually good for?
Why could blockchain technology be a solution for Corporate GRC-Management?
How could a blockchain-based solution for Corporate GRC-Management well work?
2. Methodology
Three steps involved in conducting this study include Literature Review, Evaluation and
Construction. The method we use in the study is qualitative, that is “Deductive Argumentation-
Negative Requirements”. First of all, let us set up a proposition: If the hypothesis “A is
positive” holds, such that it makes the B come into existence. Similarly, if we let the hypothesis
“A is negative” holds, hence it does not to make the existence of B. Namely,
𝐼𝑓 𝐴+, 𝑡ℎ𝑒𝑛 𝐵; 𝑖𝑓 𝐴−, 𝑡ℎ𝑒𝑛 𝑛𝑜𝑡 𝐵 (1)
In detail, the premise assumption is that if the existing GRC software is perfect (if A+), then
Corporates will no longer face any GRC-Management problems (then B). Based on this,
similarly, we use the substitution method with negative hypothesis what means that we can
substitute the negative hypothesis into the question. If no conclusion can be obtained, this
negative hypothesis assumed must be necessary; if the conclusion can still be drawn, this
negative hypothesis supposed is not necessary. That is to say, if we can prove the existing GRC
software used by Corporates is not perfect (that is if A-), then for Corporates there are still
GRC-Management problems to face (then not B). Therefore, we need to seek a better solution.
3. What is blockchain technology actually good for?
What is blockchain? Primavera De Filippi in his research stated, “A blockchain is a
decentralized ledger (or state machine) that relies on cryptographic algorithms and economic
incentives in order to ensure the integrity and legitimacy of every transaction (or state change).
A copy of the blockchain is shared amongst all nodes connected to the network…” (Primavera
De Filippi, 2016, p. 6). Nowadays, blockchain technology application exploration has extended
to various fields after the application of pioneer Bitcoin:
In the Internet of Things and Logistics field: This field is considered to be a promising
application direction of blockchain (DHL Trend Research and Accenture, 2008).
In the financial field: Such as Visa B2B Connect (Ye Chun Qing, 2016), Citibank’s
testing cryptocurrency dubbed “CitiCoin" (Biggs, J., 2015) has brought a revolutionary
change.

33
A FRAME OF REFERENCE FOR RESEARCH OF A BLOCKCHAIN-BASED SOLUTION TO
CORPORATE GRC-MANAGEMENT
In the insurance market: A typical application case is LenderBot2, a registered and
customized micro-insurance product launched in 2016 by blockchain technology startup
Stratumn, Deloitte and next-generation insurance platform LemonWay.
In the Public services field (Akins et al., 2013): Blockchain is closely related to people's
production and life in the fields of public management, energy, transportation, etc.
4. Why could blockchain technology be a solution for Corporate GRC-Management?
If blockchain technology has played an important role in promoting these fields, then we have
reason to believe that it would also probably be significantly influential in the existing GRC
software. Here we will verify the proposition of A- in the Expression (1) (see Section 2), that
is, the imperfection of existing GRC software.
a. First of all, in practice, Corporates usually mix these three terms for using still without clear
boundaries. Since there is still no “Authoritative Definition” by a World class Authority as
OECD, there still exist different arguments about it among the scientific community on GRC,
so, the basis of conceptual theory is inconsistent, brings more difficulty to subsequent
development of GRC software. While the first peer-reviewed academic paper on the topic was
published in 2007 by OCEG3 founder Scott L.Mitchell in the International Journal of
Disclosure and Governance. This groundbreaking paper influenced an entire industry of
software and services. According to Nicolas Racz, Edgar Weippl and Andreas Seufert (2010),
“However to this day the concept behind the acronym has neither been adequately researched,
nor is there a common understanding among professionals.” (p. 106). And let us see, in the
light of the extensive literature and available on the current scenario of GRC studied by
Nicolas Racz, Edgar Weippl and Andreas Seufert (2010), “One in three of the analyzed
publications offers a GRC definition (21%). Two thirds of these definitions explain what is
understood by GRC as an integrated concept (67%). The remaining third disregards that the
total might be more than the sum of its parts and confines itself to defining the three terms of
governance, risk management and compliance separately. (12%)” (p. 110).
b. Secondly, even under the premise of acknowledging the concept of integrated GRC, there
are still problems in terms of development technology perspective. Because no releases of both
an official concept and statistics on existing GRC software as indications by authoritative
Organization (e.g. OECD). According to our preliminary statistics on the Internet, there exist
no less than one hundred kinds various types of GRC software on the market, and each product
is also very different, hence this requires a mainstream GRC software product with distinctive
features to assist Corporates to fulfill GRC-Management.
c. Finally, GRC software has inherent defects as software that cannot be perfect. They stated,
“46% of the organizations in our survey have deployed GRC software that covers multiple
governance, risk and compliance aspects. Only 29% state that all GRC activities are
consolidated in a single software platform, however.” (Racz, N., Panitz, J., Amberg, M.,
Weippl, E., & Seufert, A., 2010, p. 4). Even GRC software has been used into many
organizations, we also worry about the difference from each other and their defects which are
2 LenderBot is a proof-of-concept micro-insurance platform that uses the bitcoin blockchain for insuring all
sorts of things. 3 Founded in 2002, OCEG is headquartered in Phoenix, AZ. It's a non-profit think tank that is dedicated to
achieving a world where every organization and every person strives to achieve objectives, address
uncertainty and act with integrity. This approach to business, and to life, is what they call Principled
Performance.

34
ITEMA 2020
Conference Proceedings
the inherent components of software products. According to Humphrey4 (1999), “One of the
things that really bothers me is the common software practice of referring to software defects
by the term “bugs.” In my view, they should be called “defects.” ” (p. 1). Anyhow, according
to all the above discussion we have proved that the premise assumption is negative what is that
if the existing GRC software is not perfect (that is if A-), consequently Corporates should still
take into account the GRC-Management problems (then not B).
5. How could a blockchain-based solution for Corporate GRC-Management well
work?
a. We precisely based on its characteristics that are Decentralization, Persistency, Anonymity
and Auditability to proceed our study (Zheng, Z. et al., 2018, p. 357):
i. Decentralization. In conventional centralized transaction systems, the central trusted
agency (e.g., the central bank) validated each transaction which generates the cost and
the performance bottlenecks at the central servers (Zheng, Z. et al., 2018, p. 357). This
is one of the highlights of our proposing to apply blockchain technology to solve GRC-
Management which is particularly important in Corporate GRC-Management. It needs to
be deployed and promoted by the highest decision-maker of the Corporate to make it a
consensus for the development of the Corporate. Corporate GRC-Management which
have been given the crucial functions into processes of every department within an
organization is a shared responsibility of the entire Corporate, not simply performed only
by the GRC-Management Department itself but all departments of the Corporate (will be
elaborated further in following Point b).
ii. Persistency. “Since each of the transactions spreading across the network needs to be
confirmed and recorded in blocks distributed in the whole network, it is nearly impossible
to tamper. Additionally, each broadcasted block would be validated by other nodes and
transactions would be checked. So any falsification could be detected easily.” Stated by
them (Zheng, Z. et al., 2018, p. 357). The case of Enron scandal became a typical case of
Corporate Governance Failure. In the study of Borgia was stated “It is important because
good or bad results are very much dependent on the way governance systems operate. It
is topical because recent scandals have proved that today’s ostensibly ‘state-of-the-art ’
mode of governance is indeed inadequate. ” (Borgia, F., 2005, p. 6).
iii. Anonymity. With a generated address each user can interact with the blockchain
network. Further, many addresses could be generated by user in order to avoid expose
the identity...So a certain amount of privacy on the transactions included in the blockchain
is preserved thanks to this mechanism (Zheng, Z. et al., 2018, p. 357). Moreover,
according to Racz, N., Panitz, J., Amberg, M., Weippl, E., & Seufert, A. (2010),
“Number, complexity and importance of GRC requirements steadily increase, resulting
in companies undertaking various efforts to better face risks and to ensure the adherence
to laws, regulatory standards and voluntarily imposed obligations (Menzies2006).” (p. 1),
wherefore the security technology as digital signatures, identity authentication could be
used for department supervision by its personnel (as Orphan blocks) so that the Corporate
privacy could be well protected.
iv. Auditability. Since on the blockchain each of the transactions is validated and a
timestamp is given. So the previous records through accessing any node in the distributed
network can be easily verified and traced by users. The traceability and the transparency
of the data stored in the blockchain is highly improved (Zheng, Z. et al., 2018, p. 357). It
4 Watts S. Humphrey (July 4, 1927 – October 28, 2010) was an American pioneer in software engineering,
who was called the "father of software quality."

35
A FRAME OF REFERENCE FOR RESEARCH OF A BLOCKCHAIN-BASED SOLUTION TO
CORPORATE GRC-MANAGEMENT
establishes an open and healthy operating environment in which all departments work
together in the method of sustainable development and transparency so as to optimize
business benefits to the greatest extent.
b. In addition, herein we will elaborate a theory on how to further optimize Corporate GRC-
Management. In 2018, a research report released by Accenture showed that despite the industry
differences, in the digital transformation, leading companies in each industry stand out. Among
them, the production-oriented enterprises in the automotive and parts and consumer electronics
industries have the highest proportion of "digital transformation leaders”. In the rapidly
changing digital market environment, how to improve Corporate GRC-Management for
existing businesses has become a great challenge.
i. As one component of GRC, the main risks confronted by Corporates, as we all know, can
be divided into two categories: external risks and internal risks. External risks mainly
include Political risks, Legal risks, Social and Cultural risks, Technological risks, Natural
environmental risks, Market risks, Industrial risks, etc. Internal risks mainly include:
Strategic risks, Management risks, Operational risks, technical risk, Financial risks, etc.
To facilitate the following elaboration, here we will collectively call the various risks
faced by the enterprise the Corporate Total Risk (abbreviated as “CTR"). Concerning
production-oriented Corporates, generally, the organisational structure is mainly
composed of Decision-making Organisation (Board), Procurement, Supply, Production,
Logistics, Warehouse, Sales, Marketing, IT, Media, Accounting&Finance,
Administration, HR, Auditing, Law, R & D, GRC and others with different functions. If
the risk is distributed to various departments of an organisation, then let us see an example
of Corporate's organisational structure shown on the right of Fig.1 below. Since we
believe that the consistency of the structure between the blockchain and the Corporates
is precisely same, and the comparison is as shown on Fig.1. As blocks are storage units
one by one, which records all communication information of each block node within a
certain period, just as both the communication and the cooperation between various
departments of the Corporate.
Figure 1. Blockchain and Risk of organizational structure of production-oriented Corporate

36
ITEMA 2020
Conference Proceedings
ii. Furthermore, we consider single department of a Corporate as every single chain. More
vividly as shown on the left of above Fig.1 the Genesis block (the topmost one) to the
current block is as Board of Corporates, the Main chain (start from 1 block below the
topmost block, plus other 6 blocks running through the whole chain) is as the Heads of
departments, and Orphan blocks (1 block branched on the left, and two pairs branched
from the main chain located on its both outsides of the main chain) are as other Personnel.
That is, if the probability of defects in one block or several blocks of Main chain is more
higher, the security of the entire blockchain will be greatly reduced; just like a Corporate
as shown on the above Fig.1, if the probability of the unfulfilled GRC (which is Corporate
Total Risk (abbreviated as “CTR") in one or more departments is higher, then the higher
the probability of unfulfilling Corporate Total GRC (abbreviated as “CTGRC”).
Therefore, we believe that the core task for Corporate GRC-Management also the future
research direction is to maximize the GRC of each department of the Corporate through
blockchain technology. So to discover the form of the relationship between CTGRC and
GRC of single department of the Corporate we can write it as:
𝐶𝑇𝐺𝑅𝐶 = ∑ 𝐺𝑅𝐶𝑖 = 𝐺𝑅𝐶1 + 𝐺𝑅𝐶2 + 𝐺𝑅𝐶3 + … …𝑛𝑖=𝑚 + 𝐺𝑅𝐶𝑛 (2)
Where i indicates the number of departments of the Corporate and m ≥ 1, and CTGRC is a
constant5. Generally, if the relationship between two variables x and y can be expressed in the
form of y = k / x (k is a constant, k ≠ 0), then y is called the inverse proportional function of x.
And as there exists the negative correlation between GTGRC and CTR, assume they are two
variables and substitute them respectively into Y and X, then the relationship of them can be
expressed in the form as:
𝐶𝑇𝐺𝑅𝐶 = 𝑘/𝐶𝑇𝑅 (3)
Where k is a constant, k ≠ 0, and CTR is a constant6. Consequently, we obtain the relationship
between CTR and CTGRC which can be written as:
lim𝑖=∞
(𝐶𝑇𝐺𝑅𝐶) = lim𝑖=∞
(𝑘
𝐶𝑇𝑅) = 𝑘 ∗ lim
𝑖→∞(
1
𝐶𝑇𝑅) = 0 ≈ 𝑀𝑖𝑛[𝐶𝑇𝑅] = 𝑀𝑎𝑥[𝐶𝑇𝐺𝑅𝐶] (4)
Obviously, substitute the Expression (3) into the Expression (4), when i the number of
departments of the Corporate gets closer to infinity, namely, the responsibility of Corporate
GRC is distributed into every department till each operation, then CTGRC gets closer to
infinity, thus, the limit of the reciprocal of CTGRC converges to zero, then realize the
minimization of CTR, namely, the maximization of CTGRC is fulfilled.
6. Results
Through a series of arguments above (Sections 3 to 5), we have demonstrated that the existing
GRC software is not perfect, so Corporates still need to solve the GRC-Management problems.
Therefore, Corporates should also take GRC-Management strategies into account to adapt to
the new digital reality with new technologies to optimize Corporate GRC-management.
According to the Expressions (2) and (4) we should consider the fact that is only by combining
5 CTGRC can be quantified by KPI and other performance evaluation indicators, so here we can regard it as
a constant in a certain sense. 6 CTR can be quantified by the Risk Quantification model and other methods to measure risk, so here we
can regard it as a constant in a certain sense.

37
A FRAME OF REFERENCE FOR RESEARCH OF A BLOCKCHAIN-BASED SOLUTION TO
CORPORATE GRC-MANAGEMENT
every department’s GRC from every dimensions the Corporate should be able to in the true
sense realize Corporate GRC-Management through an all-round cooperation. We stated a
possible solution for existing GRC-Management based on both blockchain technical
characteristics and the theory of entire personnel's GRC responsibility system.
FUTURE RESEARCH DIRECTIONS
There are still many practical aspects to continue to study:
• Subject to current laws. The supporting of laws and regulations, standards, supervision
and management system should be strengthened, and especially we need to unify the
understanding of integrated Corporate GRC-Management concept.
• At the technical level. Although it has the characteristics of greatly improving security, the
application of Corporate GRC-Management still has the problem of embedding various
processes in the GRC software to be solved, especially we need the prudence in the process
of test. We also need to take into account in consideration of Whether these new
technologies could own other potential technical advantages.
CONCLUSION
Overall, we hope that this study work to promote the official release of an integrated GRC
definition from the authority level (e.g.OECD) as it has a magnificent meaning on the
development of Corporate GRC-Management GRC; and to further elaborate our proposed
framework in order to develop a solution based on blockchain technology and the theory of
entire personnel's GRC responsibility system, especially when DT has emerged as one of the
most important considerations in Corporate's Strategy-Making.
ACKNOWLEDGEMENT
The author is grateful to Prof. Mavilia Roberto and Prof. Loprevite Salvatore, for their valuable
guidance.
REFERENCES
Akins, B. W., Chapman, J. L., & Gordon, J. M. (2014). A whole new world: Income tax
considerations of the Bitcoin economy. Pitt. Tax Rev., 12, 25.
https://doi.org/10.5195/taxreview.2014.32
Biggs, J. (2015). Citibank Is Working On Its Own Digital Currency, Citicoin. archive (consulté
le 20 novembre 2015).
Borgia, F. (2005). Corporate governance & transparency role of disclosure: how prevent new
financial scandals and crimes. American University Transnational Crime and Corruption
Center School of International Service.
De Filippi, P. (2016). The interplay between decentralization and privacy: the case of
blockchain technologies. Journal of Peer Production, Issue, (7).
Humphrey, W. S. (1999). Bugs or Defects?. CMU SEI, 1.
Mitchell, S. L. (2007). GRC360: A framework to help organisations drive principled
performance. International Journal of Disclosure and Governance, 4(4), 279-
296.https://doi.org/10.1057/palgrave.jdg.2050066

38
ITEMA 2020
Conference Proceedings
Racz, N., Panitz, J., Amberg, M., Weippl, E., & Seufert, A. (2010). Governance, risk &
compliance (GRC) status quo and software use: results from a survey among large
enterprises.
Racz, N., Weippl, E., & Seufert, A. (2011). Governance, risk & compliance (GRC) software-
an exploratory study of software vendor and market research perspectives. In 2011 44th
Hawaii International Conference on System Sciences (pp. 1-10).
IEEE.https://doi.org/10.1109/HICSS.2011.215
Zheng, Z., Xie, S., Dai, H. N., Chen, X., & Wang, H. (2018). Blockchain challenges and
opportunities: A survey. International Journal of Web and Grid Services, 14(4), 352-
375.https://doi.org/10.1504/IJWGS.2018.095647

39
GRAPH DATABASE MANAGEMENT SYSTEMS AND GRAPH
THEORY
Kornelije Rabuzin1
Sonja Ristić2
Robert Kudelić3
DOI: https://doi.org/10.31410/ITEMA.2020.39
Abstract: In recent years, graph databases have become far more important. They have been
proven to be an excellent choice for storing and managing large amounts of interconnected
data. Since graph databases (GDB) rely on a graph data model based on graph theory, this
study examines whether currently available graph database management systems support the
principles of graph theory, and, if so, to what extent. We also show how these systems differ in
terms of implementation and languages, and we also discuss which graph database
management systems are used today and why.
Keywords: Neo4j, MS SQL server, Oracle, Cypher.
INTRODUCTION
he importance of relational databases has been evident for many years. Transactional
systems, CRM systems, ERP systems, and so on rely on relational databases. Last year,
we witnessed the 50th year of relational databases. With a solid mathematical
foundation and a background in set theory and logic, relational databases are not estimated to
vanish, although some authors like to think so. However, in recent years, we have seen large
amounts of data arriving from different sources. There are many V’s describing the nature of
data, and the term “Big Data” has been introduced and used extensively. The first V that one
should consider is data volume. Although relational databases can store large amounts of data,
PetaBytes (PB) or ExaBytes (EB) can cause problems for relational databases. It takes time to
write and read the data from the database. The second V stands for variety since data are
heterogeneous in nature. The third V denotes velocity, which means that data are being
produced quickly, and they have to be processed rapidly. Sometimes there is not enough time
to store the data and then later process the data; the data have to be processed immediately.
In order to deal with Big Data and its challenges, two solutions have been identified: NoSQL
databases (including document-oriented, column-oriented, key value and graph databases) or
distributed file systems, like the Hadoop framework. Graph databases belong to NoSQL
databases, and they rely on a graph data model. In graph databases, data can be stored within
the nodes and can have relationships that do connect the nodes. Many examples can be found
and modelled using graph databases (computer networks, social network analysis, traffic, etc.).
In this study, we present the different types of graphs that are known in graph theory, and we
show how these graphs can be implemented in Neo4j. Then we show how MS SQL Server and
1 University of Zagreb, Faculty of organization and informatics, Pavlinska 2, Varaždin, Croatia 2 University of Novi Sad, Faculty of technical sciences, Trg D. Obradovića 6, Novi Sad, Serbia 3 University of Zagreb, Faculty of organization and informatics, Pavlinska 2, Varaždin, Croatia
T

40
ITEMA 2020
Conference Proceedings
Oracle deal with the graph data model. Furthermore, we also discuss some major trends in
GDBMS’s global market.
The rest of this study is organized as follows: first we say a few words about graph databases,
graph database management systems, and graphs in general. Then we show different types of
implementations, including Neo4j, MS SQL Server, and Oracle. Then we discuss some open
issues and the potential for future research directions. We also demonstrate a few
improvements that we implemented in Neo4j. In the end, the conclusion is presented.
THE GRAPH DATABASE MANAGEMENT SYSTEMS (GDBMS) PERSPECTIVE
As far as we know in graph databases, we use the terms nodes and relationships (edges or loops
in graph theory) that connect the nodes. The number of nodes and relationships can be vast.
Since nodes are directly connected through their relationships, graph databases are extremely
suitable for problem domains that contain large amounts of interconnected data. In order to
create and use graph databases, we have to use a specific graph database management system.
There are many purely graph database management systems available, including OrientDB,
Neo4j, ArangoDB, etc. In this study, we use Neo4j since it is the most popular, and therefore,
has had the widest impact, with support for many functional characteristics. However, the
importance of having purely graph database management systems (GDBMS) has decreased
over time. If we looked at the page https://db-engines.com/en/ranking, a few years ago, Neo4j
was on a few occasions placed in the top 10 of systems. However, now it is ranked below that
at 22nd place, and other graph database management systems are ranked even lower. Arango
and OrientDB are at 59th and 71st place, respectively.
Table 1. Top 10 database systems (https://db-engines.com/en/ranking)
System Primarily Other supported models
Oracle Relational Document Store, Graph DBMS, RDF store
MySQL Relational Document Store
MS SQL Server Relational Document Store, Graph DBMS
PostgreSQL Relational Document Store
MongoDB Document Search engine
IBM DB2 Relational Document Store, RDF store
Elasticsearch Search engine Document Store
Redis Key-value Document Store, Graph DBMS, Search engine,
Time series DBMS
SQLite Relational
Cassandra Wide column
One major change is that all major DBMSs have turned multi-model. In Table 1, we see that
many systems support the document model, and that three systems that are in the top 10 support
the graph data model: Oracle, MS SQL Server, and Redis. Indeed, the only purely relational
database management system in the top 10 is SQLite. It is lightweight and popular due to its
size and the possibilities it affords that are extremely useful for smart phones, for example.
Some other companies like Mozilla use SQLite for storing cache files, etc.
Since major DB vendors support the graph data model, it is important to keep in mind that in
SQL Server, one can use SQL statements and constraints that most users are familiar with, and
one can also use the graph database, as we demonstrate later on. Namely, in order to use Neo4j,
one needs to learn Cypher or Gremlin, and there are some challenges regarding how to move

41
GRAPH DATABASE MANAGEMENT SYSTEMS AND GRAPH THEORY
data to and from the graph database. So, this could be the reason why GDBMS are not that
popular anymore. There were some attempts to build a single language or interface that would
make it possible to use graph databases using already known query languages. For more
information, look at (He & Singh, 2008) and (Holzschuher & Peinl, 2013). Many studies have
been written to show how graph databases outperform relational databases, or to measure
which graph database management system is better, such as (Chen et al., 2020) etc. If you are
interested in graph databases in general, a good reference is (Robinson et al., 2013). A nice
review of relational and graph databases is (Gupta et al., 2020) and (Maleković et al., 2016).
NEO4J
A good book on graphs and graph theory is (Wilson, 1996) And the definitions that are
presented in the chapter below come from this book. We have also done some significant work
in the field of graph theory, for example (Kudelić, 2016).
Generally speaking, in other studies, people usually talk about nodes and edges. However, there
are other concepts presented in graph theory, and in this chapter, we show how they could be
implemented in GDBMS Neo4j. “A simple graph G is a structure that consists of a non-empty
finite set V(G) of elements called vertices, and a finite set E(G) of distinct unordered pairs of
distinct elements of V(G) called edges” (Wilson, 1996). In this study we assume that simple
graphs do not contain loops (i.e., an edge that joins a vertex to itself) and that there is at most
one edge that connects a given pair of vertices (Wilson, 1996). If we allowed loops and multiple
edges, then we would talk about graphs or multigraphs depending on the situation.
NULL GRAPH
A null graph’s edge set is an empty set. Because of the fact that edges are not present, we can
only see a vertex or more vertices that have no connections between them (Figure 1).
Figure 1. Null graph
We could have a graph database that contains nodes that have no relationships, but the
importance of graph databases lies in relationships that connect the nodes and that do at the
same time contain additional information. The following statement creates three “Person”
nodes in an empty database and we check the database content (Figure 2): CREATE (john:Person { firstname: "John", lastname: "Smith" }),
(mary:Person { firstname: "Mary", lastname: "Smith"}),
(jack:Person { firstname: "Jack", lastname: "Smith"})
MATCH (n:Person) RETURN n LIMIT 25
Figure 2. Creating nodes in Neo4j – null graph

42
ITEMA 2020
Conference Proceedings
We can see that null graphs can be implemented in Neo4j since we have three nodes that are
not connected (Figure 2), but such graphs provide little information. As we said earlier, the
connections between the nodes provide valuable information and this is where the strength of
graph databases lies.
COMPLETE GRAPH
In order to explain complete graphs, several definitions are important (Wilson, 1996): “We say
that two vertices v and w of a graph G are adjacent if there is an edge vw joining them, and the
vertices v and w are then incident with such an edge. Similarly, two distinct edges e and f are
adjacent if they have a vertex in common… A graph is connected if it cannot be expressed as
the union of two graphs, and disconnected otherwise.” In order to see whether complete graphs
can be implemented, we should first recall the notion of adjacency. We should also take note
that a complete graph has n(n-1)/2 edges. Basically, when an edge connects two vertices, they
are adjacent. In a simple complete, graph this has to be true for “each pair of distinct vertices”
(Wilson, 1996). Such graphs are denoted by Kn; K4 is presented in Figure 3.
Figure 3. K4
In the next example, we try to implement the complete graph in Neo4j. We would like to add
one new person and to make a few relationships between the nodes. MATCH (john:Person {firstname:"John"}), (mary:Person{firstname:"Mary"}),
(jack:Person {firstname:"Jack"})
CREATE (adam:Person { firstname: "Adam", lastname: "Smith"}),
(john)–[:KNOWS {since:2011}]->(mary), (john)–[:KNOWS {since:2012}]->(jack),
(john)–[:KNOWS {since:2014}]->(adam), (mary)–[:KNOWS {since:2012}]->(jack),
(mary)–[:KNOWS {since:2013}]->(adam), (jack)–[:KNOWS {since:2011}]->(adam)
When we look at the database state, we see that the nodes are connected and the relationships
are directed, i.e. they have arrows (Figure 4):
Figure 4. Complete graph
This leads us to the concept of directed graphs. Informally, directed graphs (digraphs) contain
vertices and arcs. However, it is not irrelevant which vertex comes first within an arc. In fact,
arrows are used to indicate the ordering of vertices in the arc. Therefore, we are dealing with
an ordered pair of vertices. This is supported in graph databases since the direction of a
relationship can be specified when the relationship is created.

43
GRAPH DATABASE MANAGEMENT SYSTEMS AND GRAPH THEORY
“The degree of a vertex v of G is the number of edges incident with v… A graph in which each
vertex has the same degree is a regular graph” (Wilson, 1996). We can see that “complete graph
Kn is regular of degree n-1” (Wilson, 1996). If we neglected the fact that relationships are
directed, the graph above would be regular as well.
CYCLE GRAPHS
“A connected graph that is regular of degree 2 is a cycle graph. We denote the cycle graph on
n vertices by Cn” (Wilson, 1996) (Figure 5).
Figure 5. Cycle graph Figure 6. Path graph
If we remove one edge, we get a path graph (Figure 6). Social network analysis shows that if a
and b are friends and b and c are friends, there exists a finite chance that a and c will be friends
in the future. In social network analysis, some path graphs that include several persons are most
likely to turn into connected graphs. Due to space limitations the example is omitted.
COMPLEMENT OF A SINGLE GRAPH
“If G is a simple graph with vertex set V(G), its complement Ḡ is the simple graph with vertex
set V(G) in which two vertices are adjacent if and only if they are not adjacent in G” (Wilson,
1996). What are the implications for graph databases? If we had one instance of a database, it
would be interesting to see which nodes are not connected. That way, we would be able to
know who does not have friends, we would be able to know who does not ship products to
certain countries, etc. The query below would simply find people, in the database created
above, that are NOT connected (observe NOT ((a)-[:KNOWS]-(b))): MATCH (a:Person), (b:Person)
WHERE a<>b AND NOT ((a)-[:KNOWS]-(b))
RETURN a, b;
GRAPH DATABASES IN MS SQL SERVER 2019
In the previous section, we used Neo4j to implement the concepts of graph theory. Here, we
use MS SQL Server 2019. In MS SQL Server 2019, users can create one graph per database.
A graph consists of an edge and node tables. According to https://docs.microsoft.com/en-
us/sql/relational-databases/graphs/sql-graph-architecture?view=sql-server-ver15: “A node
table is a collection of similar type of nodes. For example, a Person node table holds all the
Person nodes belonging to a graph. Similarly, an edge table is a collection of similar type of
edges. For example, a Friends edge table holds all the edges that connect a Person to another
Person. Since nodes and edges are stored in tables, most of the operations supported on regular
tables are supported on node or edge tables.”
Let us look at one example and let us create one small graph using MS SQL Server 2019. We
have several employees and we “manage” links that denote which employee is responsible for
a certain another employee. First, we create the employee node table using SQL (observe the

44
ITEMA 2020
Conference Proceedings
“AS NODE” at the end of the CREATE statement) and then we create the “manages” table
(observe “AS EDGE” at the end of the statement): CREATE TABLE Employee (ID INTEGER PRIMARY KEY, Name VARCHAR(100), DEPT
VARCHAR(100)) AS NODE;
CREATE TABLE manages (SINCE date) AS EDGE;
Now, let’s add a few employees: INSERT INTO Employee VALUES (1, 'John', 'IT')
INSERT INTO Employee VALUES (2, 'Mark', 'IT')
INSERT INTO Employee VALUES (3, 'Jack', 'Finances')
Now let’s specify one row for the “manages” table. Basically, we have to specify three values
including $from_id, $to_id, and SINCE (we use subqueries to return the node id value for
$from_id and $to_id columns): INSERT INTO manages VALUES ((SELECT $node_id FROM Employee WHERE ID = 3),
(SELECT $node_id FROM Employee WHERE ID = 1),'2020/01/01')
How do we find all of the employees who are managed by Jack? SELECT e2.Name
FROM Employee e1, manages, Employee e2
WHERE MATCH (e1-(manages)-> e2) AND e1.name = 'Jack'
Here, we see that the SELECT statement is used to retrieve rows from the table. The main
difference can be seen in the WHERE clause; the “MATCH (e1-(manages)-> e2)” part looks
more like Cypher, than SQL.
GRAPH DATABASES IN ORACLE
In this section, we give a brief overview of Oracle’s features and graph data model support.
According to https://blogs.oracle.com/oraclespatial/graph-database-and-analytics-for-
everyone, Oracle supports Property Graph database, PGX in-memory graph engine, PGQL
graph query language, 50+ Graph algorithms, Support for graph visualization, SPARQL graph
query language, Java APIs via open source Apache Jena, W3C standards support for semantic
data, ontologies and inferencing, and RDF Graph views of relational tables. Due to space
limitations we show one PGQL (property graph query language) example borrowed from
https://pgql-lang.org/: SELECT owner.name AS account_holder, SUM(t.amount) AS
total_transacted_with_Nikita
FROM MATCH (p:Person) -[:ownerOf]-> (account1:Account)
, MATCH (account1) -[t:transaction]- (account2)
, MATCH (account2:Account) <-[:ownerOf]- (owner:Person|Company)
WHERE p.name = 'Nikita'
GROUP BY owner
We see that the query looks like an SQL SELECT statement, almost like those found in SQL
Server. However, in the FROM clause, we specify the nodes and the edges as well as their
“connections.” WHERE and GROUP BY clauses look like traditional SQL clauses.

45
GRAPH DATABASE MANAGEMENT SYSTEMS AND GRAPH THEORY
DISCUSSION AND FUTURE RESEARCH
As is now obvious based on the discussion above, graph databases are interesting and
important, but they do have some issues that are specific and one has to be aware of. In our
previous research, we investigated some aspects of graph databases, like integrity constraint
implementations (Rabuzin et al., 2016a) and (Rabuzin et al., 2016b). We have also
implemented a visual interface (Gremlin By Example) that should make it easier for users to
pose queries against the graph database (Rabuzin, Maleković, & Šestak, 2016). This interface
is used to enable end users to pose queries against the Neo4j database in a manner similar to
the way Query By Example is used to pose queries visually against MS Access. At this time,
we are implementing a few other types of constraints given that many things that are supported
in relational databases are still not supported for graph databases. One could also extend the
research and include other GDBMSs and other query languages as well.
CONCLUSION
Graph databases are increasingly important. In this study, we had three goals: first we tried to
investigate the importance of some of the other concepts that exist in graph theory, beyond
those of edges and nodes. We tried to implement the presented concepts in Neo4j. Then we
also investigated the graph database management systems that are popular and we used them
to implement some examples. Finally, we also demonstrated how query languages look like in
three different database systems. For that purpose, we have presented different types of graphs,
including null graphs, directed graphs, cycle graphs, complete graphs, etc. We also investigated
how these concepts could be implemented in Neo4j and described the repercussions of doing
so. Then we showed how the graph data model is implemented in MS SQL Server 2019. The
good thing is that one can use existing SQL-like statements to implement the graph database,
but we do not have as many advanced features supported as are found in Neo4j. Oracle, on the
other hand, supports more features than MS SQL Server and has more algorithms, but uses
another query language (PGQL). Regarding the trends, we can see that existing purely graph
database management systems have lost their popularity and many relational DBMS systems
have turned multi-model. Finally, we can say that it will be interesting to see what the future
will bring us.
REFERENCES
Chen, J., Song, Q., Zhao, C., & Li, Z. (2020). Graph database and relational database
performance comparison on a transportation network doi:10.1007/978-981-15-6634-
9_37
Gupta, S., Pal, S., & Chakraborty, M. (2020). A study on various database models: Relational,
graph, and hybrid databases doi:10.1007/978-981-15-0361-0_11
He, H., & Singh, A. K., (2008). Graphs-at-a-time: query language and access methods for
graph databases. In Proceedings of the 2008 ACM SIGMOD international conference
on Management of data (pp. 405–418).
Holzschuher, F., & Peinl, R., (2013). Performance of graph query languages: comparison of
cypher, gremlin and native access in Neo4j. In Proceedings of the Joint EDBT/ICDT
2013 Workshops (pp. 195–204).
Kudelić, R., (2016). Monte-Carlo randomized algorithm for minimal feedback arc set problem.
Applied soft computing, 235 - 246. https://doi.org/10.1016/j.asoc.2015.12.018

46
ITEMA 2020
Conference Proceedings
Maleković, M., Rabuzin, K., & Šestak, M., (2016). Graph Databases-are they really so new.
International Journal of Advances in Science Engineering and Technology. 4 (2016).
Retrieved from http://bib.irb.hr/prikazi-rad?rad=843723
Rabuzin, K., Konecki, M., & Šestak, M., 2016a. Implementing CHECK Integrity Constraint in
Graph Databases. Proceedings of the 82nd IIER International Conference. Retrieved
from http://bib.irb.hr/prikazi-rad?rad=836861
Rabuzin, K., Maleković, M., & Šestak, M. (2016). Gremlin By Example. International
Conference on Advances in Big Data Analytics, 144–149.
Rabuzin, K., Šestak, M., & Konecki, M., 2016b. Implementing UNIQUE Integrity Constraint
in Graph Databases. Multi-Conference on Computing in the Global Information
Technology. Retrieved from http://bib.irb.hr/prikazi-rad?rad=844504
Robinson, I., Webber, J., & Eifrem, E., 2013. Graph Databases. Information Management.
https://doi.org/http://dx.doi.org/10.1016/B978-0-12-407192-6.00003-0
Wilson, J. R., 1996. Graph Theory. UK: Addison Wesley.

47
SMALL AND MEDIUM-SIZED ENTERPRISES IN TOURISM AND
THEIR IMPACT ON REGIONAL DEVELOPMENT
Katarína Kráľová1
Jana Sochuľáková2
Dagmar Petrušová3
DOI: https://doi.org/10.31410/ITEMA.2020.47
Abstract: A long-term problem of the Slovak economy is significant regional disparities
caused by insufficient use of existing local resources. Inefficient and unsystematic use of
existing resources at the local level causes a decrease in the competitiveness of these regions,
which is also reflected in the overall performance of the economy. In our article, after the
initial definition of basic terminology, we will focus on the evaluation of regional disparities
and the current development of regional differences in the conditions of the Slovak Republic.
We will evaluate the impact of SMEs on regional development in the Slovak Republic.
However, we will focus primarily on their positive benefits to reducing regional disparities in
the conditions of the Slovak Republic. We will pay particular attention to SMEs operating in
the field of tourism in individual regions, how they contribute or in the future can solve the
problem of reducing regional disparities.
Keywords: Regional disparities, Regional development, Small and medium enterprises,
Tourism.
INTRODUCTION
ignificant differences in the socio-economic level of regions, in their competitiveness,
the level of infrastructure is still a current problem in most countries of the European
Union, including Slovakia. Differences in the development of individual regions in
Slovakia have been evident since 1989. Disparities are generally understood as inequalities,
differences, heterogeneities or differences. In the case of regional development, we understand
disparity as different levels of social and economic development, which create inequalities
between the individual units being compared. Matlovič, R., Klamár, R, Matlovičová, K. (2008,
p.5) understand regional disparities as "differences in the degree of socio-economic
development of regions which are the result of its unevenness." Gajdoš, P. (2008, p.102) states
that "regional disparities are the product of the action of several factors, depending on the
quality and development availability of potentials, but also the different positions from which
individual regions entered the transformation process." Within the regional economy, there are
various institutions and partnerships. Their mission and activities create conditions leading to
the development of the region, the formation of its structure and the use of capacities. One of
the ways to improve the economic performance of regions is to support the development of
business activities and create a unique environment to unite companies of a similar nature.
1 Alexander Dubček University in Trenčín, Faculty of Social and Economic Relations, Študentská 3, 91150
Trenčín, Slovakia 2 Alexander Dubček University in Trenčín, Faculty of Social and Economic Relations, Študentská 3, 91150
Trenčín, Slovakia 3 Alexander Dubček University in Trenčín, Faculty of Social and Economic Relations, Študentská 3, 91150
Trenčín, Slovakia
S

48
ITEMA 2020
Conference Proceedings
(Habánik et al, 2016, p.146). In the regions, it is important to use mainly local development
potential. Small and medium-sized enterprises play an important role in regional development
and are an integral part of any advanced market economy, given their contribution to the
flexibility of the market mechanism, the potential of the competitive environment and
innovative activities. The role of small and medium-sized enterprises in regional development
is significantly influenced by the level and stability of the overall business environment. In this
paper, we focus on small and medium-sized enterprises operating in the field of tourism in
individual regions and their benefit to reducing regional disparities. In the analysis of regional
disparities, we had to solve several methodological problems. Firstly, it was the selection of
suitable territorial units - regions, secondly it was the selection of suitable indicators and the
selection of appropriate statistical tools that allow comparison. In our research, we used the
regions of the Slovak Republic (NUTS III level) and the division at the NUTS II level as
suitable territorial units. When deciding on the selection of suitable indicators, we were limited
by the limitations in the availability of suitable data. Many data are not systematically
monitored and therefore a relevant analysis would not be possible. In the analysis of regional
disparities, we included the following indicators: registered unemployment rate, regional gross
domestic product per capita, motorway network in the regions, at-risk-of-poverty rate in the
regions, number of facilities and beds in the regions. We monitored most of the indicators for
the period 2010-2019. In some cases, we had to limit ourselves to the period 2010-2018. In the
literature we can meet with the application of several statistical tools and indicators to measure
disparities. The coefficient of variation is a relative measure of the dispersion derived from the
standard deviation (ratio of standard deviation to mean). It is a more suitable tool for
comparative analyzes, because it does not depend on the measured values of input indicators.
Using the coefficient of variation, we can assess the size of regional differences in terms of
selected parameters, but we can also compare these differences.
2
1
1
1.1
.
n
i
ik n
i
i
x x
Vn
xn
(1)
Where:
kV is the coefficient of variation
n is the number of observed units,
ix is the value of the indicator x for the i-th region,
x is the average rate of the indicator in the whole higher order.
The Gini concentration coefficient was created as a tool for measuring pension inequality. It
ranges from 0 (absolute equality) to 1 (absolute inequality). It can be calculated in several ways.
This is twice the area between the ideal and real Lorenz curve.
1
2
1
n
i i
i
GINI F Qn
(2)
Where:
GINI is the Gini concentration coefficient
n is the number of observed units,
iF is i
iF
n

49
SMALL AND MEDIUM-SIZED ENTERPRISES IN TOURISM AND THEIR IMPACT ON REGIONAL
DEVELOPMENT
Development of regional disparities in the Slovak Republic based on selected socio-
economic indicators
The first of the indicators used in the analysis of regional disparities was the unemployment
rate analyzed at the regional NUTS III level. This indicator is a suitable indicator for analyzing
socio-economic development in individual regions. It is calculated as the ratio of the available
registered number of unemployed to the number of economically active population, where the
number of economically active population in the region is mainly affected by the deteriorating
demographic situation in some regions of the Slovak Republic (aging of population, migration
of the population for work to more developed regions or abroad). Based on the values given in
table 1, we can state decreasing differences in the indicator of the registered unemployment
rate between the regions of Slovakia in the analyzed period, which can confirm that the
development of the economy in the period positively affected the unemployment rate in the
regions. The Prešov region has the long-term highest unemployment rate, followed by the
Košice region and the Banská Bystrica region.
Table 1. Registered unemployment rate in % Registered unemployment rate (in%)
region / year 2010 2011 2012 2013 2014 2015 2016 2017 2018 2019
region of Bratislava 4,63 5,41 5,72 6,17 6,13 5,34 4,51 3,05 2,62 2,83
region of Trnava 8,17 8,88 9,43 9,16 8,03 6,71 4,41 2,6 2,31 2.63
region of Trenčín 9,51 9,95 10,89 10,74 9,56 7,71 5,85 3,53 2,93 3,2
region of Nitra 11,76 13,27 14,08 12,52 11,21 9,71 6,96 4,05 3,12 2,93
region of Žilina 10,86 11,91 12,79 12,51 10,91 8,86 6,92 4,7 4,04 3,96
region of Banská
Bystrica 18,86 19,83 20,81 18,26 17,22 14,94 12,8 8,67 7,03 6,69
region of Prešov 17,75 18,95 20,66 19,35 17,45 15,5 13,91 9,68 8,61 8,19
region of Košice 16,78 18,76 19,58 17,23 15,92 14,39 12,76 9,94 8,17 7,57
coefficient of variation 0,3847 0,3732 0,3697 0,3295 0,401 0,3596 0,4363 0,5033 0,5081 0,459
GINI coefficient 0,24732 0,23918 0,23041 0,212034 0,20145 0,2138 0,26994 0,31093 0,312975 0,280676
Source: Statistical Office of the Slovak Republic (2020), own calculations and processing
Regional gross domestic product per capita is a basic measure of a region's performance, so it
is part of our analysis of regional disparities. From the data given in table 2 it is clear that in
the whole monitored period there was an increase in regional gross product per capita in
individual regions of the Slovak Republic as well as that the Bratislava Region has long been
the most efficient region in Slovakia. The value of the indicator in absolute terms increased by
EUR 7,740.22 in the Bratislava region in the observed period. The least efficient region has
long been the Prešov region, followed by the Bansko Bystrický and Košice regions. Based on
the development of the value of the coefficient of variation between all regions of the Slovak
Republic at the NUTS III level, we cannot unequivocally state that differences in the amount
of gross domestic product per capita between the regions of Slovakia in the analyzed period
significantly decreasing. The indicator reached the lowest level in 2018. The development of
the value of the GINI coefficient copies the development of the value of the coefficient of
variation, so it is balanced in the long run. The indicator of the regional development index
calculated by the EU also shows significant differences in the development of individual
regions of the Slovak Republic at the NUTS II level, see table no.3.
The Regional Development Index points out that the Bratislava region has long been the most
developed region in the Slovak Republic. Other regions of Slovakia achieve a medium level of
regional development, but in the long run the lowest level is in the East Slovakia region (NUTS
III level: Košice region and Prešov region) and is followed by the Central Slovakia region
(NUTS III level: Banská Bystrica region and Žilina region).

50
ITEMA 2020
Conference Proceedings
Table 2. Regional gross domestic product per capita in EUR Regional gross domestic product per capita in EUR
2010 2011 2012 2013 2014 2015 2016 2017 2018
Region of Bratislava 31095,78 32793,71 32 862,47 34 543,62 34 460,69 36 157,86 36 657,33 37 514,49 38 836,00
Region of Trnava 13863,69 14940,46 15 187,10 15 073,50 15 777,52 15 667,62 16 191,49 16 702,29 17 917,48
Region of Trenčín 10912,38 11706,48 12 003,48 11 699,84 12 015,03 12 553,47 12 411,41 12 511,77 13 741,78
Region of Nitra 10052,03 11134,63 12 189,44 11 804,78 12 028,61 12 200,01 12 571,72 13 293,20 13 768,71
Region of Žilina 11 095,77 11769,53 11 713,70 11 717,77 12 274,51 12 890,59 12 912,09 13 305,64 14 078,55
Region of Banská
Bystrica 9196,38 9 586,50 9 666,44 9 847,08 9 911,78 10 578,30 10 753,07 11 292,08 12 064,18
Region of Prešov 7057,73 7 360,17 8 076,19 8 016,83 8 360,36 8 807,11 9 036,14 9 308,20 10 388,55
Region of Košice 9969,20 10 190,90 10 649,70 10 731,89 11 112,08 11 890,90 11 729,72 12 896,46 13 352,95
coefficient of variation 0,550492 0,547922 0,5249397 0,558649 0,538649 0,541243 0,5430694 0,530826 0,5113511
GINI coefficient 0,270987 0,274163 0,26196 0,270835 0,265569 0,260588 0,260462 0,256005 0,2455731
Source: Statistical Office of the Slovak Republic (2020), own calculations and processing
Table 3. European Regional competitiveness index region/year 2013 2016 2019 Stage of development
Bratislava Region 0,378 0,276 0,43 high
Western Slovakia -0,562 -0,579 -0,38 medium
Central Slovakia -0,749 -0,69 -0,53 medium
Eastern Slovakia -0,871 -0,846 -0,72 medium
Source: https://ec.europa.eu/regional_policy/en/
By analyzing regional disparities, we find that there is a deepening of regional differences in
the conditions of the Slovak Republic, which causes the formation of an imaginary dividing
line of the southwest and northeast direction. What does it mean? This means the division of
the territory of the Slovak Republic into regions with different attractiveness, with
differentiated development dynamics, performance and thus also competitiveness. Persistent
differences in the dynamics of regional development cause social and economic polarization
of regions. They form marginal regions called regions of poverty, which lag significantly
behind both socially and economically (table no. 4). The following table shows the percentage
of the population at risk of poverty. Based on the development of the value of the coefficients
of variation and the GINI coefficient, we can state that it increases the inequality between the
regions of East and West Slovakia in terms of at-risk-of-population poverty, which is a
consequence of increasing regional differences between these territories. As a result, the
number of least developed regions in the Slovak Republic has increased to 20 districts (NUTS
IV level region). These districts are concentrated in the Prešov region where there are at most
9 districts, in the Košice region there are 6 districts and in Banská Bystrica there are 5 districts.
Up to one fifth of the Slovak population lives in the least developed regions of the Slovak
Republic.
Table 4. At risk of poverty rate by NUTS 2 regions percentage of total population At-risk-of-poverty rate by NUTS 2 regions percentage of total population
region/year 2010 2011 2012 2013 2014 2015 2016 2017 2018
Bratislava Region 5,1 7,2 6,3 8 7,8 7,3 5,4 4,6 4,3
Western Slovakia 10,3 11,4 11,9 11,5 10,4 10,1 10,7 10 8,6
Central Slovakia 13,1 13,1 14,1 13,3 15,3 14,9 14,7 14 15,2
Eastern Slovakia 15,8 16,9 16,7 15,8 14,9 14,5 16,3 16,8 17,1
coefficient of variation 0,3576 0,3257 0,3129 0,2338 0,2596 0,2703 0,3574 0,404 0,4537
GINI coefficient 0,2626 0,2112 0,2272 0,1728 0,186 0,1937 0,2597 0,2981 0,3319
Source: https://ec.europa.eu/eurostat/data/statistics-a-z/abc, own calculations and processing

51
SMALL AND MEDIUM-SIZED ENTERPRISES IN TOURISM AND THEIR IMPACT ON REGIONAL
DEVELOPMENT
The reasons for the emergence of regional disparities in the conditions of the Slovak Republic
can be summarized in the following points:
• low competitiveness of material production and services,
• differentiated educational structure,
• spatially differentiated concentration of foreign investments and capital as factors of
region development,
• imbalances in regional labor markets,
• Insufficient quality and availability of public infrastructure,
• differentiated intensity of the absorption capacity of the business environment.
Factors of possible development of regions and reduction of regional disparities:
• efficient use of labor,
• better use and development of the region's production potential,
• increasing the innovation capacity of regions,
• increasing support for SMEs in the regions, especially in the field of tourism,
• improving the accessibility of regions by building infrastructure,
• improving the availability of public services.
Table 5. Number of SMEs doing business in tourism by size category (as at 30 June 2020) size category number of active SMEs share of active SMEs
micro-enterprises 24 514 96,46 %
small businesses 828 3,26 %
medium-sized enterprises 64 0,25 %
large companies 7 0,03 %
total 25 413 100 ,00%
Source: The position of SMEs in tourism with regard to current developments in the
industry, SBA, Bratislava, 2020, p. 17
The solution to regional disparities is the effective support and development of business
activities in the field of tourism. Tourism activities are linked to the place of its origin, i.e. the
region. Therefore, we can consider them as a driving force for the economic development of
the region. Tourism is a dynamically developing service sector, which is often considered to
be the only tool for the development of lagging regions while preserving the quality of the
region's environment and protecting native cultures. Tourism in the Slovak Republic is
significantly dominated by small and medium-sized enterprises headed by micro-enterprises
(Table 5), because thanks to their flexibility they can flexibly satisfy specific and individual
requirements on the demand side. Small and medium-sized enterprises, micro-enterprises
create jobs in the regions, contribute to the growth of the region's performance, also have an
impact on the growth of revenues to local budgets, etc.
Table 6. Headquarters of SMEs doing business in tourism
Source: The position of SMEs in tourism with regard to current developments in the
industry, SBA, Bratislava, 2020, p. 19
Number of active SMEs as of
30.6.2020
Share of active SMEs
as of 30.6.2020
Region of Bratislava 5 959 23,5%
Region of Trnava 2 787 11,0%
Region of Trenčín 2 294 9,0%
Region of Nitra 2 932 11,5%
Region of Žilina 2 972 11,7%
Region of Banská Bystrica 2 714 10,7%
Region of Prešov 3 185 12,5%
Region of Košice 2 563 10,1%

52
ITEMA 2020
Conference Proceedings
Regional development in the context of the given facts can therefore be perceived as a "by-
product" of tourism and vice versa. The development of tourism in the region brings investors
who build or improve the local infrastructure, facilities of the region and provide tourists and
locals with more opportunities and a better quality of life. However, it can work the other way
around. Because tourism depends on local infrastructure. The quality of infrastructure is an
essential determinant of the flow of tourists to the region and thus contributes to the overall
development of the region and the reduction of regional disparities. Of course, tourism also
brings with its negative effects Table 7.
Table 7. The impact of tourism on the development of the region Positive effects Negative effects
Stops rural depopulation
Creates jobs
Brings revenue
Finances infrastructure construction
Improves living conditions
Supports agriculture and improves care for
the landscape
Strengthens the feeling of belonging to the
region
It leads to a unilaterally oriented and
sensitive structure of the economy
If it develops in an uncoordinated manner, it
negatively affects its effectiveness
Occupies land by building facilities
It burdens nature and the landscape
Affects the original culture
Brings social tensions and increases
inequalities
Source: Gregorová, B. Neradný M, Klaučo M., Masný M., Balková N. 2015. Cestovný ruch
a regionálny rozvoj. UMB Banská Bystrica. p. 81
CONCLUSION
As stated by Grenčíková, A. et al (2019, p. 75): “the area of tourism is influenced by the
unpredictability of climatic conditions and customer behavior, and then accommodation and
catering services must be provided by support activities, which include e.g. opportunities for
sports, hiking, wellness, the possibility of visiting historical monuments and other attractions.
Animation services are also used and it is becoming more and more popular, for example.
gastronomic tourism, or agrotourism as an escape from the hustle and bustle of the big city,
active rest from the stressful factors of today's hectic times." And these facts create a large
space for the development of a wide range of business activities of SMEs and the possibility
of starting economic activities in lagging regions of the Slovak Republic. So, in conclusion, we
can say that the right combination of economic policy instruments and effective regional policy
will be able to gradually erase regional disparities in the longer term and contribute to economic
growth, job creation and the efficient use of regional resources.
REFERENCES
Gajdoš, P. (2008) Current state and development of regional disparities in Slovakia (with
emphasis on underdeveloped regions). In: Gajdoš, P., ed., Regional disparities in Central
Europe. Sociologický ústav SAV, Bratislava, p. 98-115
Habánik, J., Kordoš, M., Hošták, P. (2016) Competitiveness of Slovak economy and regional
development policies Journal of international studies, vol 9, pp.144-155
Matlovič, R., Klamár, R., Matlovičová, K. (2008) Vývoj regionáônych disparít začiatkom 21.
Storočia na Slovensku vo svelte vybraných indikátorov. Regionální studia / Czech
Regional Studies, recenzovaný vedecký časopis, 02/2008, ISSN 1803-1471, p. 2-12
GÚČIK, M. (2010): Cestovný ruch. 1. vyd. Banská Bystrica: DALI-BB, 2010, 307 p. ISBN
978-80-89090-80-8

53
SMALL AND MEDIUM-SIZED ENTERPRISES IN TOURISM AND THEIR IMPACT ON REGIONAL
DEVELOPMENT
GÚČIK, M. a kol. (2012). Manažment cieľového miesta cestovného ruchu. 1. vyd. Banská
Bystrica: Slovak-Swiss Tourism, DALI BB, 2012, 219 p. ISBN 978-80-8141-025-3
Gregorová, B. Neradný M, Klaučo M., Masný M., Balková N. (2015): Cestovný ruch a
regionálny rozvoj. UMB Banská Bystrica
Grenčíkova, A., Petrušová, D., Sokol J.(2019), The impact of Industry 4.0 on tourism services
online: https://fsev.tnuni.sk/konferencia2018/Zbornik-industry-4-0.pdf.
In: The impact of Industry 4.0 on job creation Zborník odborných príspevkov z
medzinárodnej vedeckej konferencie. - Trenčín: TnUAD, 2019. - ISBN 978-80-8075-
837-0. - p.74-80.
https://www.iz.sk/sk/projekty/inkluzivny-rast/najmenej-rozvinute-okresy
The position of SMEs in tourism with regard to current developments in the industry, SBA,
Bratislava, 2020, online: http://monitoringmsp.sk/wp-
content/uploads/2020/10/Postavenie-MSP-v-cestovnom-ruchu_final.pdf
https://ec.europa.eu/eurostat/data/statistics-a-z/abc,
Statistical Office of the Slovak Republic, http://datacube.statistics.sk/#!/lang/sk
Statistical Office of the Slovak Republic, http://statdat.statistics.sk/cognosext/cgi-
bin/cognos.cgi?b_action=xts.run&m=portal/cc.xts&gohome=


55
THE MARKETING MIX - A BASIC TOOL IN THE MANAGEMENT OF
THE TOURIST DESTINATION
Delia Fratu1
DOI: https://doi.org/10.31410/ITEMA.2020.55
Abstract: Kotler's 2002 definition of place marketing is as follows: "Place marketing means
designing a site to meet the needs of its target markets. The development of places means the
development for a place of a systematic long-term marketing strategy, directed towards the
identification and development of the natural and potential attributes of an area”.
The elaboration of a marketing mix for the tourist destination is the main tool for marketing
planning and for adopting the most appropriate strategies. Given that each tourist destination
has its specificity, the marketing mix must contain its own elements, adapted to the objectives
set.
In this paper we chose to exemplify a way to apply and combine the components of the following
marketing mix: product, price, distribution, promotion, staff, partnerships, packaging,
security, process management for the tourist destination Brasov Area.
Keywords: Place marketing, Marketing mix, Tourism, Destination.
1. BRASOV AREA- A TOURIST DESTINATION
tourist destination is defined according to the following variables: the attractions and
the environment within the destination, the facilities and services available at the
destination, the accessibility of the destination, the image and the brand of the
destination.
1.1. Defining the Tourist Destination Brasov Area
Brasov Area is located in a special natural setting. In the southern part it is delimited by the
Făgăraş, Bucegi, Piatra Mare, Piatra Craiului and Postăvaru Mountains, in the Eastern part
there is the Braşov depression, and in the Western part it is bordered by the Olt river valley.
Due to the geographical potential, mainly mountainous, tourists coming to the area can practice
sports and recreational activities in all seasons.
Being located in the center of the country, in the famous Transylvania region, Brasov Area is
one of the most visited tourist destinations in Romania. The multitude of ethnic groups (Saxons,
Hungarians) that marked the development of this area and their influence on architecture, local
culture is an attraction for tourists.
In Brasov Area, tourists can discover one of the most beautiful cities in Romania - the city of
Brasov which is a medieval city with a multitude of attractions: cultural tourist attractions
(Dramatic Theater Sica Alexandrescu, Brasov Opera, Gheorghe Dima Philharmonic, Reduta
Cultural Center, Library County, French Alliance, First Romanian School, etc.), historical and
religious tourist attractions (Catherine Gate, Weavers' Bastion, White Tower and Black Tower,
1 Transilvania University Brasov, 32 Avram Iancu street, Brasov, Romania
A

56
ITEMA 2020
Conference Proceedings
Graft Bastion, Black Church, St. Bartholomew's Church, St. Nicholas Church, etc.), natural
tourist attractions (Tâmpa Nature Reserve), museums (History Museum, Museum of Art and
Ethnography, Museum of Urban Civilization, etc.) as well as various events (musical,
theatrical, cinematographic, etc.).
Most of the tourists who come to Brasov Area aim to visit the surroundings of Brasov, very
rich in historical, religious, cultural and natural objectives: Poiana Brasov and Predeal resorts
are the most famous winter resorts in Romania, during the summer being sought for mountain
tourism, cycling, conference tourism; the villages in the Bran-Moeciu area are real
Transylvanian mountain villages where tourists can know the local traditions and customs, to
mention the presence of the famous Bran castle - Dracula's castle; the town of Râşnov with the
peasant fortress; the city of Făgăraş with its fortified fortress; the churches and fortified
fortresses in the villages around the city of Brasov; Piatra Craiului National Park Nature
Reserve. It should be mentioned that besides the worldwide known Dracula's Castle from Bram
Stocker's book which became a brand in itself, we can also say about Bran that it is an important
representative of the word "brand" by joining the words Bran-Destination, this as an
interpretation modern after its Norwegian origin.
Figure 1. Map of Barsa land- Brasov area
Source:.https://upload.wikimedia.org/wikipedia/commons/1/11/Map_of_Burzenland%2C_19
59.jpg
Figure 2. Image of Bran Castle
Source: https://www.twoscotsabroad.com/bucharest-to-transylvania-bran-castle/

57
THE MARKETING MIX - A BASIC TOOL IN THE MANAGEMENT OF THE TOURIST
DESTINATION
Figure 3. Image of Rasnov Citadel
Source:
https://en.wikipedia.org/wiki/R%C3%A2%C8%99nov_Citadel#/media/File:R%C3%A2%C5
%9Fnov_Citadel_(Rosenauer_Burg)_01.jpg
The accommodation possibility is diverse and adapted to all requirements and budgets: from
hostels and tourist cabins to hotels and pensions. Tourist services in the Brasov area are
developed and diversified as a whole, but there is room for improvement. Meal services are
generally diversified and of good quality. There is an untapped opportunity to attract the
Western European public interested in organic and home-cooked food with Romanian
specifics. This is expected from the accommodation units in the rural area, but most of them
opt for the more convenient option, namely the purchase of food from the supermarket.
Even though there is a wide range of local handicrafts, there are not many shops that specialize
in selling them. Recently, there have been several shops dealing with the sale and rental of
items for outdoor recreation (mountain bikes, tents, etc.).
Travel agencies are an important element for the development of a tourist destination such as
Brasov Area. There are about 80 travel agencies in the area but only a few are focused on
incoming tourism activity. Along with them, several associations work to promote the area as
a tourist destination and to develop a sustainable tourism (Association for the Promotion and
Development of Tourism - fulfills the role of destination management organization, County
Sustainable Development Agency and Metropolitan Association for Sustainable
Development).
Transport services are satisfactory, even good compared to other areas of the country. The
railway transport service between Bucharest-Predeal-Brasov is quite good. Lately, most of the
roads in the area have been rehabilitated. However, there are still roads that are almost non-
functional, mostly in rural areas, they need to be identified and rehabilitated. The inauguration
of an airport in the Brasov area would be a future investment that would ensure the development
of tourism.
Tourist information services have been improved recently. There is a tourist information
network at the level of Brasov Area, comprising 7 centers: Brasov, Predeal, Rasnov, Fagaras,
Prejmer, Bran, Zarnesti. The mission of the tourist information offices is to inform the tourists
about the attractions in the area and to promote them by offering informative materials.

58
ITEMA 2020
Conference Proceedings
In Brasov Area, there are several possibilities for schooling in the field of tourism. Transilvania
University of Brasov offers those interested the opportunity to study in Economics of
Commerce, Tourism and Services. Other schools specializing in tourism are the School of
Hotel Management, the Brasov School of Tourism. There are also post-secondary training
programs for tourism available in Bran and Brasov.
The access of tourists in the Brasov area is facilitated by the acceptable road and railway
infrastructure, compared to other areas of the country, which connects with the country's
capital, but also with Western Europe. Transport infrastructure is the biggest problem of
Romanian tourism. Investments in a highway that crosses Romania are very necessary and
urgent. The construction of an airport would create the possibility of connections between the
Brașov Area and the main western cities.
The tourist destination was promoted under the brand "Be.Live It". This brand aims to promote
the cultural diversity and dynamics of a modern, new area and was presented at the World's
Leading Travel Trade Show in Berlin where it took 2nd place. This brand was designed by the
Association for the Promotion and Development of Tourism (APDT) in partnership with the
Brasov County Council, the Agency for Sustainable Development of Brasov County (ADDJB)
and the advertising agency Firestarter, to represent the tourist destination area. Brasov at the
Berlin Tourism Fair and to promote a favorable image of it internationally. The problem was
that not enough money was invested to promote it both nationally and internationally. Even if
the idea was good, it did not ensure its visibility at all and without promotion it did not have
any significant results.
1.2. Types of tourism practiced in the Brasov area
The tourist offer of the Brașov area provides conditions for practicing many forms of tourism:
Mountain hiking tourism is favored by the existence of mountain massifs, large areas
covered with forests, the existence of marked trails, mountain huts and accommodation
bases in neighboring towns.
Cultural-historical and religious tourism is favored by the existence of numerous
historical, religious and architectural monuments throughout the area.
Sport tourism such as mountaineering, downhill skiing, cross-country skiing, horseback
riding, mountain biking, hang gliding and gliding, hunting and sport fishing in hilly and
mountainous areas, "image hunting" safari of some species such as wolf, bear and lynx,
in Brasov living 30% of Europe's large carnivorous population.
Thematic scientific tourism by sections of biodiversity, speleology, geology,
paleontology. It can be practiced in the nature reserves of the Brasov area.
Rural tourism or agrotourism is practiced especially in the area of Bran villages (Fundata,
Moeciu, Bran) and in Poiana Mărului, areas that constitute an area with a special natural,
historical and tourist potential, as well as in the Săcele-Tărlungeni area.
Ecotourism is the closest tourism to nature, offered as a tourist product in: Zărneşti area,
area in which this type of tourism is developed in the most advanced stage in Romania,
favored both by the exceptional natural environment (Piatra Craiului National Park) and
by the activity of organizing and promoting this type of tourism by the Administration
Piatra Craiului National Park; Vama Buzăului area, gateway to the Ciucaş Massif, where
the Ecology and Ecotourism Educational Center currently operates; Buneşti-Viscri area,
an incipient area in the practice of ecotourism but with a special potential for a further
development in this direction; the Făgăraş area, favored by the natural environment, in

59
THE MARKETING MIX - A BASIC TOOL IN THE MANAGEMENT OF THE TOURIST
DESTINATION
which an incipient ecotourism tourism is practiced, but without a coherent and unitary
strategy in this respect.
Business and conference tourism, from the perspective of which the Brasov area enjoys
a growing interest.
2. THE SYSTEMIC APPROACH OF THE MARKETING MIX OF THE TOURIST
DESTINATION BRAȘOV AREA
After having an overview of Brasov area as a tourist destination, let us have a look of the
components of the marketing mix from a systemic perspective.
The tourist destination Brasov area is a system because it is a set of elements with certain
common features that form an organized whole. The policies and strategies of the marketing
mix can be approached from an overall perspective or from that of its component elements.
The tourist destination Brasov area can be divided into component sub-destinations due to the
fact that the area is a destination in itself, but also the elements that make it up can be considered
independent destinations. In this paper it was considered the division of the area according to
the most representative attractions as follows:
• the city of Brasov - is the sub-destination considered the most representative for the
area according to the results of quantitative research;
• the fortified churches, the fortresses from Făgăraş, Râşnov, Rupea, Bran castle - were
grouped due to the form of tourism they represent, namely the cultural-historical
tourism;
• Poiana Brasov and Predeal resorts;
• Piatra Craiului National Park (it is the best known in the category of unique natural
attractions).
It is desired to determine the existing connections between the system represented by the
Brasov area and its component elements.
The city of Brasov - is the sub-destination considered the most representative of the area by
both tour operators and tourists. It has been included in various tours of Romania, Transylvania
or has been considered an independent destination. As a product policy, it is proposed to design
"city-break in Brasov" tourism products, with multiple accommodation possibilities for all
budgets, lasting 2 nights / 3 days because it is a sufficient time to discover the city. This product
must include the possibility of contracting sports and leisure activities. It is recommended to
approach the strategy of stimulating the current market and attracting new tourist markets.
In the case of Brasov, the strategy of low prices should be approached in order to attract as
many tourists as possible and to be able to compete with other similar destinations. The city of
Brasov is facing the phenomenon of seasonality, so it should be considered the strategy of
adjusting tariffs accordingly.
For the distribution and promotion of this type of product, intensive distribution and promotion
by all means proposed at the area level is recommended.
We propose a tourist package of the "city-break" type developed over 3 days, the theme
"Discover the city of Brasov", with free program and suggested activities: city tour with tourist
guide / tourist bus / segway with companion, walk on Tâmpa, circuit of cultural-historical

60
ITEMA 2020
Conference Proceedings
objectives, various sports activities, entrance to the Aquatic Paradise. As accommodation and
dining options, different units will be proposed on classification levels. Tourists will be
transported by bus to the destination, only on request.
It is recommended to conclude strategic partnerships between the city of Brașov and cities in
other areas of the country (for example Constanța, Iași, Oradea, Arad) and abroad for mutual
promotion.
In order to ensure the security of tourists, the strategy of deterring crimes and delinquency can
be applied by harshering those who commit crimes against tourists, increasing security
(presence of law enforcement in as many locations as possible) and informing about dangerous
areas in Brasov Area. It is also recommended to apply the strategy of neutralizing the negative
aspects by informing tourists about the security level of the destination Brasov area, by advising
tourists to fight against local crime (for example do not leave unsupervised luggage or pay
attention to the exchange commission).
Churches and fortresses in the Brasov area
This tourist product is a circuit type and has usually been included in larger circuits (for
example, "discovering the areas of Transylvania" or "tour of the fortified cities and churches
of Transylvania"). Churches and fortresses in the Brasov area, as well as those in the rest of
Transylvania, are attractions of great interest, especially for foreign tourists. These are very
well preserved, unique monuments, some of them being in the UNESCO patrimony. It is
proposed to keep this tourist product of integrated circuit type but with a clear delimitation of
the patrimony of each county because each area included in the circuit is identified with its
patrimony. Due to the positioning of these attractions especially in rural areas, this product
encompasses two forms of tourism: cultural and rural. As the product will not be changed, it is
recommended to adopt the current market stimulus strategy.
Regarding the tariff of this type of tourist product, it must be established in accordance with
the other counties that make up the circuit. In this approach, the rates should be the same for
both Romanian and foreign tourists. It is proposed to develop an access card to such objectives
with a pre-established, preferential, reduced rate for groups. The low price strategy approach
is the most appropriate. There are two examples of such churches:
1) The Prejmer fortified church ( German: Kirchenburg von Tartlau) is a Lutheran
fortified church in Prejmer (Tartlau), Brașov in the Transylvania region of Romania and
the ethnographic area of the Burzenland.
The church was founded by the Germanic Teutonic, and then was eventually taken over
by the Transylvanian Saxon community. Initially Roman, it became Lutheran following
the Reformation. Together with the surrounding village, the church forms part of the
villages with fortified churches in Transylvania UNESCO World Site.
2) Harman Fortified Church is one of the 25 UNESCO WorldHeritage Sites in
Romania Located in the heart of Harman (Honigburg in German, meaning Honey Castle)
village, this fortified church dates back to the 13th century when Saxons built the original
structure. Strong walls and bulwarks surrounded the church and on its sides, massive
towers were added

61
THE MARKETING MIX - A BASIC TOOL IN THE MANAGEMENT OF THE TOURIST
DESTINATION
Source
https://en.wikipedia.org/wiki/Prejmer#/media/
File:Prejmer_200609.jpg:
Source:
https://en.wikipedia.org/wiki/H%C4%
83rman#/media/File:RO_BV_Harman
Even if this type of product could attract a large number of tourists interested in cultural
tourism, the discovery of unique monuments, it is not exploited at its real value due to the lack
of efficient distribution and promotion. Although this type of product appears in the offer of
some Romanian and foreign tour operators, their area should be increased. It is proposed to
adopt an intensive distribution strategy, which involves the use of a large number of
intermediaries.
The following promotion strategies are recommended for this type of product:
• Documentary information strategy and pedagogical strategy, both meant to provide
information that would arouse curiosity;
• Creating events (such as the Medieval Festival Tournament of the Citadels);
• Organizing info-trips for the representatives of the tour operators and travel agencies
in order to know directly the tourist product;
• Participation in specialized tourism fairs.
It is proposed to design a tourist package with the theme "Tour of fortified cities and churches
in Transylvania "which includes visiting them, visiting Transylvanian villages in their vicinity,
providing accommodation and dining in rural areas, entertainment program every evening to
discover traditions and local customs. The transport will be done by bus; tourists will be
accompanied by specialized guides throughout the tour. The duration will depend on the
number of areas included in the circuit.
The design of a tourist package of the type mentioned above involves the consideration of
partnerships in the cultural-historical field between the Brasov area and other areas in
Transylvania in order to design a unitary product and establish common policies and strategies.
It is recommended that the policies and strategies of security, personnel and process
management be the same as those proposed for the city of Brasov.
Figure.4. Map of Prejmer fortified church
(UNESCO World Heritage Site)
Figure 5. Image of Harman Fortified
Church (UNESCO World Heritage Site

62
ITEMA 2020
Conference Proceedings
Predeal and Poiana Brasov resorts rank 3rd in the preferences of tourists visiting the Brasov
area. These tourist destinations are especially sought after for winter sports (alpine skiing,
cross-country skiing, snowboarding, tobogganing, skating, learning sports with the help of
specialized instructors). These two tourist resorts are the most famous in Romania and benefit
from a highly developed infrastructure, brought to European standards during the organization
of the European Youth Olympic Festival in 2013. The tourist product for the winter season
should be in the form of "a week in the mountains" which includes, in addition to basic services,
a common access card to the ski slopes, daytime entertainment program (e.g. competitions,
raffles) and evening (e.g. concerts, traditional evenings). The tourist product Predeal and
Poiana Braşov face the phenomenon of seasonality, like any resort dedicated to winter sports.
In order to diminish this phenomenon, tourist products destined for the summer season should
also be elaborated. The tourist product destined for the summer season should also be in shape
for a week in the mountains but with the possibility of practicing summer sports (hiking,
cycling, etc.). The strategy that should be considered is to penetrate the internal and external
market with the previously proposed products.
A global tariff (all inclusive) should be set for these products. The strategy of low tariffs is
recommended for good quality, at least in the short term, in order to face the competition
represented by countries such as Austria or Bulgaria. Given that demand is particularly
pronounced in winter, the differentiated tariff strategy for the rest of the year should be
considered.
It is proposed to adopt the intensive distribution strategy, through a large number of
intermediaries: electronic, tour operators and travel agencies, tourist information centers, in
tourism fairs, etc.
Regarding the promotion of these products, it is recommended:
• designing a portal intended exclusively for these two resorts, with the possibility of
making reservations in real time, with the presentation of all events, possibilities for
spending time, etc.;
• production of well-documented, attractive promotional materials to be distributed
free of charge to tourists, information centers and travel agencies;
• organizing info-trip excursions for the representatives of the tour operators and travel
agencies in order to test these tourist products;
• organizing internationally renowned competitions;
• participation in tourism fairs.
It is proposed to conclude partnerships with other areas of the country (especially the coastal
area and Bucharest) as well as abroad in order to promote the offers. Partnerships with major
European tour operators are also considered strategic in order to include these products in their
offers.
It is proposed to develop a tourist package with the theme "A week in the mountains", lasting
7 days, including accommodation and meals of various categories, access card to the ski slope
(winter), rental of sports equipment for winter or for the summer as the case may be, animation
program. Tourists will be transported by bus to the destination. Inside the resort, a mini-bus
will be made available to tourists who will have regular trips to ensure the transport of tourists
from the accommodation to the slopes, during the winter.

63
THE MARKETING MIX - A BASIC TOOL IN THE MANAGEMENT OF THE TOURIST
DESTINATION
For the security of tourists, they will be informed about the security level of certain places in
these resorts and by their advice and counseling in order to avoid various frauds (e.g. use of
ATMs exclusively in closed spaces, not leaving unattended luggage, use of safes in rooms hotel
for storing valuable etc.).
The staff working in tourism in these resorts is helpful and kind, so the quality of the process
of providing tourist services is generally considered satisfactory by tourists. Most organizations
active in tourism are up to date with technological developments and benefit from state-of-the-
art facilities: card readers, online booking systems, etc. Most tourism organizations apply the
policy of generating and maintaining customer relations by setting up databases with them and
by giving due importance to feedback on the quality of service delivery.
Piatra Craiului National Park is unique in the Romanian Carpathians due to the imposing
relief of the limestone ridge 25 km long and due to the rare species of flora and fauna. At
present there are very few travel agencies or organizations that offer tourist products, stays, or
simple trips to protected areas, because they involve a high degree of specialization from the
organizers and companions. The tourist offers in the Piatra Craiului National Park area are
addressed especially to young people (pupils, students) and include: guided excursions, tourism
programs based on cycling and horseback riding, wildlife watching in freedom, climbing.
Access to Piatra Craiului National Park offers a unique opportunity to create a combination of
themed tourism products (cave exploration, medicinal plants, protection of mountain and
ecological areas, observation and study of wildlife, as well as a whole series of recreational
excursions, ecotourism or educational excursions), to be sold directly to tour operators and
domestic and foreign travel agencies. The most appropriate product strategy is to penetrate the
market with such thematic products.
As this nature reserve is a new destination launching on the market, it would be appropriate to
adopt the low price strategy primarily because it addresses a category of middle and low income
consumers.
The selective distribution strategy is the most appropriate because it involves distributing the
product only to tour operators and travel agencies specializing in ecotourism, rural tourism,
sports tourism, etc. and in web-sites and tourism fairs with this theme.
The following promotion strategies are recommended for the types of tourism products listed
above:
Documentary information strategy, meant to inform tourists about this area and to arouse
their curiosity;
Elaboration of promotional materials such as leaflets, tourist guides, CDs, etc. to be
distributed to travel agencies, information centers, possibly stores with sports equipment
in the country and abroad;
Distribution of tourist products within web-sites that promote ecotourism, thematic, rural,
sports tourism as well as the presentation of products at tourism fairs with the same theme;
Organizing events for tourists on the occasion of the European Day of National Parks
(May 24), within the Piatra Craiului National Park;
Carrying out exchanges of experience with institutions and organizations from countries
with advanced practices in ecotourism, such as Germany and Great Britain, especially
because tourists from these areas are interested in Romania in general and Transylvania
in particular.

64
ITEMA 2020
Conference Proceedings
The partnership policy involves concluding them with organizations in the same field at
national and European level, on the promotion of tourism products. A series of thematic tourist
packages are proposed, targeting market segments such as: cave exploration, wildlife watching
in the wild, educational excursions. Such packages require the accompaniment of tourists by
specialized guides, depending on the topics considered. Accommodation for tourists will be
made at tourist chalets in the Piatra Craiului mountains, a place where meals will be served.
The duration of these packages will be 2 days and can be extended upon request. The transport
of tourists will be done by bus to the starting point of the mountain route. Regarding the
personnel policy, for such tourist products it is necessary the presence of a personnel with a
high degree of specialization. That is why it is very important to adopt the right employee
recruitment strategy based on experience in the field and a skill test. The staff development
strategy must also be adopted in order to be up to date with the requirements of tourists.
Regarding the Piatra Craiului National Park, it is recommended to implement the strategy of
investments in security equipment and technologies because some activities present a high
degree of risk (e.g. exploring caves or observing animals in the wild) and involve the use of
special equipment. In terms of process management, as in the case of the other three sub-
destinations, it is recommended to conduct market research in order to determine trends in
consumer behavior and expectations of tourists.
Area-level policies and strategies as a system are determined by sub-destination policies and
strategies as components of the system. Sub-destinations must adopt policies and strategies in
line with those at the area level, there must be harmonization between them. For example, in
terms of product policy, the products of the components taken in part make up the product
offered at the area level. Pricing strategies at the area level as well as at the level of sub-
destinations are in line, namely the adoption of low prices. Area-level partnership policies also
target component sub-destinations. Sub-destination packages interrelate with the regional
package. The distribution and promotion policies and strategies at the destination level in the
Brasov area are made up of those proposed within the sub-destinations. So are security,
personnel and process management. Considering these aspects, a model of systemic approach
of the tourist destination Braşov area is proposed, which consists of sub-destinations. The
graphical representation of this model is shown in Fig. nr.6.
Figure 6. Relation of policies and strategies at the level of the tourist destination Brasov area
and its component elements (sub-destinations)
Tourist destination Brasov area
City of Brasov
Fortresses
Fortified churches
National Park Piatra
Craiului
Predeal resort
Poiana Brasov resort

65
THE MARKETING MIX - A BASIC TOOL IN THE MANAGEMENT OF THE TOURIST
DESTINATION
3. The Cluster Strategy Approach
The notion of tourism cluster refers to a geographical concentration of companies and
institutions interconnected through tourism activities. It includes providers, services,
governments, institutions, universities and competitors. The main objective of a tourism cluster
is to bring together companies that usually operate on their own, to build a successful tourism
product in a given region.
A cluster structure in tourism should include accommodation, catering services - which is its
static element, and transport services, travel agencies and tour operators, car rental services -
which are mobile elements.
The tourism cluster includes, in addition to accommodation, meals, entertainment and various
attractions, tour operators and travel agencies, guides, car rental and tourist transport services,
other services and activities such as organizations and support services, transport infrastructure,
education and training, consulting and other business services. It is necessary the participation
of all actors active in tourism, not just tourism service providers to design a cluster type
structure. The government should encourage and fund programs to attract private investors,
invest in infrastructure and promote tourism.
Within tourist destinations these cluster structures appear by themselves but must be supported
and developed to reach their maximum potential. Their development should be supported by
strategic planning, the support of the authorities, investment in infrastructure and joint
marketing efforts. The interdependence that appears at the level of a destination between
attractions, services, transport, information, promotion, induces the need for collaboration and
it is obvious that if the actors at the destination level work together they have nothing to gain.
The satisfaction of the tourist depends not only on the attractions at the destination but also on
the quality and efficiency of the services offered by hotels, restaurants, shops, transport.
Therefore, in a global market where competition is very tight between tourist destinations, and
in the context where new destinations always appear and the consumer changes his behavior,
it is recommended to approach a cluster structure to become and remain competitive in the
market. High-level cooperation successfully creates added value for both the tourist destination
and the individual entrepreneur.
The first tourism cluster established in Romania "Carpathian Tourism Cluster Romania" is a
network of professional and development organizations, with as members decision makers at
regional and national level, experts in the tourism industry in Romania and was launched on
November 1, 2010. Its mission is to promote sustainable tourism and create added value for
the tourism industry in the Carpathian Mountains region. It was established at the initiative of
the Association for the Promotion and Development of Tourism in Brasov County together
with Monteoru Renaissance - Association for Sustainable Regional Development in Tourism
(Buzau County). The marketing action plan for the Carpathian Mountains tourist region will
be developed in accordance with the national brand and tourism strategy: “Romania - Explore
the Carpathian Garden”.
The considered objectives are the innovation and diversification of the tourist products and of
the services associated to them, in order to increase the interest of the external and internal
markets for the Carpathian Mountains, as a tourist destination. Also, the most important
activities are increasing competitiveness by optimizing the value chain in the local tourism

66
ITEMA 2020
Conference Proceedings
industry and improving the quality of tourism services, in order to reach European standards.
The cluster projects have an inter-regional character, focusing for the beginning, on the
Carpathian and sub-Carpathian tourist regions in the center of the Carpathian Arc, including
the counties of Brasov, Buzau, Sibiu, Covasna, Arges and Prahova. They will contribute to the
development of local and regional partnerships, to the development of resources and
capabilities of organizations in order to meet the general objectives of the cluster.
However, not all tourist destinations form cluster systems; only when they reach a high level
of development can they form such integrated systems. Even if there are many partnerships in
the Brașov area, there is no common integrated approach to target all tourism actors and to
develop in the sense of harmonizing personal benefits with those in the area and to identify
common beneficial development directions.
The following model presented in Figure 7, illustrates a cluster approach at the level of a tourist
destination that is proposed for adoption by the Brasov area.
Figure 7. The model of a tourism cluster at regional level
Source: Adapted from Sölvell Ö., Clusters - Balancing Evolutionary and Constructive
Forces, 2nd ed., DanagardsGrafiska, Ödeshög, January 2009, pp. 16.

67
THE MARKETING MIX - A BASIC TOOL IN THE MANAGEMENT OF THE TOURIST
DESTINATION
The competitiveness of the cluster approach proposed above depends on:
• human resources, natural and anthropic resources, development of tourist infrastructure,
accessibility and security;
• current conditions of demand: level of education, preferences and motivations;
• the structure of the private environment and competition.
The competitive strategies that should be adopted inside and outside the cluster are based on
the cooperation of all actors at the destination level in the Brasov area in order to innovate and
differentiate the tourist experience offered.
Local authorities play a very important role in improving the competitiveness of the cluster by
creating and maintaining tourism infrastructure, providing financial support to tourism
investment projects, ensuring destination security, preserving the natural, historical and
cultural heritage within the cluster.
The role of the University and tourism training schools within the cluster is to encourage the
design of innovative and differentiation strategies for the cluster destination and to educate and
prepare human resources.
FUTURE RESEARCH DIRECTIONS
The marketing mix proposed as an example for Brasov Area is an aspect that can be discussed
for further analysis regarding the variables proposed and also the strategies. The marketing mix
specific strategies proposed in this article for Brasov Area, together with the systemic and the
cluster approach can be proposed as a good practice example for other similar tourist
destinations within a marketing plan. The conclusions resulted can be used in the comparison.
CONCLUSION
Tourism is a dynamic phenomenon, which is constantly changing. The tourist market is
constantly changing due to the existing and constantly growing competition. Tourist
destinations, the basic pillars of tourism, face many challenges in order to enter and stay in this
market. Therefore, the marketing activity within the tourist destinations is of major importance
in order for them to be maintained at a competitive level. Marketing approaches in tourist
destinations have become indisputable tools for their success.
In recent years, the tourism market has been severely affected by major economic changes
which have also led to changes in consumer behavior. In this context, the orientation of tourists
towards certain destinations to the detriment of others underlined the need for the current
approach of policies and marketing strategies applicable to tourist destinations at a conceptual
level.
REFERENCES
Alhroot, A., Marketing of a destination: Jordan as a case study. PhD thesis, University of
Huddersfield. Huddersfield,2007
Ashworth, G., Goodall, B., Marketing tourism places, Routledge, New York, 1990
Avraham, E., et al, Media Strategies for Marketing Places in Crisis, Elsevier, Butterworth-
Heinemann, 2008

68
ITEMA 2020
Conference Proceedings
Baloglu, S, Kozak, M., Managing and Marketing Tourist Destinations Strategies to Gain a
Competitive Edge, Routledge, New York, 2011
Candrea, A., Constantin, C., Ispas, A., Tourism Heterogenity in Romanian Urban Destinations,
the case of Brasov, Tourism and Hospitality Management, vol.18, no.1. 2012
Destination Marketing Association, The Secrets of Packaging Success for Destination Tourism
Organizations, Destination Marketing Association Int Publication, 2007
Dwyer, L., Kim, K., Destination Competitiveness: Determinants and Indicators, Current Issues
in Tourism, vol.6, m.5, Routledge, 2003
Fratu Delia: Factors of influence and changes in the tourism consumer behaviour. Buletinul
Universităţii Transilvania Braşov, Vol. 4 (53) • No. 1 - 2011 • Series V 120, 2011
Fratu, D., Brychtova, S., Analysis of the Present Situation in Tourism in two European
Regions: Pardubice and Brasov, Scientific Papers of the University of Pardubice 21
(3/2011), p.53-67
Howie, F., Managing the tourist destination, Thomson Learning, Londra,2003
Kotler, P., Bowen J., Makens J., Marketing for Hospitality and Tourism, fourth edition, Pearson
Education International, Upper Saddle River, New Jersey, 2006
Kotler, P., Asplund, C., Rein, I., Haider, D., Marketing Places in Europe, Prentice Hall, 1999
Malhotra, N., Marketing research – and applied orientation, Pearson Education, Prentice Hall,
2006
Pike, S., Destination Marketing- an Integrated Marketing Communication Approach,
Butterworth-Heinenmann, Oxford, 2008

69
THE IMPORTANCE OF ACQUIRING INTERCULTURAL
COMMUNICATIVE COMPETENCE FOR PRESENT AND FUTURE
TOURIST PROFESSIONALS IN MONTENEGRO
Gordana Mušura1
DOI: https://doi.org/10.31410/ITEMA.2020.69
Abstract: The aim of this paper2 is to discuss and emphasize the importance of acquiring and
developing intercultural communicative competence (hereinafter ICC) for tourist professionals
in the context of strategic advantages of Montenegro as a tourist destination. Montenegro, as
a multicultural, multiethnic and multi-confessional country with a very rich and ancient
cultural heritage and preserved natural resources, strives for European integration and
achieving international competitiveness in the field of tourism through the development of its
strategic advantages. In order to achieve progress in tourism industry, it is necessary to apply
an interdisciplinary approach, which includes a symbiosis of elements of culture and tradition
with the need and demands of modern tourists who want to communicate with the domicile
population, or at least with their hosts, as well as to feel comfortable and welcome at the
destination they have chosen for their holiday. Therefore, communicative and affective
segments must be added to this interdisciplinary approach which inevitably includes the
acquisition of new skills in intercultural communication at the international level. Such
communication enables the development of ICC through the inclusion of both linguistic and
cultural elements of education in tourism and applying the intercultural approach in foreign
language teaching. Furthermore, developing intercultural aspects in tourism should be seen
as one of core advantages of smaller and still insufficiently affirmed tourist regions, such as
Montenegro, especially in these disruptive circumstances of crisis caused by Covid -19 virus.
Keywords: Intercultural communication, Globalization, Intercultural approach in foreign
language teaching, Intercultural speaker, Intercultural awareness and sensitivity, Long-life
learning.
1. INTRODUCTION
ur contemporary reality is characterized by globalization and interculturality.
Migrations of the population and the permeation of their cultures and languages are
becoming more and more emphasized, which has imposed the need to focus on the
intercultural aspect, both in the school and work environment of people. Tourism, as a branch
of economy that includes a large number of people, both tourists and tourist workers and
residents of the receptive tourist area, is in direct connection with globalization processes
characterized by intercultural contacts and human relations conditioned by their different
national, linguistic, cultural, religious and identity differences. Therefore, it is extremely
important that all the afore mentioned actors establish appropriate intercultural communication
1 Faculty of Business and Tourism, Akademija znanja, Budva, Montenegro 2 Some segments of the paper were taken, adapted and translated into English from the doctoral dissertation
“Sticanje interkulturne komunikativne kompetencije u nastavi italijanskog jezika kao stranog u osnovnoj
školi” (Mušura, 2019). (“Acquiring intercultural communicative competence in teaching and learning
Italian as a foreign language at elementary school”)
O

70
ITEMA 2020
Conference Proceedings
that will lead to mutual respect and appreciation of cultural differences, tolerance and
understanding of "otherness", which are the basic postulates of acquiring intercultural
competence. This competence will enable them to overcome stereotypes and prejudices about
other nations, especially in the sphere of cultural tourism. In order to achieve this, it is necessary
to establish an intercultural approach in teaching in the school system, from the earliest age of
children in the lower grades of primary school, through secondary school and higher education
at the university, on the one hand, and, on the other hand, to continuously educate tourism
workers in the direction of interculturalism, which is in line with the principles of the Council
of Europe on long life learning.
2. INTERCULTURAL COMMUNICATIVE COMPETENCE
When communicative competence is combined with intercultural competence, intercultural
communicative competence is created (hereinafter ICC), as Byram (1997), the creator of this
concept, points out. Acquiring ICC means developing the ability to interact in complex cultural
contexts among people who have more than one cultural identity and language. Accordingly,
it is necessary to create an intercultural classroom that will be characterized by the
transformation of identity, the student as an examiner and the process. When ICC becomes an
integral part of the language classroom, students will experience how to use language, build
relationships and mutual understanding with members of other cultures, re-examine their own
beliefs, viewed through a different perspective, negotiate points of view that are different from
theirs and discern into another culture. By incorporating certain activities to promote ICC in
the curriculum, students will begin to see how their attitudes, knowledge, and language skills
can influence their intercultural experiences (Moeller & Nugent, 2014).
Byram (1997) sees the ICC as a complex system that develops as a result of different non-
native speaker experiences, such as formal education, practical work, and independent learning.
Byram's model is popular among foreign language teachers and its components are recognized
as general competencies that should accompany communicative competence. Corbett (2010, p.
2) notes that the detailed specification of the ICC is still an evolving project, although it was
Byram and his colleagues who achieved a great deal by working on this. In the Framework3,
of which Byram is one of the authors, ICC is understood as a set of knowledge, skills and
attitudes. Building on Byram's work, Corbett summarizes five basic aspects of the ICC,
namely:
a) knowledge about oneself and others
b) to know how to relate to meaning and how to interpret it
c) developing critical awareness
d) to know how to reveal cultural information
e) to know how to relativize oneself and evaluate the attitudes and beliefs of others
3. INTERCULTURAL SPEAKER IN INTERCULTURAL COMMUNICATION
Intercultural learning and teaching have imposed some new challenges on previous models.
Corbett (2010, p. 1) points out that they, above all, challenged the conventional goal of
language education, which sought to acquire the language skills of the native speaker of the
foreign language being taught. For many students, that was an unattainable goal, and as the
author notes, many teachers claim that it is now an unnecessary goal, especially if we bear in
3 Common European Framework of Reference for Languages: Learning, Teaching, Assessment. Companion
volume new descriptors. (2018). Council of Europe

71
THE IMPORTANCE OF ACQUIRING INTERCULTURAL COMMUNICATIVE COMPETENCE FOR
PRESENT AND FUTURE TOURIST PROFESSIONALS IN MONTENEGRO
mind the fact that English is becoming a global and universal language of communication, i.e.
a kind of lingua franca of the modern age, as it was once the Latin language in the Middle
Ages. Therefore, it is more acceptable for most people to establish communication and achieve
functional language use than to strive for the perfection of native speakers in the UK, the USA
or Australia. Therefore, the intercultural speaker takes precedence in international
communication over the native speaker of a language. Intercultural education has certainly
contributed to this, when intercultural students, as Corbett further states (ibid.), use language
to explore different cultures and to mediate in those situations where cultural
misunderstandings occur. They do it in a sophisticated way, using their acquired knowledge of
culture and developed skills in using the resources of the target language. They are also
encouraged to include their personal qualities, such as empathy, openness and respect for
others.
The intercultural speaker is the main actor in intercultural communication and therefore it is
essential to analyze and observe the development of his intercultural competence, which is very
important in modern intercultural and multilingual environments. Byram (1997) defines the
term of intercultural speaker as a person who possesses knowledge of one or more cultures and
social identities and someone who enjoys discovering and maintaining relationships with
people from other cultural backgrounds, even though he is not formally educated for that
purpose. It is a person, according to House (2007), who managed to develop his third way,
which is among other cultures that are close to him. Such a person should be understood as
independent both of his or her original culture and language and of the new culture and
language he or she wishes to connect, mediate and harmonize between them. He or she creates
something new and autonomous in between, something hybrid, which is the third way. Such
a person is an active participant who organizes her or his discourse creatively and
independently, offering deeper views and understanding.
The aim of modern foreign language teaching, as an integral part of education for tourism
professionals, is no longer for students to master language skills and competencies, but also to
acquire plurilingual and intercultural communicative competence that are an integral part of
intercultural education. They imply activating all students 'potentials related to knowledge of
foreign languages, regardless of the level and degree of knowledge, as well as all transversal
knowledge from culture, to monitor students' personal development and their needs during
language learning, so that progress in development their linguistic and intercultural abilities
lead them to become primarily intercultural rather than native speakers of a foreign language.
4. INTERCULTURAL COMMUNICATIVE COMPETENCE IN THE TOURISM IN
MONTENEGRO
This is exactly the profile of an intercultural speaker that all those involved in the tourism sector
in Montenegro should strive for. Montenegro has a very diverse population that has lived
together for centuries in harmony and mutual tolerance, resisting the dangers that lurked during
numerous wars that took place in the long history of this country. In this way, its inhabitants
have managed to preserve multicultural, multiethnic and multi-confessional harmony, which
can be considered one of the important resources for the development of modern forms of
tourism. In addition to this human resource, Montenegro abounds in very numerous and diverse
cultural and historical monuments, some of which date back to ancient times. This cultural
heritage attracts many tourists from different parts of the world and contributes to the
development of cultural tourism. Tourists also like the natural beauties of this country, such as

72
ITEMA 2020
Conference Proceedings
the beautiful sandy beaches of the Adriatic Sea in the south and the untouched beauty of the
mountainous area in the north of the country.
However, this is not enough to meet the needs of the modern tourist who, in addition to an
excellent offer of accommodation, gastronomy and entertainment, wants a more complete
experience and a more comprehensive approach during his or her stay at a particular
destination. Such a tourist wants to feel welcome, to talk to the domicile population, to get to
know the peculiarities of the new destination and the way of life of its people. He or she wants
to feel the affective side of his or her hosts, i.e. to recognize in their smile and facial expression
true hospitality and satisfaction that they welcome him or her as a dear guest. Such a tourist
also wants to spend his or her holiday in the belief that he or she will come to the same
destination again because it was a nice and pleasant place which he or she will definitely
recommend to the family members and friends. Therefore, it is necessary for tourism workers
in Montenegro to be sensitized to this aspect of their work, which will include continuous
education and training and an interdisciplinary approach. It means that the essential elements
of culture and tradition need to be combined with various forms of communication skills and
ability to develop cultural sensitivity in contacts with foreign tourists. Apart from being an
important component of education for present and future successful tourism professionals, this
should be a new form of intercultural dialogue between people in modern globalized world that
requires mutual understanding and intercultural awareness and sensitivity. It also requires long
life learning and constant training. Furthermore, developing intercultural aspects in tourism
should be seen as one of core advantages of smaller and still insufficiently affirmed tourist
regions, such as Montenegro, especially in these disruptive circumstances of crisis caused by
Covid -19 virus.
5. CONCLUSION
The paper considers the importance of acquiring intercultural communicative competence for
present and future tourist professionals in Montenegro. As a small country that strives for
European standards and integration and sees its prosperity in the development of tourism as
one of the main economic branches, Montenegro has to allow its tourism representatives to
improve their intercultural communication. Such communication will enable the development
of ICC through the inclusion of both linguistic and cultural elements of education in tourism
and applying the intercultural approach in foreign language teaching. Both of these will
contribute to a better future in the field of tourism.
REFERENCES
Byram, M. (1997). Teaching and assessing intercultural communicative competence.
Clevedon: Multilingual Matters
Corbett, J. (2010). Intercultural language activities. Cambridge: Cambridge University Press.
Moeller, A. J., Nugent, K. (2014). Building intercultural competence in the language
classroom. Downloaded from: http://www.digitalcommons.unl.edu

73
ECONOMIC BENEFITS OF ŠUMAVA NATIONAL PARK
Josef Stemberk1
DOI: https://doi.org/10.31410/ITEMA.2020.73
Abstract: The main task of nature protection is to preserve or improve the current state of
nature. Thus, it might seem that the economic benefits of the national park are not important
for the management of the protected area, but calculating the economic benefits of protected
areas for the region improves its acceptance among locals and visitors, as well as political and
economic actors.
From 2017 to 2019, Šumava National Park (Bohemian Forest National Park) in the Czech
Republic and Nationalpark Bayerischer Wald (Bavarian Forest National Park) were subjected
to extensive socio-economic monitoring, which included, among other things, research
focusing on the economic benefits that visitors brought to both national parks. This article
presents the results of research of the regional economic benefits that visitors brought to
Šumava National Park compared with those in Bavarian Forest National Park, although the
methods and findings were not absolutely identical and therefore difficult to compare.
Keywords: Šumava national park, Economic benefits, Acceptance.
1. INTRODUCTION
irst of all, national parks are a classic tool for large-scale nature protection. After some
development, they currently focus on the protection of natural processes. It is a difficult
task not only in Central Europe, where it is a particularly challenging task as nature and
landscape have been influenced by human use in the long-term. Land use in national parks is
limited due to nature conservation, which is often understood as an intervention in spatial
planning. Local residents, including political leaders, usually accept national parks with their
main functions only reluctantly and see them as a hindrance to regional development. On the
other hand, national parks as major natural attractions are among the most sought-after
destinations. As a result, their contribution to regional development and its economic benefits
is beyond reasonable doubt. This contribution aims to show the economic benefits generated
by Šumava National Park, which is the largest national park in the Czech Republic.
a. Šumava National Park
Šumava National Park was declared in 1991 on an area of 69,000 ha and thus became not only
the largest national park in the Czech Republic, but also one of the largest national parks in
Central Europe. It stretches in a strip up to 26 km wide along the Czech-German border in the
length of 70 km and its southern tip touches the Czech-Austrian border. More than 80% of the
territory is covered by forests with numerous fragments of primeval forests. The most valuable
are climax mountain spruce forests located in the highest parts of the mountains and in vast
Šumava plains at an altitude of about 1,000 m. Numerous peat bogs and wetlands covering
about 3,500 ha are protected under the Ramsar Convention on Wetlands. The whole Šumava
1 University Hradec Kralove, Rokitanského 62, 500 03 Hradec Králové III, Czech Republic
F

74
ITEMA 2020
Conference Proceedings
National Park area is also protected as a Natura 2000 area. According to the IUCN
(International Union for Conservation of Nature) criteria, Šumava National Park is included in
Category II (Dudley, 2008). The natural (non-intervention) zone covers 27.7% of the area, i.e.,
over 15,000 ha. Together with the adjacent Šumava Protected Landscape Area, the area is part
of a network of biosphere reserves within the UNESCO Man and the Biosphere Programme.
Today, this landscape features both natural values and landscape attractions, in which many
traces of the original colonization effort have been preserved. (Těšitel et al, 2005)
The formation of the natural values of the Šumava was significantly influenced by its
demographic development. The forested border mountains were inhabited much later than
other areas and significantly so only in the 19th century. The displacement of the predominantly
German population after World War II and the launch of the Iron Curtain on the Czechoslovak
western border after 1948 caused a great discontinuity of socio-economic development in the
area. The resulting significant decline in population and the decision to close the area to
ordinary people led to the demise of numerous settlements. The only surviving economic
activities, i.e., agriculture and forestry, were carried out here in their extensive form.
Employment in state-owned enterprises in the primary sector placed low demands on the
education of workers, which was reflected in the demographic composition of the population.
The educational structure was lower than average. Further economic development of the area
was enabled only after the fall of the Iron Curtain and the subsequent establishment of the
Šumava National Park when tourism has become the most significant economic sector.
2. METHODS
In 2017, a socio-economic monitoring system was introduced in Šumava National Park, which,
in addition to quantitative monitoring of the number of visitors, collected qualitative data from
questionnaire surveys among the public (Transboundary socio-economic monitoring…, 2020).
The surveys focused on both the acceptance of Šumava National Park among the locals and
the economic benefits of visitors, which will be discussed in this contribution.
In 2018 and 2019, visitors to Šumava National Park were interviewed in order to find out their
expenses in the region. This was done in order to calculate the economic effects of tourism in
Šumava National Park based on the number of visitors.
A highly structured questionnaire containing 31 closed as well as open questions, which was
available in Czech, German and English, was used. Furthermore, face-to-face interviews were
conducted by trained staff from both Šumava National Park and Bavarian Forest National Park.
The survey took place at 23 locations in Šumava National Park, for a total of 27 days from June
2018 to May 2019, both on weekdays and on weekends and holidays. The answers of the
respondents were recorded in an analogue questionnaire and subsequently converted into the
electronic form. The interview took an average of 15 minutes. All visitors over the age of 15
who passed interview points were asked to participate in the survey. A total of 549 complete,
error-free questionnaires were obtained and could be evaluated (the rejection quota was around
34.8%).
a. Visitor counting
The permanent counting of visits using people counting devices took place from 24th
November 2017 to 23rd November 2018 at 34 different locations in Šumava National Park.
Another standardized counting of people at 66 entrances to Šumava National Park was

75
ECONOMIC BENEFITS OF ŠUMAVA NATIONAL PARK
conducted by Šumava National Park's collaborators. Data from people counting devices were
used to calculate the number of visits in comparison with calculations performed by staff.
(More details in: Transboundary socio-economic monitoring…, 2020)
b. Regional economic benefits
In order to ensure comparability with studies in other, especially Central European national
parks, including the neighbouring Bavarian Forest National Park, regional economic benefits
were determined according to the methodology developed in the study by Job et al. (2008).
3. RESULTS
a. Socio-demographic characteristics of the interviewees
According to the type of visitors, 69.7% of the interviewed were hikers, 14.8% were cyclists
or MTB cyclists and 8.5% were cross-country skiers. The remaining 7.0% of respondents were
runners, lovers of Nordic Walking or other users (snowshoe hikers, water sportsmen, etc.).
55.6% of respondents were men, 44.4% were women. On average, the respondents were 47
years old. A total of 26.9% of respondents had children with them (0-12 years). 9.7% of
respondents were walking one or more dogs. The majority of dogs (89.3%) were on a leash at
the time of questioning.
Only 18% of respondents were residents or cottage owners from the Šumava National Park
region, i.e., locals. Over 80% of respondents were tourists (with 63% of overnight guests and
19% day-trippers). Of course, a higher proportion of overnight guests have an impact on
regional economic calculations, as they spend more money in the region than day-trippers
(Arnberger et al., 2015).
More than half of the visitors (54.6%) are employees or office workers, about 20% (21.3%) are
retirees, about 14.7% are businesspeople, 4.2% students, 3.8% are on their maternity leave and
others make 1.4%. More than 40% (42.2%) of the respondents completed university or higher
education and even 44.2% passed the school-leaving examination. About 4.4% completed
higher vocational education. Only 9.2% of visitors stated that they had a lower than secondary
education (basic, without an apprenticeship certificate, etc.). When compared with the
educational structure of the population of the entire Czech Republic, visitors to Šumava
National Park boast of a higher level of education than the national average, especially when it
comes to the university level (Source: Czech Statistical Office, 2019).
Approximately 80% of respondents answered a voluntary question regarding their gross
domestic income, and a total of 45.6% of households had a gross monthly income of CZK
30,000 to 59,999 (Table 1).
Table 1. Gross monthly income of households in Šumava National Park.
Šumava NP– gross monthly income of households in CZK Share in %
<14,999 5,4
15,000-29,999 25,1
30,000-44,999 26,2
45,000-59,999 19,4
60,000-74,999 10,4
75,000-89,999 4,5

76
ITEMA 2020
Conference Proceedings
90,000-104,999 5,0
105,000-119,999 1,8
120,000-134,999 0,5
135,000-149,999 0,2
>150,000 1,6
Total 100,0
Source: Transboundary socio-economic monitoring, 2020.
b. Attitude to the 'national park' status
Almost all respondents (98.4%) knew they were in a protected area. The majority of these
respondents (90.4%) were able to correctly state the term "national park" when asked about a
specific type of protected area. For just over a third of the visitors (35.9%) who stated national
park in the previous question, the fact that it is a national park played a very large or large role
for their visit on the day of the survey. 3.5% of all respondents stated that they would not come
if Šumava National Park did not exist.
In order to ensure comparability with research in other national parks, the concept of affinity
with national parks was taken over from Job et al. (2003) in a slightly modified form. The
national park visitor in the narrower sense was defined according to three questions:
(1) Do you know that you are in a protected area? (a closed question)
(2) If yes, what is its name? (an open question)
(3) What role did the national park status of this area play for your visit today? (a closed
question)
According to the above mentioned view, the national park visitor in the narrower sense knows
that he is in a protected area, he can specifically name the national park he or she is visiting
and its protection status, and the national park status plays a very large or large role for him of
her in deciding to visit this area on the day of questioning. Almost a third of all respondents
(31.9%) fell into the category of the national park visitor in the narrower sense.
c. Number of visitors
In total, about 1,840,000 visitors were counted in Šumava National Park during the monitored
period (1 year). The survey participants comprised of 63.4% of overnight guests, 18.9% day-
trippers, and 17.7% of local residents.
In order to determine the number of visitors for each type of visitor, the share of the respective
types of visitors was divided according to the affinity for the national park (yes / no national
park visitor in the narrow sense).
Table 2. Distribution and visitor number according to the type of visitors and affinity for the
Šumava National Park
Type of visitor according to the affinity to
the national park
Respondents Number of visitors
in 017/2018 Number Per cent
Overnight guests: NP visitors in the
narrower sense 109 20.2 370 924
Overnight guests: other NP visitors 236 43.7 803 101

77
ECONOMIC BENEFITS OF ŠUMAVA NATIONAL PARK
Day-trippers: NP visitors in the narrower
sense 30 5.6 102 089
Day-trippers: other NP visitors 70 13.0 238 208
Local residents/cottage owners: NP
visitors in the narrower sense 33 6.1 112 298
Local residents/cottage owners: other NP
visitors 62 11.5 210 984
Total 540 100.0 1 837 605
Source: Transboundary socio-economic monitoring, 2020.
d. Economic effects of visitors
For individual types of visitors, net expenses for individual categories of expenses were
recalculated according to the current rate of Czech value added tax.
Table 3. Day expenditures (mean value, net) of visitors according to categories in the
national park region
Day
expen
dit
ure
s
(net
in C
ZK
)
VA
T
Over
nig
ht
gues
ts:
NP
vis
itors
in t
he
nar
row
er s
ense
O
ver
nig
ht
gues
ts:
oth
er N
P
vis
itors
Day
-tri
pper
s:
NP
vis
itors
in
the
nar
row
er
sense
D
ay-t
ripper
s:
oth
er N
P
vis
itors
Loca
l
resi
den
ts/c
ott
age
ow
ner
s: N
P
vis
itors
in t
he
nar
row
er s
ense
L
oca
l
resi
den
ts/c
ott
age
ow
ner
s: o
ther
NP
vis
itors
Accommodation 15% 353.7 364.1 - - - -
Food / soft drinks in
accommodation and
catering facilities
15% 152.8 141.6 161.6 138.6 86.0 98.6
Alcoholic beverages in
accommodation and
catering facilities
21% 27.7 38.3 19.0 15.9 8.7 14.8
Foodstuffs in shops
(including own food) 18%# 35.4 34.2 10.9 5.1 17.4 34.1
Books, magazines 10% 1.4 3.8 3.8 - 1.0 0.4
Other purchases:
alcoholic products,
souvenirs, sports
equipment, etc.
21% 23.6 20.4 16.8 18.3 12.9 4.8
Public transport 10% 12.1 5.0 35.0 13.5 9.0 8.4
Parking fees 21% 8.1 7.9 8.0 10.9 12.5 7.3
Refuelling (in the
region) 21% 13.7 24.8 29.4 29.1 12.8 36.1
Rental of sports
equipment, etc. 21% 9.3 6.9 - - - -
Tickets and admission 15% 17.2 13.3 8.3 1.2 - -
Municipal taxes / guest
card 15% 16.8 16.1 - - - -
Spa treatments /
doctor's fee 15% 1.8 2.4 - - 7.9 1.0

78
ITEMA 2020
Conference Proceedings
Other expenses 18%* 0.6 - - - - -
Lump sum 18%^ 11.4 80.7 - 6.1 - -
Total 685.8 759.5 292.8 238.8 168.1 205.5
N 109 236 30 70 33 62
Notices: # Mixed value added tax because food is taxed differently; * Mixed value added tax
for all categories except accommodation; ^ Mixed value added tax for all categories.
Source: Transboundary socio-economic monitoring, 2020.
Table 4 shows a summary of average total expenditure per person according to the type of
visitor and affinity for the national park.
Table 4. Overview of visitor expenses by type of visitor and affinity for the national park
(per person): gross and net, Visitors to the national park in the narrower sense
Type of visitor according to affinity
for the national park
Daily expenditures (gross)
in CZK
Daily expenditures (net)
in CZK
Overnight guests: NP visitors in the
narrower sense 794.3 685.8
Overnight guests: other NP visitors 882.3 759.5
Day-trippers: NP visitors in the
narrower sense 339.5 292.8
Day-trippers: other NP visitors 278.7 238.8
Local residents/cottage owners: NP
visitors in the narrower sense 196.1 168.1
Local residents/cottage owners:
other NP visitors 240.7 205.5
Annual turnovers were calculated from daily expenditures according to the types of visitors
and affinity for the national park (daily expenditures * number of visitors – Table 5). The total
gross annual turnover was CZK 1,177 million and the net turnover was CZK 1,013 million
(Table 5).
Table 5. Overview of gross and net annual sales by type of visitor and affinity for the
national park: Visitors to the national park in the narrower sense
Type of visitor according to affinity for the
national park
Daily expenditures
(gross) in CZK
Daily expenditures
(net) in CZK
Overnight guests: NP visitors in the narrower
sense 294 638 369 254 369 033
Overnight guests: other NP visitors 708 578 908 609 935 368
Day-trippers: NP visitors in the narrower sense 34 658 705 29 891 314
Day-trippers: other NP visitors 66 394 257 56 881 851
Local residents/cottage owners: NP visitors in the
narrower sense 22 026 683 18 877 366
Local residents/cottage owners: other NP visitors 50 782 668 43 358 065
Total 1 177 079 590 1 013 312 997
Source: Transboundary socio-economic monitoring, 2020.
The group of overnight guests generated the largest share of economic impacts. Their share in
individual economic indicators was more than 80%. The expenditures of this visitor group for
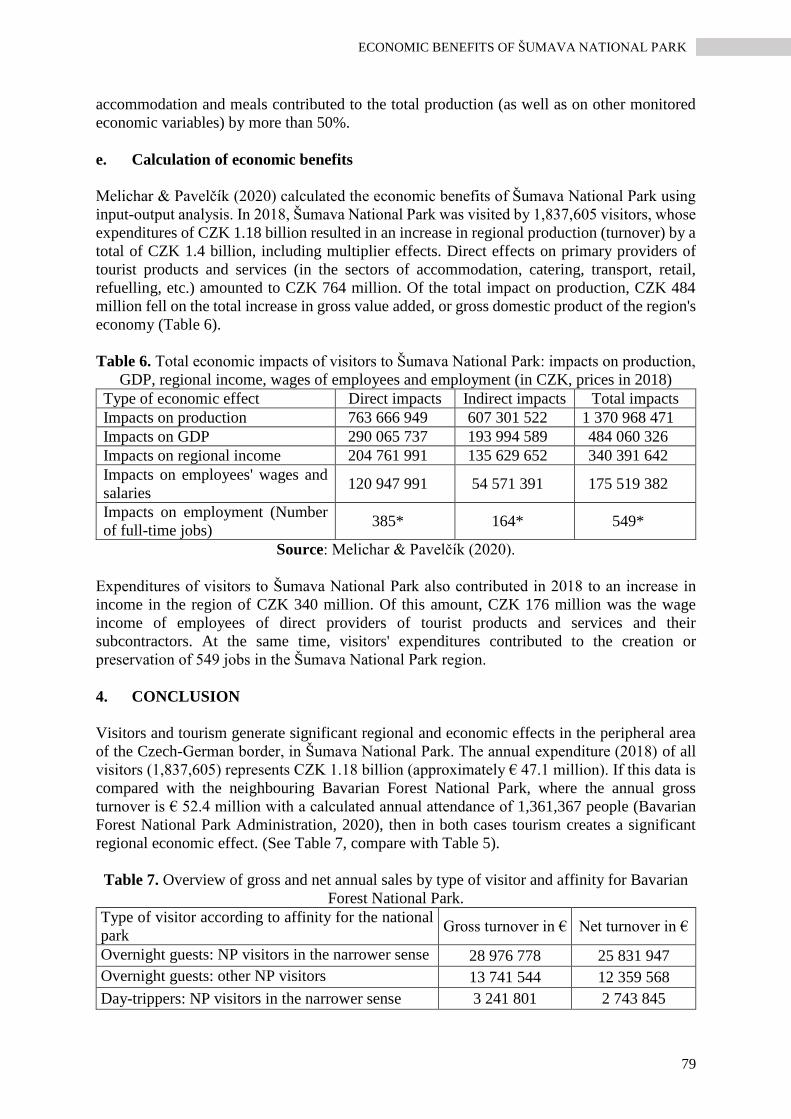
79
ECONOMIC BENEFITS OF ŠUMAVA NATIONAL PARK
accommodation and meals contributed to the total production (as well as on other monitored
economic variables) by more than 50%.
e. Calculation of economic benefits
Melichar & Pavelčík (2020) calculated the economic benefits of Šumava National Park using
input-output analysis. In 2018, Šumava National Park was visited by 1,837,605 visitors, whose
expenditures of CZK 1.18 billion resulted in an increase in regional production (turnover) by a
total of CZK 1.4 billion, including multiplier effects. Direct effects on primary providers of
tourist products and services (in the sectors of accommodation, catering, transport, retail,
refuelling, etc.) amounted to CZK 764 million. Of the total impact on production, CZK 484
million fell on the total increase in gross value added, or gross domestic product of the region's
economy (Table 6).
Table 6. Total economic impacts of visitors to Šumava National Park: impacts on production,
GDP, regional income, wages of employees and employment (in CZK, prices in 2018)
Type of economic effect Direct impacts Indirect impacts Total impacts
Impacts on production 763 666 949 607 301 522 1 370 968 471
Impacts on GDP 290 065 737 193 994 589 484 060 326
Impacts on regional income 204 761 991 135 629 652 340 391 642
Impacts on employees' wages and
salaries 120 947 991 54 571 391 175 519 382
Impacts on employment (Number
of full-time jobs) 385* 164* 549*
Source: Melichar & Pavelčík (2020).
Expenditures of visitors to Šumava National Park also contributed in 2018 to an increase in
income in the region of CZK 340 million. Of this amount, CZK 176 million was the wage
income of employees of direct providers of tourist products and services and their
subcontractors. At the same time, visitors' expenditures contributed to the creation or
preservation of 549 jobs in the Šumava National Park region.
4. CONCLUSION
Visitors and tourism generate significant regional and economic effects in the peripheral area
of the Czech-German border, in Šumava National Park. The annual expenditure (2018) of all
visitors (1,837,605) represents CZK 1.18 billion (approximately € 47.1 million). If this data is
compared with the neighbouring Bavarian Forest National Park, where the annual gross
turnover is € 52.4 million with a calculated annual attendance of 1,361,367 people (Bavarian
Forest National Park Administration, 2020), then in both cases tourism creates a significant
regional economic effect. (See Table 7, compare with Table 5).
Table 7. Overview of gross and net annual sales by type of visitor and affinity for Bavarian
Forest National Park.
Type of visitor according to affinity for the national
park Gross turnover in € Net turnover in €
Overnight guests: NP visitors in the narrower sense 28 976 778 25 831 947
Overnight guests: other NP visitors 13 741 544 12 359 568
Day-trippers: NP visitors in the narrower sense 3 241 801 2 743 845

80
ITEMA 2020
Conference Proceedings
Day-trippers: other NP visitors 2 756 098 2 339 899
Local residents/cottage owners: NP visitors in the
narrower sense 1 933 278 1 647 156
Local residents/cottage owners: other NP visitors 1 751 812 1 492 730
Total 52 401 311 46 415 145
Source: Transboundary socio-economic monitoring, 2020.
In Šumava National Park, a socio-economic monitoring system has been gradually introduced
since 2018, but the first research of the economic effects of the national park took place in
Bavarian Forest National Park as early as 2007 and is repeated about every five years. (See
Table 8). The main reasons for the increase in visitor expenditures (especially those of
overnight guests) include the rising standard of accommodation facilities, which can also obtain
a "National Park Partner" certificate, whose criteria include environmentally friendly operation
as well as the support of the Bavarian Forest National Park approach: 'let nature be nature'.
Table 8. Daily expenditures (gross per person), according to the visitor's affinity for the
national park.
Type of visitor according to affinity for the national
park
Daily
expenditure
s 2007
(gross) in €
Daily
expenditures
2013/14
(gross) in €
Daily
expenditures
2018/19
(gross) in €
Overnight guests: NP visitors in the narrower sense 49.6 56.2 77.7
Overnight guests: other NP visitors 49.6 56.2 71.9
Day-trippers: NP visitors in the narrower sense 12.3 13.9 18.2
Day-trippers: other NP visitors 12.1 13.7 18.5
Local residents/cottage owners: NP visitors in the
narrower sense 9.1 10.4 8.2
Local residents/cottage owners: other NP visitors 6.1 6.9 7.5
Source: Transboundary socio-economic monitoring, 2020.
Overall, the results in both neighbouring and comparable national parks show that soft forms
of tourism, where the main reason for the visit is to stay and observe nature, bring significant
economic benefits to the region. These results refute the general myth that nature conservation
is at odds with socio-economic development (Těšitel et al., 2005) and at the same time support
the claim that nature tourism, which combines nature experience with relieving the burden on
nature and the environment, and with generating economic benefits, greatly increases the
acceptance of protected areas (Job et al, 2005).
5. ACKNOWLEDGMENT
I would like to thank all my colleagues working together on the project “Introduction of a
transboundary socio-economic monitoring system in the National Parks of Šumava and
Bavarian Forest” from the Šumava National Park Administration, Bavarian Forest National
Park Administration and the methodical and supervisor work of experts from the University of
Natural Resources and Life Sciences, Vienna (BOKU). The common Czech-Bavarian project
was supported by the European Union.

81
ECONOMIC BENEFITS OF ŠUMAVA NATIONAL PARK
REFERENCES
Dudley, N., (2008). Guidelines for Applying Protected Area Management Categories. Gland,
Switzerland: IUCN. ISBN 978-2-8317-1086-0
Těšitel J., Kušová D., Matějka K., Bartoš M. (2005). Lidé v biosférických rezervacích /People
in biosphere reserves. České Budějovice, Czech Republic: Ústav systémové biologie a
ekologie Akademie věd České republiky.
Arnberger, A., Allex, B., Preisel, H., Eder, R. (2015): Sozioökonomisches Monitoring
Nationalpark Bayerischer Wald: Befragung und Besucherzählung 2013/2014. Interner
Endbericht.
Job, H., Mayer, M., Woltering, M. (2008). Die Destination Nationalpark Bayerischer Wald als
regionaler Wirtschaftsfaktor. Germany: Bavarian Forest National Park Administration.
Job, H., Metzler, D., Vogt, L. (2003). Inwertsetzung alpiner Nationalparke. Eine
regionalwirtschaftliche Analyse des Tourismus im Alpenpark Berchtesgaden. Münchener
Studien zur Sozial- und Wirtschaftsgeographie 43.
ADDITIONAL READING
Melichar J. & Pavelčík, P. (2020). Evaluation of the economic effects of tourism in Šumava
National Park. Charles University/Prague, Czech Republic: Unpublished report.
Transboundary socio-economic monitoring in Šumava and Bavarian Forest National Parks in
the years 2017-2019. (Final report) (2020), Šumava National Park
Administration/Vimperk, Czech Republic: Šumava National Park Administration
(published on-line: https://www.npsumava.cz/sprava-np/seznam-projektu/zavedeni-
preshranicniho-socioekonomickeho-monitorovaciho-systemu-v-narodnich-parcich-
sumava-a-bavorsky-les-2/)


83
THE ROLE OF INTERNATIONAL AND PROFESSIONAL
ORGANISATIONS’ IN DEFINING STATE-OWNED ENTERPRISES
Ioana Andreea Ciolomic1
Ioana Natalia Beleiu2
DOI: https://doi.org/10.31410/ITEMA.2020.83
Abstract: State-owned enterprises (SOEs) have an essential role in national economies
worldwide, but regardless of their acknowledged contribution to the global markets, divergent
opinions and approaches can be observed when defining and characterizing these entities. On
the other hand, international organizations such as OECD, International Monetary Fund,
European Commission, United Nations, World Trade Organizations, World Bank, Asian
Development Bank, and professional organizations such as IPSASB and Chartered Institute of
Management Accountants have an essential role in SOEs' activity. One of the biggest
challenges that professional bodies have nowadays is to find a unique definition to match the
need of practitioners and capture the complexity of SOEs. Even if there can be identified some
common approaches between academicians, international, and professional organizations,
there are some delicate areas that require substantial efforts for clarifications. The paper
addresses this topic, aiming to clarify the main aspects concerning the definition of SOEs from
international and professional organizations' points of view based on qualitative research
methods.
Keywords: State-owned enterprises, International and professional organisations,
Governance.
INTRODUCTION
eforms in public management represent a global trend (Ongaro and Valotti, 2008),
being frequent when regulations are not correlated with the business world reality or
instructions regarding their implementation are missing. Unfortunately, in most
countries, the current legislation referring to state-owned enterprises (SOE) is inadequate,
adjusting, and restructuring SOEs being a necessity determined by the market and
technological changes (Kloviene and Gimzauskiene, 2014).
SOEs' importance strongly increased in the recent period due to a stringent need for effective,
efficient, and high-quality public services (Papenfuss and Schmidt, 2015). Recently, both
researchers and practitioners focus on aspects regarding good governance to increase
organisational efficiency. Christiansen (2011) underlines the importance of SOEs by
presenting statistical data that create an overview of the Organisation for Economic Co-
Operation and Development (OECD) reporting countries' situation in the year 2008/2009:
2,057 enterprises, employing over 4 million people and with an estimated value exceeding 1.3
trillion US dollars.
1 Babes-Bolyai University, Faculty of Economics and Business Administration, Cluj-Napoca, Romania 2 Babes-Bolyai University, Faculty of Economics and Business Administration, Cluj-Napoca, Romania
R

84
ITEMA 2020
Conference Proceedings
The research presented in this article is mainly qualitative. It aims to clarify the main aspects
concerning SOEs' definition from international and professional organizations' point of view.
One conclusion of the study is that clearly defined concepts should contribute to a better
understanding of the SOEs concept and contribute to good governance by enhancing the
quality, consistency, and transparency of government' actions.
The paper's remaining sections are organized as follows: methodological aspects, findings and
discussions of SOE definitions used by international and professional organisations, and
conclusions of the conducted study.
METHODOLOGY AND RESEARCH QUESTION
International and professional organisations have divergent opinions and approaches when
defining and characterizing state-owned enterprises. One of the biggest challenges that
professional bodies have nowadays is to find a unique definition to match the need of
practitioners and capture the complexity of SOEs. The purpose of the paper is to create a
comprehensive view of the topic of SOEs' definitions used by international and professional
organisations related to emerging issues like governance, performance, accounting, and
accountability. The study's research question is: How do international and professional
organisations define SOEs?
The methodology is in line with the interpretative perspective and pays particular attention to
the meanings behind SOE. The data collection is based on content analysis of documents issued
by worldwide recognised international organisations like OECD, International Monetary Fund
(IMF), European Commission (EC), United Nations (UN), World Trade Organisations (WTO),
World Bank (WB), Asian Development Bank (ADB) and professional organisations such as
IPSASB and Chartered Institute of Management Accountants (CIMA). For each organisation,
the table below presents the documents used for content analysis.
Table 1. Documents used for content analysis
International
organisation Year Document
OECD 2005
2014
Corporate governance of state-owned enterprises: A
survey of OECD countries
OECD Guidelines on Corporate Governance of State-
Owned Enterprises - Draft for Public Comment
International Monetary
Fund 2014 Government Finance Statistics Manual
European Commission 2012 EUROSTAT Foreign Affiliates Statistics
Recommendation Material
United Nations 2008
2014
System of National Accounts
World Investment Report 2014: Investing in the SDGs:
An Action Plan
IPSASB 2012 Handbook of International Public Sector Accounting
Pronouncements – Vol. I, II
World Trade
Organisation 1994 The General Agreement on Tariffs and Trade
Source: Author’s projection

85
THE ROLE OF INTERNATIONAL AND PROFESSIONAL ORGANISATIONS’ IN DEFINING STATE-
OWNED ENTERPRISES
The selected documents are analysed to identify critical elements used in defining SOEs. The
organisations were selected based on their interest regarding the topic of SOEs.
FINDINGS AND DISCUSSIONS OF SOE DEFINITIONS USED BY
INTERNATIONAL AND PROFESSIONAL ORGANISATIONS
The concept of SOE is at the top of debates of international and professional organizations such
as the OECD, IMF, EC, UN, WTO, WB, ADB, CIMA, and IPSASB. Baring this in mind, to
achieve the paper's purpose, we analysed the definitions provided by these institutions. These
organisations, except WB, deal with SOEs without considering the level of government (state,
regional and local government) while acknowledging the existence of different levels and
forms of ownership and control. On the other hand, the World's Bank toolkit focuses on SOEs
at the national level. Even though this guideline does not cover municipal and local level SOEs,
they admit that many of the concepts and approaches are relevant for them as well. CIMA
(professional organisation) and ADB (international organisation) are involved in projects
regarding SOEs, but none of their actions aim to define SOEs, the primary constraint of our
methodology. Based on this imposed restriction, these organisations could not be included in
our analysis.
Readjustment and restructure of state-owned sectors in the context of markets globalization,
technological reforms, and deregulation of previously monopolistic markets determined the
OECD to initiate various projects in this field since 2003. The most relevant projects are
"Privatizing State-Owned Enterprise, An Overview of Policies and Practices in OECD
Countries" 2003 and "Corporate Governance of State-Owned Enterprises: A Survey of OECD
Countries", 2005.
In the OECD Guidelines on Corporate Governance of SOEs, the terms used are "state-owned
enterprises", defined as "enterprises where the state has significant control, through full,
majority, or significant minority ownership" (OECD 2005, 11). The definition provided by
OECD since 2005 is not restrictive, covering two key elements: control and ownership.
Although it appears relatively straightforward, several countries had responded in various
manners when they applied the OECD definition in their national legislation:
• Countries that took over the conditions provided by OECD, some even adding other
critical elements as legal form or activity (objectives)- for example, Australia, Austria,
Belgium, Czech Republic, Bulgaria, Romania, Italy;
• Countries that modified the conditions provided by OECD, adding the percentage of
ownership/votes – for example, Estonia, Greece (requires more than 50% of share
capital), Hungary (companies in which the state owns at least 10%), Slovenia (the
government owns directly or indirectly at least 25% plus one vote of the total capital).
In May 2014, the OECD developed a new draft for public comments on the OECD Guidelines
on Corporate Governance of State-Owned Enterprises, with a noticeably different approach
related to SOEs' concept from the previous version. According to the new guidelines, the SOE
is "any state-owned corporate entity recognised by national law as an enterprise" (OECD 2014).
This includes joint-stock companies, limited liability companies, partnerships limited by
shares, and statutory corporations with specific legal form and primarily commercial activities.
Each government is entitled to choose the recognition or not of other enterprises as SOEs
depending on their judgement, regardless of their degree of market/non-market orientation
(OECD 2014). OECD's new perspective concerning SOEs consists of both key elements, such
as control and ownership and legal form and activity orientation.

86
ITEMA 2020
Conference Proceedings
While OECD defines SOEs from the governance perspective, IPSASB approaches it from the
accounting perspective. IPSASB refers to SOEs using the notion "governance business
enterprises (GBE)", defined in IPSAS 1 - Presentation of Financial Statements as (IPSASB
2012, 32): "an entity that has all the following characteristics: has the power to contract in its
name; has been assigned the financial and operational authority to carry on business; sells
goods and services, in the ordinary course of its business, to other entities at a profit or full
cost recovery; is not reliant on continuing government funding to be a going concern (other
than purchases of outputs at arm's length); is controlled by a public sector entity."
Throughout time, IPSASB developed some projects aiming to set the conceptual delimitation
of the term. The first Consultation Paper (CP) idea arose in 2008, but IPSASB discussed and
approved a brief project on SOEs in March 2012, which started in December 2012. Initially,
IPSASB considered four approaches to SOEs (IPSASB 2012): "(a) Do not specifically define
SOEs, but provide the high-level characteristics of entities; (b) Clarify the existing definition
of SOEs; (c) Narrow the current definition; or (d) Redefine SOEs using a different approach,
e.g., based on services provided by entities or the objectives of entities. But, since it received
little support, it was decided not to develop a further approach (d)". Further, in 2014, IPSASB
suggests two main approaches. The first approach does not define the term. Instead, it produces
a list of characteristics for public sector entities, while the second approach is modifying or
narrowing the current definition presented in IPSAS 1. Both approaches have two sub-options;
the differentiating criteria are the use of statistical terminology (IPSASB 2014).
One can observe that the IPSASB definition concerning SOEs was initially based mainly on
control, ownership, and activity criteria. In 2014, the IPSASB decision was to define SOEs
using characteristics and acknowledge the role of regulators in determining other specific
elements that could help them establish which entities should be recognized as SOEs (the same
approach identified in the OECD project).
European Commission through EUROSTAT provides a definition based on control and
ownership criteria, in accordance with OECD: "there are numerous cases of enterprises
controlled by the government directly (through nominating its representatives on the board) or
indirectly (through state-owned funds and agencies) that themselves control affiliates in
another country" (EC, 2012, p. 32). The novelty of definition consists in introducing the notion
of direct or indirect control.
Further, the International Monetary Fund (IMF) uses this term in Governance Finance
Statistic Manual (GFSM) linking IPSAS and GFSM: "the IPSAS equivalent of a market entity,
that is, a GBE" (IMF 2014, 352). The IMF urges international standard-setters to collaborate
to align reporting standards for budget, statistics, and accounts.
From the statistical point of view, there are two international frameworks in significant
harmony (European System of Accounts - ESA and System National Accounts- SNA).
Although terms as GBE or SOE are not used, they refer to corporations and quasi-corporations
similar to SOEs when controlled by public sector units (EC 2010; UNSD 2008, SNA, 2008).
The concept of control, from a statistical point of view, is "the ability to determine the general
policy or programme of that entity" (EC 2010). Corporations are "created for the purpose of
producing goods or services for the market that may be a source of profit or another financial
gain to its owner(s), being collectively owned by shareholders who have the authority to
appoint directors responsible for its general management" (UNSD 2008; EC 2010). Quasi-
corporations "are unincorporated entities engaged in the production of market goods and

87
THE ROLE OF INTERNATIONAL AND PROFESSIONAL ORGANISATIONS’ IN DEFINING STATE-
OWNED ENTERPRISES
services, managed as a corporation, having their own set of accounts" (EC 2010; IPSASB 2014;
UNSD 2008). SNA and ESA divide public companies into financial and non-financial,
depending on their activity (UNSD 2008), and this approach is also identified in the CP
provided by IPSASB. However, the approaches of these two international organisations also
include, alongside key elements as control, ownership, and activity, a common point of view:
the SOEs must have the power to contract in their name, although in certain countries, this
cannot be applied, due to national regulations. National accounts statisticians use a rather broad
definition of SOEs, including in this type of organisations, all autonomous government
companies (ownership criteria) with independent budgets and balance sheets that generate at
least half of their income through the commercialisation of goods and services (activity
criteria). The national authorities apply a restrictive concept, which is, in many cases, braced
in SOE-related legislation (OECD 2014).
World Trade Organisation (WTO) is another international organisation that pays attention to
SOEs due to the government's influence on world trade. It refers to SOEs using the term "state-
owned transnational companies", and includes in this category all state trading enterprises that
deal with goods for export or import (WTO 1994). The definition provided by WTO is not
restrictive, and it uses just two key characteristics of SOEs identified in the academic literature:
ownership and activity.
World Bank provides the most complex approach among international organisations
concerning SOEs' definitions. Despite the SOEs' definition provided in the Glossary of Key
Terms being based only on two key elements identified in the academic literature, legal form
and activity (commercial), the World Bank created through its toolkit "Corporate Governance
of State-Owned Enterprises – a Toolkit" an overview which comprises the majority of the
issues identified in the first section of this research paper: areas in which SOEs operate, their
importance and role in economies, performance and the ownership and control issues. They
assert that these entities are "commercial enterprises that use a distinct legal form and engage
in commercial activities and that receive the bulk of their income from sales and fees" (WB
2014). Even if SOEs' definition provided in the Glossary of Key Terms is based only on two
key elements identified in the academic literature, legal form and activity (commercial), they
created through their toolkit "Corporate Governance of State-Owned Enterprises" (WB 2014),
an overview which comprise mostly all issues identified in the first section of this research:
areas in which SOEs operate, their importance and role in economies, ownership and control
issues. This guideline focuses on commercial SOEs at the national level in which the
government has significant control through full, majority, or substantial minority ownership.
World Bank concludes that these discrepancies caused by different visions of the countries
hamper advancing a generally accepted definition of SOEs.
One conclusion of the study is that the concept of ownership is crucial when defining SOEs.
Ownership implies the responsibility for actions regarding the entity, whose rights are usually
protected by the law. Also, market and non-market-oriented activities are concepts used by
international and professional organizations in defining SOEs. Discussing another significant
key element, the notion of control, we identified two approaches analysed among international
and professional organizations:
Policy control – from a statistical perspective, a government exercises control under a
corporation if the government can determine the general corporate policy;
Financial control – from an accounting standpoint, a government controls a company if
it has the power to manage its financial and operating policies to benefit from its
activities.

88
ITEMA 2020
Conference Proceedings
Another conclusion of the study conducted is that international and professional organisations
approached the SOE issue from governmental, accounting, or statistical perspectives,
providing restrictive definitions based on key elements as ownership, control, and activity
(market orientation). OECD, EC, and IPSASB define SOEs using key elements as control and
ownership while IMF and UN, activity and ownership. Even if we identified some common
approaches between academicians and international and professional organisations, some
delicate areas require substantial clarifications.
CONCLUSION
Based on the definitions presented above, we can conclude that SOEs are public entities
controlled directly or indirectly by the government with a mixture of commercial and public
policy objectives. SOEs have an adapted legal form, operate in commercial affairs, reach for
the achievement of public policy objectives and financial goals.
Even though they are the same companies totally or partially owned by the state, the
terminology used differs between countries. There are several different approaches to what
types of entities are covered by SOE's definition. The biggest challenge for professional bodies
is to find a unique definition to match the need of practitioners and capture the complexity of
SOEs.
Overall, the international and professional organisations approach the SOE topic from
governance, accounting, or statistical perspectives, based on key elements like ownership,
control, market orientation. OECD, EC, and IPSASB define SOEs using key elements as
control and ownership while IMF and UN, activity and ownership. Although we have identified
some common approaches between international and professional organisations, some delicate
areas require laborious efforts for clarifications considering the objective of each organisation.
The biggest challenge for professional bodies is finding a unique definition to match all three
main areas of interest.
So, we conclude that a definition is necessary. As we saw, significant national professional
bodies consider it essential to use a definition, to present the characteristics and provide a
guideline for SOE recognition. Emerging countries need to have clearly established boundaries
of their financial statements. Most of the time, they do not have the necessary resources as
professional bodies, qualified personnel to fulfil their obligations as regulators.
REFERENCES
Christiansen, H. (2011), “The Size and Composition of the SOE Sector in OECD Countries”,
OECD Corporate Governance Working Papers, No. 5, OECD Publishing.
European Commission (2012), “EUROSTAT Foreign Affiliates Statistics Recommendation
Material, Luxemburg, pp.32.
European Commission (2010) European system of accounts. Luxemburg.
International Monetary Fund (2014), “Government Finance Statistics Manual”, Washington,
p. 32.
IPSASB (2012), Handbook of International Public Sector Accounting Pronouncements- Vol
I,II, New York, available at: http://www2.ifac.org/publications-resources/2011-
handbook-international-public-sector-accounting-pronouncements
IPSASB (2014), Responses to GBEs Consultation Paper, New York, available at:
http://www2.ifac.org/system/files/meetings/files/GBE%20%20responses.pdf

89
THE ROLE OF INTERNATIONAL AND PROFESSIONAL ORGANISATIONS’ IN DEFINING STATE-
OWNED ENTERPRISES
Kloviene, R., Gimzauskiene, E. (2014), “Performance measurement model formation in state-
owned enterprises”, Procedia Social and Behavioral Sciences, 156, pp. 954-598.
OECD (2005), Corporate governance of state-owned enterprises: A survey of OECD countries,
Paris, OECD.
OECD (2014) OECD guidelines on corporate governance of state-owned enterprises – draft
for public comment, OECD, Paris
Papenfuss, U., Schmidt, C. (2015), “Determinants of manager pay in German state-owned
enterprises and international public policy implications: 3-years study for sectors,
performance and gender”, working paper, University of Leipzig, available at:
http://hdl.handle.net/10419/107708, (accessed 10 April 2015).
United Nations Statistics Division (2008) System of national accounts. New York
United Nations Statistics Division (2008), System of National Accounts, New York
World Bank (2014) Corporate governance of state-owned enterprises – a toolkit. WB,
Washington, DC
World Trade Organisation (1994) The general agreement on tariffs and trade. WTO, Geneva


91
TESTING THE EMPIRICS OF WEAK FORM OF EFFICIENT
MARKET HYPOTHESIS: EVIDENCE FROM LAC REGION
MARKETS
Hortense Santos1
Rui Dias2
Paula Heliodoro3
Paulo Alexandre4
DOI: https://doi.org/10.31410/ITEMA.2020.91
Abstract: The new coronavirus disease (Covid-19) evolved quickly from a regional health
outbreak to a global collapse, stopping the global economy in a unprecedented way, creating
uncertainty and chaos in the financial markets. Based on these events, it is intended in this
paper to test the persistence of profitability in the financial markets of Argentina, Brazil, Chile,
Colombia, Peru and Mexico, in the period between January 2018 to July 2020. In order to
perform this analysis where undertaken different approaches in order to analyze if: (i) the
financial markets of Latin America are efficient in their weak-form during the global pandemic
(Covid-19)? ii) If so, the persistent long memories cause risks between these regional markets?
The results suggest that the returns don’t follow the i.i.d. hypothesis, from dimension 2,
reinforcing the idea that returns of stock indexes have a non-linear nature or a significant non-
linear component, exception made to the Argentina market, which was expected in virtue of the
Ljung-Box (with the return squares) test results, and ARCH-LM. Corroborating the exponents
Detrended Fluctuation Analysis (DFA), indicate the presence of persistent long memories,
namely into the following markets: Colombia (0.72), Chile (0.66), Brazil (0.58) and Peru
(0.57). The Argentina market does not reject the random walk hypothesis, while the Mexican
market suggests some anti-persistence (0.41). This situation has implications for investors,
once that some returns can be expected, creating arbitration opportunities and abnormal
income, contrary to the supposed from the random walk hypothesis and information efficiency.
The t-test results of the heteroscedasticity form the two samples suggest that there is no risk
transmission between these regional markets, with the exception to the BOVESPA / BOLSAA
MX markets, that is, the existence of persistent long memories in the returns does not imply the
risk transmission between markets. These finds allow the creation of strategies of
diversification inefficient portfolios. These conclusions also open space for the market
regulators to implement measures that guarantee a better informational information of these
regional markets.
Keywords: Covid-19, LAC region, Long memories, Arbitration.
1 Escola Superior de Ciências Empresarias – Instituto Politécnico de Setúbal, Portugal 2 Escola Superior de Ciências Empresarias - Instituto Politécnico de Setúbal, Portugal & CEFAGE,
Universidade de Évora, Portugal 3 Escola Superior de Ciências Empresarias – Instituto Politécnico de Setúbal, Portugal 4 Escola Superior de Ciências Empresarias – Instituto Politécnico de Setúbal, Portugal

92
ITEMA 2020
Conference Proceedings
1. INTRODUCTION
The Covid-19 global pandemic affects negatively global trade, as well as social and cultural
life, namely the tourism, trade in goods, production and sectors like transportation. The fast
spread of the coronavirus (COVID-19) has dramatic impacts in the financial markets all over
their world, causing significant loses to the investors in a very short period. Aligned with all
this negative effects, it seems inevitable that the stock exchanges, economic growth and
exchange rates have also been affected in equal matter (Liu, Manzoor, Wang, Zhang and
Manzoor, 2020).
The subject of hypothesis of efficiency in the markets, shows if the actual price of the active
reflects all the available information, in a certain moment, and price adjusts quickly, as new
and unforeseen information gets to the market. The mean reversion hypothesis, also known as
negative series correlation, has been interpreted; it has an efficient correlation mechanism in
developed markets, and, a sign of speculative bubble in the financial emerging markets
(Summers, 1986; Fama and French, 1988).
This investigation will test the persistence and risk of the financial markets of Argentina,
Brazil, Chile, Colombia, Peru and Mexico, in the period between January 2018 to July 2020.
The results suggest that the returns don’t follow the i.i.d. hypothesis, from dimension 2,
reinforcing the idea that returns of stock indexes have a non-linear nature or a significant non-
linear component, exception made to the Argentina market. In order to validate the persistence,
the exponents Detrended Fluctuation Analysis (DFA), indicate the presence of persistent long
memories, namely in the following markets: Colombia (0.72), Chile (0.66), Brazil (0.58) and
Peru (0.57). The Argentina market does not reject the random walk hypothesis, while the
Mexican markets suggest some anti-persistence (0.41). This situation has implications for
investors, once that some returns can be expected, creating arbitration opportunities and
abnormal income, contrary to the supposed from the random walk hypothesis and information
efficiency. The t-test results of the heteroscedasticity from the two samples suggest that there
is no risk transmission between these regional markets, except for the BOVESPA / BOLSAA
MX markets, that is, the existence of persistent long memories in the returns does not imply
the risk transmission between markets.
These investigations present two contributions to the existing literature. The first contribution
is regarding the study of efficiency, in its weak form, and risk transmission in the financial
markets of Latin America, in the context of global pandemic (Covid-19). As far as we know
some studies analyze the impact of the global pandemic in the financial markets (Ali, Alam,
and Rizvi, 2020; Corbet, Larkin, and Lucey, 2020; He, Liu, Wang, and Yu, 2020; Sansa, 2020),
however the approach was essentially distinct from the followed in this paper. The second
contribution is related to the preference in these regional emerging markets; after the financial
crisis of 2008 these regional markets became an important investment destination. In this
context and having in mind that the large capital inflows are of a great importance to understand
the persistence of returns and risk transmission between Latin-American markets, in order to
provide international investors knowledge, they can implement efficient diversification
strategies.
In terms of structure this paper is organized into 5 sections. In Section 2 is presented the
literature review in concern of articles about the efficiency of market, in its weak form. Section
3 describes methodology and data. Section 4 presents the results. Section 5 concludes.

93
TESTING THE EMPIRICS OF WEAK FORM OF EFFICIENT MARKET HYPOTHESIS: EVIDENCE
FROM LAC REGION MARKETS
2. LITERATURE REVIEW
Several works have been approaching the matter of efficiency of the markets, analyzing the
profitability predictability hypothesis through the analysis of average reversal patterns, inspired
in the semi-final works of Poterba and Summers (1988) and Fama and French (1988), in which
they documented reversion to the average in the stock markets, in periods above one year.
According to the authors Malafeyev, Awasthi, S.Kambekar, and Kupinskaya (2019) when the
random walk hypothesis and informational efficiency are rejected it cause extreme movements
in stock prices. The occurrence of these phenomena can, eventually, decrease the
implementation of diversification strategies of efficient portfolios.
The authors Nisar and Hanif (2012) analyzed the stock markets of India, Pakistan, Bangladesh
and Sri Lanka, and evidence (in) market efficiency, in its weak form. Mehla and Goyal (2013)
suggest that the Indian market does not show the characteristics of random walk and as such is
not efficient in its weak form. El Khamlichi et al. (2014) show that Islamic indices have the
same level of (in) efficiency as benchmarks, but MSCI and FTSE indices are less inefficient.
Righi and Ceretta (2011), Sierra Suárez, Duarte Duarte and Mascareñas Pérez-Iñigo (2013),
Worthington and Higgs (2013), Duarte and Mascareñas Pérez-Iñigo (2014), Ruiz-Porras and
Ruiz-Robles (2015) tested market efficiency in its weak form in Latin America. Righi and
Ceretta (2011) analyzed the S&P500, Ibovespa, Merval and IPC indexes, showing that these
regional markets are efficient in their weak form, except for the U.S. market. Sierra Suárez,
Duarte Duarte and Mascareñas Pérez-Iñigo (2013) studied the Colombian market, showing
hybrid results, that is, the assets show signs of chaotic behavior in ascending periods and
random in descending periods. While the authors Worthington and Higgs (2013) examined the
financial markets of Argentina, Brazil, Chile, Colombia, México, Peru, e Venezuela,
suggesting that the efficient market hypothesis is rejected. Duarte and Mascareñas Pérez-Iñigo
(2014) analyzed the main financial markets in Latin America. The authors show that the five
main Latin American economies have undergone a change from non-efficiency to efficiency
in recent years, according to, the following chronological order: México (2007), Brazil (2008),
Colombia (2008), Chile (2011) e Peru (2012). Ruiz-Porras and Ruiz-Robles (2015) analyzed
the Mexican stock market, suggesting that the stock market is (in) efficient in its weak form,
and this efficiency has declined since 2007.
Andrianto and Mirza (2016), Hamid, Suleman, Ali Shah, and Imdad Akash (2017), Singh and
Kumar (2018) examined efficiency of markets, in their weak form, in Asian markets. Andrianto
and Mirza (2016) show that Indonesia´s stock market is efficient in its weak form, suggesting
that the daily movement of the stock prince is random, and does not present autocorrelation.
Hamid, Suleman, Ali Shah, and Imdad Akash (2017) analyzed the markets of Pakistan, India,
Sri Lanka, China, Korea, Hong Kong, Indonesia, Malaysia, Philippines, Singapore, Thailand,
Taiwan, Japan, e Australia. The authors show that prices do not follow the random walk
hypothesis. Singh and Kumar (2018) show that the Kuala Lumpur Stock Exchange shows signs
of (in) efficiency in its weak form. Given this evidence, investors can benefit from the
arbitration process by achieving anomalous profitability without incurring additional risk.
Aggarwal (2018), Rehman, Chhapra, Kashif, and Rehan (2018), Karasiński (2020) tested the
persistence of profitability in various financial markets. Aggarwal (2018) analyzed the
efficiency and market and the persistence of the South Korean stock market (KOSPI), and
suggests that the time series do not follow a process of random walk. Rehman, Chhapra, Kashif,
and Rehan (2018) show that the stock indexes of Pakistan, India and Bangladesh are not

94
ITEMA 2020
Conference Proceedings
efficient in their weak form. While author Karasiński (2020) examined efficiency in its weak
form in European markets and shows that overall efficiency tended to improve after the global
financial crisis of 2008.
In summary, this work aims to contribute to the provision of information to investors and
regulators in Latin American stock markets, where individual and institutional investors seek
diversification benefits, as well as to help promote the implementation of policies that
contribute to the efficiency of these markets in this period of global pandemic (Covid-19).
3. METHODOLOGY
DATA
Data on the closing prices of the financial markets in Argentina, Brazil, Chile, Colombia, Peru,
and Mexico were obtained from the Thomson Reuters platform. The quotations are daily and
between the period from January2, 2018 to July 21, 2020, having been partitioned into two sub
periods before and during Covid-19. Quotes are in local currency to mitigate distortions in
exchange rates.
Table 1. The name of countries and their indices used in this paper
Index Country
BOLSAA MX Mexico
BVLAC Peru
COLCAP Colombia
IBOVESPA Brazil
IPSA Chile
MERVAL Argentina
Source: Own elaboration
METHODOLOGY
The development of the research took place along several stages. The characterization of the
sample used was performed through descriptive statistics, the Adherence Test of Jarque and
Bera (1980). To answer the first question of investigation, we tested the persistence of
profitability through the tests: Ljung-Box (with the squares of profitability); ARCH-LM
(Engle, 1982) and BDS (Brock and De Lima, 1996). In order to validate the results of the
persistence of profitability we will use the Detrended Fluctuation Analysis (DFA). DFA is an
analysis method that examines temporal dependence on non-stationary data series. This
technique by assuming that time series are non-stationary avoids spurious results when the
analysis focuses on the relationships of data series in the long term. The DFA model allows to
examine the behavior of financial series, having the following interpretation: anti persistent
series; series features 0 < 𝛼 < 0,5𝛼 = 0,5random walk; 0,5 < 𝛼 < 1persistent series. To
answer the second question of investigation, that is, if the generalized increase in correlations
had statistical significance, the heteroscedasticity t-test of two samples from Forbes and
Rigobon (2002) will be applied. This type of correlations requires transformation through
fisher's method. This test will show the results on the existence or not of risk transmission
among the financial markets of the LAC Region, in the context of global pandemic (Covid-
19).

95
TESTING THE EMPIRICS OF WEAK FORM OF EFFICIENT MARKET HYPOTHESIS: EVIDENCE
FROM LAC REGION MARKETS
4. RESULTS
Figure 1 shows the evolution of the markets, at levels of the financial markets of Latin America,
in the period from January 2, 2018 to July 21, 2020, being the same as the period of great
complexity, due to the global pandemic outbreak (Covid-19). Index prices index clearly reveal
the instability experienced in these markets in January, February, March and April 2020.
Figure 1. Evolution, in levels, of the 6 financial markets, in the full period
Source: Own elaboration
Table 2 shows the main descriptive statistics of the six financial markets in Latin America,
referring to the full sample period. The average is positive in the stock indexes of Mexico
(BOLSAA MX), Brazil, (IBOVESPA), and Argentina (MERVAL), except in the markets of
Peru (BVLAC), Colombia (COLCAP), and Chile (IPSA). The Argentina market has the
highest standard deviation (0.0351). The results obtained show that the series of profitability
propose removals from the hypothesis of normality. This result arises through the Jarque and
Bera test (1980) that allowed to reject the null hypothesis of normality (H0) in favor of the
alternative (H1 - non-normality), for a significance level of 1%. Additionally, the coefficients
of asymmetry and kurtosis are statistically different from those of a normal distribution, being
the same leptokurtic and asymmetric.
Table 2. Descriptive statistics, in profitability, of the 6 financial markets in Latin America in
the full period BOLSAA MX BVLAC COLCAP IBOVESPA IPSA MERVAL
Mean 0.000437 -0.000202 -0.000387 0.000463 -0.000478 0.000795
Std. Dev. 0.022153 0.010505 0.015441 0.020328 0.014879 0.035148
Skewness 0.922157 -2.418776 -2.190409 -1.587049 -2.287239 -4.231528
Kurtosis 16.68369 26.17456 42.93431 20.61187 31.90027 57.53034
Jarque-Bera 5012.373*** 14735.48*** 42433.19*** 8419.984*** 22509.65*** 80062.89***
Observations 631 631 631 631 631 631
Source: Own elaboration

96
ITEMA 2020
Conference Proceedings
Table 3 shows the results of unit root tests, with structure breaks, by Clemente et al. (1998),
suggesting marked structural breakdowns in January, February and April 2020, in a complex
period of the global pandemic (covid-19). The Argentina market shows that the most
significant structural collapse occurred in July 2019. This model identifies the most significant
structure breakdown, which means that there may be smaller, structure breaks in the period
January 2018 to July 2020. The results are in line with the findings of the authors Lahmiri and
Bekiros (2020), Sansa (2020), He, Liu, Wang, and Yu (2020), which show sharp declines in
financial markets resulting from the global pandemic (Covid-19).
Table 3. Unit root tests, with structural breakdowns, referring to the financial markets of
Latin America, in the full period Index t-stat Break Date
BOLSAA MX -29.09(0) *** 27/04/2020
BVLAC -26.50(0) *** 03/04/2020
COLCAP -21.98(0) *** 22/01/2020
IBOVESPA -31.21(0) *** 23/03/2020
IPSA -26.67(0) *** 30/03/2020
MERVAL -30.75(0) *** 31/07/2019 Note: Lag Length (Automatic Length based on SIC). Break Selection: Minimize Dickey-Fuller t-statistic. The lateral values in parentheses
refer to lags. ***. **. *. represent significance at 1%. 5% and 10%. respectively.
Source: Own elaboration.
In order to verify the existence of persistent profitability in the financial markets of Latin
America, we will estimate the following methodologies: Ljung-Box (with the squares of
profitability); ARCH-LM (Engle, 1982) and BDS (Brock and De Lima, 1996). Table 4 shows
the Ljung-Box test results, applied to index yield rates, as well as squared yields. We performed
in a first phase, and for lags 4 and 12, the Ljung-Box test and we verify as we increase the lags
the autocorrelation becomes more persistent. To validate results, we used the same model, with
the profitability squared, also for lags 4 and 12, and we proved that the autocorrelation becomes
more persistent; the exception to these results is verified in the Argentina market (MERVAL)
that indicates balance or anti-persistence.
Table 4. Results of Ljung-Box tests applied to time series waste for Latin American markets
in the full period
BOLSAA MX BVLAC COLCAP IBOVESPA IPSA MERVAL
LB (4) 15.889*** 13.837*** 67.198*** 25.328*** 31.968*** 5.7256
LB (12) 74.395*** 54.230*** 82.955*** 81.623*** 49.439*** 16.115
LB2 (4) 149.60*** 181.90*** 166.99*** 693.50*** 216.03*** 2.2472
LB2 (12) 345.38*** 225.81*** 437.24*** 951.86*** 327.15*** 4.1862
Note: The asterisk ***, ** represent significance at 1% and 5%, respectively.
Source: Own elaboration.
To analyze the presence of the phenomenon of conditional heteroscedasticity in financial
series, it is customary to use the Lagrange Multiplier test (ARCH-LM test) (Engle, 1982). The
ARCH-LM tests were applied to residues of first-order self-regressive processes and, for lag
10. Table 5 shows that the residues of the self-regressive processes of the financial markets
under analysis exhibit conditioned heteroscedasticity, corroborating this characteristic
frequently present in financial assets. The Ljung-Box tests, applied to the square of the
profitability (table 4), for these lags 4 and 12, prove the evidence of the ARCH-LM test,
reinforcing the evidence of the presence of ARCH effects in the time series. The markets of
Brazil (IBOVESPA) and Mexico show more significant heteroscedasticity, while Colombia
(COLCAP) and Chile the signal is less pronounced. The Argentina market (MERVAL) shows
that the data series has no ARCH effects.

97
TESTING THE EMPIRICS OF WEAK FORM OF EFFICIENT MARKET HYPOTHESIS: EVIDENCE
FROM LAC REGION MARKETS
Table 5. ARCH-LM test for waste applied to time waste series for Latin America markets in
full period BOLSAA MX BVLAC COLCAP IBOVESPA IPSA MERVAL
ARCH LM (10 lags) 126.1958*** 36.26859*** 14.24187*** 306.5358*** 5.409216** 2.289060
Note: The LM test was applied to the residues of a first-order self-regressive process of each series. Asterisk***, ** represent significance at 1% and 5%, respectively.
Source: Own elaboration.
Table 6 shows the BDS test results, and we can verify that the chances that the yields are i.i.d.
is rejected, with statistical significance, from dimension 2, reinforcing the idea that the
profitability of stock indices have a nonlinear nature or have a significant nonlinear component,
except for the Argentina market, which was expected due to the results of the Ljung-Box (with
the squares of profitability) and ARCH-LM tests. According to author Taylor (1986) the
significant presence of greater autocorrelation between the squares of profitability than among
the original values of profitability is also an indication of the presence of nonlinearity. Table 4
shows the results of the autocorrelation tests of the squares of the profitability, for lags 4 and
12 and all indexes reject the null hypothesis, identifying autocorrelation in series, except for
the Argentina market. The results of the autocorrelation tests are totally coincident with those
obtained by the BDS test. The rejection of the null hypothesis, i.i.d., can be explained, among
other factors, by the existence of autocorrelation or by the existence of heteroscedasticity in the
series of scholarship indices, cases in which the rejection of the null hypothesis is explained by
nonlinear dependence on the data. These results are in line with studies by the authors
Pernagallo and Torrisi (2019) that show the existence of persistence in the profitability of
financial markets.
Table 6. BDS test applied to time series waste, referring to Latin America markets in the full
period BOLSAA MX BVLAC COLCAP IBOVESPA IPSA MERVAL
Dimension (2) 6.5566*** 6.0448*** 3.9619*** 9.0055*** 8.3832*** -0.04015
Dimension (3) 6.9686*** 7.7242*** 6.8186*** 9.4047*** 11.5163*** -0.05405
Dimension (4) 7.0610*** 8.7397*** 8.9511*** 9.2726*** 13.3075*** -0.06481
Dimension (5) 7.1258*** 9.3107*** 10.3755*** 9.3957*** 14.6851*** -0.07403
Dimension (6) 7.1959*** 9.6764*** 11.3864*** 9.9429*** 15.9209*** -0.08228 Notes: The method considered in the BDS test was the pair fraction, for a value of 0. 7. The first column concerns the size of the dive
(embedding dimension). The values shown in the table refer to the z-Statistic, ** represent significance at 1% and 5%, respectively.
Source: Own elaboration
Table 7 shows the results of the exponents α DFA, and we found that the Latin American
markets indicate persistence in profitability, i.e. the presence of sharp long memories,
particularly in the markets of Colombia (0.72), Chile (0.66), Brazil (0.58) and Peru (0.57). The
Argentina market does not reject the random walk hypothesis, while the Mexican market
suggests anti persistence (0.41). These findings show that prices do not fully reflect the
information available and that price changes are not i.i.d. This situation has implications for
investors, since some returns can be expected, creating opportunities for arbitrage and
abnormal income, contrary to what is supposed by the assumptions of random walk and
informational efficiency. These results are mostly corroborated by the Ljung-Box tests (with
the squares of profitability); ARCH-LM (Engle, 1982) and BDS (Brock and De Lima, 1996)
that show persistence in profitability.
Table 7. DFA exponent for return. The hypotheses are 𝐻0: α = 0.5 and 𝐻1: α ≠ 0.5
Index DFA exponent (Covid-19)
BOLSAA MX 0.41 ≌ 0.0238

98
ITEMA 2020
Conference Proceedings
BVLAC 0.57 ≌ 0.0239
COLCAP 0.72 ≌ 0.0014
IBOVESPA 0.58 ≌ 0.0224
IPSA 0.66 ≌ 0.0030
MERVAL 0.52 ≌ 0.0052
Note: The values of the linear adjustments for αDFA always had 𝑅2 > 0.99
Source: Own elaboration.
In order to analyze the risk transmission among the financial markets of the LAC Region, non-
conditional correlations were estimated, and the statistical significance was examined. One way
to test the statistical significance of the correlation coefficient is to resort to 𝑡 statistics, which
follows the distribution 𝑡, with 𝑛 −2 degrees of freedom, in which r is the correlation
coefficient between two series and 𝑛 is the number of observations. To test whether the matrix
of correlation coefficients is globally different from the identity matrix, we use the
verisimilitude ratio test, suggested by Pindyck and Rotemberg (1990).
Table 8 shows the non-conditional correlation coefficients of the statistics for the Pre-Covid
sub period, and we can verify the existence of non-significant correlation coefficients
(BVLAC-IBOVESPA; BVLAC-MERVAL), negative correlation coefficients (BOLSAA MX-
IPSA; IBOVESPA-IPSA; IPSA-MERVAL). Additionally, we can also verify that the positive
correlation coefficients are not high.
Table 8. Non-conditional correlation coefficients, pre-covid-19 period BOLSAA MX BVLAC COLCAP IBOVESPA IPSA MERVAL
BOLSAA MX ###
BVLAC 0.134108*** ###
COLCAP 0.119942** 0.578708*** ###
IBOVESPA 0.234242*** 0.021255 0.160407*** ###
IPSA -0.100876** 0.439219*** 0.132402*** -0.545241*** ###
MERVAL 0.165000*** -0.069380 0.144528*** 0.583039*** -0.203724*** ###
Note: Asterisks ***, ** represent significance at 1% and 5%, respectively.
Source: Own elaboration
Table 9 shows the non-conditional correlation coefficients in the Covid-19 period, and we can
see that the market pairs BOLSAA MX-COLCAP, BOLSAA MX- IPSA, BVLAC- MERVAL,
COLCAP- MERVAL, IPSA-MERVAL present negative correlation coefficients (in 15
possible). In addition, we can also see the increase in correlations when compared to the
previous period.
Table 9. Non-conditional correlation coefficients, Covid-19 period BOLSAA MX BVLAC COLCAP IBOVESPA IPSA MERVAL
BOLSAA MX ###
BVLAC 0.179370*** ###
COLCAP -0.216833*** 0.697127*** ###
IBOVESPA 0.069303 0.672792*** 0.746810*** ###
IPSA -0.218262*** 0.730612*** 0.808306*** 0.796805*** ###
MERVAL 0.271763*** -0.408585*** -0.079134 0.168842** -0.167217** ### Note: Asterisks ***, ** represent significance at 1% and 5%, respectively.
Source: Own elaboration
Table 10 shows the results of risk transmission between Latin American markets through the
t-test of heteroscedasticity of two samples of Forbes and Rigobon (2002) between the Pre-
Covid and Covid sub periods. The results suggest that there is no risk transmission between

99
TESTING THE EMPIRICS OF WEAK FORM OF EFFICIENT MARKET HYPOTHESIS: EVIDENCE
FROM LAC REGION MARKETS
these regional markets, except for BOVESPA / BOLSAA MX markets, i.e. the existence of
persistence of profitability, and long memories do not imply the transmission of risk between
markets. These results open doors to the existence of possibilities for diversification of efficient
portfolios.
Table 10. Results of risk transmission, between Pre / Covid-19 sub-period
Markets t-Statistic Results Markets t-Statistic Results
MERVAL / BOVESPA -0.34 Nonexistent BOL.MX / BOVESPA 0.23 Nonexistent
MERVAL / IPSA -1.25 Nonexistent BOL.MX / IPSA -0.90 Nonexistent
MERVAL / BVLAC -2.59 Nonexistent BOL.MX / BVLAC -2.66 Nonexistent
MERVAL / COLCAP -2.46 Nonexistent BOL.MX / COLCAP -2.64 Nonexistent
MERVAL / BOL.MX -0.62 Nonexistent BOL.MX / MERVAL -0.09 Nonexistent
BOVESPA / MERVAL 1.21 Nonexistent IPSA / MERVAL 0.96 Nonexistent
BOVESPA / IPSA 0.35 Nonexistent IPSA / BOVESPA 1.06 Nonexistent
BOVESPA / BVLAC -0.61 Nonexistent IPSA / BVLAC -0.67 Nonexistent
BOVESPA / COLCAP -0.28 Nonexistent IPSA / COLCAP -0.38 Nonexistent
BOVESPA / BOL.MX 1.42* Existent IPSA / BOL.MX 1.11 Nonexistent
BVLAC / MERVAL 1.14 Nonexistent COLCAP / MERVAL 0.91 Nonexistent
BVLAC / BOVESPA 1.23 Nonexistent COLCAP / BOVESPA 1.02 Nonexistent
BVLAC / IPSA 0.42 Nonexistent COLCAP / BVLAC -0.72 Nonexistent
BVLAC / COLCAP -0.18 Nonexistent COLCAP / IPSA 0.21 Nonexistent
BVLAC / BOL.MX 1.30 Nonexistent COLCAP / BOL.MX 1.06 Nonexistent
Notes: Critical values correspond to a one-tailed significance on the right, 2.7638 (1%), 1.8125 (5%) and 1.3722 (10%). ***, **, * indicate significant results at 1%, 5% and 10%, respectively.
Source: Own elaboration
5. CONCLUSION
The general conclusion to be retained and, supported by the results obtained, through the tests
carried out with econometric and econophysical models demonstrates that the global pandemic
has a significant impact on the memory properties of the indices of the financial markets in
Latin, America. We believe that the profitability does not follow the hypothesis i.i.d., from
dimension 2, reinforcing the idea that the yields of stock indices have a nonlinear nature or
have a significant nonlinear component, with the exception made to the Argentina market,
which was expected due to the results of the Ljung-Box (with the squares of profitability) and
ARCH-LM tests. Corroborating the exponents of Detrended Fluctuation Analysis (DFA), it
indicates the presence of long memories. These findings show that prices do not fully reflect
the information available and that price changes are not i.i.d. This situation has implications
for investors, since some returns can be expected, creating opportunities for arbitrage and
abnormal income, contrary to what is supposed by the assumptions of random walk and
informational efficiency. The results of the t-test of heteroscedasticity of two samples suggest
that there is no risk transmission between these regional markets, except for BOVESPA /
BOLSAA MX markets, i.e. the existence of persistence of profitability, and long memories do
not imply the transmission of risk between markets. These findings allow the implementation
of strategies for diversification of efficient portfolios. These findings also make room for

100
ITEMA 2020
Conference Proceedings
market regulators to take steps to ensure better informational information in these regional
markets.
REFERENCES
Aggarwal, D. (2018). Random walk model and asymmetric effect in Korean composite stock
price index. Afro-Asian J. of Finance and Accounting.
https://doi.org/10.1504/aajfa.2018.10009906
Ali, M., Alam, N., & Rizvi, S. A. R. (2020). Coronavirus (COVID-19) — An epidemic or
pandemic for financial markets. Journal of Behavioral and Experimental Finance.
https://doi.org/10.1016/j.jbef.2020.100341
Andrianto, Y., & Mirza, A. R. (2016). A Testing of Efficient Markets Hypothesis in Indonesia
Stock Market. Procedia - Social and Behavioral Sciences.
https://doi.org/10.1016/j.sbspro.2016.04.048
Brock, W. A., & de Lima, P. J. F. (1996). 11 Nonlinear time series, complexity theory, and
finance. In Handbook of Statistics (Vol. 14, pp. 317–361). https://doi.org/10.1016/S0169-
7161(96)14013-X
Clemente, J., Montañés, A., & Reyes, M. (1998). Testing for a unit root in variables with a
double change in the mean. Economics Letters, 59(2), 175–182.
https://doi.org/10.1016/S0165-1765(98)00052-4
Corbet, S., Larkin, C. J., & Lucey, B. M. (2020). The Contagion Effects of the COVID-19
Pandemic: Evidence from Gold and Cryptocurrencies. SSRN Electronic Journal.
https://doi.org/10.2139/ssrn.3564443
Duarte Duarte, J. B., & Mascareñas Pérez-Iñigo, J. M. (2014). Comprobación de la eficiencia
débil en los principales mercados financieros latinoamericanos. Estudios Gerenciales.
https://doi.org/10.1016/j.estger.2014.05.005
El Khamlichi, A., Sarkar, K., Arouri, M., & Teulon, F. (2014). Are Islamic equity indices more
efficient than their conventional counterparts? Evidence from major global index
families. Journal of Applied Business Research.
https://doi.org/10.19030/jabr.v30i4.8660
Engle, R. F. (1982). Autoregressive Conditional Heteroscedasticity with Estimates of the
Variance of United Kingdom Inflation. Econometrica, 50(4), 987.
https://doi.org/10.2307/1912773
Fama, E. F., & French, K. R. (1988). Dividend yields and expected stock returns. Journal of
Financial Economics. https://doi.org/10.1016/0304-405X(88)90020-7
Forbes, K. J., & Rigobon, R. (2002). No Contagion, Only Interdependence: Measuring Stock
Market Comovements. The Journal of Finance, 57(5), 2223–2261.
https://doi.org/10.2307/3094510
Hamid, K., Suleman, M. T., Ali Shah, S. Z., & Imdad Akash, R. S. (2017). Testing the Weak
Form of Efficient Market Hypothesis: Empirical Evidence from Asia-Pacific Markets.
SSRN Electronic Journal. https://doi.org/10.2139/ssrn.2912908
He, Q., Liu, J., Wang, S., & Yu, J. (2020). The impact of COVID-19 on stock markets.
Economic and Political Studies. https://doi.org/10.1080/20954816.2020.1757570
Jarque, C. M., & Bera, A. K. (1980). Efficient tests for normality, homoscedasticity and serial
independence of regression residuals. Economics Letters, 6(3), 255–259.
https://doi.org/10.1016/0165-1765(80)90024-5
Karasiński, J. (2020). The Changing Efficiency of the European Stock Markets. Annales
Universitatis Mariae Curie-Skłodowska, Sectio H – Oeconomia.
https://doi.org/10.17951/h.2020.54.1.41-51
Lahmiri, S., & Bekiros, S. (2020). The impact of COVID-19 pandemic upon stability and

101
TESTING THE EMPIRICS OF WEAK FORM OF EFFICIENT MARKET HYPOTHESIS: EVIDENCE
FROM LAC REGION MARKETS
sequential irregularity of equity and cryptocurrency markets. Chaos, Solitons and
Fractals. https://doi.org/10.1016/j.chaos.2020.109936
Lawrence H. Summers. (1986). Does the stock market rationally reflect fundamental values.
The Journal of Finance. https://doi.org/10.2307/2328487
Liu, H., Manzoor, A., Wang, C., Zhang, L., & Manzoor, Z. (2020). The COVID-19 outbreak
and affected countries stock markets response. International Journal of Environmental
Research and Public Health. https://doi.org/10.3390/ijerph17082800
Malafeyev, O., Awasthi, A., S.Kambekar, K., & Kupinskaya, A. (2019). Random Walks and
Market Efficiency in Chinese and Indian Equity Markets. Statistics, Optimization &
Information Computing. https://doi.org/10.19139/soic.v7i1.499
Mehla, S., & Goyal, S. K. (2013). Empirical Evidence on Weak Form of Efficiency in Indian
Stock Market. Asia-Pacific Journal of Management Research and Innovation.
https://doi.org/10.1177/2319510x1200800107
Nisar, S., & Hanif, M. (2012). Testing weak form of efficient market hypothesis: Empirical
evidence from South-Asia. World Applied Sciences Journal.
Pernagallo, G., & Torrisi, B. (2019). An empirical analysis on the degree of Gaussianity and
long memory of financial returns in emerging economies. Physica A: Statistical
Mechanics and Its Applications. https://doi.org/10.1016/j.physa.2019.121296
Pindyck, R. S., & Rotemberg, J. J. (1990). Do Stock Prices Move Together Too Much?
National Bureau of Economic Research Working Paper Series, No. 3324.
Poterba, J. M., & Summers, L. H. (1988). Mean reversion in stock prices. Evidence and
Implications. Journal of Financial Economics. https://doi.org/10.1016/0304-
405X(88)90021-9
Rehman, S., Chhapra, I. U., Kashif, M., & Rehan, R. (2018). Are Stock Prices a Random Walk?
An Empirical Evidence of Asian Stock Markets. ETIKONOMI.
https://doi.org/10.15408/etk.v17i2.7102
Righi, M. B., & Ceretta, P. S. (2011). Random walk and variance ratio tests for efficiency in
the sub-prime crisis: Evidence for the U.S. and latin markets. International Research
Journal of Finance and Economics.
Ruiz-Porras, A., & Ruiz-Robles, B. (2015). La hipótesis de eficiencia y la modelación de series
bursátiles mexicanas: un análisis multivariado. Economía Informa.
https://doi.org/10.1016/s0185-0849(15)30003-7
Sansa, N. A. (2020). The Impact of the COVID-19 on the Financial Markets: Evidence from
China and USA. SSRN Electronic Journal. https://doi.org/10.2139/ssrn.3567901
Sierra Suárez, K. J., Duarte Duarte, J. B., & Mascareñas Pérez-Iñigo, J. M. (2013).
COMPROBACIÓN DEL COMPORTAMIENTO CAÓTICO EN BOLSA DE
VALORES DE COLOMBIA. Revista Estrategia Organizacional.
https://doi.org/10.22490/25392786.1480
Singh, D. S. K., & Kumar, L. (2018). Market Efficiency in Malaysia: An Empirical Study of
Random Walk Hypothesis of Kuala Lumpur Stock Market (Composite Index) Bursa
Malaysia. SSRN Electronic Journal. https://doi.org/10.2139/ssrn.3095176
Taylor, S. J. (1986). Modelling Financial Time Series. In Wiley New York.
Worthington, A. C., & Higgs, H. (2013). Tests of random walks and market efficiency in Latin
American stock markets: An empirical note. Pathogens and Global Health.
https://doi.org/10.1179/204777213X13869290853977


103
THE IMPACT OF THE COVID-19 ON THE FINANCIAL MARKETS:
EVIDENCE FROM G7
Paula Heliodoro1
Rui Dias2
Paulo Alexandre3
Maria Manuel4
DOI: https://doi.org/10.31410/ITEMA.2020.103
Abstract: This essay aims to analyse the impact of the 2020 global pandemic on the stock
indexes of France (CAC 40), Germany (DAX 30), USA (DOW JONES), United Kingdom (FTSE
100), Italy (FTSE MID), Japan (Nikkei 225) and Canada (TSX 300), from January 2018 to
June 2020, with the sample being divided into two sub periods: first sub period from January
2018 to August 2019 (Pre-Covid); second period from September 2019 to June 2020 (Covid-
19). In order to carry out this analysis, different approaches were taken in order to analyse
whether: (i) the global pandemic (Covid-19) increased the persistence of the G7 financial
markets? In the Pre-Covid period, we can verify the presence of long memories in the
Canadian market (TSX), while the markets in France (CAC 40) and Italy (FTSE MID) show
signs of balance, since the random walk hypothesis was not rejected. The German (DAX 30),
USA (DJI), United Kingdom (FTSE 100) and Japan (NIKKEI 225) markets have anti-
persistence (0 <α <0.5). In period II, the Covid-19-time scale is contained, and we verified
the presence of significant long memories, except for the US stock index (0.49). These findings
make it possible to show that the assumption of the market efficiency hypothesis may be called
into question, because these markets are predictable, which validate the research question.
The results of the pDCCA correlation coefficients, in the Pre-Covid period, show 14 pairs of
median markets (0.333 → ≌ 0.666). We can also see 7 pairs of markets with strong correlation
coefficients (0.666 → ≌ 1,000), showing that these markets have a tendency towards
integration, this evidence may call into question the hypothesis of portfolio diversification. In
period II (Covid-19) the λ_DCCA correlation coefficients have 7 strong market pairs (0.666
→ ≌ 1,000), 5 pairs have weak pDCCA coefficient (0.000 → ≌ 0.333), 5 market pairs show
anti-correlation (-1.000 → ≌ 0.000), and 4 market pairs show median coefficients (pDCCA)
(0.333 → ≌ 0.666) (out of 21 possible). When compared to the previous subperiod, we found
that the majority of the pDCCAs decreased, which shows that the markets have decreased their
integration, making it possible to diversify portfolios in certain markets, especially in the
Japanese market (NIKKEI 225). These conclusions open space for market regulators to take
measures to ensure better informational information, in the stock markets, in the 7 most
advanced economies in the world.
Keywords: Covid-19, G7, Persistence, Long memories, Arbitration.
1 Escola Superior de Ciências Empresarias, Instituto Politécnico de Setúbal, Portugal 2 Escola Superior de Ciências Empresarias, Instituto Politécnico de Setúbal, Portugal & CEFAGE,
Universidade de Évora, Portugal 3 Escola Superior de Ciências Empresarias, Instituto Politécnico de Setúbal, Portugal 4 Escola Superior de Ciências Empresarias - Instituto Politécnico de Setúbal, Portugal

104
ITEMA 2020
Conference Proceedings
1. INTRODUCTION
The efficient market hypothesis (HME) argues that bond prices reflect all available information
and that investors cannot obtain anomalous returns by trading based on this information (Fama,
1970). HME is an essential concept for financial institutions, individual and institutional
investors, and government regulators. An investor's investment strategy is greatly influenced
by market efficiency. Market efficiency also determines the regulatory measures to be
developed to ensure the development and organized management of a country's markets
(Dsouza and Mallikarjunappa, 2015; Shirvani and Delcoure, 2016).
The huge amount of data caught the attention of the audience of academics. Statistical
physicists began to analyse financial data, creating an interdisciplinary research area called
Econophysics (Gallegati, 2016; Pereira, da Silva and Pereira, 2017).
In this work, we will test the persistence of the profitability of the G7 financial markets, having
the sample been divided into two sub-periods: Pre-Covid and Covid. To answer the research
question, we will use the DFA methodology and the DCCA cross-correlation coefficient, to
analyse the dependency pattern between the various indices under analysis. First, the objective
is to assess the degree of efficiency of these indices; the individual analysis can provide
information on the profitability of this type of investment. As we will use a sliding window
approach, we can also assess how this efficiency has evolved over time. Second, with the
pDCCA, we want to assess how these markets relate to each other. This can be important, as it
can analyse the correlation between the indices and reveal the existence (or not) of connections
between the markets, which could also be important for existing and potential investors. The
results suggest that the global pandemic (Covid-19) has increased the persistence of
profitability in the G7 financial markets, which could jeopardize efficiency, in its weak form.
Additionally, we verified that the pDCCA correlation coefficients decreased in this period of
the pandemic, that is, the level of integration has slowed down, making it possible to diversify
portfolios in certain markets, mainly in the Japan market (NIKKEI 225).
This investigation adds contributions to the literature, specifically testing the fractal analysis in
the G7 markets, that is, assessing the presence of long memories, in the context of the pandemic
of the COVID-19 outbreak. As far as we know, this is the first study to analyse these financial
markets in isolation. However, there are recent studies that have analysed the diversification
of risk and the impact of the global pandemic, namely the authors Liu, Manzoor, Wang, Zhang
and Manzoor (2020), Zeren and Hizarci (2020). However, the approach was quite different
from that followed in this essay.
In terms of structure, this essay is organized in 5 sections. Section 2 presents a literature review
on the hypothesis of an efficient market in international financial markets. Section 3 describes
the methodology and data. Section 4 contains the results. Section 5 concludes.
2. LITERATURE REVISION
Different studies have addressed the issue of market efficiency, analysing the hypothesis of
predictability of returns, through the analysis of patterns of reversion to the average of stock
prices, inspired by the seminal works of Poterba and Summers (1988), Fama and French
(1988), who documented the reversal to the average in the returns of the stock markets, over
time horizons of more than one year.

105
THE IMPACT OF THE COVID-19 ON THE FINANCIAL MARKETS: EVIDENCE FROM G7
This theme has motivated other studies to analyse the implications in the hypothesis of
efficiency of the markets, according to which the current price of the assets reflects all the
available information, in a given moment, and the price adjusts quickly, as new and unforeseen
information is reaching the market. The mean reversion hypothesis, also known as negative
series correlation, has been interpreted as an efficient correction mechanism in developed
markets and a sign of a speculative bubble in emerging financial markets (Lawrence H.
Summers, 1986; Fama and French, 1988)
Ayentimi, Mensah, and Naa-Idar (2013), Dourado and Tabak (2014), Robinson (2016), Ngene,
Tah, and Darrat (2017 tested the random walk hypothesis in the stock markets. Ayentimi,
Mensah, and Naa-Idar (2013) examined the efficiency of companies listed on the Ghana Stock
Exchange (GSE). The authors suggest that the market is inefficient and recommend that
transaction costs be reduced in order to improve market activities (GSE). Dourado and Tabak
(2014) evaluated the efficiency of the São Paulo stock exchange, from January 1995 to
December 2012. The authors show that the RWH hypothesis cannot be rejected, showing signs
of efficiency. Robinson (2016) investigated the Jamaica Stock Exchange (JSE), evidencing that
the random walk hypothesis was rejected. Ngene, Tah, and Darrat (2017) examined 18
emerging markets in the presence of multiple, unforeseen and successive structural breaks.
Random walk hypothesis is rejected. However, when using double-level change tests on the
average and due tolerance to various structural breaks is made, the results are consistent with
the random walk hypothesis in most markets.
Hamid, Suleman, Ali Shah and Imdad Akash (2017), Awan and Subayyal (2018), Fernando
and Gunasekara (2018), Chaker and Sabah (2018) tested market efficiency, in its weak form,
in the stock markets. Hamid, Suleman, Ali Shah and Imdad Akash (2017) show that the
financial markets of Pakistan, India, Sri Lanka, China, Korea, Hong Kong, Indonesia,
Malaysia, Philippines, Singapore, Thailand, Taiwan, Japan and Australia, do not follow the
random walk hypothesis. Awan and Subayyal (2018) analysed the stock exchanges of Oman,
United Arab Emirates, Kuwait, Saudi Arabia, Bahrain and Qatar, and show that these markets
show signs of (in) efficiency, in their weak form. Fernando and Gunasekara (2018) show that
the ASPI index (All Share Price Index) of the CSE market, shows signs of (in) efficiency, in
its weak form, although the market efficiency is mostly dynamic. Chaker and Sabah (2018)
tested efficiency in the GCCC, United Arab Emirates, Saudi Arabia, Oman, Kuwait and
Bahrain markets, except in Qatar. The results suggest that none of the five stock markets follow
the random walk hypothesis.
Mphoeng (2019), Pernagallo and Torrisi (2019), Malafeyev, Awasthi, S. Kambekar, and
Kupinskaya (2019), tested efficiency, in its weak form, and tested whether markets are
predictable. Mphoeng (2019) tested the efficient market hypothesis in the Botswana stock
market, showing that the random walk hypothesis was rejected, which maintains that the
market is inefficient in the analysed period. Pernagallo and Torrisi (2019) analysed whether
the behaviour of the daily returns of the stock market indexes of 12 emerging economies
corroborates the hypothesis of “fat tails” and whether these series show long memory. Hurst's
exponents range from 0.51 to 0.62 showing significant long memories. Malafeyev, Awasthi,
S. Kambekar, and Kupinskaya (2019) show that the stock markets of China and India do not
show efficiency, in their weak form, in the first three periods (1996 to 2015).
Tebyaniyan, Jahanshad, and Heidarpoor (2020), Karasiński (2020), Aslam, Mohti, and Ferreira
(2020) tested the presence of long-term memories in the financial markets. Tebyaniyan,
Jahanshad, and Heidarpoor (2020) analysed the share prices of companies on the Tehran stock

106
ITEMA 2020
Conference Proceedings
exchange. The test results indicate that stock prices have a multifractal property, and have long
memories, which implies market inefficiency, in its weak form. Karasiński (2020) examined
the efficiency of European stock markets; the results show a partial rejection of the random
walk hypothesis, noting that, in the long run, the efficiency of European stock markets tends to
improve in the post-2008 financial crisis. Aslam, Mohti, and Ferreira (2020) assessed how the
coronavirus pandemic (Covid-19) affects the memory properties of 8 European stock
exchanges, with five-minute data. The authors show that the Spanish stock market remains the
most efficient, while the least efficient is that of Austria. The Belgium, Italy and Germany
markets show 0.5 results.
3. METHODOLOGY
DATA
Closing price data on the stock indices of France (CAC 40), Germany (DAX 30), USA (DOW
JONES), United Kingdom (FTSE 100), Italy (FTSE MID), Japan (Nikkei 225) and Canada
(TSX 300), were obtained from the Thomson Reuters platform. The quotations are daily and
cover the period from January 3, 2018 to June 1, 2020, with the sample being divided into two
sub periods: first sub period from January 2018 to August 2019 (Pre-Covid); second period
from September 2019 to June 2020 (Covid-19). Quotations are in local currency, to mitigate
exchange rate distortions.
Table 1. The name of countries and their indices used in this paper
Country Index
France CAC 40
Germany DAX 30
USA DOW JONES
United Kingdom FTSE 100
Italy FTSE MID
Japan NIKKEI 225
Canada TSX 300
Source: Own elaboration
METHODOLOGY
The development of the research took place over several stages. In order to answer the research
question, we will use the methodology Detrended Fluctuation Analysis (DFA), and Detrended
Cross-Correlation Analysis (pDCCA). DFA is an analysis method that examines time
dependency on non-stationary data series. This technique, assuming that the time series are
non-stationary, avoids spurious results when the analysis focuses on the relationships of the
data series in the long run. The DFA has the following interpretation: 0 <α <0.5: anti-persistent
series; α = 0.5 series has a random walk; 0.5 <α <1 persistent series. The function of this
technique is to examine the relationship between the x_k and x_ (k + t) values at different times
(Guedes et al., 2018). Zebende's (2011) trendless cross correlation coefficient (pDCCA) is a
method for quantifying the level of cross correlation between two non-stationary time series.
The coefficient is based on the DFA (Peng et al., 1994) and DCCA (Podobnik and Stanley,
2008) methods. The cross-correlation coefficient depends on the length of the box s (time
scale). One of the advantages of this cross-correlation coefficient is centred on the possibility
of measuring the correlations between two non-stationary time series at different time scales.
The function of this technique is to examine the relationship between the x_k and x_ (k + t)

107
THE IMPACT OF THE COVID-19 ON THE FINANCIAL MARKETS: EVIDENCE FROM G7
values at different times (Ferreira, Dionísio, Guedes and Zebende, 2018). Tables 2 and 3 show
the interpretation of the exponents α_DFA and pDCCA.
Table 2. Detrended Fluctuation Analysis αDFA
Exponent Type of signal
αDFA < 0.5 long-range anti-persistent
αDFA ≃ 0.5 uncorrelated, white noise
αDFA > 0.5 long-range persistent
Source: Own elaboration
Table 3. Detrended cross-correlation coefficient, 𝑝𝐷𝐶𝐶𝐴, levels
Weak Medium Strong
≌ 0.000 → ≌ 0.333 ≌ 0.333 → ≌ 0.666 ≌ 0.666 → ≌ 1.000
Source: Own elaboration
4. RESULTS
Figure 1 shows the evolution of the markets, in terms of profitability, of the G7. The sample
comprises the time lapse from January 2018 to June 2020, being a period of considerable
complexity, due to understanding the outbreak of the global pandemic (COVID-19). Yields
clearly reveal volatility in February, March and April 2020.
Figure 1. Evolution, in profitability, of the G7 financial markets, in the period of 03/01/2018
to 01/06/2020
-0,15 -0,10 -0,05 0,00 0,05 0,10
-0,20
-0,15
-0,10
-0,05
0,00
0,05
0,10
0,15
DAX 30
DJI
FTSE 100
FTSE MID
Nikkei 225
TSX 300
Source: Own elaboration
Table 4 shows the main descriptive statistics for the G7 financial markets. The analysis of
descriptive statistics allows us to ascertain that profitability shows negative daily averages,
except for the US market (DJI). Asymmetries are negative in the 7 markets, especially in the
Italian market (FTSE MID). Short-circuits are above 3, which shows signs of deviation from
the hypothesis of normality, with a greater incidence in Italy (FTSE MID). Additionally, the
asymmetry and kurtosis coefficients are statistically different from those of a normal
distribution.

108
ITEMA 2020
Conference Proceedings
Table 4. Descriptive statistics on returns, of the G7 financial markets, in the period of
03/01/2018 to 01/06/2020
Index N Mean Standard
Deviation Skewness Kurtosis Minimum Maximum
CAC 40 615 -1.78E-04 0.01368 -1.92015 19.68111 -0.13098 0.08056
DAX 30 615 -1.92E-04 0.01416 -1.21737 18.98176 -0.13055 0.10414
DJI 615 8.36E-06 0.01623 -0.95021 18.16517 -0.13842 0.10764
FTSE 100 615 -3.59E-04 0.01232 -1.56484 19.83532 -0.11512 0.08667
FTSE MID 615 -2.92E-04 0.0158 -3.22624 37.12553 -0.18541 0.08549
NIKKEI
225 615 -3.39E-04 0.01179 -0.62377 6.87018 -0.07391 0.06879
TSX 300 615 -1.12E-04 0.01374 -1.96528 37.4476 -0.13176 0.11294
Source: Own elaboration
Table 5 shows the DFA exponents referring to the stock market indices of the G7 markets. The
period I comprises the Pre-Covid time scale and we can verify the presence of long memories
in the Canada market (TSX), while the markets in France (CAC 40), and Italy (FTSE MID)
show signs of balance, since the random walk hypothesis was not rejected. The German (DAX
30), USA (DJI), United Kingdom (FTSE 100) and Japan (NIKKEI 225) markets have anti-
persistence (0 <α <0.5). In period II, the Covid-19-time scale is contained, and we verified the
presence of significant long memories, except for the US stock index (0.49). These findings
make it possible to show that the assumption of the market efficiency hypothesis may be called
into question, since the forecast of market movement can be improved if the lagged movements
of the other markets are considered, allowing arbitrage operations to occur. These results are
in line with the findings of the authors Tebyaniyan, Jahanshad, and Heidarpoor (2020),
Karasiński (2020), Aslam, Mohti, and Ferreira (2020).
Table 5. DFA exponent for index and return. The values of the linear adjustments for α DFA
always had R2 > 0.99.
Stock market DFA exponent (before crisis) DFA exponent (crisis period)
CAC 40 0.50 ≌ 0,0009 0.64 ≌ 0.0031
DAX 30 0.47 ≌ 0.0036 0.64 ≌ 0.0041
DJI 0.46 ≌ 0.0016 0.49 ≌ 0.0054
FTSE 100 0.47 ≌ 0.0010 0.55 ≌ 0.0064
FTSE MID 0.52 ≌ 0.0340 0.66 ≌ 0.0088
NIKKEI 225 0.49 ≌ 0.0033 0.64 ≌ 0.0031
TSX 300 0.56 ≌ 0.0012 0.54 ≌ 0.0272
Source: Own elaboration. Note: The hypotheses are 𝐻0: α = 0.5 and 𝐻1: α ≠ 0.5.
Table 6 shows the Detrended cross-correlation coefficient pDCCA for the period from 02
January 2018 to 30 August 2019 (Pre-Covid-19). The G7 financial markets have 14 median
cross-correlation coefficients without trend (λ_DCCA) median (0.333 → ≌ 0.666) (out of 21
possible). We can also see 7 pairs of markets showing strong correlation coefficients (0.666
→ ≌ 1,000). These findings show that these markets have marked levels of integration, which
may jeopardize efficient portfolio diversification.

109
THE IMPACT OF THE COVID-19 ON THE FINANCIAL MARKETS: EVIDENCE FROM G7
Table 6. Summary table of the pDCCA coefficients peaks, in the G7 financial markets, in
the sub period 01/02/2018 to 08/30/2019 (Pre-Covid-19)
Index λDCCA Time scale (days) Trend
CAC 40 - DAX 30 0.75 n > 92 days Strong correlation
CAC 40 - DJI 0.58 n > 92 days Mean correlation
CAC 40 - FTSE 100 0.71 n > 63 days Strong correlation
CAC 40 - FTSE MID 0.68 n > 76 days Strong correlation
CAC 40 - NIKKEI 225 0.41 n > 92 days Mean correlation
CAC 40 - TSX 300 0.56 n > 76 days Mean correlation
DAX 30 - DJI 0.65 n > 76 days Mean correlation
DAX 30 - FTSE 100 0.77 n > 76 days Strong correlation
DAX 30 - FTSE MID 0.66 n > 63 days Mean correlation
DAX 30 - NIKKEI 225 0.42 n > 92 days Mean correlation
DAX 30 - TSX 0.68 n > 76 days Strong correlation
DJI - FTSE 100 0.58 n > 76 days Mean correlation
DJI - FTSE MID 0.46 n > 63 days Mean correlation
DJI - NIKKEI 225 0.51 n > 92 days Mean correlation
DJI - TSX 300 0.77 n > 92 days Strong correlation
FTSE 100 - FTSE MID 0.59 n > 63 days Mean correlation
FTSE 100 - NIKKEI 225 0.44 n > 92 days Mean correlation
FTSE 100 - TSX 0.67 n > 92 days Strong correlation
FTSE MID - NIKKEI 225 0.36 n > 76 days Mean correlation
FTSE MID - TSX 300 0.52 n > 43 days Mean correlation
NIKKEI 225 - TSX 300 0.49 n > 92 days Mean correlation
Source: Own elaboration
Table 7 shows the Detrended cross-correlation coefficient pDCCA for the period from
September 2, 2019 to June 1, 2020 (Covid-19). The G7 financial markets have 7 pairs of strong
markets (0.666 → ≌ 1,000), 5 pairs have a weak coefficient pDCCA (0.000 → ≌ 0.333), 5
pairs of markets show anti-correlation (-1000 → 000 0.000), and 4 pairs of markets show
median (λ_DCCA) coefficients (0.333 → ≌ 0.666) (out of 21 possible). When compared to the
previous subperiod, we find that the pDCCAs have mostly decreased, which shows that the
markets have decreased their integration, making it possible to diversify portfolios in certain
markets, namely in the Japanese market (NIKKEI 225).
Table 7. Summary table of pDCCA coefficients peaks, in the G7 financial markets, in the
subperiod 02/09/2019 to 01/06/2020 (Covid-19)
Index λDCCA Time scale (days) Trend
CAC 40 - DAX 30 0.18 n > 43 days Weak correlation
CAC 40 - DJI 0.24 n > 43 days Weak correlation
CAC 40 - FTSE 100 0.58 n > 43 days Mean correlation
CAC 40 - FTSE MID 0.31 n > 43 days Weak correlation
CAC 40 - NIKKEI 225 0.07 n > 29 days Weak correlation
CAC 40 - TSX 300 0.31 n > 43 days Weak correlation
DAX 30 - DJI 0.86 n > 43 days Strong correlation
DAX 30 - FTSE 100 0.59 n > 43 days Mean correlation

110
ITEMA 2020
Conference Proceedings
DAX 30 - FTSE MID 0.85 n > 43 days Strong correlation
DAX 30 - NIKKEI 225 -0.33 n > 43 days Anti correlation
DAX 30 – TSX 300 0.88 n > 43 days Strong correlation
DJI - FTSE 100 0.57 n > 43 days Mean correlation
DJI - FTSE MID 0.77 n > 43 days Strong correlation
DJI - NIKKEI 225 -0.31 n > 43 days Anti correlation
DJI - TSX 300 0.93 n > 29 days Strong correlation
FTSE 100 - FTSE MID 0.67 n > 43 days Strong correlation
FTSE 100 - NIKKEI 225 -0.13 n > 43 days Anti correlation
FTSE 100 – TSX 300 0.62 n > 43 days Mean correlation
FTSE MID - NIKKEI 225 -0.24 n > 29 days Anti correlation
FTSE MID - TSX 300 0.77 n > 35 days Strong correlation
NIKKEI 225 - TSX 300 -0.20 n > 24 days Anti correlation
Source: Own elaboration
5. CONCLUSION
The general conclusion to be retained and sustained by the results obtained, through tests
carried out with econophysical models, show that the global pandemic has a significant impact
on the adjustment of the analysed financial markets. The results indicate that the G7 markets
show significant persistence during the Covid period, which causes some arbitrage
opportunities. Additionally, Detrended cross-correlation coefficient pDCCA decreased in the
Covid period when compared to the previous subperiod, which improves the possibilities for
portfolio diversification. These conclusions also open space for market regulators to take
measures to ensure better informational information among international financial markets. In
conclusion, we believe that investors should diversify their portfolios, and invest in less risky
markets, in order to mitigate risk and improve the efficiency of their portfolios.
REFERENCES
Aslam, F., Mohti, W., & Ferreira, P. (2020). Evidence of Intraday Multifractality in European
Stock Markets during the Recent Coronavirus (COVID-19) Outbreak. International
Journal of Financial Studies. https://doi.org/10.3390/ijfs8020031
Awan, U., & Subayyal, M. (2018). Weak Form Efficient Market Hypothesis Study: Evidence
from Gulf Stock Markets. SSRN Electronic Journal.
https://doi.org/10.2139/ssrn.2787816
Ayentimi, D., Mensah, A., & Naa-Idar, F. (2013). Stock market efficiency of Ghana stock
exchange: An objective analysis. International Journal of Management, Economics and
Social Sciences (IJMESS).
Chaker, M. N., & Sabah, A. (2018). Testing the weak form of efficiency of the stock markets
in Gulf Cooperation Council countries. Journal for Global Business Advancement.
https://doi.org/10.1504/JGBA.2018.096334
Dourado, G. de A., & Tabak, B. M. (2014). Testing the adaptive markets hypothesis for Brazil.
Brazilian Review of Finance.
Dsouza, J. J., & Mallikarjunappa, T. (2015). Does the Indian Stock Market Exhibit Random
Walk? Paradigm. https://doi.org/10.1177/0971890715585197
Fama, E. F. (1970). Efficient Capital Markets: A Review of Theory and Empirical Work. The
Journal of Finance. https://doi.org/10.2307/2325486
Fama, E. F., & French, K. R. (1988). Dividend yields and expected stock returns. Journal of

111
THE IMPACT OF THE COVID-19 ON THE FINANCIAL MARKETS: EVIDENCE FROM G7
Financial Economics. https://doi.org/10.1016/0304-405X(88)90020-7
Fernando, P. N. D., & Gunasekara, A. L. (2018). Is the Market Efficiency Static or Dynamic –
Evidence from Colombo Stock Exchange (CSE). Kelaniya Journal of Management.
https://doi.org/10.4038/kjm.v7i1.7551
Ferreira, P., Dionísio, A., Guedes, E. F., & Zebende, G. F. (2018). A sliding windows approach
to analyse the evolution of bank shares in the European Union. Physica A: Statistical
Mechanics and Its Applications, 490, 1355–1367.
https://doi.org/10.1016/j.physa.2017.08.095
Gallegati, M. (2016). Beyond econophysics (not to mention mainstream economics). European
Physical Journal: Special Topics. https://doi.org/10.1140/epjst/e2016-60105-6
Guedes, E. F., Brito, A. A., Oliveira Filho, F. M., Fernandez, B. F., de Castro, A. P. N., da
Silva Filho, A. M., & Zebende, G. F. (2018). Statistical test for ΔρDCCA: Methods and
data. Data in Brief. https://doi.org/10.1016/j.dib.2018.03.080
Hamid, K., Suleman, M. T., Ali Shah, S. Z., & Imdad Akash, R. S. (2017). Testing the Weak
Form of Efficient Market Hypothesis: Empirical Evidence from Asia-Pacific Markets.
SSRN Electronic Journal. https://doi.org/10.2139/ssrn.2912908
Karasiński, J. (2020). The Changing Efficiency of the European Stock Markets. Annales
Universitatis Mariae Curie-Skłodowska, Sectio H – Oeconomia.
https://doi.org/10.17951/h.2020.54.1.41-51
Lawrence H. Summers. (1986). Does the stock market rationally reflect fundamental values.
The Journal of Finance. https://doi.org/10.2307/2328487
Liu, H., Manzoor, A., Wang, C., Zhang, L., & Manzoor, Z. (2020). The COVID-19 outbreak
and affected countries stock markets response. International Journal of Environmental
Research and Public Health. https://doi.org/10.3390/ijerph17082800
Malafeyev, O., Awasthi, A., S.Kambekar, K., & Kupinskaya, A. (2019). Random Walks and
Market Efficiency in Chinese and Indian Equity Markets. Statistics, Optimization &
Information Computing. https://doi.org/10.19139/soic.v7i1.499
Mphoeng, M. (2019). Testing for Weak-Form Market Efficiency in the Botswana Stock
Market. Archives of Business Research. https://doi.org/10.14738/abr.79.6640
Ngene, G., Tah, K. A., & Darrat, A. F. (2017). The random-walk hypothesis revisited: new
evidence on multiple structural breaks in emerging markets. Macroeconomics and
Finance in Emerging Market Economies.
https://doi.org/10.1080/17520843.2016.1210189
Peng, C. K., Buldyrev, S. V., Havlin, S., Simons, M., Stanley, H. E., & Goldberger, A. L.
(1994). Mosaic organization of DNA nucleotides. Physical Review E, 49(2), 1685–1689.
https://doi.org/10.1103/PhysRevE.49.1685
Pernagallo, G., & Torrisi, B. (2019). An empirical analysis on the degree of Gaussianity and
long memory of financial returns in emerging economies. Physica A: Statistical
Mechanics and Its Applications. https://doi.org/10.1016/j.physa.2019.121296
Podobnik, B., & Stanley, H. E. (2008). Detrended cross-correlation analysis: A new method
for analyzing two nonstationary time series. Physical Review Letters, 100(8).
https://doi.org/10.1103/PhysRevLett.100.084102
Poterba, J. M., & Summers, L. H. (1988). Mean reversion in stock prices. Evidence and
Implications. Journal of Financial Economics. https://doi.org/10.1016/0304-
405X(88)90021-9
Robinson, C. J. (2016). Stock Price Behaviour in Emerging Markets: Tests for Weak-Form
Efficiency on the Jamaica Stock Exchange. SSRN Electronic Journal.
https://doi.org/10.2139/ssrn.2845446
Tebyaniyan, H., Jahanshad, A., & Heidarpoor, F. (2020). Analysis of weak performance
hypothesis, multi-fractality feature and long-term memory of stock price in Tehran stock

112
ITEMA 2020
Conference Proceedings
exchange. International Journal of Nonlinear Analysis and Applications.
https://doi.org/10.22075/ijnaa.2020.4412
Zebende, G. F. (2011). DCCA cross-correlation coefficient: Quantifying level of cross-
correlation. Physica A: Statistical Mechanics and Its Applications, 390(4), 614–618.
https://doi.org/10.1016/j.physa.2010.10.022
Zeren, F., & Hizarci, A. (2020). The impact of Covid-19 coronavirus on stock markets:
evidence from selected countries. Muhasebe ve Finans İncelemeleri Dergisi.
https://doi.org/10.32951/mufider.706159

113
THE DOW JONES INDUSTRIAL AVERAGE (DJIA) STOCK MARKET
INDEX AND THE CHAOTIC GROWTH MODEL
Vesna Jablanovic1
DOI: https://doi.org/10.31410/ITEMA.2020.113
Abstract: The Dow Jones Industrial Average (DJIA) index includes the stocks of 30 of the
largest companies in the United States. It represents about a quarter of the value of the entire
U.S. stock market. The changes in the DJIA index are often considered to be representative of
the entire stock market. The basic aims of this paper are: firstly, to create the simple chaotic
the DJIA stock market index growth model that is capable of generating stable equilibria,
cycles, or chaos; secondly, to analyze the local stability of the DJIA index movements in the
period 1982-2009; and thirdly, to discover the equilibrium level of the DJIA index in the
observed period. This paper confirms the existence of the stable convergent fluctuations of the
DJIA index in the observed period. Also, the golden ratio can be used to define the equilibrium
level of the DJIA index in the presented chaotic model.
Keywords: DJIA index, Stability, Elliot waves, Chaos.
INTRODUCTION
he Dow Jones Industrial Average (DJIA) includes the stocks of 30 of the largest
companies in the United States. It is a price-weighted index. It represents about a quarter
of the value of the entire U.S. stock market. The changes in the index explain the entire
stock market dynamics. The Dow Jones Industrial Average (DJIA) was started on May 26,
1896 by Charles Dow, the editor of the Wall Street Journal and co-founder of Dow Jones &
Co. On May 26, 1896, the Dow Jones industrial average began measuring stocks (12). Further,
in 1928, the sum of the prices of the 30 stocks was divided by a special number called the
“divisor” rather than by 30. This index was still identified as an “average.” The Dow Jones
Industrial Average (DJIA) is now based on the prices of the stocks of 30 major U.S. companies.
The Dow Jones Industrial Average (DJIA) has following characteristics: (i) each company in
the index is weighted by the price of its stock; (ii) the companies in the index are not
representative of the market as a whole; (iii) the DJIA excludes dividend distributions; and (iv)
the DJIA has evolved to include large tech and financial-services players.
Chaos theory started with Lorenz's (1963) discovery of complex dynamics arising from three
nonlinear differential equations leading to turbulence in the weather system. Li and Yorke
(1975) discovered that the simple logistic curve can exhibit very complex behavior. Further,
May (1976) described chaos in population biology. Chaos theory has been applied in
economics by Benhabib and Day (1981,1982), Day (1982, 1983), Grandmont (1985), Goodwin
(1990), Medio (1993), Lorenz (1993), Jablanovic (2011, 2012, 2013, 2016), Puu, T. (2003),
Zhang W.B. (2006), etc.
1 University of Belgrade, Faculty of Agriculture, Nemanjina 6, 11081 Belgrade, Serbia
T

114
ITEMA 2020
Conference Proceedings
Figure 1. Interactive chart of the Dow Jones Industrial Average (DJIA) stock market index for the last
100 years. Historical data is inflation-adjusted using the headline CPI and each data point represents
the month-end closing value. The current month is updated on an hourly basis with today's latest
value. The current price of the Dow Jones Industrial Average as of July 02, 2020 is 25,827.36.
Source: http://www.macrotrends.net/1319/dow-jones-100-year-historical-chart
THE MODEL
The chaotic stock price and /or the Dow Jones Industrial Average (DJIA) growth model is
presented by the following equations:
D t = α - β Pt α > 0, > 0 (1)
S t= γ P t γ > 0 (2)
tt
t
tt SDP
PP
1 μ > 0 (3)
Where P t – stock price; S t – supply function of stock; D t – demand function for stock; μ -
the adjustment coefficient; α, - the coefficients of the stock demand function; γ - the
coefficient of the stock supply function.
(1) defines demand function for stock; (2) defines supply function of stock; (3) determines the
relation between stock price growth rate and surplus of demand for stock.
By substitution one derives:
Pt+1 = (1+μ α) Pt – μ (β+γ ) Pt2 α, β , μ , γ > 0 (4)
Further, it is assumed that the current value of the stock price is restricted by its maximal value
in its time series. This premise requires a modification of the growth law. Now, the stock price
growth rate depends on the current size of the stock price, P, relative to its maximal size in its
time series Pm. We introduce s as s = P/Pm. Thus s range between 0 and 1. Again we index s by
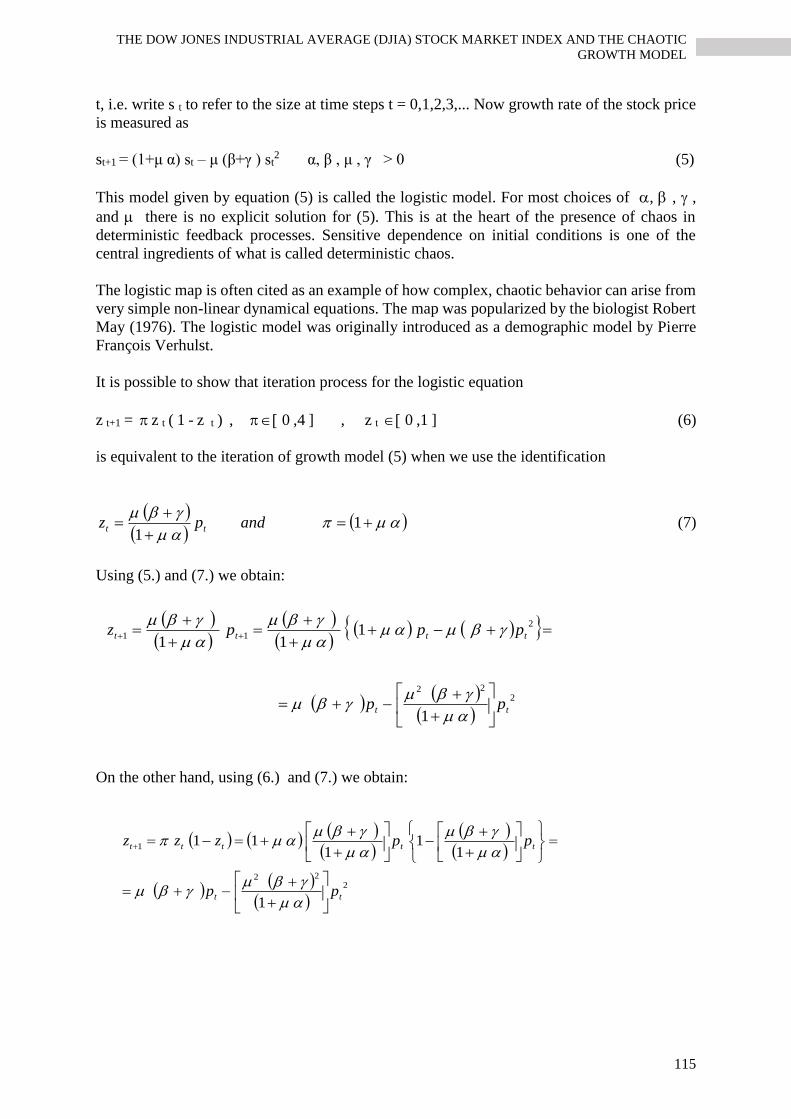
115
THE DOW JONES INDUSTRIAL AVERAGE (DJIA) STOCK MARKET INDEX AND THE CHAOTIC
GROWTH MODEL
t, i.e. write s t to refer to the size at time steps t = 0,1,2,3,... Now growth rate of the stock price
is measured as
st+1 = (1+μ α) st – μ (β+γ ) st2 α, β , μ , γ > 0 (5)
This model given by equation (5) is called the logistic model. For most choices of , , ,
and there is no explicit solution for (5). This is at the heart of the presence of chaos in
deterministic feedback processes. Sensitive dependence on initial conditions is one of the
central ingredients of what is called deterministic chaos.
The logistic map is often cited as an example of how complex, chaotic behavior can arise from
very simple non-linear dynamical equations. The map was popularized by the biologist Robert
May (1976). The logistic model was originally introduced as a demographic model by Pierre
François Verhulst.
It is possible to show that iteration process for the logistic equation
z t+1 = z t ( 1 - z t ) , 0 ,4 ] , z t 0 ,1 ] (6)
is equivalent to the iteration of growth model (5) when we use the identification
1
1andpz tt (7)
Using (5.) and (7.) we obtain:
On the other hand, using (6.) and (7.) we obtain:
2
22
2
11
1
111
tt
tttt
pp
pppz
2
22
1
1
11
111
tt
ttttt
pp
ppzzz

116
ITEMA 2020
Conference Proceedings
Thus, we have that iterating (5) is really the same as iterating (6) using (7). It is important
because the dynamic properties of the logistic equation (6) have been widely analyzed (Li and
Yorke (1975), May (1976)).
It is obtained that: (i) For parameter values 0 π 1 all solutions will converge to z = 0; (ii)
For 1 π 3,57 there exist fixed points the number of which depends on μ; (iii) For 1 π
2 all solutions monotonically increase to z = (π - 1 ) / π; (iv) For 2 π 3 fluctuations will
converge to z = (π - 1 ) / π; (v) For 3 π 4 all solutions will continuously fluctuate; (vi) For
3,57 π 4 the solution become "chaotic" which means that there exist totally aperiodic
solution or periodic solutions with a very large, complicated period. This means that the path
of zt fluctuates in an apparently random fashion over time, not settling down into any regular
pattern whatsoever. Also, for π= 2.6178 then fluctuations will converge to z=0.618.
The Fibonacci sequence, starting with zero and one, is created by adding the previous two
numbers (0, 1, 1, 2, 3, 5, 8, 13, 21, 34, 55, 89,144, 233, 377, …). This sequence is significant
because of the golden ratio. The ratio of any number in the Fibonacci sequence relative to the
number directly to its right is approximately 0.618. The Golden Ratio (golden mean, golden
number, golden proportion) is 0.618. Adding the number 1 to the Golden Ratio = Phi (Φ
=1.618). Both 0.618 and 1.618 are used interchangeably to represent the golden ratio because
they represent the same geometric relationship. (Lidwell, Holden, and Butler, 2010, p.114).
EMPIRICAL EVIDENCE
The main aim of this analysis is to present stock market index (DJIA) growth stability in the
period 1982-2009, by using the presented non-linear, logistic model (8) because stock market
index is computed from the prices of selected stocks.
In this sense,
st+1 = ω st – υ st2 ω, υ > 0 (8)
where s - stock market index, ω = π = (1+μ α) and υ= μ (β +γ)
Firstly, we transform data on stock market index from 0 to 1, according to our supposition that
actual value of stock market index, P, is restricted by its highest value in the time-series, Pm.
Further, we obtain time-series of s = P /Pm. Now, we estimate the model (8). Secondly, data on
the Dow Jones Industrial Average (DJIA) are transformed (Source:
http://www.macrotrends.net/1319/dow-jones-100-year-historical-chart) from 0 to 1, according
to our supposition that actual values of DJIA, P, is restricted by its highest value in the time-
series, Pm. Further, we obtain time-series of s =P /Pm (see Table 1). Also, the Fibonacci ratios
are associated to Elliott wave pattern.
It is supposed that the basic Elliott wave pattern exists in the period Jun 1982-March 2009.
This wave pattern consists of an impulse wave and a corrective wave. Impulse waves consist
of 5 waves and moves in the direction of the trend. Waves 1, 3, and 5 moves in the direction of
the trend, while Waves 2 and 4 move opposite to the trend. Corrective waves can be simple or
complex. A simple correction consists of 3 waves (Wave A, B and C) which retrace a portion
of impulse. The Elliot Wave Theory identifies (Frost A.J. & R.P. Prechter, 2006): (i) impulse
waves that set up a pattern; and (ii) corrective waves that oppose the larger trend. The stock
price movements are divided into: (i) trends (five waves in the direction of the main trend); and
(ii) corrections (three corrective waves) (see Fig.2.and Fig.3).
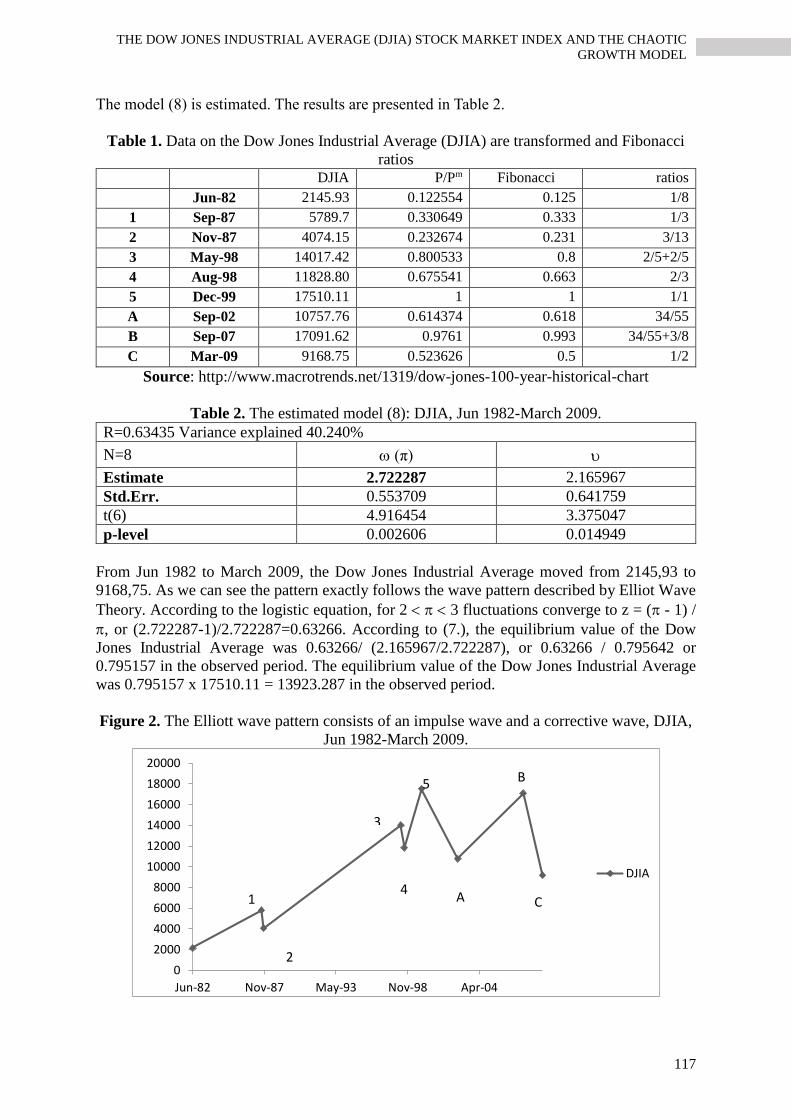
117
THE DOW JONES INDUSTRIAL AVERAGE (DJIA) STOCK MARKET INDEX AND THE CHAOTIC
GROWTH MODEL
The model (8) is estimated. The results are presented in Table 2.
Table 1. Data on the Dow Jones Industrial Average (DJIA) are transformed and Fibonacci
ratios
DJIA P/Pm Fibonacci ratios
Jun-82 2145.93 0.122554 0.125 1/8
1 Sep-87 5789.7 0.330649 0.333 1/3
2 Nov-87 4074.15 0.232674 0.231 3/13
3 May-98 14017.42 0.800533 0.8 2/5+2/5
4 Aug-98 11828.80 0.675541 0.663 2/3
5 Dec-99 17510.11 1 1 1/1
A Sep-02 10757.76 0.614374 0.618 34/55
B Sep-07 17091.62 0.9761 0.993 34/55+3/8
C Mar-09 9168.75 0.523626 0.5 1/2
Source: http://www.macrotrends.net/1319/dow-jones-100-year-historical-chart
Table 2. The estimated model (8): DJIA, Jun 1982-March 2009.
R=0.63435 Variance explained 40.240%
N=8 (π)
Estimate 2.722287 2.165967
Std.Err. 0.553709 0.641759
t(6) 4.916454 3.375047
p-level 0.002606 0.014949
From Jun 1982 to March 2009, the Dow Jones Industrial Average moved from 2145,93 to
9168,75. As we can see the pattern exactly follows the wave pattern described by Elliot Wave
Theory. According to the logistic equation, for 2 3 fluctuations converge to z = ( - 1) /
, or (2.722287-1)/2.722287=0.63266. According to (7.), the equilibrium value of the Dow
Jones Industrial Average was 0.63266/ (2.165967/2.722287), or 0.63266 / 0.795642 or
0.795157 in the observed period. The equilibrium value of the Dow Jones Industrial Average
was 0.795157 x 17510.11 = 13923.287 in the observed period.
Figure 2. The Elliott wave pattern consists of an impulse wave and a corrective wave, DJIA,
Jun 1982-March 2009.
0
2000
4000
6000
8000
10000
12000
14000
16000
18000
20000
Jun-82 Nov-87 May-93 Nov-98 Apr-04
DJIA
1
2
3
4
5
A
B
C

118
ITEMA 2020
Conference Proceedings
Figure 3. The Elliott wave pattern, Jun 1982- March 2009.
Source: http://www.macrotrends.net/1319/dow-jones-100-year-historical-chart
Further, the Elliott wave pattern, Jun 1982- March 2009. and Fibonacci ratios are shown in
Figure 4. The Fibonacci ratios are included in the model (8). The model is estimated (see Table
3).
Figure 4. The Elliott wave pattern, Jun 1982- March 2009. and Fibonacci ratios
Table 3. The estimated model (8.): DJIA, Jun 1982-March 2009. (with Fibonacci ratios)
R=0.63126 Variance explained 39.849%
N=8 (π)
Estimate 2.732233 2.177989
Std.Err. 0.554037 0.637897
t(6) 4.931498 3.414329
p-level 0.002626 0.014243
From Jun 1982 to March 2009, the Dow Jones Industrial Average (unit measure: the Fibonacci
ratios) moved from 0.125 to 0.5. As we can see the pattern exactly follows the wave pattern
2145.93
5789.7
4074.15
14017.42
11828.8
17510.11
10757.76
17091.62
9168.75
0
2000
4000
6000
8000
10000
12000
14000
16000
18000
20000
Jun-82 Nov-87 May-93 Nov-98 Apr-04
DJIA
0.125
0.333
0.231
0.8
0.663
1
0.618
0.993
0.5
0
0.2
0.4
0.6
0.8
1
1.2
Jun-82 Nov-87 May-93 Nov-98 Apr-04
The Fibbonacci ratios

119
THE DOW JONES INDUSTRIAL AVERAGE (DJIA) STOCK MARKET INDEX AND THE CHAOTIC
GROWTH MODEL
described by Elliot Wave Theory. According to the logistic equation, for 2 3 fluctuations
converge to z = ( - 1) / , or (2.732233-1)/2.732233=0.634. According to (7.), the equilibrium
value of the Dow Jones Industrial Average was 0.634/ (2.177989/2.732233), or 0.634 /
0.797146 or 0.79534 in the observed period. The equilibrium value of the Dow Jones Industrial
Average (unit measure: the Fibonacci ratios) was 0.79534 x 1 = 0.79534 in the observed period.
CONCLUSION
This paper suggests the use of the chaotic stock price growth model in predicting the
fluctuations of the stock price, or the Dow Jones Industrial Average (DJIA). The model (5) has
to rely on specified parameters α, β, γ, μ, and initial value of the stock price, and /or the Dow
Jones Industrial Average (DJIA), p0. But even slight deviations from the values of parameters:
α, β, γ, μ and initial value of the stock price and/or the Dow Jones Industrial Average (DJIA),
p0, show the difficulty of predicting a long-term stock price and/or DJIA.
A key hypothesis of this work is based on the idea that the coefficient π = (1+μ α) plays a
crucial role in explaining local stability of the stock price, and/or DJIA, where, μ is the
adjustment coefficient; α is the coefficient of the stock demand function. The estimated value
of the coefficient π is 2.722287. This result confirms continuous fluctuations of the stock price
and/or DJIA in the period 1982-2009. The equilibrium price of the Dow Jones Industrial
Average was 13923.287 in the observed period. Also, the Elliott wave pattern is observed. The
Fibonacci ratios are included in the model. The equilibrium value in the modified model was
0.79534, while the golden ratio is 0.618.
REFERENCES
Benhabib, J., & Day, R. H. (1981). Rational choice and erratic behaviour. Review of Economic
Studies, 48, 459-471.
Benhabib, J., & Day, R. H. (1982). Characterization of erratic dynamics in the overlapping
generation model. Journal of Economic Dynamics and Control, 4, 37-55.
Day, R. H. (1982). Irregular growth cycles. American Economic Review, 72, 406-414.
Day, R. H. (1983). The emergence of chaos from classical economic growth, Quarterly Journal
of Economics, 98, 200-213.
Frost A.J. & R.P. Prechter, (2006) Elliott Wave Principle: A Key to Market Behavior.
https://0104.nccdn.net/1_5/1d1/31d/37b/A.J.-Frost--Robert-Prechter---Elliott-Wave-
Principle.pdf
Goodwin, R. M. (1990). Chaotic economic dynamics. Oxford: Clarendon Press.
Grandmont, J. M. (1985). On endogenous competitive business cycle. Econometrica, 53, 994-
1045.
Jablanović V. (2011). A Chaotic Unemployment Rate Growth Model. Hyperion International
Journal of Econophysics &New Economy, Volume 4, Issue 1, 45-51.
Jablanović, V. (2012). Budget Deficit and Chaotic Economic Growth Models. Aracne editrice
S.r.l, Roma.
Jablanovic, V. (2013) Elements of Chaotic Microeconomics. Roma: Aracne editrice S.r.l.
Jablanovic, V. (2016) A Contribution to the Chaotic Economic Growth Theory. Roma: Aracne
editrice S.r.l .
Li, T., & Yorke, J. (1975) Period three implies chaos. American Mathematical Monthly, 8,
985-992.
Lidwell, W, Holden K., & J. Butler (2010) Universal Principles of Design, Revised and Updated,
Rockport Publishers, Inc.

120
ITEMA 2020
Conference Proceedings
Lorenz, E. N. (1963). Deterministic nonperiodic flow, Journal of Atmospheric Sciences, 20,
130-141.
Lorenz, H. W. (1993). Nonlinear dynamical economics and chaotic motion (2nd ed.).
Heidelberg: Springer-Verlag.
May, R. M. (1976). Mathematical models with very complicated dynamics. Nature, 261, 459-
467.
Medio, A. (1993). Chaotic dynamics: Theory and applications to economics. Cambridge:
Cambridge University Press.
Puu, T. (2003). Attractors, Bifurcations, and Chaos - Nonlinear Phenomena in Economics.
Springer.
Zhang W.B. (2012). Discrete Dynamical Systems, Bifurcations and Chaos in Economics,
Elsevier B.V.

121
RANDOM STRATEGY VERSUS TECHNICAL ANALYSIS STRATEGY
IN THE US MARKET
Miroslav Svoboda1
Martina Sponerová2
DOI: https://doi.org/10.31410/ITEMA.2020.121
Abstract: Random strategy is currently an interesting alternative to traditional trading of
financial instruments. The paper builds on existing research into the trading of investment
instruments through random strategy and strategies based on technical analysis. The highly
liquid USD/CAD currency pair was chosen for the US market research. We analyze five years
of data, and in every intraday trading session, only a single position will be opened. Technical
analysis strategy uses essential indicators such as Bollinger Bands, relative strength index
(RSI), moving averages (MA) and other. Every trading position will have the risk-reward ratio
(RRR) 3 to 1. In addition, another trading positions on the USD/CAD currency pair will be
opened without technical analysis. The time of entry into position will be indicated randomly
with a similar risk-reward ratio (RRR) 3 to 1. The aim of this paper is to assess which of the
above strategies is more suitable for the investor. In other words, this paper aims to compare
the strategy of technical analysis and the random strategy in intraday trading concerning the
profitability of these trades. We expect that a random strategy will be more suitable for the
investor in many points.
Keywords: Investment decisions, Foreign exchange markets, Moving average, Backtesting,
US market, Relative strength index.
INTRODUCTION
echnical analysis, together with fundamental analysis, ranks among the basic analyzes
in trading on financial markets. This paper extends the knowledge gained from the data
presented in the authors' paper entitled RANDOM STRATEGY VERSUS
TECHNICAL ANALYSIS STRATEGY: THE CASE OF EUR / USD INTRADAY
TRADING to American markets. The authors deal with the comparison of trading strategies of
technical analysis and trading strategies based on market randomness. The use of technical
analysis has been presented in many disgusting publications in Taylor and Allen (1992),
Menkhoff (1997), Lui and Mole (1998), Oberlechner (2001), Gehrig and Menkhoff (2004) and
Menkhoff and Taylor (2007).
There are studies that contain large amounts of trading position data based on technical analysis
indicators. For example, the study by Hsu and Taylor (2013) and Coakley, Marzano and
Nankervis (2016) deals with testing technical analysis in the foreign exchange market using
the SPA test. The study reports a very low rate of profitability of trading positions based on
some indicators of technical analysis. Zarrabi, Snaith and Coakley (2017) used FDR analysis
1 Masaryk University, Faculty of Economics and Administration, Department of Finance, Lipová 41a, 603
00 Brno, Czech Republic 2 Masaryk University, Faculty of Economics and Administration, Department of Finance, Lipová 41a, 603
00 Brno, Czech Republic
T

122
ITEMA 2020
Conference Proceedings
in their study and found that the predictive power of technical analysis is possible. The study
used data for 20 years when the trading strategy had to be updated at least once a month,
otherwise the predictive ability of technical analysis is not sustainable in the long run.
Following the above study, a trading strategy in foreign exchange markets based on technical
analysis is not sustainable in the long term. However, some studies report the profitability of
technical analysis when trading in foreign exchange markets. These are, for example, the
studies of Sweeney 1986, Levich and Thomas, 1993, Neely, 1997, LeBaron, 1999, 2002. A
study by Sager and Taylor, 2006, Menkhoff and Taylor, 2007 examines the efficiency of the
foreign exchange market with respect to small investors influencing the market. Small investors
are also important for our research, because our strategies are based on use for small investors.
According to the authors, there is a lot of space for further knowledge and studies in this
segment.
This paper builds on the authors' long-term research in the field of random strategy in
combination with a strategy based on technical analysis. The paper aims to test selected strategy
based on technical analysis and compare the results with simple random strategy for US market.
The authors used a long period to obtain additional information on the research.
1. METHODOLOGY AND DATA
In this article, the authors identified two investment strategies. These strategies have been
applied to the foreign exchange market of the USD / CAD currency pair, which reflects the US
Market. The strategy (SMA/RSI strategy) based on technical analysis uses the Simple Moving
Average (SMA) indicator together with the Relative Strength Index (RSI) indicator. The
strategy based on randomness (Random strategy) does not use any indicator of technical
analysis.
For backtesting, we choose currency pair, with regard to the US market, USD/CAD from
1/2/2015 to 12/23/2019. Trading positions were determined with a Risk-reward-ratio (RRR) of
1 to 3. Trading positions therefore showed a profit of 60 pips or a loss of 20 pips from the
opening price of each position. Both sell and buy orders were used in the research. Due to the
fact that the research compared 2 investment strategies on the same currency pair, it was not
necessary to include fees in the research data. If we included the fees in the dataset, it would
be 1-2 pips for each position. The amount of the fee, of course, depends on the specific service
provider. The following Table 1 shows the basic characteristics of our analysis.
Table 1. Basic characteristics of both strategies
Term Value
1. • Currency pair • USD/CAD
2. • Time frame • H1
3. • Period • 1/2/2015 – 12/23/2019
4. • Currency of the account • USD
5. • Demonstrative account value • 10 000 USD
6. • RRR • 3/1
7. • Profit (target) • 60 pips
8. • Loss (stop loss) • 20 pips
9. • Time zone • UTC + 1
Source: Author´s calculations

123
RANDOM STRATEGY VERSUS TECHNICAL ANALYSIS STRATEGY IN THE US MARKET
1. 1 SMA/RSI STRATEGY
A simple moving average (SMA) is usually used to determine the trend. It is a popular indicator
of technical analysis for many investors. The calculation of a given indicator is calculated as
the arithmetic average of the asset price for a certain period. A period of 250 weeks was used
in the research. We have incorporated another indicator of technical analysis into our strategy,
namely the relative strength index. The relative strength index is a momentum oscillator, which
determines the change and speed of price movements. The conditions for buying a position
were defined by a price increase above 250 SMA and at the same time a movement of RSI (25)
above 0.7 (70). The conditions for the sale of the currency were defined by a price drop below
250 SMA and at the same time a movement of RSI (25) below 0.3 (30). In this research, we
used the trend following strategy, where these investors expect/believe that when the price
rises, it will grow even more and vice versa.
Our SMA/RSI strategy is summarized in Table 2.
Table 2. Characteristics of SMA/RSI strategy
Term Value
1. • Signal to buy
• First closed candle after candle rise
above SMA (250) and a movement of RSI
(25) above 0,7
2. • Signal to sell
• First closed candle after candle drops
below SMA (250) and a movement of RSI
(25) below 0,3
3. • Close position • Breakthrough stop loss or target
Source: Author´s calculations
The following Figure 1 demonstrates the signal to open the position (buy position in this
example) and signal to close the position for our SMA/RSI strategy (breakthrough target).
Figure 1. Signal to buy, close position – USD/CAD
Source: Author´s calculations, tradingview.com

124
ITEMA 2020
Conference Proceedings
1. 2 RANDOM STRATEGY
Our random strategy is based on trading without technical and fundamental analysis. We
choose random parameters to enter trading positions. Trading positions are executed at 2 p.m.
(UTC +1) every trading day. The designated hour to enter the position predicted a higher rate
of traders entering the market due to the early opening hour for the US Market. The
determination of the long or short position was programmed randomly (50:50).
Table 3 shows the basic characteristics of the random strategy:
Table 3. Characteristics of Random strategy
Term Value
1. • Signal to buy • Random on a daily basis at the
selected time (14:00, UTC + 1)
2. • Signal to sell • Random on a daily basis at the
selected time (14:00, UTC + 1)
3. • Close position • Break through stop loss or target
Source: Author´s calculations
The figure below illustrates a trading position according to a random strategy. This is a selling
position where the position was opened according to the selected time and in this case the stop
loss was terminated.
Figure 2. 14:00, UTC + 1, sell position (at random), close position
Source: Author´s calculations, tradingview.com
2 RESULTS AND DISCUSSION
We use almost 5 years of data and backtest our strategies presented in the previous Chapter 1.
In Table 4, our results for both strategies are presented. The random strategy opened one
position every trading day, and it resulted in 1296 positions in total. For SMA/RSI strategy we
have 1163 observations.

125
RANDOM STRATEGY VERSUS TECHNICAL ANALYSIS STRATEGY IN THE US MARKET
Table 4. Results
SMA/RSI strategy Random strategy
Number of open positions • 1163 • 1296
Number of long positions • 604 • 663
% of success – long
positions • 21,36 • 24,59
Number of short positions • 559 • 633
% of success – short
positions • 22,9 • 24,33
Number of profitable
positions (60 pips profit) • 257 • 317
% of profitable positions
(60 pips profit) • 22,1 • 24,46
Number of loss positions (20
pips loss) • 906 • 979
% of loss positions (20 pips
loss) • 77,9 • 75,54
% total profit/loss • - 23,4 • - 5,34
Total profit/loss • - 2340,91 • - 534,24
Source: Author´s calculations
The Random strategy was less loss-making in our research. In this case, the strategy for the
investor performed better than the strategy based on technical analysis. The research builds on
our previous research on strategies based on technical analysis versus random strategy. In the
case of the SMA strategy of the EUR/USD currency pair, this strategy, based on technical
analysis, showed almost double the percentage of profit in the same trading account. A random
strategy also had similar results. Previously, we also examined another GBP/USD currency
pair, which showed similarly profitable results as the mentioned EUR/USD pair, with the
difference that a random strategy was more profitable.
Figure 3. Total loss SMA/RSI strategy
Source: Author´s calculations, MetaTrader
Figure 4. Total loss Random strategy
Source: Author´s calculations, MetaTrader

126
ITEMA 2020
Conference Proceedings
FUTURE RESEARCH DIRECTIONS
With the ever-evolving research of technical analysis strategies versus random strategies, we
gain important knowledge in terms of investment decisions of small investors trading in
currency markets. The data obtained show us that a random strategy can show better results
than a strategy based on technical analysis. The question is therefore whether it is necessary
for the investor to use complex strategies based on technical analysis or to use randomness, of
course, provided that money management and RRR are complied with. Another question is
whether the random strategy we present only works in currency markets or we can apply it to
other markets, such as the commodity market, stocks, etc. These questions predispose us to
further research in the field of financial markets.
CONCLUSION
Two trading strategies were addressed in the submitted paper. The first strategy was based on
technical analysis indicators. Specifically, it was a joint use of SMA and RSI indicators. The
second strategy was random. This means that only one position was opened each day, randomly
at the chosen time. The trading strategies have been tested on the USD / CAD currency pair for
almost 5 years. Subsequently, both strategies were compared and the results from the obtained
data were evaluated.
In this case, both strategies ended in a loss. However, the random strategy showed a loss
significantly lower than the loss based on technical analysis indicators. Thus, an important
question arises as to whether a random strategy in the event of an unfavorable market situation
is not safer than a strategy based on technical analysis. Therefore, it is important in the future
to apply these strategies to situations where market developments do not support indicators
based on technical analysis. The results presented in this paper build on the authors' previous
research and prove that there is a high potential for further research in this segment. It is mainly
an examination of other investment instruments and also research into the effectiveness of both
approaches in creating trading strategies.
ACKNOWLEDGMENT
This research was supported by the Masaryk University internal grant MUNI/A/1081/2019.
REFERENCES
Coakley, J. & Marzano, M. & Nankervis, J. (2016). How profitable are FX technical trading
rules?. International Review of Financial Analysis, vol. 45, pp. 273-282.
Gehrig, T., & Menkhoff, L. (2004). The use of flow analysis in foreign exchange: Exploratory
evidence. Journal of International Money and Finance, vol. 23, pp. 573–594.
Hsu, P. H., & Taylor, M. P. (2013). Forty years, thirty currencies and 21,000 trading rules: A
large-scale, data-snooping robust analysis of technical trading in the foreign exchange
market. Working paper, thirty currencies and 21.
Laïdi, A. (2008). Currency Trading And Intermarket Analysis. 1nd ed. Wiley Trading, pp. 279.
LeBaron, B. (1999). Technical trading rule profitability and foreign exchange intervention.
Journal of International Economics, vol. 49, pp. 125-143.
LeBaron, B. (2002). Technical trading profitability in foreign exchange markets in the 1990s.
Working paper, Brandeis University.

127
RANDOM STRATEGY VERSUS TECHNICAL ANALYSIS STRATEGY IN THE US MARKET
Levich, R. M., & Thomas, L. R. (1993). The significance of technical trading-rule profits in
the foreign exchange market: A bootstrap approach. Journal of International Money and
Finance, vol. 12 (5), pp. 451-474.
Lui, Y. H., & Mole, D. (1998). The use of fundamental and technical analysis by foreign
exchange dealers: Hong Kong evidence. Journal of International Money and Finance,
vol. 17, pp. 535–545.
Menkhoff, L. (1997). Examining the use of technical currency analysis. International Journal
of Finance and Economics, vol. 2(4), pp. 307–318.
Menkhoff, L., & Taylor, M. P. (2007). The obstinate passion of foreign exchange professionals:
Technical analysis. Journal of Economic Literature, vol. 45, pp. 936–972.
Neely, C. J. (1997). Technical analysis in the foreign exchange market: A layman's guide.
Federal Reserve Bank of St. Louis Review, vol. 79(5), pp. 23-38.
Oberlechner, T. (2001). Importance of technical and fundamental analysis in the European
foreign exchange market. International Journal of Finance and Economics, vol. 6(1), pp.
81–93.
Taylor, M. P., & Allen, H. (1992). The use of technical analysis in the foreign exchange market.
Journal of International Money and Finance, vol. 11, pp. 304–314.
Sager, M. J., & Taylor, M. P. (2006). Under the microscope: The structure of the foreign
exchange market. International Journal of Finance and Economics, vol. 11, pp. 81-95.
Sweeney, R. J. (1986). Beating the foreign exchange market. Journal of Finance, vol. 41(1),
pp. 163-182.
Wilder, J. W. (1978). New concepts in technical trading systems. Trend Research,
McLeansville, NC.
Zarabi, N. & Snaith, S. & Coakley, J. (2017). FX technical trading rules can be profitable
sometimes!. International Review of Financial Analysis, vol. 49, pp. 113-127.


129
CASH FLOW FORECASTING FOR INTERNATIONAL PROJECTS IN
THE PROCESS OF CAPITAL BUDGETING DURING THE COVID-19
PANDEMIC
Biljana Pejović1
Dragana Trifunović2
Aleksandra Živaljević3
DOI: https://doi.org/10.31410/ITEMA.2020.129
Abstract: By predicting cash flows in the capital budgeting procedure, the profitability of an
investment at the international level is determined in advance. Although investing globally
provides greater opportunities for earnings, cost reduction and business diversification, all
risks posed by international business must be considered when choosing a discount rate. In
addition to the risks inherent in cross-border business such as exchange rate risk, country risk,
the risks caused by the pandemic crisis, which relate primarily to measures taken by states to
protect the population by introducing quarantine, restricting the flow of people, goods and
capital, as well as activities that are endangered by a pandemic, must be considered too. If all
the risks that determine the discount rate are well assessed, the cash flow forecast will be more
accurate.
Keywords: Cash flows, Capital budgeting, Discount rate, Pandemic.
INTRODUCTION
lobalization as a process of great economic changes (Glushkova, Lomakina,
Sakulyeva, 2019, pp. 876-884), that are reflected in the social, political and cultural
aspect of overall life has been greatly stimulated by the emergence and development
of international corporations. High concentration of capital and business in several countries
are their main characteristic. The development of technology and the removal of barriers to the
free flow of products, services, people and capital have contributed to the fact that two thirds
of the world capital market are in their possession.
Cross-border business has brought greater opportunities for more cost-effective business but
also greater challenges in the management process. Some of the advantages of cross-border
business are: obtaining and using cheaper resources, conquering new markets, establishing cost
centers in countries with high tax rates, and profit centers in countries with low tax rates, in
order to optimize the tax burden. The existence of the possibility of production diversification
and the relocation of production capacities to countries with more favorable conditions, cheaper
resources are other advantages of their business. Investing in other countries increases sales
outside the country of establishment, increases market shares and makes extra profit.
International diversification additionally affects the reduction of corporate exposure to the
economic conditions of the country in which they were initially established, but it also
1 Faculty of Social Sciences, Bulevar umetnosti 2ª, Belgrade, Serbia 2 Faculty of Social Sciences, Bulevar umetnosti 2ª, Belgrade, Serbia 3 Higher Colleges of Technology, Abu Dhabi, United Arab Emirates
G

130
ITEMA 2020
Conference Proceedings
additionally affects the exposure of corporations to business risks imposed by the international
environment.
The earning capacity of corporations is determined by a good assessment of investment
opportunities at the global level (Putra, 2019, p.818-826). Decisions about the return of
investment must be consistent in order to maximize the value of the shares. Capital budgeting
or evaluation of economic efficiency of investments includes the process of identification,
analysis and selection of investment projects whose returns are expected to last longer than a
year. It includes the development of investment project proposals that are consistent with the
goals of corporations, the assessment of cash flows for each project individually, the selection
of projects based on value maximization as eligibility criteria.
The pandemic crisis caused by the Covid-19 virus also pointed to some negative effects of
international investment (Adegboye, Adekunle, Eisen, McBryde, Pak, Rahman, 2020.). The
health threat to the population has caused the re-establishment of borders and the introduction
of limits by states that can cause a slowdown and significantly higher costs of project
implementation. If the implementation of previously contracted projects cannot be postponed
due to the current situation, it is necessary to apply a discount rate when projecting cash flows,
which represents all additional risks caused by the pandemic. Although it is still too early to
draw conclusions because the pandemic is still going on, many countries will enter a period of
recession and falling GDP and there will be a large increase in the number of unemployed.
CAPITAL BUDGETING
Capital budgeting is used to assess the profitability of investments, as a technique that can
indicate in advance to investors the extent to which the selected investment is profitable
(Justice, Pious, Yeboah, 2020, p. 33). The four alternative methods used to evaluate and select
investment projects in practice are the following: net present value, internal rate of return,
payback period, and profitability index. Discounted cash flow methods provide the best
measure of the real returns of projects because they are based on future cash flows and consider
the time value of money.
These methods pay special attention to accounting reports (balance sheet, income statement
and cash flow statement) from the past, because they are used to project future cash flows, and
have proven to be one of the best valuation methods in market economies. The most commonly
used method of capital budgeting involves calculating the net present value, which is
determined by discounting the projected cash flows that will be generated by a particular
investment. The net present value is a monetary measure of return, and the internal rate of
return is a percentage measure of return of investment.
The inputs necessary for capital budgeting are: initial investment, demand forecast, price at
which products will be placed on the market, fixed and variable costs, payback period, residual
value and expected rate of return (Messer, 2020, p. 302). All parameters are highly dependent
on exchange rate fluctuations, the tax legislation of the country in which it is invested, as well
as the ban on transfers between the parent company and the branch, if any.
International capital budgeting is an identical procedure that requires a more complex analysis.
Internationally, there are many more factors that affect the level of the discount rate, which
includes all risk exposures. The process of estimating the direct costs of a project begins with

131
CASH FLOW FORECASTING FOR INTERNATIONAL PROJECTS IN THE PROCESS OF CAPITAL
BUDGETING DURING THE COVID-19 PANDEMIC
a reference to experience, if similar projects have been carried out in the past, by market
research or by scenario analysis.
The Net Present Value (NPV) method involves discounting of future cash flows back to present
value (Blaset Kastro, Kulakov, 2020.) Based on this criterion, those projects whose net present
value is higher than zero are eligible. The present value of the initial investment is the sum of
discounted net inflows, because the investment is made at the beginning of the period. The Net
Present Value is the amount by which the present value of the cash inflows exceeds the present
value of the cash outflows. A positive Net Present Value means that the rate of return of capital
investment is greater than the discount rate used in the analysis.
The internal rate of return is represented as a metric used in financial analysis to estimate the
profitability of potential investments. The internal rate of return is a discount rate that makes
the net present value (NPV) of all cash flows equal to zero in a discount cash flow analysis.
The internal rate of return for an investment project is the discount rate that equates the present
value of expected cash flows with the initial expenditure. If the internal rate of return is higher
than the required rate of return the project is eligible, otherwise the project is rejected. When
deciding between projects with the same degree of risk, a project with a higher internal rate of
return is a better investment.
Payback Period represents the amount of time required for the cash flows generated by the
investment to repay the cost of the original investment. The number of years required to recoup
the investment is the payback period. The payback period is the period required for the
cumulative cash flows from the invested project to equal the initial cash outflow. If the
calculated return period is less than the maximum acceptable, the project is accepted, and if
not, then it is rejected.
The discount rate is an integral part of the analysis and it must reflect the risk level of the capital
investment. The discount rate can represent several different approaches for the company. It
may represent the cost of capital such as the cost of borrowing money to finance the capital
expenditure or the cost of using the company’s internal funds, or it may represent the rate of
return needed to attract outside investment for the capital project. It must cover all risks that
may affect the implementation of the project. Choosing the proper discount rate is important
for an accurate Net Present Value analysis.
Another measure to determine the acceptability of a capital investment is the Profitability Index
(PI). The Profitability Index is computed by dividing the present value of cash inflows of the
capital investment by the present value of cash outflows of the capital investment. If the
Profitability Index is greater than one, the capital investment is accepted. If it is less than one,
the capital investment is rejected.
CASH FLOW FORECASTING
Discounted cash flow methods provide the best measure of the real returns of projects because
they are based on cash flows and consider the time value of money. For good estimates, it is
necessary to consider all the risks that determine the discount rate.
Determining the value that will be generated from an investment includes predicting cash flows
and the period expected to return the initial investment, determining the internal rate of return,
discounting the projected cash flows, adding the present values to determine the profitability

132
ITEMA 2020
Conference Proceedings
of the initial investment. At the beginning, the construction of financing is determined and the
weighted average cost of capital is determined.
The most important factors influencing the choice of discount rate are the financial condition
of the company in which it is invested, the financial mix, in terms of the price of borrowed
resources and the price of own sources, the economic situation, trends in the industry in which
the company operates, supply and demand ratio and country risk. If starting from cash flow
after debt servicing, the discount rate will be based on the opportunity price of capital, while
discounting the cash flow before servicing debts will use a discount rate based on the weighted
average cost of capital. Choosing the appropriate discount rate requires to consider all revenues
and expenses in accordance with market prices. Cash flow before servicing debts is used by
investors in purchase or takeover transactions, because the cash flow defined in this way
provides an insight into credit capacity and considers all the possibilities of financing
transactions from a new loan. Cash flow after debt service is important for creditors,
management and shareholders, given that the cash flow defined in this way takes into account
financial needs (Putri, 2020, p. 79).
Discount rates may vary over time. The first reason is that the level of interest rates on borrowed
funds can change over time. This usually happens if the interest rate is linked to one of the
reference rates whose movement is conditioned by the supply and demand for financial
resources. Another reason is that risk characteristics can be expected to change over time. The
third reason is that the financial mix of a project can change over time, resulting in changes in
the cost of equity and borrowed capital.
If invest in countries that have high inflation rates, it is difficult to reliably determine the
amount of net present value. Although inflation affects both costs and revenues in the same
direction (causes them to rise), the end result may be different. This is especially pronounced
in projects involving the import of components and the sale of finished products in the local
market. In that case, inflation has a greater impact on revenues than on project costs.
There are a number of reasons that affect the emergence of risk, including the project itself.
Risk is also affected by competition, industry trends, international developments,
macroeconomic factors and prices of resources in the global market. However, it is not
necessary to perform an analysis of all types of risks when estimating the discount rate.
Initially, differentiation of risk sources is performed at the project level. Among the various
sources of risk that are analyzed during capital budgeting, only those risks that cannot be
diversified should be considered. This type of risk varies from company to company depending
on whether it is a company whose shares are publicly traded or not. After identifying the risk
at the company level, the risk at the project level is determined and measured. If companies
invest in homogeneous projects, with similar risk profiles, the cost of the company's share
capital is used. If the company is diversified and engaged in different activities, and projects
within each activity have a similar risk, the cost of share capital is also used for that activity. If
the project is unique in terms of risk, the cost of share capital that is specific to that project is
calculated and used. After assessing the risk of share capital and the risk of default on the
company's debt, there are two ways to include the risk in the analysis. One way is to calculate
the cost of share capital and debt that will reflect the risk of the project. Riskier projects will
have higher costs. Another way is to adjust cash flows using a risk-reflecting discount rate.
The combined effect of inflation and exchange rate fluctuations on net cash flow may act
neutrally from the parent company's perspective. The exchange rate of countries with high

133
CASH FLOW FORECASTING FOR INTERNATIONAL PROJECTS IN THE PROCESS OF CAPITAL
BUDGETING DURING THE COVID-19 PANDEMIC
inflation weakens over time. Although the branch's earnings are expressed in local currency
due to the impact of inflation, when converted into the parent company's currency, the effect
of growth is lost (the currency of the country in which the branch is weak in relation to the
parent company's currency). This effect of exchange rate neutralization and inflation rarely
occurs in practice because inflation is only one of the factors influencing the exchange rate,
and in addition there is no guarantee that the local currency will depreciate when the inflation
rate is relatively high.
Since the introduction of the pandemic caused by the Covid-19 virus, business conditions in
the international arena have changed. The behavior of the virus is atypical, in terms of the
duration of the infection, the way it is transmitted, the behavior of the virus at high summer
temperatures, so that many predictions of even the most eminent experts were wrong. A large
number of people have become infected and a state of emergency has been declared in many
countries. Regardless of the measures taken by the states in order to protect the spread of the
infection, the mortality rate in almost all countries is extremely high.
According to data released by the World Health Organization on September 19, 2020, there
have been 30,369,778 confirmed cases of COVID -19, including 948,795 deaths (World Health
Organization, 2020.). Some countries have introduced a state of quarantine and bans on the
movement of the population, not only within state borders, but also within cities, as is the case
in Italy. Some had a much more liberal stance, such as Sweden. The final conclusion on how
to behave in a pandemic will be made when the pandemic is stopped or at least brought under
control. Acquiring global immunity through vaccination of the population is still not feasible,
because until practical application, vaccines must pass a phase of testing that requires time.
Many companies, whether privately or state-owned, have had to provide conditions for their
employees, which would protect them against infection. Companies had a better organization
of their business, which could enable employees to do their jobs online, if it was feasible, from
home. It turned out that high-tech activities were in the lead.
An additional problem is the increase in the unemployment rate. All over the world, employers
have laid off surplus labor, both due to the reduction in the volume of business and the inability
to provide the conditions prescribed by state regulations for the protection of employees in the
workplace. All over the world, many employees are expected to lose their jobs. Cash flow
forecasting costs will be further increased by employee health care requirements during a
pandemic. It is still too early to consider these figures, but it should be borne in mind that these
developments will affect the cost of labor used in forecasting cash flow costs.
Why is this information important for international projects? The discount rate used in the
process of calculating the net present value should include all risks that may directly or
indirectly affect the implementation of projects and affect the formation of the price of input
and outputs. Higher risk requires a higher discount rate which affects the reduction of the net
present value and profitability of the project. The state of panic and fear affects the human
psyche in terms of savings, reduced consumption and limited movement.
The pandemic did not affect all industrial areas equally. The biggest changes in business have
occurred in the field of tourism, transport, hotel services, catering, real estates’ rental,
organization of events that involve numerous gatherings of people, such as sports events,
concerts, etc. In some industries they have found a transitional solution. Traders and restaurant

134
ITEMA 2020
Conference Proceedings
owners delivered the ordered products online to the home address, in order to maintain good
traffic as much as possible.
If it is impossible to delay all investments in these industries, a discount rate should be carefully
formed and it would include all the risks already mentioned.
Based on research conducted to create the most effective policies to overcome the harmful
effects of Covid-19 on the economy and the wider community in March 2020, based on the
views of representatives of companies, local governments and civil society organizations, the
biggest challenges they face are problems with collection and liquidity (for as many as 63% of
respondents), drop in demand (45%), but also problems with regular payment of wages to
workers (32%), organization of work (29%) and the possibility of regular settlement of
obligations to the state (Nacionalna alijansa za lokalni ekonomski razvoj, 2020, p.4)
According to data published by the World Health Organization, the number of deaths in the
world is constantly increasing. The number of deaths in the world due to the Covid-19 virus
pandemic, on September 19, 2020: Americas 15,333,470, South-East Asia 5,973,186, Europe
5,149,121, Eastern Mediterranean 2,199,096, Africa 1,141,044 and Western Pacific 573,120
(World Health Organization, 2020.). It is expected that the measures introduced by countries
to protect the population will be even more rigorous, which should affect the discount rate in
the future.
CONCLUSION
The realization of international projects during the pandemic caused by the Covid-19 virus
poses new challenges for investors. Determining whether and to what extent projects are
profitable can be correctly calculated only if a discount rate is applied when forecasting future
cash flows, which, in addition to all the risks caused by international business, also include all
additional risks brought by the pandemic. Investments in the field of tourism, transport, hotel
services, catering, organization of events that include numerous gatherings of people, such as
sports events, concerts require higher discount rates. All projects that require the gathering of
a larger number of people, their movement during the pandemic are additionally risky. Until
the pandemic is over, or at least not brought under control, due to the health protection of the
population, investment in these industrial areas should be postponed or in the calculation of
their profitability one should be realistic. When choosing the discount rate used to estimate
future cash flows, the most important thing is to include all the risks that may affect the
implementation of the project.
REFERENCES
Blaset, Kastro, A., N., Kulakov, N., Y., (2020). Risk-adjusted discount rates and the present
value of risky non-conventional projects, The Engineering
Economist. https://doi.org/10.1080/0013791X.2020.1815918
Glushkova, S., Lomakina, O., Sakulyeva, T., (2019). The Economy of Developing Countries
in the Context of Globalization: Global Supply Chain Management, International
Journal of Supply Chain Management, 8(1), 876-884.
Justice, A., Pious, O., Yeboah, E., N., (2020). Capital Budgeting as a Tool of Management
Decision Making: A Case Study of National Investment Bank Limited, Research Journal
of Finance and Accounting, 11(4), 33-41.

135
CASH FLOW FORECASTING FOR INTERNATIONAL PROJECTS IN THE PROCESS OF CAPITAL
BUDGETING DURING THE COVID-19 PANDEMIC
Messer, R. (2020). "Making a Lot of Decisions", Financial Modeling for Decision Making:
Using MS-Excel in Accounting and Finance. Emerald Publishing
Limited. https://doi.org/10.1108/978-1-78973-413-320201018
Nacionalna alijansa za lokalni ekonomski razvoj (2020). Covid-19, Uticaj na privredu i lokalne
zajednice; Percepcija predstavnika privatnog, javnog i civilnog sektora
Adegboye, O. A., Adekunle, A. I., Eisen, D. P., McBryde, E. S., Pak, A., Rahman, K. M.,
(2020). Economic Consequences of the COVID-19 Outbreak: the Need for Epidemic
Preparedness, Front Public Health, 8(241). https://doi.org/10.3389/fpubh.2020.00241
Putra, Y. M., (2019). Analysis of Factors Affecting the Interests of SMEs Using Accounting
Applications. Journal of Economics and Business, 2(3), 818-826.
https://doi.org/10.31014/aior.1992.02.03.129
Putri, R., S., T., (2020). The Effect of Return on Assets, Free Cash Flow, and Debt to Equity
Ratio on Company Value, EPRA International Journal of Multidisciplinary Research
(IJMR), 6(10), 76-84. https://doi.org/10.36713/epra5329
World Health Organization (2020) WHO Coronavirus Disease (COVID-19) Dashboard,
https://covid19.who.int/, Accessed on: 2020/09/19


137
ANALYSIS OF RESEARCH AND DEVELOPMENT EXPENDITURE IN
EUROPEAN UNION COUNTRIES
Ľubica Hurbánková1
DOI: https://doi.org/10.31410/ITEMA.2020.137
Abstract: Paper deals with the analysis of research and development expenditure. Expenditure
per capita in European Union countries in years 2009 - 2018 and total research and
development expenditure in million Euro are analyzed. The aim of the paper is to find out in
which countries expenditure per capita increased the most during the observed period and in
which it decreased, what was the average annual growth rate of this indicator. Contribution
method will help to analyze how the total research and development expenditure in 27
European Union countries has changed, what was the share of each country in this
expenditure, which countries contributed the most to this change and which the least. Research
and development expenditure per capita increased average annually between 2009 and 2018
in all analyzed countries, except Luxembourg and Finland, where it decreased. The highest
average annual growth was recorded in Poland (12.48%), Latvia (10.50%), Slovakia (10.47%)
and Bulgaria (10.38%). Total research and development expenditure increased in 2018
compared to 2009 by 41.65%, Germany (18.11%) and France (4.29%) contributed the most to
this increase.
Keywords: Research and development expenditure, European union countries, Contribution
method.
INTRODUCTION
esearch and development expenditure is an indicator, which includes expenditure on
research and development by business enterprises, higher education institutions,
government and private non-profit organizations (Eurostat, 2020).
Research and development expenditure comprise total amount of expenditures spent in
organization on research and development activities, i.e. they are internal expenditures.
Expenditures spent out of the organization include only those serving for support to the internal
research and development (e.g. purchase of equipment for R&D institutions). Depreciation of
buildings, machines and equipment is excluded from the statistical survey of internal
expenditures on research and development (Štatistický úrad Slovenskej republiky, 2019).
Research and development expenditure is associated directly with the research and
development of a company's goods or services and any intellectual property generated in the
process. They are direct expenditures relating to a company's efforts to develop, design, and
enhance its products, services, technologies, or processes. The industrial, technological, health
care, and pharmaceutical sectors typically incur the highest degree of R&D expenses
(Investopedia, 2020).
1 University of Economics in Bratislava, Dolnozemská cesta 1, 852 35 Bratislava, Slovak Republic
R

138
ITEMA 2020
Conference Proceedings
The aim of the paper is to find out in which countries in the years 2009 – 2018 research and
development expenditure per inhabitant increased the most and in which decreased, what was
the average annual growth rate of this indicator. Next, we will analyze how the total research
and development expenditure in 27 European Union countries has changed, what was the share
of each country in this expenditure, which countries contributed the most to this change and
which the least. We will use contribution method for this analysis.
USING METHOD
To find out how the analyzed indicator developed, we use the characteristics of time series –
basic index and average growth rate (see Pacáková et al., 2009).
As our goal is to find out how individual countries have contributed to the total change in
research and development expenditure, we will use contribution method.
Contribution method is used for the analysis of additive indicator Y, which arise from the sum
of individual components:
n
i
iyY1
(1)
where: Y is additive indicator,
yi are individual components.
The procedure of this method is as follows (Hurbánková, Sivašová, 2018):
We calculate the relative increase of additive indicator, which expresses how the given
indicator has changed:
)1()(
11
1
Y
tt
tt
dt kY
Yd
Y
YYk (2)
We calculate the relative increases of the individual components, which express how the
individual components developed:
)1()(
11
1
i
yi
t
i
t
i
t
i
t
dt ky
yd
y
yyk (3)
We determine the structural numbers that express the share of individual components in
additive indicator. We calculate the structural numbers in the period t-1, assuming that the
analogous share of the component on the additive indicator is maintained during the continuous
development of the additive indicator:
1
11
t
i
ti
tY
ys (4)
We calculate the contribution to which i-th component contributed to the relative increase of
the additive indicator:
i
t
i
y
t
i
t
i
t
i
t
i
t skY
y
y
yy1
1
1
1
1 *)1(*
(5)
The contribution of each additive component is equal to multiply of its relative increase and
the share of this component in the additive indicator in the previous period.

139
ANALYSIS OF RESEARCH AND DEVELOPMENT EXPENDITURE IN EUROPEAN UNION
COUNTRIES
The relative increase of the additive indicator is equal to the sum of the relative contributions
of the individual components (Hindls, Hronová, 1997):
(6)
ANALYSIS OF RESEARCH AND DEVELOPMENT EXPENDITURE IN EUROPEAN
UNION COUNTRIES
Table 1 shows data on research and development expenditure per inhabitant in European Union
countries in years 2009 – 2018 in Euro. The trend of this indicator in 2018 compared to 2009
and the average annual growth rate are calculated.
Table 1. Research and development expenditure per inhabitant in European Union countries
in 2009 – 2018 in Euro, its trend in 2018 compared to 2009 and average annual growth rate
GEO/TIME 2009 2010 2011 2012 2013 2014 2015 2016 2017 2018 2018
/2009
Average
annual
growth
rate
EU 27 473,7 490,8 519,0 537,2 543,9 558,2 582,7 594,9 629,2 661,9 1,3973 1,0379
Belgium 644,0 690,7 742,8 795,3 822,1 854,3 900,4 959,5 1 045,5 1 115 1,7314 1,0629
Bulgaria 24,7 29,0 29,8 34,6 36,6 46,9 60,4 52,5 54,7 60,1 2,4332 1,1038
Czechia 184,6 200,3 243,4 273,9 285 294,0 308,4 280,8 324,5 377,6 2,0455 1,0828
Denmark 1 282 1 281,6 1 312,7 1 360,0 1 371,8 1 376,2 1 473,7 1 534,2 1 551,4 1 580,9 1,2332 1,0236
Germany 818,0 855,9 942,0 984,8 990,1 1 043,1 1 093,4 1 121,7 1 206,4 1 266,3 1,5480 1,0498
Estonia 147,8 174,6 289,1 287,3 247 217,9 230,3 205,4 231,3 277,2 1,8755 1,0724
Ireland 605,0 586,8 583,2 595,7 610,3 639,8 664,6 671,8 768,2 769,5 1,2719 1,0271
Greece 133,9 121,6 125,1 120,7 133,2 136,2 156,9 162,7 189,3 202,5 1,5123 1,0470
Spain 315,4 313,8 303,9 286,0 278,5 275,6 283,6 285,5 302,2 320,3 1,0155 1,0017
France 665,7 672,3 694,3 712,6 722 724,2 749,9 745,1 757,7 773,6 1,1621 1,0168
Croatia 88,3 77,9 78,4 77,2 83,2 80,0 88,7 96,0 101,9 122,2 1,3839 1,0368
Italy 325,6 331,6 333,7 345,2 351,6 358,3 364,5 382,0 392,7 406,4 1,2482 1,0249
Cyprus 104,1 105,2 107,0 99,0 101,0 104,3 100,7 116,5 128,9 134,0 1,2872 1,0285
Latvia 39,2 51,2 67,8 71,7 69,1 81,3 76,6 56,1 70,7 96,3 2,4566 1,1050
Lithuania 70,2 69,9 92,6 99,3 111,9 128 133,4 113,4 133,0 151,8 2,1624 1,0895
Luxembourg 1 256,9 1 202,4 1 233,6 1 069,6 1 127,9 1 146,7 1 204,4 1 235,8 1 220,1 1 208,3 0,9613 0,9956
Hungary 106,4 112,4 120,6 126,6 142,8 144,7 153,3 139,5 170,8 209,8 1,9718 1,0784
Malta 77,3 96,7 111 141,9 139,8 141,0 162,6 130,3 143,2 148,8 1,9250 1,0755
Netherlands 631,3 657,1 734,6 747,9 759,6 788,4 810,4 833,0 857,0 974,8 1,5441 1,0495
Austria 897,4 965,9 988,2 1 104,6 1 132,4 1 207,7 1 223,0 1 279,9 1 286,9 1 388,1 1,5468 1,0497
Poland 55,0 68,6 74,5 90,1 90,3 101,6 113,6 108,3 127,3 158,5 2,8818 1,1248
Portugal 262,4 260,8 242,7 220,1 215,4 214,1 215,4 231,0 250,7 269,1 1,0255 1,0028
Romania 27,2 28,2 32,5 32,1 27,9 28,8 39,4 41,4 48,1 52,5 1,9301 1,0758
Slovenia 323,2 364,4 436,2 451,6 454,1 431,9 413,5 393,4 388,4 431,8 1,3360 1,0327
Slovakia 56,3 77,2 86,9 108,3 112,9 123,6 171,0 118,1 137,8 138,0 2,4512 1,1047
Finland 1 274,1 1 302,7 1 332,7 1 264,9 1 231,7 1 194,6 1 109,5 1 080,0 1 121,7 1 167,7 0,9165 0,9904
Sweden 1 154,1 1 270,8 1 397,4 1 464,9 1 507,6 1 411,3 1 504,3 1 537,0 1 615,0 1 544,6 1,3384 1,0329
Source: Eurostat, 2020 and own calculations
1
1
1
1
111
1
11
1
1 1
1 11*
t
ttn
i
i
t
n
i
i
t
t
n
i
i
t
i
t
tt
i
tn
ii
t
i
t
i
t
Y
YYyy
Yyy
YY
y
y
yy

140
ITEMA 2020
Conference Proceedings
As can be seen from Table 1, the highest research and development expenditure (more than
1,000 € per inhabitant) was in Denmark (1,580.9 € per capita in 2018), Sweden, Finland and
Luxembourg throughout the analyzed period. The lowest was in Bulgaria (only 24.7 Euro per
inhabitant in 2009), Romania, Latvia, Slovakia, Poland, Lithuania and Malta. In 2018,
compared to 2009, expenditure increased in all countries except Luxembourg and Finland,
where it decreased - in Luxembourg by 3.87%, which represents an average annual decrease
of 0.44% and in Finland it decreased by 8.35%, on average by 0.96% per year. This indicator
grew the most in Poland in 2018 compared to 2009 by 188.18%, which is an average annual
increase of 12.48%. In Slovakia, the third highest increase was recorded by 145.12%, which is
an average annual increase of 10.47%.
In order to be able to calculate how countries have contributed to the total change in research
and development expenditure, we need to have an absolute indicator. Therefore, we chose the
indicator of total research and development expenditure, not per inhabitant. Input data and
calculation using contribution method are shown in Table 2.
Table 2. Application of contribution method on research and development expenditure in
European Union countries in 2009 and 2018
GEO/TIME 2009 2018 Relative
increase
Structural
number Contribution
Belgium 6 924,591 12 709,638 0,8354 0,0332 0,0278
Bulgaria 184,610 423,818 1,2957 0,0009 0,0011
Czechia 1 924,518 4 006,462 1,0818 0,0092 0,0100
Denmark 7 065,873 9 139,430 0,2935 0,0339 0,0099
Germany 67 078,121 104 836,000 0,5629 0,3218 0,1811
Estonia 197,393 365,650 0,8524 0,0009 0,0008
Ireland 2 735,556 3 716,800 0,3587 0,0131 0,0047
Greece 1 485,940 2 174,670 0,4635 0,0071 0,0033
Spain 14 581,676 14 946,000 0,0250 0,0700 0,0017
France 42 834,917 51 768,559 0,2086 0,2055 0,0429
Croatia 380,677 501,756 0,3181 0,0018 0,0006
Italy 19 209,000 24 581,681 0,2797 0,0921 0,0258
Cyprus 82,988 115,800 0,3954 0,0004 0,0002
Latvia 84,882 186,200 1,1936 0,0004 0,0005
Lithuania 223,471 426,306 0,9077 0,0011 0,0010
Luxembourg 620,280 727,400 0,1727 0,0030 0,0005
Hungary 1 067,166 2 051,375 0,9223 0,0051 0,0047
Malta 31,761 70,792 1,2289 0,0002 0,0002
Netherlands 10 408,000 16 748,200 0,6092 0,0499 0,0304
Austria 7 479,745 12 246,010 0,6372 0,0359 0,0229
Poland 2 095,827 6 018,489 1,8717 0,0101 0,0188
Portugal 2 771,600 2 769,072 -0,0009 0,0133 0,0000
Romania 555,887 1 024,770 0,8435 0,0027 0,0022
Slovenia 656,882 892,399 0,3585 0,0032 0,0011
Slovakia 302,994 750,947 1,4784 0,0015 0,0021
Finland 6 786,472 6 437,900 -0,0514 0,0326 -0,0017
Sweden 10 682,826 15 631,342 0,4632 0,0512 0,0237
EU 27 208 453,653 295 267,466 0,4165 1,0000 0,4165
Source: Eurostat, 2020 and own calculations

141
ANALYSIS OF RESEARCH AND DEVELOPMENT EXPENDITURE IN EUROPEAN UNION
COUNTRIES
From Table 2 we found out that total research and development expenditure in EU-27 increased
by 41.65% in 2018 compared to 2009, with the largest increase in Poland by 187.17% (similar
to research and development expenditure per inhabitant) and in Slovakia by 147.84%. They
decreased only in Portugal (by 0.09%) and Finland (by 5.14%). Germany (32.18%) and France
(20.55%) had the highest share in total expenditure in 2009. Germany (18.11%) and France
(4.29%) contributed the most to the 41.65% increase in total expenditure. In 2009, Slovakia
had only a 0.15% share in this indicator for all EU-27 countries and contributed only 0.21% to
the increase.
CONCLUSION
From the realized analysis we can draw the following conclusions:
The highest research and development expenditure was in Denmark in 2018 (1,580.9 €
per capita). The lowest was in Bulgaria (only 24.7 Euro per inhabitant in 2009).
In 2018, compared to 2009, expenditure increased in all countries except Luxembourg
and Finland, where it decreased - in Luxembourg by 3.87% (average annual decrease of
0.44%) and in Finland by 8.35% (on average by 0.96% per year). This indicator grew the
most in Poland in 2018 compared to 2009 by 188.18% (average annual increase of
12.48%). In Slovakia, the third highest increase was recorded by 145.12% (average
annual increase of 10.47%).
Total research and development expenditure in EU-27 increased by 41.65% in 2018
compared to 2009, with the largest increase in Poland by 187.17% and in Slovakia by
147.84%. They decreased only in Portugal (by 0.09%) and Finland (by 5.14%). Germany
(32.18%) and France (20.55%) had the highest share in total expenditure in 2009.
Germany (18.11%) and France (4.29%) contributed the most to the 41.65% increase in
total expenditure. Slovakia contributed only 0.21% to the increase.
ACKNOWLEDGMENT
This research was supported by the Grant Agency of Slovak Republic [KEGA grant number
007EU-4/2020 Interactive and interdisciplinary teaching of Services and Tourism Innovation
subjects using information technology].
REFERENCES
Eurostat (2020)
https://appsso.eurostat.ec.europa.eu/nui/show.do?dataset=rd_e_gerdtot&lang=en (cited
22.9.2020).
Eurostat (2020) https://appsso.eurostat.ec.europa.eu/nui/submitViewTableAction.do (cited
22.9.2020).
Eurostat (2020) https://ec.europa.eu/eurostat/statistics-
explained/index.php?title=Glossary:Gross_domestic_expenditure_on_R_%26_D_(GER
D) (cited 22.9.2020).
Hindls, R. & Hronová, S. (1997). Vývoj domácího produktu z hlediska přispění jednotlivých
faktorú. Politická ekonomie, 1997 (5), pp. 699-707.
Hurbánková, Ľ. & Sivašová, D. (2018). Hospodárska štatistika I. Bratislava: Vydavateľstvo
EKONÓM. pp. 140.
Investopedia (2020) https://www.investopedia.com/terms/r/research-and-development-
expenses.asp (cited 22.9.2020).

142
ITEMA 2020
Conference Proceedings
Pacáková, V. et al. (2009). Štatistické metódy pre ekonómov. Bratislava: Iura Edition.
pp 405.
Štatistický úrad Slovenskej republiky (2019). Štatistická ročenka Slovenskej republiky 2019.
Bratislava: Veda.

143
EUROPEAN UNION, ROMANIA AND RAILWAY TRANSPORT
Clara Elena Muț1
Ciprian Beniamin Benea2
Adrian Negrea3
Secara-Onita Adina4
Catarig Andra5
DOI: https://doi.org/10.31410/ITEMA.2020.143
Abstract: This paper aims to present the role railway transport plays in European Union and
in Romania. The importance of this mode of transport is shortly put to the reader forefronts,
while at the same time there is presented its share in land transport market. Road transport
has its advantages, but its market share cannot be motivated only by market considerations;
there are other factors which put this type of transport on a predominant position. The
advantages of rail transport are presented face-to-face with road transport especially for
passengers’ transport, how railway transport can gain a greater share in land transport
market, and how it can contribute to create the conditions of a more sustainable future.
Keywords: Railway transport, Land transport, Sustainable future.
INTRODUCTION
his paper aims to present an analysis with a component focused upon a specific market
case in railway transportation area, due to this type of transport’s peculiarities in a
competitive environment. It will present the railway transportation market regarding
passengers’ transport, in order to provide clues and development opportunities for this
economic activity and to understand the development potential this market has.
As it is the case in other areas, Romania as a European Union member state must bring into
harmony its national interest with that of the EU; this is a pressing phenomenon in railway
transport area, because the EU´s common policy on this subject is focused on the creation of a
single railway, as a key-element of European economic integration and a base for future
economic development in Europe.
The Romanian railway transport faces great challenges, especially regarding the integration in
the European railway system and exploiting opportunities brought by the quality of being a
European member; missing determination points to the incapacity to exploit the position and
potential offered by the Romanian market, and in the same time reducing the existing
discrepancies.
In the last years the Romanian railway transportation system registered numerous changes such
as restructuring, liberalization, aspects specific to administrative and legal areas; but in the
1 SC Interregional SRL - (private railway transport operator) 2 University of Oradea, Strada Universității nr. 1, Oradea 410087, Romania 3 University of Oradea, Strada Universității nr. 1, Oradea 410087, Romania 4 University of Oradea, Strada Universității nr. 1, Oradea 410087, Romania 5 University of Oradea, Strada Universității nr. 1, Oradea 410087, Romania
T

144
ITEMA 2020
Conference Proceedings
technical area – where upgrading needs huge and sustained efforts – Romanian railway
infrastructure continues to be in a visible and continuous decay, placing Romania in a weak
position face-to-face with other European states.
As a matter of fact, railway transportation is interconnected with national interest at large, and
as a consequence, strategic objectives regarding railway transport system derives from national
interest connected to improving national mobility and the state’s capacity to administrate better
its territory. Railway transport system is a key-component in this regard; from this point of
view transportation and geopolitics overlap.
Furthermore, the stimulation of railway transport in order to move persons has become a high
priority in the European Union framework, which was underscored by the White Paper in 2001;
this strategic document presented the importance and the advantages of railway transportation
related to climate changes and environmental protection (White Charta, 2015). Ten years later,
the White Paper of 2011 has specified that greenhouse emissions should be reduced by 80-95%
until 2050 related to their level in 1990 (White Charta, 2015). This document presents main
steps to be taken in order to rise railway transport efficiency, to rise its competitiveness related
to resources’ use, and to become a sustainable alternative to road transport.
In Romania, the main direction of development and types of transport’s balance promoted both
at institutional level, and by active companies operating in the transport sector, sustain national
policies in transport sector in correlation with this European strategic document.
Seeing the gap between the situation where the Romanian railway transport system is located
and the ascending trend identified in Western Europe in this field of transport, it is of outmost
importance to identify the strategies and resources in order to equilibrate the balance among
types of transport in Romania, with the aim of reducing pollution, rising mobility, and the
decongestion of roads.
The only way to recover and revitalize railway transport must be centered on improving its
competitiveness, and in this way, it would become an important part among other continental
types of transport, rising its capacity to recover its lost clients, and to attract new ones.
The current situation in Romania points to the fact that there exists a great potential regarding
the possibility to rise railway transport share on Romanian domestic transport market for
passengers’ movement: railway can attract both people which currently use public road
transport when traveling between cities, and people which use their car.
Railway transport can become a key-player on domestic transport market, as over 90%
(Development strategy 2018-2020 Ministry of Transport, p. 13) of total railway transport is
done on domestic area.
If this would be the case in the future, the success of railway transport on Romanian domestic
market, it would strengthen international railway transport, too; this would contribute directly
also to the European Union’s success related to the creation of European unique railway area.
Integration in this unique area is the strategic objective which derives from the quality of being
an EU member state.

145
EUROPEAN UNION, ROMANIA AND RAILWAY TRANSPORT
CONTEXT AND CHALLENGES
The importance that the railway has on economic, social and political fields determines all
states to develop their domestic transportation systems, and pushes them to collaborate in order
to identify border points where these networks meet each other.
The level of transport system’s development directly determines the degree and capacity to
attract material and human resources located in different areas, territorial repartition of
production capacities and their specialization, distribution of urban centers and domestic
population, size and shape of human settlements, technological, cultural and scientific
development; it improves a country’s defense capacity and determines the degree a specific
society contributes to globalization. (Gherasim T., 2007, p. 12) Shortly, greater mobility means
that in the same span of time the society with greater mobility rotates money faster, creates
greater wealth, and brings greater incomes to the national budget, because if the goods/services
are sold/bought faster so does the taxes imposed on them are collected faster. In this way,
transportation and civilization are the two faces of the same coin.
Public interests connected to transport activity determine governments get involved in this
strategic sector. Good or bad public policies in the transport sector are decisive for encouraging
or blocking the transportation activity’s success. This policy should aim:
- rising efficiency of transport activities;
- be sensitive to market trends and needs;
- attract passengers;
- be affordable and take into account the best environmental standards.
Efficiency in transportation – or its absence – is a central element for economic development
– or it can morph into a hindrance for economic development. The best way to rise transport
efficiency is to promote the cheap types of transport, as to provide the minimization of logistical
costs at domestic level.
The repartition of different types of transport is given by the evolution of different technologies
and of economic interests.
The following analysis provides clues to see general distribution of different types of transport
in Romania, the data being taken from Romanian National Institute of Statistics, and appraisals
made by Romanian Railways Company (CFR). (Development strategy 2018-2020 Ministry of
Transport, p. 23)
In Romania, the main share of passengers’ transport over land is taken by road transport, 80%
respectively. At European Union level the share of road transport in land transport is 83%, a
little higher than in Romania due to higher capacity of Western societies to get access to cars,
and a better road infrastructure.
In the following figure, there are presented the specific situations of land transport use in EU,
and in Romania respectively.

146
ITEMA 2020
Conference Proceedings
Figure 1. Different types of transport’s market share in Romania and the EU
Romania EU
Source: http://mt.ro/web14/documente/acte-normative/2018/07_03/Strategie, accessed at
10.04.2020; Development strategy 2018-2020 Ministry of Transport, p. 24
The mobility requirements of the population overland are distributed between road transport of
passengers using their individual transport options (i), and the public transport (p) provided by
road transport operators by bus and coach, and of course or by rail transport operators.
The road transport preeminence over railway transport points to the fact that it seems (at first
sight) to be superior from an economic point of view and more attractive to transport
beneficiaries.
But a study with global perspectives created together with International Railways Union (UIC)
and International Energy Agency (IEA) (Railway Handbook 2014, p. 5) indicates that railway
transport is much more efficient than road transport (Development strategy 2018-2020 Ministry
of Transport, p. 25), because:
- under the energy efficiency perspective, railway uses per transport unit 11 times less
energy than road transport;
- from environmental point of view, the costs generated to fight greenhouses gases are very
small: railway transport generates only 2% of greenhouses gases generated by transport
sector, while road transport gives 73% (European Environment Agency); this means 36
times more pollution by cars/buses than railway;
- road is much more dangerous than rail. For road transport it was taken the average of 259
deadly accidents/billion passengers/ km (Transport Master Plan 2014), while for rail
transport the average is 1,34 deadly accidents/billion passengers/ km (ERA Report). Road
gives 193 times more bad accidents than rail per billion/passengers/km; as a consequence,
medical costs due to road accidents are around Euro 1.2 billion/year only in Romania,
meaning 0.8% of GDP. (Development strategy 2018-2020 Ministry of Transport, p. 27)
As we can observe, rail transport is much more efficient from economic and environmental
points of view, and the safest one. As a direct deduction, the optimization of economic activity
is better fulfilled when railways get a bigger market share. This means lower costs for national
economy, which determines a higher competitiveness on global stage and a stimulus for
economic development. (Development strategy 2018-2020 Ministry of Transport, p. 26)
Put it synthetically, national transportation system should be characterized by equilibrium
among different types of transport, being capable to assure maximum benefits for national
economy and the potential for rising through direct cost reduction and their externalizations; to
83,1%
Railway
7,7%
Road 9,2% p

147
EUROPEAN UNION, ROMANIA AND RAILWAY TRANSPORT
rise energy security, and oil consumption’s reduction in transport sector; to reduce negative
effects of transport activity upon the environment.
The causes for the present situation where road transport has preeminence is due to political
decisions at highest level. Road transport means at first sight freedom – freedom to choose
what, how, when and where to travel – while railways means at first sight rigidity and
discipline. But in the long run, road transport means a dispersed society which generates higher
costs to administrate, while rail means industry and easier and cheaper way to administrate
territory and to centralize the forces of society. We can shortly note that even from military
point of view rail is far more strategic than road: in geopolitical fight among nations – which
is a constant of world politics – railways and fleet fights to control the area close to their
meeting points, in world ports, respectively. But as political men are in constant search for
votes, they promoted the idea of freedom through the acquisition of a personal car, and ordinary
men jump into it fast. This was one of the most important elements which gave road the present
position. Of course, the oil industry wants to sell its products, so it needs buyers, more buyers.
In this way big oil interests overlapped with political men interests.
But railway transport is of outmost importance, whose advantages could decisively contribute
to national transport system’s efficiency improving and its sustainability.
Romania’s integration in EU and the reduction of gaps among Romania and other EU member
states depends on railway transport system’s gradual integration in a unique European transport
system; the alignment to European policy and strategy in transportation field is not an option,
but a necessity. (Development strategy 2018-2020 Ministry of Transport, p. 16)
THE PECULIARITIES OF RAILWAY TRANSPORT OF PASSENGERS IN
ROMANIA
The organization of the Romanian railway transport system is in line with the European policy
and legislation in this field, in order to provide an optimal working in a competitive
environment; the principle of complete administrative separation of railway infrastructure
management and railway transport services is fully applied. The railway operator provides the
commercial relation with the client using his own resources, while the management of
infrastructure provides necessary activities which sustain train circulation, providing railway
infrastructure, too.
The asymmetric public financing of road and rail transports, characterized by funds 10 times
smaller for railways (Development strategy 2018-2020 Ministry of Transport, p. 29), has
generated a significant competitive loss, because of railway infrastructure’s decay, which has
severely limited the trains’ performances reflected in commercial speed and punctuality.
Great parts of the railway system in Romania have registered constant decay, generating speed
limits, while only 40% of the railway system is electrified (Development strategy 2018-2020
Ministry of Transport, p. 123). The commercial speed limit is around 50 km/h for passengers’
trains, 40 to 60% less than the speed for which that railway had been constructed (Development
strategy 2018-2020 Ministry of Transport, p. 91).
Due to these deficiencies, it has become a necessity to find a strategy which would define the
Romanian railway transport’s evolution, taking account of national financial capacities,
European financial support, and Romania’s national and administrative capacities.

148
ITEMA 2020
Conference Proceedings
A great project had been initiated in 2006, regarding the modernization of the rail line between
Bucharest and Constanta aiming at rising maximum speed from 140 km/h to 160 km/h, which
had been concluded in 2014. Another national project began in 2017 and its purpose is to create
the technical capacities along the 4-th European Corridor, to facilitate the jump from 50 km/h
to 120 km/h, while between Simeria and Sighisoara the passengers’ train would run even with
160 km/h.
To make business in rail transport in Romania one needs to take into account that there are,
from administrative point of view, quite high barriers, due to special and important
administrative conditions and expensive investments (licenses, safety certificates, rolling
material).
The structure of railway market regarding passengers’ transport reflects the specific legislation,
both from access to infrastructure point of view, and from the way one can operate on that
infrastructure.
The number of private companies is small, because of peculiarities of rail transport and the way
it is regulated. The market share of private railway operators is around 20% in Romania
(http://www.consiliulferoviar.ro/, p.85), meaning that this country has one of the top position
in Europe, but the market share of rail transport of passengers has significantly been
diminishing in the face of road transport (individual or public), nowadays being situated around
16% (Development strategy 2018-2020 Ministry of Transport, p. 57).
Between 1990 and 2012 the number of railway passengers had been constantly decreasing
(from 408 mil passengers/km to 54,5 mil passengers/km), but after that it has been registering
a constant increase, and in 2019 it had got to 66 mil passengers/km
(http://www.consiliulferoviar.ro/, p.8).
Romanian railway market has the peculiarities of oligopoly, being dominated by an important
leader – CFR Calatori – share of 80 to 86 %, and asymmetric quotas, 80% facing 10-14%, or
even less for other operators, put together (http://www.consiliulferoviar.ro/, p.47).
The market structure is characterized by a high concentration using Herfindahl-Hirschman
Index (HHI) calculations, which is used to measure the degree of concentration on a specific
market. It used the cumulus of square market quotas of all companies on a specific market. A
poor concentrated market has an HHI Index smaller than 1000, a medium concentrated one has
HHI between 1000 and 2000. Over 2000 the market is a concentrated one and Concentration
Ratio (CRk) points to the figure of over 6000 (HHI) and 3% (CRk), indicating the peculiarities
of a strong oligopoly (http://www.consiliulferoviar.ro/, p.47).
A point to be mentioned is the fact that the elasticity of demand is not uniform on the whole
market; there are passengers which show different degrees of sensitivities regarding price. The
main factors determining such differences are trip’s aim, incomes level, or the accessibility
(financial and geographical) of another type of transport.
The consumers negotiation’s power is reduced, market being characterized by an atomized
demand, with a significant number of people without alternatives. The low level of price in
comparison with other countries in Western Europe constitutes a hindrance for potential
competitors, and doesn’t stimulate competition’s intensification through rising profitability on
the most used networks.

149
EUROPEAN UNION, ROMANIA AND RAILWAY TRANSPORT
Graph 1: Regarding the Evolution Herfindahl-Hirschman Index and CR3 and the Degree of
Market Concentration
Source: CFR Calatori, http://www.consiliulferoviar.ro/ accessed at 15.03.2020
The degree of market transparency is limited; although the level of tariffs can be observed by
competitors; while a significant part of the costs is quite symmetrical, the costs’ structure is
difficult to identify; the railway transport’s dynamic depends even on employees’ skills,
qualifications, and motivation.
From an economic point of view, the only path for rail transport to regain its central position
depends on rising its competitiveness.
In the EU there has been registered a moderate increase in the number of passengers using
railway transport, while the situation in Romania is lower than the European average, due to
missing investments, and fierce competition for road transport.
From administrative point of view, Romania is well positioned in respect with liberalization
degree, but the main disadvantages are brought by decaying railway infrastructure and rolling
material.
The demand for railway transport is determined by endogenous and exogenous factors; the
endogenous elements are railway infrastructure’s quality, the way companies administrate
railway transport services, doubled by network density, inter-connectivity, quality of transport
services, pricing. Exogenous factors have demographical character, being influenced by the
number of people in a specific geographical area, unemployment, incomes level and a
commercial character such as number of jobs, touristic activities, and the psychological
availability to use a specific type of transport.
CONCLUSION
The action measures taken by the competition are quite timid due to structural peculiarities in
railway transport area, the main one being complicated barriers hindering market entry
strategies. But when a specific level of passengers’ transport is overcome, the commercial
incomes are bigger than the costs, the profit being directly influenced by railway transport
activity’s intensification. In that moment the railway system would become efficient on
commercial base only, without needing to attract public financing.
100 100
CR3 – see right part HHI – see left part
stânga
2010 2011 2012 2013 2014
2015
100
90
80
70
60
50
40
9020 96 96 96 9322
96
9000
8000
7000
6000
5000
4000
CRk 3 (%) HHI
6486 6476 6479
6478

150
ITEMA 2020
Conference Proceedings
But in order to get to this point, there are necessary initial investments in infrastructure, while
in order to revitalize railway transport (Development strategy 2018-2020 Ministry of
Transport, p. 34), there are needed some measures such as:
- limiting public spending (through subsidies) of road transport, and the internalization of
all costs generated by transport activity, including environmental costs;
- creation of necessary prerequisites in order to provide the framework for the railway
transport’s development, in an open and competitive environment;
- limiting necessary subsidies for railway transport until it gets to its own minimum
intrinsic efficiency.
One main premise of European transport policy is: „The continent’s prosperity will depend on all
European regions’ capacities to stay fully integrated in world economy, in a competitive manner.
Efficient transports are a vital prerequisite for this.” (Development strategy 2018-2020 Ministry
of Transport, p. 2)
REFERENCES
Carta Albă (2015)- Foaie de parcurs pentru un spaţiu european unic al transporturilor – Către
un sistem de transport competitiv şi eficient din punct de vedere al resurselor https://eur-
lex.europa.eu/legal-content/RO/LSU/?uri=celex:52011DC0144
Development strategy 2018-2020, Ministry of Transport, Bucharest, Romania
Gherasim T. (2007) Sisteme de transport, Transporturi feroviare, Editura Bacovia, Bacău,
Romania
Railway Handbook (2014) - Energy Consumption and CO2 Emissions - Focus on
Infrastructure European Environment Agency
CFR Calatori, http://www.consiliulferoviar.ro/; Studiu de piaţă în transportul de călători

151
BASIC ELEMENTS OF THE FINANCIAL FUNCTION IN BUSINESS
ENTITIES
Slobodan Bracanović1
DOI: https://doi.org/10.31410/ITEMA.2020.151
Abstract: Finance and accounting are the essences and the lifeblood of the business doing of
business entities. Classical financial mechanisms and instruments are adapted to the
contemporary conditions of profitable business doing. The real economy is the basis of the
financial economy. Public finance is a special field. Virtual, parallel finance is manifested in
contemporary business doing.
Keywords: Finance, Accounting, Function, Market, Flow, Capital, Virtual.
1. PRIOR DETERMINANTS
inance, i.e. the financial function (apart from the supply, production and sales functions),
is of special and priority significance in all business entities. The financial function of a
business entity (an enterprise, a company) is possible to perceive as the flow and process
of the management of monetary jobs and tasks, i.e. the collection, accumulation, concentration
and securing of financial assets for manufacturing, service, commercial and marketing goals
and purposes, and so forth. The financial function is the underpinning for the achievement of
financial decision-making (analyses, research studies, business operation and profitable
business doing rating and assessment), as well as strategic, tactical and operational decision-
making, investing - and personnel-related decisions (in the short, medium and long terms), and
so forth.
The role, place, and significance of finance in the management system can be perceived in a
complex and differentiated manner, bearing in mind a very complex set of factors:
manufacturing, capital, a structure, costs and changes, an increase in value; business and
financial decision-making; the distribution of own funds; anticipated changes and an increase
in monetary flows; the creation and modelling of projections, concepts and strategies; the
management of riskiness, a salary (stimulus) payment policy; the estimation and assessment of
effects, the results of profitable business doing, and so on. Finance is the lifeblood of the
economic mechanism.
Each one of the existing functions in business entities contains and includes the management
of the function itself as well. Analogously, there is also the management of the management
system itself (“meta management”). The place, role and significance of finance in general
management are important. More specifically, apart from general management in the supply,
manufacturing and sales functions (enterprises), it is also possible to observe financial
management in each one of these individual business functions. Namely, the connectedness
between the financial function and goods and monetary flows, on the one hand, and the other
functions in the management of business entities crystallizes itself. Circulation and the “circular
1 Faculty of Economics in Priština, Kosovska Mitrovica
F

152
ITEMA 2020
Conference Proceedings
flow of reproduction” is traced from money, goods (raw materials and reproduction materials),
manufacturing and goods again (finished products), realized money etc.
The financial goals that can be classified in a principled way into the following groups: initial,
interim (interphase and interstate) and final assume special significance. “Initial goals” include
the optimal structure of assets and sources of funds, liquidity, rational and purposeful
investments. “Interim goals” include financial stability and balance, cost (expense)
minimization and the maximization (optimization) of income, revenue and a profit
(accumulation), solvency, asset turnover (favoring the speed of such turnover) and so on. Final
goals incorporate the financial strength, poser and independence (i.e. autonomy); the
maximization of gains and a profit (profitability) as a target function; an increase in property
(assets). The structure of said financial goals and the interactive connections existing between
them are perceived. The role and significance of these goals achieve both for the financial
function and overall management, guidance and decision-making in a concrete business and
social, or state (public) entity crystalize themselves. (6; 2015, 325 – 326).
2. THE INTER-CAUSALITY OF FINANCIAL DETERMINANTS
The connectedness, interdependence and inter-conditionality of financial determinants in
business and social entities are perceived bearing in mind the financial goals, organization,
policy, concept and strategy, the information system, and decision-making flows.
Diagram 1. The connection of the factors: the financial goals and policy, information and
decision-making:
The main, basic tasks of the financial function encompass a panoply including planning the
financial assets of profitable business doing, the provision of assets (own, credit, donations,
etc.) for all business functions, the use and functional use of assets (inflow and/or outflow
dynamics), placement (forms, time, riskiness, anticipated yields) and potential transformations
(the circular flow) of assets from one form into another, the collection of realization and claims
based upon products and/or services (manufacturing, nonmanufacturing, combined), the
monitoring of all the monetary asset flows through the control system (cashier operations,
securities received and issued, giro accounts, liabilities and receivables (claims), unfinished
production, buyers, suppliers, stocks, interests, insurance, integration, etc.).
There are also derived and accompanying tasks of the financial function that include the
recording and control of financial documentation, the financial analysis of business operations
(the analysis of the balance, ratio analysis, the analysis of productivity, profitability and cost
effectiveness, liquidity, solvency), the payment modality (cash, noncash, etc.), informing,
reporting, and so forth. The close connectedness between the bookkeeping-accounting and the
financial functions as the “more passive” activity and the “more active” activity, respectively,
Financial policy and goals
OrganizationInformation
(system) Decision-making

153
BASIC ELEMENTS OF THE FINANCIAL FUNCTION IN BUSINESS ENTITIES
is crystallized; it is quite frequently the case that, in practice, these two functions are performed
as one, the so-called financial-accounting function.
The goals and tasks of financial activities indirectly economic, or social and/or state-owned
entities, determine constant programming, the designing and planning of diverse activities and
actions integrally including diverse balance positions (in the Balance Sheet and the Profit and
Loss Account), planning different flows and processes (of cash, total assets, the basic and
working funds, i.e. capital, in a contemporary complex interpretation, etc.). For said reasons,
the financial function performed in business entities is carried out in connection with the scope,
complexity and sophistication of financial tasks, and in compliance with different principles of
the organization, such as centralization, decentralization, mixed forms, etc., also depending
upon numerous (internal and external) factors, the form of the activity, the technical-
technological equipment of work and personnel potentials, marketing, etc. and that function is
becoming ever-stronger in contemporary conditions. (6; 327-328)
Diagram 2: The model of the organization of the financial function and jobs in business
entities:
The activities of the raising, collection and placement of assets include financial business
operations, (5), making investments in research and development, the activities in the financial
market (capital), and asset insurance and channeling activities. Payment operation and
liquidation jobs include obligations (liabilities) towards suppliers and receivables from buyers,
liquidation (“depot”), cash-in-hand, and so forth. The activities of financial management
include planning (the plan), analysis, control and reporting. There are also interim jobs. (6;
328).
The connection between and inter-conditionality, intertwinement and the crisscross nature of
the flows and actors in financial planning are indicative, bearing in mind the complex
multidimensional, dynamic plan set of factors and elements, such as fixed assets, the stocks of
raw materials, materials (reproduction materials), manufacturing in progress, the stocks of
finished products, salaries and other costs of labor, amortization, buyers and suppliers,
receivable collection, cash flows, sales and administrative costs, cash and loan sales, sales
Financial management
Financial goals, interests and
tasks
Payment operations and
liquidation
Asset concentration and placement

154
ITEMA 2020
Conference Proceedings
assets and purchase assets, investment, shareholders and lenders, the use of loan arrangements,
loan placement payoff, dividends, inflationary tendencies and the reality of nominal indicators,
and so on. There are cash flows from business, investment activities, funding (collection and
payout, asset inflows and outflows). Cash flows are realized as the net changes in cash assets
during a business period (6; 329-330). Finance and accounting are the very backbone of
business operations.
Diagram 3: The principles/rules of financing as the norms of the application of a financial
policy
“The Profitability Principle” expresses a positive financial effect, which implies that it
expresses optimal, maximum results on a longer- or longtime horizon. “The Safety Principle”
assumes that the business from which the spent monetary assets will be valorized with a
(relative) certainty are financed. A business entity aspires to a reduction in and the
minimization of costs and the strengthening of its own sources of financing (in closing the
“funding construction”). The impossibility of the collection of receivables that must necessarily
be minimized is also a risk. There are also suspicious and/or disputed receivables. “The
Flexibility (Elasticity) Principle” denotes the ability to adapt to changed market and
conjunctural conditions quickly or more slowly in a short term. The additional capital
conditioned by an increase in the scope of and/or changes in the business operation structure is
also a necessity. “The Excessive Indebtedness Protection Principle” implies the funding
brought into compliance with riskiness, i.e. the share of own capital necessarily has to be
proportional to riskiness, i.e. risk should necessarily be accompanied by a greater share of own
capital (with an increase in the share of own capital, the independence and autonomy of a
business entity - enterprise also increases). The rules of financing imply norms for the
implementation of a financial policy. The financing principles include a) a relationship between
own and foreign capital (vertical rules), b) the relationships between parts of assets and capital
(horizontal rules), and c) related factors (cross-elements). This is the domain of classical
finance. The purport of financial analysis implies offering an information base for the
tendencies of the development of the analyzed or investigated phenomenon through the
decomposition of phenomenal forms and comparison, all aimed at and for the purpose of
decision-making, making correct decisions, and undertaking adequate activities and
procedures. The capital market, which is favored in contemporary conditions of profitable
Safety
Protection from excessive
indebtedness
Flexibility etc.Profitability
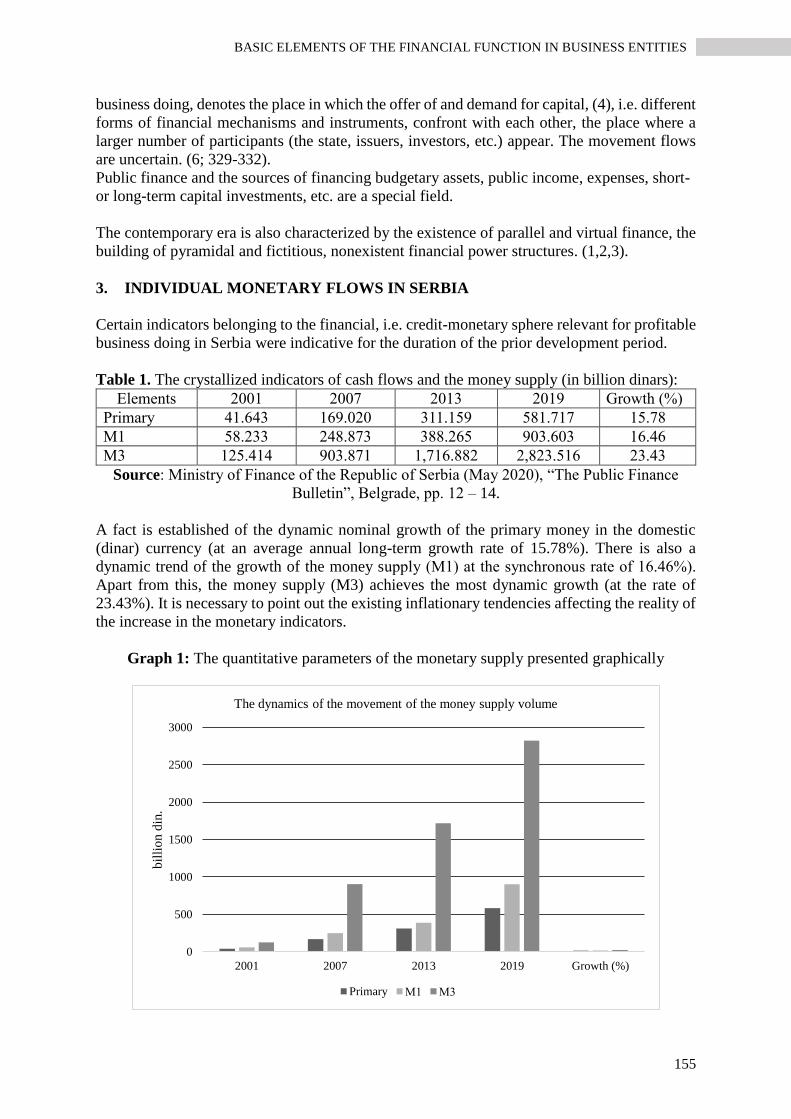
155
BASIC ELEMENTS OF THE FINANCIAL FUNCTION IN BUSINESS ENTITIES
business doing, denotes the place in which the offer of and demand for capital, (4), i.e. different
forms of financial mechanisms and instruments, confront with each other, the place where a
larger number of participants (the state, issuers, investors, etc.) appear. The movement flows
are uncertain. (6; 329-332).
Public finance and the sources of financing budgetary assets, public income, expenses, short-
or long-term capital investments, etc. are a special field.
The contemporary era is also characterized by the existence of parallel and virtual finance, the
building of pyramidal and fictitious, nonexistent financial power structures. (1,2,3).
3. INDIVIDUAL MONETARY FLOWS IN SERBIA
Certain indicators belonging to the financial, i.e. credit-monetary sphere relevant for profitable
business doing in Serbia were indicative for the duration of the prior development period.
Table 1. The crystallized indicators of cash flows and the money supply (in billion dinars):
Elements 2001 2007 2013 2019 Growth (%)
Primary 41.643 169.020 311.159 581.717 15.78
М1 58.233 248.873 388.265 903.603 16.46
М3 125.414 903.871 1,716.882 2,823.516 23.43
Source: Ministry of Finance of the Republic of Serbia (May 2020), “The Public Finance
Bulletin”, Belgrade, pp. 12 – 14.
A fact is established of the dynamic nominal growth of the primary money in the domestic
(dinar) currency (at an average annual long-term growth rate of 15.78%). There is also a
dynamic trend of the growth of the money supply (М1) at the synchronous rate of 16.46%).
Apart from this, the money supply (M3) achieves the most dynamic growth (at the rate of
23.43%). It is necessary to point out the existing inflationary tendencies affecting the reality of
the increase in the monetary indicators.
Graph 1: The quantitative parameters of the monetary supply presented graphically
0
500
1000
1500
2000
2500
3000
2001 2007 2013 2019 Growth (%)
bil
lio
n d
in.
The dynamics of the movement of the money supply volume
Primary М1 М3

156
ITEMA 2020
Conference Proceedings
Table 2. The volume of loan placements to the corporate sector and the retail sector (in
billion dinars):
E l e m e n t s 2001 2007 2013 2019 Growth (%)
Corporate sector 247.829 508.167 1,110.016 1,290.788 9.60
Retail sector 5.277 305.967 673.696 1,111.392 219.17
Total (1+2): 253.106 814.134 1,783.712 2,402.180 13.32
Source: Ministry of Finance of the Republic of Serbia (May 2020), “The Public Finance
Bulletin”, Belgrade, pp. 12 – 14.
It is possible to perceive the dynamic long-term growth of financial loan placements
(arrangements) to the institutional (individual) corporate and retail sectors, and in the total
volume as well. The most dynamic growth is achieved by the loan assets directed with a special
purpose towards the retail sector. Again, it is needed to highlight the inflationary trends
affecting a reduction in the real value of the nominal parameters in this period. Inflation
(expressed by the retail consumer price growth rate) was on average 91.8% and 1.7% in 2001
and 2019, respectively. In the latest available period (May 2020), inflation was reduced (0.7%
at the interannual level), and this trend was significantly affected by the movement of the oil
derivative prices. Synchronously, the comparative inflation of the EU countries is lower
(0.6%).
Graph 2. Clearer presentation of the loan volume numerical parameters
In the current period, the biggest formative share in the structure of the placements to the
corporate sector was achieved by loans for working assets (38.9%) and investment loans
(43.3%), with the interannual growth of the working asset loans (12.2%) and investment loans
(24.5%). Comparatively, when the placements to the retail sector are concerned, the biggest
structural share was achieved by cash loans (43.8%) and residential loans (36.3%), with the
interannual growth of cash loan assets (16.5%), as well as residential loan arrangement (6.4%).
0
500
1000
1500
2000
2500
3000
2001 2007 2013 2019 Growth (%)
bil
lio
n d
in.
The trends of the volume of loan placements to the corporate and retail
sector
Corporate sector Retail sector Total (1+2):

157
BASIC ELEMENTS OF THE FINANCIAL FUNCTION IN BUSINESS ENTITIES
Regarding the structure of the sources of the bank assets, the share of the assets lent dominates
(85.3% at the end of May 2020). Comparing that with the same period of the previous year, the
lent assets increased (1.4%). The structure could also be substantially more favorable.
From the aspect of the currency structure of the asset sources, too, the foreign-exchange sources
prevail, participating with a share exceeding one-half (50.6%); however, the share was reduced
in comparison with the identical period of the last year (1.9%), which is the question of the
optimality of the share of the domestic sources.
The “inflow of (foreign-exchange) assets” was also achieved by issuing state (public) bonds in
the international financial market to accomplish operational goals.
The money supply was covered (M1, 159%) even considerably more than the half-year
imports. In May 2020, the NBS retained the level of the reference interest rate (1.5%). The
movements in the foreign exchange market are a determinant of the real depreciation of the
domicile currency in comparison with the EUR currency (0.1%), whereas nominally, the Dinar
did not fluctuate. In comparison with the same period in the last year, the foreign-exchange
rate achieved a nominal appreciation (0.3%) and a real appreciation (0.9%). With the aim of
amortizing enormous current oscillations, the financial institution, i.e. the NBS, intervened at
the interbank foreign-exchange market with a greater amount of money (i.e. 250 million euros)
in May 2020.
Banks are also the largest individual investors in state securities.
Speaking about financial markets, the trade of securities, stocks and bonds was reduced by one-
third in May 2020 in relation to the same period in 2019 on the Belgrade Stock Exchange.
Furthermore, the total market capitalization at the end of May 2020 was considerable (510.1
billion dinars); however, it was reduced by 2.6% in comparison with the identical period in
2019. Besides, this year in May, foreign investors did not have a big share in the total turnover
on the Stock Exchange (6.15%), the same being reduced by 7.25% in comparison with the
same period in 2019. The share of foreign investors in trade flows and stocks was
synchronously significant (28.74%, with a comparable growth of 18.59%), whereas this share
in the trade of the public bonds of the RoS was smaller (4.17%, with a comparable significant
reduction 10.30%). The oil price (for the Urals oil type) was over 30.65 dollars/barrel, and the
price has been reduced by 41.7% since the beginning of 2020 in comparison with the same
period in the previous year (7; 7-10).
4. CONCLUSION
Finance and accounting are the backbone, depth and “lifeblood” of the business operations of
a business entity. Financial goals and principles have theoretically and practically been
elaborated. Namely, for example, the liquidity principle shows whether a business entity in
capable of valorizing (i.e. paying for) its liabilities that have come due and payable
simultaneously maintaining the necessary volume and/or structure of working (monetary and
other) assets and maintaining a solid “credit rating, i.e. financial reliability”.
The financial indicators of activities are expressed by the relations of the total income and
costs, individual and total investments in business assets, and so on. These relations represent
the coefficients of the turnover of such business (basic and working) assets (which can be
different). A financial constellation is denoted by the ownership structure of the source of

158
ITEMA 2020
Conference Proceedings
assets. This structure has a goal to perceive the proportion of own and borrowed sources of
financing. The indicators of the market value are indicative for enterprises (especially so for
joint-stock companies), and they encompass the indicators of the market price per share, net
earnings per share, dividends and so on.
Efficiency is reduced to the “minimax” principle, i.e. the principle implying minimum
investment and maximum effects. The real economy is the basic of the financial economy.
“Virtual finance” is the contemporariness.
REFERENCES
Bulatović M. (2004), Pravila ćutanja, Narodna knjiga, Alfa, Beograd;
Bulatović M. (2011), Ekonomija i demokratija - Držati glavu iznad, Jumedia Mont, Podgorica;
Bulatović M. (2018), Nevidljivi lanci - Moć nepostojećeg novca, Laguna, Beograd;
Dragutinović D., Filipović M., Cvetanović S. (2005), Teorija privrednog rasta i razvoja, Centar
za izdavačku djelatnost Ekonomskog fakulteta u Beogradu, Beograd;
Jančetović M., Đurić Z. (2005), Strategijski i operativni menadžment, Beogradska poslovna
škola, Beograd;
Mašić B., Dželetović M. (2015), Uvod u menadžment, Inovacioni centar fakulteta bezbjednosti
Univerziteta u Beogradu, Akademska knjiga, Novi Sad, Beograd;
Ministarstvo finansija Republike Srbije (maj, 2020), Bilten javnih finansija, Beograd, str. 7-14.

159
HUNGARIAN IFRS IMPLEMENTATION FROM TAX PERSPECTIVE
Gábor Fehér1
Éva Karai2
DOI: https://doi.org/10.31410/ITEMA.2020.159
Abstract: The influence of corporate income taxation on financial statements presented on a
domestic accounting standards basis differ by countries in a wide range. Corporate income
taxation in Hungary has a strong connection to the Hungarian Accounting Act. From 2016 it
is prescribed or allowed for specific companies to present their financial statements on IFRS
basis. The transition represented not only a challenge in the accounting system of the
companies, but the state had to face new tasks because the taxation of IFRS companies had to
meet the tax principle of horizontal equity and ensure the proper tax revenue. Research data
arise from financial statements of Hungarian companies listed on the Budapest Stock
Exchange. The average effective tax rate of Hungarian listed companies decreased after the
transition. Temporary tax rules for IFRS companies were applied to reach the tax level of the
companies that prepare their financial statements following the Hungarian Accounting Law.
Authors compare the results with empirical findings of other European countries.
Keywords: IFRS, Corporate income taxation, Listed companies.
INTRODUCTION
n Hungary, from January 2016 on a range of companies have the opportunity, and since
2017, the obligation to apply the International Financial Reporting Standards (IFRS) by
preparing their separate financial statements. To prepare transition, reconciliation with the
various areas affected, such as e.g. accounting, taxation, collection of statistical data, has started
from the very outset (Molnár, 2015).
In Hungary, the calculation of corporate tax relies strongly on the information obtained in the
course of the derivation of accounting profits; therefore, the taxation issues of transition to the
IFRS had utmost importance. The member states of the European Union are of divergent views
whether they approve or not the use of IFRS on the level of separate financial statement 3 (Bíró,
2015). The Anglo-Saxon countries and those Central and Eastern European countries that have
joined later the EU would allow the application of the IFRS for a much broader circle of
companies. On the other hand, Germany, France and Austria, where taxation and accounting
are traditionally closely related, would allow only for the narrowest circle prescribed in the IAS
regulation to prepare their separate financial statements in conformity with the IFRS (Guggiola,
2010; Procházka and Molín, 2016).
1 Eotvos Lorand University Institut of Business Economics, 1088 Budapest, Rákóczi út 7, Hungary 2 Eotvos Lorand University Institut of Business Economics, 1088 Budapest, Rákóczi út 7, Hungary 3
https://ec.europa.eu/info/sites/info/files/business_economy_euro/company_reporting_and_auditing/docume
nts/ias-regulation-use-of-options-overview_en.pdf (European Committee, 2019)
I

160
ITEMA 2020
Conference Proceedings
The situation of the Central European countries and, among them, Hungary, is peculiar because
so far as the relation between accounting and corporate taxation are concerned they are
conventionally much closer to the stringent German approach; still, as regards the application
of the IFRS they tend to be much more allowing and stand closer to the Anglo-Saxon practice.
The more widespread the application of the IFRS becomes on the level of the member states,
the more important it is to find out how can IFRS-based accounting be harmonised with
taxation (Brüggemann et al., 2012; Cuzdriorean and Matis, 2012; Jacobs et al., 2005).
Several empirical studies have examined actual or theoretical corporate taxation in the member
states with taxes computed according to the IFRS or local accounting principles (Eberhartinger
& Klostermann, 2007; Gavana et al., 2015; Haverals, 2007; Jirásková, 2013). However, partly
due to the vast differences in the methodology of the studies the conclusions significantly differ
in whether the introduction of the IFRS would result in tax deficit or tax surplus for the
respective exchequers of the different member states. The doubt raised before the introduction
of IFRS in Hungary, namely whether transition shall or not have any negative impact on
taxation, coincide with these quite diverse empirical results (Mészáros, 2015).
TAXATION OF IFRS COMPANIES
In Hungary, the most significant of all taxes levied on profits is the corporate tax. Earlier all
companies in Hungary calculated the corporate tax based on the profit before tax as per the
local GAAP, but after the transition, IFRS companies declare their corporate tax on the PBT
as per IFRS.
As at the transition the parties set as a goal the principle of fiscal neutrality (Molnár, 2015), it
had to be achieved that the tax liabilities of the companies should be more or less the same
irrespective of their accounting systems. To reach this goal, adjusting items were required
(Borók, 2015), and finally, amendments to the tax act were adopted. Companies under the
domestic accounting system use adjusting items for modifying the tax basis. These adjusting
items arise from the different requirements of the Act on Accounting and the Corporate Tax
Act. The IFRS companies need further adjusting items to balance the differences between
accounts prepared according to the IFRS and the Act on Accounting.
In the preparatory phase, the proper level of tax revenue was also formulated as a requirement
in the transition process. A minimum tax was applied to maintain the stability of state revenues.
Accordingly, in the fiscal year of transition and the consecutive tax year companies shall pay
a corporate tax at least the same that paid in the last fiscal year preceding transition. When the
company, due to unfavourable economic processes, should pay a significantly lower amount
of corporate tax than the amount paid before the transition, a special exemption can be applied.
The legislator tries to eliminate the above anomaly of the minimum tax by a temporary solution.
If the corporate tax liability of the company as calculated according to the Hungarian
accounting rules would be less than in the year before the transition, then it can lodge a special
request for its tax liability to be established according to the acts on accounting. This remedy
is therefore available only temporarily as the exemption can be requested only in the year of
transition and the consecutive one. In that case, companies shall have a bookkeeping system
that meets the requirements of both IFRS and Hungarian Accounting Act (hereinafter;
Hungarian Accounting Standards, HAS).

161
HUNGARIAN IFRS IMPLEMENTATION FROM TAX PERSPECTIVE
Companies that establish their tax liabilities from the profit before tax as per IFRS incorporate
into their calculations the differences between the two accounting systems with the help of a
multi-phase corporate tax calculation process. As the Hungarian accounting rules treat the
changes in the equity in a way different from the IFRS, therefore these differences shall need
to be adjusted. The accounting treatment of expenses and incomes shows differences in the two
systems, either; so, these differences must be adjusted, too, still before the establishment of the
adjusted pre-tax profit.
Adjusted PBT shall be further modified because of the differences stemming from the different
approaches of the statutory provisions regulating accounting and taxation. This modification
circle has impacts on several points on the tax expense of those applying the IFRS. The switch
from HAS to IFRS causes transition differences which also have to be considered on this level.
After the consideration of the previously mentioned tax base adjustments, companies determine
the corporate tax, which can be reduced potentially by tax benefits.
METHODOLOGY AND DATA
In our study, we analysed data on the corporate taxes paid between 2016 and 2018 by
companies transitioning to the IFRS in 2017. According to the data published by the Hungarian
National Tax and Customs Authority in 2017 (NAV, 2017), 142 companies that have
transitioned to IFRS and preparing their accounts thereunder have filed corporate tax returns.
We have confined our study only to companies listed on the Budapesti Értéktőzsde (Budapest
Stock Exchange) as of 01 January 2020. The reason for this is that listed public companies are
the only well identifiable group, that were uniformly obliged to adopt the use of IFRS.
On 01 January 2020 shares of 43 companies were listed on the Budapest Stock Exchange.
Among these companies, 35 were listed in both 2017 - at the date of the obligatory IFRS
transition. So, these companies have data relevant for our study. We removed the data of an
association of savings banks, as it transitioned to IFRS in 2019. As a result, the 34 enterprises
taken into account in the study represent only 24% of the transitioning companies, but they
collectively account for 67% of the cumulated pre-tax profits of all. Therefore, the changes that
can be observed in the sample well represent trends in state revenues as a result of the transition.
As regards their legal forms, out of the 34 companies, 33 are public companies limited by
shares and 1 is a European company. As regards their business, industrial production
companies, services providers and financial firms have a more or less equal share among them,
and there are a small number of real estate companies, one bank and one insurer among them.
In our studies, we examined data in the financial statements of the 34 companies above for the
period between 2016 and 2018. Using these we have obtained for each year the actual effective
tax rates by the help of formula 1.
effective tax rate =Corporate tax for the year of assessment
IFRS profit before taxation –Other profit taxes (1)
Thus, from the period before the transition, from among the financial statements prepared in
2016 as per Hungarian Act on Accounting those were taken into account that had a positive
pre-tax result in 2016, and their profit and loss statement showed corporate tax expense. Thus,
out of the pre-selected 34 companies, the data of 17 could be used regarding 2016. From FYs
2017 and 2018, i.e. the period after the transition, we have collected the corporate tax liability

162
ITEMA 2020
Conference Proceedings
and the pre-tax profit in the IFRS financial statements. We have taken into account companies
that had tax liabilities in the given years and a positive pre-tax result. Seventeen listed
companies met these criteria in 2017, and 24 in 2018.
The IFRS income taxes differ from those computed as per the Hungarian Act on Accounting;
therefore, they had to be adjusted. The Act on Accounting interprets only corporate tax as an
income tax expense in the year of assessment. Several IFRS companies in Hungary classify
local business tax and innovation tax as an income tax under IAS 12 and other companies
present these tax types as other operating expenses, which is the right treatment on the basis of
the local GAAP. In 2017 were 20 and in 2018 22 cases, where these taxes were treated as
income taxes. We filtered them from the pre-tax profits.
Table 1. Accounting for "other income taxes" at the companies studied
Year 2017 2018
Accounted for as income tax 21 23
Accounted for as other operating expense 12 11
No data available/no IFRS FS 1 0
Total 34 34
The average amount of the effective corporate tax could be determined from the effective
corporate tax rates of the companies using formula 1. The results of the calculations are
summarised in Table 2.
Table 2. Rate of the average effective corporate tax
2016 eff. CT 2017 eff. CT 2018 eff. CT
Average effective corporate tax 6.72% 3.35% 7.33%
The cleaned average effective tax rate 5.76% 3.10% 4.97%
The averages presented in the first row of Table 2 contain some extreme values that
considerably distorted our results; we cleaned our database. As a result, we calculated the
cleaned effective tax rates, in which the highest and the lowest effective tax rate values of the
respective companies were not included. The cleaned average effective tax rates can be found
in the last row of Table 2. We have compared the data obtained with national tax authority data
for IFRS taxpayers published by Tóth-Takács (2018).
Table 3. Computation of the corporate tax of companies using the IFRS in 2017 (data in
HUF)
1. Profit before tax as per IFRS (IFRS PBT) 895,014
2. IFRS PBT adjusting items (a+b) -36,909
a. Other income taxes (local business tax, innovation tax, etc.) -33,645
b. IFRS adjustments -3,264
3. Adjusted profit before tax (APBT) (Lines 1+2) 858,105
4. Total APBT adjustments – not including Line 5 -559,364
5. IFRS transition difference -9,459
6. Tax base (Lines 3+4+5) or minimum income 286,542
7. Corporate tax payable or minimum tax 20,815
Source: Authors processing based on data of Tóth-Takács (2018)

163
HUNGARIAN IFRS IMPLEMENTATION FROM TAX PERSPECTIVE
RESULTS
From the results of the cleaned data, it is obvious that from the first year of the transition to
IFRS, i.e. from 2017, the average tax rate of public listed companies has considerably
decreased. It must, however, be examined whether it comes from the transition or other
processes could also contribute to the considerable decrease experienced in 2017.
An explanation for the decrease can, on the one hand, be that from 2017 the rate of corporate
tax has changed. As opposed to the progressive taxation applied before (the rate of the corporate
tax was 10 % up to a tax base HUF 500 million and 19% after that), a fixed rate 9% corporate
tax was introduced. Thus, in order to make the data for 2016 to be comparable with data from
subsequent periods, it was justified to recalculate the corporate taxes for 2016 by the tax rate
introduced in 2017. In 2016, the financial statements complied the Act on Accounting, and they
also include a detailed breakdown of the calculation of the corporate tax; thus, the theoretical,
9% tax can be derived from these.
Table 4. The impact of the change in the nominal rates on the effective tax rate
Tax base Eff.tax_10-
19%
Eff.tax_9
%
Change of
rate
Change of tax
burden
HUF 0-500 million 4.41% 2.60% -1.81% -43.53%
HUF 500 million < 7.68% 6.91% -0.77% -10.00%
Eff- CT tax_total 6.72% 5.64% -1.07% -16.84%
millionCleanef
CT_total 5.76% 4.73% -1.03% -17.92%
Although it seems to be an apparent explanation as the tax rate was reduced from 19% to less
than its half, i.e. to 9 %, it is important to note, that out of the 17 companies with data relevant
to 2016, there were only five whose tax base exceeded the HUF 500 million limits, accordingly,
the remaining 12 companies could apply the lower, 10% tax rate for their entire tax base.
In this way, the tax burdens of the twelve companies with a tax base under HUF 500 million
decreased by a mere 10% as a result of the recalculation of the data for 2016, while their
effective tax rates have decreased by 0.77-point percentage. For tax income, however, the
figures for the five "key accounts", who in 2016 have accounted for 95% of the total amount
of the tax liabilities of the above 17 companies are crucial. Their tax liabilities decreased by
43.53% on average, and their average effective tax rates from 4.41% to 2.6%.
As shown in table 4, the impact of the tax rate reduction introduced in 2017 on the effective
tax rates and the tax burdens of the companies is smaller than the decrease experienced in the
year of transition. Thus, the change in the tax rates in itself could not result in a drop of the
average effective tax rates of companies to almost the half in the year of transition compared
to these in the preceding year, i.e. 2016.
Although to allow their comparison, all other profit taxes except corporate tax were already
reclassified into the profit before tax; there are still differences that result from the different
accounting approaches. The IFRS adjusting items in PBT are aimed to treat this difference. In
order that their impact and efficiency could be examined, we had to compare the pre-tax profits
computed in two different ways. We can use as a point of reference the pre-tax profits for the
year 2016.

164
ITEMA 2020
Conference Proceedings
IFRS 1 requires the presentation of the data for the business year preceding transition for
comparative purpose, in the first financial statements prepared based on International Financial
Reporting Standards. Thus, the financial statements of those who transitioned in 2017 also
include the comparative data for 2016. In these, we can find the profit before tax for 2016 that
shall be adjusted as aforesaid by the other income taxes accounted for in the income tax
expenses.
We compared the two types of data of those listed companies whose calculated pre-tax profits
and corporate tax liabilities had a positive value in 2016 both in IFRS, and HAS. 15 of the 34
companies (seven listed on BUX and eight other traders) met this criterion. Using the data, we
examined how the difference between the pre-tax profits estimated according to the IFRS and
by the method prescribed by the Hungarian Act on Accounting impacted the average effective
tax rate.
Table 5. Theoretical impact of the average effective tax rate change in 2017 on 2016
Av._diff.PTP
(Act on Acc./IFRS)
IFRS 2016 Act on Acc. 2016
Eff.tax rate Eff.tax_10-19%
Other +27.93% 7.52% 7.97%
BUX +14.77% 2.49% 2.89%
Total +21.79% 5.17% 5.60%
From Table 5, it is apparent that, on average, the IFRS profit before taxation is higher than in
HAS. It is not only valid for the averages but also the single companies: as a result of the IFRS
transition, the PBT decreased by only three companies, out of the 14 examined companies.
We also further examined other IFRS tax adjustments from the data of the national tax authority
(Tóth-Takács, 2018), presented in Table 3. The total IFRS adjustments, other than the other
income tax corrections, result in a much lesser decrease in the IFRS profit before tax. On the
level of the adjusted PBT, essential adjustments are the adjusting effects of the transition
differences. If we examine their increasing or decreasing impact on the tax base separately,
then they are relatively significant. If, however, we consider them on their net values, their
impacts amending the tax base become less significant compared to the other adjusting items
associated with the IFRS.
Following their transitions to the IFRS, these companies have, as a non-recurring effect, a
transition difference. According to IFRS 1, transition difference is accounted for directly in the
equity; therefore, it does not affect the profit or loss. Although this difference is accounted for
within equity, according to the Act on Personal Income Tax, it is still considered as an adjusting
item of the tax base. According to the 2017 data, the predominant part of the transitioning
companies availed themselves of the opportunity to decrease their tax base by the transition
differences. The negative difference can be accounted for as a decreasing item in three years,
while the positive difference can either be accounted for in three years or all in one sum, in the
year of transition. The transition difference is a one-off effect in the tax of the IFRS companies.
The adjusting effect of the transition difference ceases in the third year, at the latest, following
the transition, and from then on it causes no difference compared to the tax determination of
companies of the Hungarian Act on Accounting.
There are also adjusting items which both affect IFRS and the Hungarian Act on Accounting
companies; however, the adjustment affects the two circles differently: e.g. IFRS companies

165
HUNGARIAN IFRS IMPLEMENTATION FROM TAX PERSPECTIVE
more frequently use fair value measurement in their financial statements than local GAAP
companies.
Among the examined companies, there were several holding companies, participants of the real
estate market and financial services providers; by whom fair value measurement is a usual
accounting practice, the impacts may cause a significant difference in the pre-tax profits of the
two accounting systems.
By 2016, compared to the local GAAP, the pre-tax profit items were extended according to
IFRS. Among the real estate companies, the profit before tax as per the IFRS was always higher
than per local GAAP. During 2016 a steady price growth could already be observed on the real
estate market (MNB Lakásárindex, 2020; Statisztikai Tükör, 2019), then this price increase
could manifest through the fair valuation in the IFRS pre-tax profits. These surplus profits
appear as a decreasing item in the tax base by the same amount as the profits originating from
the fair valuation.
Thus, due to the adjusting items, the fair valuation had no impact on the amount of the corporate
tax. It, however, decreased the effective tax rate calculated from the pre-tax profits obtained
according to the IFRS.
CONCLUSION
In our paper, we examined corporate tax data obtained from the financial statements of
Hungarian companies listed on the Stock Exchange. Our research question focused on the tax
revenues of IFRS companies after the transition.
In Hungary, IFRS companies may use the profit before tax presented according to the
international standards as the basis for the calculation of their corporate taxes.
In Hungary, the corporate tax base is determined on a domestic accounting basis. IFRS
companies apply tax base adjusting items, taking into consideration also the domestic adjusting
items and tax benefits.
According to data regarding share issuers listed on the Budapest Stock Exchange, in the year
of transition, i.e. in 2017, the average effective tax rates of the companies decreased
significantly, and this lower value also remained in 2018, i.e., the year following the transition.
The decrease was larger than the considerable decrease in 2017 of the nominal corporate tax
rate.
The PBT adjustments and the recognition of the transition differences also explain the decrease
of the effective tax rate. The tax base adjustments secured the steadiness of tax revenues and
the tax neutrality of taxpayers.
We identified the adjustments resulting from the fair value method as significant adjusting
items by financial services providers, real estate and holding companies. The elimination of the
positive effects of fair valuation on the profit before tax led to a considerable decrease in the
effective tax rate but not in the tax revenue of the state.
In 2017, several impacts had resulted in a lower effective tax rate. These are partly attributable
to transitioning to the IFRS and partly to the change of the tax rate. Their cumulative effect is
the reason for the decrease. Although, by 2018, the average effective tax rate has increased,

166
ITEMA 2020
Conference Proceedings
still, it did not reach its level of 2016. Thus, part of the decreasing impacts has remained, but
the one-off tax-reducing effect of transition difference was less significant. The change in the
effective tax rate was not the result of the fact that due to transitioning, the tax payment
liabilities of the companies have decreased.
Due to the transition, the change in the effective corporate tax rate is significant. The results
show significant differences in the pre-tax profits calculated under the two different accounting
systems. If the tax law regulations would not treat this difference then the effective tax rate
would remain unchanged. The adjustment rules secure the tax revenue of the state and the
neutrality of the taxpayers.
The study cover, however, only the data of the year of transitioning (2017) and the consecutive
business year; therefore, the impact on the long run cannot be ascertained. Results referring to
FY 2020 shall be highly interesting because of the trends contrary to those that have existed
during the studied period.
REFERENCES
Bíró, J. (2015). IFRS áttérés az egyedi beszámolók tekintetében. A törvényi szabályozás állása
és az áttérési szabályok [IFRS Transition from Separate Financial Statements
Perspective. Legal position and the Laws of the Transition.]. MKVK conference paper.
Borók T. (2015). Az IFRS-ek miatt szükséges változások a társasági adóban és az
energiaellátók jövedelemadójában [Necessary Changes in Corporate Income Tax and
Energy Supplier Tax Due to IFRS]. Számvitel, adó, könyvvizsgálat. 57(10), 455-457.
Brüggemann, U., Hitz, J. M., & Sellhorn, T. (2013). Intended and unintended consequences of
mandatory IFRS adoption: A review of extant evidence and suggestions for future
research. European Accounting Review, 22(1), 1-37.
Cuzdriorean, D. D., & Matis, D. (2012). The relationship between accounting and taxation
insight the European Union: The influence of the international accounting regulation.
Annales Universitatis Apulensis: Series Oeconomica,14(1), 28.
Eberhartinger, E., & Klostermann, M. (2007). What if IFRS were a Tax Base? New Empirical
Evidence from an Austrian Perspective. Accounting in Europe, 4(2), 141.
Gavana, G., Guggiola, G., & Marenzi, A. (2015). Aligning taxation and international financial
reporting standards: evidence from Italian listed companies. Politica Economica, 31(1),
77-96.
Guggiola, G. (2010). IFRS adoption in the EU, accounting harmonisation and markets
efficiency: a review. International Business & Economics Research Journal (IBER),
9(12).
Haverals, J. (2007). IAS/IFRS in Belgium: Quantitative analysis of the impact on the tax
burden of companies. Journal of International Accounting, Auditing and Taxation, 16(1),
69-89.
Jacobs, O. H., Spengel, C., Stetter, T., & Wendt, C. (2005). EU company taxation in case of a
common tax base: A computer-based calculation and comparison using the enhanced
model of the European Tax Analyser. Intertax. 33, 414.
Jirásková, S. (2013). Range data reported to the requirements of the IAS 12 and impact of the
IFRS adoption for tax purposes in the tax collection of the Czech Republic. Acta
Universitatis Agriculturae et Silviculturae Mendelianae Brunensis. 61(4), 961-966.
Mészáros L. (2015): A kormány döntött az IFRS-ek egyedi beszámolási célokra történő
alkalmazásáról. Számvitel, adó, könyvvizsgálat. 57(6), 276-278.

167
HUNGARIAN IFRS IMPLEMENTATION FROM TAX PERSPECTIVE
Molnár, Cs. (2015). Döntés-előkészítő folyamat az IFRS-ek hazai bevezetésére [Process of
Preparation of the Domestic IFRS Transition]. Számvitel, adó, könyvvizsgálat. 57(2), 65-
67.
Procházka, D., & Molin, J. (2016). Book-tax conformity: the review of recent research and its
implication for the IFRS adoption in Europe. eJTR, 14, 96.
Tóth-Takács G. (2018). Az IFRS-alkalmazók 2017. évi társasági adó-adatai [Corporate Income
Tax Data of IFRS Taxpayers 2017]. Számvitel, adó, könyvvizsgálat. 60(9), 19-21.

169
CLASSIFICATION OF FINANCIAL MECHANISMS OF
HEALTHCARE SYSTEMS IN THE COUNTRIES OF EUROPEAN
UNION
Nadiya Dubrovina1
Stanislav Filip2
Vira Dubrovina3
DOI: https://doi.org/10.31410/ITEMA.2020.169
Abstract: In the article the problems of the classification of financial mechanisms of
healthcare systems were considered. The well-known types of the financial mechanisms of
healthcare systems were described and the authors argued the importance of the development
of new classification of financial mechanism of healthcare systems in the EU, which will be
based on the application of quantitative methods. The purpose of the research is cluster (or
regimes of funding healthcare system) analysis and development for EU countries over long-
term period of 2000-2017.The authors used k-means method for the cluster analysis and
revealed 5 clusters (groups) for the characteristics of the different regimes of funding
healthcare system in the EU countries.
Keywords: Healthcare system, Funding, Classification, Cluster analysis.
INTRODUCTION
ealth of population is a highest value of citizens in the developed democratic countries
and the one of the prior target of social policy of the governments in the EU countries
(European Commission, 2010). One of the important task for the government is to
develop an efficient mechanism of funding healthcare based on the optimal allocation of public
resources, social equity and access to the main healthcare services needed for support of public
and individual health, prevention and treatment of the diseases, high quality of the health
services and good performance of the healthcare institutions. For these reasons strategies of
health policy should be based on the targets of society, in one of the hand, and features of the
socio-economic capacities and political background, in other hand. Health policy as a mirror
of the values of the society or communities, and it is relative with socio-economic systems,
traditions, national strategical programs of the development, etc. (Greer et al, 2013, Gottlieb et
al, 2019).
Kostičová et al. noted that “a health system is the ensemble of all public and private
organizations, institutions and resources mandated to improve, maintain or restore health”
(Kostičová et al, 2011, p. 84.). That is why is relatively difficult to compare national health
systems in the different countries, because it is necessary to take into account main indicators
1 School of Economics and Management in Public Administration in Bratislava, Furdekova 16, 851 04
Bratislava, Slovakia 2 School of Economics and Management in Public Administration in Bratislava, Furdekova 16, 851 04
Bratislava, Slovakia 3 Kharkiv Institute of Trade and Economics of KNTEU, Otakara Yarosha Ln, 8, Kharkiv, Kharkiv, 61000,
Ukraine
H

170
ITEMA 2020
Conference Proceedings
characterizing economic, socio-demographic, political and institutional background in each
country. Nevertheless, some typologies or classification of the healthcare systems to its funding
are described in the books and papers (Mossialos et al, 2002, Kostičová et al, 2011, Benova et
al., 2014). The authors characterize well-known types of the financing of health systems as:
Bismarkian health insurance or public contract model, Beveridge model or public-integrated
model, Douglas national health insurance model, Semashko national health system or mixed
private/public system (Kostičová et al, 2011), or develop own classification based on the
multidimensional analysis of the set of the main indicators characterizing health systems
(Benova et al., 2014). Beveridge model is based on the public finance by general taxation. This
model is implemented in the UK, Norway, Sweden, Denmark, Italy, Spain, Portugal, Greece.
The features of this model are: central planning, integrated district health system with
capitation financing, general physicians service. Bismarckian model has compulsory social
insurance and it is included contracts with providers or patient reimbursement. This model was
developed in Germany and it occurs now in Netherlands, France, Austria, Belgium, Slovakia,
etc. Douglas national health insurance model is based on taxation and cost sharing between
provincial and federal government. In this system the federal government regulation and
provincial government administration are implemented, medical services are paid by fee-for-
service and hospitals have block budgets. This system works in Canada and Australia. In mixed
private/public system private insurance through employment is used, but public insurance
exists for specific groups (children, elderly, poor) and private voluntary insurance is possible.
This system is realized in the USA, some countries of Latin America, Asia and Africa.
Semashko national health system uses revenue from state budget, it characterizes by strong
central government planning and control and financing by fixed norms per population. This
system was created and works in the USSR (Kostičová et al, 2011).
Nowadays the tendencies of mix and variation of these models are observed, and cost-sharing
by patients contributes to health care finance in all countries of the EU (Santo et al, 2020).
Thus, for more complete characteristic of financing mechanisms of healthcare systems in the
EU countries and for their comparative analysis it is insufficient just distinguish such models
as: state public health care system; social health insurance system; private medicine or mixed
system. Even among the countries with similar general principles of financing of public health
care system there are essential differences in providing the sources and funds of national public
health care system, payment for various medical services, full or part their covering, etc. That
is why classification of financial mechanism must be enhanced and expanded by means
including other additional principles and approaches.
It is important to design classification system based on the quantitative methods and application
of the set of main indicators.
THE PURPOSE AND METHODOLOGY OF RESEARCH
The purpose of the research is cluster (or regimes of funding healthcare system) analysis and
development for EU countries over long-term period.
For this study the database from Eurostat for main indicators for period of 2000-2017 was used
and k-means as one of the method of cluster analysis was applied.

171
CLASSIFICATION OF FINANCIAL MECHANISMS OF HEALTHCARE SYSTEMS IN THE
COUNTRIES OF EUROPEAN UNION
MAIN RESULTS
In our research three macroeconomic indicators such as: total government expenditure on
health as % of GDP (TGEH1); total government expenditure on health as % of total general
government expenditure (TGEH2); total government expenditure on health per capita
(TGEH3) were used.
Thus, first indicator TGEH1 characterizes the government policy in healthcare; second
indicator TGEH2 describes budget policy and social policy of the government in its relation to
healthcare; third indicator TGEH3 shows the level of economic development of the country,
well-being and relative values of the expenditure on health per capita, which are higher in rich
and well-developed countries.
The graphical analysis of the plots for the dynamics of the indicators TGEH1, TGEH2 and
TGEH3 for each country of the EU-28 during period of 2000-2017, as well as the study of their
basic descriptive statistics for mentioned indicators showed that for many countries of the EU-
28 the tendencies to increase values were observed. In some countries the values of these
indicators were varied near average level, in other countries the more complicated changes in
the values of the indicators were revealed (Dubrovina et al, 2020).
These facts proved that on the dynamics of the main macroeconomic indicators (total
government expenditure on health as % of GDP - TGEH1; total government expenditure on
health as % of total general government expenditure - TGEH2; total government expenditure
on health per capita - TGEH3) a lot of social, economic, political factors can have an impact.
Of course, for many countries in transition, post socialist countries, which join to the EU since
2004 and later the initial values of total government expenditure on health per capita were
essentially lower, in comparison with well-developed countries from Western Europe
(Jakubowski, Busse 1998, Docteur, Oxley, 2003, Boulhol et al., 2012). Due to the crucial
reforms in healthcare sector, structural investment programs from the EU, rapid economic
growth in these countries the tendencies of the increasing total government expenditure on
health per capita or total government expenditure on health as % of GDP were observed.
Nevertheless, in some countries of the EU the change in the political impact for leading political
parties, political or economic crises influenced on essential changes in national models of
funding healthcare (Mossialos et al, 2002, Dixon, 2006, Joumard, 2010, Eurostat, 2020).
In our research we grouped the countries of the EU-28 to similar groups or clusters according
to their values of the indicators TGEH1, TGEH2 and TGEH3. For the grouping the countries
of the EU-28 we used data for period of 2000-2017 and k-means method of cluster analysis.
This method is described in many books devoted the applied statistical methods and is realized
in such software as: Statistica, SPSS, Matlab, etc. (Borovikov, 2001, Dostal, 2008, Kozlíková,
2018). On the basis of the analysis of dendrograms and results of the analysis of variance for
the different number of clusters, as well due to the results of their qualitative interpretation, we
concluded that number of 5 clusters is the best variant according to the interpretation and results
of the analysis of variation. The results of analysis of variation for 5 clusters are given in table
1.
In the table 2 the descriptive statistics is shown for clusters and in table 3 the results of grouping
countries of the EU-28 are presented for period of 2000-2017.

172
ITEMA 2020
Conference Proceedings
Table 1. Analysis of Variance
Between Within signif.
SS df SS df F p
X 470,4755 4 518,6642 499 113,1596 0
Y 945,9238 4 2235,044 499 52,79716 0
Z 5,5E+08 4 25739546 499 2667,019 0
Source: own elaboration in Statistica
As it is seen from table 2, cluster No.1 contains 21 cases, this cluster characterizes the highest
value of total government expenditure on health per capita (indicator TGEH3 or Z), the means
for other indicators TGEH1 or X (total government expenditure on health as % of GDP) and
TGEH2 or Y (total government expenditure on health as % of total general government
expenditure) have relatively high values, but not the biggest.
Table 2. The characteristics of clusters for grouping the EU-28 countries according the
different regimes of funding healthcare during period of 2000-2017
Va
ria
ble
Cluster 1 Cluster 2 Cluster 3 Cluster 4 Cluster 5
Cluster contains
21 cases
Cluster contains
92 cases
Cluster contains
93 cases
Cluster contains
111 cases
Cluster contains
187 cases
Mean Std.
Dev. Mean
Std.
Dev. Mean
Std.
Dev. Mean
Std.
Dev. Mean
Std.
Dev.
X 6,75 1,86 7,23 0,92 6,64 0,77 6,34 0,79 4,8 1,16
Y 13,58 2,26 15,12 1,97 14,03 1,41 14,36 2 11,71 2,5
Z 4007,39 342,64 2860,85 251,5
9 2030,03 237,06 1141,22 214,57 446,22 199,42
Source: own elaboration in Statistica
Cluster 2 contains 92 cases, the mean of indicator TGEH1 or X (total government expenditure
on health as % of GDP) and mean of indicator TGEH2 or Y (total government expenditure on
health as % of total general government expenditure) are the biggest, the countries of the EU-
28 with extremely high values of TGEH1 and TGEH2 were concentrated in this cluster. Also
countries of the EU-28 included in this cluster have very high value of TGEH3 or Z (total
government expenditure on health per capita) in comparison with countries in other clusters,
such as: cluster No.4 and Cluster No.5.
Cluster 3 contains 93 cases, in this cluster are relatively high all values of indicators: TGEH1
or X (total government expenditure on health as % of GDP,) TGEH2 or Y (total government
expenditure on health as % of total general government expenditure) and TGEH3 or Z (total
government expenditure on health per capita). But the mean for indicator of TGEH3 is
essentially lower than in cluster No.1 and cluster No.2, and more than 1,7 times mean value for
cluster No.4, more than 4,5 times mean value for cluster No.5
Cluster 4 contains 111 cases and characterizes relatively high values for indicators TGEH1 or
X (total government expenditure on health as % of GDP), and TGEH2 or Y (total government
expenditure on health as % of total general government expenditure), but relatively low level
of TGEH3 or Z (total government expenditure on health per capita).
Cluster 5 contains 187 cases and the features of this cluster are the lowest mean values for all
indicators, such as: TGEH1 or X (total government expenditure on health as % of GDP,)

173
CLASSIFICATION OF FINANCIAL MECHANISMS OF HEALTHCARE SYSTEMS IN THE
COUNTRIES OF EUROPEAN UNION
TGEH2 or Y (total government expenditure on health as % of total general government
expenditure) and TGEH3 or Z (total government expenditure on health per capita).
It should be noted that most of the EU-28 countries switched the regimes of the funding
healthcare systems. It is proved that over period of 2000-2017 they moved from one kind of
cluster to another one. For most countries this switch from one type of cluster to another one
occurred after long period, so it is possible to suggest the results of the economic development,
new strategies of government, maybe after change of leading political party and other priorities
in social or budget policies. Nevertheless, some countries demonstrated the stable policy in
funding their national healthcare and over all period these countries were in the same cluster.
For example, cluster No.5 or “trap of poverty” included post socialist and emerging countries
which were in this cluster all period of 2000-2017 or long period.
Such countries as: Bulgaria, Croatia, Cyprus, Latvia, Hungary and Poland were in this cluster
all period of 2000-2017. Other countries were in this cluster for long period: Czechia (2000-
2005), Estonia (2000-2014), Lithuania (2000-2016), Malta (2000-2005), Slovakia (2000-
2007). After some improving the funding healthcare systems and increasing total government
expenditure on health per capita these countries moved to cluster No.4. Thus, Greece started
from cluster No.5 in 2000 to better cluster No.4, nevertheless as a reaction on the global
economic and financial crisis of 2008-2012 and internal political and economic crisis this
country returned to cluster No.5 in 2014 and in 2015. Portugal was in cluster No.5 in 2000 and
then moved to cluster No.4. In cluster No.5 Slovenia was in 2000 and 2001, then it moved to
cluster No.4.
For all period of 2000-2017 in cluster No.4 only one country was, this is Spain. In cluster No.4
a lot of countries of the EU-28 stayed long period, such as: Czechia (2006-2017), Greece (2001-
2013, 2016, 2017), Malta (2010-2017), Portugal (2001-2017), Slovenia (2002-2017), Slovakia
(2008-2017). In 2000 such countries as: Belgium, Ireland, Italy, Netherlands, Finland and the
United Kingdom were in cluster No.4.
In cluster No. 3, cluster No.2 and cluster No.1 no countries were for all period of 2000-2017,
nevertheless, a lot of countries were for long period. In cluster No.3 a lot of countries were for
long period: France (2000-2009), Belgium (2001-2008), Italy (2004-2017), Austria (2000-
2006), Sweden (2000-2006), the United Kingdom (2001-2013).
In cluster No.2 some countries were for long time period: Belgium (2009-2017), Ireland (2004-
2017), Netherlands (2007-2017), Austria (2008-2016), Finland (2008-2017) and Sweden
(2010-2017). Some countries of the EU-28 were in this cluster a shorter period: Denmark
(2002-2007), Germany (2013-2017), Luxembourg (2003-2007), the United Kingdom (2014-
2017).
In long period cluster No.1 with the highest level of total government expenditure on health
per capita includes cases from two counties of the EU-28: Denmark (2008-2017) and
Luxembourg (2008-2017). Austria had occurred in this cluster only in 2017.

174
ITEMA 2020
Conference Proceedings
2
000
20
01
20
02
20
03
20
04
20
05
20
06
20
07
20
08
20
09
20
10
20
11
20
12
20
13
20
14
20
15
20
16
20
17
Bel
giu
m
CL
4
CL
3
CL
3
CL
3
CL
3
CL
3
CL
3
CL
3
CL
3
CL
2
CL
2
CL
2
CL
2
CL
2
CL
2
CL
2
CL
2
CL
2
Bu
lgar
ia
CL
5
CL
5
CL
5
CL
5
CL
5
CL
5
CL
5
CL
5
CL
5
CL
5
CL
5
CL
5
CL
5
CL
5
CL
5
CL
5
CL
5
CL
5
Cze
chia
C
L5
C
L5
C
L5
C
L5
C
L5
C
L5
C
L4
C
L4
C
L4
C
L4
C
L4
C
L4
C
L4
C
L4
C
L4
C
L4
C
L4
C
L4
Den
mar
k
CL
3
CL
3
CL
2
CL
2
CL
2
CL
2
CL
2
CL
2
CL
1
CL
1
CL
1
CL
1
CL
1
CL
1
CL
1
CL
1
CL
1
CL
1
Ger
man
y
CL
3
CL
3
CL
3
CL
3
CL
3
CL
3
CL
3
CL
3
CL
3
CL
3
CL
3
CL
3
CL
3
CL
2
CL
2
CL
2
CL
2
CL
2
Est
on
ia
CL
5
CL
5
CL
5
CL
5
CL
5
CL
5
CL
5
CL
5
CL
5
CL
5
CL
5
CL
5
CL
5
CL
5
CL
5
CL
4
CL
4
CL
4
Irel
and
CL
4
CL
3
CL
3
CL
3
CL
2
CL
2
CL
2
CL
2
CL
2
CL
2
CL
2
CL
2
CL
2
CL
2
CL
2
CL
2
CL
2
CL
2
Gre
ece
CL
5
CL
4
CL
4
CL
4
CL
4
CL
4
CL
4
CL
4
CL
4
CL
4
CL
4
CL
4
CL
4
CL
4
CL
5
CL
5
CL
4
CL
4
Sp
ain
CL
4
CL
4
CL
4
CL
4
CL
4
CL
4
CL
4
CL
4
CL
4
CL
4
CL
4
CL
4
CL
4
CL
4
CL
4
CL
4
CL
4
CL
4
Fra
nce
C
L3
C
L3
C
L3
C
L3
C
L3
C
L3
C
L3
C
L3
C
L3
C
L3
C
L2
C
L2
C
L2
C
L2
C
L2
C
L2
C
L2
C
L2
Cro
atia
C
L5
C
L5
C
L5
C
L5
C
L5
C
L5
C
L5
C
L5
C
L5
C
L5
C
L5
C
L5
C
L5
C
L5
C
L5
C
L5
C
L5
C
L5
Ital
y
CL
4
CL
4
CL
4
CL
4
CL
3
CL
3
CL
3
CL
3
CL
3
CL
3
CL
3
CL
3
CL
3
CL
3
CL
3
CL
3
CL
3
CL
3
Cyp
rus
CL
5
CL
5
CL
5
CL
5
CL
5
CL
5
CL
5
CL
5
CL
5
CL
5
CL
5
CL
5
CL
5
CL
5
CL
5
CL
5
CL
5
CL
5
Lat
via
C
L5
C
L5
C
L5
C
L5
C
L5
C
L5
C
L5
C
L5
C
L5
C
L5
C
L5
C
L5
C
L5
C
L5
C
L5
C
L5
C
L5
C
L5
Lit
hu
ania
C
L5
C
L5
C
L5
C
L5
C
L5
C
L5
C
L5
C
L5
C
L5
C
L5
C
L5
C
L5
C
L5
C
L5
C
L5
C
L5
C
L5
C
L4
Lu
xem
bo
urg
C
L3
C
L3
C
L3
C
L2
C
L2
C
L2
C
L2
C
L2
C
L1
C
L1
C
L1
C
L1
C
L1
C
L1
C
L1
C
L1
C
L1
C
L1
Hu
ngar
y
CL
5
CL
5
CL
5
CL
5
CL
5
CL
5
CL
5
CL
5
CL
5
CL
5
CL
5
CL
5
CL
5
CL
5
CL
5
CL
5
CL
5
CL
5
Mal
ta
CL
5
CL
5
CL
5
CL
5
CL
5
CL
5
CL
4
CL
5
CL
5
CL
5
CL
4
CL
4
CL
4
CL
4
CL
4
CL
4
CL
4
CL
4
Net
her
lan
ds
CL
4
CL
4
CL
3
CL
3
CL
3
CL
3
CL
3
CL
2
CL
2
CL
2
CL
2
CL
2
CL
2
CL
2
CL
2
CL
2
CL
2
CL
2
Au
stri
a
CL
3
CL
3
CL
3
CL
3
CL
3
CL
3
CL
3
CL
2
CL
2
CL
2
CL
2
CL
2
CL
2
CL
2
CL
2
CL
2
CL
2
CL
1
Po
land
CL
5
CL
5
CL
5
CL
5
CL
5
CL
5
CL
5
CL
5
CL
5
CL
5
CL
5
CL
5
CL
5
CL
5
CL
5
CL
5
CL
5
CL
5
Po
rtu
gal
C
L5
C
L4
C
L4
C
L4
C
L4
C
L4
C
L4
C
L4
C
L4
C
L4
C
L4
C
L4
C
L4
C
L4
C
L4
C
L4
C
L4
C
L4
Ro
man
ia
CL
5
CL
5
CL
5
CL
5
CL
5
CL
5
CL
5
CL
5
CL
5
CL
5
CL
5
CL
5
CL
5
CL
5
CL
5
CL
5
CL
5
CL
5
Slo
ven
ia
CL
5
CL
5
CL
4
CL
4
CL
4
CL
4
CL
4
CL
4
CL
4
CL
4
CL
4
CL
4
CL
4
CL
4
CL
4
CL
4
CL
4
CL
4
Slo
vak
ia
CL
5
CL
5
CL
5
CL
5
CL
5
CL
5
CL
5
CL
5
CL
4
CL
4
CL
4
CL
4
CL
4
CL
4
CL
4
CL
4
CL
4
CL
4
Fin
land
CL
4
CL
3
CL
3
CL
3
CL
3
CL
3
CL
3
CL
3
CL
2
CL
2
CL
2
CL
2
CL
2
CL
2
CL
2
CL
2
CL
2
CL
2
Sw
eden
C
L3
C
L3
C
L3
C
L3
C
L3
C
L3
C
L3
C
L2
C
L2
C
L3
C
L2
C
L2
C
L2
C
L2
C
L2
C
L2
C
L2
C
L2
Un
ited
Kin
gd
om
C
L4
C
L3
C
L3
C
L3
C
L3
C
L3
C
L3
C
L3
C
L3
C
L3
C
L3
C
L3
C
L3
C
L3
C
L2
C
L2
C
L2
C
L2
Ta
ble
3.
Gro
upin
g t
he
EU
-28 c
ountr
ies
to t
he
clust
ers
duri
ng p
erio
d o
f 20
00
-20
17
So
urc
e:
ow
n e
lab
ora
tio
n i
n E
xce
l

175
CLASSIFICATION OF FINANCIAL MECHANISMS OF HEALTHCARE SYSTEMS IN THE
COUNTRIES OF EUROPEAN UNION
CONCLUSION
On the base of the analysis of variance for the different number of clusters, as well as results
of their qualitative interpretation, we concluded that number of 5 clusters is the best variant
according to the interpretation and results of the analysis of variation. For the qualitative
interpretation of these clusters we called them “regimes of funding healthcare system”.
It is proved that over period of 2000-2017 countries moved from one kind of cluster to another
one. For most countries this switch from one type of cluster to another one occurred after long
period, so it is possible to suggest the results of the economic development, new strategies of
government, probably after change of leading political party and other priorities in social or
budget policies. Nevertheless, some countries demonstrated the stable policy in funding their
national healthcare and over all period these countries were in the same cluster.
It should be noted that in some countries the policy of financing health systems was quite
flexible and changed, while in other countries this policy was stable for a long term period. At
the same time, a number of social, economic, political and institutional factors influence the
policy of financing health systems, which should also be taken into account and studied in
connection with the changing characteristics of financing the health system in the country.
ACKNOWLEDGEMENT
The paper is the output of a scientific project IGA 3/2020-M “Improving Healthcare efficiency:
new trends and challenges”. (Funder: VSEMvs IGA VSEMvs, i.e. School of Economics and
Management in Public Administration)
REFERENCE
Benova E., Dubrovina N., Boyko V., Zamyatin P. (2014). Classification and cluster analysis
of health care systems in the OECD countries // Public Administration and Regional
Development. School of Economics and Management in Public Administration. No.2.
December, 2014. Vol. X, pp.45-56.
Borovikov V. (2001). Statistica: iskusstvo analiza dannych na kompjutere. – SPb.: Piter, 2001.
– 656 s.
Boulhol H. et al. (2012). Improving the Health-Care System in Poland. OECD Economics
Department Working Papers, No. 957, OECD Publishing.
http://dx.doi.org/10.1787/5k9b7bn5qzvd-en
Dixon A. (2006). Learning from international models of funding and delivering health care.
Oxford Handbook of Public Health Practice. Oxford University Press. 2006.
Docteur E., Oxley H. (2003). Health-Care Systems: Lessons from the Reform Experience.
OECD Health Working papers. No. 9, 2003.
Dostal, P. (2008). Pokročilé metody analýz a modelováni v podnikatelství a verejné správé.
Brno, CERM. 340 s.
Dubrovina N., Tulai O., Neuvauerova E. (2020). Tendencies of funding health care in EU
countries: the features and perspectives/ In Monograph “Theoretical and applied aspects
of sustainable development”. Ed. T. Nestorenko and A. Ostenda. Katowice School of
Technology. Katowice. 2020. pp. 12-22.
European Commission (2010). Joint Report on Health Systems. Occasional Papers, No. 74.
Eurostat. Database is available at:
https://appsso.eurostat.ec.europa.eu/nui/submitViewTableAction.do

176
ITEMA 2020
Conference Proceedings
Funding health care: options for Europe. (2002). Edited by E. Mossialos, A. Dixon, J. Figueras,
J. Kutzin. Open University Press. Philadelphia. USA, 2002. – 327 p.
Gottlieb N, Bozorgmehr K, Trummer U, Rechel B. (2019). Health policies and mixed
migration – lessons learnt from the ‘refugee crisis’. Health Policy 2019; 123: 805–08.
Greer SL, Hervey TK, Mackenbach JP, McKee M. (2013). Health law and policy in the
European Union. Lancet 2013; 381: 1135–44.
Highest proportion of government expenditure goes to social protection and health (2020).
Eurostat newsrelease No. 33/2020 from 27 February 2020. Available at:
https://ec.europa.eu/eurostat/documents/2995521/10474879/2-27022020-AP-
EN.pdf/4135f313-1e3f-6928-b1fd-816649bd424b
Jakubowski E., Busse R. (1998). Health Care Systems in the EU. A Comparative Study.
Working Paper. European Parliament. Luxembourg. 1998. 130 p.
Joumard, I., C. André and C. Nicq (2010), “Health Care Systems: Efficiency and Institutions”,
OECD. Economics Department Working Papers, No. 769.
Kostičová M., Ozorovský V., Badalík L., Fabian G. An Introduction to Social Medicine.
Bratislava, 2011. – 150 s.
Kozlíková K, Trnka M. (2018). Úvod do spracovania a prezentovania dát v medicíne.
Equlibria, s.r.o., Košice, 2018. 226 s.
Santos, J. V., Lobo, M., Neiva, R. M., Viana, J., Souza, J., Dias, C. C., Cylus, J., Ricciardi, W.,
& Freitas, A. (2020). European Union state of health from 1990 to 2017: time trends and
its enlargements' effects. International journal of public health, 65(2), 175–186.
https://doi.org/10.1007/s00038-020-01335-0

177
PREPARING SCHOOL GRADUATES FOR THE LABOUR MARKET
Mária Nováková1
Silvia Capíková2
DOI: https://doi.org/10.31410/ITEMA.2020.177
Abstract: Despite their determination to work and build their careers, school graduates are
not sufficiently prepared to look for work and the opportunities to search a job. In most cases
they are well prepared in theory and language and are literate in modern technologies. Their
biggest handicap is the lack of practical skills and work experience. At the same time,
graduates have to face the challenges of accelerated globalization and digitization. It is
necessary to find answers to questions about what professional knowledge, practical skills,
attitudes and values will be shaped by today's graduates and how education systems can
develop the required knowledge and skills. The ambition of our contribution is to identify the
main disparities that must be overcome in order to achieve the goal of the country's economic
development strategy, in which the education system must inevitably correspond to the labour
market requirements.
Keywords: Labour market, School graduates, Skills.
1. INTRODUCTION
ccelerated globalization and, as a result, the pandemic crisis are bringing about societal
change and have affected a wide range of areas from industry to technical
standardization, security, education system, science, research to the labour market or
the social system.
The reality of the national labour market, but also of the global labour market, is one of the
most complex objects of research. It is absolutely essential that the theory, based on careful
observation, analysis and generalization, comes up with new recommendations for improving
the organization of the education system and for implementing a successful social policy.
The subject of the paper is mainly the analysis and research of professional competencies,
which are crucial and useful for the labour market.
2. PROFILE OF YOUNG PEOPLE APPLYING FOR JOBS
There is no doubt that each generation has certain specifics that are only a manifestation of the
dominants of historical development.
While previous generations have become accustomed to the stability and security of
employment, the current driving force prefers greater flexibility in working conditions and
1 Faculty of Law, Comenius University in Bratislava, Šafárikovo námestie 6, 810 00 Bratislava, Slovak
Republic 2 Faculty of Medicine, Comenius University in Bratislava, Špitálska 24, 813 72 Bratislava, Slovak Republic
A

178
ITEMA 2020
Conference Proceedings
favours of "freelance" work. Their goal in the work process is primarily to achieve a work-life
balance.3
3. EMPLOYERS' REQUIREMENTS
Digitization, automation and robotics are processes that began to have a significant impact on
the labour market before the pandemic crisis.
However, it was not until the onset of the pandemic crisis, which is a global public health crisis
that the digitization of the private and public sectors accelerated enormously.
Rapid technological progress raises a number of concerns and panics about the threat to the
existence of today's jobs and at the same time about the uncertainty of the unknown possibilities
of shaping future labour markets.
Enormously changing technological changes must adapt employers' requirements for new jobs.
At present, it is unthinkable that an employee does not have technological and digital skills.
Employers also appreciate soft skills, such as analytical thinking, communication, creativity,
the ability to process complex information. Employers are also placing increasing emphasis on
social skills.
4. ALTERNATIVES TO PREPARING SCHOOL GRADUATES FOR THE
LABOUR MARKET
Global challenges also require global solutions to prepare school graduates for the global labour
market.
Accredited training institutions must be prepared to flexibly reflect the needs of the labour
market.
The education system must support the adaptation of theoretical knowledge, skills and
qualifications to demand and job opportunities. This means that it must facilitate the possibility
of the traditional transition from school to work.
In this regard, it is extremely important not only at the national, but also at the global level to
support research in the field of shaping the work environment, especially research that is aimed
at identifying promising study programs shaping graduates.
Educational institutions are expected to develop competencies that are focused primarily on
verbal communication, analytical critical thinking, creativity, complex problem-solving in
teamwork, the ability to establish relationships, etc. These skills are referred to in practice as
soft skills.4
3 NEVICKÁ, D.: Graduate and Digitization of the Labour Market. Reviewed. In: Labour law in digital form:
conference with international participation. -: 1st ed. ISBN 978-80-7502-259-2. – Prague: Printing house
Leges, 2017.-p. 216-226 ((Theoretical)). 4 NEVICKÁ, D.: Graduate and Digitization of the Labour Market. Reviewed. In: Labour law in digital form:
conference with international participation. -: 1st ed. ISBN 978-80-7502-259-2. – Prague: Printing house
Leges, 2017.-p. 216-226 ((Theoretical)).

179
PREPARING SCHOOL GRADUATES FOR THE LABOUR MARKET
The preparation of a quality graduate proving successful on the labour market depends not only
on the acquisition and development of soft skills, but above all on vocational training and the
acquisition of practical skills, which we call hard skills.
However, without real practice, it is not possible to create space in the academic environment
to acquire sufficient and suitable practical skills.
Within academic education, there is an urgent need to develop competencies in a real work
environment. It is necessary to create a space for mutual cooperation of educational institutions
with institutions in a real work environment. The close cooperation and mutual interaction of
these two entities is a sufficient guarantee of quality preparation of young people for proving
successful in the work environment.
Such close cooperation can be seen in the medical fields, but in other fields the acquisition of
practical skills is more of a formal nature. This negative phenomenon in the process of
acquiring practical skills is unacceptable, and there are alternatives to reverse this.
One possible solution can be given for illustration. Every individual can find himself in an
unfavourable life situation, which will change his life by 180 degrees in a few seconds. As a
result, his status changes from an economically active member of society to a socially
stigmatized and socially excluded one. The handicap is all the greater because the current
generation professes the values of profit and capital. The given trend is striking on social
networks, where only those who present themselves as young, beautiful and rich are successful.
The task of every developed society should be to strive for the greatest possible socialization
of disabled people, in the form of community rehabilitation. The aim of community
rehabilitation is the renewal or development of physical abilities, mental abilities and work
abilities of an individual in an unfavourable social situation and support of his integration into
society.
If, as a result of a sudden injury or illness, an individual finds himself in a state of severe or
permanent impairment of the body's functional ability, it legally requires care that falls within
the health care system. Depending on the type and extent of the damage to health, the disabled
individual will be provided with an adequate form of institutional health care. The fact that the
form of institutional health care is limited in time by health insurance companies can be
assessed negatively. It is often the case that hospitalization is terminated even in untreated
patients. After the end of hospitalization, i.e. the institutional care, the patient is discharged to
home treatment. By ending the health care process, the disabled person does not become self-
sufficient. With a disability, special needs and dependence on the help of another person occur
at the same time. A disabled person requires another form of care, namely social care.
Entry into the social care system is significantly more complicated than entry into the health
care system. Social care is not provided immediately, but presumes an administrative initiative
from the disabled person or another person on which the disabled person is dependent. It
represents an enormous bureaucratic, time and financial burden for the disabled, but also for
his loved ones, who are not yet emotionally balanced with a permanently unfavourable social
situation.
Depending on the unfavourable social situation and the degree of dependence on the assistance
of another natural person, the disabled person has the right to choose a social service and the
form of its provision. Dependence on social services is proved by a valid decision on

180
ITEMA 2020
Conference Proceedings
dependence on social services, while the issuance of a decision is preceded by a lengthy process
of health assessment activity and subsequently social assessment activity.
There is an unnecessarily long vacuum between the end of the provision of health care and the
start of the provision of social care, which deepens the hopeless situation of the disabled person
and his loved ones. They lack orientation in the material, personal and territorial scope of social
regulations. They have no experience of which institutions to turn to or what form of assistance
to ask for. Nor are there isolated cases where disabled people have to cope with the reluctance
and impatience of the staff of the institutions.5 Under the influence of such unpleasant
circumstances, people with disabilities often have suicidal tendencies.
There is still a tendency in society to help the disabled in the form of one-time in-kind and
monetary benefits, associated with a spectacular media presentation. Of course, financial
assistance is also extremely important, but this method of assistance is not permanent and is
counterproductive for people with disabilities. They are pushed into a passive position, thus
eliminating their ambition to cope with the situation and the ability to handle self-service
activities as much as possible.6
In this case, space is opening up for community rehabilitation, which could fill the gap in the
absence of care for a disabled person, due to the time-consuming transition from the health care
system to the social care system. The social need is essentially calling for the creation of some
kind of community rehabilitation centres, in which disabled people would be placed, who,
although the process of providing institutional health care has ended, still require some form
of outpatient specialized care for general treatment. It is necessary to emphasize the fact that,
due to their disability, they also have special needs, while they are dependent on the help of
another natural person. The role of community rehabilitation centres would be to ensure the
provision of health care and start the process of providing social care, until their complete
transition to the social care system. In community rehabilitation centres in particular, people
with disabilities should acquire, as far as possible, self-service skills. They would acquire
practical skills in simulated home conditions, which means that they would acquire them under
professional supervision in specially adapted flats. The benefit for disabled people would be
the fact that during their stay in the community rehabilitation centre, the professional staff
would also ensure a suitable construction of their household. The length of stay in a community
rehabilitation centre would not be limited in time and would depend on the physical and mental
abilities of the disabled person. Bridging the two systems would ensure the continuity of care
for the disabled.
It can be assumed that, as with the health care and social care system, the biggest obstacle to
providing community rehabilitation will be the lack of funding sources, but this would not be
so significant if the organization of community rehabilitation were linked to the need for
practical teaching in academic education. Community rehabilitation centres would create
specialized teaching facilities, where practical training of students would be carried out in order
5 BEŇO, P. & CAPÍKOVÁ, S. (2014). Social debarierization in healthcare from the point of view of patients
with hearing impairment. In: The patient in the health system and in society. Proceedings of the
international scientific conference held on December 11, 2012 in Bratislava. Bratislava: Section of
Sociology of Health of the Slovak Sociological Society at the Slovak Academy of Sciences. p.81. ISBN
978-80-85447-22-4. 6 TREĽOVÁ, S.: A tool to support the employment of people with disabilities in the labour market. In: Legal
and economic aspects of long-term unemployment in the Slovak Republic 2014. Proceedings of a scientific
conference held on October 24, 2014 organized by the research team of the project VEGA reg. no.
1/0935/12. p. 114. ISBN 978-80-7160-388-7.

181
PREPARING SCHOOL GRADUATES FOR THE LABOUR MARKET
to acquire professional competence to perform professional work activities in the relevant field
of study and, as a result, the centres would have to go through the accreditation process.
Practical teaching of students in community rehabilitation centres would be mutually
beneficial. A meaningful space for acquiring practical skills in the chosen field of study is
offered to students of medical faculties, nursing faculties, construction faculties, theological
faculties, law faculties, etc. For example, students of construction faculties would participate
in the preparation of proposals, but also the implementation of construction modifications of
households of disabled people, students of law faculties would provide advice and overall
administration resulting from relevant legislation, etc. High school students would also find
application for practical training.
Through a form of community rehabilitation, one of the holes in the social network through
which disabled people fall and "drown in the mud" of social exclusion would be "repaired."
This form of care provision could be used not only by disabled people, but also by other natural
persons in an unfavourable social situation.
5. VULNERABLE PERSONS
In connection with the issue of training graduates employed in the labour market, the
unemployed are demonstrated as a specific problem. These are vulnerable people who have
achieved only low qualifications as a result of the accumulation of social disadvantages. The
impact of the social background on the initial results of their education and on the level of their
skills is not negligible. Social inequality and inequality of opportunity are a particular problem
for this workforce. Even a tool of further education aimed at increasing the qualification or
retraining of low-skilled people is proving impossible. There is virtually no impact on
vulnerable groups who suffer from cumulative social disadvantages, with the emphasis that
they do not even register as jobseekers.7 This negative trend signals an acute risk factor for
economic growth. More needs to be done to develop a comprehensive long-term strategy to
activate vulnerable low-skilled graduates to engage in further education.
6. ACTIVE LABOUR MARKET MEASURES
It must be stated that active labour market measures in relation to vulnerable and disadvantaged
jobseekers are unsystematic and ineffective. They can be described as inactive or passive
without any exaggeration. They do not create space for job seekers to be active in solving their
social situation, or provide opportunities for their self-realization, but they have a demotivating
effect on them.8
Not only does the concept of social inclusion of jobseekers fail, but the unprecedented waste
of public funds spent on inefficient further education can be assessed very negatively. The
implementation of such non-systemic measures does not take into account the needs of practice
and certainly has no impact on employment growth.
7 ŠTEFÁNIK, M. et al. LABOUR MARKET IN SLOVAKIA 2019+. Centre of Social and Psychological
Sciences, Slovak Academy of Sciences (CSPS SAS), Institute of Economic Research, Slovak Academy of
Sciences (IER SAS), Faculty of Arts, Comenius University in Bratislava (FA CU): ŠEVT, as, Bratislava,
Bratislava 2018, ISBN 978-80-7144-296-7 8 HAMUĽÁK, J. Legal or illegal. Legal-theoretical and application problems of illegal work and illegal
employment in the Slovak Republic. – 1st ed. - Bratislava: Wolters Kluwer, 2017. - 139 p., ISBN 978-80-
8168-688-7

182
ITEMA 2020
Conference Proceedings
7. CONCLUSION
Accelerated digitization and the advent of new technologies should be accompanied by
innovation in the education system, which would enable the comprehensive development of
the theoretical and practical skills of future jobseekers. Only highly qualified and educated
individuals with skills that are applicable in the digital economy will have a chance to enter the
labour market.
Educational institutions need to be more active and more flexible in adapting their curricula to
the demand for current and future technological skills. It is more than desirable to ensure the
development of digital skills at all levels of the education system, including lifelong education
programs.
The pandemic crisis made it impossible for students to attend full-time teaching, and
educational institutions had to transform their teaching to distance education. As a result,
measures need to be taken to ensure that the vulnerable people also cope with the distance form
of teaching. As such, it is necessary for the public and private sector to create and ensure access
to technical and electronic equipment for economically and socially disadvantaged people, who
unfortunately include the teachers themselves.
The health care system, the social care system and the education system are considerably
materially, technically, personally and financially undersized. Their combination would at least
partially solve their undersizing and at the same time the requirement would be met of acquiring
quality theoretical knowledge, but also practical skills of future job seekers. One of the goals
of achieving and maintaining a high socio-economic level of society is to eliminate the various
types of disadvantages suffered by its members. It is essential to strive for a system that
promotes employment and enables development at regional level. As a result, the integration
of jobseekers, in particular disadvantaged jobseekers, who are most at risk of social exclusion,
could also be implemented.
REFERENCES
BEŇO, P. & CAPÍKOVÁ, S. (2014). Social debarierization in healthcare from the point of
view of patients with hearing impairment. In: The patient in the health system and in
society. Proceedings of the international scientific conference held on December 11,
2012 in Bratislava. Bratislava: Section of Sociology of Health of the Slovak Sociological
Society at the Slovak Academy of Sciences. Pp.72-84. ISBN 978-80-85447-22-4.
HAMUĽÁK, J. (2017). Legal or illegal. Legal-theoretical and application problems of illegal
work and illegal employment in the Slovak Republic. - 1st ed. - Bratislava: Wolters
Kluwer. 139p., ISBN 978-80-8168-688-7.
NEVICKÁ, D. (2017). Graduate and Digitization of the Labour Market. Reviewed. In: Labour
law in digital form: conference with international participation. -: 1st ed. ISBN 978-80-
7502-259-2. - Prague: Printing house Leges. pp. 216-226 ((Theoretical)).
ŠTEFÁNIK, M. et al. (2018). LABOUR MARKET IN SLOVAKIA 2019+. Centre of Social and
Psychological Sciences, Slovak Academy of Sciences (CSPS SAS), Institute of
Economic Research, Slovak Academy of Sciences (IER SAS), Faculty of Arts, Comenius
University in Bratislava (FA CU): ŠEVT, a.s. Bratislava, Bratislava 2018, ISBN 978-80-
7144-296-7.
TREĽOVÁ, S. (2014). A tool to support the employment of people with disabilities in the
labour market. In: Legal and economic aspects of long-term unemployment in the Slovak

183
PREPARING SCHOOL GRADUATES FOR THE LABOUR MARKET
Republic 2014. Bratislava: Comenius University in Bratislava. pp. 114–119. ISBN 978-
80-7160-388-7.
Act No. 131/2002 Coll. on Higher Education Institutions and on Amendments to Certain Acts,
as amended.
Act No. 553/2003 Coll. on Remuneration of Certain Employees in the Performance of Work
in the Public Interest and on Amendments to Certain Acts as amended.
Act No. 576/2004 Coll. on Health Care, Services Related to the Provision of Health Care and
on Amendments to Certain Acts, as amended.
Act No. 578/2004 Coll. on health care providers, health care workers, professional
organizations in health care and on the amendment of certain laws as amended.
Act No. 448/2008 Coll. on social services and on the amendment of Act No. 455/1991 Coll.
on Trade Licensing (Trade Licensing Act) as amended.
Government Regulation No. 296/2010 Coll. on professional competence for the performance
of the medical profession, the method of further education of medical staff, the system of
specialized departments and the system of certified work activities, as amended.
Decree of the Ministry of Health of the Slovak Republic No. 84/2016 Coll., which establishes
the determining features of individual types of medical facilities.


185
THE INFLUENCE OF KNOWLEDGE MANAGEMENT ON THE
DEVELOPMENT OF INNOVATION IN THE ENTERPRISES IN THE
REPUBLIC OF NORTH MACEDONIA-SELECTED RESULTS
Marija Pendevska1
DOI: https://doi.org/10.31410/ITEMA.2020.185
Abstract: Business community faces rapid change due to the technology development. Its
influence on business environment causes change in the knowledge base and its possibilities
on achieving new solution as innovation thus gaining new knowledge. Enterprises are
managing these continuous changes using the knowledge of its unique set of enterprise’s
knowledge infrastructure, employee’s knowledge skills and business environment. This implies
that fast knowledge development from technology development and innovation makes high
pressure on the enterprises and on its employees as well. The manner how this is used and
utilized within enterprise becomes dominant challenge for every enterprise and its respective
management globally. Many researches in the past years have shown that innovations as
commercialisation of new knowledge development and knowledge management practices can
assist facing those challenges remarkably. Creating the balance between them is unique for
every enterprise, for every respective management.
This research paper consists of the following parts: introduction, selected theoretical and
empirical framework and conclusion.
The theoretical framework gives selected overview of the relevant researches in the field of
knowledge management and innovation and their respective interrelation in new knowledge
creation and commercialising of this new knowledge as innovation.
The empirical framework describes the research design and gives the selected results obtained
through the research of selected enterprises based on Questionnaire that covers key
parameters previously discussed in the theoretical framework. Research focus is measuring
the existence, the exchange, the creation of knowledge within enterprises and its usage in terms
of new product development and/or improved products of the respective enterprises. Finally,
in the conclusion, the study results are elaborated and their contribution to the existing body
of knowledge and industry practices is discussed.
Keywords: Knowledge management, New knowledge creation, Innovation, Open innovation,
Closed innovation, Radical innovation, Incremental innovation.
I. INTRODUCTION
he purpose of this paper is to explore the readiness of enterprises to work with the
challenges of a globally connected economy, which is pushing / demanding continuous
development of both individual knowledge and knowledge of the enterprise, pushed
into ever changing market by constantly generating new products, improved products and
services that arise from the application of new knowledge in enterprises. This signifies finding
and maintaining the delicate balance of knowledge and knowledge flows in the enterprise, on
the one hand, by creating own new knowledge in the enterprises and, on the other, tracking
1 Komercijalna Banka AD Skopje, ul. Orce Nikolov br. 3, 1000 Skopje, R. North Macedonia
T

186
ITEMA 2020
Conference Proceedings
outside knowledge and market needs by continually adapting the products, processes and
services required by users, customers, partners.
The purpose of this research is to enlighten the elements that enable enterprises to apply
appropriate knowledge management practices, as well as to enhance understanding of how
these practices impact the development of new products and services in the form of successful
enterprise innovations.
II. THEORETICAL BACKGROUND
Nowadays, there is high demand on skilled workers and flexible enterprises that are willing to
invest in their development. Technological progress and globalization are widening the gap
between developed countries and others by automating and digitizing services and production.
Technological progress in practice replaces the workforce. Global trade and investment flows
are homogenizing production flows, and this puts pressure on companies and workers to
compete in global markets. If they do not incorporate and adopt the high capability and
competitiveness of their enterprises, they simply lose the edge and are left behind. This
research aims to enhance the capabilities in terms of knowledge and innovation in enterprises,
in order assist them to work with the pressures of global challenges and changes.
According to Schumpeter's description, innovative competitiveness is the engine of economic
development and prosperity. New products and services increase the labour productivity of
innovating enterprises by changing the distribution of labour nationally and internationally
(cited in Witt, 2016; Metcalfe et al. 2006).
This research is in terms of knowledge flow in the enterprise, i.e. the existence / exchange /
creation of knowledge in the enterprise and the relation between knowledge management and
the creation and application of new knowledge, i.e. how the enterprise applies / uses knowledge
in the form of radical, disruptive new or incremental, improved products / services or
processes. This applies both to products and services from the same enterprise, made
independently with internal knowledge, and to products and services that result from external
knowledge collaboration in the form of collaboration with the university, the user, and other
enterprises. Knowledge is a value embedded in a product / service / process and stays in the
enterprise; depending on how it is used further on, the intensity/persistence of the innovation
activity within the enterprises is, whether the knowledge creation cycle stops with the
realization of single product/service or continues through controlling and monitoring through
the product life. The research herewith is looking for answers to how enterprises in the Republic
of N. Macedonia add new value through their operation. Is the innovation process open semi-
open or closed, using own knowledge, semi-open, cooperating in gaining new knowledge and
incorporation of outside knowledge within the enterprise, in order to adjust / improve products
/ services, what novelty bring their respective innovative product, service or process that is
being realised?
The only resources that cannot simply be replaced or imitated are individual work professionals
and their skill and overall knowledge along with their interaction and successful integration
throughout the enterprise. Their unique knowledge is what makes the difference of enterprises.
It is the different knowledge structure and enterprises readiness for further knowledge
expansion, which over certain a period of time explains the different speed in developing
appropriate solutions for different enterprises.

187
THE INFLUENCE OF KNOWLEDGE MANAGEMENT ON THE DEVELOPMENT OF INNOVATION
IN THE ENTERPRISES IN THE REPUBLIC OF NORTH MACEDONIA-SELECTED RESULTS
Employee knowledge can be explicit, easily recognizable and transmitted, both through
personal contact and through other synchronic or asynchronic communication channels, such
as through picture, audio and video, chart, sketch etc. text or table. It can also be tacit
knowledge, unconscious knowledge. Both forms make the basis for the total knowledge
(learned theoretical and experiential knowledge) that is unique to every individual, and is
different, some of it not conscious (if conscious, it could be transmitted), simply obtained by
working on a particular activity or pursuing particular interest.
The duration of the cognitive process is personal feature, some individuals learns faster, some
need more time for creating deeper understanding. This indicates that the personal
characteristics of the employee are important for the environment, since it is the essence of
their full involvement and further engagement in the work in the enterprises. This indicates that
for smooth transfer of necessary knowledge within or into the enterprise, there is a need of
developing working environment that fosters smooth exchange with individuals, groups, where
the inexperienced is ready to learn and apply knowledge and the reverse, the more experienced
ready to transfer and share necessary knowledge. Previous large experience can sometimes be
an obstacle to learning new skills, especially when changing new technologies or work
processes, but sometimes it is crucial in recognizing the operation patterns. It means fostering
work environment that nurtures employees' willingness to learn, whether by working or
exploring new methods of work, that is, to track the results of work, to control and monitor of
applied solutions, concepts that facilitate, trying to simplify the work bottlenecks.
Since knowledge is not a value if it is not used, the key interest is whether and how knowledge
within enterprises is used in building new value for the enterprise.
The enterprise in which this is achieved is a prepared one. It adds value,
knowledge is continually built and engaged, by everyone in the enterprise (sometimes using
outsourced solutions, but in their own implementation, the so-called semi-open or open
innovation system). Knowledge can enter from various sources; every effort to add value is
welcome. Self-engagement and willingness to acquire exchange and re-apply
knowledge is becoming crucial capability at the individual and organizational level.
As long as the enterprise nurtures its persistence in innovation activities, new knowledge, an
idea / solution, the likelihood of new product / service / process occurring, and the knowledge
of how it is achieved, even if it is discarded and isolated, brings value for the enterprise; the
knowledge how to get there remains in the enterprise and can be used for a new cycle of
innovation.
1. Enterprise Knowledge Management Framework
Selected elements of knowledge management practices that foster knowledge development and
the emergence of new knowledge within enterprises are identified and in detail analysed, being
observed through the implementation of innovative products / services / processes and their
respective novelty implemented by enterprises.
The current state of the art of technology solutions are simplifying workflows and increasing
efficiency, but building organizational and human readiness throughout this ever-changing
process is an even greater challenge for any enterprise. Some companies do better than others,
and this is clearly reflected in their persistence and readiness to introduce new products and
services, or to introduce customizations of existing products / services. Therefore, a key

188
ITEMA 2020
Conference Proceedings
element is to establish a genuine attitude in the enterprise towards knowledge sharing and
applying it in new knowledge development. According to Desouza (2003) "The biggest
obstacle to effective knowledge management is not the realization of the latest ICT solutions,
but the failure of the preparation and readiness of the people involved in the process to share
their know-how (Desouza, 2003). Monitoring and guiding change and engaging the people
involved is the key to make the change process successful. This is especially so in terms of the
personal nature of knowledge (for example it is shown that knowledge cannot be imparted to
someone in the form of a finished product). It turns out that one must be fully motivated /
willing to accept and apply it.
To create an organizational environment in which people are willing to share knowledge, most
natural is to develop principles and the concept of continuous improvement, and to nurture a
culture of learning. Learning by itself at the individual level signifies an awareness of
adaptation, of consciously seeking a solution to a particular situation, or seeking to resolve any
conflict between two completely different and dialectically opposed ways of thinking, and
conscious and purposeful finding of a solution, or conscious adaptation. Learning as a process
in and of itself for the individual as well as the group concerned is a conscious overall personal
engagement, a holistic journey, seeking and clearing the unknown, consciously going back and
forth, using different ways of reflection and action, of feeling and thinking and application, all
in a certain period. It involves the integrated functioning of the whole person - thinking, feeling,
understanding and its behaviour towards acquiring new knowledge.
Through learning as a process, there is a synergistic connection between the person / group and
the environment. The way the possibilities of each new experience are dealt with determines
the range of choices and decisions we see. The choices and decisions we make to a certain
degree determine the knowledge we strive to achieve, and this influences our future choices. In
essence, learning is a process of knowledge creation (Kolb and Kolb, 2008).
2. Knowledge management framework researched
Knowledge management methods are used to enable the enterprise to utilize and develop
employee knowledge in a rational and complete way simultaneously. Knowledge management
comes as a goal and does not mean only knowledge production, but as a goal-oriented use and
development of knowledge and skills that improve the performance of the organization, in
order that one becomes more competitive, efficient, and innovative.
Nonaka and Takeuchi (1995) emphasize the difference, departing from the traditional
definition of knowledge as "justified true belief", by defining knowledge as "a dynamic process
of man towards justified personal belief about “the truth ". (Nonaka and Takeuchi, 1995: 58)
According to them, in order to produce new knowledge / innovation, it is necessary to enable
knowledge creation beforehand. For them, organizational knowledge creation is "the ability of
the company" as a whole to create new knowledge, to spread it too through the organization to
incorporate it into its products, services and systems” (Nonaka and Takeuchi, 1995: 58) and
explain it through their dynamic “spiral of knowledge concept”.
3.Customized Knowledge Management Cycle Model
By integrating the LH cycles outlined in the Heisig (2009) reviews one can make a simple,
practical and comprehensive LH cycle model. Building on the Evans and Ali's (2013) Lifecycle
Model The Knowledge Management Cycle (KMC) is advanced and consists of 7 phases: 1. to

189
THE INFLUENCE OF KNOWLEDGE MANAGEMENT ON THE DEVELOPMENT OF INNOVATION
IN THE ENTERPRISES IN THE REPUBLIC OF NORTH MACEDONIA-SELECTED RESULTS
identify, 2. to preserve, 3. to share, 4. to use, 5. to learn, 6. improve and 7. Create new
knowledge here modified into Innovate.
Phase 1. Identifying and / or creating knowledge
When designing for a specific knowledge request, the researcher must identify whether there
is adequate "in-house" knowledge or that necessary knowledge should be created or acquired
(either through purchase or through building or both). This is why these two phases are linked
and grouped in the Knowledge Management cycle model.
Phase 1.1: Identify knowledge
What do we want to achieve? What knowledge do we need to have to achieve the desired
result? Do we have it and who should transfer / acquire it?
It is a phase in which the intellectual capital and needs of the organization are assessed in
defining critical-to-mission-of-organization knowledge and mapping the existing intellectual
base for future needs. With effective search for specific knowledge, the identifying phase
involves analysing and evaluating specific organizational rules, work cultures and evaluation
criteria. According to Wiig (1993), analysis involves looking at and removing / separating what
is shown to have value for a viable solution to a particular problem or decision to an existing
situation, and breaking down / separating to the end to discover potentially useful knowledge.
Phase 1.2. Development of knowledge, creation of new knowledge
The knowledge requirement may require a need for new knowledge and has to be built if it is
not found in the search phase. Also new knowledge may need to be created, if existing
knowledge only partially meets the knowledge needs.
Phase 2: Storage / Storage
Once the knowledge is judged to be valuable to the organization, based on the analysis and
evaluation in the identify phase and the creation phase, it is stored as an active integral part of
the organizational memory (in the minds of employees in the form of experience or bases of
knowledge data or both). This stage indicates the preservation of a codified form of knowledge
in the enterprise databases and embedded knowledge in the products / services of the
enterprise. Generally speaking, not all knowledge that holds value for individuals or
organizations can be stored in databases. The way they are structured is to help them find the
knowledge they want, to find and share the knowledge they want.
Most often these are activities that involve meta-tagging (tagging according to defined tags, or
according to a general association for easy retrieval) classification, archiving, linking and
optimizing search and retrieval.
Phase 3: Knowledge Sharing
Knowledge is retrieved / used from organizational memory, and shared / disseminated (shared
/ shared) both inside and outside the enterprise. The time and frequency (how often) of sharing
can be pre-determined (for example, immediately and often as new knowledge is preserved) or
on an ad hoc basis (from time to time). Explicit, dynamic and flexible (Wiig, 1993; Meyer and

190
ITEMA 2020
Conference Proceedings
Zack, 1999) network of expertise (e.g., a community of shared practice) fosters collaboration
and can specifically contribute to organizational knowledge sharing. Sharing tacit knowledge
can be done through a variety of initiatives and activities, through mentoring, training, or
apprenticeship programs. A balanced selection of technologies and deployment channels
should be established in each enterprise according to their strengths and weaknesses (Dalkir,
2011)
Phase 4: Using knowledge
Once shared, knowledge can be activated, its value can be set apart and applied across the
enterprise, and it can serve to solve problems, make decisions, improve efficiency or foster
innovative thinking. Knowledge can be embedded (Wiig, 1993), and there will always be some
degree of tacit knowledge that is applied. The knowledge application stage is crucial for
internalizing the tacit form of knowledge. According to Yuasa (1987: 25) who describes it as
a phase so called "learning with the body" and according to Boisot (2002: 73) "learning-
through-doing".
Phase 5: Learning
The knowledge that was shared and used in the previous stages can be used as a basis for
creating new and refining existing knowledge. The use of knowledge, especially in situations
where professionals provide contextual understanding, leads employees to gain experience that
enables them to interpret the impact of knowledge on their work environment (Evans and Ali,
2013). This stage involves deconstructing (applying) the "blocks" with knowledge, integrating,
connecting, combining and internalizing knowledge.
Phase 6: Improving knowledge
Learning that takes place in the previous phase leads next phase that is further refinement of
knowledge. New value is either identified or created by them and additions or updates are made
to keep them current in Organizational Memory, to be applicable in the context of
organizational performance. Knowledge is repackaged to be stored, archived or labelled (in the
case of multiple forms of tacit knowledge) so that their value can be used effectively in the
future.
In this model (KMC Model) the improvement phase is the decision about which knowledge is
archived, stored or transferred outside the organization / enterprise for future use. Some general
activities that help with the improvement phase include: for example, post-crisis review,
reflection time, and adaptation lessons learned.
Phase 7: Innovate / create
This stage is also connected to the first phase by the mere creating and delivering new
organizational-level knowledge in innovative enterprise products / services /
processes. Creation occurs when prior knowledge is applied or linked in a new way, or a new
combination, reflecting new cognitive concepts that arise when employees, inventors,
researchers, builders, or entrepreneurs (re) combine most often through teamwork, social
interaction, and already existing cognitive concepts acquire new knowledge, which in turn can
bring new meaning or meaning.

191
THE INFLUENCE OF KNOWLEDGE MANAGEMENT ON THE DEVELOPMENT OF INNOVATION
IN THE ENTERPRISES IN THE REPUBLIC OF NORTH MACEDONIA-SELECTED RESULTS
In addition to the scope of technological knowledge that it must undoubtedly have, crucial and
essential for successful innovation, is the ability of the organization to apply that knowledge
(Hansen, Perry, Reese, 2004; Taylor and Greeve, 2006; Volberda and Van Den Bosch, 2005).
Knowledge related to innovation activities is analysed in terms of how innovations arise, are
created and how knowledge can be organized to influence innovation activities.
The creative process of transferring from the individual to the organization and vice versa, the
process of coming up with a feeling to realize a new combination or integrate several existing
concepts is a challenge that cannot be fully understood or foreseeable, but if certain practices
are used it is likely to happen.
4. Innovation as a creation
Here, below, are selected some knowledge management practices that enable the emergence of
an innovative process.
Usually, for innovations to be realised, there are previous causes and consequences of new
concepts and they certainly do not occur immediately. They are discovered in the process of
trial and error, elimination of error, re-examination of concepts, which can take years and are
regularly associated with a need for increasing the knowledge base. (Witt Ulrich, 2016)
According to the Oslo Manual (2005), business innovation is defined as "a product, process,
marketing method or organizational method that must be new (or significantly improved) for
enterprises", while according to Kline and Rosenberg (1986) innovation should be considered
"as a series of changes in a system”; Freeman and Soete (1997) distinguish innovation from
invention, with the former defining it as "the creation of a new idea and latter bringing it into
practice - which includes all the activities needed to commercialize new products / services".
Above mentioned different definitions of innovation state the most important message, which
is that innovation must bring something new to the enterprise, national market and global
market in order to be considered innovative. Simply said, innovating or being involved in
innovation activities helps companies to stay competitive, and that knowledge brings them
forward in their respective industries or markets.
Technological, Product and Process (TPP) innovation activities represent all the scientific,
technological, organizational, financial and commercial steps that are actually taken to bring
about the implementation of technologically new or improved products and processes. Some
are highly innovative; others are not so new but needed for realization (Oslo Manual, 2005:
32).
The Oslo Manual (2005) defines innovative activities based on two concepts / approaches,
subjective and objective: an innovative enterprise and an innovative activity. According to the
subjective approach, an innovative enterprise is an organization that has realized at least one
innovation whether it is a product, technology, marketing or process or their combination (Oslo
Manual, 2005: 31).
According to the objective approach, the enterprise can have innovative activities without any
innovation. All innovative activities can be classified into three categories:
1. “Successful with the result of realizing innovation (although this innovation may also be
commercially unsuccessful).

192
ITEMA 2020
Conference Proceedings
2. In progress, work in progress that has not yet resulted in the realization of innovation.
3. Abandoned before the realization of innovation” (Oslo Manual, 2005: 10).
The survey undertaken includes innovative activities in enterprises under the previous three
categories. Below are the selected samples of the research questions, which are included for
measuring the innovative activities of the first category.
An innovative enterprise is defined as an entity that has successfully implemented a
technologically new or significantly improved product / service / process or combination of
previous ones over a period of time under investigation. This category can be divided into
companies that have only "passive" innovative products / services / processes, i.e. those that
have exclusively innovated by importing embedded technology into new machinery or
equipment. (OECD Oslo Manuel, 2005: 11)
III. RESEARCH METHODOLOGY
1. Primary data collection methods:
1 .1. Quantitative methods:
Survey method of the survey herewith is aimed to obtain primary data from the employees
of the selected enterprises with their perception of business practices regarding
Knowledge Management and Innovation activities in their respective field of work and
enterprises. The primary data obtained are processed and analysed using appropriate
statistical methods, such as:
Method of descriptive analysis - in order to determine the individual demographic and
contextual determinants in the enterprises;
Statistical analysis method using Chi-Pearson distribution - in order to check the
observation and perform a fullness test, to determine how well the model and the
observation are validated;
IV. EMPIRICAL SURVEY AND FINDINGS
The research data is collected and analysed from enterprise employees, which in the period
under study have introduced an innovative product / service / process in the period from June
to December 2017 within selected enterprises (in total 38). Enterprise representatives were
contacted and notified by the author via personal contact, telephone or email in addition to a
written notice of the purpose of the work. An electronic link was then sent to the firms and / or
respondents to the questionnaire created for this survey. Each respondent answered the
questions to the best of their knowledge and experience working within the respective
company.
Total number of respondents who completed the questionnaire is 176, whereas 165 responds
were complete or 93.75% of the respondents.
More general approach is applied in order to obtain as much as possible information from the
employees of the contacted enterprises that were participating in this research, based on
selected key thesis questions, selected from Oslo Manual (2005) , and made adjustments to
obtain as relevant and qualitative data as possible from the participants.

193
THE INFLUENCE OF KNOWLEDGE MANAGEMENT ON THE DEVELOPMENT OF INNOVATION
IN THE ENTERPRISES IN THE REPUBLIC OF NORTH MACEDONIA-SELECTED RESULTS
1. Measurement of knowledge management practices
Question number 4 of the Questionnaire, measuring knowledge management on a personal
level: How long does it take to find the information I need?
This states a response at a firmly established or expected time interval (approx.: <5 min, 5-15
min, up to 30 min, and over 30 min ...) for a clearer analysis of the data. If the retrieval of the
required data and information from your data base is fast, it is likely that knowledge is used
regularly on an individual level – regular data / information management and technical and
operational infrastructure knowledge.
Table 1. Survey Question 4 with obtained results
IV How long does it take to find the information I need
from my file?
Number of
respondents %
1 5 minutes 108 65.45%
2 5-15 minutes 44 26.67%
3 up to 30 minutes 8 4.85%
4 longer than 30 5 3.03%
Source: M. Pendevska, 2019
At the organizational level:
This parameter measures the time it takes to find the information needed in individual
database. This enables to obtain additional features for knowledge management practices on
an individual level, i.e. accessibility and ease (or lack thereof) in finding the required
knowledge, existence or non-existence of a method of finding documents and files to obtain
satisfactory or unsatisfactory search results.
At the organizational level: how long does it take to find the information I need from the shared
file?
These results probably indicate that established organizational practices and ways of
structuring information are clear and easily accessible to their employees. The quick and easy
way to get the information you really need, indicates frequent and regular use of established
procedures in order to obtain the needed information.
Table 2. Survey Question 5 with obtained results
V How long does it take for me to find the information
I need from a shared file in the organization?
Number of
respondents %
1 5 minutes 53 31.52%
2 5-15 minutes 77 46.67%
3 up to 30 minutes 32 19.39%
4 longer than 30 4 2.42%
Source: M. Pendevska, 2019
These results show that established organizational practices, accessibility and frequency of
structured information are clear to the ones that need them and are easily accessible on the
enterprise level and are regularly used.

194
ITEMA 2020
Conference Proceedings
2. Measuring the results of innovative business activity
As we try to measure a particular innovation activity, an objective approach is chosen (Oslo
Manuel, 2005: 49), i.e., to collect selected data on an innovative activity in an enterprise.
According to the previous definition, the selected questions should be answered:
In accordance with knowledge management practices, what is the result of the operation of
enterprises in our country in terms of successful (commercial) realization of innovation, which
degree of novelty brings with it the product / service / process that is produced / is provides as
a service / technological or organizational process?
This includes the innovations undertaken by enterprises to fulfill certain product / service
improvement, manufacturing process or service for more profitable operation. It shows the
enterprise's commitment to incremental product / service / process improvement or the
introduction of a radically new product / service / process. It is assumed that incremental
innovation / improvement of product / service / process quality extends the product / service /
process life cycle. Most of the innovations are probably in this section.
To get initial information on enterprise innovation activities complete the following basic
company information and innovative product or services:
Table 3. Survey Question 14 with obtained results
XIV Realized innovation in the company where I work? Number of
respondents %
1 Product 62 37,58%
2 Service 66 40.00%
3 Working process 37 22.42%
Source: M. Pendevska, 2019
Measuring the novelty incorporated in their respective products indicates the knowledge
incorporated within the product / service / process.
How new are the product / service / process in the company, product / service / process?
Table 4. Survey Question 15 with obtained results
XV This product/service/process is: Number of
respondents %
1 New worldwide 23 13.94%
2 New to the market in the state 52 31.52%
3 New for the organization 90 54.55%
Source: M. Pendevska, 2019
This shall indicate if the commitment within the enterprise is crowned with a product that is
new to the enterprise, to the national market or worldwide. A new product for the organization
shows low level of the applied knowledge (knowledge already used and known in the near
environment) that organization can process and apply.
New product in the country means bringing new knowledge in the national market that is
applied in a product and does not exist within the country, in the near environment. This means
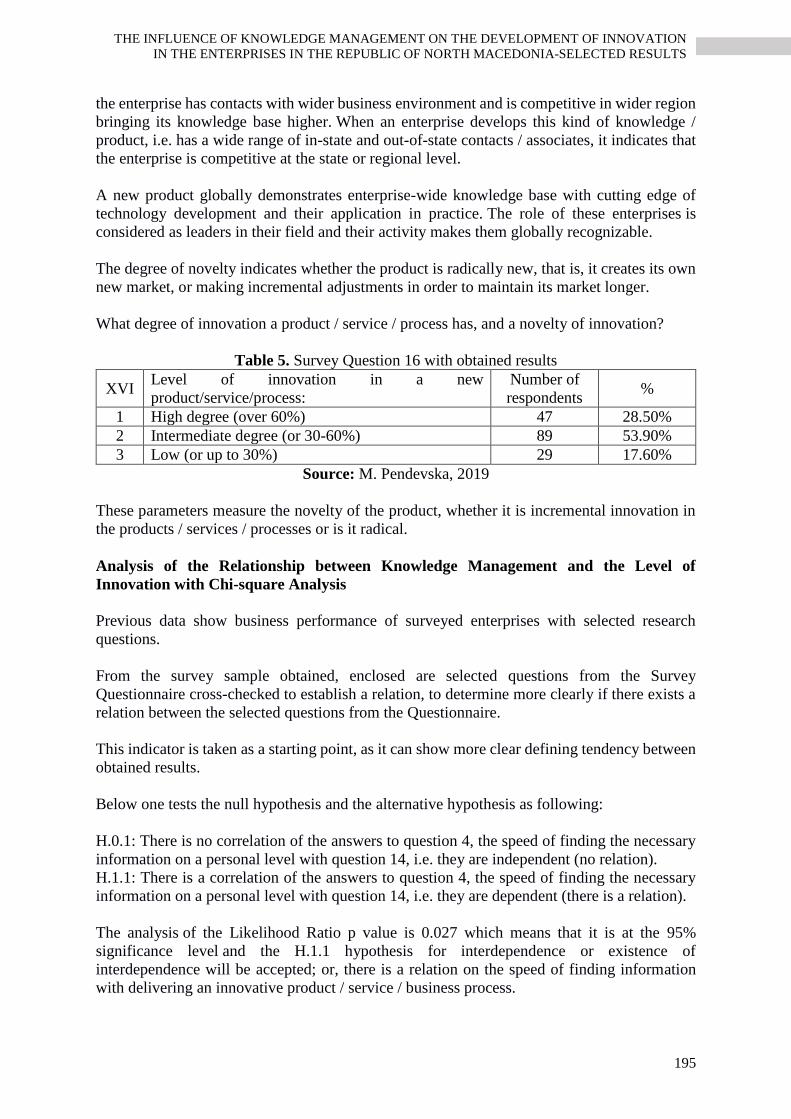
195
THE INFLUENCE OF KNOWLEDGE MANAGEMENT ON THE DEVELOPMENT OF INNOVATION
IN THE ENTERPRISES IN THE REPUBLIC OF NORTH MACEDONIA-SELECTED RESULTS
the enterprise has contacts with wider business environment and is competitive in wider region
bringing its knowledge base higher. When an enterprise develops this kind of knowledge /
product, i.e. has a wide range of in-state and out-of-state contacts / associates, it indicates that
the enterprise is competitive at the state or regional level.
A new product globally demonstrates enterprise-wide knowledge base with cutting edge of
technology development and their application in practice. The role of these enterprises is
considered as leaders in their field and their activity makes them globally recognizable.
The degree of novelty indicates whether the product is radically new, that is, it creates its own
new market, or making incremental adjustments in order to maintain its market longer.
What degree of innovation a product / service / process has, and a novelty of innovation?
Table 5. Survey Question 16 with obtained results
XVI Level of innovation in a new
product/service/process:
Number of
respondents %
1 High degree (over 60%) 47 28.50%
2 Intermediate degree (or 30-60%) 89 53.90%
3 Low (or up to 30%) 29 17.60%
Source: M. Pendevska, 2019
These parameters measure the novelty of the product, whether it is incremental innovation in
the products / services / processes or is it radical.
Analysis of the Relationship between Knowledge Management and the Level of
Innovation with Chi-square Analysis
Previous data show business performance of surveyed enterprises with selected research
questions.
From the survey sample obtained, enclosed are selected questions from the Survey
Questionnaire cross-checked to establish a relation, to determine more clearly if there exists a
relation between the selected questions from the Questionnaire.
This indicator is taken as a starting point, as it can show more clear defining tendency between
obtained results.
Below one tests the null hypothesis and the alternative hypothesis as following:
H.0.1: There is no correlation of the answers to question 4, the speed of finding the necessary
information on a personal level with question 14, i.e. they are independent (no relation).
H.1.1: There is a correlation of the answers to question 4, the speed of finding the necessary
information on a personal level with question 14, i.e. they are dependent (there is a relation).
The analysis of the Likelihood Ratio p value is 0.027 which means that it is at the 95%
significance level and the H.1.1 hypothesis for interdependence or existence of
interdependence will be accepted; or, there is a relation on the speed of finding information
with delivering an innovative product / service / business process.

196
ITEMA 2020
Conference Proceedings
This may indicate that from the sample analysed the high degree of knowledge management
system at an individual level influences the realization of an innovative product / service /
business process within the enterprises.
Table 6. Relation between survey question 4 and survey question 14
Factor 1*Factor 2
Factor 1 Factor 2 The innovation from your enterprise
Total product process service
How long
do I need
to find
information
that I need
from my
data base?
5 minutes replies 42 22 44 108
% of total 25.5% 13.3% 26.7% 65.5%
5-15
minutes
replies 16 7 21 44
% of total 9.7% 4.2% 12.7% 26.6%
up to 30
minutes
replies 2 5 1 8
% of total 1.2% 3.0% 0.6% 4.8%
longer than
30 minutes
replies 2 3 0 5
% of total 1.2% 1.8% 0.0 3.0 %
Total replies 62 37 66 165
% of total 37.6% 22.4% 40.0% 100.0%
Source: M. Pendevska, 2019
Below one tests the 2.0 hypothesis and the alternative hypothesis 2.1 as following:
H.2.0: There is no correlation of the answers to Survey Question 4, the speed of finding the
necessary information at personal level with Survey Question 15, i.e. they are independent (no
relation).
H.2.1: There is a correlation of the answers to Survey Question 4, the speed of finding the
necessary information on a personal level with Survey Question 15, i.e. they are dependent
(there is a relation).
Table 7. Relation between survey question 4 and survey question 15
Factor 1*Factor 2
Factor 1 Factor 2 This product/service/process is:
Total
new to the
organization
new to the
national level
new on a
global level
How long
do I need
to find
information
that I need
from my
data base?
5 minutes replies 59 33 16 108
% of total 35.8% 20.0% 9.7% 65.5%
5-15
minutes
replies 23 18 3 44
% of total 13.9% 10.9% 1.8% 26.7%
up to 30
minutes
replies 4 0 4 8
% of total 2.4% 0.0% 2.4% 4.8%
longer than
30 minutes
replies 4 1 0 5
% of total 2.4% 0.6% 0.0% 3.0%
Total replies 90 52 23 165
% of total 54.5% 31.5% 13.9% 100.0%
Source: M. Pendevska, 2019
The analysis of the Likelihood Ratio p value is 0.021 which means that it is at the 95%
significance level and the hypothesis H.2.1 for interdependence or existence of
interdependence will be accepted.

197
THE INFLUENCE OF KNOWLEDGE MANAGEMENT ON THE DEVELOPMENT OF INNOVATION
IN THE ENTERPRISES IN THE REPUBLIC OF NORTH MACEDONIA-SELECTED RESULTS
Innovation in a product / service / process brings different levels of innovation, in-built
knowledge or how much new knowledge is used in the relevant innovative products / processes
/ service and defines categories "new to the organization.", "New to the market in the country"
and" new worldwide ".
The knowing where to find knowledge needed and used in innovative products shows the
tendency of persistence of the company to develop its own business. The higher the knowledge
applied to their products shows probably higher the novelty of innovation embedded in the
products / services / business process.
It is noticeable the relatively low level of knowledge embedded in the innovative product or
most of the answers with 54.5%, and the level of utilization of the knowledge management
system with 35.8% or 13.9%, but up to 30 min. with 2.4% and over 30 min. with 2.4%.
It is also noticeable that in the categories "new to the state market" and "new to the world level"
the search for information belongs to the two high groups, i.e. "up to 5 min" with 20.0% and
9.7% respectively, and for the "5-15 min" category 10.9% and 1.8%;
CONCLUSION
Starting from the humanistic approach that every change starts from the individual and his
knowledge and ability, and by identifying the established knowledge management
infrastructure in the enterprise, the current situation in the enterprises is identified. The model
used clearly reflects the ability of enterprises to utilize their knowledge, foster a personal and
organizational system for creating, transferring, storing and reusing knowledge. This section
shows the level of use of systems, creating, transmitting, storing and reusing information, gives
a good explanation of the level of mutual understanding at different levels in the enterprise.
The framework provided aims to identify the current situation in order to provide a basis for
explaining the key elements that describe operational and strategic compliance. The results are
in line with previous research in this area. Namely, it indicates that there are knowledge
management practices, but they are used at a very low level.
Knowledge management practices in a broad sense do not exist for themselves. The purpose
of knowledge is to be used. For enterprises this dimension of knowledge is especially critical
for their survival and further development, that is, capturing as much as possible of the
knowledge of their employees, incorporating it with existing ones or outside them into new
enterprise products / services.
Since new knowledge does not occur by accident nor does it appear, it means that it exists
somewhere and should be used in the interest of the enterprise. Their level and the way
companies do it are dimensions that are explored and included in last part of the Questionnaire. Logically, this part explores various parameters for the existence of innovative activities in the
enterprise, i.e. commercialization of new knowledge of the enterprise.
The second part of the Questionnaire actually completes the research in enterprises, which is
the result of using their (and external) knowledge in innovative activity.
In management literature, innovative activities are elaborated as the main strategy for gaining
competitive advantage and generating sustainable profits. The criterion for positive evaluation
of innovation and its effects is based on the innovations that pass the market test successfully.

198
ITEMA 2020
Conference Proceedings
The willingness of the enterprise to deal with rapid change is related to the creation of new
knowledge / innovative products / services, it is the path that enables continuous
learning. Every technological change result in innovative activities, raising the level of
knowledge, including intangible investments such as research and development. The main
challenge, of course, is to create conditions within the enterprise for long-term
sustainable efforts for innovative activities.
The empirical research data mark changes at the enterprise level, the interaction between
different stakeholders, both at the individual level and the organizational level. It shows
different types of collaboration and knowledge-sharing in terms of new knowledge, practices
that lead to the realization of new products / services / processes in the form of innovation in
the current business environment.
For that to happen, there is probably a demand for those innovations. There are cases where
they offer solutions to problems that have not previously been satisfactorily resolved. In most
cases, the demand for innovation is simply due to lower cost, better quality and / or more
favourable supply conditions. If innovations pass the market test successfully, it means that the
demand for innovation pays off, and the innovator can make a profit. For this reason,
innovations that successfully pass the market test are considered to improve well-being and are
therefore highly desired.
Finally, recommendations arising from the empirical research on knowledge management
practices and their impact on the creation of new knowledge in the form of new products /
services / processes in enterprises in the Republic of North Macedonia show that this area is
under-researched and has substantial practical value to enterprises in order to enhance their
ability to perform successful innovation.
REFERENCES
Dalkir, Kimiz. 2005. Knowledge Management in Theory and Practice. Butterworth
Heinemann. Vol. 4. https://doi.org/10.1002/asi.21613. Evans, Max, Kimiz Dalkir, and Catalin Bidian. 2014. “A Holistic View of the Knowledge Life
Cycle: The Knowledge Management Cycle (KMC) Model.” Electronic Journal of
Knowledge Management 12 (2): 85–97.
Heisig, Peter. 2013. “Knowledge Management – Step by Step Knowledge Management – Step
by Step • Background • Concepts • Knowledge Management – Step by Step Report from
Business Practice • Concepts • Summary,” no. January: 1–7.
Heij C. V. 2015. Innovating beyond Technology, ERIM PhD Series in Research in
Management, 370 ERIM reference number: EPS-2015-370-S&E ISBN 978-90-5892-
418-6
Kolb, Alice Y, and David a Kolb. 2008. “Experiential Learning Theory: A Dynamic, Holistic
Approach to Management Learning, Education and Development.” Handbook of
Management Learning, Education and Development, 1–59.
https://doi.org/http://dx.doi.org/10.4135/9780857021038.n3. Kok, J.A.2005, Can models for knowledge management be successfully implemented to
manage the diversity of indigenous knowledge?
Nonaka, I., Takeuchi, H. (1995): The Knowledge-Creating Company: How Japanese
Companies Create the Dynamics of Innovation, Oxford University Press, May, (1995:58)
Nonaka, Ikujiro, and Noboru Konno. 1998. “The Concept of ‘Ba.’” California Management
Review. https://doi.org/10.1016/j.otsr.2010.03.008.

199
THE INFLUENCE OF KNOWLEDGE MANAGEMENT ON THE DEVELOPMENT OF INNOVATION
IN THE ENTERPRISES IN THE REPUBLIC OF NORTH MACEDONIA-SELECTED RESULTS
Nonaka, Ikujiro, and Ryoko Toyama. 2003. “The Knowledge-Creating Theory Revisited:
Knowledge Creation as a Synthesizing Process.” Knowledge Management Research &
Practice 1 (1): 2–10. https://doi.org/10.1057/palgrave.kmrp.8500001. Minbaeva, Dana B., Kristiina Mäkelä, and Larissa Rabbiosi. 2010,” Explaining Intra-
Organizational Knowledge Transfer at the Individual Level” Center for Strategic
Management and Globalization Copenhagen Business School -Working Paper No.
1/2010.
http://openarchive.cbs.dk/bitstream/handle/10398/8001/SMGWP2010_1.pdf?sequence=
1. Mcelroy, Mark W. 2001. “Second-Generation Knowledge Management.”
North, K., Probst, G., Romhardt, K. (1998): Wissenmessen – Ansätze, Erfahrungen und
kritische Fragen, in Zeitschrift für Führung und Organisation, Vol. 3
Michailova, Snejina, and Kate Hutchings. (2004) “Knowledge Sharing and National Culture:
A Comparison Between China and Russia” Journal of Management Studies. Oslo Manual, 2005, OECD 2005. “Oslo Manual.”
http://www.oecd.org/science/inno/2367580.pdf.
Pendevska Marija, (2019), “The Influence of knowledge management on the innovation in the
enterprises in Republic Macedonia”, doctoral thesis, defended June 2019 at Faculty of
Economy, University Cyril and Methodius Skopje.
Probst, G., Raub, S., Romhardt, K. (2000): Managing Knowledge, John Wiley & Sons,
Chichester
Resatsch Florian, Faisst Ulrich 2003, “Measuring the Performance of Knowledge Management
Initiatives.” n.d.
Wiig K.M, 1993, Knowledge Management Foundations: Thinking about Thinking: How
People and Organizations Create, Represent and Use Knowledge.
Willke H, 1998. Systematisches Wissenmanagement, Stuttgart: Lucius und Lucius 1998: 39
Witt, Ulrich. 2016. “What Kind of Innovations Do We Need to Secure Our Future?” Journal
of Open Innovation: Technology, Market, and Complexity 2 (1): 17.
https://doi.org/10.1186/s40852-016-0043-y.
Witt, Ulrich, Tom Broekel, and Thomas Brenner. 2007. “Knowledge and Its Economic
Characteristics - A Conceptual Clarification.” Ssrn.
https://doi.org/10.2139/ssrn.1019222.


201
OPERATION MANAGEMENT USING ITIL AND COBIT
FRAMEWORK
Joaquina Marchão1
Leonilde Reis2
Paula Ventura3
DOI: https://doi.org/10.31410/ITEMA.2020.201
Abstract: Information and Communication Technologies management is now increasingly
challenging in a highly digital and connected world, with different services emerging for
different clients with heterogeneous infrastructures, software, assets, different service
requirements, security risks increasing, organizational structures not flexible to adjust. These
are some of the variables to manage in Information and Communication Technologies
departments. This paper aims to present a literature review to support the design of an
approach for service operation management in a medium-sized organization, to improve
operational efficiency, cost optimization and stakeholder satisfaction, relevant topics in any
organization strategy. The applied methodology includes a literature study related with the
frameworks Control Objectives for Information and Related Technology (COBIT) and
Information Technology Infrastructure Library (ITIL). The main results underlying the
literature review were based on the use of keywords in the subject domain.
Keywords: ITIL, COBIT, Service operation, Business process, ITSM.
1 INTRODUCTION
nformation and Communication Technologies (ICT) Management in an organizational
context can enhance or limit business development. In this context, the alignment between
the organization's management and governance and the ICT department is considered
essential. Medium-large size organizations are faced with difficulties underlying greater
complexity in the daily service operation management and related processes. Towards
improvement, it’s important to implement universally accepted ICT management frameworks
such as IT Infrastructure Library (ITIL) and/or Control Objectives for Information and Related
Technology (COBIT). ITIL is highly used in organizations worldwide to align ICT with
business needs through the management of service lifecycle (OGC, 2007).
The stages of the service life cycle are: Service Strategy, Service Design, Service Transition,
Service Operation and Continual Service Improvement. COBIT is used to align the
management and the governance of IT departments with the company goals. To be competitive,
companies must implement information technology that is oriented to customers and
stakeholders (Raharjana, Susmiandri & Justitia, 2018). Service operation is the ITIL stage in
which the service quality is perceived by customers and stakeholders. This stage focuses on
providing effective and efficient operational services to deliver the required business outcomes
and value to the customer (OGC, 2007). ITIL bundle established best practices to support the
1 Universidade do Algarve, Portugal 2 Polytechnic Institute of Setúbal, Portugal 3 Universidade do Algarve, Portugal
I

202
ITEMA 2020
Conference Proceedings
tasks of Information Technology (IT) service operating (Kubiak & Rass, 2018). Real-life IT
support organizations usually implement very complex organizational, structural, and
behavioral processes according to strategic objectives defined at the business management
level (Bartolini, Stefanelli & Tortonesi, 2013).
Business processes are more and more dependent on ICT. A process consists of a coordinated
set of activities using resources and capabilities to produce an outcome, which, directly or
indirectly, creates value for an external customer or stakeholders (OGC, 2007). This paper aims
to present a literature review to support the design of an approach for service operation
management in a medium-sized organization. The structure of this paper has four sections. The
first section is the introduction to the research theme. The second section presents the Research
Methodology. In the third section, the results are discussed and in the last one, the fourth,
conclusions are presented and recommendations are explained.
2 RESEARCH METHODOLOGY
The research approach used is a literature review, began by planning review, identifying the
needs and formulating questions and objectives. Next phase allows to define parameters and
criteria, generate and refine keywords. The following step on this phase is conduct research
and obtain studies, evaluate and record. In a loop process, these two steps will be applied until
the achieve the desired results. The last phase is the report review.
2.1 RESEARCH SCOPE
The definition of the research process scope is based on the literature found in conference
abstracts and journals articles (IEEExplore), conference abstracts and research articles
(ScienceDirect), from 2010-2020. The focus is the evaluation of case studies implemented with
COBIT and ITIL.
ITIL bundle established best practices to support the task of IT service operation (Kubiak &
Rass, 2018), is the best practices guidance for IT Service Management (ITSM) and has been
well accepted by organizations world-wide. ITILv3 presents five stages in the service lifecycle
management: Service Strategy, Service Design, Service Transition, Service Operation and
Continual Service Improvement (OGC, 2007).
Control Objectives for Information and Related Technology (COBIT) is an IT governance
framework; it shows a clear distinction between IT management and IT governance. COBIT19
refers the possibility to define factors and components that should be considered by
organizations to build and maintain a governance system: processes, organizational structures,
politics, procedures, information flows, culture, ethic and behavior, skills, services,
applications and infrastructure of an organization, not only in the ICT domain (ISACA, 2019).
Based on several studies and research it is considered that COBIT and ITIL frameworks are
relevant references to support the design of an approach for service operation management in
a medium-sized organization, to improve operational efficiency, cost optimization and
stakeholder satisfaction.

203
OPERATION MANAGEMENT USING ITIL AND COBIT FRAMEWORK
2.2 RESEARCH QUESTIONS
The formulations of the research objectives are:
Could ITIL and COBIT bring benefit to a medium-sized organization?
Could ITIL and COBIT support implementation of service operation and related business
processes?
2.3 RESEARCH PROCESS
The process of literature identification used the following resources:
. IEEExplore Digital Library;
. Science Direct;
Based on these two sources, several keywords were used in the search with Boolean operators
in the abstract area. The keywords or group of keywords used to find the right literature are:
“Implement”; “Case”; “Process”; “Framework”; “Approach”; “Model”; “ITIL”; COBIT;
Operation. During the first execution, some similar expressions were detected, it was decided
to use all. The search strings were the following:
In IEEExplore: (“Implement” OR “Case” OR “Process” OR “Framework” OR
“Approach” OR “Model”) AND “ITIL”. It was found 194 studies. Adding AND
“COBIT”- to the previous selection, the number of studies decrease to 29. Applying
addiction again to the previous selection with - AND “Operation” - (related to ITILv3
service Operation) it results in 2 studies. Adding “medium-size”, it resulted in an empty
set. It was decided to use the 2 studies previously selected.
In Science Direct, the article types selected was research articles and conference
abstracts; the terms selected were: (“Implement” OR “Case” OR “Process” OR
“Framework” OR “Approach” OR “Model”) AND “ITIL”. It was found 307 studies.
Adding - AND “COBIT”- to the previous selection, the number of studies decrease to
100, showing that is more usual ITIL implementation. Applying another addiction to the
previous selection with - AND “Operation” (related to ITILv3 service Operation) it
results in 82 studies. Adding “medium-size” (related to the organization size) it results in
26 studies.
The complete string is: (((((((("Abstract":Implement) OR "Abstract":Case) OR
"Abstract":Process) OR "Abstract":Framework) OR "Abstract":Approach) OR
"Abstract":Model) AND "Abstract":ITIL) AND "Abstract":COBIT) AND
"Abstract":Operation) AND "Abstract":medium-size).
2.4 DATA EXTRATION
The inclusion and exclusion criteria applied to the studies were:
Rejected repeated studies and Rejected studies whose abstracts could not answer the research
questions or Scope.
Table 1 presents the results of the research in theme based on the defined criteria.
Table 1. Results of the previous stage
Source Studies Found Candidate Selected
IEE EXplore 194 29 2
Science Direct 307 100 9
Total 501 129 11

204
ITEMA 2020
Conference Proceedings
Table 1 shows the result of the interactions in online BD to select the studies considered
relevant to the development of the framework.
2.5 RESULT ANALYSIS
The result of the studies identification was based on the analysis of the following criteria:
Publishing Outlets (Conference/Journal); Most productive institutions and Author’ academic
backgrounds. It is considered that these results can contribute to enrich the framework in
development.
3 RESULTS AND DISCUSSIONS
Section three presents the result and discussions of publishing outlets, most productive
institutions and author’ Academic Background.
3.1 TRENDS CHARACTERISTICS
Table 2 shows the publishing outlets from selected studies.
Table 2. Publishing Outlets
Conference/Journal Name #
Conference 2019 IST-Africa Week Conference (IST-Africa) 1
Conference 2018 5th International Conference on Behavioral, Economic, and Socio-
Cultural Computing (BESC) 1
Journal Computer Networks 1
Journal International Journal of Accounting Information Systems 1
Journal Procedia Technology 1
Journal Computer Standards & Interfaces 1
Journal Procedia - Social and Behavioral Sciences 1
Journal Computers & Security 1
Journal International Journal of Information Management 1
Total 9
Table 2 identifies conferences and journals where selected studies were presented, it was
considered that can add value to the framework in development.
3.2 AUTHORS’ ACADEMIC BACKGROUNDS
From 32 researchers, they were categorized into 6 department/ knowledge groups. The results
show most researchers are from Computer Science groups/departments.
Table 3 shows the author’ Academic Backgrounds.
Table 3. Author’ Academic Backgrounds
Department #
Accounting 1
Computer Science 16
Software Engineering 3
Information Systems 6
Management 6
Total 32

205
OPERATION MANAGEMENT USING ITIL AND COBIT FRAMEWORK
Table 3 presents the different knowledge areas relevant to the theme. It shows the pertinence
of the work proposed in the framework that is under development and its multidisciplinary
character.
3.3 MOST PRODUCTIVE INSTITUTIONS
Table 4 presents, in an alphabetic order, the institutions considered in the studies selected with
the criteria applied.
Table 4. Most Productive Institutions
Institutions #
Beykent Üniversitesi, Istanbul, Turkey 1
Federal University of Rio Grande do Sul, Brazil 1
National Technological University of South Lima, Peru 1
NHH Norwegian School of Economics, Bergen, Norway 1
Oregon State University, EUA 1
Universidad Politécnica de Madrid, Spain 1
Universitetet i Agder, Kristiansand, Norway 1
University of Alcala, Madrid, Spain 1
University of Economics, Prague, Czech Republic 1
University of Ferrara, Italy 1
University of Innsbruck, Austria 1
University of Johannesburg, South Africa 1
University of Manchester, UK 1
University of Southern Queensland, Australia 1
University of Tulsa, Oklahoma, EUA 1
Total 15
Table 4 shows the relevance of the theme; different institutions around the world are working
and producing studies on that subject.
4 FUTURE RESEARCH DIRECTIONS
Further research needs to be conducted to align the framework objectives. Literature reviews
should be conducted on other sources as well, because this paper only used two sources
database (IEEExplore Digital Library and Science Direct). More different sources will enrich
the research and knowledge of the implementation of service operation based on ITIL and
COBIT.
CONCLUSION
Due to the need for optimization processes in a medium organization, a framework is being
designed, for which a review of the literature is being carried out. The paper presents a literature
review from two digital databases (IEEExplore and Science Direct). These publications discuss
different aspects of ITIL and COBIT frameworks.
To answer the research questions based on the literature found could be said that ITIL is the
most implemented ITSM framework all over the world, the use of IT Services Management

206
ITEMA 2020
Conference Proceedings
(ITSM) has provided many positive business impacts; although, there are several issues related
to ITSM, such as data quality, process automation, IT as a service broker, etc. (Dharmawan,
Sukmana, Wardhani, Ichsani & Subchi, 2018) and with ITIL processes in place, it becomes
considerably easier to resolve and fix the incidents reported (Mahalle, Yong & Tao, 2018).
Besides the benefits, implementing ITIL and COBIT through an organization is challenging
and complex, due a lack of alignment between both framework and the fact that literature
provides only general guidance (Yamami, Mansouri, Qbadou & Illousamen, 2016).
REFERENCES
OGC, Office of Government Commerce, “The Official Introduction to the ITIL Service
Lifecycle”, London: TSO, 2007.
ISACA, “COBIT 2019 Framework: Governance and Management Objectives”. Schaumburg:
ISACA, 2018.
I. K. Raharjana, S. Susmiandri and A. Justitia, "Applying IT Services Business Relationship
Management on Security Outsource Company" 2018 5th International Conference on
Electrical Engineering, Computer Science and Informatics (EECSI), Malang, Indonesia,
2018, pp. 426-431.
P. Kubiak and S. Rass, "An Overview of Data-Driven Techniques for IT-Service-
Management," in IEEE Access, vol. 6, pp. 63664-63688, 2018, doi:
10.1109/ACCESS.2018.2875975.
Y. Mahy, M. Ouzzif and K. Bouragba, "Supporting ITIL processes implementation using
business process management systems," 2016 Third International Conference on Systems
of Collaboration (SysCo), Casablanca, 2016, pp. 1-4, doi:
10.1109/SYSCO.2016.7831338.
M. T. Dharmawan, H. T. Sukmana, L. K. Wardhani, Y. Ichsani and I. Subchi, "The Ontology
of IT Service Management by Using ITILv.3 Framework: A Case Study for Incident
Management," 2018 Third International Conference on Informatics and Computing
(ICIC), Palembang, Indonesia, 2018, pp. 1-5, doi: 10.1109/IAC.2018.8780478.
Veronica, A., “Information Technology Service Performance management using COBIT and
ITIL framework: A case study. International Conference on Information Management
and Technology”, (ICIMTech), 2018.
A. El Yamami, K. Mansouri, M. Qbadou and E. H. Illousamen, "Toward a new multi-agents
architecture for the adoption of ITIL framework by small and medium-sized enterprises,"
2016 4th IEEE International Colloquium on Information Science and Technology (CiSt),
Tangier, 2016, pp. 40-45, doi: 10.1109/CIST.2016.7805091.
C. Bartolini, C. Stefanelli and M. Tortonesi, "Synthetic incident generation in the reenactment
of IT support organization behavior," 2013 IFIP/IEEE International Symposium on
Integrated Network Management (IM 2013), Ghent, 2013, pp. 126-133.
A. Ekanata and A. S. Girsang, "Assessment of capability level and IT governance improvement
based on COBIT and ITIL framework at communication center ministry of foreign
affairs," 2017 International Conference on ICT For Smart Society (ICISS), Tangerang,
2017, pp. 1-7, doi: 10.1109/ICTSS.2017.8288871.
Veronica and A. Debora Suryawan, "Information technology service performance management
using COBIT and an ITIL framework: A systematic literature review," 2017
International Conference on Information Management and Technology (ICIMTech),
Yogyakarta, 2017, pp. 150-155, doi: 10.1109/ICIMTech.2017.8273528.
A. Mahalle, J. Yong and X. Tao, "ITIL Processes to Control Operational Risk in Cloud
Architecture Infrastructure for Banking and Financial Services Industry," 2018 5th

207
OPERATION MANAGEMENT USING ITIL AND COBIT FRAMEWORK
International Conference on Behavioral, Economic, and Socio-Cultural Computing
(BESC), Kaohsiung, Taiwan, 2018, pp. 197-200, doi: 10.1109/BESC.2018.8697294.
LEKETI, Mpho & RABORIFE, Mpho. (2019). IT Governance Frameworks and their Impact
on Strategic Alignment in the South African Banking Industry. 1-9.
10.23919/ISTAFRICA.2019.8764872.
Nancy Judith Cruz-Hinojosa, José Antonio Gutiérrez-de-Mesa, “Literature review of the
situation research faces in the application of ITIL in Small and Medium Enterprises”,
Computer Standards & Interfaces, Volume 48, 2016, Pages 124-138, ISSN 0920-5489,
https://doi.org/10.1016/j.csi.2016.05.001
Juliano Araujo Wickboldt, Luís Armando Bianchin, Roben Castagna Lunardi, Lisandro
Zambenedetti Granville, Luciano Paschoal Gaspary, Claudio Bartolini, “A framework
for risk assessment based on analysis of historical information of workflow execution in
IT systems”, Computer Networks, Volume 55, Issue 13, 2011, Pages 2954-2975, ISSN
1389-1286, https://doi.org/10.1016/j.comnet.2011.05.025
Firoozeh Rahimian, Akhilesh Bajaj, Wray Bradley, “Estimation of deficiency risk and
prioritization of information security controls: A data-centric approach”, International
Journal of Accounting Information Systems, Volume 20, 2016, Pages 38-64, ISSN 1467-
0895, https://doi.org/10.1016/j.accinf.2016.01.004.
Michal Sebesta, “On ICT Services Outsourcing in the Context of Small and Medium
Enterprises”, Procedia - Social and Behavioral Sciences, Volume 81, 2013, Pages 495-
509, ISSN 1877-0428, https://doi.org/10.1016/j.sbspro.2013.06.467
Michael Curry, Byron Marshall, Peter Kawalek, “IT artifact bias: How exogenous predilections
influence organizational information system paradigms”, International Journal of
Information Management, Volume 34, Issue 4, 2014, Pages 427-436, ISSN 0268-4012,
https://doi.org/10.1016/j.ijinfomgt.2014.02.005.
Sudi Apak, Sefer Gümüş, Zuhal Kurban, „Strategic Dimension of Outsourcing in the
Information Technologies Intensified Businesses”, Procedia - Social and Behavioral
Sciences, Volume 58, 2012, Pages 783-791, ISSN 1877-0428,
https://doi.org/10.1016/j.sbspro.2012.09.1056l
Jon Iden, Tom Roar Eikebrokk, “Implementing IT Service Management: A systematic
literature review”, International Journal of Information Management, Volume 33, Issue
3, 2013, Pages 512-523, ISSN 0268-4012,
https://doi.org/10.1016/j.ijinfomgt.2013.01.004.
Igor Aguilar Alonso, José Carrillo Verdún, Edmundo Tovar Caro, “Case Study of Strategic IT
Demand Management in Organizations – Exploratory Results”, Procedia Technology,
Volume 9, 2013, Pages 900-909, ISSN 2212-0173,
https://doi.org/10.1016/j.protcy.2013.12.100.
Michael Brunner, Clemens Sauerwein, Michael Felderer, Ruth Breu, “Risk management
practices in information security: Exploring the status quo in the DACH region”,
Computers & Security, Volume 92, 2020, 101776, ISSN 0167- 4048,
https://doi.org/10.1016/j.cose.2020.101776.


209
HOW DATA ANALYTICS HELPS MANAGEMENT IN GLOBAL
PANDEMIC SITUATION
Dimitar Dimitrov1 Radko Radev2
DOI: https://doi.org/10.31410/ITEMA.2020.209
Abstract: The ongoing COVID-19 pandemic is having a tremendous impact on the business
organizations, governments and people around the Globe. No matter if it is a public, or private
organization, the leaders and management have changed their approaches, standard
operations, the way they communicate, processes and procedures. In this paper is analyzed the
impact of Data Analytics on two main management pillars and more specifically: Business
Operations and Human Resources Management; more precisely, how they are impacted and
changed in the pandemics. We analyzed how Global IT Companies are reacting and using
analytics as a tool that helps them in the day to day operations, representing some used models
and patterns.
Keywords: Management, Corporate management, Data analysis.
INTRODUCTION
COVID-19 outbreak
ecember 31st, the World Health Organization (WHO) reports “Pneumonia of unknown
cause”, detected in Hubei province in the city of Wuhan, China. This is how everything
started at the close of 2019. The novel Coronavirus started with officially reported 44
cases in January 2020, out of which 11 severely ill and remaining 33 in “stable condition”,
WHO (1, 2020, July 30).
Eight months later (as of end of July 2020) initially reported few cases in the China province
became the fastest spreading world-wide virus declared by WHO as a pandemic situation.
The latest numbers are as follows WHO (2020, July 30):
33,502,430 Total Cases (total cumulative count). The number include deaths, recovered
and discharged patients;
~2.9% reported deaths, calculated on the base of 1,004,421 deaths;
5,757,859 Currently infected, of which ~99% (5,691,295) defined as mid-condition and
~1% (66,564) as serious or critical cases;
~0.5% (83,959) of the cases are from China Mainland and ~99.5% (16,566,611) from
other countries. At this point of time the most impacted countries are as follows: United
States 26,63% (4,433,410), Brazil 14,69% (2,446,397), India 8.91% (1,484, 136), Russia
4,91% (818, 120), South Africa 2,72% (452,592);
Total Cured 10,226,484 (Includes recovered and Discharged);
Total Critical and Serious cases fluctuates between ~40,000(beginning of April) to
66,564 (end of July) which is the biggest absolute number since the beginning.
1 University of National and World Economy, 1700 Sofia, Student Town, UNWE, Bulgaria 2 University of National and World Economy, 1700 Sofia, Student Town, UNWE, Bulgaria
D

210
ITEMA 2020
Conference Proceedings
All these facts indicate a massive impact which goes beyond a single country or continent,
small, medium or big corporation, or a single industry. Pandemic affected not only private
companies and business owners but as well governments, non-profit organizations and people`s
lives.
It is no surprise that COVID-19 impacted every element in the macro-environment
map: Political, Economic, Social, Technological, Environmental and Legal (PESTEL).
Companies needed to change and adapt their operations, and the IT industry was not an
exception. Global players had maybe a benefit of having a world-wide footprint which enabled
them to be more flexible, but the local companies needed to act locally and be innovative in
order to survive.
Data analysis
So called Data Analytics 2.0 came in the mid-2000‘s when social network firms and internet-
based companies like eBay, Google and Facebook started to collect and analyze new and
extremely large volumes of data. The data was not only companies’ internal data, but it has
external sources as well e.g. sensors, internet, public data, audio and video.
With all this dramatic change, this phase raised the requirements for new more powerful tools
and the opportunity was used by some companies to materialize and profit it. New products,
skills, expertise and professions emerged out the new requirements and market. Hadoop,
NoSQL, Apache Spark and many other solutions were started to be developed. Terms like
Machine-learning and Artificial Inelegance started to form a real added value for the business.
In the 2.0 phase some very prominent observers have seen the beginning of the next phase (3,
Thomas H. Davenport, 2013) which is described with not only further development of the
products, service and features but when the large companies which are not just Internet and IT
Companies started to adopt above principles to create new products and services in their
industries.
From another angle, next to the three eras analytics can be defined by its type and capabilities:
1. Descriptive – “What happed?”
Descriptive analytics is used to describe and explain different relationships between
various sources usually within the existing big data bases.
2. Diagnostic – “Why did it happen?”
As the name dictates Diagnostic Analytics gives answer on “Why this happen” question.
It focuses on the root cause analysis investigating the sources, factors and causes of the
results.
3. Predictive – “What will happen?”
Predictive analytics focuses on solving problems coming from forecasting and trends
analysis. It gives answers and predicts future again based on sets of data and applying
metaethical models.
4. Prescriptive – “What should be done”
The logical sequence is prescription of the actions which needs to be taken in every
individual case after analyzing what and why happened. This part of data analytics steps
on the Predictive Analytics and uses very specific knowledge algorithms for every entity,
organization or company. It might consist of Artificial Intelligence (AI) or Machine
Learning algorithms or Data Driven Decision Making System. It usually provides

211
HOW DATA ANALYTICS HELPS MANAGEMENT IN GLOBAL PANDEMIC SITUATION
scenarios and based on the specific case it might be applied automatically or be suggested
to respective management function which needs to take decision and act.
In the current global pandemic situation, the use of Data Analytics can be vital for
organizations. Analytics can give quick answers to complex questions combining various, on
the first look not connected data sources which cannot be analyzed with conventional methods
and tools. It is also purely data driven, which means that in such unknown situations like the
COVID-19 pandemic it is driven mainly from facts and data leaving emotions and legacy aside.
The other main advantage is that Big Data analytics can combine various sources of large
unstructured data, combine and relate them providing trends and suggestions which might be
totally radical or illogical and which might give competitive advantage for the organization.
Management reaction
Economic impact was dramatic world-wide. After the pandemic spread, and the governments
started implementing measures and restrictions, the impact on business was inevitable. GDP
and economic forecasts collapsed all around. We have seen the majority of the biggest
economies in the world reporting forecasts for more than -3% drop (USA, Germany, France,
UK etc.). One of the biggest economic drivers like India and China report positive numbers
+1.2% and +1.9%, which compared to their usual growth seems like recession.
Figure 1. Q1 GDP
Source: 4, Lora Jones, Palumbo and Brown, 2020
Another major factor for the impact on the global economy is stock markets reactions. Figure
2 (4, Lora Jones, Palumbo and Brown 2020) shows how the three main stock indexes plunged.
Figure 2. The impact of COVID-19 on the Stock markets
Source: 4, Lora Jones, Palumbo and Brown 2020

212
ITEMA 2020
Conference Proceedings
In such situation, management is under high pressure not only from the economic implications
but as well from the social, political and technological factors. Revenue streams in many
industries declined dramatically e.g. “Communications Media and entertainment” and “Gas &
Oil”. Widely used as a marker Brent crude oil price dropped with more than 50% in the
beginning of the crisis (5, Maria Nicola et all, June 2020) or (6, Amadeo November 2020); in
the next months the price recovered with around 30% but it is still historically low, based on
the decreased demand and macroeconomic situation. Other sectors were completely blocked,
like “Travel & Transportation”. In this sector was reported dramatic decrease of 58%-78%
which measures international tourist arrivals (7, Borko 2020). One of the biggest carriers
Lufthansa and Air France/KLM reported year-over-year revenue slump of respectively 89%
and 82% (7, Borko 2020). Food industry and Grocery needed to take a move toward digital,
and supplying their goods to the front door of the customer. IT was challenged to provide quick
and scalable solutions to many companies, markets and industries which was not an easy task.
The management layer of the companies needed to cope with their own challenges and
problems and take quick decision based on limited information within quick timelines. In the
analysis below, we will focus on two main management topics: Business operations and
Human Resources management.
a. Operations management
The job of operations management (OM) consists of all the activities involved in transforming
a product components or activities into a finished product or services. In addition, operations
managers are involved in planning and controlling the systems that produce goods and services
(8, J. Skripak 2016).
The following study will look specifically into IT sector represented by the following global
companies: Alphabet, Cognizant, GoDaddy, Twitter, Zoom, DxC, IBM, HPE, HP Inc and
ServiceNow.
As per provided definition, Operations Management might be a very broad term overseeing
very wide range of activities; the study will focus on seven factors which clearly comes as
consequence after COVID-19, and which impacts companies operations: 1) “Remote work and
modified Schedules”, 2) “Customer Accommodation”, 3) “Health & Safety”, 4) “Supply chain
impacts”, 5) “Closed Stores and suspended services”, 6) “Community Services”, 7) “Layoffs”.
Below are listed the definitions provided by JustCaptal Global tracker (9, JustReport 2020):
1) “Remote work and modified Schedules” – Company is voluntarily shifting its
nonessential employees to a remote work or work-from-home arrangement in response
to the pandemic or are enacting alternative scheduling practices.
2) “Customer Accommodation” – Company is offering special accommodations to
customers. Drill down to explore whether companies are offering discounts or price cuts
to their customers, allowing customers to defer payment of goods and services,
continuing to provide essential utilities to customers who are unable to make payments
at this time, and/or providing services to vulnerable populations such as reserving the first
hour of shopping for high-risk customers.
3) “Health & Safety” – Company announced added health and safety measures during the
pandemic to protect workers and customers alike.
4) “Supply chain impact” – Company has announced information about impacts or
adjustments to its supply chain, including whether there have been job cuts, or the
company has made a commitment to maintain business.
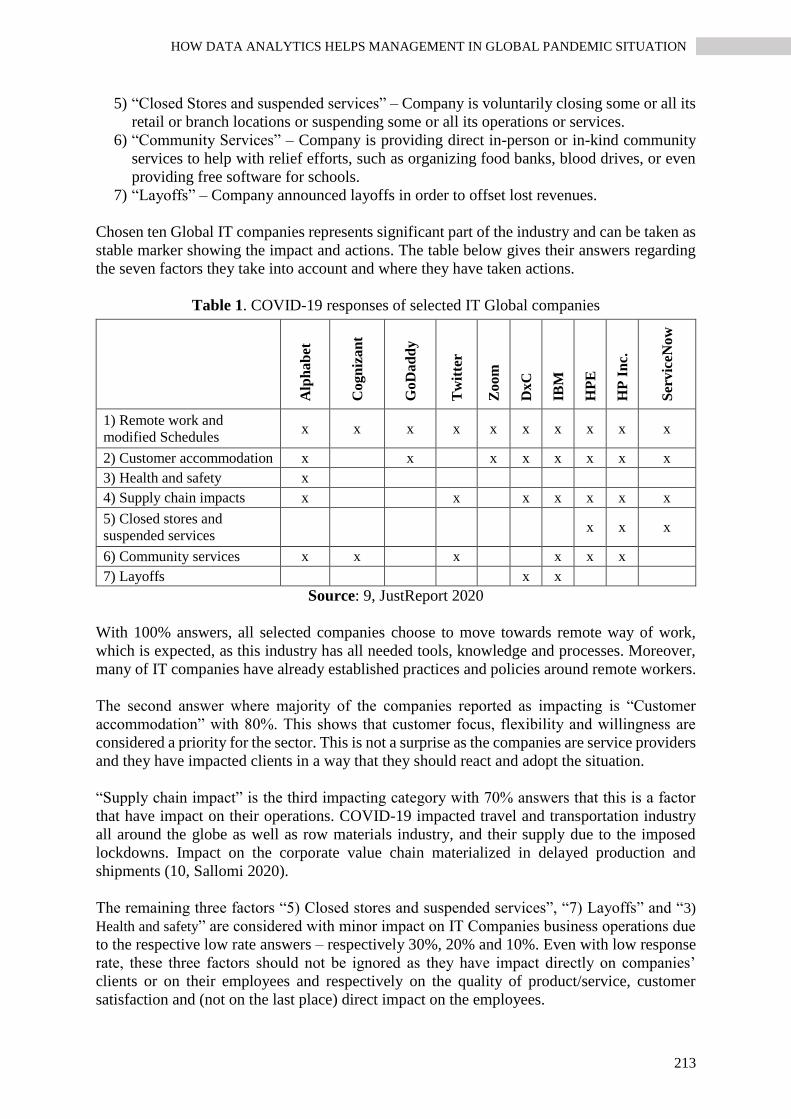
213
HOW DATA ANALYTICS HELPS MANAGEMENT IN GLOBAL PANDEMIC SITUATION
5) “Closed Stores and suspended services” – Company is voluntarily closing some or all its
retail or branch locations or suspending some or all its operations or services.
6) “Community Services” – Company is providing direct in-person or in-kind community
services to help with relief efforts, such as organizing food banks, blood drives, or even
providing free software for schools.
7) “Layoffs” – Company announced layoffs in order to offset lost revenues.
Chosen ten Global IT companies represents significant part of the industry and can be taken as
stable marker showing the impact and actions. The table below gives their answers regarding
the seven factors they take into account and where they have taken actions.
Table 1. COVID-19 responses of selected IT Global companies
Source: 9, JustReport 2020
With 100% answers, all selected companies choose to move towards remote way of work,
which is expected, as this industry has all needed tools, knowledge and processes. Moreover,
many of IT companies have already established practices and policies around remote workers.
The second answer where majority of the companies reported as impacting is “Customer
accommodation” with 80%. This shows that customer focus, flexibility and willingness are
considered a priority for the sector. This is not a surprise as the companies are service providers
and they have impacted clients in a way that they should react and adopt the situation.
“Supply chain impact” is the third impacting category with 70% answers that this is a factor
that have impact on their operations. COVID-19 impacted travel and transportation industry
all around the globe as well as row materials industry, and their supply due to the imposed
lockdowns. Impact on the corporate value chain materialized in delayed production and
shipments (10, Sallomi 2020).
The remaining three factors “5) Closed stores and suspended services”, “7) Layoffs” and “3)
Health and safety” are considered with minor impact on IT Companies business operations due
to the respective low rate answers – respectively 30%, 20% and 10%. Even with low response
rate, these three factors should not be ignored as they have impact directly on companies’
clients or on their employees and respectively on the quality of product/service, customer
satisfaction and (not on the last place) direct impact on the employees.
Alp
ha
bet
Co
gn
iza
nt
Go
Da
dd
y
Tw
itte
r
Zo
om
Dx
C
IBM
HP
E
HP
In
c.
Ser
vic
eNo
w
1) Remote work and
modified Schedules x x x x x x x x x x
2) Customer accommodation x x x x x x x x
3) Health and safety x
4) Supply chain impacts x x x x x x x
5) Closed stores and
suspended services x x x
6) Community services x x x x x x
7) Layoffs x x

214
ITEMA 2020
Conference Proceedings
The last factor which will be reviewed, and which has direct impact on every IT company
operations is “Business Continuity Planning” or BCP. Every global IT company need to have
BCP in place, it needs to be practiced and adopted / updated regularly, which ensures its smooth
and timely operations. Another angle is adopting company`s technology stack to the BCP,
which needs to be scalable and flexible enough to address the respective situation and needs
(10, Sallomi 2020). In global pandemic situation all of the included companies have
implemented stringent BCP strategies (9, JustReport 2020) which clearly helped them in the
quick reaction and proper answer.
b. Human Resources Management
Human resource management is one of the key pillars in companies strategic and overall
management. This is even more valid for IT companies, no matter if they are small Software
Development houses with 10-100 employees, medium size companies who has couple of
thousands or big global players having from tens thousands to more than one hundred thousand
employees. Human capital is a key for companies’ success and so-called total cost of workforce
or TCOW accounts for big part of their cost structure. COVID-19 put extreme pressure on the
people around the globe, which affected how business operates and approaches their human
resources. HR processes and procedures needed to be adopted to the “new reality” which
impacted their productivity, efficiency, motivation and engagement.
In the literature there are different HR management models (11, Armstrong and Tailor 2020).
Beer et al (12, Beer at al 1984) structured framework which is now known as ‘Harvard
framework’ where HRM ‘involves all management decision and actions that affect the nature
of the relationship between the organization and employees’. There are two characteristics: 1)
Direct managers are responsible and they ensure alignment between company strategy and HR
policies, and 2) HR sets the policies and model how HR activities are developed and
implemented.
There is as well ‘5-P model’ (13, Schuler 1992) where the author describes five topics where
HRM operates: 1) HP philosophy, 2) HR Policies, 3) HR Programs, 4) HR Practices and 5) HR
Processes.
The third model which we will review is so called ‘European Model’ (14, Brewster and Larsen
1992), which has the following logic: 1) Environment, 2) Objectives, 3) Focus, 4) Relationship
with employees, 5) relationship with direct managers and 6) Role of HR.
It can be summarized by the reviewed models that there are two main drivers that play key
roles in HRM, especially in the pandemic situation:
1. HR Processes & Policies,
2. Role of Direct Managers.
Relating back to the study shown in table 1, it is clear that all examined companies modified
their work processes and policies moving towards ‘work from home’ or ‘flexible models’. This
is not an easy task as every country has its own legal framework and required process and
policies adoption from HR departments. Then the implementation passed though leadership
and direct management that needs to communicate, implement, execute and monitor how this
affects their employees in all aspects as: efficiency, motivation, engagement and so on. The
other main factor which affects HRM is “Supply chain” effects which 70% of the companies
think it was impacted. Here there are different factors starting from un-availability to deliver

215
HOW DATA ANALYTICS HELPS MANAGEMENT IN GLOBAL PANDEMIC SITUATION
the services / products, issues with performing their daily tasks and facing direct problems
related to the clients.
At the beginning of the pandemic, companies took fast decisions without knowing how this
will impact their operations and results, and during the course of the year they all started to
analyze different data to see how these actions actually affect them. In his paper Paulo et al
[15] shows how COVID-19 impacts outcome for software developers:
Figure 3. Summary of the survey results on the impact of COVID-19 on task
completion time, productivity, and quality of the work
Source: 15, Paolo Anselmo et al, August 2020
This leads to an important conclusion that flexible work schedule and work from home don’t
impact their quality of work and productivity. The summarized result of the survey (Paolo
Anselmo et al, August 2020) is shown in figure 4.
Figure 4. COVID-19 impact on software developers
Source: 15, Paolo Anselmo et al, August 2020

216
ITEMA 2020
Conference Proceedings
Conclusion
Based on the above study, we can conclude that Corporate Management, as well as Human
Resource Management, reacted fast and unedified to the global pandemic. They joined their
forces and acted with great flexibility by:
- Adopting processes,
- Changing HR policies,
- Modifying their approach to Customers,
- Raised the level of safety,
- Adopting their value and supply chains.
The companies who focused on these factors stayed and became even more relevant for their
clients and were able to increase customer and employee satisfaction. That is why the next
steps will be bringing: 1) Measuring, 2) Analyze, 3) Change, 4) Adopt, and 5) Maintain of the
newly implemented practices and processes, where actually data analytics will come to play.
All of these factors can be monitored and analyzed no matter of the size of the company and
its industry. However, Global IT companies have strategic advantages as: Infrastructure
(Software and Hardware), Skill-full employees, Data Driven culture, which gives them fly-
start and moreover position them better compared to the other industries where processes are
slow, where companies don`t have the needed infrastructure and the employees are not keen
into digitalization. We believe that analytical approach and data driven approach into handling
situations like COVID-19 global pandemic will rise the bar and will push the companies more
towards digitalization and automation, as it gives enormous level of flexibility and adoptability
as well as quick resolution to problems which they have never faced before.
References
[1] WHO publishes interactive timeline of its response. July 2020. Rolling updates on
coronavirus disease (COVID-19). Retrieved from
https://www.who.int/emergencies/diseases/novel-coronavirus-2019/events-as-they-
happen
[2] World Health organization web site statistics. Retrieved from
https://www.who.int/news/item/29-06-2020-covidtimeline
[3] Thomas H. Davenport. 2013. “Analytics 3.0”, Harvard business review 2013. Retrieved
from https://hbr.org/2013/12/analytics-30
[4] Lora Jones, Daniele Palumbo and David Brown Coronavirus, “A visual guide to the
economic impact”. BBC June 2020. Retrieved from
https://www.bbc.com/news/business-51706225
[5] Maria Nicola, Zaid Alsafi, Catrin Sohrabi, Ahmed Kerwan, Ahmed Al-Jabir, Christos
Iosifidis, Maliha Agha, and Riaz Aghaf, “The socio-economic implications of the
coronavirus pandemic (COVID-19): A review”. June 2020. Retrieved from
https://www.ncbi.nlm.nih.gov/pmc/articles/PMC7162753/
[6] KIMBERLY AMADEO, “Oil Price History—Highs and Lows Since 1970”. November
2020. Retrieved from https://www.thebalance.com/oil-price-history-3306200
[7] Seth Borko, Wouter Greets, Haixia Wang, “The travel industry turned upside down:
Insights, analysis, and actions for travel executives”. September 2020. Retrieved from
https://www.mckinsey.com/industries/travel-logistics-and-infrastructure/our-
insights/the-travel-industry-turned-upside-down-insights-analysis-and-actions-for-
travel-executives

217
HOW DATA ANALYTICS HELPS MANAGEMENT IN GLOBAL PANDEMIC SITUATION
[8] Stephen J. Skripak, Richard Parsons, Anastasia Cortes, Anita Walz, “Operations
Management”. Pamplin College of Business and Virginia Tech Libraries. July 2016 p.12-
13
[9] JustReport. “The COVID-19 Corporate Response Tracker”. JustCapital, November 2020.
Retrieved from https://justcapital.com/reports/the-covid-19-corporate-response-tracker-
how-americas-largest-employers-are-treating-stakeholders-amid-the-coronavirus-
crisis/#methodology
[10] Paul Sallomi, “Understanding the impact of COVID-19 Technology Sector”. Deloitte,
April 2020. Retrieved from https://www2.deloitte.com/global/en/pages/about-
deloitte/articles/the-heart-of-resilient-leadership.html
[11] Michael Armstrong and Stephen Taylor, “Armstrong`s Handbook of Human Resources
Management Practice”, 15th edition, Kogan Page 2020 pp.10-14
[12] Michael Beer, Bert Spector, Paul R. Lawrence, D. Quinn Mills, Richard E. Walton,
“Managing Human Assets”. The free press, November 1984
[13] Schuler, R.S., Strategic Human Resource Management: “Linking People with the Needs
of Business. Organizational Dynamics”, 1992 pp.18-32
[14] Brewster, C., & Larsen, H. H., “Human resource management in Europe”: evidence from
ten countries”, International Journal of Human Resource Management, 1992 409−434
[15] Paulo Anselmo da Mota Silveira Neto, Umme Ayda Mannan, Eduardo Santana de
Almeida, Nachiappan Nagappan, David Lo, Pavneet Singh Kochhar, Cuiyun Gao,
Iftekhar Ahmed, “A Deep Dive on the Impact of COVID-19 in Software Development”,
Aug. 2020


219
PURCHASING BUSINESS IN THE CONDITIONS OF THE PANDEMIC
CRISIS
Sandra Mrvica Mađarac1
Zvonimir Filipović2
Marko Eljuga3
DOI: https://doi.org/10.31410/ITEMA.2020.219
Abstract: Procurement is a function of the company that cares of everything about that is
necessary for the realization of the goals of the business system and in particular it is very
important for the successful operation of a trade company. Procurement is a function of the
company and other business structures whose task is to supply the equipment, materials,
services, products and energy needed to achieve goals of the business system. By pursuing the
economic order quantities, decisions on expenditures and selection of the best suppliers we
contribute to the business success. On the global level, companies are facing the impact
and consequences of the COVID 19 pandemic, which also affects companies purchasing
processes. In the paper are presented and analysed changes in the organization and functions
of the purchasing business activities of the two companies as a consequence of the pandemic
crisis.
Keywords: Purchasing business, Pandemic crisis, Supply, Organization, Company.
INTRODUCTION
he pandemic crisis has brought completely new and until now, unprecedented and
unknown circumstances not only for all of us who participate in social life as individuals
but also for all the participants in business processes who have faced a series of
challenges they have not encountered so far. Restrictive measures brought by states to protect
their population from infection have caused many difficulties when carrying out daily
activities. Due to the COVID-19 pandemic, it is necessary to adapt social and economic life to
the new conditions. Companies that are engaged in sales due to the reduction of social contacts
and measures brought by the Civil Protection Headquarters of the Republic of Croatia had to
change their business organization. On 24th April 2020, the Civil Protection Headquarters of
the Republic of Croatia has issued a Decision stipulating the working hours and the way of
work in the trade activity during the Coronavirus epidemic; all stores and all sales facilities
were obliged to organize their work in compliance with the general anti-epidemic measures
and special recommendations and instructions brought by the Croatian Institute of Public
Health (Koronavirus, 15.06.2020). On 19th March 2020, the Civil Protection Headquarters of
the Republic of Croatia has issued a Decision on measures to restrict social gatherings, work
in trade, services and sporting and cultural events (Official Gazette, 32/2020), therefore
suspending working of all shops except those listed in the decision.
1 College of Applied Sciences “Lavoslav Ružička” in Vukovar, Županijska 50, Vukovar, Croatia 2 PIK Vrbovec plus d.o.o., Gospodarska zona 20, Antunovac, Croatia 3 Agro – Honor d.o.o., Vrbaska 1c, Osijek, Croatia
T

220
ITEMA 2020
Conference Proceedings
Procurement is a major part of the organizational and business process of any trading
company. The paper presents the changes in the supply business in two trading companies
during the course of the pandemic: one is engaged in the production and sale of food products,
and the other in the sale of agricultural machinery.
PROCUREMENT AS A FUNCTION OF TRADING COMPANY
Procurement is function and activity of the company and other operating systems, which takes
care of supplies, materials, equipment, services and energy that are necessary for the realization
of the objectives of the business system. As an activity, it is extremely complex and important
for the success of the company's business (Ferišak, 2006). Procurement tasks are: - connecting companies with the market, - procurement of means for production and its services in line with the production plan, - organizing the process of circulating funds in reproduction, - organizing work processes that ensure carrying out of individual procurements and the
circulation of means of production in the previous phase of the production cycle (Karpati,
1975). By procurement in the narrower sense of the word is meant primarily running of
operational activities in the process of acquiring the items of procurement. These are jobs
that need to be performed on a daily basis in order to timely realize the defined needs and
supply requirements of the business system for procurement facilities of appropriate
quality, in the required quantity, at reasonable prices, with respect to deadlines, at a
specific place and with the appropriate service. Operational functional procurement
activities are as follows: examination and consolidation of procurement requests obtained
from the preparation of work, development, warehouses, laboratories and other
organizational units, observation and monitoring of the procurement market, making and
setting inquiries to suppliers, receiving, examination and evaluation of suppliers'
offers, negotiating with suppliers, selection of the most favourable offer and
ordering, monitoring delivery deadlines and coordination of all direct connections with
the suppliers, receiving and examination of the shipment, control of supplier's
accounts, complaints due to inadequate fulfillment of the supplier’s obligations, running
records / files of procurement (Ferišak, 2002).
Procurement in a broader sense of the word encompasses strategic tasks on which depends the
effect and profits of the business system. The tasks of procurement in a broader sense are to
prepare the best possible use of procurement market opportunities, to positively influence to
the production consumption and sales by defining types, forms of input structure when using
the potential of suppliers and taking into account environmental protection, in order to better
meet consumer demands, and to maximize the effects and profits of the business system
(Ferišak, 2002). Marketing procurement significantly differs from the classic procurement
system because here it does not run a typical "supplier-procurement" relationship, which is
when the supplier motivates the customer to purchase certain goods or services, but the supplier
and procurement party establish partnerships and thus facilitate the flow of procurement, that
is, they realize short-term and long-term procurement tasks more efficiently and cost-
effectively (Ružić, 2002). The organizational structure of procurement deals with human and
other resources, and refers to (Ferišak, 2002, 317): division of tasks and procurement
function, system of managerial and executive jobs and relations between them, system of
obligations and authorities, system of work places responsibilities and system of
communication between work places. When organizing procurement, it is necessary to adhere
to certain principles, because non-compliance with them may bring many difficulties in
business. These principles are: equal and fair division of labour among the employees,

221
PURCHASING BUSINESS IN THE CONDITIONS OF THE PANDEMIC CRISIS
specialization of jobs within the service itself, standardization of goods procured, solutions to
the problem of centralization-decentralization, principles of cooperation when doing business
and proper assignment of authority and responsibility when performing affairs (Karpati, 1975,
p. 42). By choosing the optimal form of organizational structure, it can be influenced on the
business and business results of the company (Krpan et al., 2015). The very process of
procurement is carried out in the following order (Peričić, Kozina, 2001): initiating the process
of procurement, additional analysis of requirements for procurement and its approval, selection
of the supplier and sending a request, invitation to tender, the selection of suppliers and sending
orders and verification of goods from the suppliers. The procurement process is important for
(Purchase Control, 2020): efficient purchasing process (not only intended for direct
consumption), successful supplier relationship management, optimal supply chain
management, rationalization of all stages of the procurement process, establishment of the
management models of the business process.
EXAMPLES OF BUSINESS PRACTICES OF PURCHASING ORGANIZATION
DURING A PANDEMIC CRISIS Company X is a recognizable brand and market leader in Croatia in the production and sale of
meat products, and its products are exported to foreign markets, with exports accounting for
10% of total annual sales. Since it is a manufacturing company that cannot perform its basic
function of production without adequate supply of the raw materials, it is clear that the
purchasing function is one of the most important functions of the company. Production results
in the creation of added value, and in order for this added value to be competitive on the open
market, it is necessary to ensure through the procurement function the highest quality of the
raw material at the most competitive purchase price.
At the head of the company's procurement function is the procurement director who directly
manages the procurement function and, according to the business organization, comes
immediately below the company's director. The purchasing function of a company is
roughly divided into two parts depending on the type of product being procured. The first
group includes the procurement of raw materials that are directly necessary for the production
process. The second group includes the procurement of everything else necessary for the
smooth running of business processes in the company such as fixed assets, small inventory,
etc. The procurement director manages the team of procurement managers for
certain procurement groups, so the company has a procurement manager who cares for the
purchasing of the raw materials and also the procurement manager who covers other group of
procurements. In the procurement office they also have the procurement referents, which in
coordination with their superior managers perform all the current activities related to the
purchasing. It can be said that under normal circumstances before the pandemic, the
procurement function took place almost routinely in accordance to the previously established
schedules of activities. At the annual level, most of the procurement of key or basic raw
materials necessary for the production is agreed upon. As this is the food industry, it is
extremely important that the raw material for production is of exceptional quality and
freshness, which in itself suggests that the preference is given to the domestic suppliers, i.e. the
partners in the procurement process. The production process requires a certain time until the
release of the finished product, so there is a need to conclude supply contracts for a longer
period of time for at least a year, so that production can be planned in advance and proceed
according to set plans and without production standstill. The aim of procurement is to supply
raw materials of appropriate quality at the most competitive purchase price so that the final
product itself will be as competitive as possible on the demanding domestic and foreign

222
ITEMA 2020
Conference Proceedings
markets. Together with the coordination between the procurement director, procurement
manager and procurement officers, the procurement itself is agreed and the course of the
procurement process is controlled, depending on the scope of responsibilities of each level of
employees working on the procurement service. The products that the company sells on the
market have a seasonal character, which also directly affects the procurement
function. The biggest support for the procurement of raw materials is provided by the domestic
suppliers, but due to the increase in seasonal demand for certain groups of products it is
impossible to meet the market demands without the procurement of raw materials from
other countries - mostly often from the European Union. The food industry, even in normal
circumstances, requires quick reactions and adjustments to market trends and needs, which
requires exceptional flexibility from employees working in procurement and readiness to
immediately address the challenges that have arisen before them.
A company that is engaged in the production of basic food products in the conditions of
a pandemic crisis has found itself in great challenges. The population under the influence of
psychosis that was caused by the set of limitations began to react irrationally; the panic caused
an increase in demand for the Company X’s products and there was a rapid decline of finished
goods in stock. All of these new circumstances put before the procurement service tasks that
had not been encountered so far. The company at a given time should provide enough products
to supply the increased market demands, and at the same time the procurement should provide
enough raw materials for the uninterrupted production. The employees who are not necessary
present in the production process or who do not work directly in production are redirected to
work from home through modern technologies that enable them to use mobile
communications. The complete procurement service personnel were relocated to work from
home in the present circumstances. Regardless of the work from home, the service had to react
promptly and provide the allowed quantities of the necessary raw materials. The pandemic has
caused numerous imbalances in the supply and demand for primarily food products, which has
resulted in an uncontrolled rise of the prices of both final products and the raw materials that
were needed for its production. Coordination with all other services in the company has moved
to the virtual world through video links and similar advanced tools, but also communication
with the suppliers has taken place by means of virtual meetings. Prior to the procurement, new
tasks were set which comprehended the procurement of a sufficient amount of raw materials,
regardless of the procurement price. It was in such crisis that the conditions were characterized
by the increased in demand when all the shortcomings of our business environment had come
to light. The domestic raw material base proved insufficient to meet the increased needs of the
producers that were demanded by the market. Restrictions that were in force during the first
wave of the pandemic with regards to the movement of goods and people in interstate
traffic made it even more difficult to procure the raw materials from other countries. When
working from home for all the procurement staff was required a much greater commitment to
be able to complete all the necessary procurement processes than has occurred during normal
times before the pandemic. The procurement has proven to be crucial for the company's
survival on the market and for keeping the jobs for all of employees.
Company Y is specialized in retail and wholesale and service of small agricultural machines
such as motor cultivators, chainsaws, lawn mowers, motor mowers (trimmers), water pumps,
aggregates and other small machines. The procurement business of company Y is organized in
such a way that the procurement of certain devices and spare parts takes place on a daily
basis. As the company has organized both retail and wholesale, and since a relatively large
number of customers regularly order and buy products, purchasing business must always be up
to date. In the period before the pandemic crisis, the procurement business was organized in

223
PURCHASING BUSINESS IN THE CONDITIONS OF THE PANDEMIC CRISIS
such a way that employees regularly collected orders from customers for the needs of service
for their devices or to obtain the spare parts, which would be then forwarded to their
warehouses to separate the items and to send them back to the company. Company Y orders a
large amount of parts of devices and spare parts from companies operating within the Republic
of Croatia, but it also orders and imports some goods directly from other countries, such as
Germany, Italy, Serbia, Austria and other countries. Before the crisis, business with companies
from the other countries has taken place without any problems, as well as business within the
Republic of Croatia. The difference was exclusively in the duration of the time period spent for
the delivery of the ordered goods. The crisis that began in March of this year has drastically
changed the business of the company itself and businesses of all other companies with which
the company cooperates. Namely, no one was prepared for what the crisis had caused. First of
all, the delivery of ordered devices and spare parts and everything else started to be delayed,
and apart from the fact that the delivery period has increased, an even bigger problem was that
some deliveries were questionable and whether they would be realized at all. How the
carriers were limited at the very beginning of the crisis to move to other countries, and the crisis
itself has taken a big swing in the single countries (such as the case of Italy) - for the goods
which have been ordered from those countries were put a lot of question marks (here,
referring both to the production and distribution). Under these conditions, company Y had to
change its current way of doing business and to adapt to the new situation. The first decision
the company has made was to increase the stock of both the devices and the spare parts. Of
course, this decision also had some negative consequences, because large stocks also result in
the engagement of a more financial resources; it didn't do well in the crisis, but it was simply
necessary to try to adjust the business. The second decision that has been taken - that it was
necessary to clearly communicate this new way of doing business with the customers and
service users. Namely, everyone needed to be explained why did exist a longer period of time
for the delivery of devices from the service, but also for the delivery of spare parts and
individual devices from the stores. Of course, this also had negative consequences, because it
is understandable that some users did not show understanding, so in that case they gave up
services. But since other companies had similar problems, finally there were not too many of
discontented users. For the most part, customers and service users had an understanding and
had remained loyal and they continued to buy items from the company Y. In addition to this,
the company made several other adjustments in its business, all with the aim of realizing as
much work as possible, and for them doing business and surviving on the market would not be
put into question. At one point the crisis was showing signs of weakening and we all hoped it
was about to end. Business began to return to normal and all the imposed measures slowly
began to be abolished. So, business and movement of goods were allowed again to circulate as
it was before the crisis. Unfortunately, again the situation has started to show up some negative
trends related to the COVID 19 crisis. Yet again, there are introduced some limitations
measures, but this time not as rigorous and businesses are more or less normally taking
place, but again including a longer time interval. Uncertainty about how long this crisis will
last has resulted for the company to focus exclusively on procuring those materials needed
during this period, and is not willing to take any additional risks for the reason that no one can
predict what tomorrow will bring. Purchasing business has normalized as much as possible,
having larger stocks than before, but also, they offer narrower assortment. The company's goal
is to provide its customers and service users with everything they need, to try to follow the
trends, but the introduction and procurement of some new things has been currently put on
hold.
224
ITEMA 2020
Conference Proceedings
CONCLUSION
The COVID 19 pandemic crisis has been present for a long time and is causing great problems
not only for economic entities, but also for all other activities. The consequences of the crisis,
which is still going on day by day, are evident in the business operations of almost all
companies. In these conditions, companies must find their way to organize their businesses as
better as possible.
The main goal of the procurement business should be that procurement contributes as much as
possible to the success of the company's business, and this can be achieved by using economies
of scale and when choosing the right suppliers. Procurement tasks are to acquire materials and
services of functionally appropriate quality, at the best price, in economical quantity, at the
right time, from the most favourable sources, with high delivery service, when achieving the
greatest possible protection of the environment and natural resources, with the least risks, with
the lowest costs and with the good relationships with the suppliers. The procurement function
in the company itself is extremely complex process even in the normal business conditions, and
only in conditions such as the present pandemic crisis does the true importance of procurement
in the organizational structure of each company come to light. The crisis has shown how
extremely important it is to have a well-organized procurement service that will be able to
perform all the tasks set before it even in difficult conditions, by the company's
management. Developing partnerships with suppliers are needed that are not based on
cooperation for only one delivery, but based on ongoing cooperation in which all participants
in the supply process will be satisfied with the agreement that has proved to be crucial in time
of the onset of the global pandemic crisis. It can be concluded that there is not much difference
between procurement under normal circumstances and procurement during
a pandemic crisis. Procurement is here to meet the needs of the company for the raw materials
and other necessary resources that are necessary for business; it is only a question of how and
with what employee engagement this can be achieved to be the most optimal solution for the
company.
REFERENCES
Ferišak, V. (2006). Procurement - policy - strategy - organization – management. II updated
edition, Zagreb, Croatia: Author’s own edition. Karpati, T. (1975). Procurement in the associated labour production organization, Osijek,
Croatia: NIP Press.
Koronavirus, https://www.koronavirus.hr/odluka-o-radnom-vremenu-i-nacinu-rada-u-
djelatnosti-trgovine-za-vrijeme-trajanja-epidemije-koronavirusa/510, retrieved 19 June,
2020. Krpan, Lj., Varga, D. Maršanić, R. (2015). Organizational structure of procurement business
process. Technical Gazette, Vol. 9, No. 3, 327-336.
Official Gazette, 32/2020, Decision on measures restricting social gatherings, work in trade,
service activities and holding sports and cultural events.
Peričić, G., Kozina, G. (2011). Significance of logistics procurement process in business
system. Technical Gazette, Vol.5 No.1, 134-138. Purchase Control, https://www.purchasecontrol.com/uk/blog/purchasing-process/, retrieved
27. September, 2020. Ružić, D., Tomičić, Z. Turkalj, Ž. (2002). Exchange Relationships in Marketing. Osijek,
Croatia: Faculty of Economics in Osijek.

225
THE NECESSITY OF PSYCHOHYGIENE IN THE WORK OF
TRADERS
Zuzana Birknerová1
Dagmara Ratnayake Kaščáková2
DOI: https://doi.org/10.31410/ITEMA.2020.225
Abstract: The rapid economic growth of many companies brings with it the need to pay more
attention to issues of management and leadership of people in the conditions of a centralized
model of economic management, as well as mental readiness for work and social position in
business. Mental balance is one of the most important mental equipment of traders in personal
and professional life. Therefore, in the article we assess the necessity of psychohygiene in the
work of traders. Its role is to support and create favorable psychological conditions. The aim
of the research is to determine the existence of statistically significant differences in the
assessment of the attributes of psychohygiene between customers and traders. The research
sample, out of the total number of 177 respondents, consists of 125 (70.6%) women and 52
(29.4%) men aged 18 - 70 years, while the average age is 41.08 years, the standard deviation
is 7.913 years. Of the total number of respondents, 97 (54.8%) were traders and 80 (45.2%)
were customers. The length of the respondents' internship ranged from 1 to 40 years (average
17.25 years, standard deviation 8.679 years). The research results were processed in statistical
program IBM SPSS Statistics 22.00 and assessed by t- test for two independent samples. The
authors focused on mental health care, proper lifestyle, stressors, work environment and time
management.
Keywords: Attributes, Psychohygiene, Traders.
INTRODUCTION
he term psychohygiene is the equivalent of the terms mental, psychological and mental
hygiene. It is a system of scientifically elaborated rules and councils used to maintain,
deepen or regain mental health, mental balance (Míček, 1986). It has very close relations
to psychotherapy (Ďurdiak, 2001). According to Szarková (2016), psychohygiene is a
department of work psychology, which studies the possibilities and ways of adjustment or
changes in living (thus also working) conditions of a person in relation to the creation and
stabilization of his positive feelings and positive philosophy of life. Bedrnová et al. (2009;
2012) argues that it is an interdisciplinary subject covering the practical issues of our lives with
a focus on maintaining physical and mental health, despite the adverse effects of many sub-
stimuli and situations. It is such an adjustment of a person´s living conditions that would evoke
in him a feeling of satisfaction, personal happiness, physical and mental fitness and
performance (Bartko, 1990).
Mental hygiene focuses on the possibilities of self-regulation of the individual, acting on
oneself and on the active transformation of one's environment (the focus is on self-education,
mental regulation, hygiene of thinking, ideas, attention, etc.). It deals with the problems of
1 University of Presov Faculty of Management, Konštantínova 16, 080 01 Prešov, Slovakia 2 University of Presov Faculty of Management, Konštantínova 16, 080 01 Prešov, Slovakia
T

226
ITEMA 2020
Conference Proceedings
adaptation and mild cases of human maladaptation, i.e. mild mental disorders. It focuses mainly
on prevention, dealing with the issue of strengthening mental health (Míček, 1986).
Psychohygiene seeks to examine and ensure optimal mental health conditions and prevent the
development of mental disorders (Kondáš, 1985).
Mental health is a desirable condition that results from conscious or unconscious adherence to
the principles of psychohygiene (Ďurdiak, 2001). It is a state in which all mental processes take
place optimally, correctly reflect the external reality, while the appropriate solution of tasks is
accompanied by a feeling of satisfaction (Kondáš, 1985). A person is mentally healthy if he is
reasonably satisfied with himself if he has good relations with others, and if he is able to solve
the everyday problems that life brings (Melgosa, 1998).
RESEARCH PROBLEM
At present, the business environment is increasingly convinced that the application of
psychological sciences is not only beneficial for its development and comprehensive profit, but
also increasingly necessary, both in terms of meeting economic and marketing goals. Traders
are required to synergistically combine theoretical and practical knowledge and experience of
applied psychological disciplines with theoretical knowledge and approaches to the theory of
economics and marketing (Szarková, 2016). The author states that psychohygiene is a field of
work psychology that studies the possibilities and ways of adjustment, living and working
conditions of an individual, which are related to the creation and stabilization of one’s positive
feelings and positive philosophy of life. It focuses on identifying those factors that condition
or influence the state of mental health in traders, which is given by a set of the following
feelings. They are a feeling of satisfaction, a feeling of usefulness, a feeling of success, a feeling
of mental and physical fitness, a feeling of personal happiness, a feeling of inner harmony. The
degree of satisfaction of coping with the stress elements of work is an important component of
overall life satisfaction (Kollárik, 2011).
Fatigue is a natural consequence of every job. It arises as a result of effort and is one of the
main factors that affect the performance of traders. It manifests itself in mental and
physiological changes in the sensory, emotional, mental, motor and mental processes.
Depending on which functions or organs it affects, we distinguish between muscle, sensory,
nervous and mental fatigue (Provazník et al., 2002). Feeling tired is subjective and has a
protective function because it allows a person to register the symptoms of simple acute fatigue,
which can develop into chronic fatigue.
Maladaptive mental states (mental stress, stress and frustration) arise in trade as a result of
external and internal conflict situations, which the trader feels as unmanageable. They are the
result of a disruption of one’s adaptive abilities and a signal of a disturbance of one’s mental
balance. They can influence him negatively or positively, and it depends on his mental state,
mental resistance to stress, temperament and personality, assertive and self-assertive abilities,
and one’s life philosophy or positive thinking. They can be managed by will mechanisms,
autoregulatory personality system and autosuggestion, without drug treatment (Szarková,
2018). One of the possibilities of coping is psychohygiene as a guide, which needs not only to
know, but also to respect and not separate theory from practice (Míček, 1986). It is needed and
touches on many aspects of the trader's daily life. It is enough to follow psychohygienic
principles and invest in reason and better interpersonal relationships (Bartko, 1990).

227
THE NECESSITY OF PSYCHOHYGIENE IN THE WORK OF TRADERS
METHODS AND DATA ANALYSIS
The aim of the research is to identify statistically significant differences in the assessment of
psychohygiene attributes in business. We focused on mental health care, proper lifestyle,
stressors, work environment and time management. Based on the stated goal of the research,
we set the hypothesis: "We assume that there are statistically significant differences in the
assessment of selected attributes of psychohygiene between traders and customers."
In order to collect data and information, we opted for a questionnaire focused on
psychohygiene. It pays attention to attributes such as lifestyle, relaxation, rest, time
management and work environment. It contains 20 items focused on psychohygiene, for which
the respondents express the degree of their consent, resp. disagreement on a 7-point scale (1 -
strongly disagree, 7 - strongly agree).
The information obtained from the respondents was processed and analyzed at the level of
descriptive statistics (frequency of occurrence, arithmetic mean, standard deviation) and
inductive statistics (difference analysis: t-test for two independent samples) in the statistical
program IBM SPSS Statistics 22.00.
The research sample, out of the total number of 177 respondents, consists of 125 (70.6%)
women and 52 (29.4%) men aged 18 - 70 years, while the average age is 41.08 years, the
standard deviation is 7.913 years. Of the total number of respondents, 97 (54.8%) were
merchants and 80 (45.2%) were customers. The length of the respondents' internship ranged
from 1 to 40 years (average 17.25 years, standard deviation 8.679 years).
RESULTS AND DISCUSSION
In order to verify the established hypothesis, we performed statistical analyzes in the statistical
program SPSS22. We focused on identifying statistically significant differences in the
assessment of psychohygiene attributes in business. The results of the analysis to verify the
hypothesis: "We assume that there are statistically significant differences in the assessment of
selected attributes of psychohygiene between traders and customers" is described in Table 1.
Table 1. Analysis of Differences in Selected Attributes of Psychohygiene in Business
Psychohygiene Position in
organisation Average Test criterion t Significance
I am interested in mental health care. trader 5.81
1.902 .040 customer 5.03
In business, it is important to regularly
observe psychohygiene.
trader 6.04 2.144 .033
customer 5.31
I often feel that I am in a time crunch,
I lack time management.
trader 5.96 1.909 .028
customer 4.30
I often do not follow a proper lifestyle
during work.
trader 5.29 4.061 .000
customer 4.25
I also deal with my work duties outside of
working hours and premises.
trader 5.06 3.841 .000
customer 3.89
I have the opportunity to adjust my work
environment so that I feel good in it.
trader 5.66 2.301 .023
customer 4.41
Source: Own processing
The results of our research also tell us that the job of a salesperson is not only a job, but also a
mission. We found statistically significant differences between traders and customers, where

228
ITEMA 2020
Conference Proceedings
traders scored higher in selected attributes of psychohygiene (mental health care, proper
lifestyle, work responsibilities, environment and time management).
We found that salespeople pay attention to their work duties also outside working hours and
outside working spaces more often, as they scored higher in these attributes compared to the
addressed customers. Based on the results presented above, we can say that traders are more
interested in the issue of psychohygiene, despite the fact that they admitted that they often do
not follow a proper lifestyle during their work. They were also much more inclined to agree
with the possibility that they could adjust their work environment to feel good in it. They often
feel a time constraint in their work and are therefore more aware of the importance of regular
psychohygiene and mental health care.
Based on the above analyzes, we can state that the hypothesis: "We assume that there are
statistically significant differences in the assessment of selected attributes of psychohygiene
between traders and customers" was confirmed.
As part of identifying statistically significant differences in the examined aspects, we recorded
several statistically significant differences, with traders always scoring higher. They also take
care of their work responsibilities outside working hours and outside working spaces, adjusting
their work environment so that they feel good in it. However, they often feel a time constraint
in their work and are therefore more aware of the importance of regular observance of
psychohygiene.
CONCLUSION
Traders are faced with complex tasks and are required to solve complex issues, so the right
mental balance is one of the basic elements for achieving a successful business result. It is
therefore necessary to integrate psychohygiene into their work and personal life and at the same
time to increase interest in it. Various professional magazines for traders, various professional
studies that are available on the Internet, or educational programs are also beneficial sources.
There are many companies that provide personnel and psychological counseling services in the
form of business-oriented seminars, education and training courses. Since theoretical education
and possible training in teaching is not enough, it is necessary to apply the acquired knowledge
directly into practice as soon as possible and to create suitable conditions for this. In larger and
financially stronger companies, there are opportunities to use the results of analyzes found by
external consulting firms and to have psycho-hygienic principles and good habits developed
and implemented into the work regime.
After acquiring theoretical and practical skills in this area, it is important to return to the
beginning, to the family, and to transfer new good habits to it, which would become the right
stereotype, the starting point for the future and serve to set the right priorities in life (Freidl ,
2004; Holdau, 1999; Rantanen, et al., 2004; Rothmann, Rothmann, 2006; Ryff, 1989; Smith,
2008).
ACKNOWLEDGEMENT
This research was funded by the grant project KEGA No. 012PU-4/2020 “Trading Behavior –
Creation of the subject and textbook for non-economic study programs” from The Ministry of
Education, Science, Research and Sport of the Slovak Republic.

229
THE NECESSITY OF PSYCHOHYGIENE IN THE WORK OF TRADERS
REFERENCES
Bartko, D. (1990). Moderná psychohygiena. Bratislava: Obzor.
Bedrnová, E. et al. (2009). Management=osobního rozvoje: Duševní hygiena, sebeřízení a
efektivní životní styl. Praha: Management Press.
Bedrnová, E., Jarošová, E., & Nový, I. (2012). Manažérska psychológie a sociologie. Praha:
Management Press.
Ďurdiak, Ľ. (2001). Psychohygiena mladého človeka. Nitra: Enigma.
Freidl, C. (2004). Wellness boom. Erholung oder zu viel des Guten? Saarbrücken: VDM
Verlag.
Holdau, F. (1999). Einfach gut drauf. München: Gräfeund Unzer.
Kollárik, T. (2011). Sociálna psychológia + Psychológia práce = Sociálna psychológia práce?
Bratislava: Univerzita Komenského v Bratislave.
Kondáš, O. (1985). Psychohygiena všedného dňa. Martin: Osveta.
Melgosa, J. (1998). Zvládni svoj stres! Vrútky: Advent – Orion.
Míček, L. (1986). Duševní hygiena. Praha: Státní pedagogické nakladatelství.
Provazník, V. et al. (2002). Psychologie pro ekonomy a manažery. Praha: Grada Publishing.
Rantanen, J., Lehtinen, S., & Savolainen, K. (2004). The opportunities and obstacles to
collaboration between the developing and developed countries in the field of occupational
health. Toxicology, 198(1/3), 63-74. https://doi.org/10.1016/j.tox.2004.01.038
Rothmann, S., & Rothmann, J. C. (2006). The South African employee health and wellness
surfy. User manual. Potchefstroom, South Africa: Afriforte (Pty) Ltd.
Ryff, C. D. (1989). Happiness is everything, or is it? Explorations on the meaning of
psychological well-being. Journal of Personality and Social Psychology, 57(6), 1069-
1081. https://doi.org/10.1037/0022-3514.57.6.1069
Ryff, C. D. (2014). Psychological well-being revisited: Advances in the science and practice
of eudaimonia. Psychotherapy and psychosomatics, 83(1), 10-28.
https://doi.org/10.1159/000353263
Smith, S. (2008). Leadership´s Effects on Employee Health, Well-Being. Occupational
Hazards, 70(8), 18-19.
Szarková, M. (2016). Psychológia pre manažérov. Praha: Wolters Kluwer.
Szarková, M. (2018). Komunikácia v manažmente. Praha: Wolters Kluwer.


231
SOCIAL NETWORKS, COGNITIVE BIASES AND FAKE NEWS: CAN
A SIMPLE COMPUTER MODEL EXPLAIN A COMPLEX
PHENOMENON?
Blaž Rodič1
DOI: https://doi.org/10.31410/ITEMA.2020.231
Abstract: Misinformation spread by individuals sharing fake news can cause problems in
social, economic and democratic systems. The World Economic Forum considers the viral
spread of misinformation online to be one of the main threats to our society. While the reasons
why people spread misinformation likely haven't changed in the last millennia, the rise of
Internet powered social networks has allowed news to spread rapidly among millions of users,
and gave rise to new phenomena such as echo chambers. The question we ask in this paper is
whether we can model the dissemination of fake news and the emerging phenomena using
relatively simple rules in an agent-based model. We present the current state of research in the
field of fake news, the agent-based modelling methodology, and the current state of our model
development.
Keywords: Fake news, Disinformation, Cognitive bias, Emergent phenomena, Social
networks, Agent-based modelling, Social psychology.
INTRODUCTION
he viral spread of digital misinformation has become so severe that the World Economic
Forum (Tedeneke, 2018) considers it among the main threats to human society. There is
worldwide concern over false news and the possibility that it can influence political,
economic, and social well-being (Törnberg, 2018). The scale and rapidity of sharing fake news
and misinformation are having an impact on democratic processes. False news can drive the
misallocation of resources during terror attacks and natural disasters, the misalignment of
business investments, and can misinform elections (Vosoughi, Roy, & Aral, 2018)
The spreading of fake news in social networks is a complex social phenomenon. Unfortunately,
the study of large-scale social systems is hampered by its subject – in contrast with modelling
of problems typically examined in natural sciences, social science problems are much harder
to analyse and model, as they involve real human beings. Consequently, it is nearly impossible
to build coherent theories that would account for all empirical observations and which all
scientists would agree on.
Currently, there is a lack of models explaining the behaviour of individuals spreading fake
news, as the past research has been mostly focused on statistical analysis of the spread of
individual articles or posts via sharing (retweeting) in social networks. The analysis of large
datasets (e.g. 500 million tweets in (Yang & Leskovec, 2010)) can improve our understanding
of the macro phenomena via the development of statistical models, which can provide a
reference point for the validation of novel micro models of processes behind the current fake
1 Faculty of Information Studies, Ljubljanska cesta 31a, SI-8000 Novo Mesto, Slovenia
T

232
ITEMA 2020
Conference Proceedings
news phenomena. Such micro models would allow us to develop and test new theories
explaining and predicting the fake news phenomena using individual-level rules.
Agent based modelling (ABM) is currently the methodology of choice for the construction of
micro models aiming to model the interaction of individual humans. In ABM, the focus is on
individual agents, their decision processes, their interaction with other agents, and the effects
of that interaction on decision processes. Differences between individuals can be introduced
relatively easily, as ABM models operate on the micro abstraction level, with individuals
represented as discrete agents. The aim of this paper is therefore to present the current state of
research in the field of fake news, ABM methodology, and the current state of our model
development.
LITERATURE REVIEW
Social media platforms are often used as effective tools for constructive communication, but
they also help disseminate false news (Tedeneke, 2018). Known examples of fake news
disrupting democratic processes include the 2016 US presidential elections (Bovet & Makse,
2019), the UK Brexit referendum (Himma-Kadakas, 2017), 2019 European elections
(Marianna Spring and Lucy Webster, 2019), and the 2018 Brazil election (Paraguassu, 2020;
Trevisani & Seetharaman, 2018).
The paradigm of direct production of uncurated content and its uncritical consumption on
online social media fosters the formation of homogeneous communities (echo-chambers)
around specific worldviews, and has been demonstrated as a breeding ground for the creation
and diffusion of fake news (Zollo et al., 2015). It seems that fake news become rife in times of
crisis, as people seek simple explanations for complex truths and scapegoats, as evident in the
ongoing Covid-19 pandemic (Hartley & Vu, 2020; Orso, Federici, Copetti, Vetrugno, & Bove,
2020). Furthermore, fake news 'factories' and 'troll farms' seem to have become a common
weapon in psychological warfare used by state actors as well as a tool to generate web traffic
and thus profit (Gorrell et al., 2019; Linvill & Warren, 2018) (Linvill & Warren, 2018).
Humans are biased in perceiving and understanding a semantic content. A person can verify
grammatical correctness of a sentence faster if the subject matches his pre-existing opinion and
can understand a sentence faster based on hierarchical structure of the content in brain (Collins
& Quillian, 1969; Gilead, Sela, & Maril, 2018). In addition, an individual weakness, such as
lack of analytical thinking, can result in significant inaccuracy in generating content and
detecting fake content distributed in social networks (Pennycook & Rand, 2017). A recent
study has shown that humans are extremely naive in distinguishing content generated by other
humans from those by bots (Shao et al., 2017).
While all persons potentially succumb to cognitive biases, regardless of their political
persuasion (Pelly, 2017; Tait, 2017), there is evidence that the political bias and demographic
factors significantly influence individuals response to fake news and thus their dissemination
of fake news (Bovet & Makse, 2019; Guess, Nyhan, & Reifler, 2018; Poynter Institute, 2018;
Silverman & Alexander, 2016) (Tait, 2017; Silverman and Lawrence, 2016; Hern, 2018; Guess
et al., 2018; Poynter Institute, 2018). The polls conducted during Brexit also show a stronger
response to pro-Brexit propaganda, which focused on the immigration issues (“take control of
our borders”) in districts with an older age profile, lower proportions of residents educated to
the equivalent of a degree, lower median earnings and lower proportions employed in highly
skilled occupations (Gunther, Nisbet, & Beck, 2018; Waldherr & Wijermans, 2013). Work of

233
SOCIAL NETWORKS, COGNITIVE BIASES AND FAKE NEWS: CAN A SIMPLE COMPUTER
MODEL EXPLAIN A COMPLEX PHENOMENON?
Goyanes and Lavin (Goyanes & Lavin, 2018) further sheds light on the demographic factors
and situational predictors that influence the probability to share political fake news through
social media platforms.
METHODOLOGY
Agent based modelling in social psychology
The key properties of the multi-agent approach according to Smith and Conrey (Smith &
Conrey, 2007) are as follows. First, agents are autonomous. Second, agents are interdependent.
Third, agents in these models follow extremely simple rules. One frequent goal of ABM is to
identify the simplest and best supported assumptions about individual agent behaviour (such
as the motive to seek the most attractive partner) that will generate the overall pattern or
outcome of interest. Agent-based models can be used to study the sensitivity of a system to
path dependence, and to explore perturbations to social organization at various stages of group
processes (Smaldino, Calanchini, & Pickett, 2015). While the concept of agent-based
modelling is easy to grasp, defining an agent-based model is not an easy task. Common
mistakes in ABM based research include the integration of too many features and the choice
of the parameters. The results of models are often criticized for being either trivial (too much
abstraction) or, on the other hand, too complex (insufficient abstraction) and therefore probably
wrong because of their surprising results (Waldherr & Wijermans, 2013). Getting the level of
abstraction right is therefore of paramount importance. It goes without saying that the modeller
must have a good understanding of the problem or system that is being modelled, but a less
obvious requirement for selecting the appropriate level of abstraction is a well-defined
hypothesis. The hypothesis defines the goals of modelling and thus informs the selection of
model variables, their level of detail (=abstraction) and the scenarios to be simulated.
Experiments in social psychology have to navigate the thin line between an experimental setup
that mimics real-world situations at the risk of complicating later data analysis, and an over-
controlled environment trying to eliminate all potentially interfering variables. In ABMs, we
can create the experimental environment containing the exact amount of detail needed.
However, a strong bias towards simplicity should be adopted, as overly complicated models
are more difficult to analyse, and the number of model parameters can be prohibitive due to
the dimensionality of the space of possible parameter settings, which can become too large to
be searched efficiently (Eberlen, Scholz, & Gagliolo, 2017). Conte and Paolucci (Conte &
Paolucci, 2014) offer a similar view, and advise that model designer should strive to create a
model system that captures the aspects of the real-world system in which she is interested, with
enough complexity to create a credible analogy between the model and real world systems, but
otherwise as simple as possible so as to maximize generalizability and minimize obscuring
artefacts.
CURRENT STATE OF RESEARCH
While the development of a complex human actor model may be unfeasible due to the
complexities of human psyche, we aim to model the fake news dissemination processes with
sufficient accuracy by leaning on a main premise of complex adaptive systems research and
agent based modelling (ABM) in social systems: complex phenomena emerges from the
interplay of a large number of autonomous actors employing a set of simple rules. An
individual will be modelled from the aspect of an agent in the news dissemination process, and
its decision-making model is to integrate representations of the relevant cognitive biases.

234
ITEMA 2020
Conference Proceedings
The current version of the model allows us to adjust the number of individual agents, and adjust
the parameters governing the behaviour of the “news consumer” agents and several sources of
legitimate and fake news (messages). Agent parameters include political partisanism
(propensity to forward authentic messages supporting the favoured faction), naivety (likelihood
to accept a false message as authentic), ration of fake/authentic messages and frequency of
message generation per news source, processing time for fake and authentic news per agent,
and the impact of a false message (affecting likelihood for it to be forwarded).
The model also allows us to adjust network type and layout during a simulation run. Available
network layouts include arranged, random, and spring-weight, and network types distance-
based and scale-free (Barabási & Bonabeau, 2003). The simulation interface with animation of
agent communication is shown in Figure 1, while Figure 2 shows that nonlinear behaviour can
appear even in the relatively simple current version of the model. News consumer agents are
represented as circles and are divided among two factions (political options) A and B. There
are two news source agents, represented as cloud icons, and each news source generates
messages supporting a single faction. Colours are used to represent the political factions, state
of agents (receiving/forwarding messages) and the authenticity of messages received or
forwarded. Agent size is adjusted to indicate the number of their connections (links to other
agents). Simulation experiment interface is shown on Figure 1. The current value of experiment
parameters is shown in the top left, while the charts display the dynamics in the model, such as
number of legitimate and fake messages received and forwarded by news consumer agents of
factions A and B and the rate of message forwarding per adjustable time period. The agents,
their state, network layout and connections are shown on the right.
Figure 1. Simulation interface within the current model prototype

235
SOCIAL NETWORKS, COGNITIVE BIASES AND FAKE NEWS: CAN A SIMPLE COMPUTER
MODEL EXPLAIN A COMPLEX PHENOMENON?
The charts in Figure 2 display the linear increase of the cumulative number of received and
forwarded messages, with visible aberrations appearing between agent factions despite the
equal number of agents per faction and the same values of agent parameters. This indicates that
even a relatively simple model, containing only linear dependencies between variables can
produce unpredictable, nonlinear and even counterintuitive behaviour under the right
circumstances, such as network congestion.
Figure 2. Observed nonlinear behaviour within the current model prototype
We must note that the experiment results do not yet correspond to real world data, as the model
is still under development and not yet calibrated with empirical data. The model’s value in
current state is in generating insight and new ideas for its further development.
CONCLUSION
The current version of the fake news dissemination model allows use to vary the agent
behaviour parameters, news generation and processing parameters as well as agent network
type and layout in order to examine the influence of these parameters on the dynamics of
message diffusion as well as visualize the diffusion of messages through the network. We have
so far noticed that the increased frequency of messages can produce non-linear behaviour
through network congestion. The development of the model prototype will utilize the findings
from previous studies and literature review. Calibration, verification and validation of the
model will be carried out using the rules identified through secondary sources and available
databases of social network (e.g. Twitter, Facebook) and news website data. Originality and
innovation of the planned simulation model is in the focus on the mechanisms at the level of
individuals, which result in complex social dynamics present in the fake news phenomenon.
We will use ABM to model and test new theories based on existing fake news research. The
fake news phenomenon is a very relevant area of research, with a major potential scientific and
applied impact. As the subject of our research is interdisciplinary, we are looking to cooperate
with researchers from the field of network analysis, psychology and social psychology.

236
ITEMA 2020
Conference Proceedings
ACKNOWLEDGMENT
Research supported by the Slovenian Research Agency (programme No. P1-0383, Complex
networks).
REFERENCES
Barabási, A. L., & Bonabeau, E. (2003). Scale-free networks. Scientific American, 288(5), 60–
69. https://doi.org/10.1038/scientificamerican0503-60
Bovet, A., & Makse, H. A. (2019). Influence of fake news in Twitter during the 2016 US
presidential election. Nature Communications, 10(1), 7. https://doi.org/10.1038/s41467-
018-07761-2
Collins, A. M., & Quillian, M. R. (1969). Retrieval time from semantic memory. Journal of
Verbal Learning and Verbal Behavior, 8(2), 240–247. https://doi.org/10.1016/S0022-
5371(69)80069-1
Conte, R., & Paolucci, M. (2014). On agent-based modeling and computational social science.
Frontiers in Psychology, 5(JUL), 668. https://doi.org/10.3389/fpsyg.2014.00668
Eberlen, J., Scholz, G., & Gagliolo, M. (2017). Simulate this! An Introduction to Agent-Based
Models and their Power to Improve your Research Practice. International Review of
Social Psychology, 30(1), 149. https://doi.org/10.5334/irsp.115
Gilead, M., Sela, M., & Maril, A. (2018, April 4). That’s My Truth: Evidence for Involuntary
Opinion Confirmation. Social Psychological and Personality Science, p.
194855061876230. https://doi.org/10.1177/1948550618762300
Gorrell, G., Bakir, M. E., Roberts, I., Greenwood, M. A., Iavarone, B., & Bontcheva, K. (2019).
Partisanship, Propaganda and Post-Truth Politics: Quantifying Impact in Online
Debate. Retrieved from
https://www.researchgate.net/publication/330898845_Partisanship_Propaganda_and_Po
st-Truth_Politics_Quantifying_Impact_in_Online
Goyanes, M., & Lavin, A. (2018). The Sociology of Fake News. Factors affecting the
probability of sharing political fake news online. In Media and Communications.
https://doi.org/10.2307/3331474
Guess, A., Nyhan, B., & Reifler, J. (2018). Selective Exposure to Misinformation: Evidence
from the consumption of fake news during the 2016 U.S. presidential campaign.
Retrieved from http://www.dartmouth.edu/~nyhan/fake-news-2016.pdf
Gunther, R., Nisbet, E. C., & Beck, P. (2018). Trump may owe his 2016 victory to ‘ fake news
,’ new study suggests. Retrieved November 10, 2020, from The Conversation website:
https://theconversation.com/trump-may-owe-his-2016-victory-to-fake-news-new-study-
suggests-91538
Hartley, K., & Vu, M. K. (2020). Fighting fake news in the COVID-19 era: policy insights
from an equilibrium model. Policy Sciences, 53(4), 735–758.
https://doi.org/10.1007/s11077-020-09405-z
Himma-Kadakas, M. (2017). Alternative facts and fake news entering journalistic content
production cycle. Cosmopolitan Civil Societies: An Interdisciplinary Journal, 9(2), 25.
https://doi.org/10.5130/ccs.v9i2.5469
Linvill, D. L., & Warren, P. L. (2018). Troll Factories: The Internet Research Agency and
State-Sponsored Agenda Building. Retrieved from
https://www.rcmediafreedom.eu/Publications/Academic-sources/Troll-Factories-The-
Internet-Research-Agency-and-State-Sponsored-Agenda-Building
Marianna Spring and Lucy Webster. (2019). European elections: How disinformation spread
in Facebook groups. BBC NEWS. Retrieved from https://www.bbc.com/news/blogs-

237
SOCIAL NETWORKS, COGNITIVE BIASES AND FAKE NEWS: CAN A SIMPLE COMPUTER
MODEL EXPLAIN A COMPLEX PHENOMENON?
trending-48356351
Orso, D., Federici, N., Copetti, R., Vetrugno, L., & Bove, T. (2020). Infodemic and the spread
of fake news in the COVID-19-era. European Journal of Emergency Medicine, pp. 327–
328. https://doi.org/10.1097/MEJ.0000000000000713
Paraguassu, L. (2020). Brazil finalizing bill to target financiers of “fake news” attacks.
Retrieved November 11, 2020, from Reuters website: https://in.reuters.com/article/us-
brazil-politics-maia/brazil-finalizing-bill-to-target-financiers-of-fake-news-attacks-
idUSKBN25Z2G5
Pelly, S. (2017). How fake news becomes a popular, trending topic - CBS News. Retrieved
January 23, 2019, from CBS News website: https://www.cbsnews.com/news/how-fake-
news-find-your-social-media-feeds/
Pennycook, G., & Rand, D. G. (2017). Who falls for fake news? The roles of bullshit
receptivity, overclaiming, familiarity, and analytic thinking. In SSRN.
https://doi.org/10.2139/ssrn.3023545
Poynter Institute. (2018). Fake news and fact-checking websites both reach about a quarter of
the population – but not the same quarter. Retrieved March 10, 2018, from
https://www.poynter.org/fact-checking-research-database/fake-news-and-fact-checking-
websites-both-reach-about-quarter
Shao, C., Ciampaglia, G. L., Varol, O., Yang, K., Flammini, A., & Menczer, F. (2017). The
spread of fake news by social bots. Undefined, 1–16. https://doi.org/1707.07592
Silverman, C., & Alexander, L. (2016). How Teens In The Balkans Are Duping Trump
Supporters With Fake News. Retrieved January 23, 2019, from Buzzfeed News website:
https://www.buzzfeednews.com/article/craigsilverman/how-macedonia-became-a-
global-hub-for-pro-trump-misinfo
Smaldino, P. E., Calanchini, J., & Pickett, C. L. (2015). Theory development with agent-based
models. Organizational Psychology Review, 5(4), 300–317.
https://doi.org/10.1177/2041386614546944
Smith, E. R., & Conrey, F. R. (2007). Agent-based modeling: A new approach for theory
building in social psychology. Personality and Social Psychology Review, 11(1), 87–104.
https://doi.org/10.1177/1088868306294789
Tait, A. (2017, February 11). Fake news is a problem for the left, too. New Statesman. Retrieved
from https://www.newstatesman.com/politics/media/2017/02/fake-news-problem-left-
too
Tedeneke, A. (2018). Fake News Poses a Threat to Democracies across Latin America and
Worldwide > Press releases | World Economic Forum. Retrieved January 23, 2019,
from World Economic Forum website: https://www.weforum.org/press/2018/03/fake-
news-poses-a-threat-to-democracies-across-latin-america-and-worldwide/
Törnberg, P. (2018). Echo chambers and viral misinformation: Modeling fake news as complex
contagion. PLoS ONE, 13(9), e0203958. https://doi.org/10.1371/journal.pone.0203958
Trevisani, P., & Seetharaman, D. (2018). In Brazil Vote, Misinformation Spreads on Social
Media Despite Efforts to Stop It. Wall Street Journal. Retrieved from
https://www.wsj.com/articles/in-brazil-vote-fake-news-spreads-on-social-media-
despite-efforts-to-stop-it-1540566295
Vosoughi, S., Roy, D., & Aral, S. (2018). The spread of true and false news online. Science,
359(6380), 1146–1151. https://doi.org/10.1126/science.aap9559
Waldherr, A., & Wijermans, N. (2013). Communicating social simulation models to sceptical
minds. JASSS, 16(4). https://doi.org/10.18564/jasss.2247
Yang, J., & Leskovec, J. (2010). Modeling information diffusion in implicit networks.
Proceedings - IEEE International Conference on Data Mining, ICDM, 599–608.
https://doi.org/10.1109/ICDM.2010.22

238
ITEMA 2020
Conference Proceedings
Zollo, F., Novak, P. K., Del Vicario, M., Bessi, A., Mozetič, I., Scala, A., … Preis, T. (2015).
Emotional dynamics in the age of misinformation. PLoS ONE, 10(9), e0138740.
https://doi.org/10.1371/journal.pone.0138740

239
CHALLENGES IN MANAGING INTELLECTUAL PROPERTY
RIGHTS DURING CORONAVIRUS PANDEMIC
Mario Lukinović1
Larisa Jovanović2
Vladimir Šašo3
DOI: https://doi.org/10.31410/ITEMA.2020.239
Abstract: The socio-economic impact of the pandemic on all social spheres is huge, but like
any crisis, for some it is an opportunity to create, develop and promote solutions. The
coronavirus pandemic has brought many changes. It has forced us all to find new ways of
working, interacting and living. The field of intellectual property is particularly affected by the
coronavirus pandemic, its strong influence has affected all branches of intellectual property,
especially the field of copyright and patents. During the COVID-19 Pandemic, numerous
anomalies in the consumption of copyrights were observed, which coincided with the isolation
measures, from drastically increased consumption of illegal pirated content via the Internet,
especially in countries with lockdown, through a sharp increase of Disney+ and Netflix
streaming platform users.
The identification of products that have the word Corona in their name – in their trademark,
with the virus has led to a sharp drop in consumption of some products, but also to increased
sales of others. The pharmaceutical industry has invested huge funds in the fight against this
global challenge, especially in the field of treatment of viruses, new drugs for the prevention,
as well as finding a vaccine against COVID-19. This paper discusses the challenges faced by
the management of intellectual property rights and potential response measures.
Keywords: COVID-19, Innovation, Intellectual property, Patents, Coronavirus pandemic,
Generics, Drugs, Vaccines, Cybersecurity.
1. INTRODUCTION
pplication of protective measures, that was introduced by the majority of governments
world-wide in order to lessen the consequences of the pandemic, impacted them in
different ways and to a different extent, depending on the nature of activities of given
business subjects. Even though the pandemic is gradually subsiding in a significant number of
countries, the vaccine still does not exist, and the fears are still growing stronger; people fear
not only its return in the colder autumn and winter periods, but also the possible sudden spread
in the southern hemisphere, especially in the regions with a common lower level of hygiene
among local population. The impact it leaves behind itself is enormous, and it is especially
significant in the field of intellectual property. Isolation of population had a great impact on
the increase in consummation of authorship works (reading books, watching movies, listening
to music, etc.), while the activity of scientists in the field of inventions is extremely grand.
1 Faculty of Law, UNION University, Belgrade, Serbia 2 ALFA BK University, Belgrade, Serbia 3 ALFA BK University, Belgrade, Serbia
A

240
ITEMA 2020
Conference Proceedings
2. CHALLENGES OF MANAGING COPYRIGHTS DURING CORONAVIRUS
PANDEMIC
The ban and restriction of movement directed the offer of content towards the Internet, many
museums, galleries, theaters, etc. instead of classic tours, offered millions of users a virtual
tour. Even some of the contents whose contents imply exclusively in vivo communication with
visitors (virtual tours of national parks, children's camps, etc.), offered new types of
communication which imply the consumption of author's works at a distance.
Everyone tried in their own way to be a part or to give their contribution; many companies,
creators and traders offered protective masks with different designs and motifs, as well as T-
shirts with messages of the funniest nature related to COVID-19.
Social distancing and millions of people in isolation have caused a drastic increase in watching
online movies and TV series. American media provider Netflix has, during the COVID-19
pandemic, acquired 16 million of new subscribers on its streaming platform (Ryan et. al.,
2020). At the same time, British company MUSO’s data, which follows thousands of pirate
platforms and contains a database on digital online content in 196 countries, speak of a drastic
increase of Internet piracy, which is directly correlated with isolation measures. Since the last
week of February and the first week of March, when mass isolation measures commenced, a
drastic increase was recorded world-wide. According to this data, we can almost observe the
level of isolation measures taken in certain countries. In Italy, the country which was, at one
point, most harshly hit by the pandemic, the increase of movie piracy reached unbelievable
66%. Repressive isolation measures were especially strictly taken in India, where the said
increase amounted to 62%; afterwards, Spain overtook the primacy from Italy, when speaking
of the number of infected individuals, and illegal consumption of authorship has increased for
50%; in Britain, during the same period, the increase amounted to 43%, and in the United
States, it amounted to а 41% (Chatterley, 2020).
Figure 1. Increase of movie piracy in February/March of 2020
Source: MUSO
The graph expresses the increase of movie piracy during the last week of February, in
comparison to the first week of March. It is well noticeable that the highest peak occurred in

241
CHALLENGES IN MANAGING INTELLECTUAL PROPERTY RIGHTS DURING CORONAVIRUS
PANDEMIC
Italy, India and Spain, that is, in the countries that, exactly at that time, commenced
implementation of strict isolation measures.
Parallel to exponential increase of number of visits to websites containing pirated content
during the times of pandemic, the number of websites containing illegal streaming of sports
events decreased, given that there are no sporting events. The loss of emitters of sports
programs is enormous. They are directly dependent on their viewers, given that their
massiveness brings them profit, not only from subscriptions, but from commercials as well.
Without sporting transmissions, none of the previously mentioned exists. This vicious circle
also includes professional athletes, whose high profits depend in many ways on TV rights, paid
by cable and Internet providers.
Companies such as Disney, which have a high dispersion of authorship rights, are currently
counting their losses. While Disney streaming platform acquired a record of 32 million
subscribers, thanks to a great extent to isolation measures, great losses occurred due to closing
of Disney parks in America, Japan, France and China, and the world premiere of “Mulan”
movie was postponed due to the pandemic. Disney faced certain loss also due to reduced
possibility for merchandising product placement.
The Dutch media and fashion company RUMAG (acronym made of the title RUDE
MAGAZINE), famous for production of T-shirts, mugs, etc. with funny, vulgar or sexual quotes,
was publicly accused of copyright infringement. The majority of quotes and slogans that they
print on their products (in white lettering on a black background) were taken from social
networks and other sources. During the pandemic, they have decided to introduce a special
Corona collection to the market, and the entire revenue was intended for the Red Cross. Some
of the quotes that sounded funny in the context of the pandemic were taken from the songs of
authors popular in the Netherlands. Even though the authors of the said quotes were listed, and
the funds were donated for charity, the pressure of the public on RUMAG was so strong that
the CEO resigned.
Do producers, such as RUMAG company, commit infringement of authorship by such conduct?
The laws on authorship of the majority of countries do not provide a legal authorship protection
to small textual and artistic forms (short phrases and slogans, ornaments, etc.) (Bogdanović,
2017), and they are seen as the so-called “bits of authorship rights”. Certain slogans, ornaments
and phrases are protected with a trademark, and in such a way, they enjoy legal protection.
No lawmaker can foresee all life situations. When there is not a legally prescribed provision
for a normative solution of a certain problem, we resort to analogy through implementation of
suitable rule from a different source. In praxis, commercial use of the title of an authorship
work (movies, songs, etc.) without the approval of the carrier of authorship, is very common.
Within the contemporary Comparative Law, not all national legislation provides the same
protection to a title. If original, the title is regarded as an authorship and enjoys independent
protection within the French law. On the contrary, in Great Britain, it is defined that, in the
case of use of the same or similar title for the same type of work, the protection might be
demanded on the basis of the provisions on fair competition (Spasić, 2011).
According to our Law on Authorship and Familiar Rights, if the title of a work is an original,
it represents the subject of authorship legal protection, independently from the piece that is
marked by the said title. In praxis, however, not many titles can enjoy such a status. If the title
of a work is not an original to the extent that it represents an authorship itself, but is regarded

242
ITEMA 2020
Conference Proceedings
as an integral part of the authorship named by the said title, the use of the work without its title
or with a changed title is regarded as an infringement of authorship of the said title.
3. MANAGING PATENTS DURING CORONAVIRUS PANDEMIC
Nowadays, the Earth is inhabited by the highest number of habitants since its inception
(currently numbering more than 7,5 billion), of which a significant percentage inhabits urban
settings where they come to a close contact among themselves on a daily basis. Population
fluctuation is higher than ever, and airlines have, during the course of 2019, transported more
than 4,5 billion of travelers, which is more than double in comparison to the previous year.
Transportation decreases distance, and thus, the world has become a “global village” in which,
and all thanks to transportation, infections can reach, together with passengers, another side of
the planet in just a day. Because of that, the possibility of spreading viruses will continue to
grow in the years that shall follow, and the response of the humanity cannot remain in the scope
of increasing physical distancing measures and other preventive measures; it is hidden in
thousands of laboratories world-wide, where scientists must create new inventions for
repressing their impact.
rom the invention of the first wheel, to cuneiform, steam machine, penicillin and even a
computer chip, innovation represented progress, but also survival (Lukinović, 2017). A patent
is a law which protects inventions. It is an award in the form of monopoly rights, given by the
state to the inventor for his innovative success, materialized through a unique position on the
market (Lukinović et al. 2017). The industrial property protection system is not seen as a goal
itself, but as means for encouraging creative work. In order for authors and inventors to be
encouraged to create, state provides them with privileges in the form of legal protection,
authorship rights or inventions. Through these instruments, individuals are actually being put
in the function of the general thing representing progress, as a result of some authorship work
or an invention.
4. INTERNET ATTACK AND WEB APPLICATION VULNERABILITIES
CAUSED BY COVID-19
Whenever a new crisis emerges, different criminal actors are the first to jump on the occasion
to exploit unsuspecting victims in times of fear, uncertainty and doubt. These exploits take
multiple forms, from the physical to the digital world. History has taught us that the most
efficient method to initially counter these threats is through prevention and awareness towards
all levels of corporate and personal life.
There is a widespread awareness of web application security issues. Users are often called upon
to verify certificates because they want to entrust their information to serious organizations that
store their data behind advanced cryptographic protocols. Based on the examination of security
vulnerabilities of web applications in the period from 2016 to 2019, we can single out the
following categories of attacks:

243
CHALLENGES IN MANAGING INTELLECTUAL PROPERTY RIGHTS DURING CORONAVIRUS
PANDEMIC
Figure 2. Frequency of web application vulnerabilities in the period from 2016 to 2019
Source:
https://www.academia.edu/35796648/Upravljanje_bezbednoscu_u_Cyber_prostoru_i_mehani
zmi_zastite_web_aplikacija
Table 1. Vulnerabilities and categories of attacks in the period 2016-2018.
Disadvantages of
authentication
Include compromising and abusing various shortcomings of the
system login mechanism. The method of random guessing of
the user code is most often used here.
Broken Access control
Deficiencies are a case where an application is unable to protect
access to data and resources. Here, the attacker is allowed to
access sensitive user data on the server, or to perform privileged
actions.
SQL injection
Allows an attacker to modify an SQL query intended for a
database. In this way, the attacker may be able to access the
data stored in the database.
Cross-site scripting
Allows an attacker to attack other users of the application, as
well as gain access to their data or perform unauthorized
actions on their behalf.
Cross-site requests forgery
Allows an attacker to perform unwanted actions on behalf of
the user of the application. The attack is realized based on the
visit of the malicious site by the victim, after which the user's
browser performs certain actions that the user does not intend to
do.
Information leakage
Includes cases where the application displays sensitive
information that is useful to the attacker in developing
mechanisms against the application itself, by printing error
messages and other similar behavior.
Website attack attempts per day grew by 59% from January 2018 to December 2018, ending
at a peak of 80 attacks per day and averaging 62 attacks per day for the year. Rising attack
volume suggests cybercriminals are automating their attacks to expand their reach and
frequency. However, the sample of infected websites remained steady at about 60,000
throughout the year, indicating that website security tools are likely becoming more successful
at combating the increasing number of attacks.

244
ITEMA 2020
Conference Proceedings
As 5G networks roll out, the use of connected IoT devices will accelerate dramatically. They
will increase networks’ vulnerability to large-scale, multi-vector Gen V cyber-attacks. IoT
devices and their connections to networks and clouds, are a weak link in security. It’s hard to
get visibility of these devices that can have complex security requirements. What’s needed is a
more holistic approach to IoT security, combining traditional and new controls to protect these
ever-growing networks across all industry and business sectors.
Many organizations have shifted workloads to the cloud. However, the level of understanding
as to securing them remains dangerously low. Security is often an afterthought as traditional
security can be perceived as inhibiting business agility. This is why security solutions need to
evolve to a new paradigm of flexible, cloud-based, resilient architectures that deliver scalable
security services at the speed of DevOps. Cloud computing is fastmoving and dynamic. As
organizations adopt new and more efficient cloud-based services and technologies to meet their
business needs, cloud attack vectors become more complex and diversified. An additional
concern is that cloud has enabled the increase in the speed and agility of development teams to
use new technologies, but security controls for these new technologies often lag behind new
technology adoption.
Next figure shows most common critical vulnerabilities in 2020 (Internet facing):
Figure 3. Most Common Critical Vulnerabilities in 2020 (Internet facing)
Source:
https://landing.edgescan.com/hubfs/BCC030%20Vulnerability%20Stats%20Report%20(2020
)_WEB.pdf
Table 2. Vulnerabilities and categories of attacks 2020.
SQL injection
SQL injection attack consists of insertion or “injection” of a SQL query via the
input data from the client to the application. A successful SQL injection exploit
can read sensitive data from the database, modify database data
(Insert/Update/Delete), execute administration operations on the database (such
as shutdown the DBMS), recover the content of a given file present on the DBMS
file system and in some cases issue commands to the operating system. SQL
injection attacks are a type of injection attack, in which SQL commands are
injected into data-plane input in order to affect the execution of predefined SQL
commands.
Cross-site
scripting (XSS)
Cross site Scripting (XSS) attacks are a type of injection problem, in which
malicious scripts are injected into web sites. Cross site scripting flaws are the
most prevalent flaw in web applications today. Cross site scripting attacks occur
245
CHALLENGES IN MANAGING INTELLECTUAL PROPERTY RIGHTS DURING CORONAVIRUS
PANDEMIC
when an attacker uses a web application to send malicious code, generally in the
form of a browser-side script, to a different end user. The ‘stored’ variant is
considered a “Critical” vulnerability as it persists across all users who access an
infected page and has the potential to infect a wide user base of the web
application or site.
Php multiple
vulnerabilities
Many PHP vulnerabilities were discovered with ratings including both high and
critical risk. Many PHP deployments have multiple vulnerabilities concurrently.
PHP is still a widely used programming language but loosing popularity.
Millions of sites on the Internet use PHP and will for some time to come
Remote code
execution
Remote code execution (RCE) is used to describe an attacker’s ability to execute
arbitrary commands or code remotely across the Internet or network on a target
machine. This is achieved by exploiting a vulnerability which generally, if
known about, could be mitigated via a patch or configuration change
Sensitive file
disclosure
This is the result of leaving unprotected files on a hosting environment, systems
using inadequate authorization or poorly deployed systems which result in
directory listing and sensitive data disclosure. A recent trend in such a
vulnerability, are exposed AWS S3 buckets which are misconfigured, resulting
in publicly exposed database back up files, internal files, configuration files and
other private information being left available on the Internet
Vulnerabilities may result in complete compromise of a system or a user. They are generally
highly likely to occur, high impact or both. SQL Injection was first discovered in 1998 and still
lives on the Internet today together with XSS and RCE.
Since the beginning of the outbreak, a total of 90,284 new corona related domains have been
registered globally. Many of them were found to be malicious and suspicious.
More online transactions mean more opportunities to hack credit card data, and people working
remotely have opened up new ways for criminals to target both individuals and organizations.
Key findings highlighted by the INTERPOL assessment of the cybercrime landscape in relation
to the COVID-19 pandemic include:
Online Scams and Phishing - Threat actors have revised their usual online scams and
phishing schemes. By deploying COVID-19 themed phishing emails, often
impersonating government and health authorities, cybercriminals entice victims into
providing their personal data and downloading malicious content. Around two-thirds of
member countries which responded to the global cybercrime survey reported a significant
use of COVID-19 themes for phishing and online fraud since the outbreak.
Disruptive Malware (Ransomware and DDoS) - Cybercriminals are increasingly using
disruptive malware against critical infrastructure and healthcare institutions, due to the
potential for high impact and financial benefit. In the first two weeks of April 2020, there
was a spike in ransomware attacks by multiple threat groups which had been relatively
dormant for the past few months. Law enforcement investigations show the majority of
attackers estimated quite accurately the maximum amount of ransom they could demand
from targeted organizations.
Data Harvesting Malware - The deployment of data harvesting malware such as Remote
Access Trojan, info stealers, spyware and banking Trojans by cybercriminals is on the
rise. Using COVID-19 related information as a lure, threat actors infiltrate systems to
compromise networks, steal data, divert money and build botnets.
Malicious Domains - Taking advantage of the increased demand for medical supplies
and information on COVID-19, there has been a significant increase of cybercriminals

246
ITEMA 2020
Conference Proceedings
registering domain names containing keywords, such as “coronavirus” or “COVID”.
These fraudulent websites underpin a wide variety of malicious activities including C2
servers, malware deployment and phishing. From February to March 2020, a 569 per cent
growth in malicious registrations, including malware and phishing and a 788 per cent
growth in high-risk registrations were detected and reported to INTERPOL by a private
sector partner.
Misinformation - An increasing amount of misinformation and fake news is spreading
rapidly among the public. Unverified information, inadequately understood threats, and
conspiracy theories have contributed to anxiety in communities and in some cases
facilitated the execution of cyberattacks. Other cases of misinformation involved scams
via mobile text-messages containing 'too good to be true' offers such as free food, special
benefits, or large discounts in supermarkets. The concepts of misinformation and
disinformation are not new. Evidently, the current situation has made it easy to spread
this across all social platforms. A very large portion of Internet users are confined in their
homes and are using the Internet in a heightened capacity which enables misinformation
to be posted, re-posted and added upon across any media. The techniques used are very
complex and can take many forms. There are websites that are trying to investigate
misinformation related to COVID-19. In a little over a month, more than 50 articles have
been debunked and proven false. It has become exceedingly difficult to keep up with the
amount of misinformation related to the current situation. Considering this, it has become
more important than ever to ensure that the source of the information is verified, credible
and corroborated before any action is undertaken in relation to the news.
Figure 4. The monthly count for Covid-19 related email threats - first half of 2020
Source: https://www.trendmicro.com/en_us/research/20/i/1h-2020-cyber-security-defined-
by-covid-19-pandemic.html
Email was the most used entry point, making up 91.5% of detections for Covid-19-related
threats. The numbers started rising in March and peaked in April. Some of the emails we
observed include those that pose as health advisories or donation requests. These usually have
attachments that carry malware.
Taking advantage of the increased demand for medical supplies and information on COVID-
19, there has been a significant increase of cybercriminals registering domain names that
contain related keywords, such as “coronavirus” or “COVID”. These fraudulent websites
underpin a wide variety of malicious activities including C2 servers, malware deployment and
phishing. Taking advantage of the increased demand for medical supplies and information on

247
CHALLENGES IN MANAGING INTELLECTUAL PROPERTY RIGHTS DURING CORONAVIRUS
PANDEMIC
COVID-19, there has been a significant increase of cybercriminals registering domain names
containing keywords, such as “coronavirus” or “COVID”. These fraudulent websites underpin
a wide variety of malicious activities including C2 servers, malware deployment and phishing.
From February to March 2020, a 569% growth in malicious registrations, including malware
and phishing and a 788% growth in high-risk registrations were detected and reported to
INTERPOL by a private sector partner.
We can conclude that the most vulnerable parts of the application are those where the
application accepts input from the user and this is where the most attention should be paid.
When a vulnerability is detected, appropriate updates for the application are found relatively
quickly. Attacks using client-side vulnerabilities are the ones most used and developed in the
last few years. Attacks on databases (SQL Injection) are slowly disappearing, as very strong
protections are being made that are impossible to circumvent. By using the PDO prepare PHP
command, the application is enabled to pre-implement the structure of the SQL query before
accepting the user input parameters, so that later the attacker will not be allowed to modify and
abuse the query.
The impact of the COVID-19 on life on our Planet is fearful. Social relations (quarantine
measures, physical distancing) and economic decline, collapse of trade, financial and
commodity channels, elimination of a huge number of jobs have a strong impact on social and
societal movements (Lukinović, Jovanović, 2020). The economic impact of the pandemic is
evident in many sectors, from service industries (transport, tourism, hospitality, education), to
manufacturing (cars, textiles, construction, consumer electronics). Pandemic measures will
result in a serious decline of GDP in 2020 (Radić et al., 2020)
The global pandemic COVID-19 has proved the importance of a global response in
collaborative and coordinated manner (Radanov, 2020). It is especially important to establish
international cooperation in the field of pharmacy and synthesis of new drugs and vaccines.
COVID-19 treatment protocols are now being supplemented with new experimental and
generic drugs from different countries. Avifavir and coronavir are successfully used in the
Russian Federation. Good results in the treatment of COVID-19 disease are given by antibodies
from the blood plasma of donors who have suffered from COVID-19 in severe form. However,
the greatest hopes of the population in all countries of the world are placed on antiviral vaccines
against COVID-19 disease. Vaccination with Russian and Chinese vaccines take place in South
American and Asian countries (Jovanović, Ermakov, 2020).
Digitalization of all branches of the economy, financial and cultural-educational sector, as well
as administrative jobs in cities and suburbs, in addition to many positive aspects, opens
opportunities for numerous cyber intrusions and cyber-attacks (Milošević et al., 2020, Munitlak
Ivanović, 2020).
It is very important to ensure the safety of the traffic and the infrastructure of communal
services in large smart cities (Kotur, Radović, 2020, Latinović, Jovanović, 2019).
Cybercriminals are developing and boosting their attacks at an alarming pace, exploiting the
fear and uncertainty caused by the unstable social and economic situation around the world. At
the same time, the higher dependency on connectivity and digital infrastructure due to the
global lockdown increases the opportunities for cyber intrusions and cyber-attacks.

248
ITEMA 2020
Conference Proceedings
The most urgent priority to address these growing cyberthreats is to further enhance
international police cooperation for operational activities and to improve cybercrime
information exchange with diverse partners within the global ecosystem of cybersecurity
(Zlatković, Denić, 2020).
Figure 5. Key technological areas with drastic impact on the future
Source: https://www.ecs-org.eu/documents/uploads/report-on-the-ecso-members-and-the-
community-survey.pdf
The European Commission’s Next Generation EU proposal is a step in the right direction as it
looks to harness the full potential of the EU budget and allocate €8.2 billion toward the Digital
Europe Programme (DEP), involving investments in supercomputing, artificial intelligence
and cybersecurity. This includes:
Investing in more and better connectivity, especially in the rapid deployment of 5G
networks.
A stronger industrial and technological presence in strategic sectors, including artificial
intelligence, cybersecurity, supercomputing and cloud.
Building a real data economy as a motor for innovation and job creation.
Increased cyber resilience.
5. CONCLUSION
The impact of the pandemic on humanity is incredible, modern history remembers such
changes only during the great wars. Whether these changes will be permanent or temporary,
time has yet to show. When we look at intellectual property, similar changes have already taken
place in the field of copyright under the influence of new technical changes. Invention of radio
transmission, gramophone, tape recorder, CD, etc. hit hard in the field of the copyright industry.
The postulates established more than a hundred years ago were shaken, but with the necessary
changes in management and law, it continued. Other intellectual property rights, primarily
patents, are now facing such a challenge. It is difficult to predict how things will go on, the
length of the pandemic will depend on how much and what the consequences will be. The
answer to the solution to the pandemic lies in innovations, new drugs, new vaccines and the
depth of the changes will depend on the speed of the inventors.

249
CHALLENGES IN MANAGING INTELLECTUAL PROPERTY RIGHTS DURING CORONAVIRUS
PANDEMIC
REFERENCES
Bogdanović, D., Autorsko pravo i biblioteke digitalnog doba, Bosniaca: časopis Nacionalne i
univerzitetske biblioteke Bosne i Hercegovine, Vol. 22 No. 22, 2017, pp. 77- 83.
Chatterley, A., The New Normal? What The Coronavirus Means For Digital Piracy, Forbes,
available at: https://www.forbes.com/sites/andychatterley/2020/04/23/the-new-normal-
what-the-coronavirus-means-for-digital-piracy/#665e1c1443bc
Jovanović, L., Ermakov, V., Značaj selena i cinka u prevenciji i lečenju virusnih oboljenja,
Ecologica, Vol. 27, No 99 (2020), 357-365.
Kotur, M., Radović, V., Važnost autonomnih automobila i održivog transporta u razvoju
„pametnog grada“, Ecologica, Vol. 27, No 98 (2020), 273-280.
Latinović, L., Jovanović, Đ., Application of the "Smart City concept" through efficient
recyclable waste collection, Ecologica, Vol. 26, No 95 (2019), 364-370.
Lukinović, M., Intelektualna svojina, Pravni fakultet Univerziteta Union/Službeni glasnik,
2017, pp. 36.
Lukinović, M., Plagiranje, naučni rad i autorsko delo, Zbornik radova Pravnog fakulteta u Nišu,
LVI/2017, Issue No: 77, str. 121-132.
Lukinović, M., Jovanović, L., Uticaj pandemije COVID-19 na životnu sredinu, Ecologica, Vol.
27, No 99 (2020), 376-382.
Lukinović, M. Stamatović, M. Šarkić, N., Inovacije: pravno-ekonomski aspekti, Pravni fakultet
Univerziteta Union/ Službeni glasnik, Beograd, 2017, pp. 45.
Milošević, M., Milošević, D., Stanojević, A., Simjanović, D., IAHP kao podrška primeni
tehnoloških inovacija u razvoju pametnih gradova, Ecologica, Vol. 27, No 99 (2020),
407-413.
Munitlak Ivanović, O., Razvoj pametnih gradova - primer četvrte industrijske revolucije,
Ecologica, Vol. 27, No 97 (2020), 15-21.
Radić, V., Radić, N., Ravić, N., Uticaj pandemije korona virusa na ciljeve održivog razvoja i
ekonomiju, Ecologica, Vol. 27, No 99 (2020), 366-375.
Radanov, P., Informisanost stanovnika grada Pančeva o korona virusu – izazivaču teškog
akutnog respiratornog sindroma i merama zdravstvene zaštite, Ecologica, Vol. 27, No 98
(2020), 288-299.
Ryan, B. Coppola, D. Canyon, D. Brickhouse, M. Swienton, R., COVID-19 Community
Stabilization and Sustainability Framework: An Integration of the Maslow Hierarchy of
Needs and Social Determinants of Health, Disaster Medicine and Public Health
Preparedness, 2020, pp. 1-16.
Spasić, V., Autorska dela u digitalnom okruženju, Pravni fakultet u Nišu, Univerzitet u Nišu,
2011, pp. 51.
Zlatković, D., Denić, N., Smart cities: from urban development to digital infrastructure and
cybersecurity, Ecologica, Vol. 27, No 99 (2020), 443-450.
https://landing.edgescan.com/hubfs/BCC030%20Vulnerability%20Stats%20Report%20(2020
)_WEB.pdf
https://www.academia.edu/35796648/Upravljanje_bezbednoscu_u_Cyber_prostoru_i_mehani
zmi_zastite_web_aplikacija
https://www.ecs-org.eu/documents/uploads/report-on-the-ecso-members-and-the-community-
survey.pdf
https://www.trendmicro.com/en_us/research/20/i/1h-2020-cyber-security-defined-by-covid-
19-pandemic.html
https://www.unodc.org/documents/middleeastandnorthafrica/2020/COVID19/COVID19_ME
NA_Cyber_Report_EN.pdf


251
KEYWORD ANALYSIS WITH USING STATISTICAL METHODS
Dominika Krasňaská1
Mária Vojtková2
DOI: https://doi.org/10.31410/ITEMA.2020.251
Abstract: There are currently more than a billion websites worldwide. In so many websites,
everyone wants to be visible to search engines through the keywords that people search for.
The article deals with the process of creating keywords, through which we can identify the
intention of the searcher. The process of creating keywords consists of several steps, namely
the collection of keywords, subsequent cleaning of keywords, their categorization and the last
step is the interpretation of keywords. The paper focuses mainly on the categorization of
keywords, which we obtain through the use of statistical methods, which includes a method of
visualizing relationships between keywords by determining the strength of the association
between words called concept linking or term map.
Keywords: Keywords, Keyword categories, Statistical methods.
INTRODUCTION
he Internet originated in the early 1960s. Initially it served as a communication medium
for the military, later it was used by universities to share scientific knowledge, but its use
was very difficult. The change came thanks to Tim Bernerser Lee, an employee of the
European Organization for Nuclear Research (CERN), who simplified working with the
Internet for the average user by creating the World Wide Web in 1990 (Jurčík, 2017).
The World Wide Web (WWW) is the official term for the part of the Internet where information
is in the form of web pages called documents. Each document has its own specific address,
literally a Uniform Resource Locator (URL), that allows it to be found and displayed in
programs called a web browser (Berners Lee, et al., 1994).
At present, the Internet does not only serve to mediate communication and entertainment, but
the possibilities of the web space have begun to be used mainly by entrepreneurs, whether to
promote products or services, or directly on trading by the web, where they look for potential
customers. This procedure can be implemented only in cooperation with the customers
themselves (on the Internet, these are visitors to the selected website). It is the visitors who try
to satisfy their needs via the Internet by searching for various products and services. Initially,
the visitor was only oriented among dozens of websites, which did not present any
complications. There are currently more than a billion websites in the world. In so many
websites, everyone wants to be visible to search engines through the keywords that people
search for. Keywords are terms that people enter into search engines. Based on the keyword,
relevant web pages appearing that address the issue for the keyword you entered. Knowing the
1 University of Economics in Bratislava, Faculty of Economic and Informatics, Dolnozemská cesta 1,
Slovakia 2 University of Economics in Bratislava, Faculty of Economic and Informatics, Dolnozemská cesta 1,
Slovakia
T

252
ITEMA 2020
Conference Proceedings
keywords is especially important for the site owner, because it is through the keywords that
visitors come to the site, who can then perform a conversion on the site3.
THE IMPORTANCE OF KEYWORD ANALYSIS
Keyword analysis is a way to gain insight into market behavior. This is a detailed analysis of
words and phrases that are relevant to the selected area based on the focus of the site. (Binka,
2019).
Keyword analysis makes it easier to get to know your customers. The purpose of keyword
analysis is to identify the intent of the searcher through the keywords. This means identifying
words or phrases that the visitor enters into the full-text search engine. Performing keyword
analysis is important for every site owner. It is the first step in understanding user behavior.
However, applying the results found in the keyword analysis is more important, because
without incorporating the results, all the work is useless. Only when the keyword analysis
findings are incorporated can the web come to the forefront of search results. Keywords need
to be incorporated within the site, because it is through keywords that visitors come to the site.
PROCESS OF CREATING KEYWORDS
In the world of the Internet, a keyword is a word or phrase that is entered into a search engine
by an Internet visitor, such as Google, as a simplistic term for finding a comprehensive solution.
Keywords are the deciding factor in displaying a website's bidding on a search engine. After
entering a keyword into a search engine, the search engine will show us the search result, i.e. a
list of websites that match the content of the keyword.
The position of each website in the list of search results is determined by the search engine's
ranking, so the smaller the position number, the better the website is ranked for that keyword.
It is natural that every website strives to achieve the best result in its area of interest. Ideally, it
ranks first in search results after entering keywords that are relevant to the industry. However,
there is only one first position, so we also consider the position in the top ten results to be a
good result. The top ten means that the webpage appears right on the first page of search results
in the search engine.
Why is position so important? Because more website traffic means more leads for the site
owner, which in turn increases conversions. If a website ranks higher in search results, traffic
will be higher. Search engine search analysis speaks for itself. The searcher usually clicks on
the link (website) from the first page that the search engine offers him after entering the
keyword. In general, therefore, a smaller number of website positions will ensure more traffic.
For this reason, knowing the keywords for any website is the starting point for gaining potential
visitors. Keyword collection is the first step in keyword analysis.
The second step is to clean up your keywords. In the keyword cleanup process, duplicate
keywords need to be removed in the first phase, then zero-search keywords and irrelevant
keywords need to be removed. The principle of the third step, keyword categorization, is to
3 The conversion is the required action that the visitor will perform on the website, it can be the execution of
the order, registration on the website, filling in the contact form, filling in the survey, registration in the
newsletter, etc. What will be considered a conversion on a particular site is set by the site owner individually
according to their own business goals. In the e-shop, the conversion in most cases is considered to be an
online order, filling in a contact form, filling in a survey, registering for a newsletter, etc.

253
KEYWORD ANALYSIS WITH USING STATISTICAL METHODS
categorize keywords into the categories we create. In each keyword analysis, the categories
differ, depending on the area analyzed. For products, it can be a division of keywords into
categories such as price, color, quality, type of product. The individual categories in which we
classify keywords should be as specific as possible and clearly distinguishable from the rest of
the categories. Keyword categorization is one of the most important parts of the whole analysis
process. The reason is precisely that the created categories serve as a basis for creating the
information architecture of the entire website. It is the information architecture of the website
that significantly influences the position of the website in search results.
The practical part of the paper is mainly focused on the categorization of keywords using
statistical methods. The last step in keyword analysis is to interpret the results. That means an
explanation of the procedures used and the conclusions we have reached.
CONCEPT LINKING
Creating a link between concepts and data is one of the most important and difficult steps in
the research process (Angot, Milano, 2001). To understand the relationships between words
based on the common occurrence of words in a document, there is a graph called concept links
or term map (Chakraborty, Pagolu, Garla, 2014). Concept linking or term map is a term for a
graph that shows the specific strength of the association of words on the edge with a word in
the middle. The association is shown on the graph by lines. The thicker line represents a
stronger association. The strength of the association is calculated as follows:
𝑠𝑡𝑟𝑒𝑛𝑔𝑡ℎ = log𝑒(1
𝑃𝑟𝑜𝑏𝑘) (1)
where,
𝑃𝑟𝑜𝑏𝑘 = ∑ 𝑃𝑟𝑜𝑏 (𝑟)𝑟=𝑛𝑟=𝑘 (2)
whereas,
𝑃𝑟𝑜𝑏 (𝑟) = [𝑛!
[𝑟! (𝑛−𝑟)!] 𝑝𝑟(1−𝑝) (𝑛−𝑟)] (3)
A – the word in the middle of the graph
B – the word on the edge of the graph
n = number of documents (nu. of phrases), in which we can find term B
k = number of documents, in which we can find both of terms A and B
p = k/n = the probability that the expression A occurs in conjunction with the expression B,
provided that they are independent of each other.
FUTURE RESEARCH DIRECTIONS
The first step in keyword analysis is to gather keywords. The area of analysis depends on the
focus of the sold assortment of the given customer. We decided to analyze the area of jewelry.
When collecting keywords, we used various online marketing tools at our disposal, such as:
the website of the customer for whom we processed the analysis, the websites of competitors,
discussion forums, social networks and various other resources dedicated to the field of
jewelry. In the keyword cleanup process, we removed duplicate keywords, deleted zero-search
keywords, and irrelevant keywords. The goal of categorization is to categorize your keywords,
with the most similar words within one category. We categorized keywords using the statistical
software SAS Text Miner. By creating a concept linking graph or term map, which allows the
display of word associations, we have reached the following results:
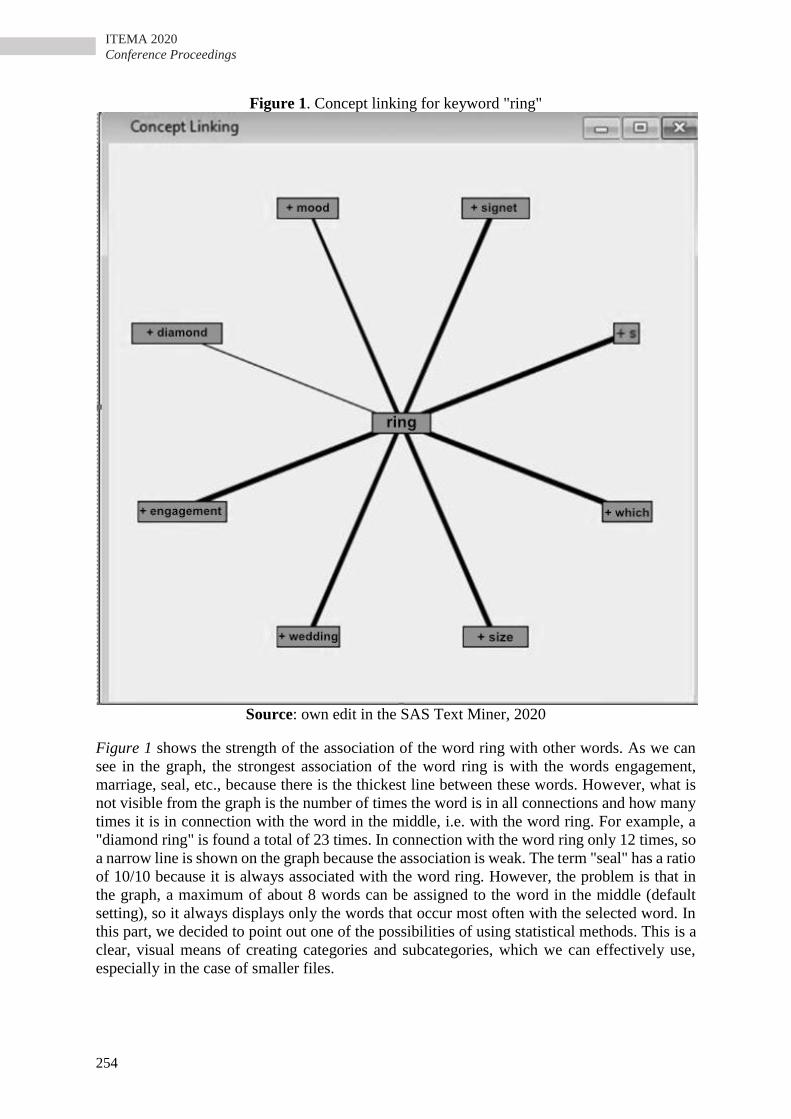
254
ITEMA 2020
Conference Proceedings
Figure 1. Concept linking for keyword "ring"
Source: own edit in the SAS Text Miner, 2020
Figure 1 shows the strength of the association of the word ring with other words. As we can
see in the graph, the strongest association of the word ring is with the words engagement,
marriage, seal, etc., because there is the thickest line between these words. However, what is
not visible from the graph is the number of times the word is in all connections and how many
times it is in connection with the word in the middle, i.e. with the word ring. For example, a
"diamond ring" is found a total of 23 times. In connection with the word ring only 12 times, so
a narrow line is shown on the graph because the association is weak. The term "seal" has a ratio
of 10/10 because it is always associated with the word ring. However, the problem is that in
the graph, a maximum of about 8 words can be assigned to the word in the middle (default
setting), so it always displays only the words that occur most often with the selected word. In
this part, we decided to point out one of the possibilities of using statistical methods. This is a
clear, visual means of creating categories and subcategories, which we can effectively use,
especially in the case of smaller files.

255
KEYWORD ANALYSIS WITH USING STATISTICAL METHODS
CONCLUSION
Using a statistical method to visualize the association of keywords through the concept linking
graph, we created several categories. It was through categorization of keywords that we created
a proposal for an information structure for the website owner. One of the main categories was
the Rings category, which contained subcategories such as engagement rings, diamond rings,
etc. In the same way as we mentioned above, we also created categories such as Chains,
Earrings, etc.
After incorporating the findings from the keyword analysis, the site for which we developed
the keyword analysis moved to a better position in the search results, which is the result of each
keyword analysis. Better positions in search results will ensure higher conversions for the
website, which resulted in an increase in the number of orders and a consequent increase in
turnover, respectively profit. Because each website aims to increase conversions, we can say
that we've met the goal of keyword analysis for the selected website.
This paper highlights the growing importance of using less traditional statistical methods that
focus on textual or unstructured data. The issue of representation and categorization of
keywords is currently the subject of much research and its use is very current in various fields.
ACKNOWLEDGMENT
This research was supported by the project VEGA 1/0193/20 Impact of spatial spillover effects
on innovation activities and development of EU regions.
REFERENCES
Angot, J. & Milano, P. (2001). Linking concepts and data. In Thiétart, R. Doing management
research (pp. 132-146). London, GB: SAGE Publications Ltd. doi:
10.4135/9781849208970
Berners-Lee, T., Cailliau, R., Luotonen, A., Frystyk Nielsen, H. & Secret, A. (1994). The
world-wide web. Communications of the ACM, 37.8: 76-82. ISBN: 0002-0782/94/0800.
Binka, M. (2019). Analýza klíčových slov: Návod krok za krokem. první vydání, Brno,
Česká republika.
Feldman, R. & Sanger, J. (2007). The Text Mining Handbook: Advanced Approaches in
Analyzing Unstructured Data. Cambridge, GB: Cambridge University Press. 410 p. ISBN
978-0-521-83657-9.
Chakraborty, G., Pagolu, M. & Garla, S. (2013). Text mining and analysis: practical methods,
examples, and case studies using SAS. North Carolina, USA: SAS Institute Inc., Cary.
ISBN 978-1-61290-551-8
Jurčík, M. (2017). Berners-Lee – Tvorca World Wide Webu, Goldman, Vydavateľstvo
MEDIAGE.


257
GREENHOUSE GAS EMISSIONS PRODUCED IN AGRICULTURE
SECTOR IN EU
Mariana Dubravská1
Elena Širá2
DOI: https://doi.org/10.31410/ITEMA.2020.257
Abstract: Each economy must adapt its activities to the protection of the environment. It is
now an essential part of everyday life, in the face of various climate changes. The Europe 2020
strategy sets out a set of objectives in the EU, including those promoting environmental
sustainability, called sustainable growth. The aim of the paper is to determine, if the
performance of the country, in the area of greenhouse gas emissions reduction is adequate to
the strategy Europe 2020. In the analysis of greenhouse gas emission reductions, we will also
focus on the agriculture sector and compare the development over time with the development
in other EU countries. The analyzed period is 10 years, from 2009 - 2018. The article
investigated the performance of greenhouse gas emissions in the example of EU (including the
Great Britain) countries.
Keywords: EU, Greenhouse gas emissions, Agriculture, Europe 2020.
INTRODUCTION
n today's world, sustainability issues are becoming more emergent. A common attribute
among the different approaches to defining this concept is the orientation towards the
future. The sustainability economy is usually based on the idea of resource efficiency.
Because a sustainable economy is about a long-term future that is largely unknown. It is
therefore necessary to answer questions, that can ensure the long-term stability and growth of
the country.
The concept of sustainable development is quite dynamic. This means that this issue can be
explored from several perspectives (Sinakou et al. 2019). From the point of view of most
theoretical approaches, there are three components to the issue of sustainable development:
environmental, economic and social. Of these three aspects, the environmental dimension of
sustainability has so far received the most attention. If people want to live in a prosperous
country with a healthy environment, the main trends of today's world need to be addressed
(such as changes in demography, changing consumer patterns, social change, changing the use
of natural resources and increasing pressure on natural resources and ecosystems, etc.). which
may worsen the situation.
1 Department of Economics and Economy, Faculty of Management, University of Prešov, 080 01 Prešov,
Slovakia 2 Department of Economics and Economy, Faculty of Management, University of Prešov, 080 01 Prešov,
Slovakia
I

258
ITEMA 2020
Conference Proceedings
THEORETICAL BACKGROUND
Europe 2020 and Sustainable growth
In 2010, the European Commission officially issued a Europe 2020 Strategy for Smart,
Sustainable and Inclusive Growth. It succeeds the Single European Market program (1986-
1992) and the Lisbon Strategy (2000 - 2010), decided by the European Council on 26 March
2010, chaired by President Herman Van Rompuy. The Lisbon Strategy, from the substantive
perspective, was not a new initiative, as before there had been attempts to introduce various
processes in order to recover and reorganize the functioning of the EU (Stec, Grzebyk, 2018).
The Lisbon Strategy aimed to transform Europe into the most competitive economy in the
world (Silander 2019), but according to some problem areas and other problems that arose
during implementation, it was not as successful as expected. The Europe 2020 strategy is the
EU strategy for sustainable and inclusive growth, for fighting the structural weaknesses of the
European economies, and for improving their competitiveness. (Radulescu et al., 2018)
The Europe 2020 strategy set out the main goals to be achieved in the EU countries by 2020.
It is up to the Member States to take action at national and regional level to try to achieve these
goals (Radulescu et al. 2018). In order to guide member states' efforts and manage progress,
only a limited number of headline targets had to be set (Abad-Segura, González-Zamar,
Belmonte-Ureña, 2020). These targets are representative, measurable, able to reflect the
diversity of situations in the Member States and based on sufficiently reliable data for
comparison purposes (Barroso 2010). In order to ensure that each Member State adapts the
Europe 2020 strategy to its specific situation, the Commission proposes that EU objectives be
reflected in national targets and trajectories. For each of these growths, targets have been set.
Some targets are the same for all member states. Other targets are adapted to the conditions of
individual member countries, respecting the specifics of the economy. And the last group
consists of targets, where all EU countries participate, according to their possibilities, in
fulfilling the targets and achieving the set value by aggregate.
This strategy focuses on three key areas. They are sustainable, inclusive and smart growth.
(Širá 2017) Sustainable growth is explained as a set of measures aimed at promoting a greener
and more competitive, resource-efficient economy (Witkowska-Dąbrowska, 2018).
Sustainable growth means building a sustainable and competitive resource-efficient economy
and strengthening competitiveness. This approach will help the EU prosper in a low-carbon,
resource-constrained world, while preventing environmental degradation, biodiversity loss and
unsustainable resource use (Barroso 2010).
Sustainable growth through the transition to a greener economy refers to building a European
economy of resource efficiency and sustainability (Adamišin et al. 2016), and staying global
competitive based on greener technologies. The main themes addressed by this strategy are
climate, energy, mobility and competitiveness. This requires innovative European political
enterprise to promote competitive entrepreneurship, new network businesses and a consumer
culture that values resource efficiency and a greener, low-carbon economy. (Silander 2019).
The Commission stated the importance of continued open trade of exports and imports but also
that Europe had to become more competitive and with higher productivity of partner states
(Anastasiou, Marietta, 2020). Europe must also continue its early initiatives to become a global
green economic actor by pushing for green technologies to safeguard resource efficiency. The
push for green technologies would lead to fulfilled climate change goals, with significant

259
GREENHOUSE GAS EMISSIONS PRODUCED IN AGRICULTURE SECTOR IN EU
decreased emissions, but would also open up for a transition to a new environmentally friendly
economy of new innovations, products and services that all together would create new jobs and
a growing economy. A transition to a greener economy would also lead to lowered costs for
import of expensive oil and gas and would be beneficial for European security because of
lowered dependency on specific foreign governments. (Barroso 2010).
Sustainable growth would be approached based on three climate change and energy targets.
The so-called 20-20-20 targets (Stec, Grzebyk, 2018) set out by the EU include:
reducing greenhouse gas emission by 20 percent,
increasing renewable energy in gross final energy consumption by 20 percent,
increasing energy efficiency by 20 percent. (Barroso 2010).
Such targets not only provide for important measures against ongoing climate change, but also
provide new jobs in a transformed, greener economy with green products and services and
makes the EU become a green, global competitive actor (Silander 2019). This sustainable
growth will require the implementation of countries' emission reduction commitments in a way
that maximizes benefits (Stăncioiu, Costea-Dunărinţu, Păduraru, 2017) and minimizes costs,
including through the dissemination of innovative technological solutions. In addition, EU
countries should focus on decoupling growth from energy use and becoming more resource-
efficient economies, which will not only give Europe a competitive advantage but also reduce
its dependence on foreign sources of raw materials and commodities (Barroso 2010).
Agriculture
Greenhouse gas emissions from agriculture, including crop and livestock production, forestry
and associated land use changes, are responsible for a significant fraction of anthropogenic
missions, up to 30% according to the Intergovernmental Panel on Climate Change. (Tubiello
et al. 2013) Among the important issues for agriculture's sustainability is greenhouse gas
emissions, and their impact on climate. Whereas agriculture can benefit from a warmer climate
in some parts of the world through longer growing seasons, agriculture could also be negatively
affected in many regions by drought, flooding, pests and/or diseases. In addition, greenhouse
gas emissions represent an indirect economic loss for the farmers (Verge, De Kimpe,
Desjardins, 2007).
Globally, the emissions of carbon dioxide, methane and nitrous oxide from agriculture account
for approximately one-fifth of the annual increase in radiative forcing, and for one-third when
land use changes are included. The agricultural sector contributes with significantly % of the
total anthropogenic emissions of CH4 and N2O. Land use change, crops and cropping systems
have various effects on the weathers (Verge, De Kimpe, Desjardins, 2007).
Three steps according to Franks & Hadingham (2012) are required to successfully and
efficiently reduce greenhouse gas emissions from agriculture:
identification of the most greenhouse gas polluting farms,
determining appropriate mitigation options for these farms,
selection between these options on the basis of their cost effectiveness.
Carbon footprints of a sample of farms together with an analysis of the Kyoto Protocol show
the difficulties encountered at each step. These difficulties are caused by:

260
ITEMA 2020
Conference Proceedings
failure to agree which functional unit to use to measure GHG emissions and pollution
swapping;
weaknesses in the Kyoto Protocol's territorial/production-based accounting methodology,
lack of cost-effectiveness data (Franks, Hadingham, 2012).
METHODOLOGY
The aim of the paper is to determine, if the performance of the country, in the area of
greenhouse gas emissions reduction is adequate to the strategy Europe 2020. We assessed the
fulfilment of the goal set out in the section of sustainable growth in the Europe 2020 strategy.
The goal set the reducing greenhouse gas emission by 20 per cent compared to year 1990.
Because the strategy Europe 2020 is the strategy obligatory for all EU member states, we
analyzed the example of all EU countries (including the Great Britain). The analyzed period is
10 years, from 2009 - 2018.
In the analysis of greenhouse gas emission reductions, we will also focus on the agriculture
sector and compare the development over time with the development in other EU countries.
Based on the approaches of various authors, we have elaborated theoretical background. These
characterize the researched area and define the goal of the work. When processing the next part
of the paper, we worked with data from Eurostat.
RESULTS AND DISCUSSION
In the previous section, we pointed out the importance of sustainability, especially in the long
term and for maintaining the current state for the future, and its improvement in areas where
this is possible. The environment and its protection are an area regulated by legislation. This
area and the possible damage in it, have a far-reaching impact on many other areas of people's
lives. Therefore, it is sustainable growth dedicated to the environment, which is an important
area that has also come to the head of the Europa 2020 strategy. It is a commitment for all EU
member states to support improvements in this area, as well as various innovations sparingly
to the environment.
The inclusion of resource efficiency and a low-carbon society among European policy
priorities is the result of the recognition, that the prevailing model of economic development
based on the fluent growth of resource use and harmful emissions, is unsustainable in the long
run. (Chovancová 2015)
Rising greenhouse gas emissions are causing increased concentrations of these gases in the
atmosphere. This in turn causes the earth's surface to overheat, leading to climate change. This
is the physical side of the problem of climate change. This problem can also be seen from a
socio-economic point of view. In this case, it is the relationship between the economy and the
emissions generated. The economy produces greenhouse gas emissions mainly through various
combustion processes, which are necessary to obtain the energy needed in the production
process. (Habrman 2012)
The Europa 2020 strategy has set as one of the goals of sustainable growth a reduction in
greenhouse gas emissions of at least 20 % compared to the values achieved in 1990. These
values for the EU countries in the period 2009 - 2018 are stated in Table 1. The aim is for all
EU states to had the values for this indicator of 80 or lower in 2020. The years in which the
individual countries met the set value are indicated in the table.

261
GREENHOUSE GAS EMISSIONS PRODUCED IN AGRICULTURE SECTOR IN EU
Table 1. Reduction of greenhouse gas emissions in % of terms compared to 1990
2009 2010 2011 2012 2013 2014 2015 2016 2017 2018
Belgium 87,61 92,63 85,76 83,61 83,48 79,77 82,81 81,96 82,14 82,67
Bulgaria 57,18 59,74 64,88 59,93 54,78 57,74 60,93 58,52 60,88 57,16
Czechia 69,75 71,07 70,28 68,14 65,46 64,41 65,13 66,06 65,56 64,82
Denmark 90,58 90,89 83,78 77,52 79,88 74,35 70,66 73,74 70,67 70,69
Germany 74,05 76,64 74,73 75,25 76,68 73,49 73,8 74,17 73,22 70,44
Estonia 41,18 52,3 52,48 49,89 54,46 52,5 45,22 48,98 52,26 49,98
Ireland 113,15 112,47 104,76 105,23 105,41 105,34 109,56 113,34 113,29 113,6
Greece 120,39 114,48 111,82 108,44 99,42 96,53 92,98 89,74 93,62 90,84
Spain 130,96 126,21 126,38 123,77 114,87 115,77 119,83 116,51 121,49 119,74
France 93,64 94,78 89,76 89,78 89,96 84,41 85,28 85,44 86,35 83,1
Croatia 88,77 87,51 86,55 80,99 76,7 74,34 75,62 76,15 78,71 75,23
Italy 98,19 100,44 98,12 94,43 87,63 83,71 86,3 85,8 85,05 84,41
Cyprus 166,42 161,52 156,65 147,73 135,68 141,56 142,01 151 155,75 153,81
Latvia 43,38 47,6 44,62 43,97 43,76 43,26 43,41 43,55 43,94 45,95
Lithuania 41,68 43,44 44,67 44,59 42,09 42,02 42,64 42,77 43,24 42,64
Luxembourg 97,71 102,38 100,82 98,04 93,98 91,21 88,67 87,98 90,88 94,16
Hungary 69,04 69,43 67,72 63,62 60,64 61,33 64,95 65,48 68,25 67,82
Malta 114,59 118,84 119,43 126,67 115,91 118 94,18 83,84 93,45 96,14
Netherlands 93,84 99 92,95 91,04 90,96 87,73 91,63 91,57 90,78 88,58
Austria 103,39 109,19 106,41 102,82 103,25 98,68 101,6 103,05 106,17 102,66
Poland 83,13 87,1 86,9 85,35 84,64 82,02 82,73 84,56 87,7 87,42
Portugal 125,57 118,96 116,78 113,69 110,69 110,82 118,01 115,32 123,78 118,9
Romania 51,64 50,11 52,03 50,66 46,83 46,96 47,08 46,29 47,39 46,84
Slovenia 105,09 105,2 105,23 102,21 98,51 89,22 90,18 94,69 93,47 94,35
Slovakia 62,24 63,25 62,3 58,85 58,39 55,6 57,04 57,72 59,31 59,16
Finland 96,18 107,11 96,8 89,12 89,8 84,01 79,06 83,16 79,59 81,41
Sweden 83,56 91,82 86,07 82,01 79,79 77,4 77,11 76,99 76,52 75,28
UK 77,67 79,33 73,68 75,63 73,97 69,03 66,9 63,76 62,7 61,59
Source: own procession according to Eurostat
We can see, that some countries have the values of this indicator below the limit set in the
Europe 2020 strategy throughout the observed period. These are the Baltic countries, then the
V4 except Poland, Romania, Bulgaria and Germany. As the second group of countries, there
are countries where during the analyzed 12 years, at least in some years, most often in recent
years, values below the recommended limit were reached. These are Croatia, Belgium,
Denmark, Finland, Sweden and the United Kingdom. The remaining countries have values
higher than the recommended 80 %. On the positive side, however, we can see an effort in
these countries to reduce these unfavorable values, such as in Malta, Slovenia, Italy and
elsewhere. Cyprus (154 %) and Spain (126 %) have the highest average values over the period.
On the contrary, the lowest average values were reached in Estonia (50 %) and Romania (51
%).

262
ITEMA 2020
Conference Proceedings
The next table compares the volume of greenhouse gas emissions in agriculture. For better
comparability of EU countries, we converted the data to % of the total number. In this
statement, we see big differences between countries.
Table 2. Greenhouse gas emissions in agriculture in %
2009 2010 2011 2012 2013 2014 2015 2016 2017 2018
Belgium 8,15 7,65 8,20 8,22 8,27 8,87 8,56 8,52 8,64 8,48
Bulgaria 11,11 11,35 9,08 10,12 11,97 12,50 11,71 12,99 12,30 13,00
Czechia 5,79 5,56 6,12 6,28 6,49 6,65 7,00 7,02 6,90 6,43
Denmark 16,46 17,03 19,02 20,02 18,99 20,87 20,29 19,51 21,10 20,14
Germany 7,24 6,90 7,25 7,25 7,23 7,72 7,73 7,54 7,61 7,65
Estonia 9,13 7,40 7,63 8,42 7,55 7,42 9,10 8,15 7,56 7,99
Ireland 26,76 26,59 27,79 28,42 29,77 29,90 29,06 29,42 29,58 30,59
Greece 7,01 7,65 7,64 7,75 8,31 8,06 8,55 8,89 8,54 8,72
Spain 11,29 11,91 11,65 11,46 12,49 13,06 12,88 13,43 13,24 13,39
France 16,59 16,11 16,92 16,91 16,85 18,30 17,87 17,63 17,44 17,84
Croatia 13,96 14,48 14,15 14,51 14,80 15,05 14,33 14,03 13,65 14,55
Italy 6,60 6,39 6,56 6,82 7,49 7,82 7,65 7,79 7,47 7,72
Cyprus 5,40 5,83 5,96 6,06 6,19 5,70 5,78 5,50 5,78 5,94
Latvia 25,92 19,99 22,30 26,86 24,35 18,59 20,71 24,24 27,21 19,85
Lithuania 33,37 39,55 38,71 40,25 39,68 39,00 30,66 27,47 25,98 26,10
Luxembourg 5,83 5,48 5,51 5,57 6,04 6,40 6,82 7,21 7,10 6,68
Hungary 9,51 9,37 9,93 10,79 11,92 12,58 12,33 12,51 12,13 12,20
Malta 2,39 2,28 2,16 2,07 2,27 2,23 2,99 3,41 3,00 2,99
Netherlands 8,67 8,20 8,61 8,67 8,91 9,36 9,28 9,42 9,51 9,44
Austria 9,54 8,98 9,37 9,57 9,38 10,08 9,78 9,79 9,48 9,79
Poland 8,79 8,11 8,38 8,52 8,83 8,90 8,55 8,47 8,66 8,80
Portugal 11,03 11,26 11,44 11,43 11,62 12,24 11,17 10,84 8,40 11,12
Romania 18,79 17,48 16,76 17,34 19,85 20,10 20,34 21,03 20,21 21,66
Slovenia 12,94 12,63 12,40 12,75 14,99 10,20 10,35 9,89 10,01 9,70
Slovakia 6,26 5,96 6,37 7,13 7,65 8,03 7,69 7,80 7,19 7,29
Finland 19,32 12,53 14,35 17,46 14,96 17,68 18,15 16,17 17,36 14,22
Sweden 40,22 35,29 41,89 52,59 52,13 53,68 58,73 80,83 72,87 69,39
UK 6,89 6,75 7,35 7,07 7,21 8,03 8,20 8,65 8,94 9,04
Source: own calculations according to Eurostat
While in some countries the values of greenhouse gas emissions in agriculture are below 10 %
(Belgium, the Czech Republic, Germany, the Netherlands, Malta, Slovakia, the UK and others),
in other countries the values are significantly higher. For example, Sweden has the highest
values, around 70 %, then Ireland has values of about 30 %. Denmark, Lithuania and Romania
still have values of 20 %. At the same time, these countries (highlighted in color) did not
achieve exceptionally high values at all in terms of overall greenhouse gas emissions in tones
among other countries.

263
GREENHOUSE GAS EMISSIONS PRODUCED IN AGRICULTURE SECTOR IN EU
Graph 1. Total greenhouse gas emissions in thousands of tones
Statistical overview of achieved values of greenhouse gas emissions in thousands of tones in
EU countries in the period 2009 - 2018 is in graph 1. From the graph, we can see that the
countries with the largest volume of greenhouse gas emissions are Germany, UK, Italy and
France. The countries with the lowest volume of greenhouse gas emissions were Malta, Cyprus
and Latvia. Between the EU countries are quite a great difference. It is caused by the size of
the country, the amount of industry in the country and by other factors.
CONCLUSION
The Europe 2020 strategy is a strategy for smart, inclusive and sustainable growth. The greener
economy is, according to climate changes and environmental protection, nowadays a priority
for the most countries. EU countries, too. This strategy includes the elements of environmental
protection, too. The sustainable growth is focus on the reduction of greenhouse gas emissions,
too. This is the one of the three priorities of sustainable growth.
One of the three goals set the reducing greenhouse gas emission by 20 per cent compared to
year 1990. In the year 2018, approximately the half of the EU member states, fulfill this goal.
Some countries fulfill this goal for a whole analyzed period, some countries fulfill it in the last
years.
Agriculture is one of the oldest industries. It has a permanent position in each country. But in
recent years, its share of the country's GDP has been steadily declining. But this trend has not
spread to the field of greenhouse gas emissions. There are countries where the share of
greenhouse gas emissions in agriculture is significant (e.g. in Sweden), but overall, the country
does not have a large volume of greenhouse gas emissions.
We have tried to point out these peculiarities in the article, but there is still a need for further
analysis of this phenomenon. What may be the subject of further studies and research?
0
100000
200000
300000
400000
500000
600000
700000
800000
900000
1000000
Bel
giu
m
Bu
lgar
ia
Cze
chia
Den
mar
k
Ger
man
y
Esto
nia
Irel
and
Gre
ece
Spai
n
Fran
ce
Cro
atia
Ital
y
Cyp
rus
Latv
ia
Lith
uan
ia
Luxe
mb
ou
rg
Hu
nga
ry
Mal
ta
Net
her
lan
ds
Au
stri
a
Po
lan
d
Po
rtu
gal
Ro
man
ia
Slo
ven
ia
Slo
vaki
a
Fin
lan
d
Swed
en UK

264
ITEMA 2020
Conference Proceedings
ACKNOWLEDGMENT
This research was supported by the Scientific Grant Agency of the Ministry of Education:
VEGA No. 1/0082/19
REFERENCES
Abad-Segura, E., González-Zamar, M. D., & Belmonte-Ureña, L. J. (2020). Effects of Circular
Economy Policies on the Environment and Sustainable Growth: Worldwide Research.
Sustainability, 12(14), 5792.
Adamisin, P., Pukala, R., Chovancova, J., Novakova, M., & Bak, T. (2016). Fulfillment of
environmental goal of the strategy Europe 2020. Is it realistic; In 3rd International
Multidisciplinary Scientific Conference on Social Sciences and Arts, SGEM (pp.181-
190).
Anastasiou, A., & Marietta, P. (2020). Sustainable Development at the Frames of the Strategy
“Europe 2020”. Theoretical Economics Letters, 10(03), 443.
Barroso, J. M. (2010). Communication from the Commission EUROPE 2020 - A strategy for
smart, sustainable and inclusive growth. European Commission, Brussels
Franks, J. R., & Hadingham, B. (2012). Reducing greenhouse gas emissions from agriculture:
avoiding trivial solutions to a global problem. Land Use Policy, 29(4), 727-736.
Habrman, M. (2012). Štruktúrna dekompozícia emisií CO2 v slovenskej ekonomike. In
Economic analysis & policy group: working paper series, č. 6, 11 s. Bratislava: o.z.
SOLIM
Chovancová, J. (2015). Hodnotenie vzťahu medzi ekonomickým rastom a produkciou emisií
skleníkových plynov v krajinách V4 pomocou metódy decoupling. In Correspondence
conference EAEP 2015 (p. 134).
Radulescu, M., Fedajev, A., Sinisi, C. I., Popescu, C., Iacob, S. E. (2018). Europe 2020
implementation as driver of economic performance and competitiveness. Panel analysis
of CEE countries. Sustainability, 10(2), 566.
Silander, D. (2019). The European Commission and Europe 2020: smart, sustainable and
inclusive growth. In Smart, Sustainable and Inclusive Growth. Edward Elgar Publishing.
Sinakou, E., Boeve-de Pauw, J., Van Petegem, P. (2019) Exploring the concept of sustainable
development within education for sustainable development: implications for ESD
research and practice. Environ. Dev. Sustain., 2019, 21(1), 1-10. DOI: 10.1007/S10668-
017-0032-8
Stăncioiu, A. F., Costea-Dunărinţu, A., & Păduraru, D. (2017). The European union strategy
for sustainable development in the energy sector. Calitatea, 18(S2), 431-434.
Stec, M., & Grzebyk, M. (2018). The implementation of the Strategy Europe 2020 objectives
in European Union countries: the concept analysis and statistical evaluation. Quality &
quantity, 52(1), 119-133.
Širá, E. (2017). The Europe 2020-sustainable growth in V4 countries. SGEM International
Multidisciplinary Scientific GeoConference, Vol 17, No.53, 893-899
Tubiello, F. N., Salvatore, M., Rossi, S., Ferrara, A., Fitton, N., & Smith, P. (2013). The
FAOSTAT database of greenhouse gas emissions from agriculture. Environmental
Research Letters, 8(1), 015009.
Verge, X. P. C., De Kimpe, C., & Desjardins, R. L. (2007). Agricultural production, greenhouse
gas emissions and mitigation potential. Agricultural and forest meteorology, 142(2-4),
255-269.

265
GREENHOUSE GAS EMISSIONS PRODUCED IN AGRICULTURE SECTOR IN EU
Witkowska-Dąbrowska, M. (2018). Evaluation of The Attainment of Environmental Goals in
Sustainable Growth Regarding Gas Emission and Energy Consumption, as Defined for
Poland in the Europe 2020 Strategy. Olsztyn Economic Journal, 13(4), 397-409.


267
HOUSEHOLD/INDIVIDUALS IN THE PROCESS OF PRODUCTION
AND DELIVERY OF ELECTRICITY FROM RENEWABLE ENERGY
SOURCES – PHOTOVOLTAIC SYSTEMS
Serjoza Markov1
DOI: https://doi.org/10.31410/ITEMA.2020.267
Abstract: First and foremost, the main inspiration for the specific problematics in this paper
is solar energy as clean and profitable energy for businesses in the Republic of North
Macedonia.
The question that arises as the basis is finding the reason why the progress in the sector of
renewable energy sources in this country is still slow and insufficient.
The results and conclusions of the research shall be achieved via comprehensive analysis, and
by finding the answer to the posed question through the: theoretical analysis, the inductive and
deductive methods, as well as description shall be used, whereas the techniques utilized shall
be questionnaires, interviews, observations.
By summarizing in one place all the theoretical and empirical aspects, we are finding the
answer to the main question asked: One of the possible reasons for this actual situation is the
fact that so far there is no possibility in this country for individuals to be involved in the process
of production and transmission of electricity in the energy system.
The goal is achieved in this paper through providing specific guidelines and suggestions
regarding the improvement of the legal framework in the Republic of North Macedonia,
emphasizing on benefits if the households are allowed to deliver their produced solar energy
and considering the possible ways to remove the determined obstacles for implementing this
idea.,
Keywords: Electricity, Solar energy, Republic of North Macedonia.
INTRODUCTION
olar energy is clean and profitable for businesses in R.N. Macedonia. Our country has
more than 280 sunny days a year and the production of one photovoltaic can reach 1500
kWh per year, which is far above the European average.
This is followed by the capacities that Macedonia has, hence according to the Low carbon
energy calculator2 for 2050, Macedonia, in 2050, can be supplied with electricity from fully
decarbonized sources, almost 60% of solar energy.
South East Europe Sustainable Energy Policy (SEE SEP) is a multi-annual program funded by
the European Commission that provides a technical analysis explaining the critical pathways
described in the 2050 Low Carbon Energy Calculator for South East Europe, a decision-making
tool developing technical and economic scenarios for the future of the decarbonization of the
energy sector in this region.
1 Law Company Cukic & Markov, 33A-01 Aminta Treti str., 1000 Skopje, Republic of North Macedonia 2 For complete calculator and web tool, please visit: http://www.see2050carboncalculator.net
S

268
ITEMA 2020
Conference Proceedings
The technical analysis of the SEE SEP – ‘Southeast Europe: The Road to the EU or the Road
to Nowhere? Energy Plan for 2050’, using the Calculator and expert opinions, predicts two
scenarios and includes ‘sliders’ for the development of changes in various economic sectors to
obtain results by 20503.
The roadmaps follow the first scenario focused on future planned coal developments and the
second scenario ‘Road to the EU’ where the countries of Southeast Europe (including R.N.
Macedonia) successfully operate in accordance with the EU regulations on environment and
climate change.
In R.N. Macedonia, although there is evident progress in the sector of renewable energy
sources, it is still slow and insufficient, and one of the possible reasons for that is the fact that
so far there is no possibility for individuals to be involved in the process of production and
transmission of electricity in the energy system.
Although so far in our country there were several initiatives from different social actors,
institutions, and similar, still this idea for active involvement in the production from
photovoltaic systems and delivery/sale of such electricity by individuals, has not been realized
in practice, nor were made changes in such direction in the last Law on energy. Unlike the
individuals, the legal entities have different treatment and the same according to the applicable
law4 in the practice can be actively included, besides in the production at the same time also in
the delivery/sale of the produced solar energy through a premiums model and preferential
tariffs model.
1. POSSIBLE WAYS AND METHODS OF TREATMENT AND BENEFITS FOR
USING THE ‘SURPLUS’ ELECTRICITY PRODUCED BY HOUSEHOLDS
FROM PHOTOVOLTAIC SYSTEMS IN ACCORDANCE WITH THE
PERFORMED ANALYSIS5
Namely, as a possible way to stimulate such development is the very idea that individuals
without starting a company to be able to produce electricity from renewable energy sources
and deliver it directly to the system with the possibility of ‘settlement’ with the electricity
distributor.
Encouraging and activating the households to use the renewable energy sources could be
expected, if they are allowed in case they install, for example, photovoltaic panels, the
electricity, in addition to being able to use it for their own needs, to be able to hand it over to a
previously concluded contract to the operator/distributor or to sell it directly on the electricity
market.
Hence, it is necessary to find an appropriate applicable mechanism by which the surplus, which
was especially incurred by the producer, is regulated in a way that everyone would have benefit,
3 Dominković, D. F., Bačeković, I., Ćosić, B., Krajačić, G., Pukšec, T., Duić, N., & Markovska, N. (2016).
Zero carbon energy system of South East Europe in 2050. Applied Energy 4 Law on energy ‘Official Gazette of the Republic of Macedonia’ No.96/2018, 96/2019 5 ‘ Grid measurement in the Republic of Macedonia, possibilities, perspectives, examples-how to cleaner
energy?“ by Sonja Risteska, Analytica Think Tank, February, 2017. Before passing the last Law on energy,
‘Analytica’ participated with initiative the individuals to be allowed without starting a company to be
authorized producers and sellers of renewable sources electricity.
(http://www.analyticamk.org/images/2017/mrezno_merenje_a40ba.pdf)

269
HOUSEHOLD/INDIVIDUALS IN THE PROCESS OF PRODUCTION AND DELIVERY OF
ELECTRICITY FROM RENEWABLE ENERGY SOURCES – PHOTOVOLTAIC SYSTEMS
both distributors and suppliers, as well as the households themselves that are in the role of
producers.
1.1. Comparative analysis of applicable ways and methods for stimulating the
production and delivery of solar energy from households and feeding
(preferential) tariffs
There are several ways and methods used in Europe and America through which the production
and transmission of solar energy from households to the energy system are allowed,
encouraged, and stimulated.
These good and functional examples could find appropriate application in our country if the
same make sufficient efforts to overcome some already located obstacles, which the institutions
in the energy field refer to and use them as an excuse for the current situation.
Available options are the introduction of monthly, seasonal, annual, or kWh-credits indefinitely
from the unspent solar energy produced by households.
It is necessary to enable the users-individuals who produce their solar energy to be able to use
it at any time, and not only when it is generated (alternating/ depending on the weather
conditions). In such a way, on a monthly basis, the users are enabled to use at night the solar
energy produced during the day.
On an annual basis, the net kilowatt credit is shifting, allowing households to use solar energy,
which, for example, was produced in July and delivered to the system, in December.
A similar practice would exist with the periodic grid measurement (for example, every 6
months/one year).
What is also proposed and necessary, and which is already functioning in other European
countries, is the possibility for the household as a producer and consumer of solar energy to
hand over in the system the excessed electricity that it cannot use and, at the same time, to get
a credit on the bill that will be applied in terms of future electricity consumption.
Vice versa, if the household-consumer spent more than what was delivered to the system, then,
it would pay the same price as any other consumer (retail price / price of electricity for
households).
While, if the household manages to save the consumption, another option is in the case on the
date of the anniversary when the offset of spent/handed over there are excess production credits
left on the bill, the distribution company to be able to repay that credit at market (current price
per MWh on the open market) or at retail price, which depends on how this issue would be
regulated by law.
The idea is based on purely economic motives, but also on environmental benefits, and the
point is to first satisfy its own consumption, and only then to ‘bring back’ to the system.
This method can be defined as a collection mechanism that rewards individuals / owners of the
photovoltaic panels for the electricity they supply to the grid.
For example, if a household has a photovoltaic panel on the roof and is able to generate more
electricity than the household can use during the day and has built-in so-called smart two-way
meter that will turn backwards, would provide credits when the household consumes electricity

270
ITEMA 2020
Conference Proceedings
overnight or other periods when the electricity consumption exceeds the one which comes out
from the system.
In that case, the households would be billed only for their ‘grid’ use of the energy.
Another possible similar option is at the end of the billing period, if the electricity produced by
the photovoltaic system exceeds the consumption at the place of production based on the
agreement with the distributor, for the difference in the produced energy the household to get
credit, by which the electricity bill will be reduced, with the equivalent amount the next time.
Of course, in such options, the household must use a two-way electricity meter that measures
changes in the electricity flow, which means that it measures the consumption of electricity
(taken from the grid) and the amount of electricity delivered to the grid (produced by the
household).
A very specific example, which has been operating for a long time in California6, is the use of
energy by the user, which is determined by dynamics prices according to the function of the
purchase price of electricity. In this case the users' meters are programmed remotely to calculate
and read the value.
So, there can be a variable calculation of the prices of the excess energy produced by the system
according to this example for calculation at market price.
This way allows small systems to have zero annual net cost, if the consumer can switch to a
low-cost tariff while the electricity generation is at its peak then back to the grid, and not used
locally.
When electricity generation exceeds customer demand, excess power generation automatically
goes through the smart meter back into the grid by measuring "backwards" in order to be able
to credit the household bill.
At other times of the day, when household demand may be higher than what it produced, it
relies on additional quantities it takes from the grid.
The producers who have produced a net surplus of energy at the end of the twelve months can
receive payment for this energy under special utility tariffs.
When it comes to net payment in European countries, within the payments two models are used
for the payment of subsidies.
One of them is for the produced electricity, which is consumed at the place of production, and
the other for part of the produced electricity that is delivered to the grid.
The first model pays a premium for real-time electricity consumption, such as the Italian
model7, while the other is an integrated model applied in Germany. In Italy the received credits
6 Grid measurement in California (http://www.gosolarcalifornia.ca.gov/solar_basics/net_metering.php) 7 Ameli, N., Kammen, D.M. 2014. Innovations in financing that drive cost parity for long-term electricity
sustainability: An assessment of Italy, Europe’s fastest growing solar PVmarket. Energy for Sustainable
Development, 19, 130-137.

271
HOUSEHOLD/INDIVIDUALS IN THE PROCESS OF PRODUCTION AND DELIVERY OF
ELECTRICITY FROM RENEWABLE ENERGY SOURCES – PHOTOVOLTAIC SYSTEMS
for the difference between the supplied/spent have no limit on use regardless of the electricity
market fluctuations.
In this case, the households have an incentive to use their own produced energy because they
would not benefit from the type of profit made, but only in the form of savings in electricity
bills, which of course are significant.
1.2. Feeding (preferential) tariffs
Feeding (preferential) tariffs is a policy that encourages the production of electricity from
renewable energy sources in a country, on a commercial level and promotes certain ‘green’
technologies.
The feeding tariff is also an energy-supply policy, which is focused on supporting the
development of new renewable energy projects, offering producers long-term purchase
agreements (guaranteed, always by the country) of the sold electricity8.
In the feeding tariff, which is an older applicable model in contrast to the previously considered
options, it is specific that two electric meters are always needed.
2. RENEWABLE ENERGY SOURCES EMPHASIZING THE PHOTOVOLTAIC
SYSTEMS AND PARTICIPATION OF THE HOUSEHOLDS ACCORDING TO
THE R.N. MACEDONIA’S REGULATION
The applicable Law on energy9 in the R.N. Macedonia, among others, incorporates also the
Directive 2009/28/EC for promoting the use of renewable sources of energy.
According to this law, a producer of electricity from renewable sources can acquire the status
of a preferential producer of electricity from renewable sources, which gives him the right to
use a premium or preferential tariff.
The law gives the preferential producer the right to use a premium or preferential tariff, in a
manner and in a procedure prescribed by law, regulations and rules adopted based on this law
and state aid regulations, according to which the Energy and Water Services Regulatory
Commission10 is responsible for conducting and regulating the entire procedure.
The right to use a premium or preferential tariff is acquired through the application of
procedures based on the principles of objectivity, transparency and non-discrimination.
A producer of electricity from renewable sources that are connected to the electricity
distribution grid (meaning legal entities) can be represented on the electricity market by a
virtual electricity producer.
The preferential producer that uses premium is selected by conducting a tender procedure with
an auction for granting the right to use premiums for preferential producers.
8 NREL (National Renewable Energy Laboratory), A Policymaker’s guide to feed-in tariff policy design,
Technical report, July 2010, page 6 http://www.nrel.gov/docs/fy10osti/44849.pdf 9 Law on energy ‘Official Gazette of the Republic of Macedonia’ No.96/2018, 96/2019 10 https://www.erc.org.mk

272
ITEMA 2020
Conference Proceedings
An authorized producer who has acquired the right to use a premium for a certain power plant
cannot use a preferential tariff and has not guaranteed the purchase of the produced energy for
the same power plant by the electricity market operator.
The law defines the ‘premium’ as a form of financial support granted to a preferential producer
of electricity from renewable sources as an additional amount to the price achieved by selling
the produced energy on the electricity market.
‘Preferred electricity producer’ is defined as a producer of electricity from renewable sources
that uses one of the support measures established by this law.
Although these two legal definitions do not clearly and decisively exclude individuals as
possible preferential producers, still the bylaw and the manner of conceptualizing the use of
the state measures allude to the impossibility of involving households in the transfer/sale of the
energy produced from renewable sources.
This is evident from the definition of the term ‘household’, which according to the law
represents a consumer connected to an energy distribution system, who supplies or produces
energy for its own consumption in the household, but not for commercial or professional
purposes.
In R.N. Macedonia are currently used these measures as an incentive to generate electricity
from renewable energy sources and they are quite successful, although the quantities produced
in these ways are far from the potential of the country.
3. BENEFITS IF THE HOUSEHOLDS ARE ALLOWED TO DELIVER THEIR
PRODUCED SOLAR ENERGY TO THE R. N. MACEDONIA’S ENERGY
SYSTEM
The benefits of allowing households to transmit their electricity to the system are huge, and the
first and most important benefit is increased use of solar energy.
If R.N. Macedonia has the potential to produce 4.4. TWh in 2050, then the situation is clear,
the citizens and the individual households must be more actively involved in using the solar
potential that the state has.
Also, the second benefit is reduced pollution and participation in lower greenhouse gas
emissions through the use of photovoltaic systems as renewable energy sources, and the third
benefit is job creation and encouraging private investment.
‘The next benefit is the increase in demand for solar energy systems, which in turn creates jobs
for installers, electricians and manufacturers working in the solar supply chain’, the analysis of
‘Analytica Think-Tank’ indicated11.
‘The distributed solar systems can help avoiding significant investments in the infrastructure,
reduce the pressure on state-owned fossil fuel-based electricity generation when demand is at
its peak and at lower prices’, the analysis said.
11 Grid measurement in the Republic of Macedonia, possibilities, perspectives, examples-how to cleaner
energy?“ by Sonja Risteska, Analytica Think Tank, February, 2017

273
HOUSEHOLD/INDIVIDUALS IN THE PROCESS OF PRODUCTION AND DELIVERY OF
ELECTRICITY FROM RENEWABLE ENERGY SOURCES – PHOTOVOLTAIC SYSTEMS
The idea of these models is to encourage self-sufficiency of energy needs as an independent
entrepreneurial activity. The offset prescribed for independent generation and transmission of
solar energy has the added advantage, by the fact that the investments in the distribution grid
are more cost-effective than in the system with preferential tariffs. In this way, the awareness
of fulfilling the obligations to increase the share of renewable energy sources in the total energy
consumption for all, not only for the ‘big’ investors, would be further encouraged.
The increased awareness for rational use of electricity is also a benefit, as well as a lower load
on the grid.
Another possible advantage of such system, emphasized in the same analysis, is that when the
electricity market is fully open also for households, the electricity will be given to the buyer,
to be offset at the end of the year; how much he spent from the grid, how much his own, and
how much he gave in the system – and if he saved, such savings should be paid to him at a
market price.
4. OBSTACLES FOR INTRODUCING THE MODEL ALLOWING INDIVIDUALS
TO GENERATE ELECTRICITY FROM PHOTOVOLTAIC SYSTEMS AND THE
SURPLUS OF SOLAR ENERGY TO BE DIRECTLY DELIVERED IN THE
ENERGY SYSTEM
Although drastic changes may have been expected with the adoption of the latest Law on
energy in the R.N. Macedonia, the role of households as potential producers and sellers of the
produced solar energy remained unchanged. As potential obstacles for such condition, which
are previously located by several energy institutions and companies in R.N. Macedonia
according to the analysis12, the following can be pointed out.
4.1. Costs for the consumers
Expected is diversion of costs from consumers who use and sell solar energy to those who do
not. In R.N. Macedonia the price for the feeding tariffs that are paid, is paid by the final
consumers because it is included in their bills.
If they do not receive bills, in that case they would not pay grid fees, etc., so, the price for their
use of the grid will have to fall to other users, which increases the price of electricity for end
users. Hence, in adopting this measure, it is important to be introduced a payment of a grid fee
and of the ‘privileged’ users-producers.
This would mean that the bills would be made in such way that the distributor would charge
for the connection of the household to the grid, but not for the electricity delivered when the
household uses its own generated electricity.
4.2. Unprepared grid
The lack of grid readiness remains a common critical point for integrating the solar energy in
the grid.
12 ‘ Grid measurement in the Republic of Macedonia, possibilities, perspectives, examples-how to cleaner
energy?“ by Sonja Risteska, Analytica Think Tank, February, 2017, pp.23,24

274
ITEMA 2020
Conference Proceedings
However, if there are significant investments in the electricity sector in the future as a result of
the necessary upgrades, the proper investment and measures should ensure the integration of
renewable energy sources and solve the problems with the alternation. The voltage failures of
the grid and the return power in opposite direction could be a problem due to distributed solar
panels. However, in some cases the studies have shown benefits from delayed investments in
capacitor banks and resistive switches13. The distributed solar energy could even delay some
upgrades of voltage regulator, gearbox load, and capacitor devices by providing voltage
support and some kind of frequency regulation in combination with energy storage14.
4.3. Technical shortcomings
Technically, care must be taken on how will be performed the including of the households and
the introduction of the model of ‘settlement’ of produced-delivered electricity, so that the
electricity grid does not suffer from load. If the photovoltaic systems are in a location that is
not yet well connected to the distribution grid, grid failures are possible and expected15.
4.4. Calculation and including the Value Added Tax (VAT)
A possible problem is the calculation of VAT, i.e. how it will be charged, if the price at which
household buys electricity has VAT included, and the electricity that is delivered to the system;
if it is calculated as purchase price, and not as retail, is not subject to VAT.
Hence, the problem is how to settle the delivered/spent, if VAT must be included when
invoicing a bill.
CONCLUSION
With the drastic reduction of the price of solar and wind energy and the aging of the existing
energy infrastructure in the region, R.N. Macedonia, as well as the whole of Southeast Europe
faces the dilemma of whether to follow the path that relies exclusively on new coal
development, without any significant progress in solar or wind energy, or to accept the
challenge and advance towards EU accession using clean energy technologies and energy
efficiency measures.
The price of solar panels is expected to decrease from around 6,6€/W in 2002 to 0.9€/W in
2027.16
Renewable sources in the electricity sector, inspiring new and innovative approaches,
fundamentally change the policy and financial environment in terms of capacity expansion,
shifting to lower marginal costs.
Generally, the investments in new electricity supplies will be crucial to meeting the EU
Roadmap to reduce greenhouse gas emissions by 80% to the levels from 1990 until 2050.17
13 Gil, H. A., & Joos, G. (2006). For quantification of the value of the delayed capacity to the grid of the
distributed production. Power Systems, IEEE Transactions on, 21(4), 1592-1599 14 Southeast Europe: The Road to EU or the Road to nowhere? Energy plan for 2050: Technical analysis, 52 15 Sustavi poticanja za integrirane fotonaponske sustave, Andrea Brajko, Hrvatski operator tržišta energije
d.o.o. 16 Cost overview for 2015 EUR. Zheng, C., & Kammen, D. M. (2014). Innovative focused roadmap for a
sustainable global photovoltaic industry. Energy Policy, 67, 159-169 17 SEE SEP, Southeast Europe: The Road to EU or the Road to nowhere? Energy plan for 2050: Technical
analysis, 2016, 26

275
HOUSEHOLD/INDIVIDUALS IN THE PROCESS OF PRODUCTION AND DELIVERY OF
ELECTRICITY FROM RENEWABLE ENERGY SOURCES – PHOTOVOLTAIC SYSTEMS
Increasing the number of solar panels installed in the distribution system can also solve the
issues with the supply system and the lack of electricity.
With the increasing presence of distributed solar energy, further grid upgrades can be expected
to adapt to new technologies, as it is obvious that the grid needs upgrades for each new capacity.
Second, the distribution company can improve its revenues, as well as monitor electricity, in
parallel with the mentioned necessary investments in the grid and in the system.
This will enable future programs to satisfy the consumption or other forms of energy efficiency
interventions to be able to effectively reshape both the electricity supply and consumption
throughout the region18.
The roadmaps presented in the region can be contextualized within the global and European
trends, emphasizing the reduction of the price of renewable energy sources, the ability for
energy efficiency and renewable measures to create new jobs at a fast pace, and the possibility
of integration by using the new grid architectures that can make Southeast Europe a leader,
rather than lagging behind energy production and the deployment of technological
infrastructure.19
Following up on this, the study20 demonstrated and established the hypothesis that although
obstacles and problems such as reduced revenues for the country and distribution grid operators
are expected, the risk of price increase for end users, and the need to upgrade the grid over time
in order to receive such electricity; however, the practice shows that all these issues have
answers, that citizens should be given the right to be responsible for the supply of electricity
and to ‘help’ the system by supplying it with electricity at the peak.
The measure has been successfully implemented in the United States for decades, and is
spreading across Europe, so with the inevitable liberalization of the electricity market, which
should have happened until now, such measure will only be an added plus for households that
have opportunities and would like to produce the electricity they use.
All this would mean that such investments are possible and desirable for the households and in
accordance with the guidelines of the European Union, but of course, if proper development
policies are created within the country itself.
18 SEE SEP, Southeast Europe: The Road to EU or the Road to nowhere? Energy plan for 2050: Technical
analysis, 33 19 SEE SEP, Southeast Europe: The Road to EU or the Road to nowhere? Energy plan for 2050: Technical
analysis, 52 20 ‘ Grid measurement in the Republic of Macedonia, possibilities, perspectives, examples-how to cleaner
energy?“ by Sonja Risteska, Analytica Think Tank, February, 2017, 33,34


277
LEVELS OF SOME PRIORITY SUBSTANCES ON ADRIATIC SEA,
ALBANIA
Aurel Nuro1
Bledar Murtaj2
DOI: https://doi.org/10.31410/ITEMA.2020.277
Abstract: This study evaluated levels for organochlorine pesticides (DDTs, HCHs,
Heptachlors, Aldrins and Endosulfanes), their residues, polychlorinated biphenyls (PCB) and
poly aromatic hydrocarbons (PAH) in water samples of Adriatic Sea, Albanian part. Water
stations were chosen near the main river estuaries of Albania (Vjosa, Semani, Shkumbini,
Erzeni, Mati and Buna rivers). These rivers have catchment areas that cover almost all
Albania. First, agricultural, industrial and urban waste is transported in these rivers and after
that they finished in Adriatic Sea.
Water samples were analyzed for a five-year period from February 2015 to December 2019.
Liquid-liquid extraction was used to isolate chlorinated pollutants and a florisil column was
used for clean-up procedure. Analysis of organochlorine pesticides (according to Method EPA
8081B) and 7 PCB markers was realized using GC/ECD and RTX-5 capillary column. The
PAHs were isolated by liquid-liquid extraction technique and after sample concentration
qualitative and quantitative analyses were performed by the GC/FID technique.
Organochlorine pollutants were detected for all stations of Adriatic Sea because of new
arrivals by agricultural and industrial activity in river basins. The highest levels were found
near Shkumbini and Semani estuaries due to impact Myzeqeja agricultural area. New arrivals
from water irrigation and rainfall influence in found levels. Degradation products of pesticides
and volatile PCBs were found at higher levels for all samples analyzed. The levels of some
individual organochlorine pesticides were higher than EU and Albanian norms for Semani and
Shkumbini rivers. Also, PAHs were found at higher levels for Semani River because of
extracting-processing industry in Patos-Marinza area. Monitoring of organic pollutants in
water of Adriatic Sea should be continuous because of its importance in fishing, tourism,
recreation and Albania economy overall.
Keywords: Organochlorine pesticides; PCBs; PAH; Water analyzes; GC/ECD.
INTRODUCTION
lbania is a country located in the Balkan Peninsula in Southeast Europe. It is rich in
marine and surface waters. It faces the Adriatic Sea and the Ionian Sea that are part of
the Mediterranean Sea. The total length of the coastline is approximately 274 km, 178
km of which are covered by sandy beaches and the remaining by different landforms. The main
lagoons (Narta, Karavasta and Patoku lagoons) are formed in estuaries of rivers that flow in
Adriatic Sea. These water ecosystems are rich in flora and fauna. Fishing, tourism and ship
transport activity in marine waters have an important role in Albanian economy. The major
1 Department of Chemistry, Faculty of Natural Sciences, Tirana University, Blv. "Zog I", Nr. 25, Tirana,
Albania 2 Department of Chemistry, Faculty of Natural Sciences, Tirana University, Blv. "Zog I", Nr. 25, Tirana,
Albania
A

278
ITEMA 2020
Conference Proceedings
surface water resources are many lakes and rivers. Three main lakes of Albania are Shkodra
Lake, Ohrid Lake and Prespa Lake. The most important rivers are Drini, Mati, Ishmi, Erzeni,
Shkumbini, Semani, Osumi, Vjosa, Bistrica and Buna (Cullaj et al, 2005). Waters of these
rivers are in use mainly for producing electricity by hydropower plants and for water irrigation
in agricultural. Note that occasionally waters of rivers are polluted by urban and industrial
waste and by remains of agricultural pesticides and veterinary drugs. These pollutants end up
in the seawater. The main rivers of Albania flow in Adriatic Sea. Based on this fact, monitoring
pollution levels in marine and surface water samples must be continuous, especially recently
after rapid growth of tourism in Albania. Marine and surface water resources have a direct
impact on people health and present an important contributor to the country's economy too.
This is the reason that river waters must have additional attention in assessing their chemical
and microbiological parameters by responsible institutions. In this context, this study presents
concentrations of organochlorine pesticides, their residues, PCB markers and PAHs in water
samples of Adriatic Sea for a five-year period. Sampling stations were selected near the main
river estuaries (Vjosa, Semani, Shkumbini, Erzeni, Mati and Buna rivers) that discharge to the
sea. These rivers have catchment areas that cover almost all Albania so the arrival of new
pollutants is not excluded.
For more than 50 years (after the Second World War to 90’) organochlorine pesticides were
used widely in Albania against malaria vector and for agricultural purposes. The main
agricultural areas are located in the western of the country near Adriatic Sea. These fields are
covered mainly by the Vjosa, Semani, Shkumbini, Erzeni, Mati and Buna rivers and their
branches. The use of pesticides in Albania after 1990 decreased rapidly due to migration and
immigration of population. PCBs were not in use in Albania until 90’. They can be found only
in some electrical transformers that were used in the early 1990s, but they were reported in
many water ecosystems of our country because of atmospheric depositions. PAHs are
pollutants generated by automobiles transport, extracting/processing of oil industry, coal mine
and other industries. Forest burning and their natural background make them very often in
environment. Organochlorine pollutants (OCP and PCB) and PAHs have high stability, high
bioaccumulation capacity and the ability to spread out far away from the application
site. Generally, these compounds are difficult to degrade and can persist for many years in
particular in water ecosystems (Corsi et al, 2010; Nuro et al, 2012).
MATERIALS AND METHODS
Study areas
The study areas were river estuaries of Vjosa, Semani, Shkumbini, Erzeni, Mati and Buna
(Adriatic Sea, Albania). Water samples were taken two times per year in a five-year period
from February 2015 to December 2019. The sampling stations are presented in Figure 1.
2,5 liters of water were taken from each station in Teflon bottles. The sampling method was
based on UNEP/MED Wg. 128/2, 1997. Water samples were transported and conserved at
+4oC before their analysis.

279
LEVELS OF SOME PRIORITY SUBSTANCES ON ADRIATIC SEA, ALBANIA
Figure 1. Sampling stations in Adriatic Sea and the main rivers catchments in Albania
Treatment of water samples for pesticide and PCB analyzes
Liquid-liquid extraction was used for extraction of organochlorine pesticide and
polychlorinated biphenyls from marine water samples of Adriatic Sea. One liter of water and
30 ml n-hexane as extracting solvent were added in a separatory funnel. After extraction, the
organic phase was dried with 5 g of anhydrous Na2SO4 for water removing. A florisil column
was used for the sample clean-up. 20 ml n-hexane/dichloromethane (4/1) was used for elution.
After concentration to 1 ml, the samples were injected in GC/ECD (Lekkas et al, 2004; Vryzas
et al, 2009; Nuro et al, 2012).
Gas chromatography analysis of pesticides and PCBs
Organochlorine pesticides and PCBs were analyzed simultaneously using capillary column
model Rtx-5 (30 m long x 0.25 mm i.d. x 0.25 μm film thicknesses) on a gas chromatograph
HP 6890 Series Plus with μECD detector. Helium was used as carrier gas (1 ml/min) while
nitrogen as make-up gas (24 ml/min). The manual injection was done in split mode (1:50) at
280°C. The organochlorine pesticides detected were DDT-related chemicals (o,p-DDE, p,p-
DDE, p,p-DDD, p,p-DDT), HCHs (a-, b-, γ- and d-isomers), Heptachlor’s (Heptachlor and
Heptachlorepoxide); Aldrin’s (Aldrine, Dieldrine and Endrin) and Endosulfanes (Endosulfan
alfa, Endosulfan beta and Endosulfan sulfat). Analysis of PCBs was based on the determination
of the seven PCB markers (IUPAC Nr. 28, 52, 101, 118, 138, 153 and 180). Quantification of
OCPs and PCBs were based on external standard method (Vryzas et al, 2009; Lekkas et al,
2004; Nuro et al, 2014).

280
ITEMA 2020
Conference Proceedings
Treatment of water samples for PAH analyzes
Liquid-liquid extraction was used for extracting PAHs from marine water samples. One liter of
water and 30 ml dichloromethane as extracting solvent were added in a separator funnel. After
extraction, the organic phase was dried with 5 g of anhydrous Na2SO4 for water
removing. Extracts were concentrated to 1 ml using Kuderna-Danish and then were injected in
GC/FID for PAHs their quantification (Nuro et al, 2014; Gustafson and Dickhut, 1997).
Determination of PAH in water samples
Gas chromatographic analyses of PAH in water samples were realized with a Varian 450 GC
instrument equipped with a flame ionization detector and PTV detector. VF-1 ms capillary
column (30 m x 0.33 mm x 0.25 μm) was used to isolate and determine 13 most toxic PAHs
according to Albanian and EU norms. Helium was used as carrier gas with 1 ml/min. FID
temperature was held at 280°C. Nitrogen was used as the make-up gas (25 ml/min). Hydrogen
and air were flame detector gases with 30 ml/min and 300 ml/min, respectively. EPA 525
Mixture was used for qualitative and quantitative of PAH analyze. Acenaphthylene, Fluorene,
Phenanthrene, Anthracene, Pyrene, Benzo [a] anthracene, Chrysene, Perilene, Benzo [b]
fluoranthene, Benzo [k] fluoranthene, Indeo [1,2,3-cd] pyrene, Dibenzo [a, b] anthracene and
Benzo [g, h, i] perylene were determined in seawater samples. Quantification of PAH was
based on external standard method (Nuro et al, 2014; Gustafson and Dickhut, 1997).
RESULTS AND DISCUSSION
Marine water samples from Adriatic Sea (Albanian part) were selected near the six main river
estuaries that flow on it (from South to North: Vjosa, Semani, Shkumbini, Erzeni, Mati and
Buna rivers). The average data of a five-year period (2015–2019) are shown in this study to
understand their pollution impact on seawater. These rivers cover a large catchment area
including the main agricultural areas and the main cities as well as industrial areas of Albania.
Organochlorine pesticides, their degradation products and PCB markers were analyzed using
GC/ECD and GC/FID techniques.
Figure 2. DDTs in water samples of Adriatic Sea
0.00
5.00
10.00
15.00 4,4'-DDT
4.4-DDD
4.4'-DDE

281
LEVELS OF SOME PRIORITY SUBSTANCES ON ADRIATIC SEA, ALBANIA
Figure 2 shows DDTs (4,4’-DDT, 4,4’-DDD and 4,4’-DDE) in marine water samples of
Adriatic Sea located near river estuaries for Vjosa, Semani, Shkumbini, Erzeni, Mati and Buna
rivers. The higher DDT levels were found in Shkumbini river mouth water samples (13.7 ng/l)
and after that in Semani River (10.9 ng/l) because of new arrivals by Myzeqeja field that lie
near these rivers. Total of DDTs near Vjosa river mouth was lower (0.5 ng/l) compared with
other stations on Adriatic Sea. DDT pesticide was found partially on samples of Semani,
Shkumbini, Erzeni and Buna rivers. DDT was not detected in water samples of Vjosa and Mati
rivers. DDT degradation products (DDE and DDD) were found in high concentration for all
samples because of DDT previous use for malaria vector and agricultural purposes. DDT levels
were lower than 1 ng/l for all stations except for two samples in Semani rivermouth station
(2017) and three samples in Buna rivermouth station (2016, 2017 and 2018). For other stations
4,4’-DDT was lower than permitted level (0.01 ug/L) based on Albanian and EU norms.
Concentrations of Lindane and its isomers (alpha-, beta-, and delta-hexachlorocyclohexanes-
HCHs) are shown in Figure 3. Also, HCHs were found in higher concentrations in water
samples near Semani and Shkumbini river mouths (25.4 and 12.5 ng/l) while samples near Mati
and Vjosa estuaries were at lower concentrations (0.8 and 1.1 ng/l). Note that Lindane was
found only in 25% of all analyzed samples. beta-HCH was found to be the primary isomer for
all seawater samples. Its origin could be because of beta-HCH presence as an impurity in
Lindane formulations or because it’s physical – chemistry properties. HCH isomers could be
found because of Lindane previous use in agricultural or due to degradation of other pesticides.
HCH's arrival by urban waste it’s not excluded. For all stations, total of HCHs was lower than
permitted level of 0.04 ug/l conform to EU Directive 2013/39 and Albanian norms for surface
waters.
Figure 3. Lindane and its isomers in water samples of Adriatic Sea
Average concentrations of Heptachlors in seawater were shown in Figure 4. Heptachlors were
found in higher concentrations in water samples of Adriatic Sea near Shkumbini estuary (23.2
ng/l) and after that near Buna (12.0 ng/l) and Semani samples (4.6 ng/l). In the higher levels in
all analyzed samples were found Heptachlorepoxide, its degradation products. This fact is
connected with the previous use of Heptachlor. Levels of Heptachlors in some samples taken
near Shkumbini and Semani rivers were higher than EU Directive 2013/39 or Albanian norms.
0.00
5.00
10.00
15.00
20.00
25.00
30.00d-HCH
Lindane
b-HCH
a-HCH

282
ITEMA 2020
Conference Proceedings
Figure 4. Heptachlor’s in marine water samples of Adriatic Sea
Concentrations and profiles of Aldrines were shown in Figure 5. The higher levels of Aldrines
were for Semani River with 22.2 ng/l and for Shkumbini River with 19.9 ng/l. In fact, the higher
level of Aldrine in Semani River was connected with higher concentration of Dieldrin, while
in Shkumbini River in higher concentration was Endrin. This is connected with the time of use
for Aldrine in the agricultural areas near these rivers. Aldrins were found in lower levels in
water samples of Mati, Buna and Vjosa river mouths. Aldrines were found 2 times higher than
EU directive 2013/39 and Albanian norms for 44% of seawater samples near Semani and
Shkumbini rivers.
Figure 5. Aldrines in marine ater samples of Adriatic Sea
Averages of concentrations for Endosulfan in estuaries of rivers (Adriatic Sea) are presented
in Figure 6. Total of Endosulfan alpha, Endosulfan beta and Endosulfan sulfate were higher in
Buna (79.8 ng/l), Semani (75.6 ng/l), Shkumbini (59.6 ng/l) and Erzeni (51.3 ng/l) river
mouths. Note that Endosulfans were found at higher levels for some individual samples near
Buna (2015, 2017, 2018), Semani (2017 and 2018) and in Shkumbini river mouths (2018).
These data could be the result of Endosulfan’s punctual source in agricultural areas near these
0.00
5.00
10.00
15.00
20.00
25.00Heptachlorepoxide
Heptachlor
0.00
5.00
10.00
15.00
20.00
25.00Endrin
Dieldrin
Aldrin

283
LEVELS OF SOME PRIORITY SUBSTANCES ON ADRIATIC SEA, ALBANIA
ecosystems. It’s not excluded the recent use of Endosulfan in water basins of Buna, Semani,
Shkumbini and Erzeni rivers. Endosulfan could be in use in these areas under false trade name.
Endosulfan concentrations for water samples of Buna, Semani, Shkumbini and Erzeni rivers
were 5 to 10 times higher than permitted level based on EU Directive 2013/39. The presence
of Endosulfane in surface water samples must be lower than 0.005 ug/l.
Figure 6. Endosulfanes in water samples of Adriatic Sea
Figure 7. PCB markers in marine water samples of Adriatic Sea
Figure 7 shows the total PCB markers in water samples of Adriatic Sea near six river estuaries
for 2015–2019 periods. PCBs were found in all analyzed samples. They were found in this rate:
Semani (69.4 ng/l) > Buna (60.7 ng/l) > Shkumbini (60.2 ng/l) > Erzeni (50.5 ng/l) > Mati
(31.1 ng/l) > Vjosa (16.7 ng/l). The higher concentrations of PCBs in Semani, Shkumbini dhe
Buna rivers can be related to the elevated industrial activity in their water basins. For all water
samples, volatile congeners (PCB 28 and PCB 52) were found at higher level. This fact is
connected with the atmospheric deposition. For Semani, Shkumbini, Buna, and Erzeni rivers
were detected relatively high level of heavy PCB congeners (PCB 180) that is connected with
punctual sources of these pollutants. Some industries that can influence PCB levels are
0.00
50.00
100.00
Endosulfan sulfat
Endosulfan beta
Endosulfan alfa
0.00
20.00
40.00
60.00
80.00PCB 180
PCB 138
PCB 153
PCB 118
PCB 101
PCB 52
PCB 28

284
ITEMA 2020
Conference Proceedings
extraction and processing of oil industry (Semani Rivers) and metallurgical complex near
Elbasani (Shkumbini River). PCB concentrations for water samples of Vjosa, Semani and
Shkumbini rivers were comparable levels than the reported data on previous studies on the
same stations (Murtaj et al. 2014; Como et al. 2013, Nuro et al. 2017).
Figure 8 shows totals of 13 PAHs according to EPA 525 Method in water samples of Adriatic
Sea measured by the GC/FID technique. PAHs were detected for all samples under study. They
were found in higher concentration for station near Semani River with 19.2 ug/l. Their presence
could be because of extracting-processing oil industry in Patos-Marinza area that is part of its
basin. Ship transport could be another source of PAH pollution in marine water samples of
Adriatic Sea. Dibenzo [ab] anthracene and Chrysene were the most abundant peaks for water
samples near Semani River. Average levels of PAHs were relatively high near Shkumbini (10.1
ug/l), Erzeni (8.4 ug/l) and Buna (6.0 ug/l) while in Mati and Vjosa their levels were in LOD
(limit of detection) for the GC/FID technique. The presence of some individual PAHs in higher
level was noted. Also, this could be a momentum value of PAHs depended on sampling
periods. PAH levels in seawater samples near Semani were higher than the reported levels for
other ecosystems of Albania (Nuro et al., 2014). The presence of some individual PAHs was
higher than permitted level according to Albanian and EU norms.
Figure 8. PAHs in water samples of Adriatic Sea
CONCLUSION
Organochlorine pesticides, their residues, PCBs and PAHs were found in all water samples of
Adriatic Sea. The higher level was found near Semani and Shkumbini river mouths because of
new arrivals from waters from channels of Myzeqeja field (the main field on Albania). It was
noted presence of degradation products of pesticides in higher levels. This fact is connected
with the previous use of pesticides in Albania and their degradation process. Endosulfan was
shown to be in high level in all samples. This pesticide could be in use in agricultural areas
near these rivers under false trade name. PCBs volatile were found at high levels for all
seawater samples. Their presence could be because of their atmospheric deposition. In marine
water samples near Shkumbini, Buna and Semani river mouths were found heavy PCB. This
could be connected with punctual sources of PCBs in these stations or a momentum value.
Also, PAHs were found at higher levels for Semani River because of extracting-processing
0.00
5.00
10.00
15.00
20.00
Benzo[ghi]Perilene
Dibenzo[ab]Antracene
Indeo[123cd]Pirene
Benzo[k]fluorantrene
Benzo[b]fluorantrene
Perilene
Krizene
Benzo[a]antracene
Piren
Antracene
Fenantrene
Fluorene
Acenaftilene

285
LEVELS OF SOME PRIORITY SUBSTANCES ON ADRIATIC SEA, ALBANIA
industry in Patos-Marinza area. Concentrations of some individual organochlorine pesticides
and PAHs were found in higher concentrations than permitted levels for surface waters
according to EU Directive 2013/39 and Albanian norms. Monitoring of organic pollutants in
water of Adriatic Sea should be continuous because of its importance in fishing, tourism,
recreation and Albania economy overall.
REFERENCES
Borshi Xh. Nuro A., Macchiarelli G., Palmerini G.M., “Analyzes of Some Chlorinated
Pesticides in Adriatic Sea. Case study: Porto-Romano, Durres, Albania” Journal of
International Environmental Application and Sciences (JIEAS), Vol. 9(4): 521-424
(2016).
Como E., Nuro A., Murtajn B., Marku E., Emiri A. (2013): Study of Some Organic Pollutants
in Water Samples of Shkumbini River”, International Journal of Ecosystems and Ecology
Sciences (IJEES), Vol 8, Issue 4; 573-579
Corsi I., Tabaku A., Nuro A., Beqiraj S., Marku E., Perra G., Tafaj L., Baroni D., Bocari D.,
Guerranti C., Cullaj A., Mariottini M., Shundi L., Volpi V., Zucchi S., Pastore A.M.,
Iacocca A., Trisciani A., Graziosi M., Piccinetti M., Benincasa T., Focardi S. (2010):
“Ecotoxicological assessment of Vlora Bay (Albany) by a biomonitoring study using an
integrated approach of sub-lethal toxicological effects and contaminants levels in
bioindicator species”. Journal of Coastal Research, Special Issue 58 - Coastal Research
in Albania: Vlora Gulf [Tursi & Corselli]: pp. 116 – 120. DOI:10.2112/SI_58_1
Directive 2008/105/Ec Of The European Parliament And Of The Council on environmental
quality standards in the field of water policy, amending and subsequently repealing
Council Directives 82/176/EEC, 83/513/EEC, 84/156/EEC, 84/491/EEC, 86/280/EEC
and amending Directive 2000/60/EC of the European Parliament and of the Council
Gustafson E., Dickhut M., (1997): Distribution of polycyclic aromatic hydrocarbons in
southern Chesapeake Bay surface water: evaluation of three methods for determining
freely dissolved water concentrations. Environment Toxicology Chemistry 16, 452–461
Konstantinou I.K., Hela D. G., Albanis T. A. (2006): The status of pesticide pollution in
surface waters (rivers and lakes) of Greece. Part I. Review on occurrence and levels,
Environmental Pollution, Volume 141, Issue 3, Pp. 555–570
Lekkas Th., Kolokythas G., Nikolaou A., Kostopoulou M., Kotrikla A., Gatidou G.,
Thomaidis N.S., Golfinopoulos S., Makri C. (2004) Evaluation of the pollution of the
surface waters of Greece from the priority compounds of List II, 76/464/EEC Directive,
and other toxic compounds, Environment International, Volume 30, Issue 8, Pp. 995–
1007
Murtaj B., Çomo E., Nuro A., Marku E., Emiri A., (2013): “Evaluation of Organochlorine
Pesticides Residues and PCBs in Sediments of Karavasta Lagoon, Albania”, Journal of
International Environmental Application and Sciences (JIEAS), Vol 8, Issue 4, Fq. 573-
579
Nuro A., Marku E., Shehu M., (2012): “Organochlorine pesticide residues in marine water in
the South of Albania”. International Journal of Ecosystems and Ecology Sciences
(IJEES), Vol 2, Issue 1, Fq. 27-34
Nuro A., Marku E., Murtaj B. Levels of organic pollutants in water samples of Vjosa River,
Albania” Zastita Materijala/ Materials Protection, Vol. 58 (3) (2017), pp. 385-384
Vryzas, Z., Vassiliou, G., Alexoudis C., Papadopoulou-Mourkidou E. (2009): Spatial and
temporal distribution of pesticide residues in surface waters in northeastern Greece,
Water Research, Volume 43, Issue 1, Pp. 1–10

286
ITEMA 2020
Conference Proceedings
Wells DE., Hess P. (2000): Determination and evaluation of chlorinated biphenyls. In: Barceló
E (2007) Sample handling and trace analysis of pollutants, techniques, applications and
quality assurance. Elsevier, Amsterdam; 239–285

287
HEAVY METAL ACCUMULATION AND CHEMICAL COMPOSITION
OF ESSENTIAL OILS OF LEMON BALM (MELISSA OFFICINALIS L.)
CULTIVATED ON HEAVY METAL CONTAMINATED SOILS
Violina Angelova1
DOI: https://doi.org/10.31410/ITEMA.2020.287
Abstract: Comparative research has been conducted to allow us to determine the content of
heavy metals and chemical composition of lemon balm oils, as well as to identify the possibility
of lemon balm growth on soils contaminated by heavy metals. The experimental plots were
situated at different distances of 0.5 km, and 15 km, respectively, from the source of pollution
the Non-Ferrous-Metal Works (MFMW) near Plovdiv, Bulgaria. On reaching the flowering
stage the lemon balm plants were gathered. The content of heavy metals in leaves of lemon
balm was determined by ICP. The essential oils of the lemon balm were obtained by steam
distillation in laboratory conditions which were analyzed for heavy metals and chemical
composition was determined. Lemon balm is a plant that is tolerant to heavy metals and can
be grown on contaminated soils. Heavy metals do not affect the development of lemon balm
and the quality and quantity of oil obtained from it. Forty components were identified in the
oils. The quantity of identified compounds corresponds to 98.82-98.83% of the total oil content.
Among the detected compounds, beta-citral (neral) (19.31-20.78%), alfa-citral (geranial)
(18,65-19,12%), β-caryophyllene (14.76-16.28%), α-cadinol (3.88-4.74%), geranyl acetate
(3.49-3.59%), trans-geraniol (3.40-3.51%), germacrene (3.18-3.28%), citronellal (2.94-
3.03%), nerol (2.63-2.71%), neryl acetate (2.42 -2.49%) were the major compounds. The
essential oil of Melissa officinalis L. can be a valuable product for farmers from polluted
regions.
Keywords: Contaminated soils, Essential oil composition, Heavy metals, Lemon balm.
1. INTRODUCTION
emon balm (Melissa officinalis) is a perennial herbaceous plant of the family
Lamiaceae. The plant is grown mainly in Germany, France, Italy, Romania, Bulgaria
and North America [1-2]. It reaches a height of 70-150 cm. The leaves have a mild
lemon scent. At the end of summer, small flowers full of nectar appear, they attract bees, hence
the name Melissa (Greek for “honey bee”). The citrus aroma of lemon balm is due to the
terpenes citral and geraniol, citronellal, citronellol and geranyl acetate [3]. The above-ground
part of the lemon balm is used as a spice and herbal tea, in medicine, in the perfume and
cosmetics industry, in folk medicine. Traditionally in Bulgaria it is used for making tea, as well
as for making bowles and liqueurs. Lemon balm tea is used in nervous sleep disorders and
gastrointestinal disorders [4], lowering the temperature and relieving headaches caused by
stress.
The oil contains terpenes (monoterpenes, sesquiterpenes and triterpenes), phenolic compounds
(phenolic acids, flavonoids and tannins) [5-6]. The main active ingredients of M. officinalis are
volatile compounds (geranial, neral, citronellal and geraniol), triterpenes (ursolic acid and
1 Department of Chemistry, Agricultural University – Plovdiv, Bulgaria
L

288
ITEMA 2020
Conference Proceedings
oleanolic acid) [7], flavonoids and phenolic acids [8-9] such as rosemary acid [10] and caffeic
acids [11], phenylpropanoid heteroside [12]. M. officinalis essential oil is used because of its
antimicrobial activity [13], antiviral [14], antibacterial, antioxidant and insect repellent
properties [15]. There is evidence that lemon balm has a positive effect on patients with
Alzheimer's disease [6].
The chemical composition of balm mint oil has been the subject of many studies around the
world. In most studies, in the essential oils from M. officinalis has been found to be
characterized mainly by oxygenated monoterpenes and sesquiterpenes. The analysis of
essential oils indicated some major constituents, like geranial, neral and citronellal [6, 10, 16-
20], (E)-caryophyllene and caryophyllene oxide [10,21], linalool [16], geraniol [22], thymol
[23], α-pinene [21], β-pinene [21,24], carvacrol and iso-menthone [20], decadienal [25] and
trans-carveol [26]. The composition of the oil depends on various factors, such as genetic
origin, habitat, environmental conditions, physiological stage (time of harvest, plant parts of
the plant used to extract the essential oil, soil composition, etc.).
It has been found that the medicinal plants can accumulate larger amounts of heavy metals such
as Cd, As, Pb and Hg compared to other plants [27].
Some medical plants such as mint, St. John's wort, lavender, marigold, marshmallow, cumin,
garlic, garden sorrel, hemp and others can accumulate large amounts of toxic heavy metals in
their tissues. However, Zheljazkov [28] demonstrated that aromatic crops may not have
significant phytoremediation potential, but growth of these crops in metal contaminated
agricultural soils is a feasible alternative. Aromatic crops can provide economic return and
metal-free final product, the essential oil. The essential oil of aromatic plants does not contain
heavy metals, although there is an accumulation in the plant biomass [28-29].
The plants of the Lamiaceae family are also widespread in world and have a large biomass
production capacity. However, there are no studies on the possibilities of heavy metals
accumulation in Melissa officinalis L. when grown on contaminated soils. There are no
comprehensive studies on the relationship among the total content of heavy metals in the soil,
their uptake by the leaves of balm mint and quality of oil.
The purpose of this work is to conduct a comparative study, which allows us to determine the
heavy metal accumulation in balm mint, the quality of balm mint oil, as well as the possibilities
to grown on heavy metal contaminated soils.
2. MATERIAL AND METHODS
The experiment was performed on agricultural fields contaminated by Zn, Pb and Cd, situated
at different distances (0.5, and 15.0 km) from the source of pollution, the NFMW near Plovdiv
(Non-Ferrous Metal Works), Bulgaria.
Characteristics of soils are shown in Table I. The soils were slightly neutral to alkalic with
moderate content of organic matter and essential nutrients (N, P and K) (Table I). The pseudo-
total content of Zn, Pb and Cd is high and exceeds the maximum permissible concentrations
(MPC) in soil 1 (S1) (Table 1).

289
HEAVY METAL ACCUMULATION AND CHEMICAL COMPOSITION OF ESSENTIAL OILS OF
LEMON BALM (MELISSA OFFICINALIS L.) CULTIVATED ON HEAVY METAL CONTAMINATED
SOILS
Table 1. Characterization of the soils
Parameter pH EC,
dS/m
Organic
C.%
N
Kjeldal,%
P,
mg/kg
K,
mg/kg
Pb,
mg/kg
Zn,
mg/kg
Cd,
mg/kg
Soil 1 (S1)
0,5 km 7,4 0,15 2,2 0,34 625,6 6960 2509,1 2423,9 64,3
Soil 2 (S2)
15 km 7,5 0,15 1,54 0,12 387,3 6780 49,4 172,7 1,0
MPC (pH 6.0-7.4) – Pb-100 mg/kg, Cd-2.0 mg.kg, Zn-320 mg/kg
MPC (pH >7.4) – Pb-100 mg/kg, Cd–3.0 mg/kg, Zn-400 mg/kg
The test plant was Melissa officinalis L. Balm mint is grown according to conventional
technology. Five plants of each of the areas were used for the analysis. Upon reaching the stage
just prior to blooming, balm mint was harvested and the content of Pb, Zn and Cd in leaves
was determined. The essential oil of the balm mint was obtained by steam distillation in
laboratory conditions which was analyzed for heavy metals content and its chemical
composition was determined.
Pseudo-total content of metals in soils was determined in accordance with ISO 11466 [30]. The
available (mobile) heavy metals contents were extracted in accordance with ISO 14870[31] by
a solution of DTPA. The contents of heavy metals (Pb, Zn and Cd) in the plant material (leaves)
and in the essential oils of sage were determined by the method of the dry mineralization. The
quantitative measures were carried out by ICP method (Jobin Yvon Emission - JY 38 S,
France). Digestion and analytical efficiency of ICP was validated using a standard reference
material of apple leaves (SRM 1515, National Institute of Standards and Technology, NIST).
The chemical composition of the oil was determined on a gas chromatograph PYE UNICAM
series 204, equipped with a flame ionization detector and a capillary column CARBOWAX 20
M with hydrogen carrier gas.
3. RESULTS AND DISCUSSION
Soils
The results presented in Tables I and II show that in the soil samples S1 (taken from the area
situated at the distance of 0.5 km from NFMW), the reported values for Pb were exceeding
MPC approved for Bulgaria and reached to 2509.1 mg/kg. In the area located at a distance of
15 km, the contents of Pb significantly reduce to 49.4 mg/kg. Similar results were obtained for
Cd and Zn. The results for the mobile forms of the metals extracted by DTPA show that the
mobile forms of Cd in the contaminated soils are the most significant portion of its total content
and reached to 57,2%, followed by Pb with 33,8 % and Zn with 9,8%.
In the soil located at a distance of 15 km from NFMW the mobile forms of Cd are the most
significant part of it.
Table 2. DTPA-extractable Pb, Zn and Cd (mg/kg) in soils sampled from NFMW
Soils Pb Cd Zn
mg/kg %* mg/kg % mg/kg %
S1 (0.5 km) 849.1 33.8 36.8 57.2 236.8 9.8
S2 (15.0
km) 21.5 43.5 0.7 70 38.9 22.5
*DTPA -extractable / total content

290
ITEMA 2020
Conference Proceedings
Content of Heavy Metals in balm mint
A significant accumulation of Pb is found in the leaves of the balm mint. The content of this
element reaches up to 143.5 mg/kg in leaves of the balm mint grown at a distance of 0.5 km
from NFMW (S1) (Table 3) and was very high beyond the proposed guide value for medicinal
plants. Kabata Pendias [27] quote that normally there are 5 - 10 mg/kg Pb in a plant material.
Schilcher and Peters [32] proposed to set the limits for Pb in medicinal plants at 10 mg/kg, due
to their little portion in the human diet and incomplete extraction of Pb during tea preparation.
The World Health Organization (WHO) recommends limits for various medicinal plants of not
more than 10 mg/kg Pb and 0.3 mg/kg Cd in the final dosage form of the plant material. The
relatively high amount of Pb may be caused by the morphological characteristics of the plant.
The leaves of balm mint were covered with pappus, which contributed to the fixing of the
aerosol pollutants and for their accumulation there. The content of Cd in the leaves of balm
mint grown at a distance of 0.5 km from NFMW reaches up to 2.25 mg/kg, values considered
to be nontoxic to plants. According to Kabata-Pendias [27] 5.0 mg/kg Cd is considered to be a
toxic value for the plants. The content of Zn in the leaves of balm mint grown at a distance of
0.5 km from NFMW reaches up to 184.7 mg/kg, as these values are also less the critical values
for plants - 100-400 mg/kg. With increasing the distance from NFMW a clear trend is seen
towards reducing the content of heavy metals in the leaves of the studied crop. The content of
heavy metals in the leaves of the balm mint grown at 15 km from NFMW reaches up to 1.6
mg/kg Pb, 0.08 mg/kg Cd and 17.7 mg/kg Zn (S2).
The heavy metal content in the essential oil from balm mint was also determined. The results
obtained show that the majority of the heavy metals contained in the leaves of the balm mint
do not pass into the oil during the distillation, therefore their content in the oil are much lower.
In the process of oil extraction by distillation, heavy metals remain in the extracted plant
residues, limiting the quantities of heavy metals in the commercial oil product. Pb content in
the essential oil of balm mint reaches up to 0.2 mg/kg, Zn up to 4.5 mg/kg, while the content
of Cd is below the limits of the quantitative measurement of the method used. Significantly
lower are the figures in the essential oil of balm mint grown at a distance of 15 km from NFMW
– 0.03 mg/kg Pb and 1.6 mg/kg Zn (S2).
These results strongly suggest that the main part of Pb, Cd and Zn, contained in the leaves of
balm mint, cultivated 0.5 km from the NFMW, does not pass into the oil obtained, its content
in the oil are lower according the Directive 76/768/EEC for plant extracts (20 mg/kg Pb and 2
mg/kg Cd) and it can be used for cosmetics. This result is very important, given the commercial
value of the essential oil extracts of the aromatic and medicinal plants. The accumulation of
heavy metals in the end products, obtained after the processing of the aboveground parts of the
plant, was within the limits of the permissible values to the normative requirements for
ecologically clean product.
Table 3. Content of Pb, Cd and Zn (mg/kg) in leaves and essential oil of balm mint
Soils Pb Cd Zn
Leaves Oil Leaves oil Leaves oil
S1 (0.5 km) 143.5 0,2 2.25 n.d. 184.7 4.5
S2 (15.0 km) 1.6 0.03 0.08 n.d. 17.7 1.6
n.d.-non detectable

291
HEAVY METAL ACCUMULATION AND CHEMICAL COMPOSITION OF ESSENTIAL OILS OF
LEMON BALM (MELISSA OFFICINALIS L.) CULTIVATED ON HEAVY METAL CONTAMINATED
SOILS
Effect of heavy metals on the quality of the oil
The results of the chromatographic analysis of essential oils obtained by processing of leaves
balm mint grown at a different distance from NFMW are presented in Table 4. The values of
the main components of the essential oil of balm mint are compared with the data obtained
from all cited references.
No significant differences were observed in the composition between the oils obtained from
the areas of different distance from NFMW. The yield for balm mint oils ranged between
0.245% (S1) and 0.25% (S2). Ozturk [33] found that the content of essential oil in lemon balm
varies between 0.02 and 0.30%, which is much lower than other plants in the family Lamiaceae.
According to Turhan [34] the content of essential oil and its composition depend on the cutting
height of the lemon balm. It was found that the content of essential oil in the upper part (young
leaves) is 0.39%, while in the whole leaf mass it is 0.14%. For this reason, the production costs
and the price of the essential oil are very high on the market. Souihi [35] found that the essential
oil content in Tunisia is very low (0.032%,), the content in the oil from Turkey varies from
0.01 to 0.25%. [36], 0.03 - 0.067% [37] to 0.27-0.36%, [38], from 0.06-0.16% in Iran oil [39],
from 0.08 to 0.25% in the oil from Poland [16], 0.25% in the oil from Germany [40], and from
0.5 to 0.8% [40] in the oil from Spain.
Forty compounds representing 98.82 – 98.83% of the oil were identified, 21 of which were
above 1 %. The obtained results show that oxygen-containing monoterpenes (neral and
geranial) and sesquiterpenes hydrocarbon (β-caryophyllene) predominate in the essential oils.
It is noteworthy that the content of oxygen-containing monoterpenes neral and geranial, and
the sesquiterpene alcohol α-cadinol is higher in the balm mint oil obtained from the
contaminated area, while the content of β-caryophyllene is lower. No significant difference
was found for the other components.
The monoterpene aldehyde citronellal determines the sweet floral aroma of rose. The content
of citronellal in the studied oils varies from 2.94% (S1) to 3.03% (S2), whereas significantly
higher values were found by Popova [41] for the Bulgarian commercial oil (18.5%). According
to literature data, the content of citronellal varies widely - from 0.2% in the oil from Cuba [42]
to 40% in the oil from France (40%) [43]. Some essential oils, such as those of Brazilian origin,
do not contain citronellal [17]. Shamsi [44] found that the amount the amount of citronellal is
lower in the leaves of the upper third part (2.82%) compared to the total leaf mass (6.44%).
The monoterpene aldehyde (Z)-citral (neral) causes the sweet citrus aroma of lemon. The
content of beta-citral (neral) in the studied oils varies from 19.31% (S2) to 20.78% (S1).
According to literature data, the content of neral varies widely in lemon balm oil - from 4.3 to
43.8%. The highest content of neral was established in the oils from Cuba (29.9%) [42], Brazil
(39.3%) [17] and Iran (43.8%) [39]. The content of neral is significantly lower in the oil from
Scotland (4.3%) [45], and Bulgaria (5.9%) [41], while neral is not found in the oil from Greece.
The monoterpene aldehyde (E)-citral (geranial) determines the citrus aroma of lemon. The
content of alpha-citral in the oils varies from 18.65% (S2) to 19.12% (S1). According to
literature data, the content of geranial varies widely - from 6.6 to 47.3%. The highest values
were found in the oils from Cuba (41.0%) [42] and Brazil (47.3%) [17], while in the oils from
Greece and Scotland [45] no geranial is contained. According to Hefendelh [46], the young
leaves have higher citral content, while the older leaves have higher citronellal content. Similar
results were reported by Mrlianova [47], who found that the amount of citral isomers (neral

292
ITEMA 2020
Conference Proceedings
and geranial) was higher in the leaves of the upper third part of the lemon balm (59.74%) than
in the leaves of the whole aboveground mass (56.87%).
Sesquiterpene, bicyclic b-caryophyllene causes spicy woody citrus aroma. The content of β-
Caryophyllene in the studied oils varies from 16.280 (S2) and 14.762% (S1). Similar results
were obtained by Allahverdiyev [5] for Turkish oils, which are characterized by a high content
of β-carophylene (14.2%). Slightly lower results were obtained for the content of β-
carophylene in the oils from Slovakia (4.2 %) [48], Serbia (4.6%) [49], Iran (4.9%) [39], and
Egypt (4.9%,) [50]. Significantly lower values were reported for the oil from Algeria (1.3%)
and France (2.4%) [43]. Mrlianova [47] b) found that the amount of beta-caryophyllene was
higher in the leaves of the upper third of the lemon balm (6.97%) than in the total leaf mass
(5.13%),
The content of geraniol varies from 1.358 (S2) to 1.317% (S1). According to literature data,
the geraniol content varies from 0.2% to 15.2%, with higher values found in oils from Serbia
(3.4%) [49], Egypt (4.2%) [50], Scotland (5.73%) [45], Bulgarian commercial oil (15.72%)
[41], and significantly lower in oil from Algeria (0.6%)[43].
Table 4. Composition of oil (%) obtained by processing fresh leaves of balm mint
№ Compound RI S1 (0.5 km) S2(15.0 km)
Reference % of TIC
1 α-Pinene 939 0,367 0,356
2 β-Pinene 979 0,934 0,906
3 1-Octen-3-ol 982 0,119 0,075
4 beta-Myrcene 990 0,25 0,243
5 Limonene 1029 1,879 1,822 trace - 57.5
6 cis-beta-Ocimene 1040 1,176 1,141
7 trans-beta-Ocimene 1050 0,577 0,56
8 beta-Linalool 1097 0,988 0,958 trace - 1.3
9 cis- Rose oxide 1110 0,339 0,329
10 trans-Rose oxide 1128 0,466 0,452
11 Verbenol 1134 0,339 0,329
12 Citronellal 1151 3,03 2,939 0.2 – 43.8
13 trans-Carveol 1195 0,149 0,144
14 Myrtenol 1198 1,359 1,318
15 Menthol 1173 0,936 0,908
16 Isomenthol 1180 0,384 0,373
17 α-Terpineol 1187 0,164 0,159
18 Nerol 1228 2,709 2,628
19 Geraniol 1230 1,358 1,317 0.2-15.2
20 beta-Citral (Neral) 1240 19,308 20,783 4.3-39.3
21 trans-Geraniol 1255 3,505 3,4
22 (S)-(-)-Citronellic
acid, methyl ester 1261 1,253 1,215
23 alfa-Citral (Geranial) 1270 18,649 19,116 6.6 - 47.3
24 Citronellyl acetate 1354 0,426 0,413 0.6 - 7.24
25 Neryl acetate 1364 2,493 2,418
26 Geranyl acetate 1383 3,593 3,485
27 β-Caryophyllene 1419,1 16,28 14,762 1.3 - 15.3

293
HEAVY METAL ACCUMULATION AND CHEMICAL COMPOSITION OF ESSENTIAL OILS OF
LEMON BALM (MELISSA OFFICINALIS L.) CULTIVATED ON HEAVY METAL CONTAMINATED
SOILS
28 (E)-β-Farnesene 1460 0,604 0,586
29 Germacrene D 1480 3,277 3,179 trace - 2.14
30 Caryophyllene Oxide 1581 1,166 1,131 1.2 - 12.6
31 n-Pentacosane 1500 1,192 1,156
32 n-Hexacosane 1600 1,041 1,009
33 tau.-Cadinol 1629 1,166 1,131
34 tau.-Muurolol 1631 1,366 1,325
35 α-Cadinol 1653 3,884 4,737
36 n-Heptacosane 1700 0,83 0,806
37 n-Octacosane 1800 0,115 0,088
38 n-Nonacosane 1900 0,237 0,229
39 n-Eicosane 2000 0,565 0,548
40 n-Heneicosane 2100 0,353 0,342
Total 98,826 98,816
Yoeld, % 0.24 0.25
RI - Relative Index; TIC - Total Ion Current
The content of monoterpene geranyl acetate varies from 3.49 (S1) to 3.59% (S2). Slightly
higher values of geranyl acetate were found in the oil from Slovakia (5.9%) [48], Iran (7.1%)
[39] and Bulgarian commercial oil (7.24%) [41].
Sesquiterpene oxide b-caryophyllene oxide causes the woody spicy aroma. The content of
caryophyllene oxide varies from 1.166 (S2) to 1.131 (S1). Similar results were obtained for the
oils from Algeria (1.3%) and Serbia (1.7%) [49]. Significantly higher results were obtained for
the oils from Iran (2.7%) [39], Cuba (5.3%) [42], Slovakia (8.35%) [48], Egypt (10.0%,) [50].
The highest values were reported in the oil from Jordan, in which caryophyllene oxide is the
dominant ingredient (43.6%) [51].
Most studies have shown that oxygen monoterpenes, such as the isomers of citral (geranial and
neral), citronellal and geraniol, predominate in the oil from M. officinalis [49,52]. For example,
lemon balm oils from Serbia [49], Slovakia [48], Egypt [50], France [43] and Iran [39] are
characterized by a high content of geranial, neral and citronellal. Citral, citronellal and
caryophyllene oxide [44] dominate in the oils obtained in Algeria. Meftahizade [52], report
that the main constituents of the essential oil are citral (geranium and neral), citronellal,
geraniol, beta-pinene, alpha-pinene, and beta-caryophyllene. According to Bagdad and Coşge
[36] the main components of the oil obtained in Turkey are citronellal (39%), citral (33%),
citronellol, linalool and geraniol, while according to Allahverdiyev [5] the oil is dominated
mainly by sesquiterpene hydrocarbons β-cubebene (15.41%) and β-caryophyllene (14.24%).
The sesquiterpene hydrocarbons β-cubeben (39%) and terpinolene (9.6%) also predominate in
the oil obtained in New Zealand [3]. Van den Berg [53] reported that the main components in
the oil were germacrene D (34.79–51.50%), sabinene (0.91–14.68%), β-caryophyllene (7.27–
12.66%) and β-pinene (0.53– 8.03%), whereas limonene is a major component in the oil
obtained in Scotland (57.5%) [45].
The results of this study show that balm mint oil belongs to the citral/β-caryophyllene
chemotype - neral (19,308-20,783%)> and geranial (18,649-19,116%)> β-caryophyllene
(14,762-16.28%). Oils from Tajikistan [54], Turkey (24], Romania [19], Serbia [18], Poland
[16], and Brazil [17], belong to geranial/neral chemotype, oIls from Iran - to
geranol/caryophyllene oxide chemotype [25], while from Egypt [55], Turkey [23], and Italy

294
ITEMA 2020
Conference Proceedings
[20] – to citronellal chemotype, oils from Iran - to α-pinene and caryophyllene oxide
chemotype [56], oils from Greece - to caryophyllene-oxide/β -caryophyllene/ β -pinene
chemotype [21]. The studied oils are a new chemotype of balm mint oil. So far, in the scientific
literature there is no information about such a type of citral/β-caryophyllene chemotype of oils.
The results from the present study confirm that balm mint have a unique chemical composition
and individual oil chemotype.
Figure 1. Classification of the identified compounds based on functional groups in oils from
contaminated soils (A) and non-contaminated soils (B) (OM - oxygen-containing
monoterpenes; MH - monoterpenic hydrocarbons; SH - sesquiterpene hydrocarbons; OS –
oxygen-containing sesquiterpenes)
A B
The chromatographic profile shows a complex mixture of components contained in balm mint
oil. Figure 1 shows the classification of the identified compounds on the basis of functional
groups. The highest is the content of oxygen-containing monoterpenes (61.448-62.684%),
followed by sesquiterpene hydrocarbons (18.527-20.161%), oxygen-containing sesquiterpenes
(7,582-8.324%), monoterpene hydrocarbons (5.028-5.183 %), and others (4.253- 4.452%).
There are no significant differences in the profile of essential oils extracted from balm mint
when grown on contaminated and uncontaminated soils. Probably the contamination of the soil
with heavy metals does not affect the composition and quality of the oil.
This study shows that balm mint can be grown on heavy metal contaminated soils. The oil
yield, essential oil content and essential oil compositions are similar to the oil from the
uncontaminated area and to the oils currently available on the market from other countries.
Therefore, essential oils extracted from balm mint grown in contaminated areas could be
marketed in the same way as essential oils produced in other regions of the world.
CONCLUSION
Based on the obtained results, the following conclusions can be made:
1. Melissa oficinalis L. is a plant which is tolerant to heavy metals and can be grown on
contaminated soils.
2. In the leaves from Melissa Oficinalis L., cultivated in the region of the NFMW, the
contents of Pb, Zn and Cd exceeded the Maximum permissible concentration, and could
be a potential danger for men, when used as herbal tea.
3. 3.The amounts of Pb, Zn and Cd in the oil of balm mint grown on contaminated soil (Pb
-2509.1 mg/kg, Zn -2423.9 mg.kg, Cd - 64.3 mg/kg) are lower than the accepted
maximum values and meet the requirements of an environmentally friendly product.
4. The contamination of the soils with heavy metals does not affect the composition and
quality of the oil. The content of the oxygen-containing monoterpenes neral and geranial,
295
HEAVY METAL ACCUMULATION AND CHEMICAL COMPOSITION OF ESSENTIAL OILS OF
LEMON BALM (MELISSA OFFICINALIS L.) CULTIVATED ON HEAVY METAL CONTAMINATED
SOILS
and the sesquiterpene alcohol α-cadinol is higher in the balm mint oil obtained from the
contaminated area, the content of β-caryophyllene is lower, and no significant difference
was found for the other components.
5. The highest is the content of oxygen-containing monoterpenes (61.448-62.684%),
followed by sesquiterpene hydrocarbons (18.527-20.161%), oxygen-containing
sesquiterpenes (7,582-8.324%), monoterpene hydrocarbons (5.028-5.183 %), and others
(4.253- 4.452%).
6. Balm mint oil from contaminated and uncontaminated area belongs to the new type of
oils- citral/β-caryophyllene chemotype - neral (19,308-20,783%)> geranial (18,649-
19,116%)> β-caryophyllene (14,762-16.28%).
7. Melissa Oficinalis L. could be cultivated in industrially polluted regions, as it is mainly
used for obtaining essential oil. The essential oil of balm mint can be a valuable product
for the farmers from the polluted areas.
Acknowledgements: The financial support by the Bulgarian National Science Fund Project
DFNI Н04/9 is greatly appreciated.
REFERENCES
[1] Anonymous (2003) Microsoft Encarta Encyclopedia, 1993- 2000
[2] De Sousa, A. C., Gattass, C. R., Alviano, D. S., Alviano, C. S., Blank, A. F., Alves, P. B.
(2004) Melissa officinalis L. essential oil: antitumoral and antioxidant activities, Journal
of pharmacy and pharmacology, vol. 56(5), pp.677-681.
[3] Bernard, S.W., Dawson, Franich, R., Meder, R., (1988) Essential oil of Melissa officinalis
L. subsp. altissima (Sibthr. et Smith) Arcang, Flavour and Fragrance Journal, vol. 3(4),
pp.167-170.
[4] Beloued, A. 2009. Plantes médicinales d’Algérie. Alger: Office des Publications
Universitaires p 134.
[5] Allahverdiyev, A., Duran, N., Ozguven, M., Koltas, S., (2004) Antiviral activity of the
volatile oils of Melissa officinalis Against Herpes simplex virus type-2, Phytomedicine,
vol. 11, pp. 657-661.
[6] Moradkhani, H., Sargsyan, E., Bibaky, H., Naseri, B., Sadat-Hosseini, M., Fayazi-Barjin,
A., Meftahizade, H. (2010) Melissa officinalis L., a valuable medicine plant: A review,
J. Med. Plants Res., vol.4, pp.2753-2759.
[7] Mencherini, T., Picerno, P., Scesa, C., Aquino, R., (2007) Triterpene, Antioxidant, and
Antimicrobial Compounds from Melissa officinalis, J. Nat. Prod., vol.70(12), pp.1889–
1894.
[8] Constantine, D.S., (2007) Extraction, separation and detection methods for phenolic acids
and flavonoids, J Sep Sci., vol. 30, pp.3268-3295.
[9] Ziakova, A., Brandsteterova, E. (2003) Validation of HPLC determination of phenolic
acids present in some Lamiaceae family plants, J Liquid Chromatogr., vol.26, pp. 443-
453.
[10] Toth, J., Mrlianova, M., Tekelova, D., Karenova, M., (2003) Rosmarinic acid – an
important phenolic active compound of Lemon balm (Melissa officinalis L.), Acta Facult.
Pharm. Univ. Comenianae, vol.50, pp. 139-146.
[11] Tagashira, M., Ohtake, Y., (1998) A New antioxidative 1, 3- benzodioxole from Melissa
officinalis, Planta Med, vol. 64, pp.555-558.
[12] Mulkenst, A., Kapetanidis, I., (1988) Eugenylglucoside, a new natural phenylpropanoid
heteroside from Melissa officinalis, J Nat Prod., vol. 51, pp.496-498.

296
ITEMA 2020
Conference Proceedings
[13] Vitullo, M., Ripabelli, I., Fanelli, I,, Tamburro, M,, Delfine, S., Sammarco, L, (2011)
Microbiological and toxicological quality of dried herbs, Lett Appl Microbiol., vol. 52,
pp. 573-580.
[14] Adjorjan, B., Buchbauer, G., (2010) Biological properties of essential oils: an updated
review, Flav Fragr J., vol. 25, pp.407-426.
[15] Spiridon, L, Colceru, S., Anghel, N., Teaca, C.A., Bodirlau, R., Armatu, A., (2011)
Antioxidant capacity and total phenolic contents of oregano (Origanum vulgare),
lavender (Lavandula angustifolia) and lemon balm (Melissa officinalis) from Romania,
Nat Prod Res., vol. 25, pp.1657-1661.
[16] Patora, J., Majda, T., Gora, J., Klimek, B., (2003). Variability in the content and
composition of essential oil from lemon balm (Melissa officinalis L.) cultivated in Poland.
J. Endocrinol. Invest., vol.26(10), pp. 950-955.
[17] da Silva, S., Sato, A., Lage, C. L. S.. da Silva, San Gil, R. A., de Almeida Azevedo, D.,
Esquibel, M. A., (2005). Essential oil composition of Melissa officinalis L. in vitro
produced under the influence of growth regulators. J. Braz. Chem. Soc., vol.16, pp. 1387-
1390.
[18] Anicic, N. V., Dimitrijevic, S., Ristic, M. S. Petrovic, S. S., Petrovic, S. D., (2005)
Antimicrobial activity of essential oil of Melissa officinalis L. Lamiaceae, Hem. Ind., vol.
59, pp. 234-247.
[19] Hancianu, M., Aprotosoaie, A. C., Gille, E., Poiata, A., Tuchilus, C., Spac, A., Stanescu,
U., (2008) Chemical composition and in vitro antimicrobial activity of essential oil of
Melissa officinalis L. from Romania, Rev. Med. Chir. Soc. Med. Nat. Iasi., vol.112, pp.
843-847.
[20] Martino, L. D., Feo, V. D., Nazzaro, F., (2009) Chemical composition and in vitro
antimicrobial and mutagenic activities of seven Lamiaceae essential oils, Molecules,
vol.14, pp.4213-4230.
[21] Basta, A., Tzakou, O., Couladi, M., (2005) Composition of the leaves essential oil of
Melissa officinalis from Greece, Flav Fragr J., vol.20, pp.642-644.
[22] Hussain, A. I., Anwar, F., Iqbal, T., Bhatti, I. A., (2011) Antioxidant attributes of four
Lamiaceae essential oils, Pak. J. Bot., vol. 43, pp. 1315-1321.
[23] Cosge, B., Ipek, A., Gurbuz, B., (2009) GC/MS analysis of herbage essential oil from
Lemon balms (Melissa officinalis L.) grown in Turkey, J. Appl. Biol. Sci., vol.3, pp. 149-
152.
[24] Sari, A. O., Ceylan, A., (2002) Yield characteristics and essential oil composition of
Lemon balm (Melissa officinalis L.) grown in the Aegean region of Turkey, Turk. J.
Agric. For., vol. 26, pp. 217-224.
[25] Saeb, K., Gholamrezaee, S., (2012) Variation of essential oil composition of Melissa
officinalis L. leaves during different stages of plant growth, Asian Pac. J. Trop. Biomed.,
vol. 2, pp. S547-S549.
[26] Adinee, J., Piri, K., Karami, O., (2008) Essential oil component in flower of Lemon balm
(Melissa officinalis L.), Am. J. Biochem. Biotechnol., vol. 4, pp. 277-278.
[27] Kabata-Pendias, A., (2010) Trace Elements in Soils and Plants. 4th edition., Boca Raton,
FL, USA: CRC Press/Taylor & Francis Group, pp. 548.
[28] Zheljazkov, V., Craker, L. E., Xing, B., Nielsen, N. E., Wilcox, A., (2008) Aromatic plant
production on metal contaminated soils, Sci. Total. Environ., vol. 395, pp. 51-62.
[29] Angelova, V.R., Grekov, D. F., Kisyov, V. K., Ivanov, K. I., (2015) Potential of Lavender
(Lavandula vera L.) for Phytoremediation of Soils Contaminated with Heavy Metals,
World Academy of Science, Engineering and Technology International Journal of
Biological, Biomolecular, Agricultural, Food and Biotechnological Engineering, vol.9
(5), pp.514-521.

297
HEAVY METAL ACCUMULATION AND CHEMICAL COMPOSITION OF ESSENTIAL OILS OF
LEMON BALM (MELISSA OFFICINALIS L.) CULTIVATED ON HEAVY METAL CONTAMINATED
SOILS
[30] ISO 11466, (1995) Soil quality - Extraction of trace elements soluble in aqua regia.
[31] ISO 14780, (2001) Anonimous, Soil quality - Extraction of trace elements by buffered
DTPA solution.
[32] Schilcher, H., Peters. H., (1990). Empfehlungen von Richtlinien und Grenzwerten fur den
maximalen Blei und Cadmiumgehalt von Arzneidrogen und daraus hergestelter
pharmazeutischer Zubereitungen, Pharm. Ind., vol. 52, pp.916-921.
[33] Ozturk, A., Unlukara, A., Ipek, A., Gurbuz, B., (2004) Effects of salt stress and water
deficit on plant growth and essential oil content of Lemon Balm (Melissa officinalis L.).
Pak. J. Bot., vol.36(4), pp. 787-792.
[34] Turhan, M., (2006) Hand book of herbal plants, chapter 4. Melissa officinalis, vol.3, pp.
184-245
[35] Souihi, M., Amri, I., Souissi, A., Hosni, K., Brahim, N. B., Annabi, M., (2020) Essential
oil and fatty acid composition of Melissa officinalis L., Progress in Nutrition, vol. 22 (n.
1), pp. 253-258.
[36] Bagdad, B.R., Cosge, B., (2006) The essential oil of lemon balm (Melissa officinalis L.),
its components and using fields, J Fac Agri Onodokuz Mayis Univ., vol.21(1), pp.116–
121.
[37] Sari, A.O., Ceylan, A., (2002) Yield characteristics and essential oil composition of
Lemon balm (Melissa officinalis L.) grown in the Aegean region of Turkey, Turk JAgric
For., vol. 26, pp.217-224.
[38] Avci, A.B., Giachino, R.R.A., (2016) Harvest stage effects on some yield and quality
characteristics of lemon balm (Melissa officinalis L.), Industrial Crops and Products,
vol.88, pp. 23-27.
[39] Sadraei, H., Ghannadi, A., Malekshahi, K., (2003) Relaxant effect of essential oil of
Melissa officinalis and citral on rat ileum contractions, Fitoterapia, vol. 74, pp.445-452.
[40] Bomme, U., Feicht, E., Rinder, R., (2002) Ergebnisse aus mehrja¨hrigen
Leistungspru¨fungen mit ausgewa¨hlten Herku¨nften von Zitronenmelisse (Melissa
officinalis L.) (in German), Z Arznei- Gewurzpfla, vol.7, pp.422–432.
[41] Popova, A., Dalemska, Z., Mihaylova, D., Hristova, I., Alexieva, I., (2016) Melissa
officinalis L.—GC profile and antioxidant activity, Int. J. Pharmacogn. Phytochem. Res.
vol. 8, pp. 634–638.
[42] Pino, J.A., Rosado. A., Fuentes. V., (1999) Composition of the essential oil of Melissa
officinalis L. from Cuba, J Essent Oil Res., vol. 11, pp.363-364.
[43] Carnat, A.P., Carnat, A., Fraisse, D., Lamaison, J., (1998) The aromatic and polyphenolic
composition of lemon balm (Melissa officinalis. L. Su, bsp. officinalis) tea, Pharma Acta
Helv., vol. 72, pp. 301-305.
[44] Shamsi, A.M., Amnzade, Y., Jahanshir, F., Jamshidi, A., (2005) Production of suspension
cell culture in Melissa officinalis and comparison of produced secondary metabolites in
callus versus whole plant, J. Med. plant, vol.13, pp. 68-71.
[45] Damien, D.H.J., Surai, P., Deans, S.G., (2000) In vitro antioxidant activity of plant
essential oils and phytoconstituents, J Essent Oil Res., vol.12, pp.241-248.
[46] Hefendehl, F.W., (1970) Composition of etheric oil of Melissa officinalis L. and
secondary changes of oil composition, Archiv Pharm., vol.303, pp.345–357
[47] Mrlianova, M., Tekelova, D., Felklova, M., Toth, J., Musil, P., Grancai, D., (2001)
Comparison of the quality of Melissa officinalis L. cultivar Citra with Melissas of
European origin, Pharmacospsychiatry Jul., vol.34 , Suppl 1, S20-21.
[48] Holla, M., Svajdlenka, E., Tekel, J., Vaverkova, S., Havranek, E., (1997) Composition of
the essential oil from Melissa officinalis L. cultivated in Slovak Republic, J Essent Oil
Res., vol.9, pp.481-484.

298
ITEMA 2020
Conference Proceedings
[49] Dukic, N.M., Bozin, B., Sokovic, M., Simin, N., (2004) Antimicrobial and antioxidant
activities of (Lamiaceae) essential oil, J Agric Food Chem., vol.52, pp. 2485-2489.
[50] Shalaby El-Gengaihi, A.S,, Khattab, M J., (1995) Oil of Melissa officinalis L. as affected
by storage and herb drying, J Essent Oil Res., vol.7, pp.667-669.
[51] Barakat, S.A., Hudaib, M., El-Asad, N., Burns, D.T., (2016) Composition of volatile oil
and methanolic extracts of Jordanian Melissa officinalis L. and actions against human
cancer cell lines, Orient. J. Chem., vol.32, pp.2355–2362.
[52] Meftahizade, H., Sargsyan, E., Moradkhani, H., (2010) Investigation of antioxidant
capacity of Melissa officinalis L. essential oils, J. Med. Plant Res., vol. 4(14), pp. 1391-
1395.
[53] Van den Berg, T., Freundl, E., Czygan, F.C., (1997) Melissa officinalis subsp. altissima:
characteristics of possible adulteration of lemon balm, Pharm., vol.52, pp. 803–808.
[54] Sharopov, F.S., Wink, M., Khalifaev, D. R., Zhang, H., Dosoky, N. S., Setzer, W.N.,
(2013) Composition and Bioactivity of the Essential Oil of Melissa officinalis L. Growing
Wild in Tajikistan, International Journal of Traditional and Natural Medicines, vol. 2(2),
pp. 86-96.
[55] Aziz, E. E., El-Ashry, S. M., (2009) Efficiency of show release urea fertilizer on herb
yield and essential oil production of Lemon balm (Melissa officinalis L.) plants, Am.-
Eurasian J. Agric. Environ. Sci., vol.5, pp. 141-147.
[56] Norouzi, M., Soleimani, T., Pasha Zanousi, M., (2012) Essential oil component in leaf
and flower of Lemon balm (Melissa officinalis L.)., Res. Pharmaceut. Sci., vol.7, p.749