Embed Size (px)
Citation preview

Is There a Generation Gap of DES: Results of PRECOMBAT Series
Jung-Min Ahn, MD
Heart Institute, Asan Medical Center
University of Ulsan, Seoul, Korea

BMS vs. 1st DES for LM
JACC Cardiovasc Interv. 2010 Jun;3(6):602-11
Meta-Analysis from 44 Studies and 10,342 Patients
Time DES
(N)
BMS
(N) OR (95% CI)
Death 6-12 mon 53 50 0.94(0.06-15.5)
2 yrs 1344 496 0.42 (0.28-0.62)
3 yrs 1809 736 0.70 (0.53-0.92)
MI 6-12 mon 53 50 0.64 (0.19-2.17)
2 yrs 178 109 0.16 (0.01-3.53)
3 yrs 611 238 0.49 (0.26-0.92)
TVR/TLR 6-12 mon 53 50 0.10 (0.01-0.84)
2 yrs - - -
3 yrs 1809 736 0.46 (0.30-0.69)
MACE 6-12 mon 138 114 0.34 (0.15-0.78)
2 yrs 398 333 0.31 (0.15-0.66)
3 yrs 1198 498 0.78 (0.57-1.07)
P
value
0.97
<0.05
<0.05
0.47
0.13
<0.05
<0.05
-
<0.05
<0.05
<0.05
0.12
0.01 0.1 1 10
Favor DES Favor BMS

LM PCI Guideline (IIa-IIb)
P=0.12
31.0%
0
Cum
ula
tive E
vent R
ate
(%
)
25
50
Months Since Allocation
36.9%
TAXUS (N=357) CABG (N=348)
0 12 60 24 36 48
SYNTAX-LM
0 12 24 36 0
5
10
15
20
9.3
14.7
8.0
12.7
6.3
9.7
p=0.052 p=0.15 p=0.069
Cum
ula
tive Incid
ence, %
CYPHER (N=300) CABG (N=300)
PRECOMBAT
Months Since Allocation

SES vs. PES for LM
MAINCOMPARE ISAR LM-1
Mehilli et al. J Am Coll Cardiol 2009; 53:1760-3 Lee et al. J Am Coll Cardiol 2009;54:853-9
Death, MI, or TVR
Number at risk
PES 189 153 94 31
SES 669 551 367 169
SES
PES
RR 0.99 (95% CI, 0.69-1.42), P=.96
Years after randomization C
um
ula
tive
In
cid
en
ce
, %
Death, MI or TVR
Patients at Risk
PES 302 278 250 189 160
SES 305 271 252 198 176
0
0
70
80
90
100
365 730 1095
SES
PES
Long-Rank p value = 0.90
Days after initial procedure
Eve
nt
fre
e s
urv
iva
l (%
)
0
0
20
30
40
50
1 2
10

1st vs. 2nd DES for LM PRECOMBAT-2 Study
0 180 360 540
0
5
10
15
20 SES
EES
CABG
Kapla
n-M
eie
r In
cid
en
ce
(%
)
Months
10.8
8.9
6.7
At risk
SES 327 294 275
EES 334 297 176
CABG 272 253 241
P = 0.23
MACCE
Kim YH et al. J Am Coll Cardiol Intv 2012;5:708

Hazard Ratios of EES after Adjustment
Kim YH et al. J Am Coll Cardiol Intv 2012;5:708
1st vs. 2nd DES for LM PRECOMBAT-2 Study

1st vs. 2nd DES for LM EXCELLENT registry
Park KW et al. Int J Cardiol 2013;168:2738-44
1 Year Outcome
Events Propensity Score
Adjustment
EES (N=160)
SES (N=115)
P value HR (95% CI) P value
Death/MI/TVR 12 (7.5%) 16 (13.9%) 0.117 0.43 (0.20-0.95) 0.037
Death 7 (4.4%) 8 (7.0%) 0.383 0.52 (0.18-0.51) 0.23
Death/MI 8 (5.0%) 8 (7.0%) 0.529 0.60 (0.21-0.67) 0.323
TVR 4 (2.5%) 8 (7.0%) 0.096 0.28 (0.08-0.98) 0.046

1st vs. 2nd DES for LM PCI Florence Registry
Log rank p= 0.006
84 ± 4 %
68 ± 4 %
Time (days)
Fre
edom
fro
m M
AC
E (
%)
100
90
80
70
60
0 150 300 450 600 750
MACE
EES (N=166)
PES (N=224)
Valenti et al. JACC 2012;60(14):1217-1222

1st vs. 2nd DES for LM PCI Florence Registry
7.1
0.5
13.4
4.8
1.2
4.2
0
5
10
15
20
25
30
35
40
Cardiac Death MI TVR
PES EES
P=0.35 P=0.40 P<0.001
Valenti et al. JACC 2012;60(14):1217-1222

1st vs. 2nd DES for LM ESTROFA-LM registry
De la Hernandez JM et al. Am J Cardiol 2013;111:676-83
3 Year Event Free Survival
Events
PES (N=415)
EES (N=355)
P value
Death and MI 86% 87% 0.50
Cardiac Death and MI 92% 91% 0.90
TLR 96% 94% 0.10
All revascularization 84% 86% 0.10
Death, MI, and TLR 84% 82% 0.60

ISAR-LEFT MAIN 2 Trial
650 patients with uLMCA lesions pre-treated with 600 mg clopidogrel
Angiographic follow-up at 8
months in 73% (N=237)
Zotarolimus-eluting stent
(Endeavor Resolute)
N= 324
Everolimus-eluting stent
(Xience)
N= 326
Angiographic follow-up at 8 months
in 69% (N=226)
Clinical follow-up at 12 months in
100% (N=324)
Clinical follow-up at 12 months in
100% (N=326)
Mehilli et al. J Am Coll Cardiol 2013;62:2075-82
0
20
40
60
80
100
0 1 2 3 4 5 6 7 8 9 10 11 12 Months after randomization
Cum
ula
tive incid
ence,
%
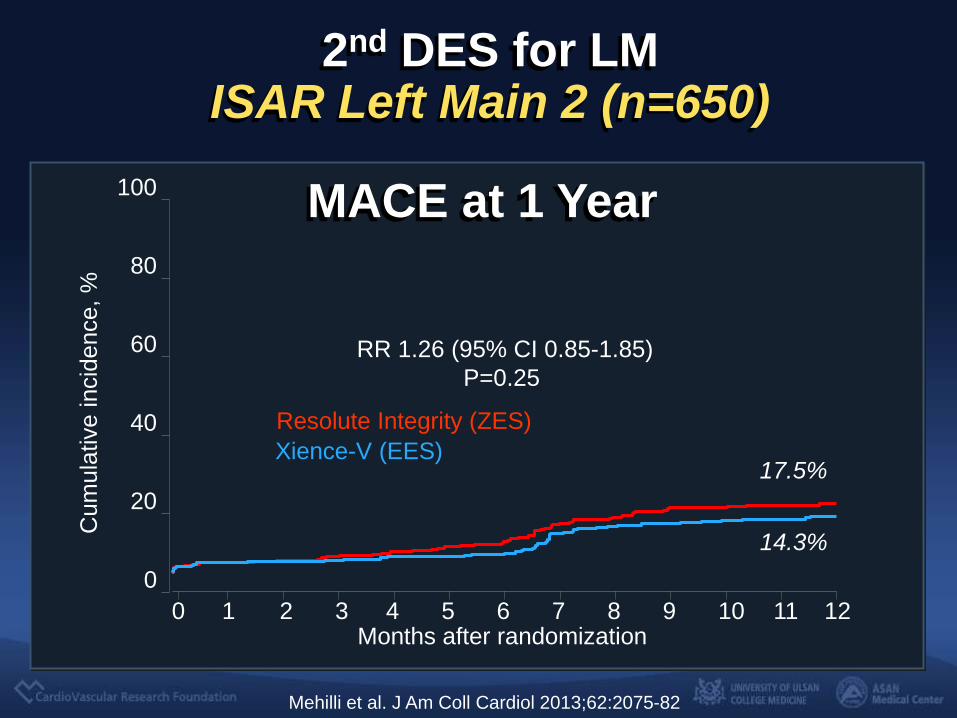
RR 1.26 (95% CI 0.85-1.85)
P=0.25
17.5%
14.3%
Resolute Integrity (ZES)
Xience-V (EES)
Mehilli et al. J Am Coll Cardiol 2013;62:2075-82
MACE at 1 Year
2nd DES for LM ISAR Left Main 2 (n=650)

5.6
2.8
11.7
21.5
0.6
5.6
1.2
9.4
16.8
0.6
0
5
10
15
20
25
30
35
40
Death MI TLR AngiographicRestenosis
Definite ST
R-ZES EES
P=0.24 P=0.98
ISAR Left Main 2 (n=650) Outcomes at 1 Year
P=0.98 P=0.16 P=0.35
Mehilli et al. J Am Coll Cardiol 2013;62:2075-82

PCI with
Cypher N=300
CABG
N=300
Primary Endpoint (MACCE):
2-year death, MI, Stroke, and ischemic driven TVR
Randomization
PRE-COMBAT
for unprotected left main disease
Multi-centers in Korea
Treated with
Xience V
Stent
Pts randomizable
in the
PRECOMBAT
N=300
PRE-COMBAT-2
for unprotected
left main disease
Treated with
Promus
Element stent
Pts randomizable
in the
PRECOMBAT
N=300
PRE-COMBAT-3
for unprotected
left main disease
PRECOMBAT Series New DES Evaluation !
Treated with
Resolute
Integrity
Pts randomizable
in the
PRECOMBAT
N=300
PRE-COMBAT-4
for unprotected
left main disease

PRECOMBAT-3 Trial
Design
• DESIGN: a prospective, single arm, registry
• OBJECTIVE: To evaluate the outcomes of PCI with everolimus-
eluting PROMUS ELEMNT (PtCr-EES) stents for patients with
ULMCA stenosis, the results were compared with those of patients
receiving SES, CoCr-EES and CABG in the PRECOMBAT trial
• PRINCIPAL INVESTIGATOR
Seung-Jung Park, MD, PhD, Asan Medical Center, Seoul, Korea

Purpose of PRECOMBAT-3
• To evaluate the safety and efficacy of PCI using platinu
m chromium everolimus-eluting Promus Element stent
(Boston Scientific) for patients with ULMCA stenosis.
• The results were compared with those of historical cont
rols of patients receiving PCI with Cypher, Xience V or
CABG in the PRECOMBAT-1 and 2 study

Subjects
• Between August 2010 and July 2013, 300 patients
who met the inclusion and exclusion criteria of
PRECOMBAT randomized study were entered from
330 patients undergoing ULMCA stenting with PtCr-
EES in 23 Korean cardiac centers.

Inclusion and Exclusion
• Identical to the PRECOMBAT randomized study
• In brief, patients with angiographic ULMCA stenosis
(> 50% stenosis), who did not have ST-segment
elevation MI, cardiogenic shock, other serious
comorbidity or contraindication of DES, were
included.

Procedures and Follow-up
• PtCr-EES (Promus Element) was the default stent for
all lesions with LMCA in the study period
• IVUS and other devices were used at the operator’s
discretion.
• Annually clinical follow-up to 5 years

End Points
Identical to those used in the PRECOMBAT.
• MACCE : Primary end point, a composite of death, MI,
stroke and ischemia-driven TVR.
• Death : cardiac and non-cardiac deaths.
• MI : Q-MI within 48 hours after procedure and
spontaneous MI thereafter.
• TVR : ischemia-driven revascularization.

Statistics
• Analysis among as-treated groups
• ANOVA and t-test for continuous variables
• Chi-square and Fisher-exact for categorical variables
• Censoring at 2 years (720 days) or events
• Log-rank for survival analysis
• Multivariate Cox analysis to adjust different baseline
characteristics

Baseline Characteristics
SES
(N=327)
CoCr-EES
(N=334)
PtCr-EES
(N=300)
CABG
(N=272)
P
value
Age, years 62.0±10.0 62.9±10.4 64.3±10.3 62.5±9.4 0.026
Male sex 249 (76.1) 236 (70.7) 231 (77.0) 209 (76.8) 0.19
Diabetes mellitus 109 (33.3) 116 (34.7) 94 (31.3) 82 (30.1) 0.63
Hypertension 176 (53.8) 189 (56.6) 191(63.7) 140 (51.5) 0.018
Hyperlipidemia 139 (42.5) 149 (44.6) 155 (51.7) 107 (39.3) 0.021
Current smoker 97 (29.7) 75 (22.5) 70 (23.3) 74 (27.2) 0.13
Previous PCI 42 (12.8) 27 (8.1) 51 (17.0) 34 (12.5) 0.009
Previous MI 16 (4.9) 13 (3.9) 15 (5.0) 17 (6.3) 0.62
Previous heart failure 0 4 (1.2) 11 (3.7) 2 (0.7) 0.001

Baseline Characteristics
SES
(N=327)
CoCr-EES
(N=334)
PtCr-EES
(N=300)
CABG
(N=272)
P
value
Chronic renal failure 3 (0.9) 4 (1.2) 15 (5.0) 2 (0.7) < 0.05
Peri. vascular disease 15 (4.6) 6 (1.8) 18 (6.0) 7 (2.6) 0.02
Chronic lung disease 8 (2.4) 4 (1.2) 9 (3.0) 7 (2.6) 0.46
ACS 155 (47.4) 151 (45.2) 151 (50.3) 147 (54.0) 0.16
Ejection fraction, % 61.5±8.4 61.1±8.2 59.0±9.9 60.8±8.4 <0.05
EuroSCORE 2.8±1.9 2.9±2.0 3.4±2.4 2.9±2.0 <0.05
Multivessel disease 231 (70.6) 191 (57.2) 198 (66.0) 205 (75.4) < 0.05
LM bifurcation 219 (67.0) 240 (71.9) 207 (69.0) 163 (59.9) < 0.05
SYNTAX Score 23.8±9.5 21.1±8.8 21.0±9.6 26.8±10.4 <0.05

Procedures
SES
(N=327)
CoCr-EES
(N=334)
PtCr-EES
(N=300)
CABG
(N=272)
P
value
Total stent N. in left main 1.6±0.8 1.8±0.9 1.7±0.8 <0.05
Total stent N. per patient 2.6±1.4 2.3±1.3 2.3±1.2 <0.05
IVUS 294 (89.9) 302 (90.4) 270 (90.0) 0.83
Two-stent technique 112 (34.3) 88 (26.3) 81 (27.0) 0.049
Angiographic follow-up 249 (76.1) 203 (60.8) 121 (40.3) < 0.05
N. of conduits 2.7±0.9
N. of arterial conduits 2.1±0.9
Off-pump surgery 166 (61.0)
Use of LIMA 254 (93.4)

Clinical Outcomes

Death
0 180 360 540 720 0
5
10
15
20
N. at risk
SES 327 324 317 315 311
CoCrEES 334 331 308 292 282
PtCrEES 300 289 273 200 119
CABG 272 265 264 262 260
5.4%
3.1% 3.3%
2.1%
P=0.18
SES CoCr-EES PtCr-EES CABG
Days Since Index Procedure
Cu
mu
lative
In
cid
en
ce
, %

Death, MI, or Stroke
0 180 360 540 720 0
5
10
15
20
N. at risk
SES 327 321 314 310 306
CoCrEES 334 331 304 287 275
PtCrEES 300 286 270 194 116
CABG 272 260 258 256 254
4.4%
5.5% 4.9%
7.9%
SES CoCr-EES PtCr-EES CABG
P=0.32
Days Since Index Procedure
Cu
mu
lative
In
cid
en
ce, %

TVR
0 180 360 540 720 0
5
10
15
20
N. at risk
SES 327 321 298 292 284
CoCrEES 334 331 289 269 255
PtCrEES 300 287 263 188 114
CABG 272 263 260 258 255
10.2%
6.5%
8.8%
2.6%
SES CoCr-EES PtCr-EES CABG
P=0.004
Days Since Index Procedure
Cu
mu
lative
In
cid
en
ce
, %
P=0.32

MACCE: Death, MI, Stroke, or TVR
0 180 360 540 720 0
5
10
15
20
N. at risk
SES 327 318 295 288 280
CoCrEES 334 331 286 266 253
PtCrEES 300 284 259 183 112
CABG 272 258 254 252 249
13.3%
12.4% 13.2%
7.4%
SES CoCr-EES PtCr-EES CABG
P=0.12
Days Since Index Procedure
Cu
mu
lative
In
cid
en
ce, %

3.3
1.5
2.6
1.1
3.1
1.2
8.8
0.6
2.1 1.6
10.2
1
5.4
1.2
6.5
2
0
2
4
6
8
10
12
14
16
18
20
Death MI TVR Stroke
CABG SES CoCr-EES PtCr-EES
Pati
en
ts,
%
Clinical Outcomes at 2 Years
Cumulative KM Event Rate; log-rank P value; *Binary rates
P=0.18
P=0.96
P<0.004
P=0.47
P value among all groups
P=0.09
P=0.88
P=0.32
P=0.47
P value among DES groups

Definite Stent Thrombosis at 2 Years
0.3 0.3 0.4
0
0.5
1
1.5
2
2.5
3
Definite Stent Thrombosis
SES CoCr-EES PtCr-EES
Pati
en
ts,
%
P=0.79

Stent Deformation
0.3 0.9
4.3
0
1
2
3
4
5
6
7
8
9
10
Stent Deformation
SES CoCr-EES PtCr-EES
Pati
en
ts,
%
P<0.001

Adjusted HR for PtCr-EES Adjusted Hazard ratio 95% CI P value
Death
vs SES 1.06 0.69 - 1.63 0.78
vs. CoCr-EES 1.81 0.60 – 5.44 0.29
vs. CABG 1.33 0.54 – 3.25 0.53
Death, MI, or stroke
vs. SES 1.05 0.75 – 1.49 0.77
vs. CoCr-EES 1.40 0.69 – 2.83 0.35
vs. CABG 1.10 0.56 – 2.22 0.79
TVR
vs. SES 0.88 0.65 – 1.20 0.42
vs. CoCr-EES 0.61 0.34 – 1.11 0.10
vs. CABG 2.75 1.13 – 6.69 0.026
MACCE
vs. SES 0.99 0.79 – 1.24 0.95
vs. CoCr-EES 0.85 0.53 – 1.36 0.50
vs. CABG 1.70 0.97 – 2.95 0.062
0.1 1 10 Favor PtCr-EES Favor Others

5.1 6.6
10.3 10.6
13.8
20.7
12.7 11.8 12.8
9.9
21.5
12.1
0
5
10
15
20
25
30
35
40
45
50
CABG SES CoCr-EES PtCr-EES
Patients
, %
Intermediate (23-32) Low (≤22) High (≥33)
2-Y MACCE in SYNTAX Subgroup
Cumulative KM Event Rate; log-rank P value; *Binary rates
P=0.38
P=0.041
P=0.32
P=0.17

4.9
11 12.8
14 13.5
9.7
14.2
11.5
0
5
10
15
20
25
30
35
40
CABG SES CoCr-EES PtCr-EES
Patients
, %
Non-Bifurcation Bifurcation
2-Y MACCE in Bifurcation
Cumulative KM Event Rate; log-rank P value; *Binary rates
P=0.038 P=0.83
P=0.95

9.8
6.4
16.5
11.5
16.8
10.1
17.8
11.2
0
5
10
15
20
25
30
35
40
CABG SES CoCr-EES PtCr-EES
Patients
, %
Non-DM DM
2-Y MACCE in DM
Cumulative KM Event Rate; log-rank P value; *Binary rates
P=0.54 P=0.31

12.5
2.3
8.4 7.4
5.6 6.8
15.8 16.3
13.8
6.6
16.1
12.9
4.3
9.7
13.9
18.9
0
5
10
15
20
25
30
CABG SES CoCr-EES PtCr-EES
Patients
, %
LM+1VD LM Isolated LM+2VD LM+3VD
2-Y MACCE in LM Subgroups
Cumulative KM Event Rate; log-rank P value; *Binary rates
P=0.38
P=0.51
P=0.45
P=0.10

Conclusions
• The PRECOMBAT-3 trial demonstrated PCI for ULMCA
stenosis using PtCr-EES is safe and effective compared
with previous version of DES including SES and CoCr-
EES.
• However, the adoption of more flexible stent design was
associated with the higher rate of stent deformation.
• In addition, compared with the historical control of
CABG group in PRECOMBAT-1 trial, PtCr-EES stenting
was associated with the similar rate of the death, MI, or
stroke but the higher rate of the repeated
revascularization at 2 year follow-up.

Conclusions
• Based on the current available data, the generation gap
of DES appears to be very minimal regarding the clinical
endpoint.
• Therefore, physicians pay more attention to “how to
stent” rather than “what kind of stent”.