Embed Size (px)
Citation preview
Is Smallholder Horticulture the Unfunded Poverty Reduction Option in Zambia? A Comparative Assessment of Welfare Effects
of Participation in Horticultural and Maize Markets
by
Munguzwe Hichaambwa, Jordan Chamberlin, and Stephen Kabwe
Working Paper 96
March 2015
Indaba Agricultural Policy Research Institute (IAPRI)
Lusaka, Zambia Downloadable at: http://www.iapri.org.zm
and http://www.aec.msu.edu/fs2/zambia/index.htm
ii
Is Smallholder Horticulture the Unfunded Poverty Reduction Option in Zambia: A Comparative Assessment of Welfare Effects of Participation in
Horticultural and Maize Markets
by
Munguzwe Hichaambwa, Jordan Chamberlin, and Stephen Kabwe
Working Paper No. 96
June 2015
Indaba Agricultural Policy Research Institute (IAPRI)
26a Middleway, Kabulonga,
Lusaka, Zambia
Hichaambwa and Kabwe are, respectively, senior researcher/business development manager and research associate II, IAPRI;.Chamberlin is assistant professor, International Development, in the Department of Agricultural, Food, and Resource Economics, Michigan State University, and currently on long-term assignment with IAPRI.

iii
ACKNOWLEDGMENTS
The Indaba Agricultural Policy Research Institute is a non-profit company limited by guarantee and collaboratively works with public and private stakeholders. IAPRI exists to carry out agricultural policy research and outreach, serving the agricultural sector in Zambia so as to contribute to sustainable pro-poor agricultural development.
The Institute would like to thank the enumerators and supervisors who have collected the two years of survey data used in this report. We would like to acknowledge Margaret Beaver for her substantial contribution to the training of enumerators, data entry personnel and data cleaners. We appreciate the efforts of Kennedy Malambo and Esnart Musukwa-Bwalya in collecting horticultural trade flows and price data since 2007.
We wish to acknowledge the financial and substantive support of the Swedish International Development Agency (Sida) and the United States Agency for International Development (USAID) in Lusaka. We further would like to acknowledge the technical and capacity building support from Michigan State University and its Researchers as well as the as the formatting and editing assistance of Patricia Johannes.
Any views expressed or remaining errors are solely the responsibility of the authors.
Comments and questions should be directed to:
The Executive Director Indaba Agricultural Policy Research Institute 26A Middleway Kabulonga Lusaka Telephone: +260 211 261194; Telefax: +260 211 261199; Email: [email protected] or [email protected]
iv
INDABA AGRICULTURAL POLICY RESEARCH INSTITUTE TEAM MEMBERS
The Zambia-based Indaba Agricultural Policy Research Institute (IAPRI) research team is comprised of Antony Chapoto, Brian Chisanga, Jordan Chamberlain, Munguzwe Hichaambwa, Chance Kabaghe, Stephen Kabwe, Auckland Kuteya, Mary Lubungu, Rhoda Mofya-Mukuka, Brian Mulenga, Thelma Namonje, Nicholas Sitko, Solomon Tembo, and Ballard Zulu. Michigan State University-based researchers associated with IAPRI are Eric Crawford, Steven Haggblade, Thomas S. Jayne, Nicole Mason, Chewe Nkonde, Melinda Smale, and David Tschirley
v
EXECUTIVE SUMMARY
Recent significant agricultural growth without rural poverty reduction in Zambia is causing concern to policy makers, development specialists, and other sector stakeholders. It is generally agreed that agricultural growth is the most powerful tool out of poverty for developing countries where the majority of the population is in agriculture. Zambia’s policy focus since the pre- and post-independence period has been on a single crop, maize, for which it has in the past decade spent over 60% of the annual public expenditure in the sector through maize input and output subsidies. The majority of the smallholder farmers (70%) cultivate less than two hectares accounting for only 31% of all the agricultural production, which explains that the agricultural growth being recorded in recent years is only being experienced by a minority of relatively better off smallholder farmers who are benefiting from the government support to the maize subsector.
This growth has not been broad based and cannot lead to significant rural poverty reduction outcomes. This calls for policy paradigm shift to investment in areas that have higher potential pay offs as far as broad based smallholder income growth and poverty reduction is concerned. To facilitate this, policy analysts need to provide empirical evidence to the policy makers and other stakeholders on the potential investment pay offs in other subsectors such as smallholder horticulture among others. This is more so considering that maize has assumed enormous political dimensions in Zambia since independence and politicians are quite unwilling to diversify into other subsectors.
This study aims to provide evidence that will contribute to raising the policy profile among sector stakeholders of smallholder horticulture with regard to its potential for broad-based rural income growth and poverty reduction through comparative analysis with the maize subsector in the following aspects:
Value added to the economy through production and trade flows: Household level profitability using Gross Margin (GM) analysis and GM returns to
Total Variable Costs (TVC); and Household income effects of market participation.
Data and Methods
Firstly, the study assesses the extent to which smallholder horticulture contributes, relative to the maize subsector, to the national economy in general and that of rural areas in particular through values produced and marketed which form part of the overall Gross Domestic Product (GDP) while cognizant of the apparent lack of public and limited private sector support. The study aims to demonstrate the relative magnitude of this contribution compared to that of maize where almost all public resources in the agricultural sector are spent every year (objective 1).
Secondly, the study hypothesizes that the profitability of a farm enterprise significantly affects its income growth and poverty reduction potential, especially for the land constrained smallholders, and intends to demonstrate the superiority of smallholder horticulture over maize (objective 2).
vi
To address the third objective of the study, we use endogenous switching regression framework (in order to control for selection bias) to estimate the comparative household income impacts of participation in horticultural and maize markets.
Key Findings
1) Smallholder horticulture contributes significantly to the Zambian economy in spite of lack of public and limited private sector support: on a per capita basis, the contribution of smallholder horticulture to the rural economy is much superior to that of maize. For example, the value of production per capita at the national level is 1.14 times higher. It is also higher among female-headed households (1.04 times) and much higher among the smallholders cultivating less than one hectare (2.36 times).
2) Smallholder horticulture is much more profitable compared to maize, especially where the market system can be navigated: analysis has shown superior GMs of all horticultural crops relative to that of maize.
3) Smallholder horticultural market participation has higher income impacts than that of maize: There is significant net income increase as a result of smallholder participation in horticultural and maize markets, but the impact is much higher for the participation in horticultural than the maize markets.
4) Other market participation related findings are that: The negative significant effect of household female-headedness is much bigger in
maize than horticultural market participation as well as the resultant household income;
The age of the household head is negatively and significantly related to horticultural market participation while it is not significant with regard to maize market participation;
Market accessibility, measured as hours to the nearest urban center and distance to the nearest tarred/paved road, has a positive significant effect on horticultural market participation (i.e., the hours and kilometers respectively are negatively related to probability to participate) while it is not significant for maize market participation;
The horticultural price variability relative to that maize has a significant negative effect on participation in horticultural markets;
The proportion of households receiving Farmer Input Support Programme (FISP) packs in a Standard Enumeration Area (SEA1) significantly increases participation in maize markets, more than horticultural ones. Anecdotal evidence shows that smallholder farmers sometimes use fertilizer acquired through FISP to grow horticultural crops and proceeds from horticultural production and marketing to meet their contributions to the input packs; and
The lagged amount of district Food Reserve Agency (FRA) maize purchases significantly reduces the probability of smallholders to participate in horticultural markets but have no significant effect on participation in maize ones.
1 SEAs are the lowest geographical sampling units used by CSO and were the primary sampling units in the Supplemental Surveys and RALS. A SEA typically contains 100-200 households.
vii
Conclusions
The foregoing has shown that enhancing conditions for smallholder participation in horticultural markets offers significant income earning opportunities much more than participation in maize markets, particularly for poor and land-constrained farmers. These income gains are more pronounced for smallholders cultivating less than a hectare and for poorer households earning less than US$1.25 per day per capita. Furthermore, participation in horticultural markets appears to reduce the gender gap in rural household income: female-headed households that market horticultural output are relatively less disadvantaged than their male-headed counterparts, as compared with female-headed households that do not market horticulture.
In order to encourage smallholder participation in horticultural markets, policies and investments designed to improve accessibility in high potential horticultural production areas, —namely those in proximity to urban markets—coupled with improved market information systems could have important enabling impacts on horticultural market development in smallholder areas.
Furthermore, better transportation and communication infrastructure will lower the costs of spatial arbitrage, which should also help to decrease localized price variability. These investments should be complemented with public extension support for horticultural production, with particular emphasis on pest management and improvements in the conditions of the traditional markets that smallholder farmers depend on.
Increased smallholder participation in the horticultural supply chains would no doubt increase their chances of moving out of poverty on one hand, and increase urban supply of high quality fresh produce at competitive prices on the other.
Recommendations
As a matter of priority, we recommend investments through Private Public Partnerships (PPPs) initiatives as provided for under the Public-Private Partnerships Act No. 14 of 2009 of the Laws of Zambia to develop strategically located and proper horticultural wholesale markets with links to markets in the region starting with Lusaka and the Copperbelt. That only 21% of the smallholder households in Zambia participate in horticultural supply chains suggests that new demand points could enjoy substantial supply response if they link effectively to the smallholder farm sector. The horticultural wholesale markets when developed will provide this vital and effective link.
viii
TABLE OF CONTENTS
ACKNOWLEDGMENTS ....................................................................................................... iii
INDABA AGRICULTURAL POLICY RESEARCH INSTITUTE TEAM MEMBERS ...... iv
EXECUTIVE SUMMARY ....................................................................................................... v
LIST OF TABLES .................................................................................................................... ix
LIST OF FIGURES .................................................................................................................. ix
LIST OF ACRONYMS AND ABBREVIATIONS .................................................................. x
1. INTRODUCTION ................................................................................................................. 11.1. Agricultural Growth without Rural Poverty Reduction .................................................. 11.2. Predominance of Maize Centric Policies in Zambian Agriculture ................................. 31.3. Smallholder Horticulture As an Alternative to Maize .................................................... 31.4. The Need for Appropriate Horticultural Wholesale Markets ......................................... 61.5. Study Objectives ............................................................................................................. 8
2. DATA AND METHODS ...................................................................................................... 92.1. Demographic Characteristics ........................................................................................ 102.2. Farm Assets ................................................................................................................... 102.3. Social Capital ................................................................................................................ 102.4. Market Characteristics .................................................................................................. 102.5. Weather Conditions ...................................................................................................... 112.6. Main Policy Environment ............................................................................................. 11
3. OPPORTUNITIES IN HORTICTURAL MARKET PARTICIPATION ........................... 133.1. Comparative Smallholder Horticulture and Maize Values to the Economy ................. 133.2. Comparative Smallholder Horticulture and Maize Profitability ................................... 153.3. Comparative Income Effects of Horticultural /Maize Market Participation ................ 16
4. CONCLUSIONS AND POLICY IMPLICATIONS ........................................................... 204.1. Conclusions ................................................................................................................... 204.2. General Recommendations ........................................................................................... 204.3. Recommendations on Development of Horticultural Wholesale Markets ................... 20
APPENDICES ......................................................................................................................... 22Table A.1. Gross Margin Budget for Smallholder Maize Production in Zambia ................ 23Table A.2. Gross Margin Budget for Smallholder Cabbage Production in Zambia ............ 23Table A.3. Gross Margin Budget for Smallholder Tomato Production in Zambia ............. 24Table A.4. Gross Margin Budget for Smallholder Onion Production in Zambia ................ 25
REFERENCES ........................................................................................................................ 26
ix
LIST OF TABLES
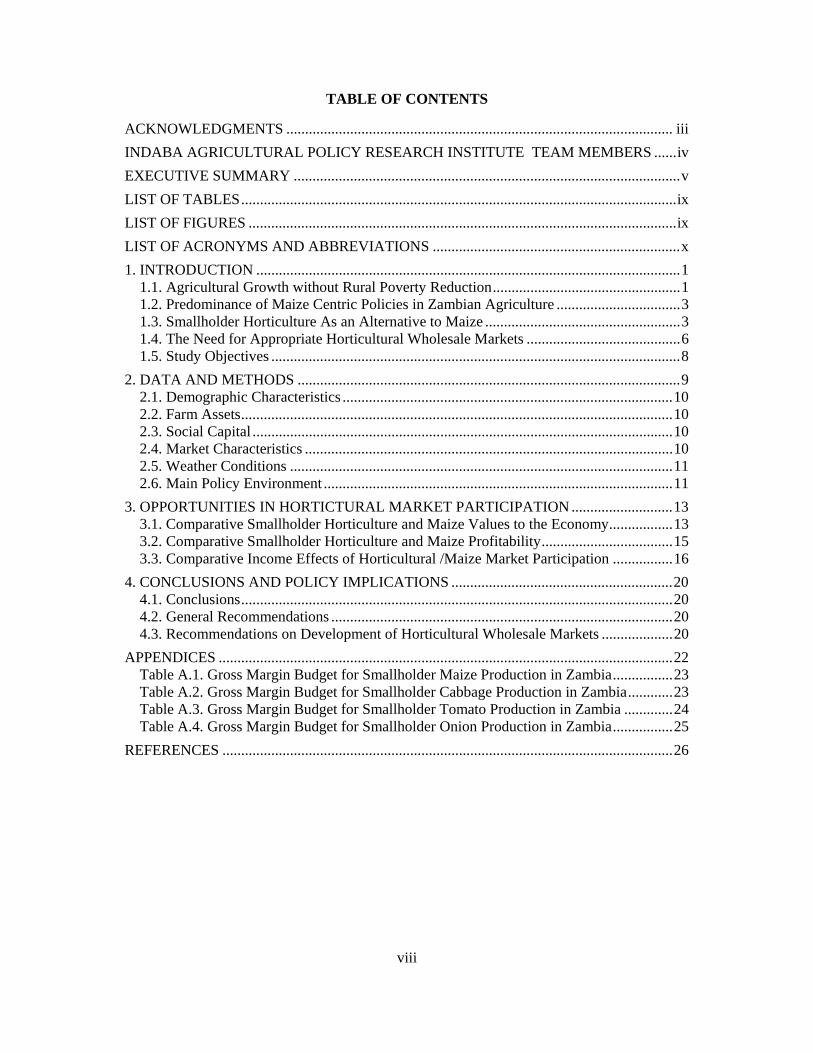
TABLE PAGE 1. Smallholder Horticultural Market Participation (May 2011 to April 2012) .......................... 52. Smallholder Horticultural Production and Marketing (May 2011 to April 2012) ................. 53. Descriptive Statistics of Variables Used .............................................................................. 124. Comparative Number of People Involved and Value of Total Production and Sales of
Maize and Horticulture ........................................................................................................ 145. Horticultural Involvement and Production/marketing as Percent of that of Maize ............. 146. Comparative Mean Value of Production and Sales per Capita ............................................ 157. Summary Gross Margin Analysis of Maize and Selected Horticultural Crops ................... 168. Determinants of Horticultural/Maize Market Participation and Household Income ........... 189. Comparative Income Impacts of Horticultural/Maize Market Participation ....................... 19
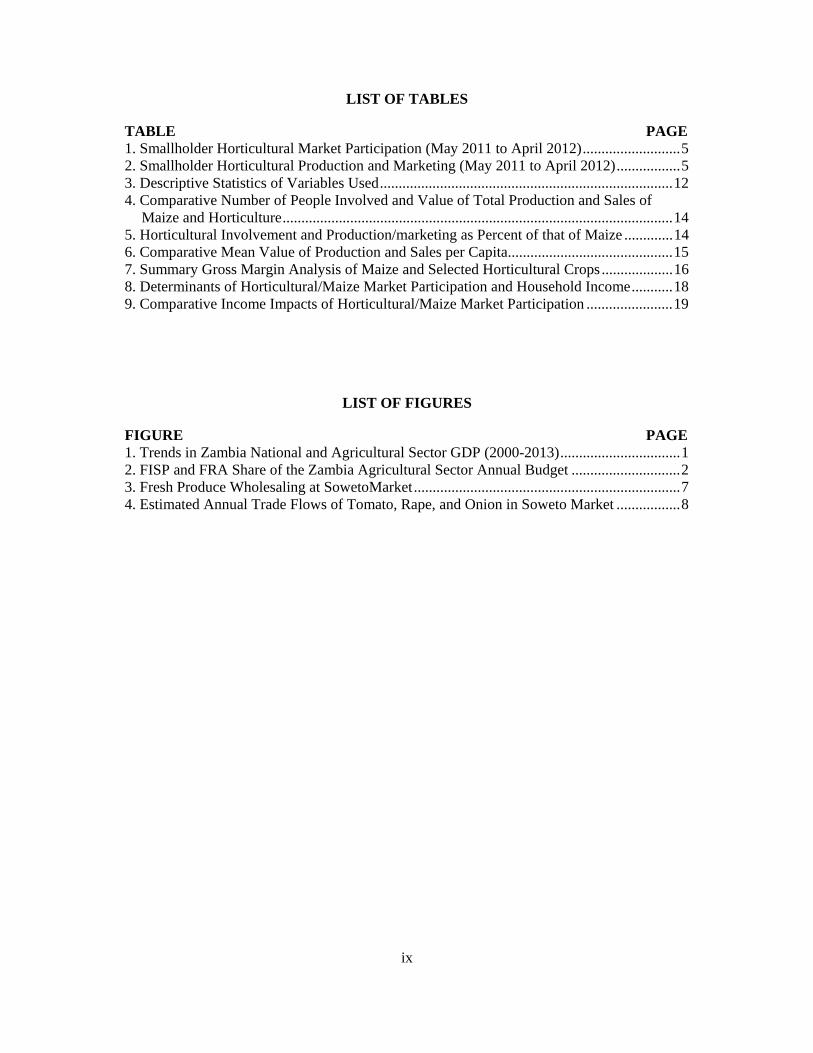
LIST OF FIGURES
FIGURE PAGE 1. Trends in Zambia National and Agricultural Sector GDP (2000-2013) ................................ 12. FISP and FRA Share of the Zambia Agricultural Sector Annual Budget ............................. 23. Fresh Produce Wholesaling at SowetoMarket ....................................................................... 74. Estimated Annual Trade Flows of Tomato, Rape, and Onion in Soweto Market ................. 8

x
LIST OF ACRONYMS AND ABBREVIATIONS
CMP Conditional Mixed Process
CSO Central Statistical Office
FISP Farmer Input Support Programme
FRA Food Reserve Agency
FSRP Food Security Research Project
GDP Gross Domestic Product
GM Gross Margin
GRZ Government of the Republic of Zambia
Ha Hectare
hh Household
IAPRI Indaba Agricultural Policy Research Institute
Kg Kilogram
Km Kilometer
MAL Ministry of Agriculture and Livestock
MT Metric Ton
PPPs Private Public Partnerships
RALS Rural Agricultural Livelihood Survey
SE Standard Error
SEA Standard Enumeration Area
SSA Sub Saharan Africa
TVC Total Variable Cost
US$ United States Dollar
ZEGA Zambia Export Growers Association
ZMW Zambian Kwacha
ZNFU Zambia National Farmers Union
1
1. INTRODUCTION
1.1. Agricultural Growth without Rural Poverty Reduction
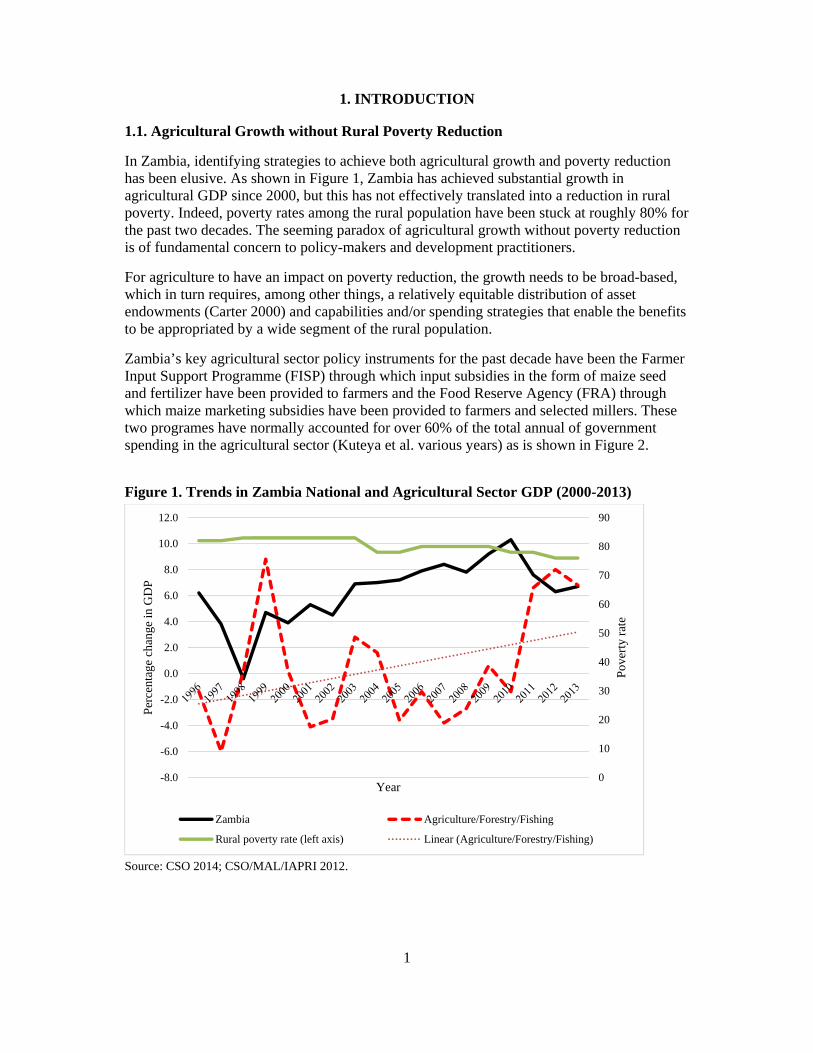
In Zambia, identifying strategies to achieve both agricultural growth and poverty reduction has been elusive. As shown in Figure 1, Zambia has achieved substantial growth in agricultural GDP since 2000, but this has not effectively translated into a reduction in rural poverty. Indeed, poverty rates among the rural population have been stuck at roughly 80% for the past two decades. The seeming paradox of agricultural growth without poverty reduction is of fundamental concern to policy-makers and development practitioners.
For agriculture to have an impact on poverty reduction, the growth needs to be broad-based, which in turn requires, among other things, a relatively equitable distribution of asset endowments (Carter 2000) and capabilities and/or spending strategies that enable the benefits to be appropriated by a wide segment of the rural population.
Zambia’s key agricultural sector policy instruments for the past decade have been the Farmer Input Support Programme (FISP) through which input subsidies in the form of maize seed and fertilizer have been provided to farmers and the Food Reserve Agency (FRA) through which maize marketing subsidies have been provided to farmers and selected millers. These two programes have normally accounted for over 60% of the total annual of government spending in the agricultural sector (Kuteya et al. various years) as is shown in Figure 2.
Figure 1. Trends in Zambia National and Agricultural Sector GDP (2000-2013)
Source: CSO 2014; CSO/MAL/IAPRI 2012.
0
10
20
30
40
50
60
70
80
90
-8.0
-6.0
-4.0
-2.0
0.0
2.0
4.0
6.0
8.0
10.0
12.0
Pov
erty
rat
e
Per
cent
age
chan
ge in
GD
P
Year
Zambia Agriculture/Forestry/Fishing
Rural poverty rate (left axis) Linear (Agriculture/Forestry/Fishing)

2
Figure 2. FISP and FRA Share of the Zambia Agricultural Sector Annual Budget
Source: Kuteya et al. various years. However, because the majority of the smallholder farming households (70%) cultivate less than two hectares and account for only 31% of the total agricultural output implies that only about a quarter of the smallholders have actually participated in the maize bumper production responsible for this agricultural growth (Hichaambwa and Jayne 2014). The majority only participated marginally: they received relatively little subsidized fertilizer and sold very little maize, hence they were unable to benefit from the government supported producer price.
There is no doubt that other avenues need to be pursued to broadly increase smallholder incomes and achieve broad based rural poverty reduction. Hichaambwa and Jayne (2014) recommended increasing smallholder access to land, especially for the land constrained ones. Working on the impact of farm size on smallholder commercialization, they found that increasing farm size by one hectare is significantly associated with an increase in agricultural sales sufficient to reduce the poverty rate up to 48%, with household income becoming more equitably distributed as well. This demonstrated the need for Zambia’s policy focus to expand from the maize centric issues into other areas that have potentially higher returns as far as rural income growth and poverty reduction are concerned such as increasing smallholder access to land as well as facilitating agricultural sub-sector diversification.
Experience of IAPRI2 policy analysis and outreach efforts since the late 1990s has shown that convincing politicians to diversify public investments away from maize is not easy due to the enormous political dimensions that maize production and marketing have assumed in Zambia. This calls for more and more empirical demonstrations to policy makers and other stakeholders on the potential pay offs of public and private investments in other subsectors in achieving broad based rural income growth and poverty reduction. It is within this framework of diversification that we endeavor to demonstrate the potential impact of public and private sector investments in smallholder horticulture.
2 Included that carried over from its forerunner, the Michigan State University’s Food Security Research Project (FSRP)
4330 30
50
30
1415
61 56
18
55 5858
91 86
68
8572
0
20
40
60
80
100
2009 2010 2011 2012 2013 2014
Per
cen
t sh
are
Year
FISP FRA Total

3
1.2. Predominance of Maize Centric Policies in Zambian Agriculture
Zambia’s maize centric policies stem from the pre-independence era when the main policy thrust through the Maize Control Board and the Grain Marketing Board was to produce enough maize to feed the urban working populations (especially those working in the copper mines). This continued after independence as the new government attempted to attain self-sufficiency in maize production. The main strategy was to promote maize production in all parts of the country, regardless of comparative advantage, through seed and fertilizer subsidies and pan territorial grain pricing and subsidized marketing through the National Agricultural Marketing Board. Since that time, maize has become a political crop. The Movement for Multi-party Democracy (MDD) government in the 1990s following structural adjustment and liberalization of agricultural marketing, reduced government involvement in agricultural input provision and output marketing. However, issues of the inadequate private sector capacity to take up the role previously played by government resulted in mixed outcomes. Government involvement was again increased in the early 2000s through the Fertiliser Support Programme, which was later changed to FISP, and FRA.
Facilitated by favorable weather as well as the effect of these policies, the Zambian smallholder sector has recorded bumper maize harvests since the 2009/10 season. However, rural poverty stubbornly remains high in spite of the government spending over 2% of the nation’s GDP to support maize production and marketing. Jayne et al. (2011) note that the smallest farmers, who cultivate less than 2 hectares (Ha) and account for over 70% of all the smallholder farms in the country, participated only marginally in these maize production expansions. These farmers received relatively little subsidized fertilizer and sold very little maize, hence they were unable to benefit from the government supported producer price. The farmers benefiting the most from the government’s expenditures on supporting maize prices were clearly those selling the most maize. Hichaambwa and Jayne (2014) demonstrated that these small farmers who account for over 70% of all the smallholders only account for about 31% of the total value of farm output. They further demonstrated that these farmers’ income share of crop production is only 57% compared to 76% for those who cultivate the largest land areas, which implied that off-farm income generation is not really a viable option for increased income and poverty reduction for the land-constrained smallholders. As a result poverty rates (per capita income of less than United States dollars [US$]1.25 per day) for this category of farmers that has remained consistently higher (about 75% to 80% compared to 9% to 14% for those who cultivate 10 ha to 20 ha.
Agricultural diversification (crop and livestock) though mentioned in policy documents has for a long time in practice suffered as most government resources to support the agricultural sector have been going to FRA and FISP. Most disadvantaged as a result of this maize policy focus have been subsectors that have seen little significant private sector activity or support such as smallholder horticulture, unlike cotton, sugar cane, coffee, tobacco, etc.
1.3. Smallholder Horticulture As an Alternative to Maize
Therefore, the question that comes to mind is, can smallholder horticulture offer any tangible options for broad rural income growth and poverty reduction in Zambia if given more public and private sector investment support? First and foremost, Zambia’s horticultural sector is composed of the commercial and smallholder systems. Commercial horticulture developed in the 1980s, launched by commercial farms that needed foreign currency to import equipment for their main activities (cattle and cereals). This has been export oriented and has grown
4
tremendously since the 1990s with support of the European Development Fund through the Zambia Export Growers Association (ZEGA). Smallholder horticulture involves largely the domestic system and is much larger as it involves many people mostly smallholder farm households (about 300,000) and their families.
Smallholder horticulture in this paper refers to the domestic sector (although it has strong regional trade linkages) as opposed to the export sector mostly engaged in by large commercial farmers who mostly are members of ZEGA. A few members of ZEGA engage smallholder farmers on out-grower arrangements but the numbers have been very small following the demise of Agriflora, which engaged a significant number during its operations. This has left only a few project level activities promoting irrigation and/or linking smallholder horticultural farmers to markets in selected target areas such as those ran by iDE Zambia, Profit Plus, and Commercial Agribusiness for Sustainable Horticulture among others. Government irrigation development support initiatives where implemented have tended to concentrate on only developing water sources, dams in most cases, without paying any attention to smallholder horticultural supply chain issues.
It has generally been agreed the world over that smallholder farmers who produce and market horticultural produce are more likely to move out of poverty than cereal growers (Hichaambwa 2010). This is partly due to the opportunities offered in higher production values per unit of land cultivated and multiple plantings in a year allowing for a continuous income stream, which can be re-invested in production and marketing. In addition, rapid urbanization and sustained income growth, in Sub Saharan Africa (SSA) in general and Zambia in particular, with its attendant transformations in agri-food systems, offers unique opportunities for sustained demand for local horticultural produce because of its high income elasticity (Tschirley et al. (2012). In spite of these opportunities, however, only about one fifth of the smallholder households in Zambia have over the past decade participated in horticultural markets. This is largely attributed to poor hard and soft market infrastructure especially at the wholesale level although there are some production related constraints as well.
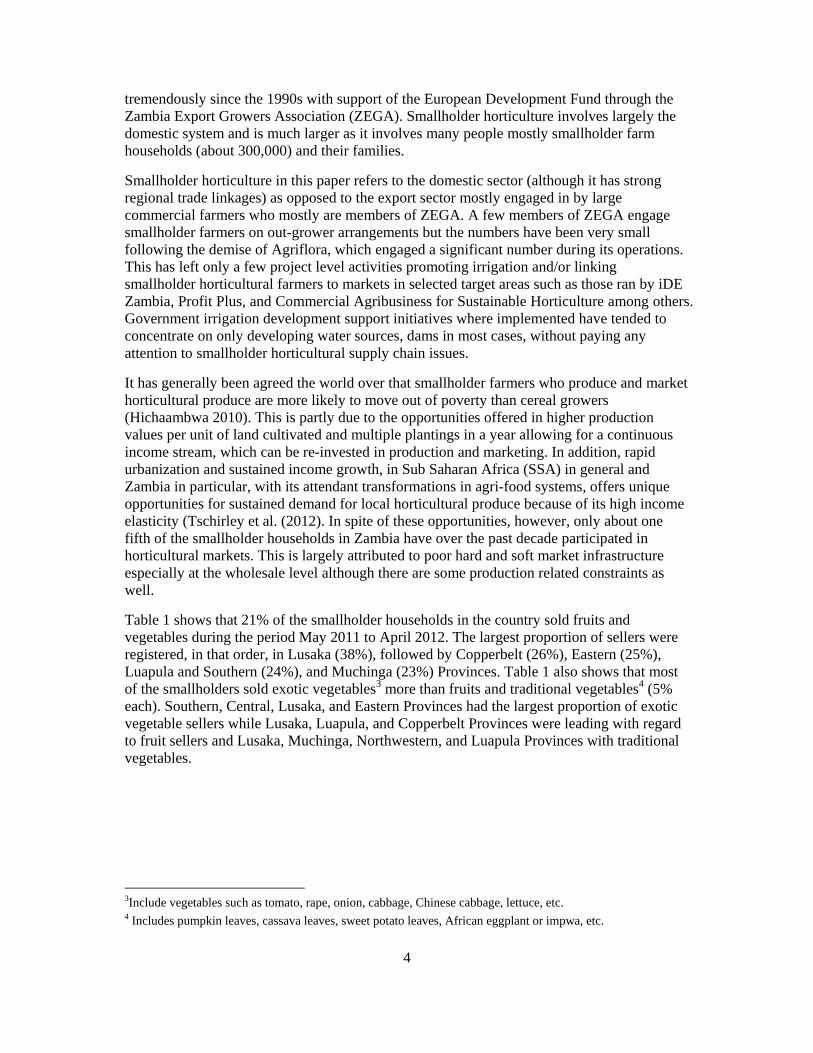
Table 1 shows that 21% of the smallholder households in the country sold fruits and vegetables during the period May 2011 to April 2012. The largest proportion of sellers were registered, in that order, in Lusaka (38%), followed by Copperbelt (26%), Eastern (25%), Luapula and Southern (24%), and Muchinga (23%) Provinces. Table 1 also shows that most of the smallholders sold exotic vegetables3 more than fruits and traditional vegetables4 (5% each). Southern, Central, Lusaka, and Eastern Provinces had the largest proportion of exotic vegetable sellers while Lusaka, Luapula, and Copperbelt Provinces were leading with regard to fruit sellers and Lusaka, Muchinga, Northwestern, and Luapula Provinces with traditional vegetables.
3Include vegetables such as tomato, rape, onion, cabbage, Chinese cabbage, lettuce, etc. 4 Includes pumpkin leaves, cassava leaves, sweet potato leaves, African eggplant or impwa, etc.
5
Table 1. Smallholder Horticultural Market Participation (May 2011 to April 2012)
Province
No of farmers (‘000s)
Percent households selling
Fruits Vegetables
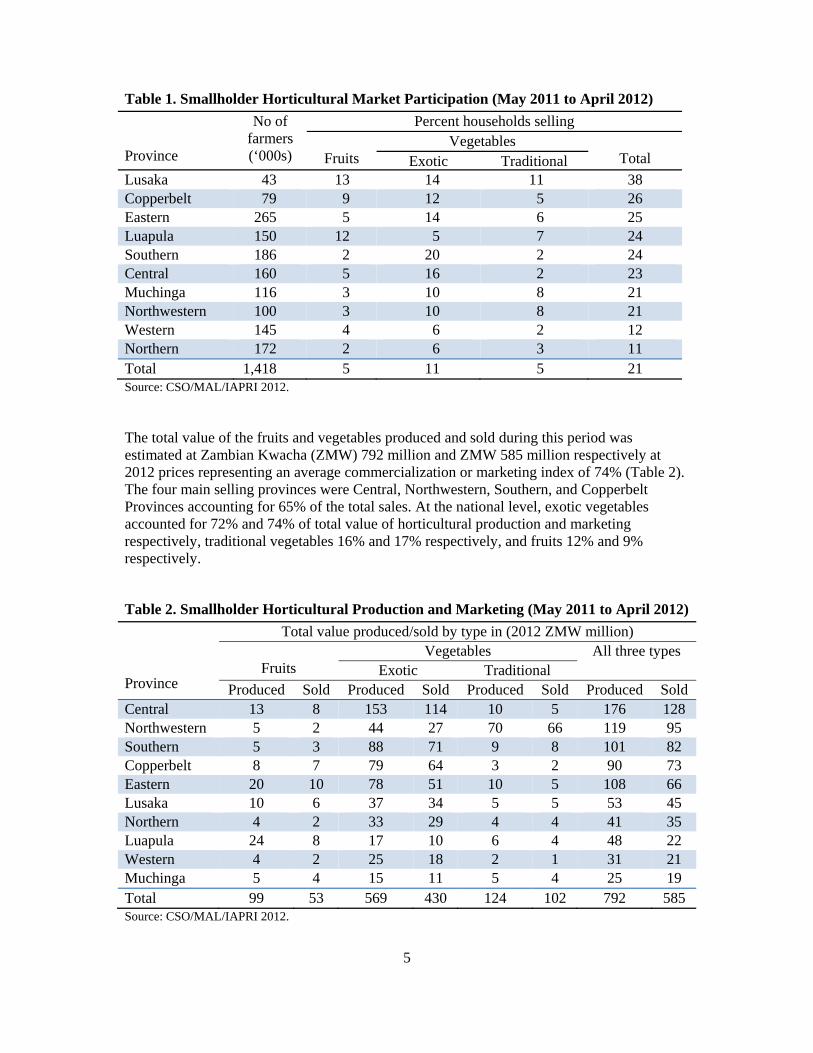
Total Exotic Traditional Lusaka 43 13 14 11 38 Copperbelt 79 9 12 5 26 Eastern 265 5 14 6 25 Luapula 150 12 5 7 24 Southern 186 2 20 2 24 Central 160 5 16 2 23 Muchinga 116 3 10 8 21 Northwestern 100 3 10 8 21 Western 145 4 6 2 12 Northern 172 2 6 3 11 Total 1,418 5 11 5 21 Source: CSO/MAL/IAPRI 2012. The total value of the fruits and vegetables produced and sold during this period was estimated at Zambian Kwacha (ZMW) 792 million and ZMW 585 million respectively at 2012 prices representing an average commercialization or marketing index of 74% (Table 2). The four main selling provinces were Central, Northwestern, Southern, and Copperbelt Provinces accounting for 65% of the total sales. At the national level, exotic vegetables accounted for 72% and 74% of total value of horticultural production and marketing respectively, traditional vegetables 16% and 17% respectively, and fruits 12% and 9% respectively.
Table 2. Smallholder Horticultural Production and Marketing (May 2011 to April 2012)
Province
Total value produced/sold by type in (2012 ZMW million)
Fruits Vegetables All three types
Exotic Traditional Produced Sold Produced Sold Produced Sold Produced Sold
Central 13 8 153 114 10 5 176 128 Northwestern 5 2 44 27 70 66 119 95 Southern 5 3 88 71 9 8 101 82 Copperbelt 8 7 79 64 3 2 90 73 Eastern 20 10 78 51 10 5 108 66 Lusaka 10 6 37 34 5 5 53 45 Northern 4 2 33 29 4 4 41 35 Luapula 24 8 17 10 6 4 48 22 Western 4 2 25 18 2 1 31 21 Muchinga 5 4 15 11 5 4 25 19 Total 99 53 569 430 124 102 792 585 Source: CSO/MAL/IAPRI 2012.

6
1.4. The Need for Appropriate Horticultural Wholesale Markets
That only 21% of the smallholder households in Zambia participate in horticultural supply chains suggests that new demand points could enjoy substantial supply response if they link effectively to the smallholder farm sector; this is more so considering that horticultural produce is an important component of the diets of urban households in Zambia, though they do not usually produce their own. According to Hichaambwa et al. (2009) horticultural produce account for 21% of the food budget of urban households in Lusaka, coming second only to cereals and staples at 24%. The share of household total consumption of this produce from own production is only 7% which means that over 90% of the value passes through marketing channels as purchases.
Urban demand for horticultural produce is poised to increase with time due to rapid urbanization and sustained urban income growth in SSA in general and in Zambia in particular, which are driving a transformation of African agrifood systems (Tschirley et al. 2014). Particularly, great opportunities are being created in domestic horticultural markets because horticultural products, like meat and dairy, have a high-income elasticity of demand in SSA (between 0.7 and 0.8 according to Seale, Regmi, and Berstein 2003). A wide array of opportunities in value added processing of horticultural products including canning, juicing, and the production of sauces and preserves offers opportunities to trigger significant multiplier effects through investments in domestic food manufacturing, as demand for these products grow.
However, unlike meat and dairy, horticultural products have proved resistant to retail consolidation by the rise of supermarkets in the region (Tschirley et al. 2014; Weatherspoon and Reardon 2003). As a result, traditional retail markets, which have substantially lower barriers to entry for smallholder producers than supermarkets, remain the primary source (over 90% market share) of horticultural products for urban consumers (Hichaambwa et al. 2009; Tschirley and Hichaambwa 2010).
One way of strengthening the horticultural supply chains from the smallholder farmers to urban consumers is through the development of strategically located horticultural wholesale markets starting with Lusaka. Currently there are no properly designated horticultural or fresh produce wholesale markets in the country and horticultural wholesaling finds itself in the normal public markets where it has become the biggest user of public market infrastructure and has been affected by wide-spread under-investment in these systems.
For example, fresh produce wholesaling in Lusaka, currently takes place at Soweto Market, (Figure 3) which is the largest in the country, in an area beyond the new market whose construction was completed in 2008. This new market did not make provisions for facilities required in fresh produce wholesaling which include good paving with provisions for drainage, refuse disposal, designated entry and exit points, as well as loading and offloading bays for the trucks, and storage facilities among others. The place where fresh produce wholesaling is taking place is merely bare ground with rudimentary structures as the only infrastructure developed and is characterized by congestion of both human and vehicular traffic, lack of drainage, and poor sanitation and is largely chaotic where operations are based on survival of the fittest with brokers bullying other market players. The market is actually squatting on privately owned land for which eviction is only curtailed by potential political ramification since most of the brokers are largely political party cadres.

7
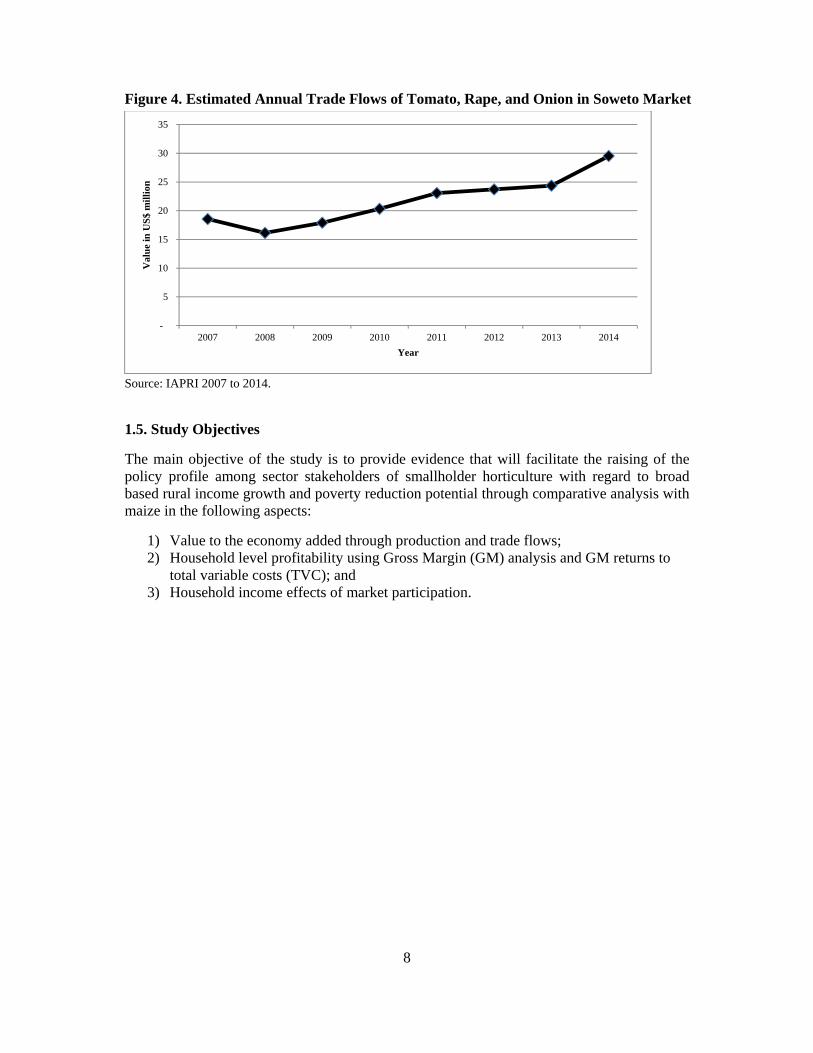
Source: IAPRI Horticultural Markets Pictures. In spite of the above, this market plays a very important role in fresh produce trade within Lusaka, to and from other parts of the country and even other countries in the region. For example, Tschirley and Hichaambwa (2010) show that about two-thirds of the onion supplied in the market is imported from either South Africa or Malawi and a bit from Tanzania. Furthermore, about 38% and 31% of the onion and tomato respectively entering the market is re-distributed outside Lusaka to mainly the Copperbelt and Congo DR in the north, and Livingstone, Namibia, and Botswana in the south. Total annual trade flows in the market of tomato, onion, and rape have been growing tremendously in response to increasing demand from about US$19 million in 2007 to about US$30 million in 20145 as shown in Figure 4.
Furthermore, Hichaambwa and Tschirley (2010) report that brokerage in this market is unregulated and brokers usually charge farmers unofficial or hidden commissions. Total commission charged by brokers is about 20% of the price retail traders pay for the produce at this market with 10% being the official or transparent or agreed commission between the farmer and the broker. At the same time, the brokers literally force the farmers to sell through them. Quite often, farmers have to wait nearby within the vicinity while their produce is being sold lest the broker takes off with the sales proceeds, and this negates one of the fundamental benefits of brokerage, i.e., allowing the principal (farmer) time to do other activities while their produce is being sold. In addition, no official market information system exists leaving farmers to rely on information obtained from other farmers or the brokers.
5 The figure could increase at least five fold when other many types of fresh produce traded in the market are taken into account.
Figure 3. Fresh Produce Wholesaling at Soweto Market in Lusaka
8
Figure 4. Estimated Annual Trade Flows of Tomato, Rape, and Onion in Soweto Market
Source: IAPRI 2007 to 2014.
1.5. Study Objectives
The main objective of the study is to provide evidence that will facilitate the raising of the policy profile among sector stakeholders of smallholder horticulture with regard to broad based rural income growth and poverty reduction potential through comparative analysis with maize in the following aspects:
1) Value to the economy added through production and trade flows; 2) Household level profitability using Gross Margin (GM) analysis and GM returns to
total variable costs (TVC); and 3) Household income effects of market participation.
-
5
10
15
20
25
30
35
2007 2008 2009 2010 2011 2012 2013 2014
Val
ue
in U
S$
mill
ion
Year
9
2. DATA AND METHODS
Firstly, the study intends to substantiate that smallholder horticulture contributes significantly to the national economy in general and that of rural areas in particular through values produced and marketed which form part of the overall GDP in spite of current lack of public and limited private sector support. The study aims to demonstrate the relative magnitude of this contribution compared to that of maize where almost all public resources in the agricultural sector are spent every year. We use descriptive analysis with the nation-wide representative Rural Livelihoods Survey (RALS) data of 2012 covering 8,094 randomly selected households conducted by the Central Statistical Office (CSO) in conjunction the Ministry of Agriculture and Livestock (MAL) and IAPRI. The survey interviewed sampled households with respect to the 2010/11 production and 2011/12 marketing season. This technique is used to address the first objective of the study.
Secondly, the study intends to examine the relative profitability of smallholder horticulture over maize, as participation in production and marketing of either crop will affect changes in income and income status. This aspect is one of the indicators of the significantly higher potential pay offs of investing in the subsector in as far as income growth and broad based poverty reduction of smallholder households is concerned. We use descriptive analysis of the Zambia National Farmers’ Union Enterprise Budgets data of 2014 as well as the IAPRI Horticultural Trade Flows and Price Dynamics database (2005 to 2014). This is used to address the second objective of the study.
And finally, to address the third objective of the study, we use endogenous switching regression framework (in order to control for selection bias) to estimate the comparative household income impacts of participation in horticultural and maize markets based on the method of Lokshin and Sajaia (2004), also applied by Rao and Qaim (2010) and Abdulai and Huffman (2014). We view participation in horticulture and maize markets as a binary choice decision problem as these smallholder households try to maximize utility or net returns from their farming activities. The probability to participate is influenced by the expected utility to participate and not to participate and the choice is based by the option with higher returns. Some of the variables determining the probability to participate also influence the income that the smallholder earns from their livelihood activities.
We use the conditional mixed process (cmp) by Roodman (2011) for the full information maximum likelihood estimation of endogenous switching regression. This allows for more freedom in variable specification of the switching regime or selection equation. The approach involves jointly estimating the determinants of income with and without participation, firstly in horticultural and then maize markets, as well those of the participation as the selection equation. To measure the impact of participation, we estimate the conditional expectation of income that participants would have with and without market participation.
In addition to the RALS, the study uses the 2008 Supplemental Survey containing 8,094 randomly selected household interviews with respect to the 2006/7 production and 2007/8 marketing season carried out by CSO in conjunction with MAL and Michigan State University’s Food Security Research Project (FSRP) (see Megill 2004 for sampling details). The two data sets were pooled to account for some variation over time for analysis, with the time dimension being controlled for by season-specific measures of localized rainfall and its distribution as measured by the coefficient of variation. Commodity prices and/or values were all inflated to 2012 levels using the CSO Consumer Price Indices.
10
The variables captured in the data and used in this analysis were classified into household demographic characteristics, farm assets and social capital, market accessibility and behavior, local rainfall conditions, and the local indicators of governmental activity within the agricultural sector.
2.1. Demographic Characteristics
These included the sex, age, and educational level of household head and number of household adult equivalents. These variables give an indication of the human capital endowment of the household through the head. Female-headed households in the rural parts of Zambia tend to face greater social barriers to income and asset accumulation than their male-headed counterparts (Farnworth, Akamandisa, and Hichaambwa 2011). While older household heads may be more experienced and achieve better farming outcomes, younger and more educated ones may be amenable to change away from the maize monoculture that has characterized Zambian agriculture since independence, adopt new farming ideas, and navigate the horticultural marketing system. Horticultural production is labour intensive and it is expected that households with more adult equivalents would be in a better position to meet this requirement. These variables were also included in both the selection and the income equations.
2.2. Farm Assets
Wealth and differential access to capital are often-cited factors for farmers achieving differential farming outcomes (Carter 2000). We use the total land owned or farm size as well as the total value of productive assets (implements and livestock) owned in the year prior to the survey year to measure this factor. The value of productive assets was included in both equations while the farm size was only included in the income equation.
2.3. Social Capital
This is captured through household head blood relationship to the local chief or headman and household head polygamously married. Having close ties to village authorities may be important in helping these households gain an advantage over other households in terms of resource access (Chapoto et al. 2011). Anecdotal evidence shows that polygamously married households tend to be wealthier. These variables were included in both equations.
2.4. Market Characteristics
Due to perishability and the lack of cold chains in Zambia, access to markets is very important in horticultural production and marketing. We use the average hours to the nearest urban center with at least 100,000 inhabitants as well as kilometers to the nearest tarred or paved road as measures of market accessibility. Where markets are accessible, price variation can be extreme and affect market participation. We capture price variation using the ration of lagged four-year annual average coefficient of variation of the prices of tomato, cabbage, rape, and Chinese cabbage, the predominantly consumed vegetables in Zambia, to that of maize. These were computed from CSO’s district-level retail price database. Market characteristic variables were used as the exclusion variables excluded from the income equations.
11
2.5. Weather Conditions
Weather conditions, especially rainfall amounts and its distribution, plays a very important role in level of crop production and productivity in Zambia—so much so, that whether or not the country records a bumper harvest of its staple food crop, maize, depends on this factor (Burke, Jayne, and Chapoto 2010). District rainfall data was obtained from the TAMSAT African Rainfall Climatology and Time-Series dataset (Maidment et al. 2014) and its distribution was captured from its coefficient of variation.
2.6. Main Policy Environment
The main government policy instruments in the agricultural sector are focused on maize input subsidies and maize market (price and quantities) subsidies. These public investments are likely to alter the incentives to participate in horticultural relative to maize markets. The effects of these polices were measured as:
a. The percentage of households in a Standard Enumeration Area (SEA6), the primary survey sampling units, receiving inputs under FISP; and
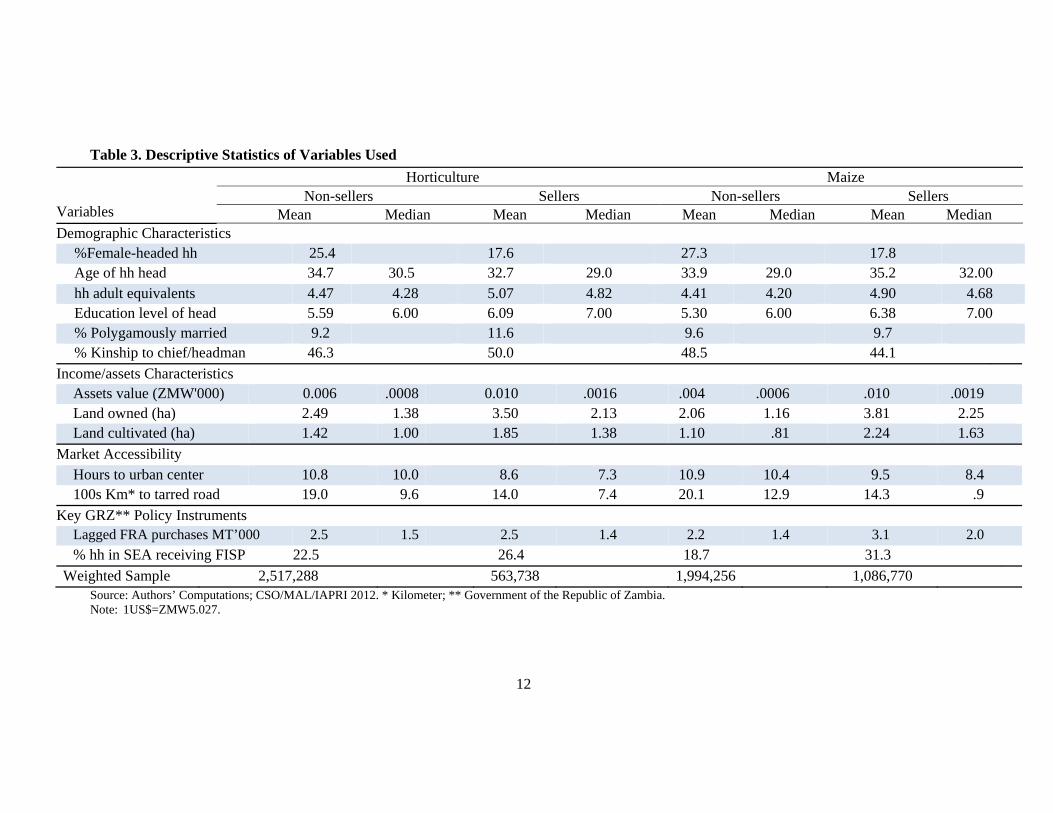
b. Lagged district maize purchases in thousand metric tons (mt) by FRA. Table 3 presents the descriptive statistics of the sample households. District fixed effects of all time varying variables (time averages) were included in the models in order to control for some unobserved heterogeneity. The dependent variable of both income equations was a log of household income.
6 SEAs are the lowest geographical sampling units used by CSO and were the primary sampling units in the Supplemental Surveys and RALS. An SEA typically contains 100-200 households.
12
Table 3. Descriptive Statistics of Variables Used
Variables
Horticulture Maize Non-sellers Sellers Non-sellers Sellers
Mean Median Mean Median Mean Median Mean Median Demographic Characteristics
%Female-headed hh 25.4 17.6 27.3 17.8 Age of hh head 34.7 30.5 32.7 29.0 33.9 29.0 35.2 32.00 hh adult equivalents 4.47 4.28 5.07 4.82 4.41 4.20 4.90 4.68 Education level of head 5.59 6.00 6.09 7.00 5.30 6.00 6.38 7.00 % Polygamously married 9.2 11.6 9.6 9.7 % Kinship to chief/headman 46.3 50.0 48.5 44.1
Income/assets Characteristics Assets value (ZMW'000) 0.006 .0008 0.010 .0016 .004 .0006 .010 .0019 Land owned (ha) 2.49 1.38 3.50 2.13 2.06 1.16 3.81 2.25 Land cultivated (ha) 1.42 1.00 1.85 1.38 1.10 .81 2.24 1.63
Market Accessibility Hours to urban center 10.8 10.0 8.6 7.3 10.9 10.4 9.5 8.4 100s Km* to tarred road 19.0 9.6 14.0 7.4 20.1 12.9 14.3 .9
Key GRZ** Policy Instruments Lagged FRA purchases MT’000 2.5 1.5 2.5 1.4 2.2 1.4 3.1 2.0
% hh in SEA receiving FISP 22.5 26.4 18.7 31.3
Weighted Sample 2,517,288 563,738 1,994,256 1,086,770 Source: Authors’ Computations; CSO/MAL/IAPRI 2012. * Kilometer; ** Government of the Republic of Zambia. Note: 1US$=ZMW5.027.

13
3. OPPORTUNITIES IN HORTICTURAL MARKET PARTICIPATION
Horticultural production and marketing may provide the greatest opportunity of any set of crops for land constrained, poor smallholder farmers to escape poverty through agricultural commercialization. This is due to its high labour intensity, high production value per unit land area, and short production cycles that allow for successfully engaging on a number of cycles in any given year. Tschirley et al. (2012) note that a relatively market oriented smallholder in Zambia might sell 1 to 2 metric tons of maize at a price ranging from US$0.12 to US$0.25 per kg, depending on the year and sales channel. Total gross revenue thus, might range from US$120 to US$500, nearly all of it occurring immediately after harvest. By contrast, the average smallholder producing tomato may produce 10-15 metric tons (on less land) over several months and sell it at an average price of US$0.30-0.35/kg, for a total gross value of US$3,000 to US$5,250—10 to 30 times higher than typical maize sales values. The following analysis further assesses opportunities for smallholder broad income growth and poverty reduction that are given by horticultural production and marketing. It starts by looking at the relative value contribution to the national GDP followed by profitability per unit of land and income effects of market participation relative to that of maize. This is important because one of the key dimensions of achieving poverty reduction through agricultural growth is to better incorporate the rural majority with small land sizes, and particularly those that are headed by women, into a process of commercialization. This is because poverty is particularly concentrated in this group.
3.1. Comparative Smallholder Horticulture and Maize Values to the Economy
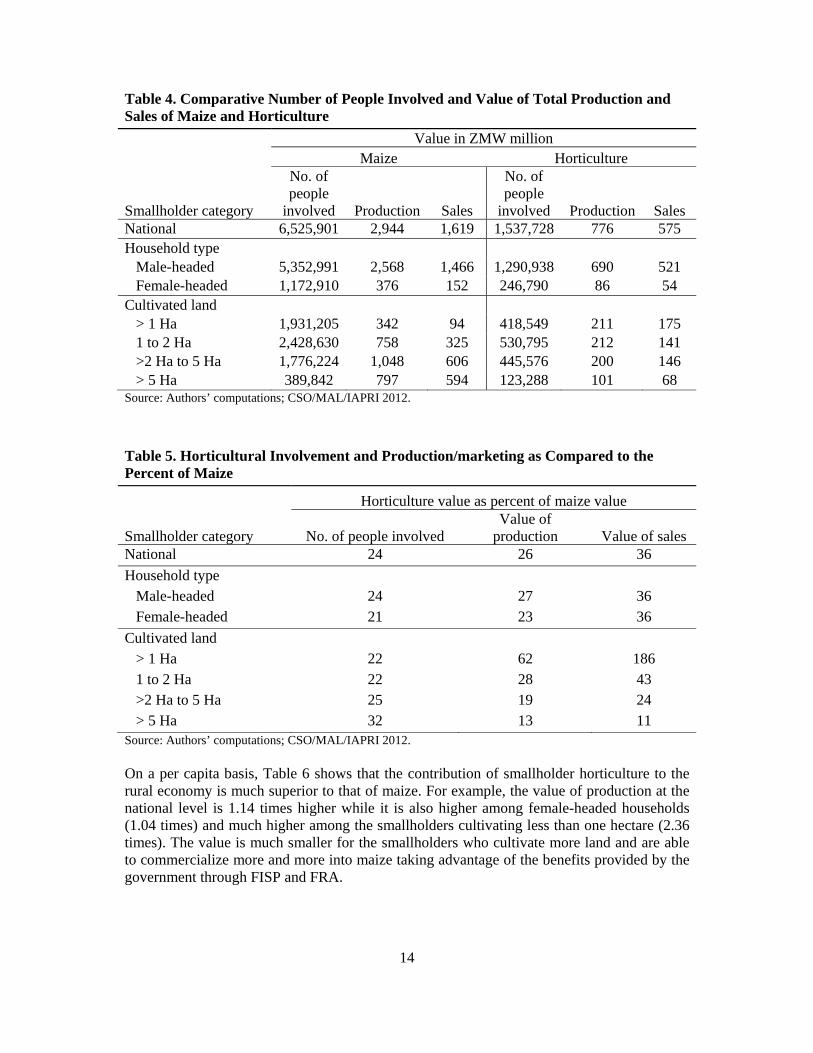
At the national level, the maize sector during the 2010/11 production and 2011/12 marketing season involved 6.5 million people producing ZMW 2.9 million worth of produce of which ZMW 1.6 million (56%) was sold (Table 4). This is understandable considering the amount of public support the subsector receives which results in over 90% of smallholder households in Zambia growing the crop. During the same period, the table shows that the horticultural sector involved 1.5 million people producing ZMW 0.8 million of which ZMW 0.6 million (74%) was sold. The commercialization or marketing index of horticulture was much higher (74% compared to 56%) while, in spite of no public or limited private/civil society sector support to the smallholder horticultural subsector, the value of production was 26% that of maize while the level of sales were 36% those of maize. Table 5 shows the levels of involvement and values of production and marketing of horticulture as a percentage of the values of maize by gender, cultivated land category, and poverty status. Some of the striking features are that:
1) In spite of the above comparative production and sales values, only about a quarter of the people are involved in smallholder horticulture compared to the maize subsector; and
2) The value of horticultural sales were 1.86 times that of maize among the smallholders cultivating less than one hectare which means that horticulture provides unique opportunities for commercialization, income growth, and broad based poverty reduction for the land constrained smallholder households.
14
Table 4. Comparative Number of People Involved and Value of Total Production and Sales of Maize and Horticulture
Smallholder category
Value in ZMW million Maize Horticulture
No. of people
involved Production Sales
No. of people
involved Production Sales National 6,525,901 2,944 1,619 1,537,728 776 575 Household type
Male-headed 5,352,991 2,568 1,466 1,290,938 690 521 Female-headed 1,172,910 376 152 246,790 86 54
Cultivated land > 1 Ha 1,931,205 342 94 418,549 211 175 1 to 2 Ha 2,428,630 758 325 530,795 212 141 >2 Ha to 5 Ha 1,776,224 1,048 606 445,576 200 146 > 5 Ha 389,842 797 594 123,288 101 68
Source: Authors’ computations; CSO/MAL/IAPRI 2012.
Table 5. Horticultural Involvement and Production/marketing as Compared to the Percent of Maize
Smallholder category
Horticulture value as percent of maize value
No. of people involved Value of
production Value of sales National 24 26 36
Household type Male-headed 24 27 36 Female-headed 21 23 36
Cultivated land > 1 Ha 22 62 186 1 to 2 Ha 22 28 43 >2 Ha to 5 Ha 25 19 24 > 5 Ha 32 13 11
Source: Authors’ computations; CSO/MAL/IAPRI 2012. On a per capita basis, Table 6 shows that the contribution of smallholder horticulture to the rural economy is much superior to that of maize. For example, the value of production at the national level is 1.14 times higher while it is also higher among female-headed households (1.04 times) and much higher among the smallholders cultivating less than one hectare (2.36 times). The value is much smaller for the smallholders who cultivate more land and are able to commercialize more and more into maize taking advantage of the benefits provided by the government through FISP and FRA.

15
Table 6. Comparative Mean Value of Production and Sales per Capita
Smallholder category
Mean value per capita in ZMW Horticultural production value
as % of maize Maize Horticulture
Production Sales Production Sales National 504 521 573 406 114 Type of household
Male-headed 528 546 606 448 115 Female-headed 419 405 434 230 104
Cultivated land < 1 Ha 233 209 549 434 236 1 to 2 Ha 372 299 519 315 140 2 Ha to 5 Ha 717 608 452 307 63 > 5 Ha 2,488 2,148 857 564 34
Source: Authors’ computations; CSO/MAL/IAPRI 2012.
3.2. Comparative Smallholder Horticulture and Maize Profitability
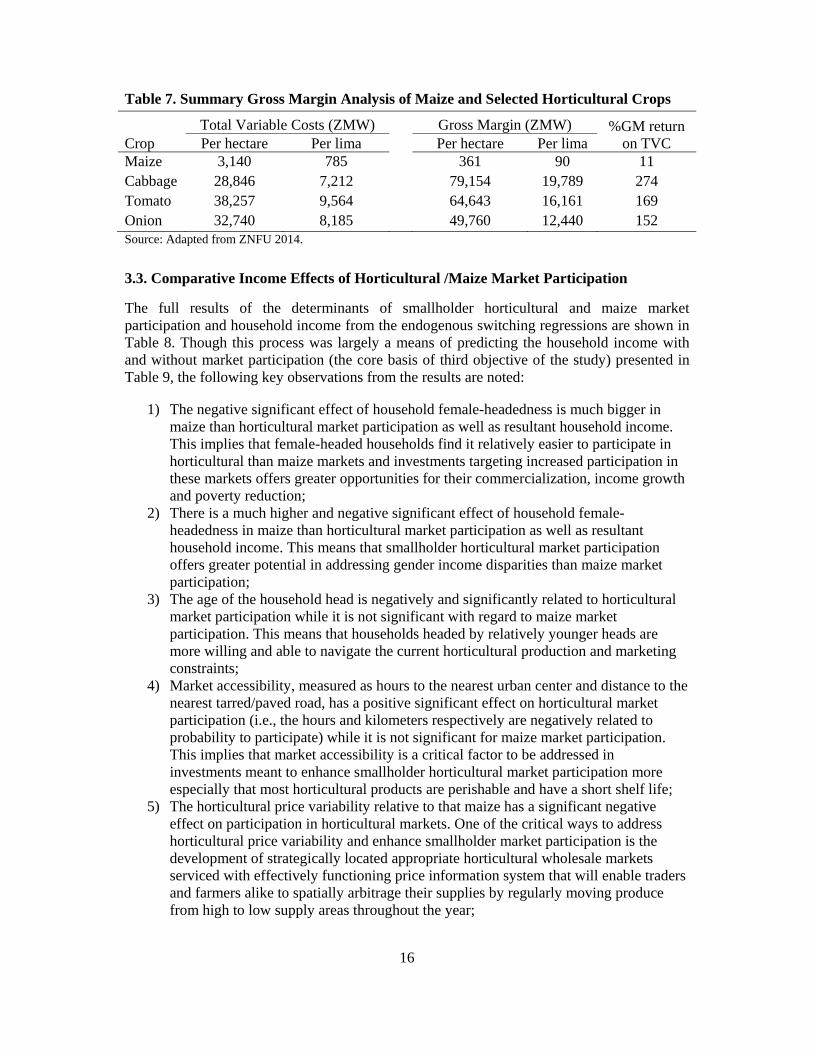
Gross margin analysis was used to compare the relative profitability of smallholder horticulture compared to that of maize at the household level. The GM as well as the percent GM return to TVC of maize was compared to that of cabbage, tomato, and onion, which are some of the four main staple vegetables (including rape) that are produced by smallholder farmers and mostly consumed in urban areas. The GM analysis was conducted on a per hectare as well as lima7 basis as it may be too expensive for most smallholder farmers to cultivate a hectare of vegetables due to the huge costs involved. The detailed analysis of the GM is presented in Appendix 1 to 4 while the summary is shown in Table 7. Table 7 shows very superior GM of all horticultural crops relative to that of maize with the highest being cabbage (219 times that of maize), followed by tomato (179 times), and onion (138 times). The percent GM return on TVC of these respective horticultural crops was 263, 158, and 141 percentage points respectively more than that of maize.
It should be noted, however, that to achieve these levels of profitability in horticultural crops much more capital (financial resources) is necessary, as well as know-how, especially to control numerous pests and diseases. Also required is the knowledge of how to navigate the marketing system which is riddled with poor infrastructure (hard market infrastructure) and lacks price information, grades and standards, effective brokerage systems, and appropriate management systems (soft market infrastructure). This calls for more investments in credit provisions and extension services as well as improving market performance. Smallholder farmers who have been able to navigate the poor marketing systems have been able to grow their horticultural production and marketing, starting small and re-investing income streams to unbelievable levels (Chapoto et al. 2013; Tschirley et al. 2012).
7 A lima is a quarter of a hectare.
16
Table 7. Summary Gross Margin Analysis of Maize and Selected Horticultural Crops
Crop Total Variable Costs (ZMW) Gross Margin (ZMW) %GM return
on TVC Per hectare Per lima Per hectare Per lima Maize 3,140 785 361 90 11 Cabbage 28,846 7,212 79,154 19,789 274 Tomato 38,257 9,564 64,643 16,161 169 Onion 32,740 8,185 49,760 12,440 152 Source: Adapted from ZNFU 2014.
3.3. Comparative Income Effects of Horticultural /Maize Market Participation
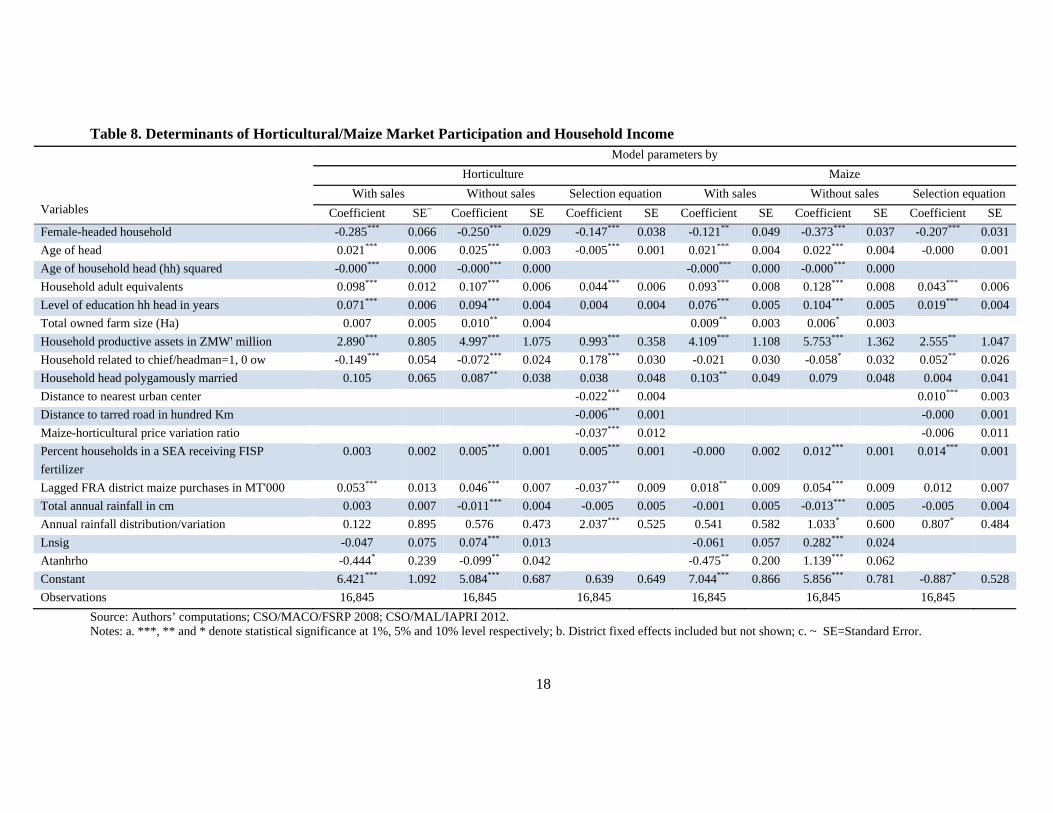
The full results of the determinants of smallholder horticultural and maize market participation and household income from the endogenous switching regressions are shown in Table 8. Though this process was largely a means of predicting the household income with and without market participation (the core basis of third objective of the study) presented in Table 9, the following key observations from the results are noted:
1) The negative significant effect of household female-headedness is much bigger in maize than horticultural market participation as well as resultant household income. This implies that female-headed households find it relatively easier to participate in horticultural than maize markets and investments targeting increased participation in these markets offers greater opportunities for their commercialization, income growth and poverty reduction;
2) There is a much higher and negative significant effect of household female-headedness in maize than horticultural market participation as well as resultant household income. This means that smallholder horticultural market participation offers greater potential in addressing gender income disparities than maize market participation;
3) The age of the household head is negatively and significantly related to horticultural market participation while it is not significant with regard to maize market participation. This means that households headed by relatively younger heads are more willing and able to navigate the current horticultural production and marketing constraints;
4) Market accessibility, measured as hours to the nearest urban center and distance to the nearest tarred/paved road, has a positive significant effect on horticultural market participation (i.e., the hours and kilometers respectively are negatively related to probability to participate) while it is not significant for maize market participation. This implies that market accessibility is a critical factor to be addressed in investments meant to enhance smallholder horticultural market participation more especially that most horticultural products are perishable and have a short shelf life;
5) The horticultural price variability relative to that maize has a significant negative effect on participation in horticultural markets. One of the critical ways to address horticultural price variability and enhance smallholder market participation is the development of strategically located appropriate horticultural wholesale markets serviced with effectively functioning price information system that will enable traders and farmers alike to spatially arbitrage their supplies by regularly moving produce from high to low supply areas throughout the year;

17
6) The proportion of households receiving FISP packs in a SEA significantly increase participation in maize markets, more than horticultural ones. Anecdotal evidence shows that smallholder farmers sometimes use fertilizer acquired through FISP to grow horticultural crops and proceeds from horticultural production and marketing to meet their contributions to the input packs. This suggests that using the flexible electronic voucher in distributing FISP inputs would more greatly benefit horticultural production and marketing than is presently the case; and
7) The lagged amount of district Food Reserve Agency (FRA) maize purchases significantly reduce the probability of smallholders to participate in horticultural markets but have no significant effect on participation in maize ones. This implies that government expenditure on maize marketing through FRA impacts negatively on the any efforts to diverse Zambia agriculture from maize monoculture.
It is also important to note that most of the variables used in the models significantly affect the probability to participate (selection equations) as well as the levels of household income. This means that there is joint determination of participation and income. The term sigma (Insig in Table 8) is statistically different from zero, which means that there is endogenous switching or self-selection of the market participants and it was important that selection bias was controlled. (Maddala 1986). Furthermore, the rho (antarho in Table 8) terms are statistically significant for both market participants and non-participants, further indicating that self-selection occurred in the decision to participate in horticultural and maize markets (Abdullai and Huffman 2014). The higher negative values of rho among the horticultural and maize market participants than their non-participating counterparts indicate positive selection bias. This suggests that smallholder households with above average income have a higher probability to participate in these markets.
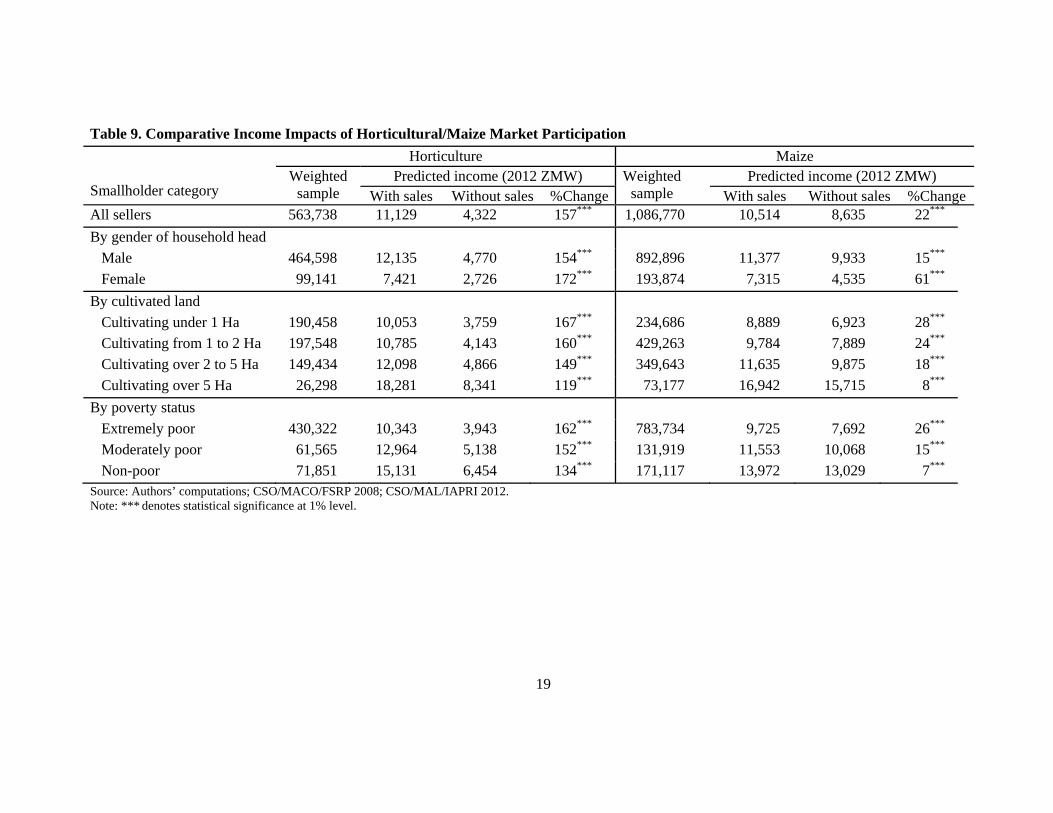
Following the joint income and selection equation, we use the predicted income with and without8 horticultural and maize market participation among the market participants to assess the impact of participation on income. In other words, based on the model, we estimated the relative change in household income of the market participants resulting from market participation by comparing it with the income they would have earned without this market participation. Since our dependent variables of both income equations is log income, we took the anti-log of the predicted values to convert them to actual average income in ZMW. The results are shown in Table 9 by different categories of the participants.
Table 9 shows that there are significant net income increases as a result of smallholder participation in horticultural and maize markets, but the impacts are much higher for the participation in horticultural than the maize markets. Participation in horticultural markets results in a net income increase of 157% compared to 22% for maize markets at the national level; participation of female-headed households in horticultural and maize markets results in incremental income of 172% and 61% respectively, while that of smallholders cultivating up to 2 hectares ranges from 160% to 167% for horticultural markets and only 24% to 28% for maize markets. Among the poor households, income increases by 152% to 162% compared to only 15% to 26% by participation in the horticultural and maize markets respectively. However, because horticultural products are perishable, market access conditions are important for any horticultural commercialization strategy to be successful.
8 This is the income market participants would have earned had they not participated in the respective markets.
18
Table 8. Determinants of Horticultural/Maize Market Participation and Household Income
Variables
Model parameters by
Horticulture Maize
With sales Without sales Selection equation With sales Without sales Selection equation
Coefficient SE~ Coefficient SE Coefficient SE Coefficient SE Coefficient SE Coefficient SE
Female-headed household -0.285*** 0.066 -0.250*** 0.029 -0.147*** 0.038 -0.121** 0.049 -0.373*** 0.037 -0.207*** 0.031
Age of head 0.021*** 0.006 0.025*** 0.003 -0.005*** 0.001 0.021*** 0.004 0.022*** 0.004 -0.000 0.001
Age of household head (hh) squared -0.000*** 0.000 -0.000*** 0.000 -0.000*** 0.000 -0.000*** 0.000
Household adult equivalents 0.098*** 0.012 0.107*** 0.006 0.044*** 0.006 0.093*** 0.008 0.128*** 0.008 0.043*** 0.006
Level of education hh head in years 0.071*** 0.006 0.094*** 0.004 0.004 0.004 0.076*** 0.005 0.104*** 0.005 0.019*** 0.004
Total owned farm size (Ha) 0.007 0.005 0.010** 0.004 0.009** 0.003 0.006* 0.003
Household productive assets in ZMW' million 2.890*** 0.805 4.997*** 1.075 0.993*** 0.358 4.109*** 1.108 5.753*** 1.362 2.555** 1.047
Household related to chief/headman=1, 0 ow -0.149*** 0.054 -0.072*** 0.024 0.178*** 0.030 -0.021 0.030 -0.058* 0.032 0.052** 0.026
Household head polygamously married 0.105 0.065 0.087** 0.038 0.038 0.048 0.103** 0.049 0.079 0.048 0.004 0.041
Distance to nearest urban center -0.022*** 0.004 0.010*** 0.003
Distance to tarred road in hundred Km -0.006*** 0.001 -0.000 0.001
Maize-horticultural price variation ratio -0.037*** 0.012 -0.006 0.011
Percent households in a SEA receiving FISP
fertilizer
0.003 0.002 0.005*** 0.001 0.005*** 0.001 -0.000 0.002 0.012*** 0.001 0.014*** 0.001
Lagged FRA district maize purchases in MT'000 0.053*** 0.013 0.046*** 0.007 -0.037*** 0.009 0.018** 0.009 0.054*** 0.009 0.012 0.007
Total annual rainfall in cm 0.003 0.007 -0.011*** 0.004 -0.005 0.005 -0.001 0.005 -0.013*** 0.005 -0.005 0.004
Annual rainfall distribution/variation 0.122 0.895 0.576 0.473 2.037*** 0.525 0.541 0.582 1.033* 0.600 0.807* 0.484
Lnsig -0.047 0.075 0.074*** 0.013 -0.061 0.057 0.282*** 0.024
Atanhrho -0.444* 0.239 -0.099** 0.042 -0.475** 0.200 1.139*** 0.062
Constant 6.421*** 1.092 5.084*** 0.687 0.639 0.649 7.044*** 0.866 5.856*** 0.781 -0.887* 0.528
Observations 16,845 16,845 16,845 16,845 16,845 16,845
Source: Authors’ computations; CSO/MACO/FSRP 2008; CSO/MAL/IAPRI 2012. Notes: a. ***, ** and * denote statistical significance at 1%, 5% and 10% level respectively; b. District fixed effects included but not shown; c. ~ SE=Standard Error.
19
Table 9. Comparative Income Impacts of Horticultural/Maize Market Participation
Smallholder category
Horticulture Maize Weighted
sample Predicted income (2012 ZMW) Weighted
sample Predicted income (2012 ZMW)
With sales Without sales %Change With sales Without sales %Change All sellers 563,738 11,129 4,322 157*** 1,086,770 10,514 8,635 22***
By gender of household head
Male 464,598 12,135 4,770 154*** 892,896 11,377 9,933 15***
Female 99,141 7,421 2,726 172*** 193,874 7,315 4,535 61***
By cultivated land
Cultivating under 1 Ha 190,458 10,053 3,759 167*** 234,686 8,889 6,923 28***
Cultivating from 1 to 2 Ha 197,548 10,785 4,143 160*** 429,263 9,784 7,889 24***
Cultivating over 2 to 5 Ha 149,434 12,098 4,866 149*** 349,643 11,635 9,875 18***
Cultivating over 5 Ha 26,298 18,281 8,341 119*** 73,177 16,942 15,715 8***
By poverty status
Extremely poor 430,322 10,343 3,943 162*** 783,734 9,725 7,692 26***
Moderately poor 61,565 12,964 5,138 152*** 131,919 11,553 10,068 15***
Non-poor 71,851 15,131 6,454 134*** 171,117 13,972 13,029 7*** Source: Authors’ computations; CSO/MACO/FSRP 2008; CSO/MAL/IAPRI 2012. Note: *** denotes statistical significance at 1% level.
20
4. CONCLUSIONS AND POLICY IMPLICATIONS
4.1. Conclusions
The high and stagnant rural poverty levels in Zambia require a policy paradigm shift to focus investment in areas with high returns in terms of smallholder incomes. This analysis has shown that enhancing conditions for smallholder participation in horticultural markets offers significant income earning opportunities much more than participation in maize markets, particularly for poor and land-constrained farmers. On average horticultural marketing leads to a 157% increase in total household income compared to 22% for participation in maize markets, holding other factors constant. These income gains are more pronounced for smallholders cultivating less than a hectare (167%) and for poorer households (162%) compared to only 26% increases for households earning less than US$1.25 per day per capita. Furthermore, participation in horticultural markets appears to reduce the gender gap in rural household income: female-headed households that market horticultural output are relatively less disadvantaged than their male-headed counterparts, as compared with female-headed households that do not market horticulture.
4.2. General Recommendations
Our analysis shows that remoteness (i.e., distance from infrastructure and markets) and price volatility are the most important factors, among several, that limit smallholder participation in horticultural markets. Therefore, policies and investments need to designed and implemented to improve accessibility in high potential horticultural production areas, namely those in proximity to urban markets. Improved market information systems including brokerage systems, grades and standards, and appropriate management models could have important enabling impacts on horticultural market development in smallholder areas. Furthermore, better transportation and communication infrastructure will lower the costs of spatial arbitrage facilitated by effective price information systems, which should also help to decrease localized price variability. These investments should be complemented with public extension support for horticultural production, with particular emphasis on pest management. All these would contribute to facilitating increased smallholder participation in the horticultural supply chains and hence, increase their chances of moving out of poverty on one hand, and increase urban supply of high quality horticultural produce at competitive prices on the other.
4.3. Recommendations on Development of Horticultural Wholesale Markets
As a matter of priority, we recommend investments to develop strategically located and proper horticultural wholesale markets in the country with links to markets in the region starting with Lusaka and the Copperbelt. That only 21% of the smallholder households in Zambia participate in horticultural supply chains suggests that new demand points could enjoy substantial supply response if they link effectively to the smallholder farm sector. When developed, the horticultural wholesale markets will provide this vital and effective link.
In this proposed development, the most important first step is to develop a new horticultural wholesale market on the outskirts of the city of Lusaka, as the current site is illegally settled, the space is inadequate, and its access roads are heavily congested with traffic. The construction can be based on appropriate cost-effective designs with the structure encompassing a concrete slab (flooring) to facilitate drainage and cleaning for a sanitary environment, designated entry and exit points for vehicular and human traffic, loading and

21
offloading bays, storage facilities (which may or may not have refrigeration facilities) and roofing among others. Such a market could be developed through Private Public Partnerships (PPPs) initiatives as provided for under the Public-Private Partnerships Act No. 14 of 2009 of the Laws of Zambia. Anecdotal evidence shows that the New Soweto Market cost about US$10 million and we think the horticultural wholesale market would almost the same amount considering the infrastructure which is available this market. Such an investment can be easily be recouped from commissions charged over 5 to 10 years with projected annual trade flows exceeding US$100 million annually considering that these currently are estimated at about US$30 million for only tomato, rape, and onion and that the flows will increase with better infrastructure and management performance.
The second step would be the development of a legal and institutional framework under which brokerage activities at the market can be undertaken in order to achieve a win-win outcome for all stakeholders. An example of a such a situation is at the Johannesburg market where the market charges 5% of all sales, while the trained, registered, and regulated brokers negotiate a commission of about 7.5% which adds up to about 12.5% with arrangements in place to give the farmer or trader better services. For example, a farmer at the markets would only need to drive in, have his produced weighed, offloaded where his broker is located, and drive out; his/her sales would later be deposited for him/her in his/her bank account. In Soweto Market, brokers take all the 20% of sales without giving anything to the market to be used for maintenance and service provision purposes while farmers or first sellers literally get no service at all. Poor brokerage has significantly contributed to smallholder farmers’ disinterest in marketing horticultural produce, which is unfortunate considering its potential for rural poverty reduction. In order to operate, brokers will need to be trained in principles and practices of brokerages, issued with certificates and registered and follow established rules and regulations.
Another urgent component of the investment is to implement a horticultural market information system. iDE Zambia has over the past year been implementing some horticultural information service on a pilot basis covering a number of selected markets in the city, though at the time of reporting additional funds were being sought to continue implementing the service. Such mobile phone based price information system could be further supported with electronic billboards installed at the market for displaying hourly prices.
Once the Lusaka market has been completed and is functional, it would then be prudent to replicate this market development in at least two other markets (one each on the Copperbelt and Southern or Eastern Province) and, the three of them would act as major links to markets in other parts of the country and indeed to regional markets. Other wholesale markets in other parts of the country can then be developed as the supply chains develop.
Following these developments, smallholders’ active participation in the supply chains can be enhanced through, among other things, development of storage or packing houses in strategic places along the supply chains for bulking produce before transportation to markets. Women farmers and traders will be encouraged to participate in the orderly market system as they are most disadvantaged by the current rule of the jungle system at Soweto market.
This development will benefit farmers, urban consumers, traders, brokers (as more farmers will bring produce their turnover will increase such that their total amount of commissions though charged at a low rate will increase), the city council, government, and even private institutions such as hotels, restaurants, schools, colleges, and hospitals which will be encouraged to source quality fresh produce from an organized wholesale market. This is important considering that over 90% of the fresh produce consumed by urban households in Lusaka is procured from traditional markets, which are largely supplied by such markets.

22
APPENDICES

23
Table A.1. Gross Margin Budget for Smallholder Maize Production in Zambia
Item Unit Rate/ Ha
Unit Price
Amount (ZMW/Ha)
Revenue Maize grain Tons 2.50 1,400.00 3,500Total Revenue 3,500
Variable Costs Seed Kilogram (Kg) 20.00 12.40 248Compound D Kg 150.00 4.00 600Urea Kg 150.00 4.10 615Labour Man-days 50.00 19.03 952Ploughing Lump sum 400.00 1.00 400Transport ZMW/Km/Ton 187.50 1.20 225Packaging ZMW/50 Kg bag 50.00 2.00 100
Total Variable Costs TVC) 3,140Gross Margin (GM) 361%GM Return on TVC 11Source: Adapted from ZNFU 2014.
Table A.2. Gross Margin Budget for Smallholder Cabbage Production in Zambia
Item Unit Rate/HaUnit Price
Amount (ZMW/Ha)
Revenue Maize grain Tons 60.00 1,800.00 108,000 Total Revenue 108,000
Variable Costs Seed Kg 0.50 850.00 425 Compound D Kg 800.00 4.00 3,200 Urea Kg 300.00 4.10 1,230 Alachlor Litres 4.00 27.50 110 Pantera Litres 1.00 90.00 90 Malathion Litres 0.60 55.00 33 Dimethoate Litres 0.16 36.00 6 Bellis Kg 0.80 465.00 372 Copper oxychloride Kg 3.00 46.50 140 Steward Kg 0.15 550.00 83 Labour man-days 120.00 19.03 2,284 Land preparation Lump sum 1,000.00 1.00 1,000 Transport ZMW/Km/Ton 4,500.00 1.20 5,400 Irrigation electricity (power) mm applied 500.00 7.35 3,675 Market agent commission Per cent 108,000.00 0.10 10,800
Total Variable Costs (TVC) 28,846 Gross Margin (GM) 79,154 %GM Return on TVC 274 Source: Adapted from ZNFU 2014.
24
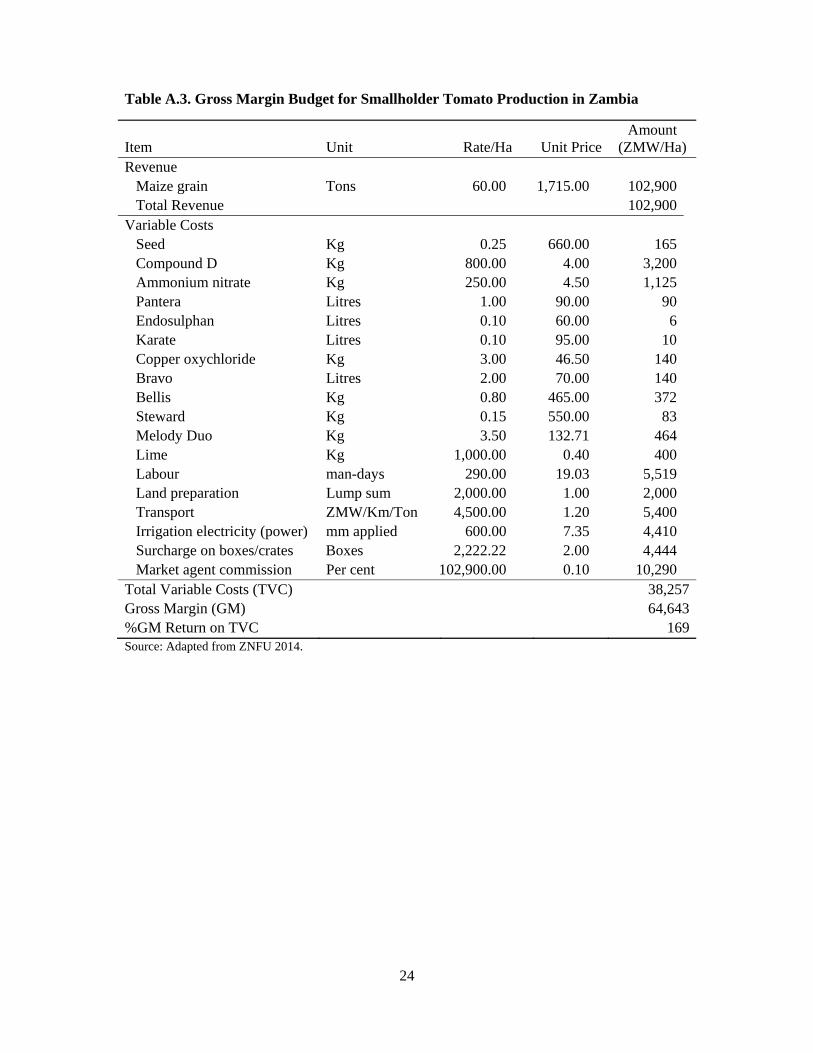
Table A.3. Gross Margin Budget for Smallholder Tomato Production in Zambia
Item Unit Rate/Ha Unit Price Amount
(ZMW/Ha) Revenue
Maize grain Tons 60.00 1,715.00 102,900Total Revenue 102,900
Variable Costs Seed Kg 0.25 660.00 165Compound D Kg 800.00 4.00 3,200Ammonium nitrate Kg 250.00 4.50 1,125Pantera Litres 1.00 90.00 90Endosulphan Litres 0.10 60.00 6Karate Litres 0.10 95.00 10Copper oxychloride Kg 3.00 46.50 140Bravo Litres 2.00 70.00 140Bellis Kg 0.80 465.00 372Steward Kg 0.15 550.00 83Melody Duo Kg 3.50 132.71 464Lime Kg 1,000.00 0.40 400Labour man-days 290.00 19.03 5,519Land preparation Lump sum 2,000.00 1.00 2,000Transport ZMW/Km/Ton 4,500.00 1.20 5,400Irrigation electricity (power) mm applied 600.00 7.35 4,410Surcharge on boxes/crates Boxes 2,222.22 2.00 4,444Market agent commission Per cent 102,900.00 0.10 10,290
Total Variable Costs (TVC) 38,257Gross Margin (GM) 64,643%GM Return on TVC 169Source: Adapted from ZNFU 2014.
25
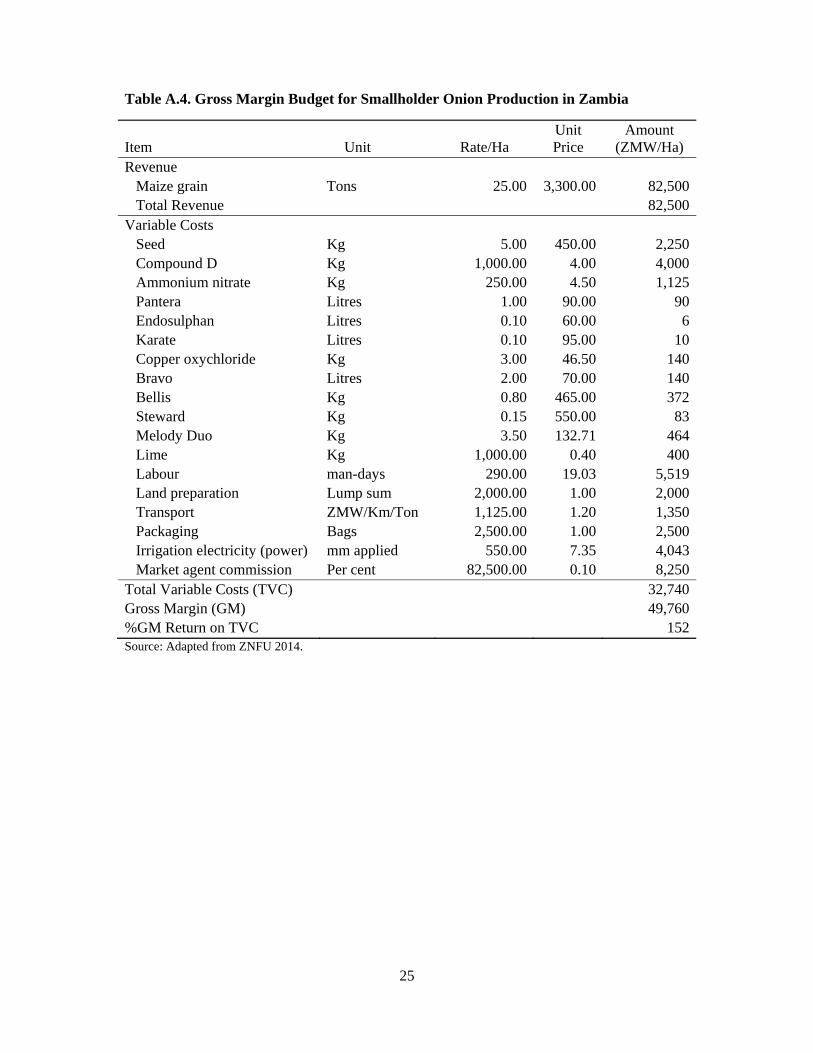
Table A.4. Gross Margin Budget for Smallholder Onion Production in Zambia
Item Unit Rate/Ha Unit Price
Amount (ZMW/Ha)
Revenue Maize grain Tons 25.00 3,300.00 82,500Total Revenue 82,500
Variable Costs Seed Kg 5.00 450.00 2,250Compound D Kg 1,000.00 4.00 4,000Ammonium nitrate Kg 250.00 4.50 1,125Pantera Litres 1.00 90.00 90Endosulphan Litres 0.10 60.00 6Karate Litres 0.10 95.00 10Copper oxychloride Kg 3.00 46.50 140Bravo Litres 2.00 70.00 140Bellis Kg 0.80 465.00 372Steward Kg 0.15 550.00 83Melody Duo Kg 3.50 132.71 464Lime Kg 1,000.00 0.40 400Labour man-days 290.00 19.03 5,519Land preparation Lump sum 2,000.00 1.00 2,000Transport ZMW/Km/Ton 1,125.00 1.20 1,350Packaging Bags 2,500.00 1.00 2,500Irrigation electricity (power) mm applied 550.00 7.35 4,043Market agent commission Per cent 82,500.00 0.10 8,250
Total Variable Costs (TVC) 32,740Gross Margin (GM) 49,760%GM Return on TVC 152Source: Adapted from ZNFU 2014.
26
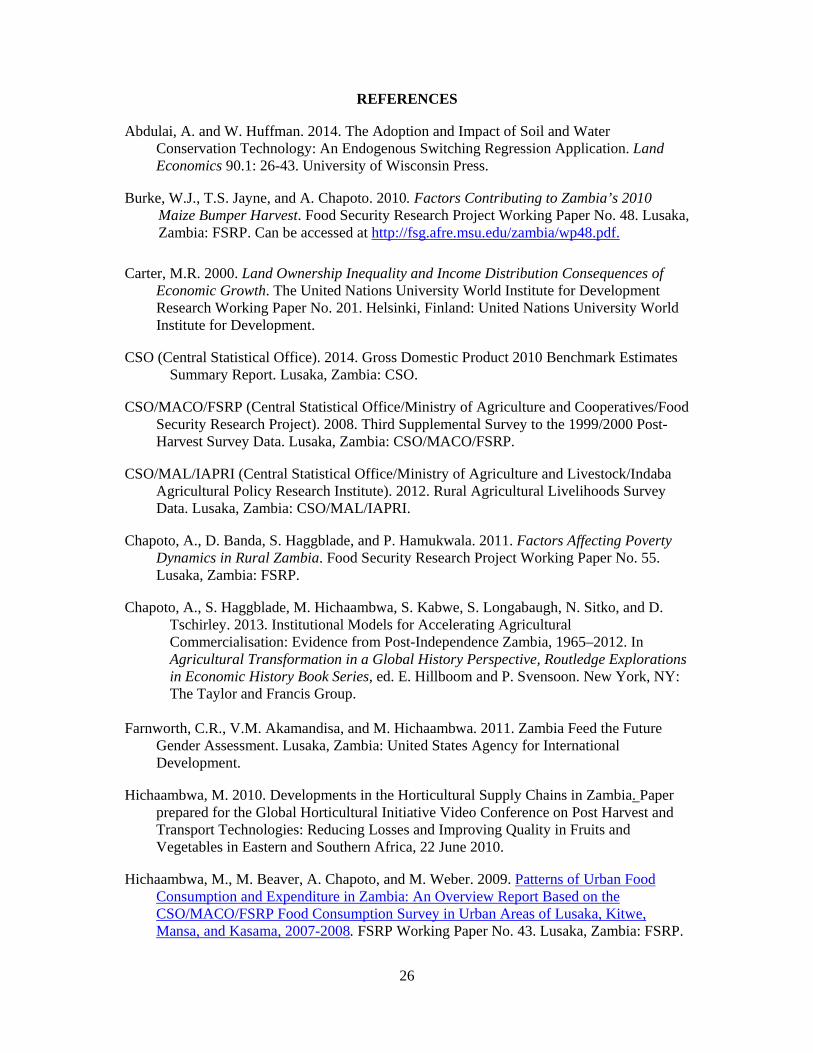
REFERENCES
Abdulai, A. and W. Huffman. 2014. The Adoption and Impact of Soil and Water Conservation Technology: An Endogenous Switching Regression Application. Land Economics 90.1: 26-43. University of Wisconsin Press.
Burke, W.J., T.S. Jayne, and A. Chapoto. 2010. Factors Contributing to Zambia’s 2010 Maize Bumper Harvest. Food Security Research Project Working Paper No. 48. Lusaka, Zambia: FSRP. Can be accessed at http://fsg.afre.msu.edu/zambia/wp48.pdf.
Carter, M.R. 2000. Land Ownership Inequality and Income Distribution Consequences of
Economic Growth. The United Nations University World Institute for Development Research Working Paper No. 201. Helsinki, Finland: United Nations University World Institute for Development.
CSO (Central Statistical Office). 2014. Gross Domestic Product 2010 Benchmark Estimates Summary Report. Lusaka, Zambia: CSO.
CSO/MACO/FSRP (Central Statistical Office/Ministry of Agriculture and Cooperatives/Food Security Research Project). 2008. Third Supplemental Survey to the 1999/2000 Post-Harvest Survey Data. Lusaka, Zambia: CSO/MACO/FSRP.
CSO/MAL/IAPRI (Central Statistical Office/Ministry of Agriculture and Livestock/Indaba Agricultural Policy Research Institute). 2012. Rural Agricultural Livelihoods Survey Data. Lusaka, Zambia: CSO/MAL/IAPRI.
Chapoto, A., D. Banda, S. Haggblade, and P. Hamukwala. 2011. Factors Affecting Poverty Dynamics in Rural Zambia. Food Security Research Project Working Paper No. 55. Lusaka, Zambia: FSRP.
Chapoto, A., S. Haggblade, M. Hichaambwa, S. Kabwe, S. Longabaugh, N. Sitko, and D. Tschirley. 2013. Institutional Models for Accelerating Agricultural Commercialisation: Evidence from Post-Independence Zambia, 1965–2012. In Agricultural Transformation in a Global History Perspective, Routledge Explorations in Economic History Book Series, ed. E. Hillboom and P. Svensoon. New York, NY: The Taylor and Francis Group.
Farnworth, C.R., V.M. Akamandisa, and M. Hichaambwa. 2011. Zambia Feed the Future
Gender Assessment. Lusaka, Zambia: United States Agency for International Development.
Hichaambwa, M. 2010. Developments in the Horticultural Supply Chains in Zambia. Paper prepared for the Global Horticultural Initiative Video Conference on Post Harvest and Transport Technologies: Reducing Losses and Improving Quality in Fruits and Vegetables in Eastern and Southern Africa, 22 June 2010.
Hichaambwa, M., M. Beaver, A. Chapoto, and M. Weber. 2009. Patterns of Urban Food Consumption and Expenditure in Zambia: An Overview Report Based on the CSO/MACO/FSRP Food Consumption Survey in Urban Areas of Lusaka, Kitwe, Mansa, and Kasama, 2007-2008. FSRP Working Paper No. 43. Lusaka, Zambia: FSRP.
27
Hichaambwa, M. and D. Tschirley. 2010. Do Brokers Help or Hinder the Marketing of Fresh Produce in Lusaka? Preliminary Insights from Research. FSRP Policy Brief Number 39. Lusaka, Zambia: FSRP.
Hichaambwa, M. and T.S. Jayne. 2014. Poverty Reduction Potential of Increasing Smallholder Access to Land. IAPRI Working Paper No. 83. Lusaka, Zambia: IAPRI.
IAPRI (Indaba Agricultural Policy Research Institute). 2007 to 2014. Horticultural Trade Flows and Price Dynamics database. Lusaka, Zambia: IAPRI.
Jayne, T.S., N. Mason, W. Burke, A. Shipekesa, A. Chapoto, and C. Kabaghe. 2011. Mountains of Maize, Persistent Poverty. FSRP Policy Synthesis No. 48. Lusaka, Zambia: FSRP. http://fsg.afre.msu.edu/zambia/ps_48.pdf.
Kuteya, A. and IAPRI team. Various years. Analysis of the Zambia Agricultural Sector Budget. Lusaka, Zambia: IAPRI. Can be downloaded at: www.iapri.org.zm
Lokshin, M. and Z. Sajaia. 2004. Maximum Likelihood Estimation of Endogenous Switching Regression Models. The Stata Journal 4.3: 282-289.
Maddala, G.S. 1986. Disequilibrium, Self-selection, and Switching Models. In Handbook of Econometrics, ed. Z. Griliches and D. Intriligator. North-Holland: Elsevier
Maidment, Ross I., David Grimes, Richard P. Allan, Elena Tarnavsky, Marc Stringer, Tim Hewison, Rob Roebeling, and Emily Black. 2014. The 30-year TAMSAT African Rainfall Climatology and Time-series Dataset. Journal of Geophysical Research: Atmospheres 119.18: 10,619-10,644. doi: 10.1002/2014JD021927
Megill, D.J. 2004. Recommendations on Sample Design for Post-Harvest Surveys in Zambia Based on the 2000 Census. FSRP Working Paper No. 11. Lusaka, Zambia: FSRP.
Rao, E.J.O. and M. Qaim. 2010. Supermarkets, Farm Household Income, and Poverty: Insights from Kenya. World Development 39.5: 784-796.
Roodman, D. 2011. Estimating Fully Observed Recursive Mixed-process Models with CMP. Stata Journal 11: 159-206.
Seale, James Jr., Anita Regmi, and Jason Berstein. 2003. International Evidence on Food Consumption Patterns. USDA Technical Bulletin No. 1904. Washington, DC: USDA. http://www.ers.usda.gov/media/285613/tb1904_1_.pdf.
Tschirley, D., M. Hichaambwa, M. Ayieko, J. Cairns, V. Kelly, and M. Mwiinga. 2012. Fresh Produce Production and Marketing Systems in East and Southern Africa - A Comparative Assessment. DRAFT. East Lansing, MI: Michigan State University’s Guiding Investments for Sustainable Agricultural Markets in Africa Project.
Tschirley, D., T. Reardon, M. Dolislager, and J. Snyder. 2014. The Rise of a Middle Class in East and Southern Africa: Implications for Food System Transformation. UN WIDER Working Paper 119. Helsinki, Finland: United Nations University (UNU), World Institute for Development Economics Research (WIDER). Online at: http://www.saipar.org:8080/eprc/handle/123456789/417.

28
Tschirley, D. and M. Hichaambwa. 2010. The Structure and Behaviour of Vegetable Markets Serving Lusaka: Main Report. FSRP Working Paper No. 46. Lusaka, Zambia: FSRP.
Weatherspoon, D.D. and T. Reardon. 2003. The Rise of Supermarkets in Africa: Implications for Agrifood Systems and the Rural Poor. Development Policy Review 21.3: 333-355.
ZNFU (Zambia National Farmers Union). 2014. 2014 Enterprise Budgets. Lusaka, Zambia: ZNFU.