Embed Size (px)
Citation preview

Republic of Kenya
Integrated Pest Management Framework (IPMF)
ForKenya Agricultural Productivity and Agribusiness Project (KAPAP)
andKenya Adaptation to Climate Change in Arid and Semi-Arid Lands
(KACCAL)
February 2009 (revised June 2012)
E1783 v5

EXECUTIVE SUMMARYThe two projects namely; (i) Kenya Agricultural Productivity and Agribusiness Project (KAPAP); (ii) Kenya Adaptation to Climate Change in Arid and Semi-arid Lands (KACCAL) will contribute to the revitalization of agriculture by:
i. Making resources available and strengthen the capacity of agricultural producers and other resource users to: (1) adopt good practices and technologies to mitigate land degradation and achieve greater productivity of crops, trees and livestock; (2) enhance understanding of climate change and its impacts nationally and in local regions; (3) recommend vulnerability assessment, impact monitoring and capacity building framework needs as a response to climate change; and (4) adopt sustainable alternative livelihood options to diversify and increase income, and reduce the pressure on the natural resources
ii. Enhancing the institutional capacity of all relevant stakeholders to promote sustainable land management practices and alternative livelihood strategies based on participatory and demand-driven approaches
iii. Evaluating the impact of existing policies affecting the management of natural resources and contribute to the removal of barriers hindering the widespread adoption of SLM practices and ‘smart agriculture’
iv. Facilitating the exchange of information on best practices in sustainable land management among farmers, communities, extension agents, researchers, development partners, and policy makers
KAPAP and KACCAL are implemented under KAPAP Project Coordination Unit including the secretariat and key experts:
i. National Coordinator, Environmental Expert, M&E’s experts, IT- expert, ii. Regional service units, which are to include and a KAPAP Coordinator and KACCAL
Climate Change Coordinator; and general field officers implementing any of the 3 projectiii. Local community level forming different groups to undertake KAPAP or KACCAL sub-
projects, depending on particular activities being implemented.
The projects address fundamental features of the Government’s strategies for development and poverty alleviation as specified in the Kenya Vision 2030 and in the Agricultural Sector Development Strategy (ASDS) which has specifically identified five critical areas requiring public action in the modernization process of the sector. The projects are designed to fund agricultural policy processes and activities including small-scale, community-based sub-projects that were identified and planned by the communities, with the support of projects’-financed extension teams.
KAPAP covers a period of five years (2010-2014) and focuses on the following:
(i) Improving linkages of agricultural research and extension systems to national, local and regional sector priorities through the implementation of ASDS, NASEP and NARS policies, including improved planning, coordination, funding and implementation;
(ii) Empowerment of producer and other public and private stakeholders and their organizations to plan, design and deliver extension and agribusiness services, aimed at sector transformation/growth, including production and value-addition and linking farmers to input and output markets
(iii) Setting-up of appropriate funding and risk mitigation systems which would lead to the development of on- and off- farm diversification and promote private investment in the sector.
KACCAL, project financed by GEF, will:
i. Contribute to climate change adaptation particularly through sustainable land management.
i

ii. KACCAL will strengthen capacities among national institutions to better assess and respond to current and future climate risks. The project will generate and disseminate climate-related knowledge and strengthen institutional coordination among currently fragmented agencies managing disaster and climate risk.
iii. The project will help communities adopt climate change adaptation strategies and investments. Such investments will help arrest vulnerability among the ASAL population by directly strengthening their resilience to climate risk.
The purpose of this document on Integrated Pest Management (IPM) is to provide a strategic framework for the integration of climate change mitigation measures, smart agriculture, SLM practices and technologies, environmental and pest management considerations in the planning and implementation of the activities to be implemented within the Kenya Agricultural Productivity and Agribusiness Project (KAPAP) and Kenya Adaptation to Climate Change in Arid and Semi-arid Lands (KACCAL). T h i s IPMF has been prepared and revised as a guide for initial screening of the sub-projects for negative impacts which would require attention and mitigation prior to their implementation.
The plan incorporates
i. Guidelines on assessment of the potential impacts of pest management measures within KAPAP a n d K A C C A L p r o j e c t s taking into account the World Bank’s O perational Policy OP 4.09, as well as Kenya’s environmental policies, laws and regulations
ii. Development of screening procedures (including checklists) that will be used as a mechanism in the IPMP for screening potential environmental and social impacts due to sub-project interventions
iii. Provides a guideline for development of appropriate methods to promote an Integrated Pest Management (IPM) approach that will minimize the need for chemical pesticides during each project intervention.
iv. Reviews national environmental policies, legislation, regulatory and administrative frameworks and formulation of recommendations in the context of each of the projects as appropriate is provided
v. Review of the relevant conventions and protocols to which Kenya is a signatoryvi. Management capacity as well as capacity to implement mitigation measures, and
formulation of appropriate recommendations, including the institutional structure and the responsible agencies for implementing the framework, a grievance mechanism
vii. Monitoring and evaluation (M&E) of potential impacts;viii. Evaluation of capacity building and training needs and their costs;
ix. Presentation of an outline on institutional arrangements for IPMx. IPM assessment procedures, monitoring indicators and mitigation strategies, as
appropriate under each of the projects.
It is expected that with the implementation of this framework in the KAPAP pilot sites, and KACCAL districts; small scale farmers will have better access to, and use of IPM knowledge and technologies, which through sustained partnership with service provides, contribute to higher productivity and profitability. It will also contribute to enhancing human, animal and environmental health in the country.
It will also improve beneficiaries’ attention towards smart agriculture, SLM practices and technologies and climate change mitigation measures.
ii

I
Table of Contents
EXECUTIVE SUMMARY................................................................................................................i
ACRONYMS AND ABBREVIATIONS........................................................................................14
1.0 INTRODUCTION................................................................................................................17
1.1 Background.......................................................................................................................17
1.2 Objectives of IPMF..........................................................................................................18
1.3 Description of KAPAP project.........................................................................................18
1.3 Description of KACCAL project.....................................................................................19
1.4 Institutional and Implementation Arrangements.............................................................20
2.0 ECONOMIC IMPACTS OF PESTS....................................................................................23
2.1 Crop Pests.........................................................................................................................23
2.1.1 Impact on Production......................................................................................................23
2.1.2 Impacts on food security.................................................................................................23
2.2 Livestock Pests.................................................................................................................24
2.2.1 Impacts on production.....................................................................................................24
2.2.2 Impacts on human health and the environment.............................................................25
2.3 Economic impact of forest pests......................................................................................25
2.3.1 Impact on Production......................................................................................................25
3.0 INTEGRATED PEST MANAGEMENT............................................................................25
4.0 POLICY, INSTITUTIONAL AND LEGAL FRAMEWORKS FOR IMPLEMENTING IPM 27
4.1 Introduction......................................................................................................................27
4.2 Policies for IPM International policies............................................................................27
4.2.1. Convention on Biological Diversity (1992)..................................................................27
4.2.2. World Bank Operational Policy on Pest Management, OP 4.09 (1998).....................27
4.2.3 International plant Protection Convention of FAO (1952)...........................................27
4.2.4 United Nations Framework convention on Climate Change (1992)............................28
4.2.5 World Food Security and the Plan of Action of November 1996................................28
4.2.6 National policies.............................................................................................................28
4.3 Institutional framework....................................................................................................28
4.3.1 Agricultural sector ministries.........................................................................................28
4.4 Legal Framework..............................................................................................................29
4.4.1 Chapter 324 – Plant Protection Act................................................................................29
4.4.2 Chapter 326 – Seeds and Plants Variety Act.................................................................29
4.4.3 Chapter 347 on irrigation................................................................................................30
4.4.4 Chapter 346: Pest Control Products...............................................................................30
4.4.5 Chapter 343 - Tea............................................................................................................30
4.4.6 Chapter 335 – Cotton......................................................................................................30

X
4.4.7 Chapter 338 - National Cereals and Produce Board......................................................30
4.4.8 Chapter 364 - Animal Diseases......................................................................................30
4.4.9 Chapter 128 – Chiefs’ Authority....................................................................................31
4.4.10 Chapter 325 - Suppression of Noxious Weeds............................................................31
4.4.11 Chapter 265 Local Government...................................................................................31
5.0 PROCEDURES AND METHODOLOGIES FOR IPM PLANNING, DESIGN AND IMPLEMENTATION OF SUB-PROJECTS TO BE FINANCED UNDER KAPAP AND KACCAL..........................................................................................................................................32
5.1 Planning for subprojects...................................................................................................33
5.2 Subproject Design............................................................................................................60
5.2.1 Set up of an IPM Program..............................................................................................60
5.2.2 Identifying Problems.......................................................................................................60
5.2.3 Select Tactics..................................................................................................................60
5.2.4 Consider Economic Factors: Know When It Pays to Use a Pesticide.........................61
5.2.5 Evaluating IPM Program................................................................................................61
5.2.6 Pesticide reduction and judicious use............................................................................61
5.2.7 Investigate the cause.......................................................................................................62
5.2.8 Choosing controls...........................................................................................................62
5.3 Implementation.................................................................................................................63
5.3.1 Step One: Understand IPM and its advantages over other pest control methodologies..................................................................................................................................................63
5.3.2 Step Two: Identify the implementation team................................................................64
5.3.3 Step Three: Decide on scale of implementation............................................................64
5.3.4 Step Four: Set goals and measurable objectives for your IPM program......................65
5.3.5 Step Five: Analyse current housekeeping, maintenance and pest control practices....66
5.3.6 Step Six: Establish a system of regular IPM inspections..............................................66
5.3.7 Step Seven: Define policy treatment selection..............................................................67
5.3.8 Step Eight: Establish communication protocols for environmental services, facility maintenance, facility management and service provider.......................................................67
5.3.9 Step Nine: Develop worker training plans and policies................................................67
5.3.10 Step Ten: Track progress and reward success.............................................................67
6.0 MONITORING AND EVALUATION SYSTEMS FOR THE VARIOUS PEST MANAGEMENT PRACTICES OF THE PMP..............................................................................69
6.1 Proposed Pests Monitoring and Evaluation Regime........................................................70
6.2 Participatory Impact Monitoring (PIM)...........................................................................70
6.3 Integrated Pest Management Monitoring Framework.....................................................72
7.0 POTENTIAL ECONOMIC, ENVIRONMENTAL AND SOCIAL IMPACTS OF THE PEST MANAGEMENT ACTIVITIES WITHIN THE SUB-PROJECTS......................................73
7.1 Major agricultural and animal husbandry enterprises......................................................73
7.2 Food Crops.............................................................................................................................74
7.2.1 Maize...............................................................................................................................74

X
7.2.2 Rice..................................................................................................................................76
7.2.3 Sorghum..........................................................................................................................77
7.2.4 Pearl millet......................................................................................................................78
7.2 5 Bananas...........................................................................................................................79
7.2.6 Cassava............................................................................................................................80
7.2.7 Common Beans (Phaseolus)...........................................................................................82
7.2.8 Sweet Potatoes................................................................................................................84
7.2.9 Coffee..............................................................................................................................85
7.2.10 Cotton............................................................................................................................87
7.2.11 Coconuts...................................................................................................................89
7.2.12 Cashew-nuts..................................................................................................................90
7.2.13 Mangoes........................................................................................................................90
7.2.14 Citrus.............................................................................................................................90
7.2.15 Pineapples.....................................................................................................................91
7.2.16 Tomatoes.......................................................................................................................92
7.2.17 Onions...........................................................................................................................95
7.2.18 Brassicas (cabbages and kale)......................................................................................80
7.3 Management of Pests.............................................................................................................80
7.3.1 Rodents.....................................................................................................................80
7.3.2 Birds (Quelea quelea spp).......................................................................................81
7.3.3 Locust.......................................................................................................................82
7.3.4 Armyworm...............................................................................................................82
7.3.5 Water hyacinth................................................................................................................83
7.3.6 Striga...............................................................................................................................83
7.4 Key livestock pests and diseases............................................................................................84
7.3 Key Forestry pests and diseases.............................................................................................81
8.0 MANAGEMENT OF NEGATIVE IMPACTS OF CROP PROTECTION MEASURES.81
8.1 Introduction......................................................................................................................81
8.2 Implication of control measures.......................................................................................82
8.2.1 Control of plant pests and diseases................................................................................82
8.2.2 Control of Livestock pests and diseases........................................................................82
8.2.3 Associated Risks.............................................................................................................83
8.3 Impacts of empirical plant and animal pests and disease control methods.....................83
8.3.1 Use of Pesticides.............................................................................................................83
8.3.2 Impact on Environment..................................................................................................83
8.3.3 Impact on Health and safety...........................................................................................86
8.3.4 Use of Biological method...............................................................................................86
8.3.5 Use of Mechanical method.............................................................................................87
8.3.6 Use of manual method....................................................................................................87

X
8.3.7 Use of Quarantine...........................................................................................................88
9.0 CAPACITY NEEDS AND TECHNICAL ASSISTANCE FOR SUCCESSFUL IMPLEMENTATION OF THE IPMF.............................................................................................89
10.0 IPM RESEARCH AREAS IN KAPAP AND KACCAL....................................................91
10.1 Economic Threshold for the pests and diseases.................................................................91
10.2 Risk analysis........................................................................................................................91
10.3 Economic Impact of the pests and diseases........................................................................91
10.4 Development of IPM strategies for the control of pests and diseases..............................92
11.0 IPMF IMPLEMENTATION AND BUDGET.....................................................................93
11.1 Implementation.....................................................................................................................93
11.2 Budget...................................................................................................................................93
12.0 REFERENCES.....................................................................................................................95
Appendix 1: Production of Crops in Kenya.....................................................................................97
Appendix 1a: Production of food crops in Kenya (2002 -2006)................................................97
Appendix 1b: Production of industrial crops in Kenya (2002-2006).........................................98
Appendix 1c: Production of horticultural crops in Kenya (2002-2006)....................................98
Appendix 2: Step 1, 2 and 3 of Stakeholder Analysis...................................................................101
Appendix 3: Questionnaire on Pest Management..........................................................................104
LIST OF TABLES
Table 1: Agro-ecological zones of the tropics and their associated enterprise... 18
Table 2: Certified seeds production and importation (2002 -2006).................... 19
Table 3. Annual fertilizer off- take (2000 – 2007).............................................. 21
Table 4. Quantities and values of imported pesticides 2003/04 – 2005/06........ 22
Table 5. Major livestock pests and diseases in Kenya......................................... 67
Table 6. Social and economic activities associated with the presence of pests and vectors.................................................................................................................. 72
Table 7. List of banned or restricted pesticides in Kenya.................................. 75
Table 8. Budget element for implementation of IPMF........................................ 84
LIST OF FIGURES
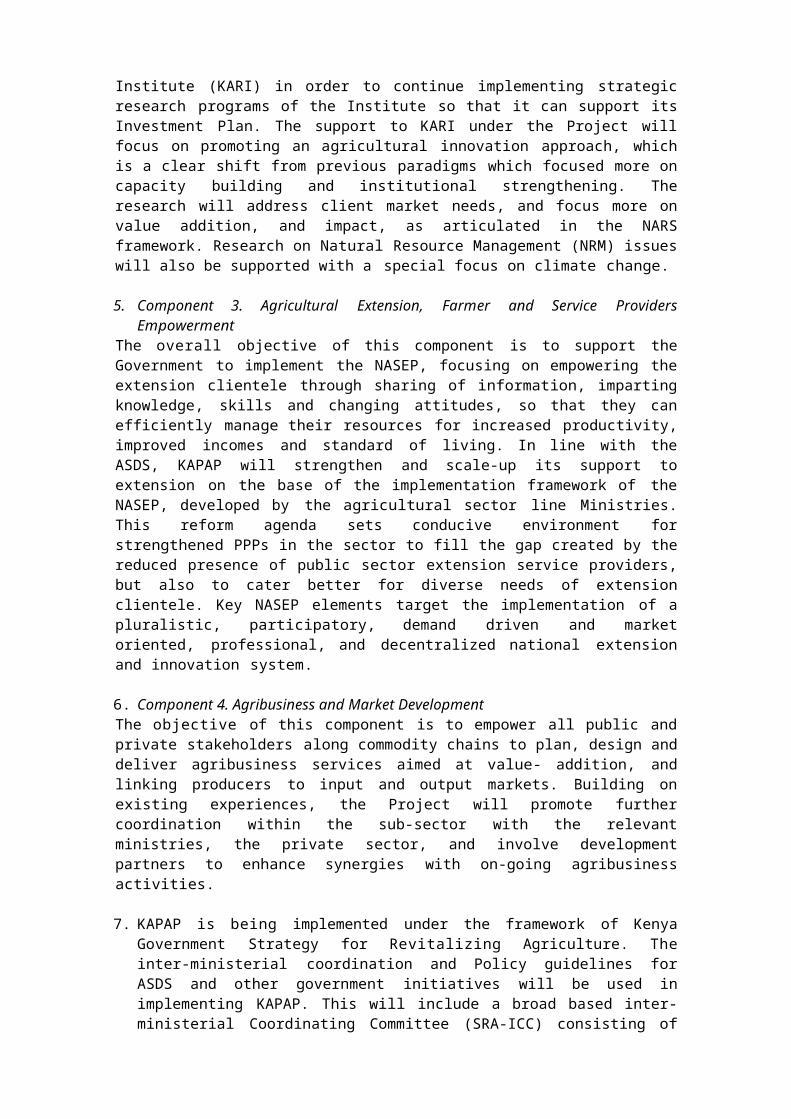
Figure 1: Agroecological zones of Kenya ........................................................... 17
Figure 2: Participatory Impact Monitoring (PIM) approach to IPM ................... 38
Figure 3: Monitoring framework for Integrated Pest Management based on previous practices and proposed approaches ........................................................40

X

X
ACRONYMS AND ABBREVIATIONSSAL Arid and Semi-Arid Lands
ATIRI Agricultural Technology and Information Response Initiative
AGOA African Growth Opportunity Act
BMP Best Management Practices
BP Bank Procedure
CAC Catchment Area Coordinator
CAP Community Action Plan CAS Country Assistance Strategy
CCC Climate Change Coordinator
CBS Central Bureau of Statistics
CBO Community Based Organization
CBPP Contagious Bovine Pleuropneumonia
CIG Common Interest Group
CWG Community Working Group
CGIAR Consultative Group on International Agricultural Research
CMS Convention on Migratory Species of Wild Animals
KS KAPAP Secretariat
DDO District Development Officer
DEO District Environment Officer
DEC District Environment Committee
DRSRS Department of Resource Survey and Remote Sensing
DSC District Steering Committee
DSDO District Social Development Officer
RSU Regional Service Unit
EA Environmental Assessment
EIA Environmental Impact Assessment
EMCA Environmental Management and Co-ordination Act
ERS Economic Recovery Strategy for Wealth and Employment Creation
EMP Environmental Management Plan
ESA Environmental and Social Assessment
ESMF Environmental and Social Management Framework
FFS Farmer Field Schools
GDP Gross Domestic Product
GEF Global Environment Facility
GHGs Greenhouse Gases
GMP Good Management Practices
GMT Good Management Technologies
GOK Government of Kenya

X
IBA Important Bird Area
ICC Inter-Ministerial Coordinating Committee
ICM Integrated Crop Management
ICRAF International Centre for Research on Agroforestry (currently World Agroforestry Centre, WAC
IDA International Development Association
ISC Inter-Ministerial Steering Committee
IMCE Inter-Ministerial Committee on Environment
IPs Indigenous Peoples
IPO Indigenous Peoples Organization
IPP Indigenous Peoples Plan
IPM Integrated Pest Management
IPMF Integrated Pest Management Framework
KACCAL Kenya Adaptation to Climate Change in Arid and Semi-arid Lands
KAPAP Kenya Agricultural Productivity and Agri business Project
KAPSLMP Kenya Agricultural Productivity and Sustainable Land Management Project
KARI Kenya Agricultural Research Institute
KEMRI Kenya Medical Research Institute
KMFRI Kenya Marine and Fisheries Research Institute
KEFRI Kenya Forestry Research Institute
KWS Kenya Wildlife Service
M&E Monitoring and Evaluation
MG & SS Ministry of Gender and Social Services
MoA Ministry of Agriculture
MoH Ministry of Health
NALEP National Agricultural and Livestock Extension Project
NARS National Agricultural Research Systems
NASEP National Agricultural Sector Extension Policy
NEMA National Environment Management Authority
NGO Non Governmental Organization
OAC Operation Area Coordinator
PEO Provincial Environment Officer
PMP Pest Management Plan
PRSP Poverty Reduction Strategy Paper
PRA Participatory Rural Appraisal
RAP Resettlement Action Plan
SC Steering Committee
SLM Sustainable Land Management
SRA Strategy for Revitalizing Agriculture
TOR Terms of Reference

X
TN Total Nitrogen
TP Total Phosphorus
UNFCC United Nations Framework Convention on Climate Change
UNEP United Nations Environment Programme
UNCCD United Nations Convention to Combat Desertification
UNDP United Nations Development Programme
VFF Village Farmers Forum
VMG Vulnerable and Marginalized Groups
WHO World Health Organization

1.0 INTRODUCTION
1.1 Background1. Despite steady growth in the immediate post-independence period, Kenya’s economy has
performed considerably below its potential in recent years. For the past two decades productivity has declined, competitiveness eroded and international financial support diminished. Poverty and food insecurity have increased. Average GDP growth declined from about 7% in the 1970s to 3.5% in 1980s to about 2% during 1990s. Underlying factors include persistent and pervasive governance problems, poorly implemented reforms, and low, ill targeted investments in social services, infrastructure and economic services including agricultural sector. In addition, external factors such as declining global agricultural commodity prices and vulnerability to climatic shocks explains partly, the decline. Domestic policy shortcomings created distortions in input and output markets. Inadequacies in the legal and regulatory framework raised costs of business. Poor infrastructure increased costs of marketing. High incidence of HIV/AIDS contributed to reduced labour productivity. Dysfunctional public support services slowed the renewal of agricultural technology. The end result has been increased rural poverty and food insecurity, decline in competitiveness, and virtual cessation of both private and public investment in the agricultural sector.
2. The agriculture sector is the main contributor to the Kenyan economy, with a share of 24% of GDP. Besides the GDP, the sector is a major contributor to poverty alleviation and employment creation in the rural Kenya and also provides major raw materials for the agro-industries. Kenya Agricultural Productivity and Agribusiness Project (KAPAP and Kenya Adaptation to Climate Change in Arid and Semi-arid Lands (KACCAL) will contribute to the revitalization of the agricultural sector through: (i) facilitating empowerment of farmers to access and apply profitable and sustainable technologies; (ii) laying the groundwork for a pluralistic agricultural extension and learning systems; (iii) integrating and rationalizing the national agricultural research systems; (vi) improving the vegetative cover within the cultivated areas, (v) promotion of sustainable land management practices and technologies, (vi) help the ability of the participating farmers and communities plan and implement climate change adaptation measures and (vii) supporting analytical work to inform policy and institutional reforms.
3. The two projects cover a wide range of major issues of strategic significance to the economy, climate change, and food insecurity. It includes crop and livestock enterprises, smart agriculture, potential irrigable land, intensity of agribusiness, marketing systems and outlets. The two projects: KAPAP and KACCAL strategically target 69 Districts for implementation of its activities. This will provide opportunities to respond to the challenges of sustainable development, smart agriculture, food insecurity and economic development, which are key to improving the livelihoods of projects’ beneficiaries and others. The demand driven capacity building approach adopted by the two projects will help to identify and equip communities with appropriate technologies, knowledge and skills hence, improving appreciation and ability to protect environment.
4. These projects correspond with the fundamental features of the Government’s strategy for poverty alleviation as specified in the Poverty Reduction Strategy Paper (PRSP) of 2003, the Economic Recovery Strategy for Wealth and Employment Creation (ERS, 2003- 2007), and the Strategy for Revitalizing Agriculture (SRA 2004-2014). The previous phase of KAPAP project (KAPP I) was designed to fund agricultural policy processes and activities including small-scale, community-based sub-projects that were identified and planned by the communities, with the support of project-financed extension teams. This Integrated Pest Management Framework (IPMF) document will be used during the execution of KAPAP and KACCAL activities. The IPMP document emphasises that the agricultural producers and other natural resource users should increasingly adopt profitable and environmentally- sound pest management practices.

1.2 Objectives of IPMF2 The objectives of IPMF are:
i. Establish clear procedures and methodologies for IPM planning, design and implementation of sub-projects to be financed under KAPAP and KACCAL
ii. Develop monitoring and evaluation systems for the various pest management practices for subprojects under KAPAP and KACCAL;
iii. To assess the potential economic, environmental and social impacts of the pest management activities within the sub-projects
iv. To mitigate against negative impacts of crop protection measuresv. To identify capacity needs and technical assistance for successful implementation of
the IPMFvi. To identify IPM research areas in KAPAP and KACCAL
vii. To propose a budget required to implement the IPMF
1.3 Description of KAPAP project2 The KAPAP project is designed to cover a period of five years (2010-2014) and focuses
on:
(i) Improved linkages of agricultural research and extension systems to national, local and regional sector priorities through the implementation of ASDS, NASEP and NARS policies, including improved planning, coordination, funding and implementation.
(ii) Empowerment of producer and other public and private stakeholders and their organizations to plan, design and deliver extension and agribusiness services, aimed at sector transformation/growth, including production and value-addition and linking farmers to input and output markets.
(iii) Setting-up of appropriate funding and risk mitigation systems which would lead to the development of on- and off- farm diversification and promote private investment in the sector.
The following are the key KAPAP project components:
3. Component 1. Policy/Institutional and Project Implementation SupportThis component will support activities that will lead to better coordination of the sector with an aim of creating the necessary impetus for sector-wide approach. These activities will be undertaken both at the national and lower levels. At the national level, the project will support the development of the ASDS investment plan, its implementation, activities that will facilitate harmonization of both Government and donor supported programs, and activities to align them with ASDS.
4. Component 2. Agricultural Research SystemsSupport will be given to NARS institutions with the objective of operationalizing the NARS policy towards increased productivity and value addition through pluralism, decentralization, efficiency, cost effectiveness and impact. This will enhance the interplay of research, extension, education, agricultural and livestock producers and clients in all aspects of research problem identification, research agenda setting, planning, and research service delivery. Further investment will be made to the Kenya Agricultural Research Institute (KARI) in order to continue implementing strategic research programs of the Institute so that it can support its Investment Plan. The support to KARI under the Project will focus on promoting an agricultural innovation approach, which is a clear shift from previous paradigms which focused more on capacity building and institutional strengthening. The research will address client market needs, and focus more on value addition, and impact, as articulated in the NARS framework. Research on Natural Resource Management (NRM) issues will also be supported with a special focus on climate change.

5. Component 3. Agricultural Extension, Farmer and Service Providers EmpowermentThe overall objective of this component is to support the Government to implement the NASEP, focusing on empowering the extension clientele through sharing of information, imparting knowledge, skills and changing attitudes, so that they can efficiently manage their resources for increased productivity, improved incomes and standard of living. In line with the ASDS, KAPAP will strengthen and scale-up its support to extension on the base of the implementation framework of the NASEP, developed by the agricultural sector line Ministries. This reform agenda sets conducive environment for strengthened PPPs in the sector to fill the gap created by the reduced presence of public sector extension service providers, but also to cater better for diverse needs of extension clientele. Key NASEP elements target the implementation of a pluralistic, participatory, demand driven and market oriented, professional, and decentralized national extension and innovation system.
6. Component 4. Agribusiness and Market DevelopmentThe objective of this component is to empower all public and private stakeholders along commodity chains to plan, design and deliver agribusiness services aimed at value- addition, and linking producers to input and output markets. Building on existing experiences, the Project will promote further coordination within the sub-sector with the relevant ministries, the private sector, and involve development partners to enhance synergies with on-going agribusiness activities.
7. KAPAP is being implemented under the framework of Kenya Government Strategy for Revitalizing Agriculture. The inter-ministerial coordination and Policy guidelines for ASDS and other government initiatives will be used in implementing KAPAP. This will include a broad based inter-ministerial Coordinating Committee (SRA-ICC) consisting of permanent secretaries from the seven ministries of Agriculture, Livestock Development, Fisheries Development, Cooperative Development, Water, Environment and Natural Resources, Lands and Local government. It has also a National Forum (NF) consisting of all stakeholders operating the sector.
8. The four sector ministries (Agriculture, Livestock Development, Fisheries Development, and Co-operative Development), KARI and KENFAP, will be the implementing agencies.
9. As envisaged during the original design of the KAPP program, the Ministry of Agriculture (MoA) will have fiduciary responsibility for the Project. This will be exercised through the KAPAP Secretariat (KS), which will be mainstreamed in the government ministries.
10. The Inter-ministerial Coordinating Committee (ICC) will be responsible for, inter alia, policy matters and providing guidance to address implementation bottlenecks. However, the composition of the ICC will be expanded to reflect all the key implementation agencies.
11. The KAPP Steering Committee from Phase I will be replaced with a sector-wide Agricultural Sector Programs Steering Committee (ASPSC). The previous Steering Committee will be expanded to enable it to offer technical, financial (approval of annual work plans and budgets) and operational guidance and oversight to KAPAP implementation and other programs in the agricultural sector. The finance and audit sub- committees will be maintained and strengthened
KAPAP implementation will be mainstreamed into the GOK system, both at national and the local level. Qualified staff will be seconded from the line ministries for the entire period of the Project. GOK staff seconded to the KAPP Phase I will be retained based on their performance. The capacity of KS will be strengthened to include an Agribusiness Specialist, Accountants and Auditors and other support staff.

1.3 Description of KACCAL projectThe specific mandate attached to KACCAL is briefly presented below.
12. Component 1: Climate information products, policy and advocacyThis component will strengthen capacities among national institutions to better assess and respond to current and future climate risks. It will generate and disseminate climate related knowledge and strengthen institutional coordination among currently fragmented agencies managing disaster and climate risk. National stakeholders will be trained to further disseminate the knowledge that is generated to the County and community levels. Sub component 1.1 will involve development of climate-related knowledge products to inform climate-risk management. Sub-component 1.2 on the other hand will support integration of climate action into national ASAL development plans and programs.
13. Component 2: Climate risk management at district /County levelThis component will promote the integration of a climate risk management perspective into district/County planning process and programs. Sub component 2.1 is about capacity building to integrate climate risk management into district/County planning process – strengthen the district level capacity on climate change. Sub component 2.2 is about support for climate-smart public and private investments. It will also support feasibility studies and preparation of public and private investments, including operation costs.
14. Component 3: Community-driven initiatives for climate resilience This component will help communities to adopt climate change adaptation strategies and investments. It has two sub components 3.1 which supports community capacity building. This sub component will help build awareness and capacity at community level to assess climate risk and plan and invest for climate resilience while sub component 3.2 supports community-based micro-projects identified in the ‘climate-resilient CAPs. It supports grants to communities to implement micro-projects.
1.4 Institutional and Implementation Arrangements 15. Due to the sub-division of the original KAPP districts, the District Service Units
(DSUs) will be maintained and converted into Regional Service Units (RSUs; CACs; CCCs). The RSUs will service the original district mandate (and later County mandate). A regional programs steering committee will be formed and supported to coordinate the activities of the two projects and other sector programs at each region. The regional steering committee will also facilitate joint work programming and planning for all the districts covered under each region/County. The composition of the committee will include heads of department in government sector ministries, KENFAP, District farmer’s representative; Marginalized Groups Representatives and other stakeholders. Tbhe RSU coordinator will be the secretary and convener of steering committee.
16. Two project organs are funded to carry out the following activities: (i) the KAPAP Secretariat (KS), to provide overall coordination of the program, while overseeing the Monitoring and Evaluation and Information and Communication functions; (ii) the KAPAP Steering Committee, to offer technical, financial, operational guidance and oversight to KAPAP/ KACCAL implementation and (iii) Regional Service Units (RSUs; CACs; CCCs) to coordinate and implement Agricultural extension, farmer and service providers empowerment; and Agribusiness and market development components. For the first two years will be implemented in the following 59 districts:

Table 1: Districts covered by KAPAP and KACCAL
County/ Districts/ Areas Project(s) active in District
County Districts/Areas Project(s) active in District
West Pokot West Pokot, Central Pokot,
North Pokot.
KAPAP;KACCAL Tana River Tana River, Tana Delta
KAPAP; KACCAL
Nakuru Nakuru, Molo, Nakuru North
Naivasha, Njoro
KAPAP Kwale Kwale, Kinango,
Msambweni
KAPAP
Trans Nzoia
Trans Nzoia West, Trans
Nzoia East, Kwanza
KAPAP Garissa Garissa, Fafi, Lagdera
KAPAP; KACCAL
Nyandarua Nyandarua North,
Nyandarua Central, Nyandarua South, Kipipiri
KAPAP Wajir Wajir East, Wajir South,
Wajir North, Wajir West
KAPAP
Nyeri Nyeri South, Nyeri North, Nyeri Central, Nyeri East
KAPAP Meru Central
Meru Central, Imenti; North,
Buuri; Imenti South
KAPAP
Homa Bay Homa Bay, Ndhiwa KAPAP Makueni Makueni, Mbooni, Kibwezi,
Nzani
KAPAP
Gucha Gucha, Gucha South KAPAP Embu Embu KAPAP
Siaya Siaya, Ugenya KAPAP Kakamega Kakamega North, K.
Central, Kakamega South,
Kakamega East
KAPAP
Taita -
Taveta
Taita, Taveta KAPAP Busia Busia, Samia, Bunyala
KAPAP
Kilifi Kilifi, Kaloleni; Malindi KAPAP; KACCAL Butere-
Mumias
Butere, Mumias KAPAP
17. The 59 K A PA P districts cover the geographical area covered by the 20 districts where phase I (KAPP) was being implemented. The increase in number of districts is as a result of sub- division. The District coverage will be reviewed during mid-term

evaluation. However, the geographical catchments of the agri-business and market development activities may naturally spill over beyond the focal district boundaries and some of them will have a national coverage.
18. The project implementation structures include Secretariat (KS), Regional Service Units (RSUs; CACs; CCCS), Financing Models (FMs) (who paid the service providers in KAPP I and Value Chain Structures who are to pay Service Provider Consortia in this Phase of KAPAP and KACCAL ), the service providers, service provider fora, Farmer fora, Common interest groups (CIG) and Community Working Groups (CWGs). The KAPAP secretariat provide overall coordination at national level and a KAPAP Steering Committee with a national multi-stakeholder membership, has been advising and reviewing the project functions, and also facilitating access to technical resources needed to support the activities of the two projects. The RSUs, CACs and CCCs will be implementing KAPAP and KACCAL activities at County/district level.

2.0 ECONOMIC IMPACTS OF PESTS
2.1 Crop Pests
2.1.1 Impact on Production
19. Estimates of potential crop damage from pests in the absence of control have been made by measuring damage as a proportion of total feasible output. Generally, estimates of damage during outbreaks and plagues range from insignificant losses of the planted crop to 100 percent, depending on the year, region and pest species.
20. Weeds are reported to generally cause up to 70% of yield losses on susceptible crops. However, in some areas such as the Lake Victoria Basin, Striga is the number one ranked weed causing severe damage to crops like maize, sugarcane and sorghum. Documented literature indicates that it causes between 42-100% yield losses. Other notorious weeds are grasses and broad leaved weeds that cause 30-70% yield loss.
21. A major weed that may require noting although it does not affect crops is the water hyacinth which causes fish catch reduction ranging from 30-100% depending on the levels of infestation. A serious production impediment in many developing countries is the spread of introduced weed species such as the water hyacinth, which results in severe disruption of the socioeconomic activities of the local communities.
22. Some studies may over-estimate the potential crop losses caused by pests. They rarely account for farmers' response to mitigate the effects of pests and are often based on calculations of optimal production conditions. In both ways, they may overstate the losses caused by the pests. Studies of pests have been carried out by focusing on estimated damage in the absence of control and comparing them with direct costs of control operations. Thus, these studies have the same drawbacks. In all likelihood, they give an incomplete picture of the true net benefits of pest control.
23. There are numerous diseases of crops reported in Kenya that are causing havoc to crop production. Among the leading diseases are those caused by viruses and bacteria. Although the impacts are not well, the major diseases identified include:
a) Mosaic virus causing up to 19 % loss on maize and sugarcane.b) Cassava mosaic virus seriously affected the crop causing significant losses in
production. Experiments carried estimated losses of crop at 36%, although the impact seems to be declining in view of the control measures that have been undertaken by KARI through introduction of resistant cassava varieties.
c) Sugarcane ratoon stunting disease which cause up to 19% yield loss in the basin.d) Coffee berry disease is a major disease which causes heavy crop losses which
reach 90% with heavy infestation.e) Other diseases causing heavy losses include sugarcane smut and rice blast.
2.1.2 Impacts on food security
24. The effect of pest damage on the food security has not been analysed in the past. However, where there are major damages there is significant losses in production and hence the food supply such as in maize. A case in point is that of the Cassava mosaic virus which razed the whole of the lake basin in Kenya extending to the Uganda side, thereby causing serious reduction in the crop supply.
23
25. During severe attacks of these diseases the supply of the affected crops is inhibited hence causing shortages in the availability and hence high prices in the market Thus the consumers are exposed to high prices making the crop unaffordable.
2.2 Livestock Pests
2.2.1 Impacts on production
26. All animal diseases have the potential to kill affected animals, but the severity of the disease will vary depending on factors such as the species and breed of animal, its age and nutrition and the disease agent. Many animal diseases have mortality rates of between 50% and 90% in susceptible animals. Rift Valley Fever normally produces only a mild infection in local African breeds of cattle, sheep and goats, while exotic breeds of the same species may experience severe spates of abortion. Under experimental conditions, some "mild" strains of classical swine fever virus kill less than half of the infected pigs while other "virulent" strains may kill up to 100%. Productivity losses can persist even in animals that survive disease. Abortions caused by Rift Valley fever do not only entail the loss of offspring but also the loss of one lactation and thus reduced milk supply for human consumption in the year following an outbreak. Foot-and-mouth disease leads to considerable loss in milk production in dairy cattle. In Kenya, losses caused by foot-and-mouth disease in the early 1980s amounted to KShs. 230 million (1980 value) annually, approximately 30 % of which were due to reduced milk production.
27. The first outbreak of rinderpest in Eastern Africa in 1887 was estimated to have killed about 90% of Ethiopia's cattle and more than 10 million cattle on the continent as a whole resulting in a widespread famine. Rinderpest losses in production has been estimated with and without the control campaign and found benefits exceeded costs. The benefit/cost ratio ranged from 1.35:1 to 2.55:1. As mentioned earlier in cost-benefit studies, there are many variables that are not considered in a simple evaluation of costs and losses that might lead to an underestimation of the costs and/or an overestimation of the benefits of a control campaign.
28. Reductions in mortality and improvements in animal productivity are the traditional goals of disease eradication programmes. Access to export markets is now becoming an equally important reason. Improved response to outbreaks and increased access to vaccine have reduced the likelihood of many disease epidemics, but this experience is countered by increased trade, smuggling and susceptibility of small poultry and ruminant populations raised in intensive conditions.
29. Most analyses of animal disease do not include the cost of treatment, perhaps because it is regarded as minor. The effects of disease on animal productivity depend on the actual disease incidence, which may be reduced by a control campaign. Animal diseases directly affect the size and composition of animal populations and thus indirectly have repercussions on the environment. In conjunction with other environmental factors, major livestock diseases determine which production system, species and breeds of animals are adopted by livestock owners.
30. The majority of animal diseases do not cause epidemics in humans, although occasionally humans can become infected. The viruses causing rinderpest, peste des petits ruminants, classical swine fever and Asian swine flu, as well as the causative agent of CBPP, are not infective for humans but foot-and-mouth disease virus has been isolated from around 40 people worldwide following a mild cause of disease.
24

2.2.2 Impacts on human health and the environment
31. Some animal pests and diseases can affect humans directly and may use animals as vectors that aid in their transmission. Areas with conflict or poor health controls pose a greater risk of human infection from animal disease. Larger production units and increased contact among animals also increases the impact of outbreaks.
32. Rift Valley fever virus can infect humans, where it causes a febrile illness, which is sometimes complicated by haemorrhage, encephalitis and blindness. The virus is transmitted among animals and from animals to humans by certain mosquito species, which gives rise to the distinct association of Rift Valley fever epidemics with periods of high rainfall. Humans also appear to contract the infection through direct contact with infected tissues and fluids of animals at slaughter.
2.3 Economic impact of forest pests
2.3.1 Impact on Production
33. The story of the Cyprus aphid exemplifies one of the problems affecting African trees today, the accidental introduction of exotic insect pests and a s s o c i a t e d diseases, which can affect both exotic and indigenous tree species. Native African pest species rarely produce such noticeable results, but like alien pests have a capacity to reduce tree growth and fitness considerably through feeding and, consequently, a loss in annual growth increment. Finally, besides pests that directly affect tree health, invasive weed species can damage forests by competing with existing stands and preventing forest regeneration.
3.0 INTEGRATED PEST MANAGEMENT34. In the early years of the last century, different crop protection practices were integral
parts of any cropping system. However, with increased world human population, the demand for more food was eminent. This also coincided with increased pest problem and advent of pesticides. From the 1940’s to the 1970’s, a spectacular increase in yield was obtained with the aid of an intensive development of technology, including the development of a variety of agro-pesticides. In many countries this advancement was coupled with the development of education of farmers and efficient extension services. However, in many developing countries, pesticides were used without adequate support systems. Agro-pesticides were often used injudiciously. Misuse and over-use was stimulated by heavy subsidies on agro-chemicals. Crop protection measures were often reduced to easy-to-use pesticide application recipes, aimed at immediate elimination of the causal organism. In places where the use of improved varieties was propagated, packages of high-yielding varieties with high inputs of agro-pesticides and fertilizers made farmers dependent on high external inputs. Since then, it has been realized that this conventional approach has the following drawbacks:
a) Toxicity; poisoning and residue problems
b) Destruction of natural enemies and other non-target organisms
c) Development of resistance in target organisms
d) Environmental pollution and degradation
e) High costs of pesticides;
f) Good management of pesticides use requires skills and knowledge
35. Because of the drawbacks of reliance on pesticides, a crop protection approach is needed that is centered on local farmer needs that are sustainable, appropriate, environmentally
25

safe and economic to use. Such approach is called Integrated Pest Management (IPM).
36. There are many different definitions that have been developed over the years to describe IPM. In 1967, FAO defined IPM as “a pest management system that in the context of the associated environment and the population dynamics of the pest species, utilizes all suitable techniques and methods in as compatible manner as possible, and maintains the pest population at levels below those causing economic injury”. The requirement for adoption of IPM in farming systems is also emphasized in the World Bank OP 4.09 on Pest Management, which supports safe, effective, and environmentally sound pest management aspects, such as the use of biological and environmental friendly control methods.
37. The following are key preconditions for an IPM approach:a. Understanding of the ecological relationships within a farming system (crop, plant, pests
organisms and factors influencing their developmentb. Understanding of economic factors within a production system (infestation: loss ratio,
market potential and product prices)c. Understanding of socio-cultural decision-making behaviour of the farmersd. (traditional preferences, risk behaviour)e. Involvement of the farmers in the analysis of the pest problems and their managementf. Successive creation of a legislative and agricultural policy framework conducive to a
sustainable IPM strategy (plant quarantine legislation, pesticides legislation, pesticide registration, price policy)
38. The key elements of an IPM program are:a. Use of available, suitable, and compatible methods which includes resistant varieties,
cultural methods (planting time, intercropping and crop rotation), biological control, safe pesticides, etc. to maintain pests below levels that cause economic damage and loss
b. Conservation of the ecosystem to enhance and support natural enemies and pollinatorsc. Integrating the pest management strategies in the farming system d. Pests and crop loss assessments
39. This Integrated Pest Management Framework (IPMF) addresses the need f o r t h e t w o p r o j e c t s to promote ecosystem approach in pest management. This approach has benefits in terms of enhancing good human and environmental health, and improving economic wellbeing of the farmer.
The IPMF provides:a. An information basis for stakeholder groups to establish functional mechanisms
enabling farmers to identify, understand and manage pest and vector problems in the further development of agriculture
b. Reduction of personal and environmental health risks associated with pesticide usec. Protection of beneficial biodiversity such as pest natural enemies and pollinators to
enhance farmer’ crop productivity.d. The need for farmers to understand and respond to the external factors affecting farmers’
livelihoods that contributes to pest management.
40. For example, quarantine pests, alien invasive species and stringent minimum pesticide residue levels limit the potential for farmers to benefit from international trade opportunities. Collaborative linkages between the project and international IPM groups will help to bring relevant expertise and supporting IPM resources developed elsewhere to strengthen national and local capacity to address pest problems. A mechanism to develop
26

a national IPM policy to encourage national and local compliance with international conventions and guidelines on pesticides, and to further develop IPM.
4.0 POLICY, INSTITUTIONAL AND LEGAL FRAMEWORKS FOR IMPLEMENTING IPM
4.1 Introduction41. The government of Kenya has been emphasising on the commercialization of agriculture.
Farmers are expected to increase utilization of external inputs, including pesticides. This IPMP intends to ensure that there is safe and judicious use of pesticides in the country. Worldwide, there is also a common agreement that although agriculture is a main contributor to food security, the sector has contributed to environmental degradation and climate change. Therefore, both the government and international stakeholders have had impact on the implementation and utilization of IPM strategies in Kenya. This has resulted to formulation of policies, institutions and legal frameworks that in one way or another affects agricultural production and agro-enterprises.
4.2 Policies for IPM International policies
4.2.1. Convention on Biological Diversity (1992)
42. The Convention on Biological Diversity adopts a broad approach to conservation (Alistsi,2002). It requires Parties to the Convention to adopt national strategies, plans and programs for the conservation of biological diversity, and to integrate the conservation and sustainable use of biological diversity into relevant sectoral and cross-sectoral plans, programs and policies. The proposed programme is expected to conserve biodiversity, especially the rare and endangered species in the project area and its environs.
4.2.2. World Bank Operational Policy on Pest Management, OP 4.09 (1998)
43. The Bank uses various means to assess pest management in the country and support integrated pest management (IPM) and the safe use of agricultural pesticides, economic and sector work, sectoral or project-specific environmental assessments, participatory IPM assessments, and adjustment or investment projects and components aimed specifically at supporting the adoption and use of IPM. In the Bank-financed agriculture operations, it advocates pest populations reduction through IPM approaches such as biological control, cultural practices, and the development and use of crop varieties that are resistant or tolerant to the pest.
44. The World Bank does not finance any pesticides, which fall under WHO class Ia and Ib.
4.2.3 International plant Protection Convention of FAO (1952)
45. The IPPC is an international treaty to secure action to prevent the spread and introduction of pests of plants and plant products, and to promote appropriate measures for their control. It is governed by the Commission on Phytosanitary Measures (CPM) which adopts International Standards for Phytosanitary Measures (ISPMs).
27

4.2.4 United Nations Framework convention on Climate Change (1992)
46. The convention seeks to regulate levels of greenhouse gases (GHGs) concentration in the atmosphere, to avoid the occurrence of climate change at levels that would harm economic development, or that would impede food production activities.
4.2.5 World Food Security and the Plan of Action of November 1996
47. This declaration seeks to secure effective prevention and progressive control of plant and animal pests and diseases, including especially those which are of trans-boundary nature, such as rinderpest, cattle tick, foot-and-mouth disease and desert locust, where outbreaks can cause major food shortages, destabilize markets and trigger trade measures; and promote concurrently, regional collaboration in plant pests and animal disease control and the widespread development and use of integrated pest management practices
4.2.6 National policies
48. There are several policies that have been developed in the country that have impact on crop production and IPM implementation. Some of these policies are:
(i) Vision 2030
(ii) National Agricultural Research Systems
(iii) Agricultural Sector Development Strategy
(iv) National Agricultural Sector Extension Policy
(v) Environment policy
(vi) National food and nutrition policy
(vii) National seed industry policy
4.3 Institutional framework49. Different institutions and stakeholders are involved in pest management and influence
adoption of IPM programs.
These include:
4.3.1 Agricultural sector ministries
50. The functions of various agricultural ministries are hinged on various policy documents, guidelines and institutional structures. Some of the services provided by the sector ministries include the provision of National direction on agriculture and livestock development, husbandry and management through Agricultural Policy and Services. The lead ministries are also instrumental in guaranteeing national food security through the National Food Policy. Many of the food security policies in Kenya are closely linked to Poverty Reduction Strategies (PRS) and Millennium Development Goals (MDGs).
51. Both the Ministry of Agriculture and the Ministry of Livestock Development provide Extension Services to the lowest administrative levels in the country though it is constrained by various economic, human resource and geographical factors. Many extension services do not only include the development of these natural resources but a high level of pest management; even though, there are institutions charged with express mandate of crop and animal pest management in Kenya.
52. Various research institutions are involved in applied research in both crop and animal production. The main focus has been on high yielding varieties of crops and animals as well as development of early maturing and disease resistant varieties. Institutions of
28

particular interest include: Kenya Agricultural Research Institute (KARI), Kenya Sugar Research Foundation (KESREF), Coffee Research Foundation (CRF), Kenya Forestry Research Institute (KEFRI), and Kenya Seed Company (KSC). There are also government financial institutions that support farmers such as Agricultural Development Corporation (ADC) and Agricultural Finance Corporation (AFC).
53. The key public institutions that support production and marketing are: Nyayo Tea Zones Development Corporation, Kenya Sugar Board, Coffee Board of Kenya, National Cereals and Produce Board (NCPB), Horticultural Crops Development Authority (HCDA), Pyrethrum Board of Kenya (PBK), Tea Board of Kenya, Cotton Lint and Seed Marketing Board, Kenya Sisal Board, Kenya Forest Services and New Kenya Cooperative Creameries (New KCC).
54. There are several public and private institutions that play a major role in pest management in Kenya: Kenya Plant Health Inspectorate Service (KEPHIS), Pest Control Products Board (PCPB) and National Environment Management Authority (NEMA), Agro Chemical Association of Kenya (AAK).
55. Several commercially oriented institutions, parastatals and companies have been created to address specific enterprises. These include sugar companies, agro-chemical industries, NGOs and farmer organizations (e.g., FPEAK, KENFAP, and Kenya Flower Council).
56. There are international and regional institutions that are involved in pest management of crops and animals which includes, ILRI, ICIPE, IITA, CYMMIT, CIP, ICRAF (WAC), CIAT, ICRISAT and DLCO
4.4 Legal Framework57. There are many statutes that deal with pests and diseases directly and others that are
indirectly connected with pest control and management. These include:
4.4.1 Chapter 324 – Plant Protection Act
58. This Act makes a provision for the prevention of the introduction and spread of diseases destructive to plants. The most applicable parts of this Act to Integrated Pest Management are specified in Sec. 3, 4, 5, 6, 7 and 8.
59. The act creates specific rules to support plant protection in various crops. These includes: sugarcane (L.N.294/1962. Rule 3, Sch. 2), Maize and Sorghum (L.N.216/1956. Schedule (rr. 7 and 8), Sisal (L.N.522/1957, L.N.365/1964, L.N.153/1958, L.N.177/1959, L.N.558/1960) and Banana (Cap.178 (1948), Sub. Leg. L.N.365/1964).
4.4.2 Chapter 326 – Seeds and Plants Variety Act
60. This Act regulates transactions in seeds, including provision for the testing and certification of seeds; for the establishment of an index of names of plant varieties; to empower the imposition of restriction on the introduction of new varieties; to control the importation of seeds; to authorize measures to prevent injurious cross-pollination; to provide for the grant of proprietary rights to persons breeding or discovering new varieties. The act includes subsidiary legislation on seeds and plant varieties (seeds) regulations, registration of seed growers, seed certification and seed importation and exportation.
29

4.4.3 Chapter 347 on irrigation
61. The Act makes regulations for the administration and day-to-day control of national irrigation schemes and standards of good husbandry and the control of pests and diseases in national irrigation schemes
4.4.4 Chapter 346: Pest Control Products
62. This Act covers the use, application, importation and trade in pest products. It includes regulation on:
a. Prescribing for the purposes of this Act the nomenclature of pests, pest control products and classes and kinds of pests and pest control products;
b. Prescribing the form in which applications for registration shall be made and the information to be furnished therewith;
c. Respecting the registration of pest control products and establishments in which any pest control products are and led by manufacturers or dealers and prescribing the fees therefore, and respecting the procedures to be followed for the review of cases involving the refusal, suspension or cancellation of the registration of any such product or establishment;
d. Prescribing the form, composition, and all other standards relating to the safe use of pest control products, including toxic residue effects;
e. Respecting the manufacture or treatment of any pest control product to facilitate its recognition by change in colouration or other means;
f. Respecting the standards for efficacy and safety of any pest control product;g. Respecting the manufacture, storage, distribution, display and use of any pest control
product;h. Respecting the packaging, labelling and advertising of pest control products;i. Respecting the taking of samples and the making of analyses for the purposes and
provisions of this Act;j. Prescribing the information to be supplied and the form of such information in respect
of any pest control product that is to be imported into Kenya;k. Prescribing the circumstances and conditions under which pest control products that have
met the requirements of the Cattle Cleansing Act may be deemed to be registered as prescribed under this Act;
4.4.5 Chapter 343 - Tea
63. The Act establishes the Tea Board of Kenya a nd charges it with various responsibilities and gives it powers to promote the tea industry in Kenya that includes pest control and management.
4.4.6 Chapter 335 – Cotton
64. The Act establishes The Cotton Lint and Seed marketing Board mandated to monitor cotton growing, cotton ginning, and management of cotton diseases and pests;
4.4.7 Chapter 338 - National Cereals and Produce Board
65. This Act regulates and controls the marketing and processing of mainly maize, wheat and scheduled agricultural produce.
4.4.8 Chapter 364 - Animal Diseases
66. This Act provides regulation on matters related to the diseases of animals. The Legislation regulates importation of animals and provisions affecting infected areas such as
30

prohibition of the importation or the exportation of all animals or any specified kinds of animals, or of carcasses, meat, hides, steins, air, wool, litter, dung, semen, live viruses capable of setting up infections in animals, sera, vaccines and other biological or chemical products intended to be used for the control of animal disease or fodder, from any specified country, port or territory.
4.4.9 Chapter 128 – Chiefs’ Authority
67. The Act has two items on pests and diseases:a. Section 11 giving the Chiefs powers to issue orders for suppressing or controlling animal or
insect pests or plant pests, noxious weeds or diseases andb. Section 12 giving Chiefs power to require work or services in emergency in connection
with an emergency consequent on fire, flood, earthquake, violent epidemic or epizootic disease, invasion by animal or insect pests or plant diseases or pests, or arising from circumstances which would endanger the existence of the whole or any part of the population, to be done or rendered, he may, in writing, authorize any chief to issue orders under this section to persons within the jurisdiction of such chief, and any chief so authorized may by any such order require any able-bodied adult person to perform any such work or render any such service as aforesaid specified in such order.
4.4.10 Chapter 325 - Suppression of Noxious Weeds
68. The act regulates declaration of plants as noxious weed (G.N.1721/1955, L.N.173/1960) and to eradicate it. The Local Authorities have powers under Cap. 265 (L.N.256/1963) to eradicate any noxious weed from land within its area and for compelling owners or occupiers of land to cause any such weed to be eradicated from their land, and for such purposes by-laws may appoint or provide for the appointment of inspectors.
4.4.11 Chapter 265 Local Government
69. The act empowers the council to make laws (L.N.22/1984) in respect of all such matters as are necessary or desirable for the maintenance of the health, safety and well-being of the inhabitants of its area or any part thereof and for the good rule and government of such area or any part thereof and for the prevention and suppression of nuisances therein.
70. As can be seen from these sections of the statutes, there is no central coordinating body in ensuring that all the institutions, statutes and players carry out the pest and disease control in a systematic and coordinated body as each of the legislations specifies the authorized officers to implement these laws. One of the problems that could be facing pest management strategies in Kenya seems to lie in the weak policy, institutional and legal linkages among the key players. This weakness forms one of the major gaps to be addressed in the proposed Integrated Pest Management Plan in this report and especially on the Participatory Monitoring and Evaluation Framework.
31

5.0 PROCEDURES AND METHODOLOGIES FOR IPM PLANNING, DESIGN AND IMPLEMENTATION OF SUB-PROJECTS TO BE FINANCED UNDER KAPAP AND KACCAL
Figure 1: Agro-ecological zones of Kenya
32

Figure 2 below provides the description of these agro-ecologies in Kenya.
71. In addition, it also provides the agro-enterprises suitable in each zone (see appendix 1 on crop production and area in Kenya).
5.1 Planning for subprojects72. To effectively plan, design and implement an IPM program, there is need to understand
the agro-ecological zones where the project will be based. This is important since IPM relies on the ecosystem approach in its implementation. The two projects will be implemented in different agroecological zones; hence the IPM elements will also depend on the location of the projects
73. In addition to the agro-ecologies and enterprises, IPM planning involves consideration of the inputs required in the production processes of the target enterprise. For example, what support does the project provide to the target farmers in terms of acquiring key farm inputs? Are the inputs used by farmers complementary and do they empower the farmer economically? Are there simple and cheap methods that farmers can adopt in their production systems? Some of the key inputs applied include seeds, fertilizers and pesticides (Table 2-4)
33

Table 2: Certified seeds production and importation (2002 -2006)
CROP
Quantities produced and imported
2002 2003 2004 2005 2006
Local
Production
Imports
(KG)
Local
Production
Imports
(KG)
Local
Production
Imports
(KG)
Local
Production
Imports
(KG)
Local
Production
Imports
(KG)
Barley 484,500.00 0.0 659,400.0 0.0 1,394,248.3 0.0 1,650,650.0 0.0 1,626,900.0 0.0
Beans 448,376.0 241,896.2 568,678.6 348,391.5 392,646.7 261,378.2 607,957.9 567,851.1 172,960.0 0.0
Oats 0.0 0.0 4,950.0 0.0 0.0 0.0 12,090.0 0.0 2,820.0 0.0
Flower 8,939.8 4,184.3 501.0 501.0 499.5 352.4 180.7 227.7 453.5 453.5
Herbage 203,587.0 14,700.0 85,684.0 2,815 69,591.0 25,250.0 55,877.5 6,244.0 0.0 0.0
Maize 8,533,162.0 497.916.0 26,952,871.9 1,101,644. 24,881,202.7 1,351,032. 24,215,835.0 2,345,544.0 28,978.043.0 3,022,287.0
Millet 214,156.0 0.0 183,301.0 0.0 54,139.0 3,050.0 45,147.0 0.0 32,576.0 0.0
Peas 529,240.1 253,857.3 604,498.5 240.626.0 536,250.0 443,591.0 473,507.6 444,398.0 0.0 0.0
Pigeon peas
0.0 0.0 0.0 0.0 0.0 0.0 19,240.0 0.0 7,300.0 0.0
Finger Millet
0.0 0.0 0.0 0.0 0.0 0.0 0.0 0.0 3,242.0 0.0
Cow peas 0.0 0.0 0.0 0.0 0.0 0.0 0.0 0.0 102,180.0 0.0
Green Grams
0.0 0.0 0.0 0.0 0.0 0.0 0.0 0.0 24,622.0 0.0
Ground Nuts
0.0 0.0 0.0 0.0 0.0 0.0 0.0 0.0 369.0 0.0
34

CROP
Quantities produced and imported
2002 2003 2004 2005 2006
Local
Production
Imports
(KG)
Local
Production
Imports
(KG)
Local
Production
Imports
(KG)
Local
Production
Imports
(KG)
Local
Production
Imports
(KG)
Pasture 0.0 0.0 0.0 0.0 0.0 0.0 0.0 0.0 28,791.0 602.0
Soya Beans
0.0 0.0 0.0 0.0 0.0 0.0 0.0 0.0 488.0 0.0
Cotton 0.0 0.0 0.0 0.0 0.0 0.0 400.0 0.0 4,852.5 0.0
Sorghum 1,339,125.0 5,225.0 737,070.0 18,000.0 297,693.0 0.0 230,662.0 18,000.0 492,410.0 10,000.0
Sunflower
82,953.0 0.0 322,128.0 18,000.0 63,669.0 9,210.0 145,246.0 13,200.0 148,718.0 28,200.0
Safflower 0.0 0.0 0.0 0.0 385.0 0.0 300.0 300.0 486.0 0.0
Tobacco 0.0 0.0 0.0 0.0 12.7 12.7 0.0 0.0 24,622.0 0.0
Vegetables
438,050.4 199,637.2 553,964.0 307,258.6 423,516.0 225,155.0 579,626.9 451,741.3 1,685,598.2 1,712,284.7
Wheat 716,523.0 0.0 530,200.0 0.0 1,045,214.0 0.0 1,842,592.0 0.0 1,369,281.0 0.0
Table 3: Annual fertilizer off- take (2000 – 2007)
TYPE OF FERTILIZER 2000/01 2001/02 2002/03 2003/04 2004/05 2005/06 2006/07
DAP 88,567 98,285 116,295 105,724 150,569 136,254 164,964
MAP 25,441 10,476 31,674 1,144 3,420 2,157 2,712
TSP 341 - 3,948 4,622 201 599 3,198
SSP 470 470 1,970 3,999 2,010 6,000 4,980
NPK 20:20:0 7,236 2,416 16,592 13,761 2,945 9,036 7,982
35

TYPE OF FERTILIZER 2000/01 2001/02 2002/03 2003/04 2004/05 2005/06 2006/07
NPK 23:23:0 15,822 10,868 21,987 8,567 10,300 18,713 16,175
TOP DRESSING
CAN 57,526 44,560 59,801 30,700 51,456 59,739 69,714
ASN 350 850 630 - - - 500
UREA 16,552 37,557 24,288 45,084 25,017 41,071 28,554
SA 3,400 5,325 425 4,005 - 1,029 1,340
SPECIALIZED FERTILIZER
MgNo3 1,590 929 1,595 799 208 420 738
MgSo4 245 4,160 2,071 3,221 1,026 3,150 3,040
CN 399 2,769 2,913 6,916 3,997 900 597
MOP/SOP 539 1,125 1,593 6,121 12,510 10,396 6,411
AN 204 312 219 623 749 2,746 1,006
Iron chelate 1 2,285 5 57 10 2,020
Potassium Nitrate - 201 813 2,298 644 2,083
NPK28:28:0 2,890 174 2,736 - - -
NPK19:19:19 2,548 234 2,314 11 42 118 539
NPK19:19:19+1%MgO - 1,915 20 - - 4
Ferrous sulphate 1,315 172 563 1,780 - 1,475 1,987
Organic fertilizer 185 816 8,320 9,865 - 1,0000
Others 1,366 2,756 2,367 - 6,808 1,877 1,514
Sub Total 11,282 17,848 25,528 31,691 25,994 21,082 20,938
36

TYPE OF FERTILIZER 2000/01 2001/02 2002/03 2003/04 2004/05 2005/06 2006/07
GRAND-TOTAL 317,409 329,449 335,009 312,440 351,776 383,285 410,214
Table 4: Quantities and values of imported pesticides 2003/04 – 2005/06
CATEGORY2003/2004
Quantity in tons
2004/2005
Quantity in tons
2005/2006
Quantity in tons
Insecticide 2,465 2,881 2,844
Fungicide 1,657 2,031 2,361
Herbicide 1,396 1,538 1,311
*Others 723 597 1,192
Total 6,241 7,047 7,708
37

5.2 Subproject Design74. The assessment of IPM program needs for Counties/districts under KAPAP/ /KACCAL
should involve invitation of proposals from various institutions for development of IPM program for the Counties/districts. It should also include designing and delivery of training programme for crop specialists, Service Providers, programme stakeholders and farmers to assist users in planning and implementing location specific IPM activities.
5.2.1 Set up of an IPM Program
75. Planning is at the core of an IPM program and needs to be tailored for every crop that is to be considered. Early planning, prior to a growing season, is crucial for the program as it will help to minimize reliance on pesticides.
76. A good Integrated Pest Management program has four parts:
a) Identifying problems;
b) Selecting tactics;
c) Considering economic and environmental factors; and
d) Evaluating the program.
5.2.2 Identifying Problems
77. You have to know what’s happening in your fields before you can make good management decisions. You should scout your crops often and on a regular basis to identify problems. Scouting is, in fact, the key feature of any IPM program. By scouting, you will be able to detect potential problems early. The earlier you discover a problem, the better your chances are of avoiding economic losses.
78. To scout effectively, you have to: Know the crop’s growth characteristics to recognize abnormal or damaged plants. Identify the cause of the problem to know what kind of pest you are dealing with. If you
encounter something you cannot identify, consult an expert in KAPAP PCU. Determine the stage of growth of the pest and the crop. This is essential for proper timing
of control methods. Decide whether the infestation is increasing or decreasing. Assess the condition of the crop. Map out problem areas. It may be possible to limit the area that needs treatment. Use the right scouting method for the specific pest.
5.2.3 Select Tactics
79. Once you’ve identified the problem, you should consider how to control it. Your goal in selecting control tactics is to use methods that are effective, practical, economical, and environmentally sound. To select the best control tactics, you have to:
Understand the life cycle and habits of the pest. Some control methods will work only if they are used at the right time.
Decide whether the infestation is serious in terms of economic loss. Compare the costs and benefits of various control methods. Make plans for the future. Not every part of an IPM program can be put into effect
immediately. Some tactics, such as planting resistant varieties or rotating crops, require long-range planning.
60

5.2.4 Consider Economic Factors: Know When It Pays to Use a Pesticide
80. Despite efforts to avoid using chemicals, there are times when only pesticides can control the damage. Even so, it may not pay to use them. Pesticides should be used in an IPM program only when the benefits (yield, quality, aesthetic value) exceed the costs of control. Otherwise time and money are wasted. It is not easy to figure out when it pays to use pesticides. There are many variables: the pest population, variety, crop growth stage, value of the crop, weather, and cost of the control. The following economic concepts are helpful in determining the point at which it pays to use pesticides:
a. Economic damage (ED) occurs when the cost of preventable crop damage exceeds the cost of control. For example, if Maize is worth Kshs 1,500 a bag and an insecticide costs Kshs 10,500 an acre, then economic damage occurs when insect damage causes a yield loss of seven or more bags an acre.
b. Economic injury level (EIL) is the lowest pest population that will cause economic damage. For many pests it is important to use control measures before this level is reached.
c. Economic threshold (ET) is the pest population level at which a control tactic should be started to keep the pest population from reaching the EIL. (The ET is also called the action threshold.) Economic thresholds have been established for a number of crop/pest systems, in particular those involving insects. This information is available from the Agricultural Extension Service. It has been harder to develop economic thresholds for weeds and diseases, but research is being done to develop ETs for these systems.
5.2.5 Evaluating IPM Program
Evaluation means deciding how effective a program is and whether any changes are needed.
To evaluate an IPM program, the following steps are to be followed:
81. Monitor your fields and keep records. Each time you visit your fields, make a note of crop and pest conditions—record crop yields and quality and record any counts on pest populations.
82. Record control measures. Records should include dates, weather conditions, pest levels, application rates and timing, and costs. Good records are a guide if the same problem occurs. They are also a good legal safeguard.
83. Compare effectiveness. Whatever control tactics are chosen, use a different method on some strips. That way you can compare them; which worked better, taking into account costs and environmental impacts
5.2.6 Pesticide reduction and judicious use
84. There are no quick and easy answers to concerns about pesticide use. When pesticides are properly used according to the label, risks are minimized.
85. Pesticides vary greatly in their level of toxicity, so during training in integrated pest management an ecological approach to pest control we stress the importance of using a product that is effective, but as nontoxic as possible to non-target organisms.
86. A reduction in pesticide use can only be achieved with a greater understanding of plant selection, placement and care. Farmers can do a great deal to reduce and, in many cases, eliminate their use of pesticides.
87. There may be a cultural, mechanical, physical, biological and/or chemical approach that effectively controls the problem with minimal impact on humans and the environment, and integrated pest management considers all those approaches. Whatever the situation,
61

it is always important to first identify the problem, monitor the severity and spread, and know at what time or stage control is necessary.
5.2.7 Investigate the cause
88. Once you begin to understand the underlying causes for pests, disease and weed problems, you can develop long-term solutions to keep your plants healthy with fewer pesticides. Pesticides often are used as a quick and temporary solution to address a more serious underlying problem that must be corrected. As an example, some farmers see weeds in the farm and rush to apply a herbicide. There are many herbicides available to help control weeds temporarily, and they may be beneficial if they are properly applied and used at the correct time. However, weeds are usually indicators of soil compaction problems that must be alleviated for long-term control.
89. Use tillage practices that aerate and loosen the soils, allowing crops to thrive in place of weeds. Add fertilizers, lime and gypsum, based on soil tests, to provide critical nutrients and adjust pH for proper plant growth. The best time to irrigate a crop field is very early in the morning or after 16:00 to prevent extended leaf wetness, which increases the potential for disease. Deep and infrequent irrigation is best. For flowers and vegetables, water plants at the base and avoid wetting leaves.
90. Insect problems also can be reduced with proper plant selection and care. For instance, select crops that are pest tolerant or resistant. Selection of the latest varieties of crops tested and released by the Kenya Plant Health Inspection Service and suitable for the agro ecological zone will minimize the need for pesticides.
91. There are many new biological alternatives (beneficial insects, fungi, bacterium, etc.) for insect pests that can be used in an IPM program such as nematodes (steinernema species), ladybird beetles, bacteria (bacillus species) and fungus (Beauvaria bassiana).
5.2.8 Choosing controls
92. There is no such thing as a completely safe and natural pesticide. Pesticides can vary greatly in their level of toxicity to non-target organisms such as people, pets or beneficial insects. Even organically approved pesticides can pose a danger to people and the environment if they are not used properly.
93. Take care with all pest-control products and use them as directed. Products will list the specific pest or pests they control and the plants onto which they can be applied. They must be used at the proper concentration in order to be effective without posing additional risks to the applicator or the environment. It is illegal to misuse them.
94. Pesticides are grouped into various types or categories. For example, there are fungicides, insecticides, herbicides (for weeds), nematicides (for nematodes) and miticides (for mites). While many pesticides control specific problems, there are still some broad spectrum controls. In addition, there are many products that are only effective if they are used at a specific growth stage of the pest, so timing is critical.
95. It is never wise to use blanket applications of pesticides on large areas or to use them based on a calendar alone. The improper use of pesticides can pose a risk to the applicator, family, plants, beneficial organisms and the environment.
96. There are times when pesticides are needed to prevent major losses of plant material. The judicious and proper use of pesticides can occur with a sound IPM program.
Application of non-chemical means of pest control:
97. Some of the main features of IPM involve the non-chemical methods of pest control:a) Biological controls: the use of natural enemies of crop pests, often called beneficials,
which include parasites, predators and insect pathogens. Environmental friendly chemical interventions sometimes are included in the biological controls, such as the use of
62

semiochemicals, including pheromones and feeding attractants, and biopesticides, for example specific and beneficial friendly insecticides.
b) Cultural and crop or livestock management controls: tissue culture, disease-free
seed, trap crops, cross protection, cultivation, refuge management, mulching, field sanitation, crop rotations, grazing rotations, steam cleaning, trapping, freezing and intercropping.
c) Strategic controls: planting location, timing of planting and harvesting.
d) Genetically based controls: insect and disease resistant varieties/breeds and rootstock.
5.3 ImplementationThis will utilise such tools as the general micro-projects screening checklist (Appendix 4) which is followed by a more detailed investigation undertaken as guided by specific IPM questions using Appendix 3: Questionnaire on Pest Management
5.3.1 Step One: Understand IPM and its advantages over other pest control methodologies
98. To understand IPM and its advantages, you have to recognize some of the fundamental ways it differs from more traditional pest control programs:
99. IPM addresses more than just the symptoms of a pest problemNon-integrated pest control programs tend to focus on killing pests while ignoring the reasons why pests are there in the first place, which doesn’t do much to prevent recurring problems. By removing or altering the conditions that attract or are conducive to pest infestations, IPM practitioners can better cure existing infestations and prevent future ones.
100. Scheduled chemical treatments are not IPMMany pest control plans call for routine pesticide applications whether pests are present or not. These applications are seen as “protective barriers” that will prevent infestations. They are not. In fact, unnecessary applications may even lead to the development of pesticide resistance in target pest populations and increase problem infestations instead of reducing them. And an application of a pesticide on a regular schedule is not IPM. IPM instead relies on routine inspection and monitoring for pest presence. Pesticides are considered only when there is clear evidence of pest presence (e.g., pest sightings, droppings or pest catches in monitoring traps, and when non-chemical approaches such as vacuuming, trapping and exclusion (i.e., physically blocking pests’ entrance) have been unsuccessful or are inappropriate.
101. IPM techniques are less toxic, more targetedSome pest controllers will apply pesticide to exposed areas far from where it is really needed and use more of it than necessary. IPM practitioners apply pesticides with precision and choose the least-toxic formulation to get the job done.
102. IPM is not a one-person jobLong-term pest management solutions typically depend on daily pest monitoring and a variety of sanitation, breeding, tillage, management and appropriate agronomic practices. No one person can do it alone. Without cooperation from land owners, land occupiers management and staff, the IPM model falls apart and chemical treatments will be difficult to avoid.
IPM requires greater expertise than traditional programs
103. Managing pests with less pesticide requires a strong working knowledge of pest biology and behavior, current pest control technologies and practices, climate and its effects on pest proliferation, greenhouse and storage structural characteristics and staff behavior. Without this knowledge, it will be difficult, if not impossible, to prevent
63

infestations without routine chemical applications.
104. IPM is effective Simply put, IPM is more effective in controlling pests over long periods than unitary use of the conventional chemicals which do imbalance the ecosystems. This is not surprising, since IPM combines many control techniques instead of relying on any one technique. IPM’s efficacy advantage has been confirmed by research and in practice. IPM approach is recommended by pesticide management stakeholders.
105. IPM costs less long-termIt is a common misconception that IPM programs are more expensive than traditional programs, partly because it can cost more up front to implement an IPM strategy. But IPM is analogous to preventive health maintenance. In the long term, it’s almost certainly more cost-effective in terms of time, personnel and materials to prevent problems than to remediate the same symptoms again and again.
106. IPM poses less riskFarm workers may have compromised immune, neurological, and digestive and respiratory systems that put them at increased risk of suffering harmful effects from exposure to pesticides. Chemically sensitive individuals, pregnant women, infants, children and the elderly may be especially vulnerable to the effects of pesticides. By reducing pesticide use, IPM helps reduce the potential for negative impacts on human health and the environment.
5.3.2 Step Two: Identify the implementation team
107. As with any successful initiative, the transition to an IPM program requires a diverse, action-oriented team. This committee could be part of an existing ‘green team’ or developed as a subcommittee under the National or District Environmental committee, since implementation of a new IPM program can be tracked as a performance indicator. The leader of this team should be familiar with pests, pesticides, pesticide regulations,
108. Pest management principles and environmental issues, have a direct link to supporting leadership and have the time and authority to supervise IPM implementation. Other team members could include environmentalists, agronomists, crop protection experts (entomologists, pathologists) animal production experts, animal health experts, veterinarians, maintenance staff, public health experts, food services, industrial hygiene, environmental services, safety and infection control.
109. If you do not have IPM expertise in-house and plan to contract out IPM services, you may wish to identify your prospective vendor and make use of their information and support as you develop implementation plans.
5.3.3 Step Three: Decide on scale of implementation
110. To determine the scale and strategic approach you need to take, first discuss what IPM is—and what it isn’t—with key staff and committees. If you are outsourcing and have identified a prospective IPM vendor, ask a representative to accompany you to committee meetings to help explain the IPM approach and give examples of documented success in facilities like yours. Through these discussions you can build understanding and address potential objections with solid information. Having well-positioned members of your designated IPM committee present before department heads, board of directors and other committees may create sufficient buy-in to allow you to make changes in your pest control methods across the board.
111. Feeling resistance? Try a pilot/ demonstration plot to accommodate concerns, work out the kinks and build support. Problems can more easily be seen as a learning process when you start small. When determining where to carry out your pilot, remember that IPM involves altering the environment to reduce pest entry points, and
64

food and water sources, so it works best when it encompasses an isolated area. For example, choose a single building if possible, rather than one floor of a building, where pests can easily travel from another floor to continue to infest your pilot areas. Remember, IPM takes time to achieve positive results, and even successful programs may go through a period of static as you discover problem areas and adjust accordingly.
5.3.4 Step Four: Set goals and measurable objectives for your IPM program
112. Measurable goals to track could include pest management costs, monitoring of pest activity before and after implementation of an IPM program, number of calls related to pest problems and toxic chemical use reduction. When will your IPM program be up and running? Know how much will it cost? What i s to be accomplishing by choosing IPM? K n o w i n g w h e n o n e h a s succeeded? One need to know answer these questions before tackling IPM implementation.
113. When will the shift to IPM occur? The first step is to develop an implementation timeline that includes time to execute all of the steps outlined in the implementation plan. Make sure to include time to obtain administration and staff buy-in, conduct any staff training and manage an RFP process if you expect to outsource to a pest management professional.
114. How much will it cost? The budget for the program will be critical to administration. Be sure to design a budget that differentiates the costs of initial implementation from the costs of maintaining the program, which should be less than the implementation cost. Talk to industry colleagues whose facilities have implemented IPM programs. How long did it take them? Do they outsource, and if so, to whom? Are they satisfied with their service? What is their budget? What does it include? Be sure to analyze the marginal cost of your IPM program when compared to the costs of your current pest control effort. It may be less than you think.
115. How will you know if IPM is succeeding?The advantages of IPM—efficacy, cost and safety—are laudable but probably won’t do you much good when it comes to asking for budget if you don’t have a system in place to measure the program’s achievements. Build measurable objectives for each of those goals into your program plan from the beginning.
116. Efficacy: Since IPM is better at controlling pests, you should see a measurable reduction in pest sightings, client complaints and monitoring station counts over time. But if you’re planning to measure against these or similar metrics later, you’ll need benchmark data on them now. Consider how you will obtain and compile that data before the switch to IPM. Once you’ve implemented your IPM program, you’ll want to allow the program sufficient time—at least six months—to make a real difference before you measure. Remember, IPM’s not an overnight event but a process.
117. Cost: Do you expect to see cost reductions over time as IPM gains momentum? When? Set specific dollar-figure parameters for your IPM costs so you can measure against them later.
118. Safety: IPM’s ability to create a safer environment is predicated in large part on reducing pesticide use. If you’re already outsourcing to a professional, ask them if records are available as to the volume of pesticides applied in the facility for the previous year (or more if available). If you’re just starting a contract with a professional for the IPM program, be sure the company can provide detailed information on how any decision to apply pesticides will be made, their advance notification procedures for pesticide application, and how they will supply you with pesticide usage records when
65

pesticides are applied (see Step 10). In either case, the information will help you prepare for, benchmark and track pesticide usage. The goal should be a downward trend over time or ideally, a specific reduction amount, with the end result a reduction to only very occasional usage of highly toxic pest control chemicals.
5.3.5 Step Five: Analyse current housekeeping, maintenance and pest control practices
119. As you prepare to make the switch to IPM, it helps tremendously to have a clear idea of your facility’s current policies and practices when it comes to structural maintenance, sanitation and pest control. In some cases, current practice may be in line with IPM principles. In others, you may have a long way to go. The more you know about what your facility is doing now, the better you can prepare for the necessary changes. Here are a few considerations to keep in mind as you lay the groundwork.
120. Structural Maintenance One of the best (and maybe most obvious) ways to keep pests out of a facility is to physically stop them from entering wherever possible. As part of your regular IPM inspections, you’ll need to inspect cracks, crevices or other unnecessary openings in the building exterior that can be used by pests as harborage areas or entry points—no matter how small—and seal them as appropriate. Is your maintenance staff or pest management provider already doing this? If not, who will be responsible for this activity under the IPM program? Will training be required? What are the cost implications?
121. Sanitation If pests can’t find the food and water they need in your facility, they have much less reason to be there. That’s why sanitation will always be one of the most powerful tools in the IPM arsenal. The cleaner the facility, the less need there will be for chemical pest control treatments. Does your facility already follow a written sanitation plan indicating cleaning schedules, procedures and responsible parties? If so, make sure the routine sanitation inspections focus on areas of high pest pressure (e.g., receiving docks, food service areas, admissions areas, break rooms or bio-hazard rooms). You may need to work with the appropriate parties to implement a sanitation plan that pays special attention to these sensitive areas. Also consider how daily staff sanitation practices play into the overall cleanliness of the facility.
122. When it comes to pest control, a sanitation plan is only as strong as its dirtiest station. Be prepared for staff pushback and the chance that staff may need some special training (see Step 9)
5.3.6 Step Six: Establish a system of regular IPM inspections
123. Whereas many pest control programs still revolve around regularly scheduled pesticide applications, IPM revolves around regular facility inspections. These inspections are the “engine” for an ongoing cycle of IPM activities that may or may not include chemical treatments. These activities include:a. Inspectionsb. Pest Identificationc. Selection of Control Methods d) Monitoringd. Evaluation
124. IPM inspections must focus on the five “zones” or “triggers” of pest activity: entry points, water sources, food sources and harborage areas. During inspections, all existing pest issues and potential problem areas, inside and out, must be noted for follow-up (see Step 7). If your facility chooses to outsource IPM services, it will be the provider’s job to perform a thorough inspection during each scheduled visit and determine appropriate treatment methods. For in-house IPM programs, the greatest
66

inspection challenge will be establishing routine, proactive surveillance by trained specialists (see Step 9).
5.3.7 Step Seven: Define policy treatment selection
125. Even in the cleanest facility, pests will appear from time to time, so you need a clear, written policy on how your facility will respond when they do:a. The policy should define non-chemical and chemical treatment options and the order
in which they should be considered. It should be very clear on when and where chemical treatments are appropriate. Finally, it should include an “approved materials” list to ensure smart choices when chemical treatments are applied.
b. Keep in mind as you develop your policy that the first step in any IPM response is to correctly identify the pest that has invaded. Because pest behavior varies so much from one species to the next, the appropriate response will vary just as widely.
c. Once the pest is identified and the source of activity is pinpointed, the treatment policy should call for habitat modifications such as exclusion, repair or better sanitation. These countermeasures can greatly reduce pest presence before chemical responses are considered.
d. Additional treatment options—chemical and nonchemical—can then be tailored to the biology and behaviour of the target pest.
e. The final step in the response cycle is Monitoring. The information you gain through continuous monitoring of the problem will help determine additional treatment options if they are needed.
f. If you outsource to a pest management professional, work with the provider to agree on a policy and a written approved materials list. But don’t forget that the policy applies to facility staff as well as the provider.
5.3.8 Step Eight: Establish communication protocols for environmental services, facility maintenance, facility management and service provider
126. Because IPM is a cooperative effort, effective communication between various parties is a prerequisite for success. Clients and employees must document pest sightings, the pest management professional must make recommendations and notify appropriate parties of chemical treatments, environmental services must communicate with maintenance to make necessary repairs, and so forth. Consider the “bird’s eye view” of an effective IPM communication flow above.
5.3.9 Step Nine: Develop worker training plans and policies
127. As mentioned in Step 6, the greatest challenge for in-house IPM programs will be establishing routine, proactive surveillance by trained specialists. Whether you outsource or not, remember that your employees can serve as a vast pool of “inspectors” charged with reporting pest sightings, which will quicken response times and help limit the scope of new infestations. Host training sessions to acquaint employees with IPM principles and the role they will play in a successful IPM program. Some pest management providers will offer IPM training for your staff. Take advantage of it. A little on-the-ground help from employees will go a long way toward achieving your IPM goals.
5.3.10 Step Ten: Track progress and reward success
128. Remember the measurable objectives you set and data you gathered in Step 4? Your goals will not mean much if you do not measure the IPM program’s performance against them at least once a year. Detailed service records will be critical to these evaluations, so make sure your pest management professional or in-house program provides the following documentation:
67
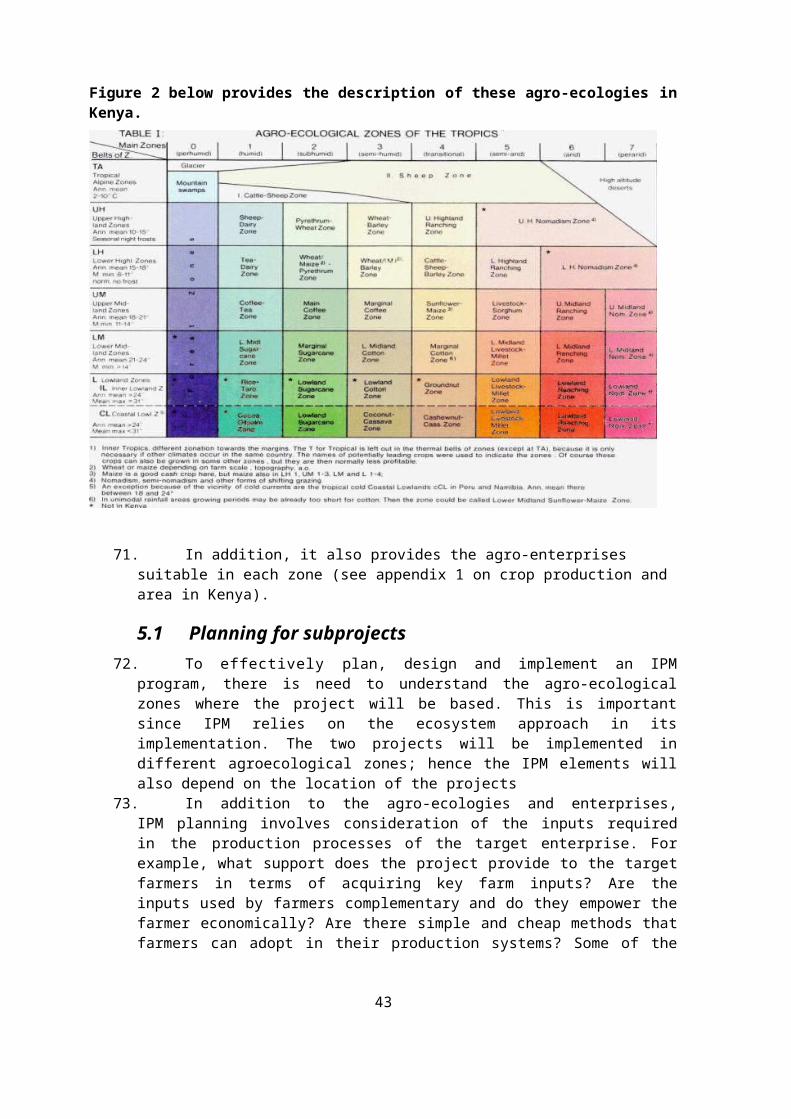
a. Detailed description of the parameters and service protocols of the IPM program (i.e., what are the ground rules?) Specific locations where pest management work was performed
b. Dates of servicec. Activity descriptions, e.g., baiting, crack-and crevice treatment, trapping, structural
repair. Log of any pesticide applications, including:i. Target pest(s)
ii. The brand names and active ingredients of any pesticides appliediii. EPA registration numbers of pesticides appliediv. Percentages of mix used in dilutionv. Volume of pesticides used expressed in pounds of active ingredient
vi. Applicator’s name(s) and certification identity (copy of original certification and recertification should be maintained.)
vii. Facility floor plan on which all pest control devices are mapped and numbered
viii. Pest tracking logs (sightings and trap counts)(ix) Action plans, including structural and sanitation plans, to correct any pest problems
ix. Pest sighting memos for staff to use in reporting pest presence to the pest management provider
129. Using these records, and assuming the goals of your IPM program are increased efficacy, lower costs and reduced pesticide use (see Step 4), you should see: Fewer pest sightings and client complaints. Lower monitoring-station counts over
time. Lower costs after the first 12-18 months, once IPM’s efficacy advantage has had
time to take effect. Downward trend in volume or frequency of pesticide usage.
130. Report the program’s successes following each evaluation and encourage good practices by recognizing individuals who played a role. Remember, IPM is a team effort. Communicating the success of your program in reducing toxic chemical use and exposure, reducing pest complaints and lowering costs will help facility staff understand the purpose of the program and appreciate its success. The more they understand, the more likely they will participate willingly in helping you expand and institutionalize IPM in your facility.
131. When your program has been in place for long enough to show significant results, you may also wish to work with your community affairs department to publicize your successes more broadly to demonstrate your environmentally responsible approach to effective pest control. And last but not least, lead by example by sharing your success with other stakeholders.
68

6.0 MONITORING AND EVALUATION SYSTEMS FOR THE VARIOUS PEST MANAGEMENT PRACTICES OF THE PMP
132. Successful implementation of the KAPAP/KACCAL program in the districts will require regular monitoring and evaluation of activities undertaken by the Farmer Groups. The focus of monitoring and evaluation will be to assess the build-up of IPM capacity in the Farmer Groups and the extent to which IPM techniques are being adopted in agricultural production, and the economic benefits that farmers derive by adopting IPM. It is also crucial to evaluate the prevailing trends in the benefits of reducing pesticide distribution, application and misuse.
133. Indicators that require regular monitoring and evaluation during the programme implementation include the following:
1. The IPM capacity building in membership of Farmer Groups: Number of farmers who have successfully received IPM training in IPM methods; evaluation the training content, methodology and trainee response to training through feedback Numbers of Farmer Organizations that nominated members for IPM training; emphasize the number of women trained; assess Farmer Groups understanding of the importance of IPM for sustainable crop production
2. Numbers of farmers who have adopted IPM practices as crop protection strategy in their crop production efforts; evaluate the rate of IPM adoption
3. In how many crop production systems is applied IPM? Are the numbers increased and at what rate
4. How has the adoption of IPM improved the production derive by adopting IPM Economic benefits: increased in crop productivity due to adoption of IPM practices; increase in farm revenue resulting from adoption of IPM practices, compared with farmer conventional practices;
5. Social benefits: improvement in the health status of farmers6. Numbers of IPM networks operational and types of activities undertaken7. Extent to which pesticides are used for crop production8. Effeciency of pesticide use and handling and reduction in pesticide poisoning
and environmental contamination9. Levels of reduction of pesticide use and handling and reduction in pesticide
poisoning and environmental contamination10. Number of IPM participatory research project completed11. Influence of the results of IPM participatory research on implementation of
IPM and crop production12. Overall assessment of: activities that are going according to plans; activities
that need improvements; and remedial actions required
134. The following indicators will be incorporated into a participatory monitoring and evaluation plan:1. Types and number of participatory learning methods (PLM) delivered; category
and number of extension agents and farmers trained and reached with each PLM; practical skills/techniques most frequently demanded by districts and farmers, and food, cash and horticultural crops and livestock management practices preferred by farmers.
2. Category and number of farmers who correctly apply the skills they had learnt; new management practices adopted by most farmers; types of farmer-innovations implemented; level of pest damage and losses; rate of adoption of IPM practices; impact of the adoption of IPM on production performance of farmers
3. Increase in food, cash and horticultural production systems/livestock production; increase in farm revenue; social benefits: e.g. improvement in the health status of farmers, reduction in pesticide package and use; and number of community families using preventive mechanisms against diseases.
69

6.1 Proposed Pests Monitoring and Evaluation Regime135. The participatory M&E system for IPM should also be enterprise-based so as to
deal with a group of diseases and pests affecting any single crop. The approaches being proposed here therefore does not handle single pest to otherwise the issue of different agronomic practices for different crops would have to be taken into consideration.
136. Similarly, the animal, forestry and aquaculture pests are treated in a similar way. This approach seems to be the most cost effective in terms of mobilizing stakeholders with common interest (e.g sugar cane farmers, tea farmers, banana farmers, aquaculture farmers, livestock farmers, etc.) as well as area of coverage and intensity of the pest problems.
137. Since pest problem is an existing problem and a major constraint to several enterprises in Kenya, it is obvious that there are already existing pest management programmes within the country. In view of these efforts, it will be advisable to use the Participatory Impact Monitoring (PIM) approach.
138. The steps involved in participatory M&E should include:
a. Stakeholder Analysis and identification of M&E team b. Setting up objectives and expectations for monitoringc. Selection of Impacts to be monitored (Variables/Indicators)d. Develop Indicator sheetse. Develop and test the tools to be used in data collection (Usually Participatory Rural
Appraisal tools are used)f. Collect the data from as many sources of stakeholders as possibleg. Assessment of the data and discussion for a arranged on regular basis
6.2 Participatory Impact Monitoring (PIM)139. Participatory Impact Monitoring (PIM) should be employed for continuous
observation, systematic documentation and critical reflection of impacts of IPM, followed by corrective action (plan adjustments, strategy changes). It should be done by project staff and target groups, using self-generated survey results. The stakeholder analysis and selection of participatory M&E team is therefore very important in implementing an effective impact monitoring (See guide on 4-Step Stakeholder Analysis Templates).
140. Once an agreement on the objectives of PIM is reached among the stakeholders (development partners, implementing agency, target groups etc), their expectations and fears regarding project impact are identified, e.g. in brainstorming sessions. The more participatory the activities have been planned the more these views will overlap each other.
141. Having examined already existing M&E data regarding the selected impacts, the task is to develop indicator sheets (Shown below) which contain all important information for impact measurement: definitions of terms, indicators and their rationale, survey units and respondents, instructions for data collection, statements on limitations of the methods used.
142. Users and the key questions for which the indicator is intended (if appropriate comment on area affected, villages affected, seriousness scale, impacts on humans, environment etc., recognising that one indicator may fill several roles in this respect).
143. Indicator Fact Sheets Sample
Suggested Contents/FormatIndicator Name:
70

Use and interpretation:
Meaning and potential causes of upward or downward trendsImplications for of the indicator to IPM
Units in which it is expressed (e.g. km2, number of individuals, % change)
Description of source data: (origins, dates, units, sample size and extent)
Calculation procedure (including appropriate methods and constraints for aggregation):
Most effective forms of presentation (graph types, maps, narratives, etc. – give examples where possible):
Limits to usefulness and accuracy: (e.g. rates of change – increase/decrease, poor quality data, limited scope for updating etc)Data sources and process for updating:Sources could include key informants, opinion leaders, NGOs, GoK Departments, Development Agencies etc. There could be several sources of similar datasets or informationClosely related indicators:Other existing or monitored indicators that give similar information for monitoring the same change or impact
Source: (i.e. who calculated the indicator (author etc), with contact information or references.
144. The factsheet assumes that political, legal, agro-ecological and other framework conditions are almost the same for a single enterprise; any observed differences regarding selected impacts will be largely due to the (additional) input towards IPM.
145. After the selection of impacts to be monitored, impact hypotheses are established in order to obtain a clearer picture of the IPM and the environment in which it acts. In impact diagrams, project activities / outputs that are supposed to lead to a certain impact can be arranged below, external factors above the impact in the centre of the diagram (Fig. 2).
Figure 2: Participatory Impact Monitoring (PIM) approach to IPM
71
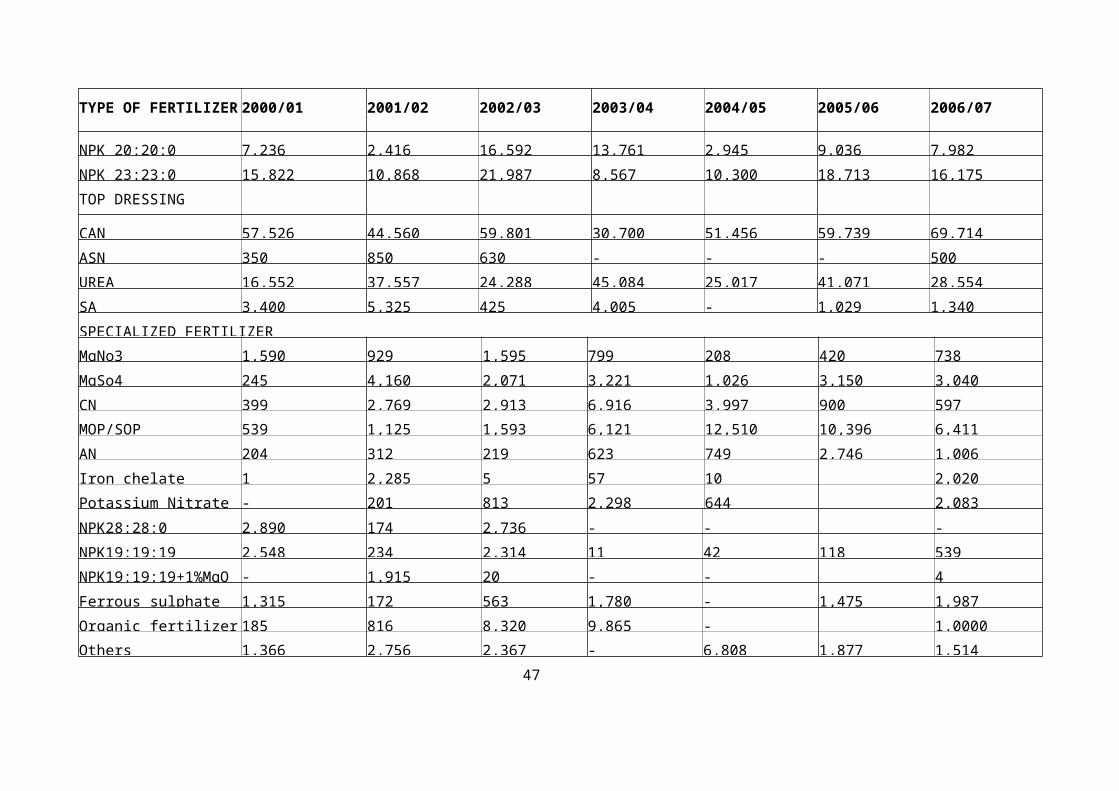
146. Once questionnaires and other tools (e.g. PRA instruments) have been pre-tested, and a decision on sample size and composition has been taken, impact-related information and data is collected and processed. Interviews are held with randomly selected individuals (e.g. female farmers), key persons (e.g. village elders, teachers) or groups (e.g. Saving and Credit Groups, Development agencies, Institutions etc.).
147. Joint reflection workshops with project staff, target group representatives and other stakeholders are conducted in order to (a) consolidate impact monitoring results by combining the views of various actors and (b) ensure that necessary plan adjustments and strategy changes are in line with the target groups’ demands and capacities.
6.3 Integrated Pest Management Monitoring Framework148. The Participatory M&E Framework for IPM should follow a feedback principle in
which results or impact of any interventions can be traced to the activities/inputs. Either by using conventional pest management method or IPM, the feedback should allow for evaluation of the methods used and adjustment or incorporation of additional control methods (Fig. 3). The results of the activities form the basis of the factsheets to be used in monitoring.
Figure 3: Monitoring framework for Integrated Pest Management based on previous practices and proposed approaches
72

7.0 POTENTIAL ECONOMIC, ENVIRONMENTAL AND SOCIAL IMPACTS OF THE PEST MANAGEMENT ACTIVITIES WITHIN THE SUB-PROJECTS
7.1 Major agricultural and animal husbandry enterprises149. Kenya is a predominantly agricultural based economy with agriculture
contributing about 25% to the overall Gross Domestic Product. Other than agricultural production, the sector boasts a comparatively wide range of manufacturing industries, with food processing being the largest single activity. About 66% of the manufacturing sector is agro-based, owing to the country’s agricultural economy foundation. Agriculture, mainly the cultivation of maize, rice, sugarcane, coffee, tea, cotton and horticultural products and livestock-rearing employs some 75% of the workforce and forms the basis of its economic viability.
150. The major food crops are beans, rice and bananas while sorghum, millet and root crops, such as cassava and sweet potato are considered to be important food security crops (Fig. 2). In Kenya, maize is one of the most important cereal crop and accounts for 80% of the national production of cereals (CIMMYT, 1994). It is a significant source of carbohydrates for Kenyans who consume more than 100 kg of maize per person each year. The importance of maize in Kenya is indicated by the intensity of its cultivation in many parts of the country (Fig. 3) during the long rainy season for 1989. Industrial crops include tea, sugarcane, cotton, coffeee and tobacco. Important horticultural crops include kales, tomatoes and onion while the fruit trees include avocado and pawpaw.
151. Rice is the third most important staple food in Kenya after maize and wheat. It forms part of the larger diet for urban population. The magnitude of existing and proposed rice irrigation in Kenya is enormous. Consequently Kenya is one of the areas in the country with the greatest potential for irrigation (Fig. 4). About 95% of the rice in Kenya is grown under irrigation in paddy schemes managed by the National Irrigation Board (NIB). The remaining 5% of the rice is rain fed. If properly utilized, Kenya has the potential to feed the East and Central Africa region.
152. Tea is the single largest export commodity in Kenya and is a major foreign exchange earner, accounting for 17-20% of Kenya’s total export earnings (Wachira, 2002). In the year 2005, Kenya was the fourth largest tea producer after India, China and Sri Lanka and is contributing 10% of the global tea. Tea production in Kenya is divided into two categories, privately owned large plantations which account for about 40% of the total tea production in the county and the smallholder tea farmers who produce the remaining 60% of Kenyan tea.
153. Sugarcane production is also largely caried out in Western Kenya which is within Western Kenya in three zones namely; the Nyanza sugar belt which is the oldest producing zone; Western Kenya, a small-scale production zone and the South Nyanza belt. The sugar industry supports several other industries including: beverage, confectionery, pharmaceutical, wine, spirit, alcohol, animal feeds, and electricity, chemical and fertilizer firms. Currently, the industry is experiencing problems related to low production and capacity utilization. Sugar factories (Fig. 6) are running inefficiently and/or operate below capacity.
154. Cotton used to be a major cash crop and performed quite well in the marginal areas of the country especially after it attained independence in the 1960s. However, problems within the industry discouraged farmers from engaging in this enterprise. According to the Cotton Board of Kenya, about 350,000 hectares in the country are suitable for cotton production and have the potential to yield an estimated 260,000 bales of lint annually. However, cotton is only being cultivated on 25,000 hectares at present, with an annual lint production of 20,000 bales.
73
155. Root crops remain important food security crops especially in the semi-arid areas. In Kenya, the main cassava producing areas are western and coastal regions, below 1500 m.a.s.l (Acland, 1973). In 1988, the area estimated to be under cassava cultivation in Kenya was 53,500 ha and the projected production was 450,000 tonnes. This gives an average yield of 8 tonnes/ha. Sweet potato was cultivated on an area of 57,000 ha in 1990. Fifty five percent of the production area was concentrated in the Nyanza and Eastern regions with South Nyanza, in south-western Kenya.
156. Bananas have played and continue to play a major role in the diets of the people and economy of Kenya. The area under banana and plantain cultivation in Kenya was 115,500 ha in 1989 and increased to 125,000 ha in 1997 with a corresponding production of 520,000 and 595,000 metric tonnes respectively (Reddy et al., 1999).
157. The livestock industry contributes about 10% of the GDP of the country. The real proportion of this sub sector’s contribution is likely to be higher if consideration is made of unrecorded slaughter and home consumption. The re-opening of the Kenya Meat Commission in 2006 provides an additional marketing channel for beef production. Production value of dairy products in Kenya’s 1995 was about 253.75 million Kenya shillings (KShs.), or about 8.48% of total agricultural product value.
158. The major livestock enterprises in the basin include cattle, poultry and goats. Non- conventional livestock are slowly gaining importance within the country. These include the ostrich, guinea fowls and quails. The major livestock kept in Kenya are the indigenous cattle and the high breed. Sheep and goats are also kept. Exotic poultry (chicken) and bee keeping play a role in the economy of the country.
159. In Eastern and Southern Africa, trees such as cypress, pine and eucalyptus are grown extensively in industrial plantations monocultures for wood-based industries such as sawn timber, paper and other products. In most countries in this region, cypress and eucalyptus trees are also grown in village woodlots and by small-scale farmers for fuel wood, local timber, soil stabilization and wind breaks
7.2 Food Crops160. The major food crops shown in preceding tables are grown in the target
project areas and include maize, rice, sorghum, millet, beans, cassava, sweet potato, banana, grain legumes (green gram, pigeon peas, cowpeas, soybeans, groundnuts) and wheat. The importance of each crop varies from one area to another and the priority list varies depending on the source of information. However, maize is the most popular staple of many Kenyans. This is followed by rice, sorghum, millet, bananas, beans, cassava, sweet potato, wheat and grain legumes. Some of these crops such as rice, maize, beans, sorghum and millet are regarded as food and cash crops depending on area.
7.2.1 Maize
Major maize pest problems and recommended management practices
Pest Recommended management practices
Stalk borers (Busseola
fusca)
Stalks are buried or burned to eliminate diapausing larvae, Early
sowing reduces infestation, Intercropping with pulses (except rice), Neem(arobani) powder (4-5 gm i.e. pinch of 3 fingers) per funnel, Neem seed cake (4 gm/hole) during planting
Carbofuran and carbaryl are effective insecticides, Use the extract of Neuratanenia mitis, a botanical pesticide
African armyworm
(Spodoptera exempta)
Scout the crop immediately the forecast warns of expected
outbreak in the area
Apply recommended insecticide or botanical extract timely (Table
74
Pest Recommended management practices
Seedling weevils
(Tanymecus spp. &
Mesokeuvus spp)
Timely planting to escape damage, Scout the crop, Apply lambda
cyhalothrin if necessary (Table 4.3)
Larger grain borer
(LGB) Weevils Moths
Red flour beetle
Dried bean beetles
Selection of tolerant varieties, Timely harvest, De-husking and
Shelling, Proper drying, Sorting and cleaning of the produce, Cleaning & repair of the storage facilities, Use rodent guards in areas with rat problems, Use improved granaries, Use appropriate natural grain protectants e.g. where applicable or, Use recommended insecticides at recommended dosage (Table 4.3) and/or, Keep the grain in air tight containers and store these in a shady place, preferably in-doors, Carry out regular inspection of
the store and produce. Timely detection of any damage to the grain
and/or storage structure is essential to minimise potential loss or damage, Promote biological control of LGB using Teretriosoma nigrescens (Tn) to minimise infestation from wild sources. This is the task of the national plant protection services because the agents have to be reared and released in strategic sites. However, the farmers will benefit from this strategy.
Grey leaf spots (GLS) Crop rotation, Plant recommended resistant varieties e.g. H6302,
UH6010, TMV-2, Observe recommended time of planting, Removal of infected plant debris by deep ploughing
Maize streak virus Early planting, Plant recommended resistant varieties e.g. TMV-1
in areas below 1500m above sea level, Kilima ST and Katumani
ST and Staha
Northern leaf blight Rotation, Deep plough of the crop residues, Plant recommended resistant varieties e.g. H6302, UH6010, TMV-2, H614
Maize streak virus
(MSV)
(Cicadulina mbila)
Observe recommended time of planting to avoid the diseases,
Plant recommended tolerant varieties e. g. TMV-1, Kilima ST, Staha-ST, Kito-ST
Leaf rusts (Puccinia
sorghi)
Timely planting, Crop rotation, Clean seeds, Reduce density,
Allow adequate aeration
Leaf blights
(Helminthosparium turcicum and maydis)
Crop rotation, Deep plough of crop residues
Common smut (Ustilago
Clean seeds, Crop rotation, Removal of plant debris by deep
PloughingWeeds:Wild lettuce,
Starber weeds, Simama (oxygonum sinuatum), Star grass, Wondering jew, Late weed, Digitaria spp.
Crop rotation, Proper land preparation, Timely weeding (at 2 and 5
weeks after planting), Use recommended herbicides when necessary, Hand pulling and hoe weeding, Intercropping, Use resistant/tolerant varieties
Improvement of soil fertility, Tillage , Proper land preparation, Timely weeding (at 2 and 5-6 weeks after planting),
75

Pest Recommended management practices
Witch weed (Striga spp) Hand pulling at flowering to avoid seed formation, Use of false
host plants e.g. rotation of maize with cotton or legumes, Application of high quantities of farm yard manure
Baboons, Monkeys,
Wild pigs, Warthog, Birds, Rats, Hippopotamus
Farming in block, Cultivate crops that are not preferred by the
prevalent vermin
Hunting (farmer groups), Use of traps, Local scaring
7.2.2 Rice
Major pests of rice and recommended management practices
Pest Recommended management practices
Stem borers (Chilo partellus, C.
orichalcociliellus, Maliarpha separatella,
Plant recommended early maturing varieties,
Destruction of eggs in the seedbeds, Early planting, Proper fertilisation, Use recommended plant spacing, Observe simultaneous planting, Destruction of stubble after harvest, Clean weeding, Plough after harvest to expose the eggs to natural enemiesStalk-eyed fly (Diopsis
spp)
African rice gall midge (Orseolia
oryzivora)
African armyworm (Spodoptera
Resistance varieties, Stalk management in dry season
Flea beetles (Chaetocnema varicornis)
Suspected to be the key vector of RYMV (Banwo, et
al. in press; Kibanda, 2001). No known control measures.Rice hispa (Dicladispa sp)
Cyperus rotandus, striga
All types (see Table 4.5)
Early clean weeding, Use recommended herbicides if
necessary
Rice yellow mottle virus Field sanitation including buring of crop residues and
removal of volunteer plants, Use of resistant varieties
Rice blast (Pyricularia oryzae)
Destruction of crop residues, Clean seeds, Avoid use
of excessive nitrogen fertilizers, Use of wide spacing to avoid overcrowding, Use resistance varieties, Appropriate crop rotation, Timely planting, Burying crop debris
Brown leaf spot (Helminthosporium spp)
Sheath rot (Acrocylindrium oryzae)
76

Pest Recommended management practices
Birds, Wild pigs, Hippopotamus, Rats
Scaring, Bush clearing, Early weeding, Early
harvesting, Spraying against Quelea Queleas
7.2.3 Sorghum
Sorghum major pests and recommended management practices
Pest Recommended management practices
Shootfly (Atherigoma
soccata)
Observe recommended time of planting to avoid the pest, Plant
recommended varieties, Destroy infected crop residues by burying, Apply recommended insecticides if necessary e.g., endosulfan or fenitrothion
Stalk borers
(Busseola fusca & Chilo partellus)
Stalks are buried or burned to eliminate diapausing larvae, Early
sowing reduces infestation, Intercropping with pulses (except rice), Neem(arobani) powder (4-5 gm i.e. pinch of 3 fingers) per funnel, Neem ssed cake (4 gm/hole) during planting, Carbofuran and carbaryl are effective insecticides, Use the extract of Neuratanenia mitis, a botanical pesticide
African armyworm
((Spodoptera exempta) Cutworms (agrotis ipsilon)
Plough a month before sowing, Rapid seedling growth, Weeding
early, Use of plant treated seeds, Treat the seed bed with wood ash, Scout the crop immediately the forecast warns of expected outbreak in the area, Apply recommended insecticide or botanical pesticide timely
LGB, weevils and moths Use of botanicals, e.g. Neem or pili-pili, Bio-control (use of natural
enemies)
Grain moulds Plant recommended tolerant/resistant varieties, Observe
recommended time of planting, Field sanitation, Practice good crop rotation
Grey leaf spot
(Cercospora sorghi)
Observe recommended time of planting, Field sanitation, Practice
good crop rotation, Use clean planting material
Anthracnose (Colletotrichum graminiocola)
Plant recommended tolerant varieties, Observe recommended time of
planting, Field sanitation
Rust (Puccinia
purpurea)
Use disease free seeds and follow recommended spacing, Plough in
crops immediately after harvesting, Crop rotation, Observe recommended time of planting, Field sanitation
Leaf blight
(Exserohilum turcicum)
Plant recommended tolerant varieties, Observe recommended, time of
planting, Field sanitationLadder leaf spot
(Cercospora fusimaculans)
Observe recommended time of planting, Field sanitation, Practice
good crop rotation, Use clean planting material
77

Pest Recommended management practices
Sooty stripe
(Ramulispora sorghi)Zonate leaf spot
(Gleocercospora sorghi)Witchweed (Striga
asiatica)
As for maize
Quelea quelea spp
Warthog
Hippopotamus
Scaring, Bird trapping, Farmers to scout potential breeding sites and
destroy nests, Monitoring and organised aerial spraying using fenthion 60%ULV at the rate of 2.0l/ha, Spot spraying, targeting roosting sites
7.2.4 Pearl millet
Pearl millet major pests and recommended management practices
Pest Recommended management practices
Shootfly (Atherigoma
soccata)
Observe recommended time of planting to avoid the pest
Plant recommended varieties, Destroy infected crop residues by burying, Apply recommended insecticides if necessary e.g. endosulfan or fenitrothion
Stalk borers (Busseola
fusca & Chilo partellus)
Stalks are buried or burned to eliminate diapausing larvae
Early sowing reduces infestation, Intercropping with pulses (except rice), Neem(arobani) powder (4-5 gm i.e. pinch of 3 fingers) per funnel
Neem ssed cake (4 gm/hole) during planting, Carbofuran and carbaryl are effective insecticides, Use the extract of Neuratanenia mitis, a botanical pesticide
African armyworm
((Spodoptera exempta) Cutworms (agrotis ipsilon)
Plough a month before sowing, Rapid seedling growth,
Weeding early
Use of plant treated seeds, Treat the seed bed with wood ash Scout the crop immediately the forecast warns of expected outbreak in the area, Apply recommended insecticide or botanical pesticide timely
Leaf spot No recommendation
Rust (Puccinia
penniseti)
Observe recommended time of planting
Field sanitationSmut (Moesziomyce
bullatus)
Plant resistant varieties
Downy mildew
(Sclerospora graminicola)
Early sowing
Use of disease free seed
Transplanting the crop suffers less from the disease
78

Pest Recommended management practices
Witchweed (Striga spp) Farm yard manure
Weeding
Quelea quelea spp Scaring, Bird trapping , Farmers to scout potential breeding
sites and destroy nests, Monitoring and organised aerial spraying using fenthion 60%ULV at the rate of 2.0l/ha Spot spraying, targeting roosting sites
7.2 5 Bananas
161. Bananas are growing in association with various other crops, such as coffee, beans, maize, and fruit trees. Farmers apply no chemical control measures to protect the crop. The major disease to bananas is Panama wilt (Fusarium), while Black Sigatoka or Black leaf streak disease is of lesser importance. Both diseases are caused by fungi and can destroy all susceptible varities within a large area. Panama disease are caused is soil borne and spreads through soil and infected planting materials. Black Sigatoka is soil borne and spreads by wind, water dripping or splashing, but also by infected planting materials. Farmers’ control of both diseases is limited to removal of diseased plants, application of large quantities of farmyard manure and avoidance of planting susceptible varieties. Options for their control by IPM include field sanitation (such as rotation), use of clean suckers and planting of resistant varieties. Application of farmyard manure reduces the damaging effect of the two diseases.
162. Two important pests causing great loss of harvest are banana weevils and nematodes. The latter cause toppling of the plants because the rooting system is seriously weakened. Weevils cause snapping at ground level of the bananas. Both pests may be present in planting materials and hence infect new fields. The extent of damage by weevils and nematodes is further enhanced by poor soil fertility management. Weevils can be trapped and removed by using split pseudo stems and corns, but application of botanicals, such as Tephrosia, tobacco and Mexican marigold can also be tried.
79

163. Banana major pests and recommended management practices:
Pest Recommended management practices
Banana weevil
(Cosmopolites sordidus) (Temnoschoita delumbrata)
Practice crop rotation
Intercropping with legume which reduce weevil movement Sanitation/crop hygiene, Use healthy planting material (use a
combination of corm paring and hot water (at 550C for 20
minutes or solarisation ) treatment, Sequential planting to avoid nematode infested areas
Rational use of weevil trapping with using bate (split pseudostems or discs and corns), Use of repellent botanicals, such as Tephrosia, tobacco, Mexican marigold, Neem and Iboza multiflora, Improved soil fertility management and crop husbandry, Mulching, Deep planting to discourage egg-laying Application of high quantities of manure to improve soil fertility Harvest hygiene
Ants Trapping
Panama disease or
Fusarium wilt (Fusarium oxysporum f.sp. cubense) Kiswahili name: Mnyauko panama
Grow banana cultivars with resistance to pest and disease
Fallow or rotation
Sanitation/crop hygiene, Planting of clean suckers
Establish new crop on disease free sites
Black and yellow
sigatoka (Mycosphaerella fijiensis)
Resistant cultivars
Uproot and burn the affected parts
Use of large quantities of farmyard manure
Pland and field sanitation, Use disease free seeds
Prune, remove suckers and weed frequently
Burrowing
nematodes, e.g. Pratylenchus goodeyi, Radophilus similis, Meloidogyne spp. and Helichotylenchus multicintus
Improved farm management, including sequential replanting
and soil fertility Practice crop rotation Sanitation/crop hygiene
Farmer training in disease identification and control measures
Use healthy planting material
Establish new crop on disease free sites
Mulching to enhance beneficial soil organisms to suppress nematodes
Treatment of infested suckers with hot water
Application of high quantities of manureRodents Trapping by using local methods
Cleanliness of the farm
7.2.6 Cassava
Cassava major pests and recommended management practices:
80
Pest Recommended management practices
Cassava mealybugs
(Phenococcus manihot)
Improve the soil fertility by manuring, mulching and intercropping
Practice crop rotation
Use clean planting material
Resistant varieties, Plant health stem cuttings
Cassava green mites
(Mononychellus tanajaa)
Improve the soil fertility by manuring, mulching and
intercropping, Practice crop rotation
Use clean planting material
Resistant varieties, Plant health stem cuttingsCassava root scale
(Stictococus
Plant health stem cuttings
Plant as the beginning of the wet seasonCassave white scale
(Aonidomytilus
Plant health stem cuttings
Plant as the beginning of the wet seasonVariegated
grasshopper (Zonocerus variegates)
Destructing the breeding sites
Dig egg-laying sites of variegates grasshopper in the wet season to expose and destroy egg pod of the pest
Biological control: use fungal pathogens, e.g. Metarlizium spp
Spiralling whitefly
(Aleurodicus dispersus)
Crop rotation
Plant health stem cuttings
Plant as the beginning of the wet season
White fly (Bemisia
tabaci)
Eliminate the sources of the virus
Plant health stem cuttings
Plant as the beginning of the wet season
LGB, Weevils and
Red flour beetle
Use of botanicals, e.g. Neem or pili-pili
Bio-control (use of natural enemies)
Cassava mosaic
disease
(CMD)
Improve the soil by manuring, mulching and intercrops
Plant health stem cuttings
After harvesting destroy infected cassava stems
Use resistance varieties that tolerate CMD
Manipulate sowing date and planting spacing to reduce incidence of the disease
81

Pest Recommended management practices
Cassava bacterial
blight (Xanthomorias ampestris)
Plant cuttings from health plants without leaf chlorosis
After harvesting destroy discarded infected cassava stems
Cleansing of farmers tools
Crop rotation
Avoid growing cassava consecutively on the same field
Check field regularly
Fallow practice
Use of resistant varietiesCassava Anthracnose
(Colletotrichum graminiocola)
Plant cuttings from health plants without leaf chlorosis
After harvesting destroy discarded infected cassava stems
Cleansing of farmers tools
Crop rotation
Avoid growing cassava consecutively on the same field
Check field regularly
Cassava brown streak
disease
Plant cuttings from health plants without leaf chlorosis
After harvesting destroy discarded infected cassava stems
Cleansing of farmers tools
Crop rotation
Harvest early
Cassava root rot
disease (Phytophtora, Pithium and Fusarium spp)
Harvest early
Plant cuttings from health plants without leaf chlorosis After harvesting destroy discarded infected cassava stems Cleansing of farmers tools
Acanthospermum sppCultural methods
Baboons, Monkeys
and rats (Lake Zone)
Hunting farmer groups
Use of traps
7.2.7 Common Beans (Phaseolus)
The major pest problems of beans and recommended management practices
Pest Recommended management practices
Bean stem maggot
(Ophiomyia spp)
Observe recommended time of planting, Apply mulch
Apply manure/fertilizers, Practice hilling/earthing up when weeding, Using of resistant varieties such as G11746 and G22501
82

Pest Recommended management practices
Bean aphids (Aphis
fabae)
Promote build up of indigenous natural enemies, Observe
recommended time of planting, Apply wood ash in case of a heavy attack, Carry our regular crop inspection to detect early attacks, Apply recommended insecticide when necessary
Bean leaf beetle
(Ootheca benningseni)
Practice good crop rotation, Observe recommended time of
planting
Bean bruchids
(Acanthoscelides obtectus)
Early harvesting and good drying of the beans, Ensure the beans
are dry and well cleaned before storage, Apply recommended storage insecticide/ botanical extracts, Storage in airtight containers, Vegetable oil seed coating
Angular leaf spot
(Phaeoisariopsis griseola)
Practice good crop rotation, Use of healthy and clean seeds
Use certified seeds, Post-harvest tillage, Removal of crop
Plant tolerant/resistant varietiesAnthracnose
(Colletotrichum lindemuthiamum)
Use of resistance varieties, Use of healthy seeds, Crop rotation
Seed dressing, Post-harvest tillage, Field sanitation, Plant tolerant/resistant varieties
Bean stem maggot
(Ophiomyia spp)
Seed dressing, Apply recommended insecticide or botanical
extracts within five days after emergence, Plant tolerant/resistant varieties if available, Improvement of soil fertility through application of manure and/or fertilisers
Bean aphids (Aphis
fabae)
Practice early planting, Apply recommended insecticides or
botanical extracts if necessary
Bean leaf beetle
(Ootheca benningseni)
Observe recommended time of planting, Practice good crop
rotation, Post-harvest ploughing where possible, Apply recommended insecticides
Bean pod borer
(Helicoverpa armigera)
Apply recommended insecticides or botanical extracts
Bean bruchids
(Acanthoscelides obtectus)
Ensure the beans are dry and well cleaned before storage
Apply recommended storage insecticide/ botanical extracts
Bean anthracnose Practice good crop rotation, Sanitation and crop hygiene, Use
certified seed, Observe recommended time of planting, Plant tolerant/resistant varieties
Rust (Uromyces
appendiculatus)
Avoid planting beans in high altitude areas, Practice good crop
rotation, Sanitation and crop hygiene, Plant tolerant/resistant varieties, Observe recommended time of planting, Spray with recommended fungicide when necessary
83

Pest Recommended management practices
Haloblight
(Pseudomonas sp)
Plant tolerant/resistant varieties, Spray with recommended
fungicide when necessary, Use certified seed
Ascochyta (Phoma
sp)
Avoid planting beans in high altitude areas, Spray with
recommended fungicide when necessary, Plant tolerant/resistant varieties, Sanitation and crop hygiene
Bean common
mosaic virus
Plant tolerant/resistant varieties if available
Effect good control of aphids
Bean aphids (Aphis
fabae)
Practice early planting, Apply recommended insecticides or
botanical extracts if necessary
Cutworms (Agrotis
spp)
Early ploughing, Application of wood ash around plants
Application of botanical pesticides such as Neem
Bean bruchids
(Acanthoscelides obtectus)
Early harvesting and good drying of the beans, Ensure the beans
are dry and well cleaned before storage, Apply recommended storage insecticide/ botanical extracts, Storage in airtight containers, Vegetable oil seed coating
Angular leaf spot
(Phaeisariopsis griseloa)
Use of clean seed, Burial of infected debris, Crop rotation
Use of cultivar mixtures, Intercropping with cereals
Common and
fuscous bacterial blight (Xanthomona phaseli)
Use resistance or tolerant varieties
Use pathogen free, high quality seed, Field sanitation including burning of crop residues, Rotation sequence with cereals
Star grass, Nut grass,
Couch grass, Wondering Jew, Bristly strubur
Cultural control
7.2.8 Sweet Potatoes
164. The crop suffers from two major pests, which reduce significantly its yield: mole rats and weevils that may provoke other pathogens to enter and cause rotting. Factors that contribute to the presence of these pests include mono-cropping, use of infested planting materials (weevils), drought and late harvesting.
84

165. The major pests of sweet potato and recommended management practices:
Pest Recommended management practices
Sweet potato weevil
(Cylas brnneus)
Sanitation, Use of clean materials, Crop rotation, Plant
varieties that form tubers at a greater depth, Early harvesting of tubers; as soon as weevil damage is observed on tuber tips, harvesting should begin, Keeping distance (at least 500m) between successive sweet potatoes plots, Destroy infected crop residues by burying, Planting of repellent species, such as
Tephrosia, tobacco and Mexican, Hilling up twice (at 4th and
8th week after planting) in the season to cover soil cracks and exposed to minimize eggs laying, Traps with pheromones
Rough sweet potato
weevil (Blosyrus sp)
Crop rotation, Sanitation, Planting of repellent species
Botanical pesticide
Striped sweet potato
weevil (Alcidodes dentipes)
Sanitation, Use of clean materials, Crop rotation, Plant varieties that form tubers at a greater depth, Early harvesting of tubers; as soon as weevil damage is observed on tuber tips, harvesting should begin
Sweet potato feathery
mottle virus (SPFMV)
Use of resistant varieties, Crop rotation, Sanitation
Sweet potato sunken
vein virus (SPSVV)
Avoid disease plants as a source of planting materials, Use of
resistant varieties
Sweet potato virus
Disease (SPVD)
Sanitation, Use of resistant varieties, Crop rotation
Mole rats
(Tachyoryctes splendens)
Planting of repellent species, such as Tephrosia, tobacco,
onion, garlic and Mexican marigold in the field and its boundaries, Insert pars of repellent plant species into tunnels
Monkeys, wild pigs Local scaring
7.2.9 Coffee
166. Coffee insects and other coffee pests are some of the major factors that undermine coffee productivity by direct reduction of crop yield and quality to coffee growers. There are about 850 species of insect pest known. Coffee is much affected by pests, of which the most important species Antesia bug and white stem borer. Of less importance are leaf miner, coffee berry moth, scale insects, mealy bugs, coffee berry borer and rood-knot nematodes.
85

167. Coffee pest problems and recommended management practices:
Pest Recommended management practices
Stem borers (Anthores
spp)
Sanitation and crop hygiene, Stem cleaning, Uproot and bury
badly damaged trees, Scouting for attacked trees, Pick and destroy the adults (from October/November especially December, Mechanical removal of larva by using hooks, Apply cooking oil or fat around boreholes to attract predatory ants, Insert cotton wool soaked with kerosene, Paint the stem and branches with a paste out substance like lime, Spray botanicals like Neem, Tephrosia, Euphorbia, Apply recommended insecticides if necessary
Antestia bugs
(Antestiopsis spp)
Use of botanicals, Conservation of indigenous natural
enemies, Shade management by reducing size, Pruning and de-suckering, Scouting, Use of botanical pesticides, e.g. Tephrosia and Neem, Preserve natural enemies (parasitic wasps, Tachind flies)
Leaf miners (Leucoptera
spp)
Conservation of indigenous natural enemies, Sanitation and
crop hygiene, Use of botanicals, Shade management Mulching, Pruning, Crop scouting, Spray with recommended insecticides if necessary
Coffee berry borer (CBB)
(Hypothenemus hampei)
Scouting, Conservation of indigenous natural enemies,
Sanitation and crop hygiene, Shade management, Mulching Pruning, Use of botanicals, Burry infected berries as larvae can develop in fallen fruits, Regular harvesting, Mbuni stripping
Mealy bugs (Planococcus
kenyae)
Use of tolerant or resistant varieties, Proper pruning of
coffee trees, Use of botanicals and other alternative agents
Green scale insects
(Coccus viridis)
Application of botanicals, such as pili-pili, Neem and
Tephrosia, Curative spraying of solutions of ash, oil, soap, kerosene or clay
Coffee berry disease
(Colletotrichum coffeanum)
Sanitation and crop hygiene, Shade management, Mulching
Pruning, Proper plant nutrition, Stem cleaning, Spray with recommended fungicide
Coffee leaf rust (Hemileia
vastatrix)
Use of botanicals, Resistant varieties, Removal of old
unproductive trees, After harvest stripping berries, Simulate uniform flowering, Sanitation and crop hygiene, Shade management, Mulching,
Coffee wilt caused by
Fusarium spp
Uprooting and burning of affected trees, Planting of coffee in
pathogens free fields, Selection of clean seedlings, Avoid transmission of the disease by soil, Improvement of crop tolerance by soil fertility
All types of weeds Clean weeding, Mulching, Use recommended herbicides
Root-knot nematodes
(Meliodogyne spp.)
Grafting on resistant coffee varieties, Soil sterilization (by
sun) in the nursery, Use of non-infested seedlings, Mulching
(to preserve moisture), Fertilization
86

Pest Recommended management practices
Antestia bugs
(Antestiopsis spp.)
Pruning, Mbuni stripping, Apply recommended insecticides
at recommended dosage if necessary
White stem borer and
yellow headed stem borer
Sanitation and crop hygiene, Stem cleaning, Mechanical
(hook the larvae out if possible)
7.2.10 Cotton
168. Similar to coffee, the cotton pest problems and the recommended management options vary depending on location. The recommended current cotton pest management strategies emphasises integration of several aspects of IPM. However not all farmers in all the cotton growing areas are aware and informed about the approaches.
169. Cotton pest problems and recommended management practices:
Pest Recommended management practices
Jassids (Empoasca sp) Plant recommended UK varieties (resistant plant varieties),
Spray in case of a severe attack at seedling stage
African bollworm
(Helicoverpa armigera)
The host plants should be inspected regularly, Scouting,
Encourage natural enemies, Use botanical pesticides like neem, Plant recommended varieties, Early planting
Spray with recommended insecticides after scouting
Aphids (Aphis gossypii) No spraying, Encourage build up of natural enemies like
birds, Populations often washed off by rain
Spiny bollworm (Earias
insulana and E.biplaga)
The host plants should be inspected regularly, Scouting,
Encourage natural enemies like birds, Use botanical pesticides like neem, Early planting
Lygus (Lygus vosseleri) Spray with insecticides in case of an early season attack
Holopetlis bugs
(Helopeltis
anacardi)
Biological control using the African weaver ant (Oecophilla
longinoda). (Maji Moto), Not intercropping pigeon pea with cashew, Apply recommended insecticide at recommended dosage in case of severe outbreaks
Cashew mealybugs
(Pseudococcus longispinus)
Crop sanitation (removal & proper disposal of affected plant parts)
Biological control
Thrips
(Selenothrips rubrocinctus)
Control should mainly target larvae stage during early stages of
flowering
Stem borers, Adults should be collected and destroyed by hand, Mechanical,
87

Pest Recommended management practices
Weevils, (Mecocorynus loripes)
using a recommended hooks, If the tree is severely attacked, cut and dispose properly
Powdery mildew
(Oidium anacardii)
Prune to provide good ventilation and aeration within trees making
microclimate not conducive to the pathogen multiplication, Scouting, For established plantations, practice selective thinning, Remove off-season young shoots which can be sources of fresh inoculum during the season, Sanitation, Thin densely populated trees and leave them well spaced, to reduce or delay mildew epidemic due to changes in microclimate in the field, Plant recommended tolerant clones and at recommended spacing, Apply recommended fungicides as appropriate
Anthracnose
(Colletotrichum gloeosporioides)
Remove and burning of all infected organs before the start of the
cashew season, Plant recommended tolerant clones and at recommended spacing, Apply at recommended pesticide at correct rate and time
Dieback (Phonopsis
anacardii)
Remove and burning of all infected organs before the start of the
cashew season, Apply at recommended pesticide at correct rate and time
Wilt syndrome
Coreid bugs
(Pseudotheraptus wayi)
Biological control using the African weaver ant (Oecophilla
longinoda). T o enhance effectiveness of the bio-control agents, farmers are advised to do the following, Apply Hydramethyl to control Brown house ants (Pheidole megasephala) when necessary, Interplant coconut with recommended suitable host trees of weaver ants, Construct artificial aerial bridges to facilitate mobility of weaver ants between trees, Plant weaver ant nests in areas where they do not occur naturally, Apply recommended insecticide at recommended dosage in case of severe outbreaks
Cotton stainers
(Dysdercus spp)
Observe the close season, Early and frequent picking avoid
build-up of stainers, Sanitation in and around cotton ginneries and buying posts, Apply 1 to 2 sprays of recommended insecticides if necessary (inspect the crop before spraying)
Blue bugs (Calidea
dregii)
Observe close season, Early and frequent picking avoid
build-up of stainers, Sanitation in and around cotton ginneries and buying posts, Apply 1 to 2 sprays of recommended insecticides if necessary (inspect the crop before spraying)
Bacterial blight
(Xanthomonas malvacearum)
Rotation , Plant recommended UK 82 varieties (resistant
plant varieties), Observe the close season, Crop sanitation
88

Pest Recommended management practices
Fusarium wilt
(Fusarium oxysporum
f.sp. vasinfectum)
Rotation, Crop sanitation, Plant recommended UK 77 or 91
varieties (resistant plant varieties)
Alternaria leafspot
(Alternaria macrospora)
Rotation, Field sanitation
All types of weeds Proper land preparation, Early clean weeding, Use
recommended herbicides
Field rats, monkeys and
baboons
Scaring, Trapping
7.2.11 Coconuts
170. Coconut pest problems and recommended management practices:
Pest Recommended management practices
Coreid bugs
(Pseudotheraptus wayi)
Biological control using the African weaver ant (Oecophilla
longinoda). To enhance the effectiveness of the weaver ants, farmers are advised to do the following, Apply Hydramethyl to control brown house ants (Pheidole megasephala) when necessary, Interplant coconut with recommended suitable host trees of weaver ants, Construct artificial aerial bridges to facilitate mobility of weaver ants between trees, Plant weaver ant nests in areas where they do not occur naturally
African rhinoceros
beetle (Orytes monoceros)
Cultural removal of breeding sites of the pest, Mechanical, using recommended hooks
Coconut mites
(Aceria guerreronis)
This is a new pest and therefore no control measures available
Coconut termites
(Macrotermes spp.)
For species living above ground, the termitarium can be destroyed physically
89

7.2.12 Cashew-nuts
171. Major pests and recommended control practices for cashew nut:
Pest Recommended management practices
Phytoplasma Plant recommended tolerant/resistant varieties. E.g. East African Tall sub populations, Proper destruction of diseased plants, Avoid movement of seedlings from infested to non-infested areas, Location specific replanting
7.2.13 Mangoes
172. Key pests of mangoes and current farmer practices to reduce losses:
Pest Farmer practices
Fruit flies (Ceratitis
spp)
Harvest as much fruit as possible; sort out the edible fruit and
bury all those that are infested, Apply chlorpyrifos when necessary, Use toxic bait sprays e.g. yeast products mixed with malathion or fenthion around the tree base, Removal of infested fruits and proper disposal (collect and bury at least 10 feet deep)
Mango weevils
(Sternochetus mangifera)
Removal of infested fruits at least twice a week and proper
disposal (collect and bury at least 10 feet deep), Selected less susceptible varieties , such as Ngowe, Boribo, Maintain field sanitation at the end of the season by clearing all seeds under the tree canopy
Mango mealybug Spray contact/systemic insecticides, Control of attendant ants to reduce spread of the pest
Mango anthracnose
(Colletratrichum gloesporiodes)
Apply available registered fungicides, Proper pruning to reduce excessive and minimise disease build-up, Use the recommended post-harvesting treatment
Powdery mildew
(Oidium spp)
Apply recommended fungicides
7.2.14 Citrus
173. Major pest problems of citrus and recommended management practices:
Pest Recommended management practices
Scale insects Normally ants protect aphids against natural enemies
Mealybugs
(Planococus citri- Risso)
Trees with dead brown leaves should be uprooted and replaced
Aphids (Toxptera
citricidus)
Normally ants protect aphids against natural enemies
90
Pest Recommended management practices
False codling moth
(Cryptophlebia leucotrata)
Field sanitation (collect all fallen fruits and bury them at least 50 cm deep), Remove wild castor (“Mbarika”) around the orchard
Orange dog
(Pappilio demodercus)
Regular scouting and hand picking of caterpillars, Apply contact insecticides in case of a severe attack
The wooly white
fly (Aleurothrixus flocossus)
Biological control using imported parasitic wasps, Management of attendant ants to reduce spread and facilitate the efficacy of natural bio-control agents
Black flies
(Aleurocanthus sp)
Management of attendant ants to reduce spread and facilitate the
efficacy of natural bio-control agents
Giant coreid bug
(Anoplenemis curvipes)
New pest but farmers are encouraged to introduce and enhance the
activity of weaver ants (refer to cashew & coconut approach)
Citrus leafminer Crop sanitation and mulching, Apply recommended systemic
insecticides when necessaryGreening disease
(Liberobacter africana)
Propagation of disease free planting materials, Eliminate all
infested trees, Strict quarantine measures, Natural enemies Hymenopterous chalcids such as Tetrastichus spp and Diaphorencytrus aligarhenses , Use clean planting material, Good plant nutrition
Gummosis
(Phytophthora spp)
Budded at least 20cm from ground should be chosen, Cut infected
trees, Affected orchards should not be excessively irrigated
Tristeza (Virus
localized in phlorm tissue)
Use disease free budwood
Green moulds
(Pencillium italicum)
Handle fruit carefully to reduce skin injury, Treat bruches, graders,
Use the recommended post harvesting treatment
7.2.15 Pineapples
174. Major pest problems of pineapples and recommended management practices:
Pest Recommended management practices
Mealybugs
(Pseodococcus brevipes)
Use clean planting materials, Trees with dead brown leaves should
be uprooted and replaced
91

Pest Recommended management practices
Top and root rot
(Phytophthora spp)
Use well-drained soils from pineapple growing, Plant on raised beds
at least 23 cm high after settling, Provide drainage system to get rid of excess water without causing soil erosion, Deep-trip down the slope before hilling if subsurface soil compaction is evident
7.2.16 Tomatoes
175. Major pests of tomatoes and recommended management practices for northern zone:
Pest Recommended management practices
American bollworm
(Helicoverpa armigera)
Destroy infected crop residues and fruit after harvesting,
Encourage natural enemies (parasites, ants, Anghocorid-bugs and egg predators), Use maize ads a trap crop (timing of crop stage; tasseling stage coincides with attack), Inspect the crop regularly for new infestations, Use botanicals like Neem extract, Apply recommended insecticides at recommended dosage rate
Cutworms (Agrotis
spp)
Early ploughing to expose cutworms to predators, Apply wood ash around plants, Inspect the crop regularly soon after transplanting because this is the most susceptible stage of the crop, Mechanical (hand collect and crush them), Use appropriate trapping methods. Crush the caterpillars or feed them to chicken, Use repellent botanicals, Spray with recommended insecticide if necessary
Root knot nematodes
(Meloidogyne)
Optima rotation and fallow, Deep ploughing, Avoid
contaminated water, Plant tolerant/resistant varieties, Sterilise the seedbed before sowing, Avoid planting a new crop on infested areas
Red spider mites
(Tetranychus spp)
Rogue infected plants, Avoid dusty conditions during extreme dry season, Encourage moist microclimate by frequent irrigation, Hedge planting to reduce dust, invasion by mites blown by wind, Encourage natural enemies by mulching and hedging, Use neem as alternative sprays, Observe recommended time of planting, Application of irrigation, Plant tolerant/ resistant varieties, Sanitation and crop hygiene, Use healthy planting material, Frequent weeding, Inspect the crop regularly for new infestations, Use neem oil with cow urine, Apply a recommended miticide if necessary
Late blight
(Phytophthora infestants)
Regular crop scouting to detect early attack, Field sanitation
after harvest by removal of infected plant parts, Crop rotation Avoid moist microclimate at shady places, Use wide spacing (wet season), Observe recommended time of planting, Plant at correct spacing, Shade management, Decrease humidity through pruning, de-suckering, staking and weeding, Avoiding the humid season and mulch to avoid rain splash causing infections
Early blight
(Alternaria solani)
Remove infected plants staring from nursery, Weed out
Solanacea plants, Try botanicals and other natural pesticides Observe recommended time of planting, Regular crop scouting to detect early attack, Apply recommended fungicide if necessary
92

Pest Recommended management practices
Powdery mildew
(Oidium lycopersicum)
Sanitation , remove infested leaves and plants, Practice crop
rotation, Use botanical and other natural pesticides, Regular crop scouting to detect early attack, Apply recommended fungicide if necessary
Bacterial wilt
(Pseudomonas solanacearum)
Practice good crop rotation, Practice deep ploughing/post
harvesting cultivation to expose soil to sun, Add organic matter to the soil (cow dung, mulch, green manure), Rogue affected crops and weed-hosts, destroy or bury outside the field, Avoid transferring infested soil including soil on roots of plants, Do not irrigate with contaminated water from infested areas, Choose seedbed in clean uninfected area
Fusarium wilt
(Fusarium oxysporum)
Use resistant varieties are the best practical measure to manage the disease in the field, Practice good crop rotation, Sanitation and crop hygiene, Deep ploughing, Avoid transferring infested soil including soil on roots of plants, Do not irrigate with contaminated water from infested areas, Add organic matter to the soil (cow dung, mulch, green manure)
Bactoria spot
(Xanthomonas compestris pv. Vesicatoria)
Use clean seed, Three year crop rotation, Avoid working in
fields under wet conditions, Avoiding of injuries to fruits
Tomato yellow leaf
curl (TYLC)-virus transmitted by whitefly (Bemisia tabaci)
Use disease free planting materials, Time of planting, Scouting of the disease and removal of affected plants, Intercrop with onion. This also reduces aphids in tomatoes, Intercrop with eggplants as traps to draw whiteflies away from less tolerant and virus prone crops like tomatoes, Use repellent botanicals, such as Tephrosia and Mexican marigold, Regular crop scouting to detect early attack, Good management of irrigation water, Remove and destroy crop residues immediately after the final harvest, Avoid planting Lantana camara near tomatoes, Encourage beneficial insects, such as Encasis, Spray if necessary but use recommended insecticides
Fusarium wilt
(Fusarium oxysporum)
Use resistant varieties are the best practical measure to manage
the disease in the field, Practice good crop rotation, Sanitation and crop hygiene, Deep ploughing, Avoid transferring infested soil including soil on roots of plants, Do not irrigate with contaminated water from infested areas, Add organic matter to the soil (cow dung, mulch, green manure)
Bactoria spot
(Xanthomonas compestris pv. Vesicatoria)
Use clean seed, Three year crop rotation, Avoid working in
fields under wet conditions, Avoiding of injuries to fruits
93

Pest Recommended management practices
Tomato yellow leaf
curl (TYLC)-virus transmitted by whitefly (Bemisia tabaci)
Use disease free planting materials, Time of planting, Scouting
of the disease and removal of affected plants, Intercrop with onion. This also reduces aphids in tomatoes, Intercrop with eggplants as traps to draw whiteflies away from less tolant and virus prone crops like tomatoes, Use repellent botanicals, such as Tephrosia and Mexican marigold, Regular crop scouting to detect early attack, Good management of irrigation water, Remove and destroy crop residues immediately after the final harvest, Avoid planting Lantana camara near tomatoes, Encourage beneficial insects, such as Encasis, Spray if necessary but use recommended insecticides
94

7.2.17 Onions
176. Major pest problems and recommended management practices:
Pest Recommended management practices
Onion thrips (Thrips
tabaci)
Sanitation, Scouting, Separate seed bed and field to reduce
danger of carrying over thrips from one site to the other, Crop rotation, Mixed cropping of carrots and onions, Observe recommended time of planting, Field sanitation and crop hygiene Transplant clean seedlings, Mulching reduces thrips infestation considerably, Plough deep after the harvest to bury the pupae Irrigation/adequate watering, Enhance beneficials (predatory mits, bugs, fungal pathogens like Metarhizium), Inspect the crop regularly, Use botanical extract like Neem oil, Tephrosia, tobacco, etc.
Downy mildew
(Peronospora destructor)
Use resistant varieties (red creole) and crop rotation for at least five years, Sanitation: remove crop remains after harvest, do no leave volunteer plants in the field and avoid over fertilization, Wide spacing and good drainage to decrease humidity in the plant stand, Apply mulch to avoid rain splash, Inspect the crop regularly
Purple blotch
(Alternaria porri)
Sanitation: remove crop remains after harvest, do not leave
volunteer plants in the field, Crop rotation, Mulching to avoid rain splash, Plant at recommended spacing, Inspect the crop regularly, Apply recommended fungicide at correct dosage
Storage rots (Bortytis, Erwinia, Mucor, Fusarium)
Use of netted bamboo baskets, Avoid heaps exceeding 30 cm depth and use racks of 1m high, Ventilated stores, Minimize damage during handling, Drying of onions before storage, Remove tops, Avoid thick neck/split
95

7.2.18 Brassicas (cabbages and kale)
177. Major pests of brassicas and recommended practices:
Pest Recommended management practices
Diamondback moth
(Plutella xylostella)
Scouting, Use botanical and other control agents, Observe
recommended time of planting, Transplant healthy seedlings, Inspect the crop regularly to detect early attacks, Encourage natural enemies (predatory hoverfly larvae, coccinellids, parasitic wasps) by enhancing diversity, Application of fermented cow urine (10-14 days fermentation) , Use botanicals (Neem oil, chillies, etc.)
Aphids (Brevicoryne
brassicae)
Sawflies
Cabbage webworms
Blackrot (Xanthomonas
compestris)
Kiswahili name: Uozo mweusi
Seed dressing with Bacillus bacteria, Seed treatment with hot water, Mulching, Deep ploughing, 3-year crop rotation, Field and crop hygiene, Transplant only healthy seedlings, Plant certified seeds, Plant tolerant/resistant varieties like Glory, Amigo FI, Sterilise the seed bed before sowing, Good drainage, and mulch to avoid infections from rain splash
Downy mildew
(Peronospora destructor)
Practice good crop rotation, Observe recommended time of planting, Transplant only healthy seedlings, Plant at recommended spacing
Alternaria leaf spot
(Alternatira spp)
Avoid overhead irrigation, Practice good crop rotation
Observe recommended time of planting, Transplant only healthy seedlings, Plant at recommended spacing
Cabbage club rot
(Plasmodiaphora brassicae)
Crop rotation, Plant in well drained soils, Adjust soil pH to alkaline by adding hydrated lime
Black rot (Xanthomonos
compestris pv. Compestris)
Crop rotation, Use of pathogen free seeds, Avoid overhead irrigation, Use of resistance cultivars (Glory FA, Amigo F1) Sanitation: remove crop residues, plough under, compost or feed to animals, Good drainage, and mulch to avoid infections from rain splash
Cauliflower mosaic
virus (CaMV)
Remove brassica weeds, Rogue young plants showing disease symptoms and immediately burns them
Dumpting off (Fusarium
Spp, Rhizoctonia spp. Pytium spp and Phytophotra
Provide good soil structure and drainage, Avoid overwatering
Apply wood ash in seedbed, Sterilise seedbed, Use treated beds, Pricking excessive seedlings (thinning)
Bacterial soft rot (Erwinia carotovora var. carotovora, Pseudomonas spp)
Avoid harvesting when the weather is wet, Handle produce carefully and store in cool, well-ventilated areas, Plough in crops immediately after harvesting, Practice crop rotation and provide good drainage, Timely planting to coincide with dry season
80

7.3 Management of Pests
7.3.1 Rodents
178. Rodents, particularly the multi-mammate shamba rat, (Mastomys natalensis), are major pests of food crops. The most affected crops are maize, millets, paddy and cassava. Maize is the most susceptible of all the crops. At the pre-harvest -stage, maize is attacked at planting (the rodents retrieve sown seeds from the soil causing spatial germination). In some cases, as much as 100% of the seeds are destroyed, this forcing farmers to replant.
179. Farmers in outbreak areas are strongly advised to do the following to reduce potential damage to crops and the environment:
(i) Regular surveillance. The earlier the presence of rodents is observed, the cheaper and simpler any subsequent action will be and losses will remain negligible
(ii) Sanitation. It is much easier to notice the presence of rodents if the store is clean and tidy
(iii) Proofing i.e. making the store rat-proof in order to discourage rodents from entering(iv) Trapping. Place the traps in strategic positions(v) Use recommended rodenticide. However, bait poisons should be used only if rats
are present. In stores or buildings, use single-dose anticoagulant poisons, preferably as ready-made baits.
(vi) Encourage team approach for effectiveness. The larger the area managed or controlled with poison, the more effective the impact
7.3.2 Birds (Quelea quelea spp)
180. Birds are serious migratory pests of cereal crops, namely wheat, rice, sorghum and millet across the country. The quelea birds, which in Kenya occur are swarms ranging from thousands to a few millions, have been responsible for famines of varying proportions in some areas.
181. Bird pest problems in agriculture have proved difficult to resolve due in large part to the behavioural versatility associated with flocking. The array of food choices available to birds is also complex, hence forth; necessary information is needed for successful control strategies. The total damaged per bird per day, if the bird is exclusively feeding on cereal crops, has been estimated at 8 g (Winkfield, 1989) and 10 g (Elloitt, 1989).
182. Several techniques have been tried to reduce bird populations to levels where crop damage is minimal. Traditional methods, slings, bird scares, and scarecrows, are still being used in many parts. Modern techniques of frightening devices, chemical repellents, less preferred crop varities and alternative cultural practices have been evaluated.
183. All the methods have minimal value in situations where bird pressure is high and where habitation is likely to develop through repetitive repellent use and other methods, which may alleviate damage in small plots or in large fields for a short time.
184. The aerial spraying of chemical (parathion and later fenthion) on nesting and roosting sites, the most widely used technique to date. Currently, only fenthion 60%ULV aerial formulation is being used. The pesticide is recommended to be used at the rate of 2.0l/ha.
185. The concerns over possible human health problems and environmental damage resulting from the large-scale application of chemical pesticide for quelea control have led to a proposal for alternative non-lethal control strategy. Chemical pesticide applied for quelea control represent a risk for human, terrestrial, non-target fauna and aquatic ecosystems. The chemical pose risk by directly poisoning or by food contamination/depletion. Among the terrestrial non-target invertebrates, there are beneficial species. Some are responsible for organic matter cycling; others are predators, and parasitoids of crop pests. Some assure pollination of crops and wild plants, while others
81

again produce honey and silk. The fact that non-target birds and, occasionally, other vertebrates may be killed by quelea control operations is well-established.
186. The risk of human health problems and environmental damage can be mitigated considerably by development of integrated environmentally sound control strategies including Net-Catching. These methods will educate farmers become custodians of the environment. A new emphasis is the possibility of harvesting quelea for food. Since quelea is a good source of protein and preferred by many people. This method offers more rapid prospects for implementation which enable farmers to continue making their own decisions important for the control of quelea in their area. While present indications are that harvesting is probably not an option as a crop protection technique, it offers the possibility of providing income to rural populations in compensation for crop losses.
187. In respect of quelea birds, FAO is currently encouraging the use of IPM approaches to the problem of bird attacks on cereal crops. This means working with farmers in examining all aspects of farming practice in relation to quelea damage, and seeking to minimise external inputs, especially pesticides. In includes modifying crop husbandry, planting time, week reduction, crop substitution, bird scaring, exclusion neeting, etc. and only using lethal control for birds directly threatening crops when the other methods have failed. It is also important for farmers to be aware of the costs of control using pesticides, and in the case of commercial farmers, for them to bear some or all of the costs. A major likely benefit of IPM is reduced environmental side-effects resulting from decreased pesticide use. Although some elements of IPM have been tried in bird pest management, a major effort has yet to be made, for quelea, to focus on farmers in all aspects of the problem.
7.3.3 Locust
188. Locusts live and breed in numerous grassland plains, the best ecologically favourable ones are known as outbreak areas. During periods with favourable weather, locusts multiply rapidly and form large swarms which escape and may result into a plague. There are eight known locusts outbreak in East and Central Africa. The strategy for red locust control combines regular monitoring of breeding sites followed by aerial application of fenitrothion 96.8% ULV to eliminate potential threatening hopper populations.
7.3.4 Armyworm
189. The African armyworm (Spodoptera exempta) is a major threat to basic food production in a number of east and southern African countries Armyworm is a major pest of cereal crops (maize, rice, sorghum and millets) as well as pasture (grass family) and therefore a threat to food security and livestock. Overall losses of 30% for crops have been estimated though in major outbreak years losses in maize of up to 92% are recorded. Armyworm outbreaks vary from year to year but serious outbreaks occurs frequently.
190. Due to its economic significance, management and control is centrally co-ordinated by Crop Protection Department of the Ministry of Agriculture. Its control combines monitoring in identified breeding areas, forecasting and early warning of potential outbreaks. The national armyworm control programme runs a network of several traps distributed throughout the country. The traps are placed at district offices, research stations and in large-scale farms. Weekly returns from these traps are used in forecasting potential outbreaks for the following week. The information about potential outbreaks is passed to the regions and districts from where it is further passed to farming communities through the extension system. Farmers are advised to inspect their fields for signs of infestation. If the crop is attacked, farmers should spray with diazinon, fenitrothion or chlorpyrifos, whichever is available at the nearest pesticide store. Both ULV and knapsack sprayers can be used depending on available formulation in the outbreak areas. This service could be improved through a better monitoring and reporting system that empowers farmers to be partners in a co-ordinated network. This will require the following activities:
(i) Development of community based monitoring and early warning approaches
82

(ii) Formulating and implementing appropriate training for district plant protection officers (DPPOs), village extension officers (VEOs) and farmers to impart simple reliable monitoring skills
(iii) Formulating and implementing a reliable community based early warning network
191. This approach is likely to have a number of benefits. One, less pesticides will be used because farmers will be able to identify and apply control measures on the most vulnerable stage of the pest, which is not possible in the current set-up. Secondly, farmers can use less toxic and environmentally friendly proven alternatives to pesticides e.g. botanical extracts and/or biopesticides at relatively low cost with minimum environmental hazards. Thirdly, if well-co-ordinated, the information generated by farming communities can be integrated in the nation monitoring and early warning system to improve the quality of the information at national and international level.
192. A new natural control for armyworm is being developed by using a natural disease of the armyworm as biological control in place of toxic chemeak insecticides. This disease of armyworm is caused by specific agent, the Spodoptera exempta nucleopolyhedrovirus (or NPV). It has been observed since the early 1960s the late in the season many armyworm outbreaks collapse due to the occurrence of a disease that killed up to 98% of caterpillars. NPV can be sprayed like chemicals onto pest outbreaks causing epidemics of NPV desease that kill off the pests, effectively acting as a natural insecticide. What is more, the killed insects produce more NPV spreading the disease further. The NPV produced by dying insects can infect later generations of armyworms so that the effect is longer lasting than chemical insecticdes (Mushobozi, et.al. undated)
7.3.5 Water hyacinth
193. There are three types of control measures adopted including, manual, mechanical and biological. The local communities around the lake identified key areas that require manual removal. These included the landing sites, ports and piers, water supply points and sources, amongst others. Manual removal entails the use of simple tools such as pangas, rakes and wheel barrows as well as protection gears. Mechanical control was undertaken in Kenya during the year 1999. This involved chopping and dumping of the water hyacinth in the lake. This method is generally most expensive and mobility around the lake becomes a problem. The disposal of the harvested water hyacinth has negative effect on the environment. Lastly, biological control involved the rearing and release of two types of weevils (Neochetina eichorniae and Neochetina bruchi) into the lake. Local communities also assisted in the rearing of the weevils. Although this control method is slow it is environmentally friendly as no chemicals are used.
194. Continued monitoring and surveillance of water hyacinth is recommended. Rearing and release of weevils should be a continuous process to keep the water hyacinth in abeyance.
7.3.6 Striga
195. The popular control methods of Striga in Kenya are manual and use of fertilizers. The most popular control method is manual which involves hand weeding and pulling of the Striga. Organic and inorganic fertilizers are also used although their use is dictated by availability and the purchasing power. Although immense research has been undertaken by various scientists on the use of pesticides and resistant varieties in Kenya the adoption seems to be low as seen from the popular control methods currently used.
196. KARI in collaboration with CIMMYT have evaluated resistant varieties and chemicals which needs to be popularized and evaluated for their effectiveness and compatibility with the farmers circumstances in order to enhance their adoption. A case in point is the recent introduction of commercial release of Striga -resistant maize, locally known as Ua Kayongo, led by Western Seed Company following extensive tests
83

and farm trials and awareness creation. The new herbicide-resistant maize hybrid and seed coated herbicide technology is based upon inherited resistance of maize to a systemic herbicide (imazapyr), a mechanism widely recognized as imazapyr-resistance (I-R). When I-R maize seed is coated with the herbicide, Striga attempting to parasitize the resulting plant are destroyed.
7.4 Key livestock pests and diseases197. Livestock disease is one of the major constraints to animal production in Africa
(Table below). This is in addition to inadequate nutrition, poor management practices and socio- economic constraints. Vector-borne diseases, particularly trypanosomiasis transmitted by the tsetse flies and tick-borne diseases (TBDs) seriously limit livestock production and improvement in much of African countries south of the Sahara. In addition the tsetse flies also transmit the fatal human sleeping sickness.
84

Table 5. Major livestock pests and diseases in KenyaD
isea
se Aetiology Epidemiology Hosts Transmission Sources of Vulnerability
Foot
and
Mou
th
Dis
ease
Caused by a virus of the family Picornaviridae, genus Aphthovirus with seven immunologically distinct serotypes: A,
O, C, SAT1, SAT2, SAT3, Asia1. The virus is resistance to physical and chemical action. It survives in lymph nodes and bone marrow at neutral pH.
Epidemiologically, foot and mouth disease is one of the most
contagious animal diseases, with important economic losses.
Though it exhibits low mortality rate in adult animals, but often high mortality in young due to myocarditis
Cattle Zebus
Sheep Goats
Swine All wild
ruminants
Direct or indirect contact (droplets), animate vectors (humans, etc.), inanimate vectors (vehicles, implements), airborne, especially temperate zones (up to 60 km overland and 300 km by sea).
Resistance to physical and chemical action.
(virus persists in the oropharynx for up to 30 months in cattle or and 9 months in sheep
FMD is endemic in parts of Asia, Africa, the Middle East and South America
Sporadic outbreaks in free areas Survives in lymph nodes and bone marrow at neutral pH.
Rin
derp
est
Caused by virus family
Paramyxoviridae, genus Morbillivirus
High morbidity rate, mortality rate is high with virulent strains but variable with mild strains
Cattle, zebus. Sheep
Goats
By direct or close indirect contacts
Resistance to physical and chemical action
Remains viable for long periods in chilled or frozen tissues
In Africa it has been eradicated from several countries and sub-regions, and is normally absent from the northern and southern parts of the continent
80

Dis
ease Aetiology Epidemiology Hosts Transmission Sources of Vulnerability
Lum
py S
kin
Dis
ease
Virus family Poxviridae, genus Capripoxvirus
Morbidity rate 5-
85%
Mortality rate very variable
Cattle
Bos taurus Zebus, domestic buffaloes)
Transmission may occur via infected saliva in the absence of an insect vector.
Though no specific vector has been identified to date, mosquitoes (e.g. Culex mirificens and Aedes natrionus) and flies (e.g. Stomoxys calcitrans and Biomyia fasciata) could play a major role
Endemism: LSD was confined to sub- Saharan Africa strict quarantine to avoid introduction of infected animals in to safe herds in cases of outbreaks, isolation and prohibition of animal movements slaughtering of all sick and infected animals (as far as possible) correct disposal of dead animals (e.g. incineration) disinfection of premises and implements vector control in premises and on animals
81
Dis
ease Aetiology Epidemiology Hosts Transmission Sources of Vulnerability
Rift
Val
ley
Feve
r
Virus family Bunyaviridae, genus Phlebovirus
High mortality rate in young animals High abortion rate in ruminants
Cattle Sheep Goats
Dromedaries
Several rodents
Haematophagous mosquitoes of many genera (Aedes, Anopheles, Culex, Eretmapodites, Mansonia, etc.) can transmit fever as
biological, competent vectors. Mosquitoes (Aedes) are the reservoir host
Direct contamination: occurs in humans when handling infected animals and meat
Resistance to physical and chemical action
Survives in dried discharges and multiplies in some arthropod vectors.
Can survive contact with 0.5% phenol at 4°C for 6 months
For animals: wild fauna and vectors For humans: nasal discharge, blood, vaginal secretions after abortion in animals, mosquitoes, and infected meat. Possibly also by aerosols and consumption of raw milk
RVF has been recognised exclusively in African countries, with an underlying association with high rainfall and dense populations of vector mosquitoes
82

Dis
ease Aetiology Epidemiology Hosts Transmission Sources of Vulnerability
Shee
p Po
x an
d
Goa
t Pox
Virus family Poxviridae, genus Capripoxvirus
Morbidity rate: Endemic areas 70-
90%
Mortality rate: Endemic areas 5-
10%, although can approach 100% in imported animals
Sheep and goats (breed-linked predisposition and dependent on strain of capripoxvirus)
Direct contact and Indirect transmission by contaminated implements vehicles or products (litter, fodder)
Indirect transmission by insects (mechanical vectors) has been established (minor role) Contamination by inhalation, intradermal or subcutaneous inoculation, or by respiratory, transcutaneous and transmucosal routes
Resistance to physical and chemical action
Survive for many years in dried scabs at ambient temperatures.
Virus remains viable in wool for 2 months and in premises for as long as 6 months
Hig
hly
Path
ogen
ic A
vian
Virus family Orthomyxoviridae, genus Influenzavirus A, B. To date, all highly pathogenic isolates
have been influenza A viruses of subtypes H5 and H7
Highly contagious to assume all avian species are susceptible to infection
Direct contact with secretions from infected birds, especially faeces
Contaminated feed, water, equipment and clothing Clinically normal waterfowl and sea birds may introduce the virus into flocks Broken Contaminated eggs may infect chicks in the incubator
Resistance to physical and chemical action
Remains viable for long periods in tissues, faeces and also in water Highly pathogenic viruses may remain viable for long periods of time in infected faeces, but also in tissues and water
83

Dis
ease Aetiology Epidemiology Hosts Transmission Sources of Vulnerability
New
cast
le
Dis
ease
Virus family Paramyxoviridae, genus Rubulavirus
Many species of birds, both domestic and wild
The mortality and morbidity rates vary among species, and with the strain of virus
Chickens are the most susceptible poultry, ducks and geese are the least susceptible poultry
A carrier state may exist in psittacine and some other wild birds
Direct contact with secretions, especially faeces, from infected birds
Contaminated feed, water, implements, premises, human clothing, etc.
Sources of virus
Respiratory discharges, faeces
All parts of the carcass Virus is shed during the incubation period and for a
limited period during
convalescence
Some psittacine birds have been demonstrated to shed ND virus intermittently for over 1 year
Survives for long periods at ambient temperature, especially in faeces Strict isolation of outbreaks
Destruction of all infected and exposed birds
Thorough cleaning and disinfection of premises
Proper carcass disposal
Pest control in flocks
Depopulation followed by 21 days before restocking
Avoidance of contact with birds of unknown health status
Control of human traffic.
One age group per farm ('all in-all out') breeding is recommended Medical prophylaxis
Vaccination with live and/or oil emulsion vaccines can markedly reduce the losses in poultry flocks
Live B1 and La Sota strains are administrated in drinking
84

198. For l i v e s t o c k animals, the most common disease is the East Coast Fever which is a tick-borne disease. The problem as worsened in the last 10 years as most of the communal dips have collapsed and the private dips are not accessible to most of the farmers. Another reason is that the ticks have now gained resistance to the organophosphates originally used for their control and the farmers now have to use pyrethroids which are relatively more costly and therefore unaffordable to most farmers. The situation has led to an increase in other tick- borne diseases such as Babeiosis, heartwater and anaplasmosis.
199. Foot-and-mouth disease is highly contagious and can spread extremely rapidly in cloven- hoofed livestock populations through movement of infected animals and animal products, contaminated objects (for example livestock trucks) and even wind currents. Vaccination is complicated by a multiplicity of antigenic types and subtypes. Substantial progress has been made towards the control and eradication of foot-and-mouth disease in several regions, notably Europe and parts of South America and Asia. Foot and mouth disease is relatively easily contained through the use of vaccines. However, the many variances of the disease slow down the control process.
200. Contagious bovine pleuropneumonia (CBPP) is often regarded as an insidious, low- mortality disease of cattle, but this assessment is based on experiences in endemic areas. In susceptible cattle populations, the disease can spread surprisingly rapidly and cause high mortality rates. The disease is spread with the movement of infected animals, including acute cases and chronic carriers. Major CBPP epidemics have been experienced in eastern, southern and western Africa over the last few years. It currently affects 27 countries in Africa at an estimated annual cost of US $2 billion(Thomson, n.d.).
201. Another disease of importance is mastitis. The disease is related to hygiene and is common where hygiene in the livestock pens is not maintained. Similarly, nagana which is transmitted by tsetse fly is an equally troublesome disease in Livestock.
202. Tsetse fly control methods include the following:a. Deployment of insecticide (e.g.deltamethrin) impregnated targets/trapsb. Application of pour-ons on livestock with Flumethrinc. Cattle crush-pen spraying with Decatix, which also controls ticks and biting
fliesd. Disease surveillancee. Use of zero grazing unit protective nets
203. Since the trypanosome parasite also causes sleeping sickness in people, successful control of the disease in cattle should result in added benefits for human health. Another potential benefit is that increased use of targeted treatment of cattle with insecticide may lead to reduced incidence of malaria in some localities where mosquitoes feed on the same animals.
204. The most important disease occurring in goats is Helminthiasis. The disease is caused by helminthes (worms) and the farmers spend a considerable amount of money on buying dewormers.
205. The major disease of poultry is Newcastle. This is a virus spread primarily through bird- to-bird contact among chickens, but it can also spread through contaminated feed, water or clothing. Outbreaks occur in most parts of the world, and there have been two major pandemics over the last century. It is a major constraint to the development of village chicken industries, particularly in Asia and Africa. A large number of wild bird species can harbour Newcastle disease virus and, occasionally, the disease affects large-scale commercial poultry units in developed countries, despite tight biosecurity measures. Others diseases within the country include Gumboro, Coccidiosis
80

and fowlpox.
206. Aquaculture is a fast growing industry in Kenya. Common diseases of fish include:a) Bacteria – Fish remain in vertical position, white spots on the skin around the
mouth.b) Remedy – Antibiotics e.g Furaltadonec) Fungal – cotton–like growths on the mouth and barbels. Caused by handling,
netting or parasited) Remedy- use malachite greene) Parasitical- Fish assume vertical position and rub their heads on the pond surface a)
Remedy – Use formalinf) Worms – Red-brown worms on skin and barbels a) Remedy- Use of Masoteng) Broken head – pop eyes, soft skull and deformed caudal fin. Causes: Poor water
qualityh) Remedy- Observe good qualityi) Open belly – Swollen bellies, necrotic intestines, Causes: Bacteria a) Remedy-
Decrease feeding regime
7.3 Key Forestry pests and diseases207. One of the most significant recent pests in forestry is an exotic pest, identified as
the gall- forming wasp, Blue Gum Chalcid. It has been reported as a threat to Eucalyptus trees in Western parts of Kenya. The pest is reported to cause serious damage to young trees and nursery seedlings.
208. Another pest of significance is the Cyprus aphid which was reported to have invaded the county in 1991. The weed was estimated to kill as many as 50 percent of all Cyprus trees during the 30-year harvest cycle.
8.0 MANAGEMENT OF NEGATIVE IMPACTS OF CROP PROTECTION MEASURES
8.1 Introduction209. The effective control of diseases and pests is pertinent for improved crop and
livestock production. No single crop or plant is free from diseases and pests. There are pests and disease of economic importance that require cost effective control for improved productivity. Effective management can only be achieved when social, economic and environmental factors are taken in account’, particularly when you are making a choice of the appropriate control measure. This is important for increased adoption and effective use of the selected method. Some of the major social and economic activities to be considered are presented in the Table below. In addition, an understanding of the institutional and legal frame work is also important in assessing the impacts of the current pests and disease control measures.
Table 6. Social and economic activities associated with the presence of pests and vectors
Pest and vectors Economic Activities Social Activities
Crop Pests Cash crop Production,
subsistence crop production, storage of crops, marketing of
Population movement, siting
of homes
81

Pest and vectors Economic Activities Social Activities
Insect borne
vectors (mosquitoes, tsetse flies, black flies)
Farming, forestry, game hunting,
fishing, livestock management, market attendance, population
Recreation (water and land),
housing, waste disposal;, fetching water, population movements, settlement patterns leisure (siting outside the houses)
Animal-borne
vectors (tick and mites)
Livestock management, Game
hunting
Recreation sanitation
conditions
Water-borne
vectors (snails)
Fishing irrigation, livestock
management, market attendance, population movements.
Siting of homes, bathing,
washing, fetching water recreation (water), waste disposal, population movements, settlement patterns
Adopted from: Pest and vector management in the tropics, Youdeowei, A., 1983
210. An environmental impact of pest managemnt is a change in the environment caused by applying or using a certain method of pest or disease control. This will involve a change in the properties of a natural or man-made resource in a way considered important. In this case, specific environmental areas of concern will include: the quality of ground and surface water, wetlands and terrestrial communities (flora and fauna), and aquatic communities including fishery and other animals and soil properties. While the social economic impacts include: the health and personal safety of the people using the various control methods. The primary goals of any control programme against pests or diseases are, first, to establish the "optimal" level of disease or pest presence to meet a country's goals and, next, to choose the most cost-effective way of achieving that level of control.
8.2 Implication of control measures
8.2.1 Control of plant pests and diseases
211. The control of pests and diseases raises the most obvious concern of the resulting losses when there is no control, as pests populations can expand quickly from a localized outbreak to critical levels with serious infestations occurring simultaneously in several areas and neighbouring regions. The fast initial multiplication may occur unnoticed in remote and unpopulated areas and follow a natural (biologically induced) pathway. Once cropping areas are invaded, there is rarely sufficient time to prevent damage through control operations.
212. The widespread loss associated with an outbreak of pests and diseases makes it imperative for control measures to be undertaken. In view of major pests and diseases losses occurring in the lake basin, there is added need to prevent impacts on scarce food resources. Normally a control is carried out as a response to the appearance of pests and disease, with the main effort aimed at eradicating them once they appear in significant or levels. The primary response is widespread pesticide spraying to target pests, manual removal, biological control such as use of preys, use of resistant varieties, etc. All these methods have different effects on the environment, health and safety and general social setting. The rapid identification of early stages of attacks in the lake basin is critically important to minimize the damage to neighbouring regions
8.2.2 Control of Livestock pests and diseases
213. Animal diseases are spread either through natural pathways or human intervention. The transmission of certain diseases requires an insect to serve as a vector,
82

dictated by external environmental conditions and possibly appropriate plant hosts to carry out its life cycle. Based on biological reasons, these disease pathways have limited geographical scope, which simplifies the task of identifying pathways for disease transmission compared with plant pest introduction. In the lake- basin movement of livestock and derived products is regulated and controlled to prevent the entry and subsequent spread of exotic disease agents. Furthermore, disease surveillance systems with laboratory diagnostic support are maintained to ensure the early detection of disease outbreaks and contingency plans are in place to respond rapidly to an epidemic. In addition to these there is immense use of pesticides through spraying to control the spread of the disease and the use of acaricides to treat the disease.
8.2.3 Associated Risks
214. The control measures may be associated with risky outcomes in terms of expected profitability and is often measured by the variance. The risks may include and not limited to the following: a) Incorrect choice of herbicide, such that non target species are damaged, b) Mistakes in calibrationc) Effectiveness of pesticides which depends on the weather or other factors.
8.3 Impacts of empirical plant and animal pests and disease control methods
8.3.1 Use of Pesticides
215. Pesticides are commonly used in the control of diseases, pests and weeds on various crops. Other than crops (food, horticultural and cash), areas where pesticides are used is livestock industry (cattle and poultry) in the control of ticks and for treatment. Pesticides/acaricides are used to control ticks and tick borne diseases as well as viral, helminth and mycoplasmal diseases of economic importance. Drugs and vaccines are popularly used to control livestock diseases.
8.3.2 Impact on Environment
216. All campaigns against invasive species of pests and disease tend to occur over large areas, thereby affecting a significant amount of territory and people. The use of pesticides in an effort to control pests, both introduced and indigenous, can lead to serious health effects in developed and developing countries. Control of animal diseases is far less risky to people and the environment.
217. It is understood that pesticide use can be dangerous to farmers, nearby exposed populations and the affected environment. It is estimated that there are almost 5 million cases of pesticide poisoning in developing countries each year. World Health Organization (WHO) has estimated that there are 3 million severe human pesticide poisonings in the world each year, with approximately 220,000 deaths. While developed countries use about 80 percent of the world's pesticides, they have less than half of this number of deaths. It is not known how many of these poisonings should be attributed to control measures against plant pests.
218. The high concentrations of the organo-chlorine compounds in the soils where they are directly applied signal a potential problem. Other chemical compounds present include pyrethroids, traizines, etc. These compounds are also detected in water and sediments from rivers which drain through the farming areas, and that their concentration in water is influenced by their concentration in soil and sediments. Rain plays a major role in the transportation process through surface run-offs. The presence of compounds in the soil for up to five years since last application shows that the pesticides also persist in tropical soil conditions. High levels of these chemicals become harmful to man and aquatic community as the chemicals are eventually washed as run offs to the water bodies. The use of pesticides becomes injurious
83

particularly for example as evidenced by the spray drift if the spraying is not well done it affects non-target plants or animals.
219. The table below shows the list of agrochemicals that are banned in the country. The danger is that some of these chemicals which are banned are still being used in the lake basin including DDT and dieldrin, amongst others. However, pest eradication or the prevention of spreading requires pesticides for a shorter term and in a smaller area than would be employed if the pest were to spread. Therefore, it is important to balance the risk of pesticide use for control at different stages of pest outbreaks against the potential negative impacts.
Table 7. List of banned or restricted pesticides in Kenya.
BANNED PESTICIDES IN KENYA
Common name Use Date Banned
1. 2,4,5 T (2,4,5 – Trichloro-phenoxybutyric acid)
Herbicide 1986
2. Chlordane Insecticide 1986
3. Chlordimeform Insecticide 1986
4. DDT (Dichlorodiphenyl
Trichloroethane)
Agriculture 1986
5. Dibromochloropropane Soil Fumigant 1986
6. Endrin Insecticide 1986
7. Ethylene dibromide Soil Fumigant 1986
8. Heptachlor Insecticide 1986
9. Toxaphene (Camphechlor)
Insecticide 1986
10. 5 Isomers of Hexachlorocyclo-hexane (HCH)
Fungicide 1986
11. Ethyl Parathion Insecticide
All formulations banned except for capsule suspensions
1988
12. Methyl Parathion Insecticide
All formulations banned except for capsule suspensions
1988
13. Captafol Fungicide 1989
14. Aldrin Insecticide 2004
84

BANNED PESTICIDES IN KENYA
Common name Use Date Banned
15. Benomyl,
Carbofuran,
Thiram combinations
Dustable powder formulations containing a combination of Benomyl above 7%, Carbofuran above 10% and Thiram above 15%
2004
16. Binapacryl Miticide/Fumigant 2004
17. Chlorobenzilate Miticide 2004
18. Dieldrin Insecticide 2004
19. Dinoseb and Dinoseb salts
Herbicide 2004
20. DNOC and its salts (such as Ammonium Salt, Potassium salt & Sodium Salt)
Insecticide, Fungicide, Herbicide
2004
21. Ethylene Dichloride Fumigant 2004
22. Ethylene Oxide Fumigant 2004
23. Fluoroacetamide Rodenticide 2004
24. Hexachlorobenzene (HCB)
Fungicide 2004
25. Mercury Compounds Fungicides, seed treatment 2004
26. Pentachlorophenol Herbicide 2004
Phosphamidon Insecticide, Soluble liquid formulations of the substance that exceed 1000g active ingredient/L
2004
27. Monocrotophos Insecticide/Acaricide 2009
28. All Tributylin Compounds
All compounds including tributyltin oxide, tributyltin benzoate, trybutyltin fluoride, trybutyltin lineoleate, tributyltin methacrylate, tributyltin naphthenate, tributylin chloride
2009
85

BANNED PESTICIDES IN KENYA
Common name Use Date Banned
29. Alachlor Herbicide. 2011
30. Aldicarb Nematicide/Insecticide/Acaricide.
2011
Endosulfan Insecticide. 2011
31. Lindane Insecticide. 2011
Source: Pest Control Products Board (2012)
8.3.3 Impact on Health and safety
220. Concerns remain about worker exposure, residues on food and harm to domestic and non- target wild animals. Fish and invertebrates are frequently vulnerable, especially aquatic arthropods. Stocks of obsolete pesticides have also become a serious health and environmental problem in many countries of Africa and the Near East. Since pest outbreaks are erratic and difficult to predict, there is a danger that more pesticides than needed will be ordered or that pests will migrate out of the country before the pesticides arrive. As a consequence of the need to be prepared for initiating a control campaign at short notice, stockpiles of pesticides can be found in many of the countries affected by migratory pests. Often they are not stored correctly, which has resulted in corroded containers, lost labels and release of the chemicals into the environment.
221. The pesticide stockpiles pose a very important problem that requires urgent attention, especially for stocks near urban areas where there is a risk of the pesticides contaminating drinking-water, food or the air. However, in general they lack the resources and technology to mount appropriate disposal campaigns. The use of pesticides, fungicides and herbicides may lead to water pollution, given that water is used for drinking and other domestic purposes.
8.3.4 Use of Biological method
222. The biological control of pests and diseases entail the use of insects, bacteria or fungi on the host to eliminate the pest or disease. For example in the control of water hyacinth specific weevils spp. are used to destroy the weed.
8.3.4.1 Impact on Environment
223. This is one of the known environmentally friendly control methods as compared to other control methods. Unlike other methods biological control is applied carefully and selectively and since no chemicals are used it has no adverse effect on the environment. In comparison to other methods it is cost effective since its application may entail community participation and can be integrated in other control methods. The natural enemies once established may spread to other remote areas as in the case of water hyacinth.
224. The only criticisms is that the control agents are slow in action and take a longer period to generate results and therefore cannot be used in emergency situations. The danger comes in when the host is eliminated if the pest is not host specific then they may attack other plants (crops) or insects and therefore create an imbalance in the ecosystem.
86

225. In the case of the control of water hyacinth the use of weevils damage the water hyacinth which then rots and sinks providing a substrate on which other plants thrive on; e,g. cyperus, papyrus, hippo grass. This phenomenon was observed in L.Kyoga and Victoria when the beetles were successfully used in the control of water hyacinth in the late 1990’s. The new plants (ecological succession) which emerge pauses a problem on communication, water supply and fishing in the lake.
226. The use of resistant clones in the control of diseases and adoption of a fast method of propagating plantings has numerous environmental benefits. For example providing a reliable supply of improved tree seedlings will have important benefits for the environment. By increasing and sustaining the supply of timber, pressure on forests will be reduced on natural forests, helping to preserve valuable natural biodiversity and rare habitats. The Tissue culture technology also has the potential to increase biodiversity by replacing the stocks of rare and endangered tree species. The wider environmental benefits of increasing tree cover include improving soil stability, reducing erosion, preventing desertification and stabilizing global climate.
8.3.4.2 Impact on Health and safety
227. Since no chemicals are used there are no dangers and thus the method is generally/fairly safe. Refer to the KAPAP/KACCAL Environmental and Social Management Framework (disclosed in Kenya and in World Bank InfoShop) for guidance for usage of Personal Protective Equipment by workers, including farmers.
8.3.5 Use of Mechanical method
228. This method involves the use of automated machines and may also be expensive depending what machines are used. For example inter-cultivation in is done using a tractor mounted inter-cultivator to control weeds in crops such as sugarcane and use of boom sprays.
8.3.5.1 Impact on Environment
229. This may be friendly or unfriendly to the environment depending on the operation carried out and the disposal technique of the weeds or the wastes. For example when the water hyacinth is chopped mechanically and left to rot and sink at the bottom of the lake, they result into accumulation of water hyacinth debris. These materials impact on biotic communities, the environment and socioeconomic activities. These calls for choosing a method where by the chopped materials are completely removed from the site.
8.3.5.2 Impact on health and safety
230. The wise operation of the machines and the supporting labour becomes important in the safety and handling.
8.3.6 Use of manual method
231. The manual control basically consists of the use of labour with simple implements/tools. The major concern is often the high cost involved. For example weeding is particularly expensive before the tea matures and covers the ground completely
8.3.6.1 Impact on Environment
232. It is friendly to the environment as there is no pollution of land, water or air when the method is applied. An example would be the control of mole rats using traps. In the coffee sector, it is safe to ensure that the uprooted weeds are not placed on the tree stumps as this may introduce soil borne diseases into the tree, while in the sugar sector, when smutted stools of sugarcane are uprooted and not buried in the ground they cause more infection on the cane.
87

8.3.6.2 Impact on Health and safety
233. The danger involved in the manual control includes the risk of bilharzias, snake bites, hippo or crocodile attacks, depending on which plant and where the operation is carried out.
8.3.7 Use of Quarantine
234. Quarantine refers to a period when an animal or person that has or may have a disease is kept away from others in order to prevent the disease from spreading. For plants it is a situation which ensures safe movement, treatment, introduction and destruction of diseased/infected plants materials to reduce the risk of exposure of the country’s plant resources (environment) to foreign pests, diseases and noxious weeds.
8.3.7.1 Impact on Environment
235. This method is fairly safe to the environment as it allows for the control and management of pests and diseases through isolation.
8.3.7.2 Impact on Health and safety
236. Quarantines ensure safe passage of animals and plants by reducing contamination or spread of diseases.
88

9.0 CAPACITY NEEDS AND TECHNICAL ASSISTANCE FOR SUCCESSFUL IMPLEMENTATION OF THE IPMF
237. IPM is a knowledge intensive and interactive methodology. The need to accurately identify and diagnose pests and pest problems and understand ecosystem interactions could enable farmers with biological and ecological control opportunities and in making pragmatic pest control decisions. Thus the success of IPM depends largely on developing and sustaining institutional and human capacity to facilitate experiential learning for making informed decisions in integrating scientific and indigenous knowledge to solve district, ward and village specific problems. Poor communication between farmers, extension agents and researchers from research institutes and universities has often led to poorly-targeted research or to poor adoption of promising options generated by research. The full benefits of investment in agricultural research thereby remain untapped under these circumstances. Closer farmer-research investigator interaction and adaptive research and participatory learning approaches in capacity building efforts can help to bridge this gap and make research results more applicable by farmers. The farmers will learn biological and ecological processes underpinning IPM options, and use the newly acquired knowledge to choose compatible methods to reduce production and post-harvest losses through frequent field visits, meetings, demonstrations, adaptive research trails, etc.
238. Capacity building will be achieved through farmer-based collaborative management mechanisms where all key stakeholders shall be regarded as equal partners. Beneficiary farmers shall be the principal actors facilitated by other actor such as from research institutes, academic institutions, sector ministries, NGOs, etc. as partners whose role will be to facilitate the process and provide technical direction and any other support necessary for the implementation of PMP. The pilot PMP should be designed to build on, and to some extent strengthen existing national capacities for the promotion and implementation of IPM.
239. The major actors and partners will include the following:a) The programme beneficiary farmers: as the principal beneficiaries they will be
organized into Farmer Groups for training and adoption of IPM practices. The farmers will be facilitated to set up Community IPM Action Committees to coordinate IPM activities in their areas.
b) Agricultural sector ministries have the national mandates in implementation of crop protection and pest management research. The two projects will provide logistical and technical support to the Implementing Agencies, RSUs; CACs; and CCCs; Service Provider Consortia to be trained as IPM trainers and to exploit their experiences in the implementation of IPM and management of outbreak and migratory pest. RSUs, CACs and CCCs will undertake to build the capacities of researchers to train farmers and community leaders in promoting IPM activities. These in turn will facilitate information sharing with Farmers Field Schools (FFS). KAPAP will thus provide capacity and policy guidance and/or oversight for implementation of the two projects at regional/county level. The IPM commodity team will serve as resource persons at FFS, counties and districts or any other mechanism deemed suitable for conducting IPM Trainers and Farmer Group training secessions. The team will also be a major partner to farmer groups in the planning and execution of farmer participatory research activities related to IPM.
c) The sector ministries within the pilot KAPAP/KACCAL districts should provide staff for training at FFSs and should play major role with NGOs/CBOs in the public awareness campaign, production of extension materials, radio and television programmes in the respective districts. They should also monitor the prevalence of inputs supply by the dealers.
89

d) Ministry of Health (MoH): the district hospital or clinics in the KAPAP and KACCAL operational areas should set up databases on incidence of data on poisoning, effect of pesticides on human health and environmental contamination. This data will then be used to measure and validate the ameliorating effects of IPM adoption and pilot KAPAP/ KACCAL implementation that is expected to reduce risks to pesticides exposure.
e) National Environmental Management Authority (NEMA): will collaborate with the district hospitals and natural resources management offices of the districts on training beneficiary Farmer Groups in environmental management.
240. Partners will include the following:a) Research and training institutions: to formulate proposals for research and training
programmes for the development of IPM protocols, and training modules for participating KAPAP- commodity IPM team and programme staff.
b) WorldBank, FAO and Global IPM facility: to be a valuable sources of technical information and to provide technical support for training, planning and field implementation of IPM in Farmer Groups. The KAPAP/ KACCAL programmes will also build on the knowledge, structures, facilities, and lessons learnt in other related projects in Africa and elsewhere.
c) Agriculture Service Providers and NGOs that are working on providing services to farmers and improving agricultural productivity, environmental management and rural health matters will be identified to provide services and technical support to the field implementation of IPM and other pilot PMP.
90

10.0 IPM RESEARCH AREAS IN KAPAP AND KACCAL
241. There is need to develop strategies in the control of pests and diseases encompassing the following characteristics; economically feasible, socially acceptable, environmentally friendly and ensure safety. The following areas have been identified for more research in order to ensure the above characteristics are adhered to. These include: determining economic thresholds for major pests and diseases; undertaking risk analysis to provide information that assist in making a decision on the choice of management options; assessing impacts in terms of production (tonnage and monetary) which was unavailable. Others included development of IPM strategies for enterprises where they were missing or weak comprehensive determination of environmental impact of specific pesticides and further research for specific pests and control measures. These areas are fully described below:
10.1 Economic Threshold for the pests and diseases242. Although the terms of reference for this project was not to determine the
economic threshold of the pests and diseases, it is important to ascertain this level since it provides information that will guide in decision making on whether to invest in the control or not. There will be need to undertake studies that will establish this threshold for diseases/pests of economic importance in the lake basin.
10.2 Risk analysis243. Risk analysis is carried out to identify and assess the risks and
uncertainties associated with a hazardous activity and to identify management options that mitigate that risk. It consists of two stages: risk assessment, which is a positive or descriptive operation; and risk management, which is normative and essentially subjective.
244. There is a risk that exists as related to the occurrence of various pests and diseases; however the degree of this risk has not been quantified. Information derived from this information helps in preparing one self and taking appropriate control measures at an opportune time. It is important to study and document risk for pests such as Quelea birds and Grain larger borer amongst others.
245. In addition risk analysis is important in terms of ascertaining the outcome of a management outcome/options selected. This will allow a comparison of the risks in the presence of mitigating efforts, such as pre-entry treatments, vaccination campaigns, inspections and post-entry control measures. In each case, the benefits of reducing risk can then be balanced against the costs. It may be necessary that for all major enterprises some risk analyses is undertaken for major pests and diseases.
10.3 Economic Impact of the pests and diseases246. Even though a lot of efforts have been put in the assessment of yield losses due to
pests and diseases information in terms of loss in production was scanty for most of the crops, livestock and diseases considered. Research should focus more on the quantification of losses in terms of production (tonnage and monetary) and costs that are used in the control or eradication of the pests and diseases.
91

10.4 Development of IPM strategies for the control of pests and diseases247. Essentially IPM has been found to be technically and cost effective. There is need
to delve into areas/enterprises which do not have a clear package of IPM. This will include focusing on the following:
a) Biological control has been found to be environmentally friendly and cost effective in the long run. This has been exemplified in the control of water hyacinth but found lacking in the control of pests and diseases in crops, trees and livestock. There is need to extend research in the use of biological agents in the control of pests such tsetse that cause trypanasomiasis. In addition
b) More research may be required to develop appropriate IPM in the control of major diseases such smut in sugarcane and rot rust in tea.
c) The Blue Gum Eucalyptus spp pest Leptocybe invasa had considerable attack of upto 52% but those severely attacked had remained at 4% There is need to develop integrated pest management strategies for Blue Gum Eucalyptus spp. pest Leptocybe invasa.
248. The research should focus on :a) Identification which Ecalyptus species are tolerant to the pest, and identify the
natural enemies of the pest for an environmentally friendly d) Develop IPM and weed control approaches.
b) Test the efficacy of some plant based extracts as insecticides.c) To develop technologies for integrated and sustainable parasite and pest
control for all livestock- e.g. develop traditional herbs to treat animal diseases and test their efficacy.
d) Promote adoption of such approaches by farmers.e) Adaptive/strategic research themes for cereals and cassava protection and
production should include the classical biological control of LGB and the identification and integration of sustainable control methods.
f) Continued monitoring and surveillance of water hyacinth is recommended.g) Rearing and release of weevils should be a continuous process to keep the
water hyacinth in abeyanceh) Assess the developed methods for their effectiveness and compatibility with
the current farming system in order to increase their relevance, effectiveness and hence adoption. One possible method is to develop and recommend an IPM.
i) The adoption levels and associated constraints need to be assessed and documented.
j) There is need to research on chemical and biological control methods to enhance effective control of sugar smut.
k) Given the heavy expense involved in the control of migratory pests, there is need to identify a cost effective alternative method. An appropriate IPM could be an ideal strategy for these pests.
l) The use of targeted treatment of cattle with insecticides may lead to reduced incidence of malaria in some localities where mosquitoes feed on the same animals.
m) Continued cross breeding in livestock for improvement of the outputs of local breeds but also to increase resistance to diseases and pests attacks.
n) Biotechnology: to develop high yielding varieties of crops, trees and livestock and promote the adoption of these high yielding varieties/breeds by farmers.
92
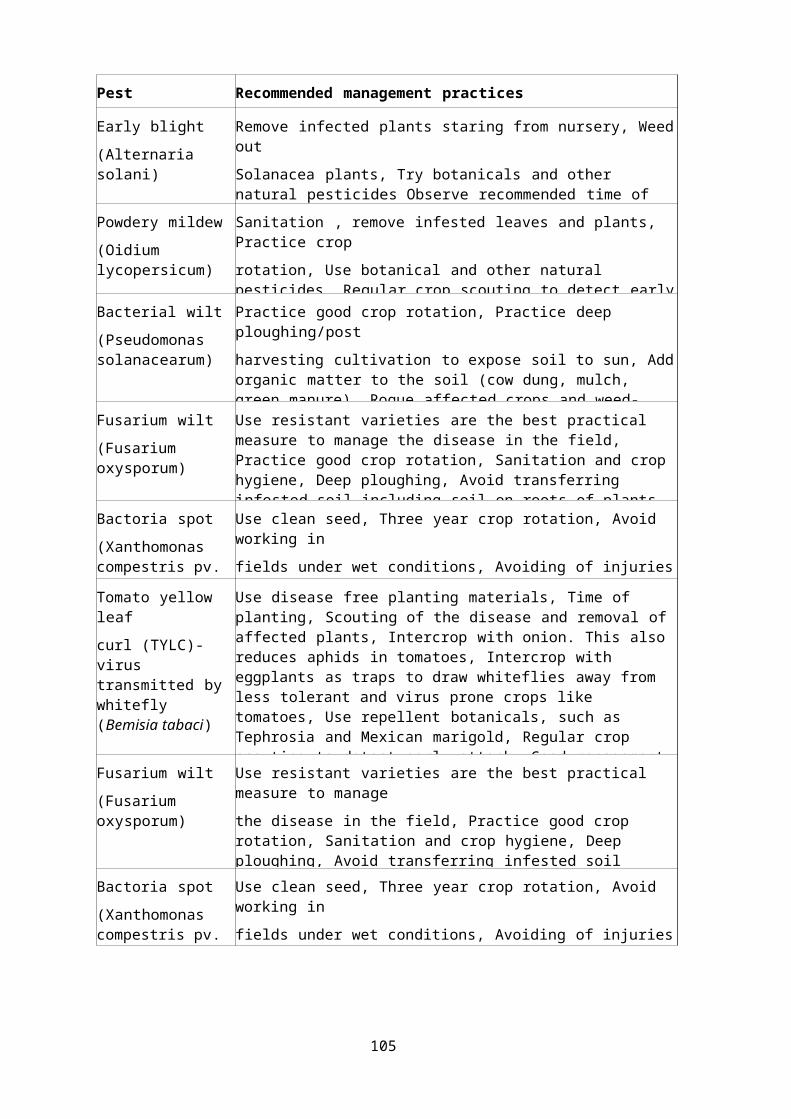
11.0 IPMF IMPLEMENTATION AND BUDGET249. The programme management team of KAPAP/ KACCAL will be responsible
in the implementation of this IPMF and estimated costs for the various activities under these projects will be built in the budget. The core activities will be as follows:
a) Coordinationb) Development of IPM packages for the pilot KAPAP districts c) IPM orientation
workshopsc) Training of trainers and Farmer groups trainingd) Public awareness and promoting the adoption of IPM practicese) Field guides/training materials for production, purchase and distribution g)
Farmers field daysf) h) Field visits and study toursg) Database for human-health and environmental contaminationh) Crop pest surveillance and updating pest/disease database at KEPHISi) Annual workshops on progress and lesson learnt j) Participatory IPM research and developmentk) Monitoring and evaluation
11.1 Implementation250. During every 6 months all interested in IPM activities will meet to discuss the
progress report and activities plan for the following 12 months. The extension staff, cooperative/association extension staff sponsored and none sponsored by KAPAP PCU and representative of farmers responsible for IPM execution will give periodic reports and planned activities for the following quarter, and should reflect the approved work program for each in association or cooperative. This should include:
a) Name of crop and area under demonstration, b) Activities performed during this period (1 to 3 months), c) Number of farmers involved, d) Dates of various activities, e) Inputs used f) Pest and diseases observed and control methodsg) Person hours or days spent on each activityh) Field days and number of people attendedi) Farmer to farmer visits done and number of participantsj) Leaders invited and attended any of IPM eventsk) Lessons learnt and problems during the monthl) Other activities done by the groupm) Future plans n) Observation and suggestions
11.2 Budget251. A tentative cost estimates of budgetary requirements is given in the table below
Table 8. Budget element for implementation of IPMP-KAPAP/KACCAL (in USD)
Line item Yr 1 Yr 2 Yr 3 Yr 4 Yr 5 Total
1. Capacity building
IPM orientation 5000 3000 3000 11000
TOT 15000 15000 10000 40000
FG training 10000 10000 10000 10000 10000 50000
93

Line item Yr 1 Yr 2 Yr 3 Yr 4 Yr 5 Total
Database 7500 11000 8500 26000
Surveillance 5000 5000 5000 10000 125000
Workshop 4000 5000 6000 8000 23000
2.R&D
Participatory IPM 30000 30000 30000 30000 30000 150000
3. Field days 3000 5000 7000 5000 8000 28000
4. Advistory services
Field guides/IPM materials 5000 3000 4000 12000
Public awareness 6000 6000 4000 2000 2000 20000
Pest specialist 3000 3000 3000 3000 3000 15000
M&E 10000 50000 5000 4000 4000 73000
Coordination 2000 2000 2000 2000 2000 10000
Grand total 470,000
94

12.0 REFERENCES
FAO, 1967. Report of the first session of the FAO panel of Experts on Integrated Pest Control, Rome, Italy, Sept. 18-22, 1967. 19 pp. is shown In: Bruin and Meerman, 2001)
ISAAA website (2002). Biotechnology in Tree Production: Creating a Self-sustaining Production and Dissemination System in Kenya.
Abele S., M. Odendo, H. Obiero, E. Twine, J. Odenya and P.Ntawuruhunga, n.d. The Impact of the Introduction of CMD resistant cassava varieties in Western Kenya. A Kenya Agricultural Research Institute and International Institute of tropical Agriculture Report Acland, J.D. 1973. East African crops. Longman, London.
Anon. 2005. Cotton Survey Research in Usigu and Butalang’i Division of Western Kenya
B. Maturwe R. Kuto, J.O. Okungu, J.O.Z. Abuodha and R.E. Hecky ( n.d.) Pesticides and Heavy Metals Contamination in the Lake Victoria Basin, Kenya.
CIAT, 1986. Proceedings of the bean fly workshop, Arusha, Tanzania, 16-20. Nov Pan African Workshop series No. 1 (Allen D.J. and Smithson ed) CIAT, Cali, Colombia.18pg
CRF-2006. A Coffee Research Foundation Quarterly Bulletin. Vol.8 No. 2, October-Dec 2006.
Crop Protection Compendium (2005)
Hugo De Groote, 2002. Maize yield losses from stemborers in Kenya. Insect Sci. Applic.Vol. 22, No. 2, 2002, pp. 89-96
Farrel, G., Greathead, A.H., Hill, M.G. & Kibata, G.N., 1996. Management of farm storage pests in East and Central Africa. Proceedings of the East and Central African Storage Pest Management Workshop, 14-19 April, 1996, Naivasha, Kenya.
Kanampiu F. 2002. New Ways to curb Striga. AgriForum No.19 (April-June, 2002): 1&10.
KESREF 2007. A Technical Bulletin for Kenya Sugar Research Foundation. Vol One No. 2
Mailu A. M 2001. Preliminary Assessment of the social, Economic and Environmental Impacts of water Hycainth in the Lake Victoria Basin and the Status of control. In M.H. Julien, M.P. Hill, T.D. Centre and Ding Jianqing (Eds.) Biological and Integrated Control of Water Hyacinth, Eichhornia crassipes. Proceedings of the Second meeting of the Global Working Group for the Biological and Integrated Control of Water Hyacinth, Beijing, China, 9-12 October, 2000.
NARO 2002. Experiences with managing water hyacinth infestation in Uganda.Published by National Agricultural Research Organisation and Fisheries resources Research Institute (FIRRI).
Nzioki H.S. 2007 and J. E. Jamoza. Assessment Of Yield Loss Due To Sugarcane Smut (Ustilago Scitaminea) Infection In Kenya: A KESREF Technical Bulletin. Vol. One No.1
Odendo M.O., O.M. Odongo, F.A. Musanga and J.O. Ojiem 2002. Socioeconomic dimension of integrated Striga Control in Maize through use of tolerant varieties and soil fertility improvement options in Western Kenya. A KARI-Kakamega Socioeconomic document Series No. 02/02.
Odongo O.M., A.O. Diallo and G. Ambani 2001. Identification of maize varieties resistant/tolerant to Striga hermonthica and Adapted to Western Kenya. A paper presented at the plant breeders Association of Kenya Workshop on November, 22, 2001 at KARI HQs.Nairobi.
Othina A., R. Omondi, J. Gichuki, D. Masai and J. Ogari 2000. The Impact of Water Hyacinth on the Macropytes and Fisheries in the Nyanza gulf of L. Victoria. A Kenya Marine Fisheries Research Institute Report.
95
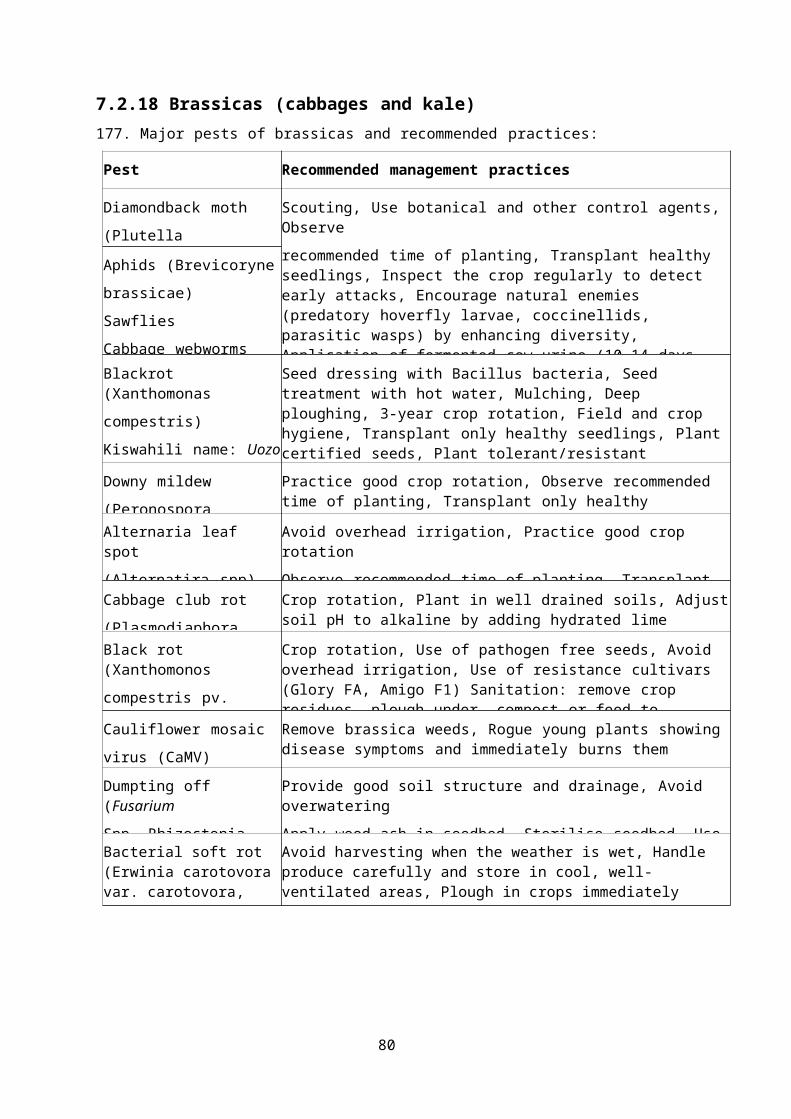
PDA Annual Report 2006. Provincial Director of Agriculture, Rift Valley Province 2006.
Ransom J.K. 1996. Integrated Management of Striga Spp.in the Agriculture of Sub Saharan
Africa. Proceedings of 2nd International Weed Control Congress, Copenhagen. Pp. 623-628.
Rono J.K M.O. Osoro and A.M. Nyang’au 2007. Survey Of Pests And Diseases Of Sugarcane In Western Kenya. A KESREF Technical Bulletin. Vol. One No.2. TRFK 2002.
The Tea Research Foundation of Kenya. A TRFK Technical Manual. Wawire N. W. and GRS Ochiel 2002. A Review of the impact of Water Hyacinth on Lake Victoria: The case of Winam
gulf. A paper presented to the LVEMP first regional conference, 3-7th Dec, 2001, Kisumu-Kenya.
Thomas Gavin, (n.d), Contagious Bovine pleuropneumonia: Possible future strategies for the control of the disease in the PACE region; PACE Programme, AU-IBAR, Nairobi
Wawire N.W. 2005. The impact of water hyacinth on the productivity, profitability and species composition of the Lake Victoria Fishery, Kenya. A PhD thesis presented to Moi University- Kenya.
Ministry of Environment and Mineral Resources Lake Victoria Environmental Management Project: Applied Research Program For The Lake Victoria Basin. Final Report, March 2007.
96

Appendix 1: Production of Crops in Kenya
Appendix 1a: Production of food crops in Kenya (2002 -2006)
CROP 2002 2003 2004 2005 2006
Area (ha) Production
(Tons)
Area (ha) Production
(Tons)
Area (ha) Production
(Tons)
Area (ha) Production
(Tons)
Area (ha) Production
(Tons)
Maize 1,592,315 2,411,007 1,670,914 2,713,561 1,819,817 2,454,930 1,760,618 2,918,157 1,888,185 3,247,777
Wheat 144,794 307,523 151,135 379,034 145,359 397,005 159,477 365,696 150,488 358,061
Rice 13,000 44,996 10,781 40,498 13,322 49,290 15,940 57,942 23,106 64,840
Sorghum 144,294 115,700 148,985 127,343 123,155 86,580 122,368 150,127 163,865 131,188
Millets 118,700 72,327 108,343 63,731 129,750 75,171 92,430 59,481 137,711 79,207
Beans 928,651 481,225 879,032 429,183 872,070 232,074 1,034,477 375,820 995,391 531,800
Pigeon Peas 164,453 93,296 183,612 98,378 195,308 105,571 180,240 94,950 196,630 110,841
Cowpeas 122,398 59,428 151,679 46,967 125,189 29,321 72,654 36,242 161,971 87,808
Green Grams 69,551 30,946 70.312 26,147 94,149 26,175 87,510 32,891 102,882 43,399
Arrow Roots 2,265 15,856 2,906 21,134 2,140 12,840 2,332 27,326 3,144 22,846
Cassava 81,967 601,976 53,297 421,317 56,010 388,713 68,320 566,400 68,502 656,633
Sweet Potatoes
60,410 513,485 58,770 587,700 60,701 546,309 61,300 671,709 74,937 724,646
Yams 960 7,584 952 8,007 836 7,086 835 7,238 842 8,001

Appendix 1b: Production of industrial crops in Kenya (2002-2006)
CROP 2002 2003 2004 2005 2006
Area (ha) Production
(Tons)
Area (ha) Production
(Tons)
Area (ha) Production
(Tons)
Area (ha) Production
(Tons)
Area (ha) Production
(Tons)Tea 44,400 111,200 45,100 112,900 48,800 132,100 48,600 130,800 51,300 119,401
Coffee 42,000 23,073 42,000 21,417 42,000 18,473 42,000 20,745 42,000 21,257
Sugar 126,826 4,501,363 122,850 4,204,055 131,507 4,660,995 144,765 4,800,820 147,730 4,932,839
Cotton 20,171 12,808 24,955 17,776 30,000 18,000 32,357 19,414 36,277 22,492
Pyrethrum 18,210 10,953 17,520 5,796 10,950 2,207 4,522 1,003 6,325 762.7
Tobacco 13,983 14,900 14,000 13,871 16,630 13,983 10,296 15,959 12,179 17,605
Sisal 36,430 22,108 34,650 25,009 31,800 26,604 31,800 25,600 24,962 26,375
Coconut 43,862 61,052 42,220 56,937 43,162 69,245 37,293 61,824 37,137 61,117
Bixa 5,474 3,003 5,537 3,182 5,519 6,117 5,252 6,468 5,658 6,607
Appendix 1c: Production of horticultural crops in Kenya (2002-2006)
CROP 2002 2003 2004 2005 2006
Area (ha) Production
(Tons)
Area (ha) Production
(Tons)
Area (ha) Production
(Tons)
Area (ha) Production
(Tons)
Area (ha) Production
(Tons)
Nuts 2,557.0 13,837.0 2,419.0 11,134.0 2,583.0 10,910.0 2,591.0 12,958.0 3,277.0 18,161.0
Irish Potatoes 111,728.0 861,566.0 112,300.0 1,060,003.0 128,484.0 1,084,412.0 120,842.0 980,163.0 107,908.0 784,596.0
Herbs & Spices 1,606.0 8,357.0 1,944.0 11,235.0 1,957.0 10,184.0 2,513.0 12,915.0 2,944.7 23,427.5

CROP 2002 2003 2004 2005 2006
Area (ha) Production
(Tons)
Area (ha) Production
(Tons)
Area (ha) Production
(Tons)
Area (ha) Production
(Tons)
Area (ha) Production
(Tons)
Cut Flowers 2,092.7 978.4 1,798.0 855.0 2,177.0 1,444.0 2,098.0 3,290.0 2,423.8 3,844.7
Chilies 768 3,152 1,011 5,599 842 5,214 1,287 5,199 1,286 4,292
Coriander 187 222 278 349 272 1,340 309 1,799 339 1,495
Celery 131 1,047 95 849 87 919 112 960 - -
Cut Flowers 2,093 978.4 1,798 855 1,777 1,444 2,098 3,290 2,424 3,844
Macadamia 2,557 13,837.0 2,613 13,144.0 2,683 10,910.0 2,691 12,958.0 3,277 18,161.0
Cashew Nuts 30,011 7,626 29,020 11,075 27,805 12,435 28,223 13,276 27,602 14,117
Cabbage 18,905.0 260,774.0 20,809.0 337,076.0 19,531.0 348,176.0 20,527.0 529,003.0 20,513.1 416,373.0
Tomatoes 17,430.0 284,859.0 18,163.0 3,370,756.0 22,784.0 328,510.0 20,743.0 337,447.0 19,541.6 334,478.7
Kales 23,121 317,281.0 23,892.0 371,896.0 24,933.0 335,135.0 26,818.0 315,159.0 28,898 403,701
Onions 5,964.0 60,536.0 6,476.0 65,761.0 6,513.0 64,322.0 6,395.0 68,860.0 6,800.0 84,542
Carrots 3,654.0 37,281.0 4,208.0 44,324.0 3,088.0 35,519.0 2,737.0 28,750.0 2,874 31,220
French Beans 6,482.0 28,818.0 5,521.0 31,379.0 6,291.0 48,487.0 7,004.0 62,189.0 6,154 43,821
Spinach 862.0 8,296.0 2,124.0 24,791.0 2,138.0 26,738.0 2,172.0 29,173.0 2,613 35,095
Garden Peas 6,522.0 26,013.0 7,181.0 25,174.0 6,580.0 23,327.0 5,313.0 22,798.0 7,564 28,229
Snow Peas 870.0 2,766.0 1250 4,903.0 1,256.0 5,184.0 1,550.0 5,578.0 1,383.9 9,282.1Asian 1,985.0 11,189.0 1,911.0 13,589.0 2,353.0 16,337.0 2,832.0 18,958.0 3,074 20,761

CROP 2002 2003 2004 2005 2006
Area (ha) Production
(Tons)
Area (ha) Production
(Tons)
Area (ha) Production
(Tons)
Area (ha) Production
(Tons)
Area (ha) Production
(Tons)
Irish Potatoes 111,728.0 861,566.0 126,490.0 1,223,531.0 128,484.0 1,084,412.0 120,842.0 980,163.0 107,907.0 784,506Banana 78,156 1,073,001 79,598 1,019,377 81,673 1,036,138 83,687 1,006,870 82,517.8 1,058,018Citrus 15,051 116,336 15,035 129,532 15,007 118,190 14,793 113,098 13,905 97,382Mangoes 16,673 176,504 17,268 183,486 18,094 183,440 18,738 188,658 21,264 163,726
Avocadoes 4,880 62,431 5,099 70,948 6,421 80,316 7,414 99,960 7,649 91,369Passion Fruit 2,991 29,118 3,435 28,993 4,024 31,951 3,941 32,551 4,419 32,744Pineapples 13,193 619,860 11,892 399,103 14,473 536,948 15,158 593,712 15,123 447,558
Paw paws 7,974 81,811 8,277 86,491 8,718 86,264 8,448 79,567 8,643 85,210
Apples 201 1,178 220 1,442 226 1,379 239 1,431 256 1,626Plums 700 4,885 784 5,250 783 4,259 843 5,845 824 5,868.3Water Melon 684 5,871 684 6,187 2,269 12,679 1,286 8,520 1,642 10,828Tree Tomatoes 140 966 283 2,429 306 2,902 328 3,287 376 3,810Strawberry 18 120 30 221 41 229 44 254 39 240

Appendix 2: Step 1, 2 and 3 of Stakeholder Analysis
Stakeholder
Groups
Interest (s) Effects of Project on
Interest(s)
+ 0 -
Importance of Stakeholder for
Success of Project
U = Unknown
1 = Little/No Importance
2 = Some Importance
3 = Moderate Importance
4 = Very Important
5 = Critical Player
Degree of Influence of
Stakeholder over Project
U = Unknown
1 = Little/No Influence
2 = Some Influence
3 = Moderate Influence
4 = Significant Influence
5 = Very Influential
YEA
R S
TAR
TED

Step 3 of Stakeholder Analysis
INFLUENCE OF STAKEHOLDER
IMPORTANCE OF ACTIVITY TO STAKEHOLDER
Unknown Little/No
Importance
Some Importance Moderate
Importance
Very
Important
Critical
Player
Unknown
Little/No influence
Some Influence
Moderate Influence
Significant Influence
Very Influential
STAGE IN
PROJECT PROCESS
TYPE OF PARTICIPATION
Information Sharing (One-Way Flow) Consultation (Two-
Way Flow)
Collaboration (Increasing control over decision making)
Empowerment (Transfer of control over decision making and resources)
Capacity Building (Better Governance and Management)
Skills Development (Livelihood options and improved
standard of living)
Project Identification

Project Preparation
ImplementationSupervision
Monitoring
Evaluation

Appendix 3: Questionnaire on Pest ManagementThis questionnaire will be used with the farmers groups for purpose of implementing the IPMF
1) Pest Control practices
a) Do you use any pesticides to control pests (Insects, diseases, weeds) of crops?
Yes
No If yes, name them:
Name of
pesticide
Name of pest,
disease, weed controlled
Number of
times applied/season
When did you apply
(growth stage or month) Quantity purchased
each season
If No, WHY?
b) If you use any of the above pesticide types, do you keep records of the:
Application location Yes…………. No ………….
Date of application Yes…………. No ………….
Pesticide product trade name
Yes…………. No ………….
Operator name Yes…………. No ………….
If No, WHY?
c) How do you decide when to use the pesticides (tick all that apply)?
We use pesticides at regular intervals throughout the season (calendar) We use pesticides when we see pests in the field (control)
We use pesticides after field sampling and finding a certain number of pests or a certain level of damage (scouting
Told by someone to apply (specify who)
Other (specify)
d) Do you use a knapsack sprayer? Yes No If yes, do you own it Yes No
Do you rent it Yes No
Do you borrow it Yes No

e) From your experience, are there any negative/harmful effects of using pesticides?
Yes………. No ………….
f) If yes, list the negative effects:
1. ………………………………………………………………
2.................................................................................................
3. ………………………………………………………………
4. ………………………………………………………………
5. ………………………………………………………………
g) Do you use any kind of protective clothing while applying or handling pesticides? Yes No
Why?
h) If YES, what kind?
2. Knowledge of pesticide handling and storage (tick one in each row)
a) Do you read labels on the pesticide container before using?
Sometimes Always Never
b) How often do you wear protective clothing and other accessories like nasal mask, eye goggles, and boots when applying the pesticides?
Sometimes Always Never
c) Do you mix pesticides with your hands?
Sometimes Always Never
d) Do you observe the pre-harvest waiting periods after applying the pesticides?
Sometimes Always Never
e) After spraying, do you wait 12 hours before entering the field?
Sometimes Always Never
f) Do you store pesticides in a secure, sound and well-ventilated location?
Sometimes Always Never
g) Do you make a cocktail before applying the pesticides? (i.e., mix more than one chemical and apply them at once?)
Sometimes Always Never
h) Where do you store your pesticides?
Why do you store them there?
i) What do you do with your pesticide containers after they are empty?

j) Do you know of any beneficial insects (insects that eat harmful insects)?
Yes…………. No ………….
k) If yes, name them:
i) ii) iii)
3. Pesticides and Health
a) Do you find that pesticide application is affecting the health of: Persons regularly applying pesticides
Sometimes Always Never
Persons working in fields sprayed with pesticides
Sometimes Always Never
Persons harvesting the produce
Sometimes Always Never
4. Options to Pesticides
a) From your experience, are you aware of other methods for controlling insects diseases and/or weeds besides pesticides?
Yes……….. No …………
b) If yes, describe these practices:
i) ii) iii) iv)
5. Information
a) What information do you think you need for improving your crop production and marketing?
6. Training
a) Have you ever received any training on any of the following topics related to crop production?
Integrated Pest Management
Yes…………. No ………….
No. of times/past yr. ………….
Pesticide Usage Yes…………. No ………….
No. of times/past yr. ………….
Pesticide Safety Yes…………. No ………….
No. of times/past yr. ………….
Insect Identification Yes…………. No ………….

No. of times/past yr. ………….
Disease Identification Yes…………. No ………….
No. of times/past yr. ………….
Quality aspects of production
Yes…………. No ………….
No. of times/past yr.………….
7) Is there anything else that you want us to know about your crop production?
Thank you for your time
Appendix 4: ESM Sub-projects Screening Checklist (Revised September 2010)
(Sub-projects screening process by benefitting communities/Agencies)
Section A: Background information
Name of district……………………………………………………………
Name of RSU/Monitoring Officer/Researcher …………………………
Sub-project location……………………………..
Name of CBO/Institution…………………………………………..
Postal Address:……………………………………………….
Contact Person………………………………Cellphone:…………………………………..
Sub-project name………………………………………………….
Estimated cost (KShs.)……………………………………
Approximate size of land area available for the sub-project………
Objectives of the sub project……………………………………………………
…………………………………………………………………………………………………………………………………………………………………………………………………………………………………………………………………………………..
Activities/enterprises undertaken……………………………………………

How was the sub-project chosen?....................................
Expected sub project duration:…………………………………………………
Section B: Environmental Issues
Will the sub-project: Yes No
Create a risk of increased soil erosion?
Create a risk of increased deforestation?
Create a risk of increasing any other soil degradation soil degradation?
Affect soil salinity and alkalinity?
Divert the water resource from its natural course/location?
Cause pollution of aquatic ecosystems by sedimentation and agro-chemicals, oil spillage, effluents, etc?
Introduce exotic plants or animals?
Involve drainage of wetlands or other permanently flooded areas?
Cause poor water drainage and increase the risk of water-related diseases such as malaria?
Reduce the quantity of water for the downstream users?
Result in the lowering of groundwater level or depletion of groundwater?
Create waste that could adversely affect local soils, vegetation, rivers and streams or groundwater?
Reduce various types of livestock production?
Affect any watershed?
Focus on Biomass/Bio-fuel energy generation?
If the answers to any of the above is ‘yes’, please include an EMP with sub-project application.
Section C: Socio-economic Issues
Will the sub-project: Yes No
Displace people from their current settlement?
Interfere with the normal health and safety of the worker/employee?

Reduce the employment opportunities for the surrounding communities?
Reduce settlement (no further area allocated to settlements)?
Reduce income for the local communities?
Increase insecurity due to introduction of the project?
Increase exposure of the community to HIV/AIDS?
Induce conflict?
Have machinery and/or equipment installed for value addition?
Introduce new practices and habits?
Lead to child delinquency (school drop-outs, child abuse, child labour, etc?
Lead to gender disparity?
Lead to poor diets?
Lead to social evils (drug abuse, excessive alcohol consumption, crime, etc)?
Section D: Natural Habitats
Will the sub-project:
Be located within or near environmentally sensitive areas (e.g. intact natural forests, mangroves, wetlands) or threatened species?
Adversely affect environmentally sensitive areas or critical habitats – wetlands, woodlots, natural forests, rivers, etc)?
Affect the indigenous biodiversity (Flora and fauna)?
Cause any loss or degradation of any natural habitats, either directly (through project works) or indirectly?
Affect the aesthetic quality of the landscape?
Reduce people’s access to the pasture, water, public services or other resources that they depend on?
Increase human-wildlife conflicts?
Use irrigation system in its implementation?
If the answers to any of the above is ‘yes’, please include an EMP with sub-project application.

Section E: Pesticides and Agricultural Chemicals
Will the sub-project:
Involve the use of pesticides or other agricultural chemicals, or increase existing use?
Cause contamination of watercourses by chemicals and pesticides?
Cause contamination of soil by agrochemicals and pesticides?
Experience effluent and/or emissions discharge?
Export produce? Involve annual inspections of the producers and unannounced inspections?
Require scheduled chemical applications?
Require chemical application even to areas distant away from the focus?
Require chemical application to be done by vulnerable group (pregnant mothers, chemically allergic persons, elderly, etc)?
If the answer to the above is ‘yes’, please consult the IPM that has been prepared for the project.
Section F: Indigenous Peoples
Are there:
Indigenous peoples living within the boundaries of, or near the project?
Members of these indigenous peoples in the area who could benefit from the project?
Indigenous peoples livelihoods to be affected by the sub project?
If the answer to any of the above is ‘yes’, please consult the IPPF that has been prepared for the project.
Section G: Land Acquisition and Access to Resources
Will the sub-project: Yes No
Require that land (public or private) be acquired (temporarily or permanently) for its development?
Use land that is currently occupied or regularly used for productive purposes (e.g. gardening, farming, pasture, fishing locations, forests)
Displace individuals, families or businesses?

Result in temporary or permanent loss of crops, fruit trees and pasture land?
Adversely affect small communal cultural property such as funeral and burial sites, or sacred groves?
Result in involuntary restriction of access by people to legally designated parks and protected areas?
Be on monoculture cropping?
If the answer to any of the above is ‘yes’, please consult the mitigation measures in the ESMF, and if needed prepare a (Resettlement Action Plan) RAP.
Section H: Proposed action
(i) Summarize the above: (ii) Guidance
All the above answers are ‘No’
There is at least one ‘Yes’
If all the above answers are ‘No’, there is no need for further action;
If there is at least one ‘Yes’, please describe your recommended course of action (see below).
(iii) Recommended Course of Action
If there is at least one ‘Yes’, which course of action do you recommend?
RSUs and DEOs will provide detailed guidance on mitigation measures as outlined in the ESMF; and
Specific advice is required from DEOs, Lead Scientist and RSUs regarding sub-project specific EA(s) and also in the following area(s)
[type here]
All sub-project applications/proposals MUST include a completed ESMF checklist. The KAPAP-RSU and DEC will review the sub-project applications/proposals and the DEOs will sign off;
The proposals will then be submitted to KAPAP-Secretariat for clearance for implementation through RSUs for community-based subprojects or Principal Investigator in case of Competitive research grants.
Expert Advice
The Government of Kenya through the Department of Monuments and Sites of the National Museums of Kenya can assist in identifying and, mapping of monuments and archaeological sites; and

Sub-project specific EAs, if recommended, must be carried out by experts registered with NEMA and be followed by monitoring and review. During the process of conducting an EA the proponent shall seek views of persons who may be affected by the sub-project. The WB policy set out in OP 4.01 requires consultation of sub-project affected groups and disclosure of EA’s conclusions. In seeking views of the public after the approval of the sub-project, the proponent shall avail the draft EA report at a public place accessible to project-affected groups and local NGOs.
Completed by: [type here]
Name: [type here]
Position / Community: [type here]
Date: [type here]
Field Appraisal Officer (DEO): [type here]
Signature: [ ]
Date: [type here]
Note:
Project category
Characteristics
A These projects are not financed under KAPAP/KACCAL. Full and extensive EIA needed- irreversible environmental impacts; impacts not easy to pick or isolate and mitigation cost expensive; EMP design not easily done; Must have the EIA done and future annual EAs instituted
B Site specific environmental impacts envisaged; mitigation measures easy to pick, not costly and EMP design readily done; need an EIA and future EAs
C Have minimal or occasionally NO adverse environmental impacts; exempted from further environmental processes save environmental audits