Embed Size (px)
DESCRIPTION
Iowa State University/CTRE NCRST-I Projects. About CTRE. Center for Transportation Research and Education Iowa State University/CCE Interdisciplinary MS Transportation Midwest Transportation Consortium (USDOT) 80+ year partnership with Iowa DOT 75 projects/$4M budget. Team Philosophy. - PowerPoint PPT Presentation
Citation preview
Iowa State University/CTRE NCRST-I Projects

About CTRE
• Center for Transportation Research and Education• Iowa State University/CCE• Interdisciplinary MS Transportation• Midwest Transportation Consortium (USDOT)• 80+ year partnership with Iowa DOT• 75 projects/$4M budget

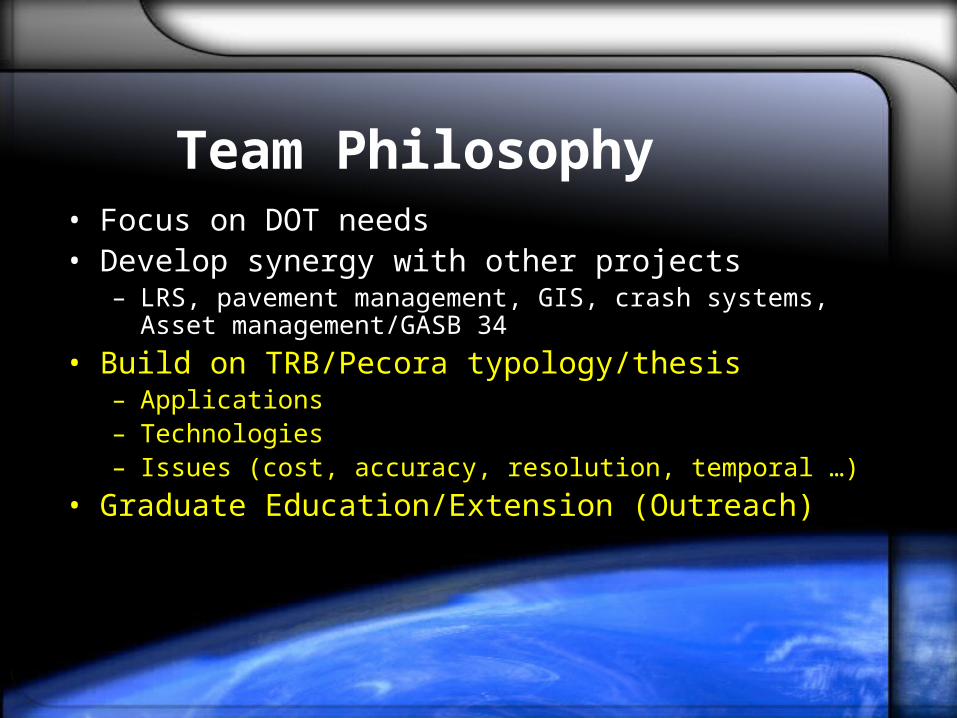
Team Philosophy• Focus on DOT needs• Develop synergy with other projects
– LRS, pavement management, GIS, crash systems, Asset management/GASB 34
• Build on TRB/Pecora typology/thesis– Applications– Technologies– Issues (cost, accuracy, resolution, temporal …)
• Graduate Education/Extension (Outreach)
Functions:• Engineering
– Traffic Engineering– Transportation
Safety• Maintenance• Motor Vehicle
– Driver Services– Motor Carrier
Services• Planning and
Programming– Program
Management– Project Planning– Systems Planning
• Project Development– Bridges and
Structures– Construction– Contracts– Design– Materials– Right of Way
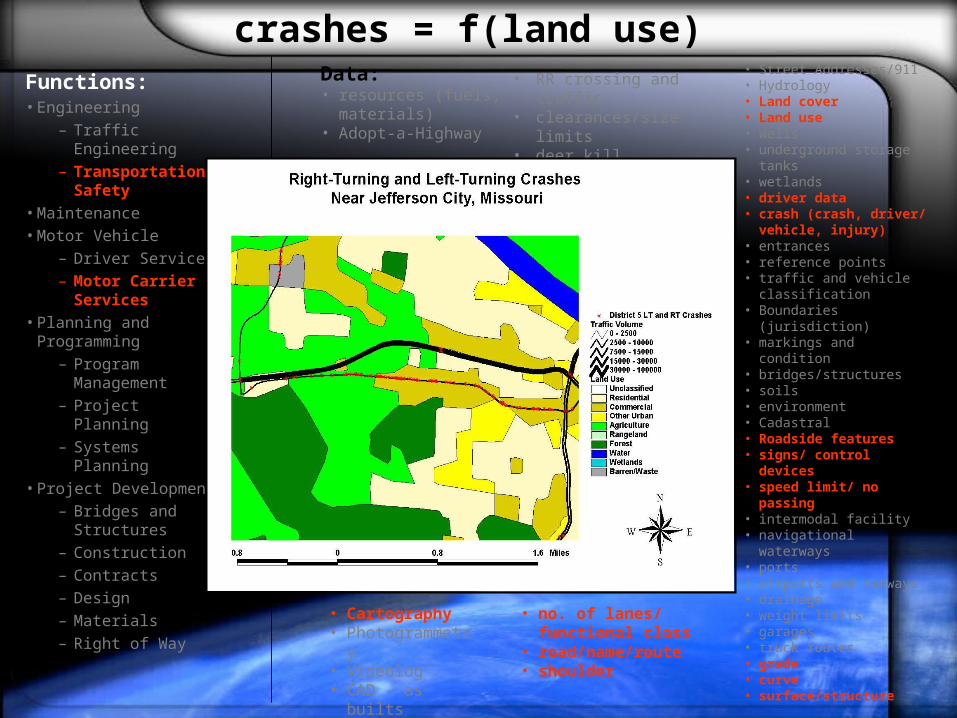
• Street Addresses/911• Hydrology• Land cover• Land use• Wells• underground storage tanks• wetlands• driver data• crash (crash, driver/
vehicle, injury)• entrances• reference points• traffic and vehicle
classification• Boundaries (jurisdiction)• markings and condition• bridges/structures• soils• environment• Cadastral• Roadside features• signs/ control devices• speed limit/ no passing• intermodal facility• navigational waterways• ports• airports and runways• drainage• weight limits• garages• truck routes• grade• curve • surface/structure
• RR crossing and traffic• clearances/size limits• deer kill
Data: • resources (fuels, materials)• Adopt-a-Highway
• Cartography• Photogrammetry• Videolog• CAD - as builts
crashes = f(land use)
• no. of lanes/ functional class
• road/name/route• shoulder

Functions:• Engineering
– Traffic Engineering– Transportation
Safety• Maintenance• Motor Vehicle
– Driver Services– Motor Carrier
Services• Planning and
Programming– Program
Management– Project Planning– Systems Planning
• Project Development– Bridges and
Structures– Construction– Contracts– Design– Materials– Right of Way
WWW roadway weather conditions• Street Addresses/911• Hydrology• Land cover• Land use• Wells• underground storage tanks• wetlands• driver data• crash (crash, driver/
vehicle, injury)• entrances• reference points• traffic and vehicle
classification• Boundaries
(jurisdiction)• markings and condition• bridges/structures• soils• environment• Cadastral• Roadside features• signs/ control devices• speed limit/ no passing• intermodal facility• navigational waterways• ports• airports and runways• drainage• weight limits• garages• truck routes• grade• curve
• RR crossing and traffic• clearances/size limits• deer kill
Data: • resources (fuels, materials)• Adopt-a-Highway
• Cartography• Photogrammetry• Videolog• CAD - as builts
• no. of lanes/ functional class
• road/name/route• shoulder• surface/structure

Asset ManagementFunctions:• Engineering
– Traffic Engineering
– Transportation Safety
• Maintenance• Motor Vehicle
– Driver Services– Motor Carrier
Services• Planning and
Programming– Program
Management– Project Planning– Systems Planning
• Project Development– Bridges and
Structures– Construction– Contracts– Design– Materials– Right of Way
• Street Addresses/911• Hydrology• Land cover• Land use• Wells• underground storage tanks• wetlands• driver data• crash (crash, driver/
vehicle, injury)• entrances• reference points• traffic and vehicle
classification• Boundaries
(jurisdiction)• markings and condition• bridges/structures• soils• environment• Cadastral• Roadside features• signs/ control devices• speed limit/ no passing• intermodal facility• navigational waterways• ports• airports and runways• drainage• weight limits• garages• truck routes• grade• curve
• RR crossing and traffic• clearances/size limits• deer kill
Data: • resources (fuels, materials)• Adopt-a-Highway
• Cartography• Photogrammetry• Videolog• CAD - as builts
• no. of lanes/ functional class
• road/name/route• shoulder• surface/structure

GIS - Crash Location and AnalysisFunctions:• Engineering
– Traffic Engineering– Transportation
Safety• Maintenance• Motor Vehicle
– Driver Services– Motor Carrier
Services• Planning and
Programming– Program
Management– Project Planning– Systems Planning
• Project Development– Bridges and
Structures– Construction– Contracts– Design– Materials– Right of Way
• Street Addresses/911• Hydrology• Land cover• Land use• Wells• underground storage tanks• wetlands• driver data• crash (crash, driver/
vehicle, injury)• entrances• reference points• traffic and vehicle
classification• Boundaries
(jurisdiction)• markings and condition• bridges/structures• soils• environment• Cadastral• Roadside features• signs/ control devices• speed limit/ no passing• intermodal facility• navigational waterways• ports• airports and runways• drainage• weight limits• garages• truck routes• grade• curve
• RR crossing and traffic• clearances/size limits• deer kill
Data: • resources (fuels, materials)• Adopt-a-Highway
• Cartography• Photogrammetry• Videolog• CAD - as builts
• no. of lanes/ functional class
• road/name/route• shoulder• surface/structure
Team Philosophy• Focus on DOT needs• Develop synergy with other projects
– LRS, pavement management, GIS, crash systems, Asset management/GASB 34
• Build on TRB/Pecora typology/thesis– Applications– Technologies– Issues (cost, accuracy, resolution, temporal …)
• Graduate Education/Extension (Outreach)

From: Cowen, D.J. and J.R. Jensen, People and Pixels, 1998.

Potential for RS Applications in Transportation
1.1 Satellite/Space Based
1.2 Aerial/Airplane Based
1.3 In-situ (Video/Magnetic)
2.1.1 Traffic Counting, Classification & Analysis2.1.2 Observation of Intermodal Behavior2.1.3 Visualization and Exploratory Data Analysis2.2.1 Assessment of Transportation Emissions2.2.2 Relationships between theTransportation Infrastructure and the Environment2.2.3 Corridor Analysis and Planning2.2.4 Assess and Model the Impacts ofClimate Variability and Change on Transportation Networks
2.3.1 Traveler Information Systems2.3.2 Regional Disaster Assessment and Response
2.4.1 Physical Inventory2.4.2 Condition Assessment
2.3 Hazards, Safety, and Disaster Response
2.4 Infrastructure Management
Type of SensingApplications
2.1 Transportation FlowAssessment
2.2 EnvironmentalAssessment
Information Available
Further Researchor Beyond Scope
Information Available for VideoInconsistent for Magnetic
Further Research for VideoInconsistent for Magnetic
Inconsistent

Application n
Low Altitude Aerial Photography
Calib
rate/
Valid
ate
Plann
ing
Mod
els
Issu
es
Time: Considerably faster than performing an O/D study or manual counts. No driver disruption.Cost: For peak hour model, cost of one flight during peak periodAvailability: Off the shelf technology, pictures can be taken every 15 minutesEase of use: photos will need to be manually interpretedAccuracy: Images can be blown up in order to see vehicles, resolution & scale not really a concern for counting vehiclesApplicability: Could have other uses although not corrected for distortions or scaleLabor: Less labor intensive than previous ways
Type o
f Sen
sing
Applic
ation

ISU/CTRE Stakeholders
• Iowa DOT/MTC match @1/3• Local IDOT Steering Committee
– Photogrammetry– GIS Coordinator– Research/Videolog
• Ian MacGillivray– IDOT Research/Engineering Director– Steering Committee– Speaker at DC conf


ISU/CTRE Team• R. Souleyrette, PI
– 12 years (UNLV Nuke Waste/ISU GIS-T)– TRB GIS-T, Iowa DOT GIS
• S. Hallmark, PM– Assistant Professor of Civil Engineering– PhD GaTech– LRS, safety, vehicular dynamics, air quality
• 3 MS students (2 CE, 1 Trans)

ISU/CTRE Projects
1. Access Management
2. Pavement and Marking Condition
3. Infrastructure Point Features/LRS Control

Project #1: Access Management

• Balance access and mobility
• Improve traffic flow and safety
• Local issue … businesses
• Rural issue … safety
Access Management
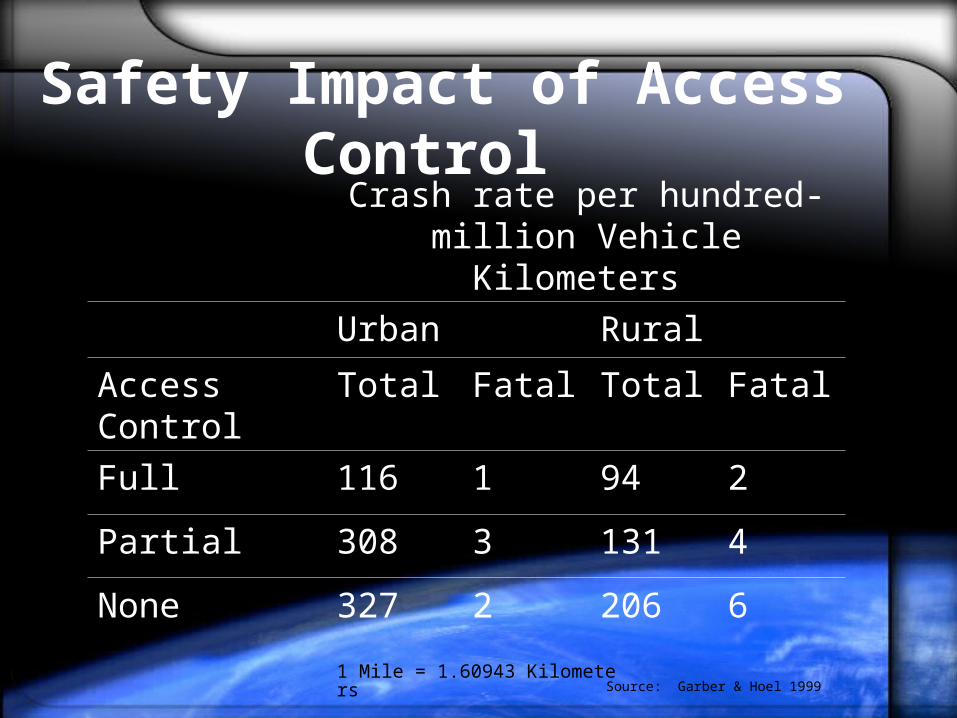
1 Mile = 1.60943 Kilometers
Safety Impact of Access Control Crash rate per hundred-million
Vehicle Kilometers
Urban Rural
Access Control Total Fatal Total Fatal
Full 116 1 94 2
Partial 308 3 131 4
None 327 2 206 6
Source: Garber & Hoel 1999

source: http://www.fhwa.dot.gov/////realestate/am_mich.pdf
The Problem
• US Crash cost $150B+ per year (NHTSA)
• System-wide crash data now available
• No comprehensive inventory available
• On-road data collection is resource intensive

Access Related Data Elements
• Access roads– Presence– Configuration
• Driveways– Number– Dimensions– Frequency– Continuity– Vertical grade
• Medians– Type– Length
• Turn lanes– Length– Material
• Intersections– Proximity– Frequency

The Opportunity
• Correlate access w/crash history
• Determine relationships
• Identify hot spots
• Identify system deficiencies

Research Approach• Identify features of interest• Collect ground truth• Extract features from imagery (quantitative)• Estimate quality of access (qualitative)• Correlate measures with crash rates• Determine quality of data required to support
analysis• Work with partners on machine-assisted extraction

Sample Imagery

Project #2: Pavement and Marking Condition

Pavement Condition - The Problem
• Pavement/shoulder type– Inventory element– Safety concern
• Pavement condition assessment– Input to pavement management system– Requires field data collection
• Pavement condition analysis – Visual inspection/expert judgment is subjective– PMIS data collection is expensive

Research Approach: Pavement Condition Evaluation
• Identify measures obtainable from imagery– Cracks (by type)
– Pavement type
– Rutting (LIDAR?)
• Validate (IPMP Roadware Van)• Benefit-cost analysis

Pavement Markings - The Problem• Pavement markings
– Wear out variably– Replaced on regular basis, or on “complaint”
• Marking program not directly dependent on condition– Remaining life is unknown– Maintenance expense

Research Approach - Pavement Marking Condition
• Evaluate spatial, spectral, temporal and radiometric requirements– Current marking visibility– Retro-reflectivity (surrogate measures?)– Remaining life
• Buffer vectors to reduce computational requirements of hyperspectral (subpixel analysis)
• Test available data and specify requirements• Evaluate benefit of a systematic method
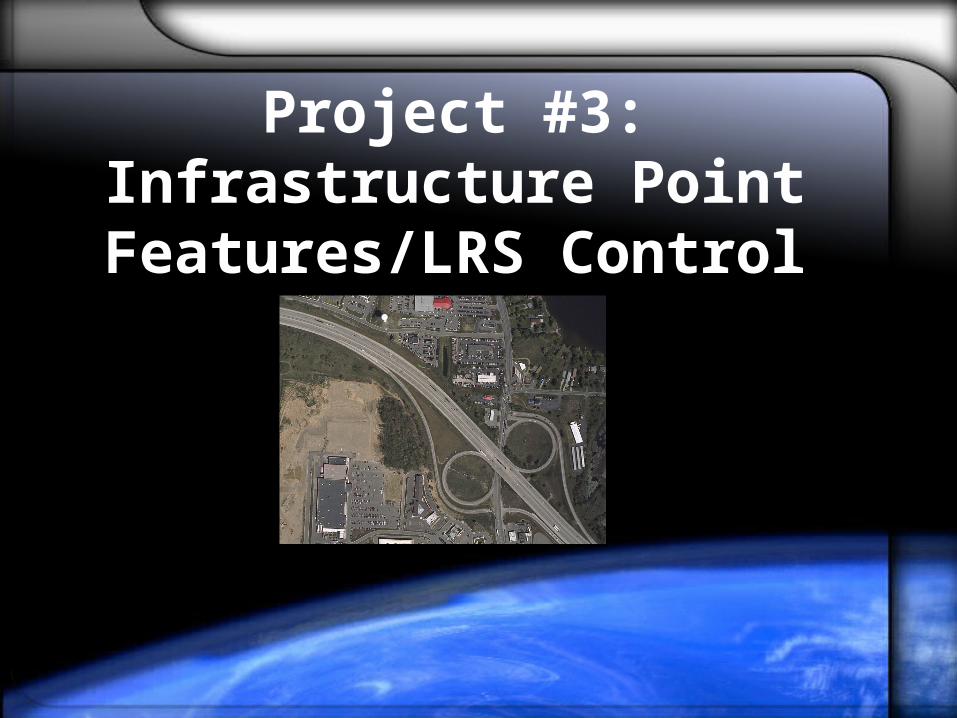
Project #3: Infrastructure Point Features/LRS Control
The Problem/Opportunity
• DOTs have huge spatial datasets and many LRMs• NCHRP 20-27 LRS model (Vonderohe/Adams)
– LRS relates methods
– Iowa is early implementer
• Inventory of large systems is expensive– 110,000 miles of road in Iowa

Iowa DOT LRS
• LRS datum = anchor points and anchor sections
• Control located using highly accurate methods (RTK GPS, etc.)
• Pilot did not test satellite imagery
from anchor pointto anchor point
L1 @195 m
L1 @353 m
L1 @604 m
L1 @781 m
L1 @908 m
anchor section = 1164 m

Point Infrastructure Elements• Pixel
– Roadway intersection
– Bridge abutments – Drainage structures– Railroad crossings– Ramp gore point
• Sub-pixel?– Signs– Mileposts– Utility access covers– Telephone poles

Approach• Evaluate ability to extract features based on resolution
w/partner institutions– pixel/sub-pixel– image interpretation/machine assisted
• Collect validation data (GPS)• Statistical comparison RS vs.GPS• Define resolution (SSTR) requirements• Benefit/cost analysis
60'
36'
Road Segment

Potential Future Projects• Linear, areal and temporal features• Intersection sight distance• Elderly driver issues• Vegetation growth• Snow drifting/hydrology• Parking Inventory

Questions/Suggestions?