Embed Size (px)
Citation preview
INVESTOR PRESENTATION
FOURTH QUARTER 2019
DISCLAIMERThis material is being furnished to you solely for your information on a confidentialbasis and may not be reproduced, redistributed or passed on, in whole or in part, toany other person. The information contained in this material is subject to changeswithout notice and past performance is not indicative of future results.
This presentation may contain certain “forward-looking statements” relating to GBAuto S.A.E. (the “Company”). These may be identified in part through the use offorward-looking terminology such as “will,” “planned,” “expectations” and“forecast” as well as similar explanations or qualifiers and by discussions of strategy,plans or intentions. These statements may include descriptions of investmentsplanned or currently under consideration or development by the Company and theanticipated impact of these investments. Any such statements reflect the currentviews of the Company with respect to future events and are subject to certain risks,uncertainties and assumptions. Many factors could cause the actual results,performance, decisions or achievements of the Company to be materially differentfrom any future results that may be expressed or implied by such forward-lookingstatements. Such forward-looking statements speak only as of the date on whichthey are made. The Company does not undertake any obligation to update or reviseany forward-looking statement, whether as a result of new information, futureevents or otherwise.
This material is presented solely for information purposes and is not to be construedas a solicitation, inducement or an offer to buy, subscribe for or sell any securities orrelated financial instruments and should not be treated as giving investment, legal,accounting, regulatory, taxation, or other advice. It has no regard to the specificinvestment objectives, financial situation or particular needs of any recipient. Norepresentation or warranty, either express or implied, is provided in relation to theaccuracy, completeness or reliability of the information contained herein. None ofthe Company, its affiliates, advisers or representatives shall have any liability
whatsoever (in negligence or otherwise) for any loss howsoever arising from any useof this material or otherwise arising in connection with this material. This documentis for information purposes only and is neither an advertisement nor a prospectus.
In the United Kingdom this material is only being distributed to, and is only directedat (a) investment professionals falling within Article 19(5) of the Financial Servicesand Markets Act 2000 (Financial Promotion) Order 2005 (as amended) (the“Financial Promotion Order”) and (b) high net worth companies and other personsfalling within Article 49(2)(a) to (d) of the Financial Promotion Order (all suchpersons together being referred to as “relevant persons”). Any person in the UnitedKingdom that is not a relevant person must not act or rely on this material. Anyinvestment or investment activity to which this material relates is available in theUnited Kingdom only to relevant persons, and will be engaged in only with suchpersons.
Neither this document nor any copy thereof may be taken or transmitted ordistributed, directly or indirectly, into the United States or to a U.S. Person (asdefined in Rule 902 of Regulation S under the U.S. Securities Act of 1933, asamended (the “Securities Act”)), other than to qualified institutional buyers asdefined in Rule 144A under the Securities Act. The distribution of this document inother jurisdictions may be restricted by law and persons into whose possession thisdocument comes should inform themselves about, and observe, any suchrestriction. Any failure to comply with these restrictions may constitute a violationof the laws of any such other jurisdiction.
By attending this presentation, you are agreeing to be bound by the foregoinglimitations. Any failure to comply with these restrictions may constitute a violationof applicable securities laws.
2

OUTLINE
GB Auto Overview04
GB Auto & Auto Related10
GB Capital23
Consolidated Financial Performance26
Key Corporate and Shareholder Information29
GB Auto Overview
GB Auto & Auto Related
GB Capital
Consolidated Financial Performance
Key Corporate and Shareholder Information
04
10
23
26
29
I. GROUP OVERVIEW
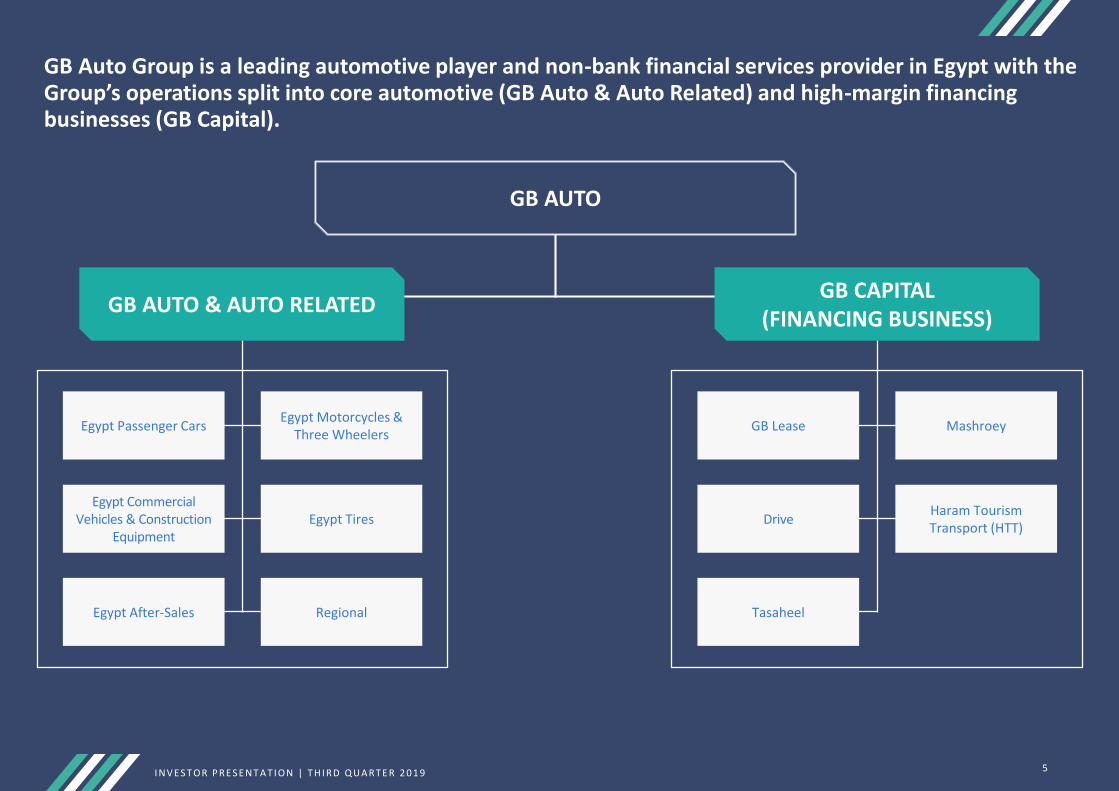
GB Auto Group is a leading automotive player and non-bank financial services provider in Egypt with the Group’s operations split into core automotive (GB Auto & Auto Related) and high-margin financing businesses (GB Capital).
Egypt Passenger Cars
Egypt Commercial Vehicles & Construction
Equipment
Egypt After-Sales
Egypt Motorcycles & Three Wheelers
Egypt Tires
Regional
GB Lease
Drive
Tasaheel
Mashroey
Haram Tourism Transport (HTT)
GB AUTO
GB AUTO & AUTO RELATEDGB CAPITAL
(FINANCING BUSINESS)
I N V E S T OR P RE S E N T A T I ON | T H I RD Q U A RT E R 2 0 1 9 5
Egypt Passenger CarsEgypt Motorcycles & Three
WheelersEgypt CV&CE Egypt Tires Egypt After-Sales Regional
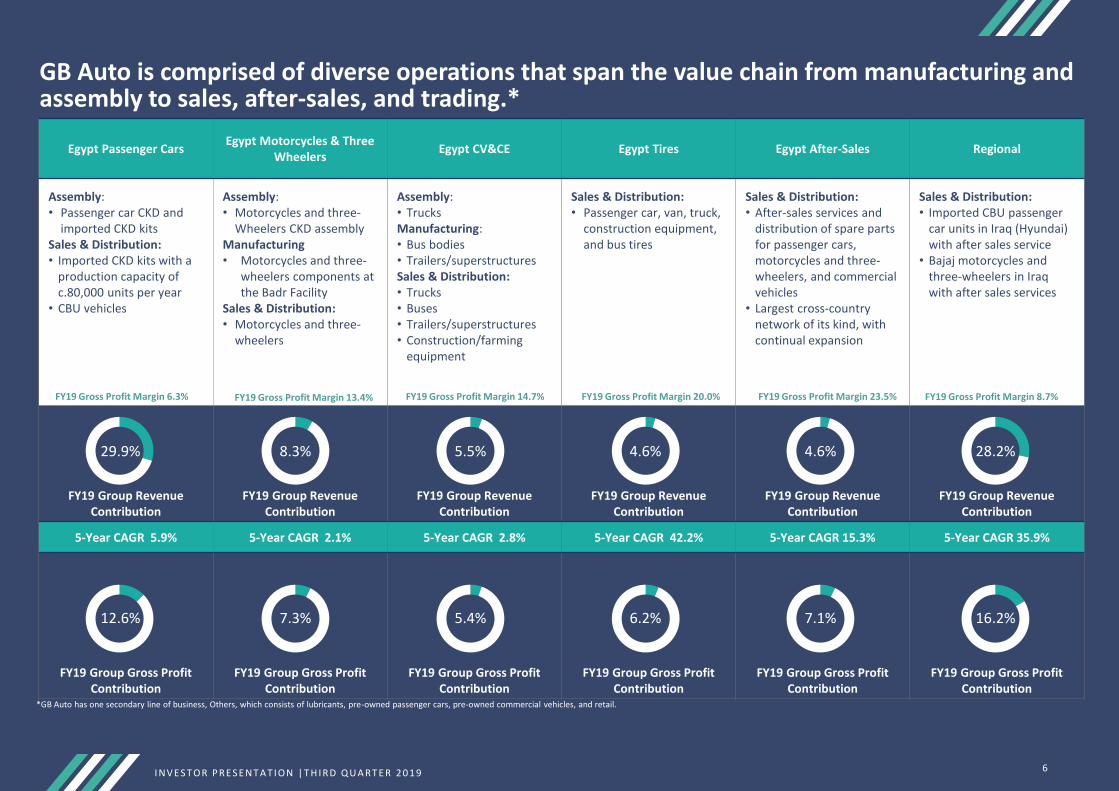
Assembly:• Passenger car CKD and
imported CKD kitsSales & Distribution:• Imported CKD kits with a
production capacity of c.80,000 units per year
• CBU vehicles
Assembly:• Motorcycles and three-
Wheelers CKD assemblyManufacturing• Motorcycles and three-
wheelers components at the Badr Facility
Sales & Distribution:• Motorcycles and three-
wheelers
Assembly:• TrucksManufacturing:• Bus bodies• Trailers/superstructures Sales & Distribution:• Trucks• Buses• Trailers/superstructures • Construction/farming
equipment
Sales & Distribution:• Passenger car, van, truck,
construction equipment, and bus tires
Sales & Distribution:• After-sales services and
distribution of spare parts for passenger cars, motorcycles and three-wheelers, and commercial vehicles
• Largest cross-country network of its kind, with continual expansion
Sales & Distribution:• Imported CBU passenger
car units in Iraq (Hyundai) with after sales service
• Bajaj motorcycles and three-wheelers in Iraq with after sales services
FY19 Group Revenue Contribution
FY19 Group Revenue Contribution
FY19 Group Revenue Contribution
FY19 Group Revenue Contribution
FY19 Group Revenue Contribution
FY19 Group Revenue Contribution
5-Year CAGR 5.9% 5-Year CAGR 2.1% 5-Year CAGR 2.8% 5-Year CAGR 42.2% 5-Year CAGR 15.3% 5-Year CAGR 35.9%
FY19 Group Gross Profit Contribution
FY19 Group Gross Profit Contribution
FY19 Group Gross Profit Contribution
FY19 Group Gross Profit Contribution
FY19 Group Gross Profit Contribution
FY19 Group Gross Profit Contribution
GB Auto is comprised of diverse operations that span the value chain from manufacturing and assembly to sales, after-sales, and trading.*
29.9% 8.3% 5.5% 4.6% 4.6% 28.2%
12.6% 7.3% 5.4% 6.2% 7.1% 16.2%
*GB Auto has one secondary line of business, Others, which consists of lubricants, pre-owned passenger cars, pre-owned commercial vehicles, and retail.
I N V E S T OR P RE S E N T A T I ON | T H I RD Q U A RT E R 2 0 1 9
FY19 Gross Profit Margin 8.7%FY19 Gross Profit Margin 23.5%FY19 Gross Profit Margin 20.0%FY19 Gross Profit Margin 14.7%FY19 Gross Profit Margin 13.4%FY19 Gross Profit Margin 6.3%
6
I N V E S T OR P RE S E N T A T I ON | F OU RT H Q U A RT E R 2 0 1 9 7
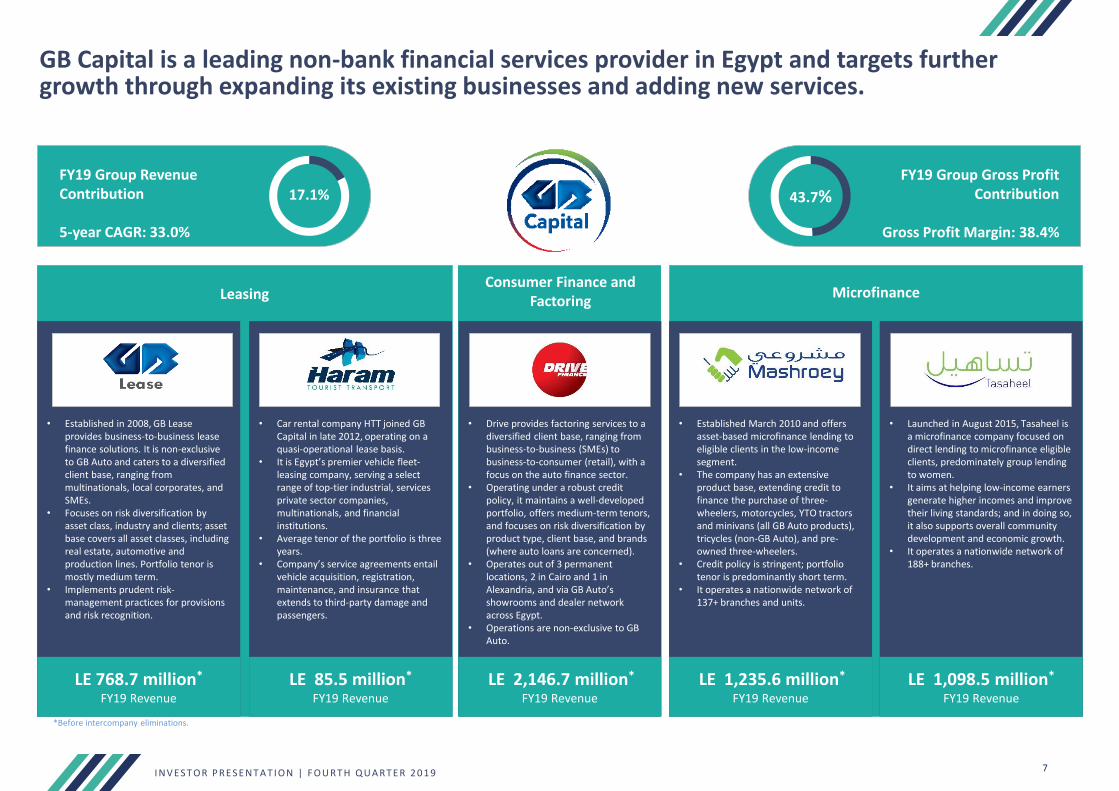
GB Capital is a leading non-bank financial services provider in Egypt and targets further growth through expanding its existing businesses and adding new services.
*After intercompany eliminations.
FY19 Group Gross Profit Contribution
Gross Profit Margin: 38.4%
43.7%FY19 Group Revenue Contribution
5-year CAGR: 33.0%
17.1%
• Established in 2008, GB Lease provides business-to-business lease finance solutions. It is non-exclusive to GB Auto and caters to a diversified client base, ranging from multinationals, local corporates, and SMEs.
• Focuses on risk diversification by asset class, industry and clients; asset base covers all asset classes, including real estate, automotive and production lines. Portfolio tenor is mostly medium term.
• Implements prudent risk-management practices for provisions and risk recognition.
• Established March 2010 and offers asset-based microfinance lending to eligible clients in the low-income segment.
• The company has an extensive product base, extending credit to finance the purchase of three-wheelers, motorcycles, YTO tractors and minivans (all GB Auto products), tricycles (non-GB Auto), and pre-owned three-wheelers.
• Credit policy is stringent; portfolio tenor is predominantly short term.
• It operates a nationwide network of 137+ branches and units.
• Drive provides factoring services to a diversified client base, ranging from business-to-business (SMEs) to business-to-consumer (retail), with a focus on the auto finance sector.
• Operating under a robust credit policy, it maintains a well-developed portfolio, offers medium-term tenors, and focuses on risk diversification by product type, client base, and brands (where auto loans are concerned).
• Operates out of 3 permanent locations, 2 in Cairo and 1 in Alexandria, and via GB Auto’s showrooms and dealer network across Egypt.
• Operations are non-exclusive to GB Auto.
• Car rental company HTT joined GB Capital in late 2012, operating on a quasi-operational lease basis.
• It is Egypt’s premier vehicle fleet-leasing company, serving a select range of top-tier industrial, services private sector companies, multinationals, and financial institutions.
• Average tenor of the portfolio is three years.
• Company’s service agreements entail vehicle acquisition, registration, maintenance, and insurance that extends to third-party damage and passengers.
• Launched in August 2015, Tasaheel is a microfinance company focused on direct lending to microfinance eligible clients, predominately group lending to women.
• It aims at helping low-income earners generate higher incomes and improve their living standards; and in doing so, it also supports overall community development and economic growth.
• It operates a nationwide network of 188+ branches.
LE 768.7 million*
FY19 Revenue
LE 1,235.6 million*
FY19 Revenue
LE 2,146.7 million*
FY19 Revenue
LE 85.5 million*
FY19 Revenue
LE 1,098.5 million*
FY19 Revenue
*Before intercompany eliminations.
LeasingConsumer Finance and
FactoringMicrofinance

8
EGYPT
Passenger Cars
Commercial Vehicles & Construction Equipment
Motorcycles & Three-Wheelers
Tires
Others
The Group has an established regional footprint with a strong portfolio of top global brands.
GB CAPITAL
IRAQ
Passenger Cars
Motorcycles & Three-Wheelers
I N V E S T OR P RE S E N T A T I ON | T H I RD Q U A RT E R 2 0 1 9
I N V E S T OR P RE S E N T A T I ON | F OU RT H Q U A RT E R 2 0 1 9 9
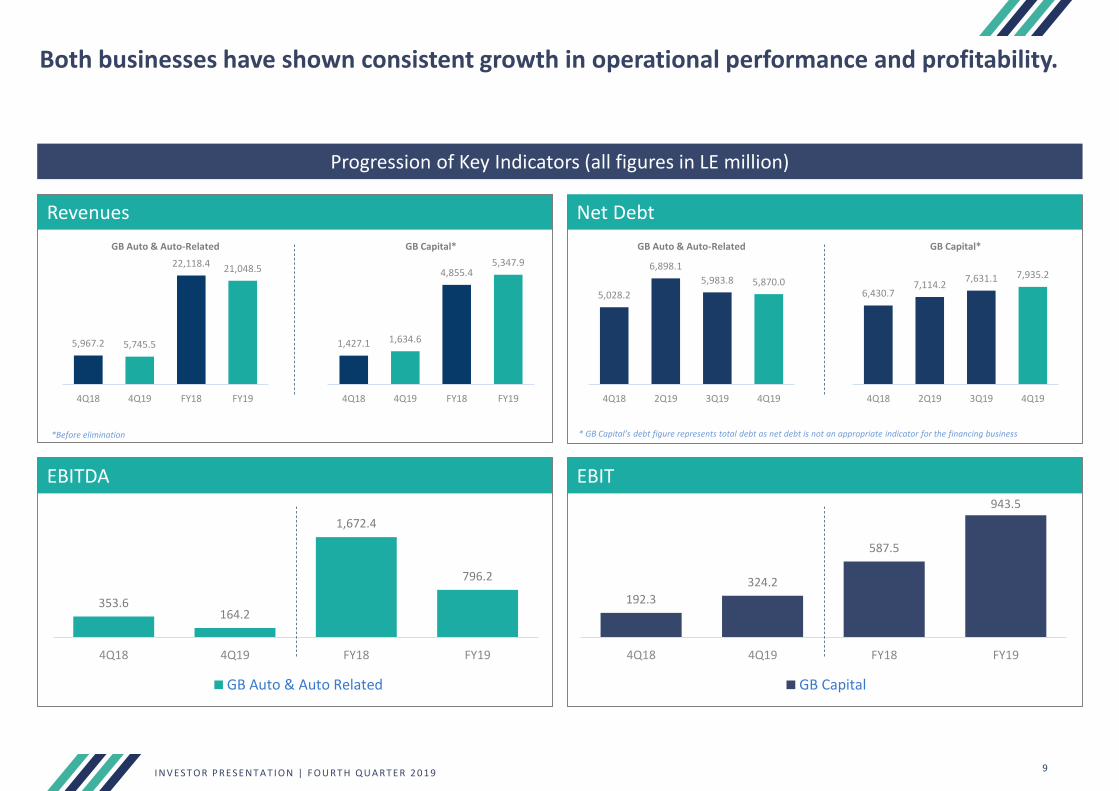
Both businesses have shown consistent growth in operational performance and profitability.
Progression of Key Indicators (all figures in LE million)
Revenues
EBITDA EBIT
353.6164.2
1,672.4
796.2
4Q18 4Q19 FY18 FY19
GB Auto & Auto Related
*Before elimination * GB Capital’s debt figure represents total debt as net debt is not an appropriate indicator for the financing business
192.3
324.2
587.5
943.5
4Q18 4Q19 FY18 FY19
GB Capital
Net Debt
5,967.2 5,745.5
22,118.4 21,048.5
4Q18 4Q19 FY18 FY19
GB Auto & Auto-Related
1,427.1 1,634.6
4,855.45,347.9
4Q18 4Q19 FY18 FY19
GB Capital*
5,028.2
6,898.1
5,983.8 5,870.0
4Q18 2Q19 3Q19 4Q19
GB Auto & Auto-Related
6,430.77,114.2
7,631.1 7,935.2
4Q18 2Q19 3Q19 4Q19
GB Capital*

II. GB AUTO & AUTO RELATED
I N V E S T OR P RE S E N T A T I ON | F OU RT H Q U A RT E R 2 0 1 9 11
19
2,8
48
13
3,1
65
14
4,2
04
13
3,7
60
20
7,9
73
19
5,5
59
14
1,9
83
99
,53
0
14
5,8
86
12
7,4
43
FY10 FY11 FY12 FY13 FY14 FY15 FY16 FY17 FY18 FY19
COUNTRY GDP PER CAPITA (USD)**
Libya 290 7,235
Jordan 165 4,248
Turkey 140 9,311
Algeria 114 4,279
Iraq 77 5,878
Egypt 45* 2,549
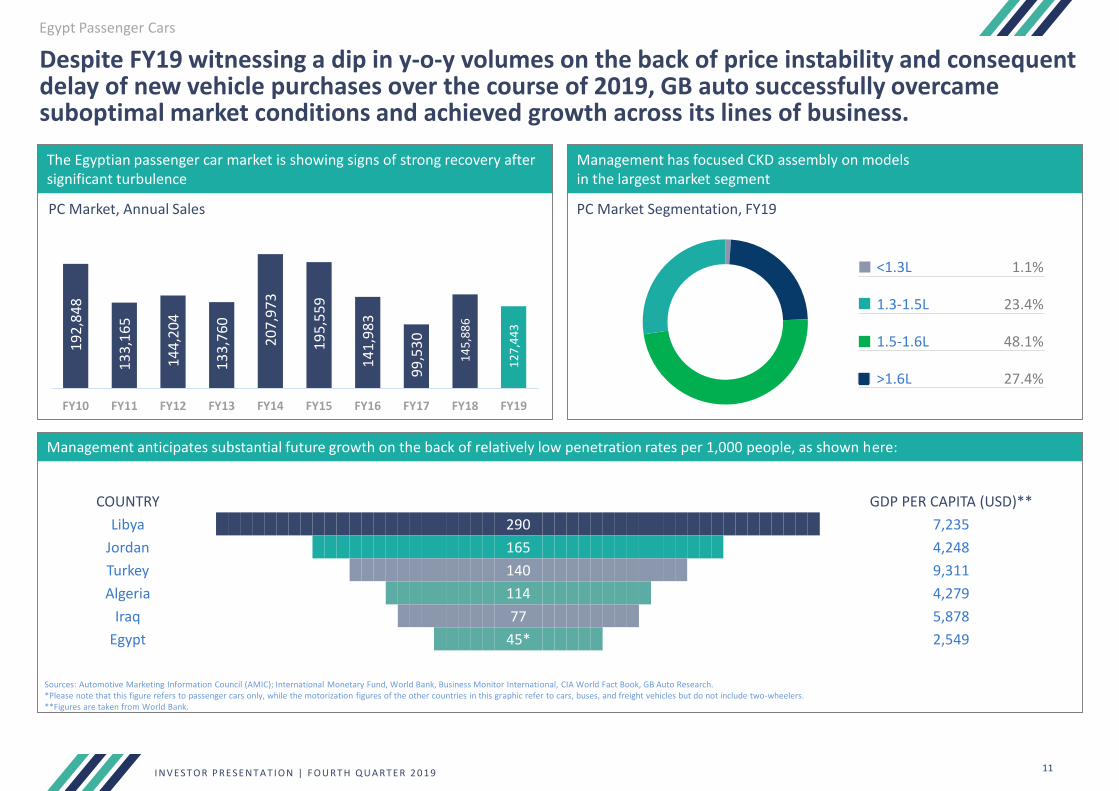
Despite FY19 witnessing a dip in y-o-y volumes on the back of price instability and consequent delay of new vehicle purchases over the course of 2019, GB auto successfully overcame suboptimal market conditions and achieved growth across its lines of business.
The Egyptian passenger car market is showing signs of strong recovery after significant turbulence
Management has focused CKD assembly on models in the largest market segment
PC Market, Annual Sales PC Market Segmentation, FY19
◼ <1.3L 1.1%
◼ 1.3-1.5L 23.4%
◼ 1.5-1.6L 48.1%
◼ >1.6L 27.4%
Management anticipates substantial future growth on the back of relatively low penetration rates per 1,000 people, as shown here:
Sources: Automotive Marketing Information Council (AMIC); International Monetary Fund, World Bank, Business Monitor International, CIA World Fact Book, GB Auto Research.*Please note that this figure refers to passenger cars only, while the motorization figures of the other countries in this graphic refer to cars, buses, and freight vehicles but do not include two-wheelers.**Figures are taken from World Bank.
Egypt Passenger Cars
I N V E S T OR P RE S E N T A T I ON | F OU RT H Q U A RT E R 2 0 1 9 12
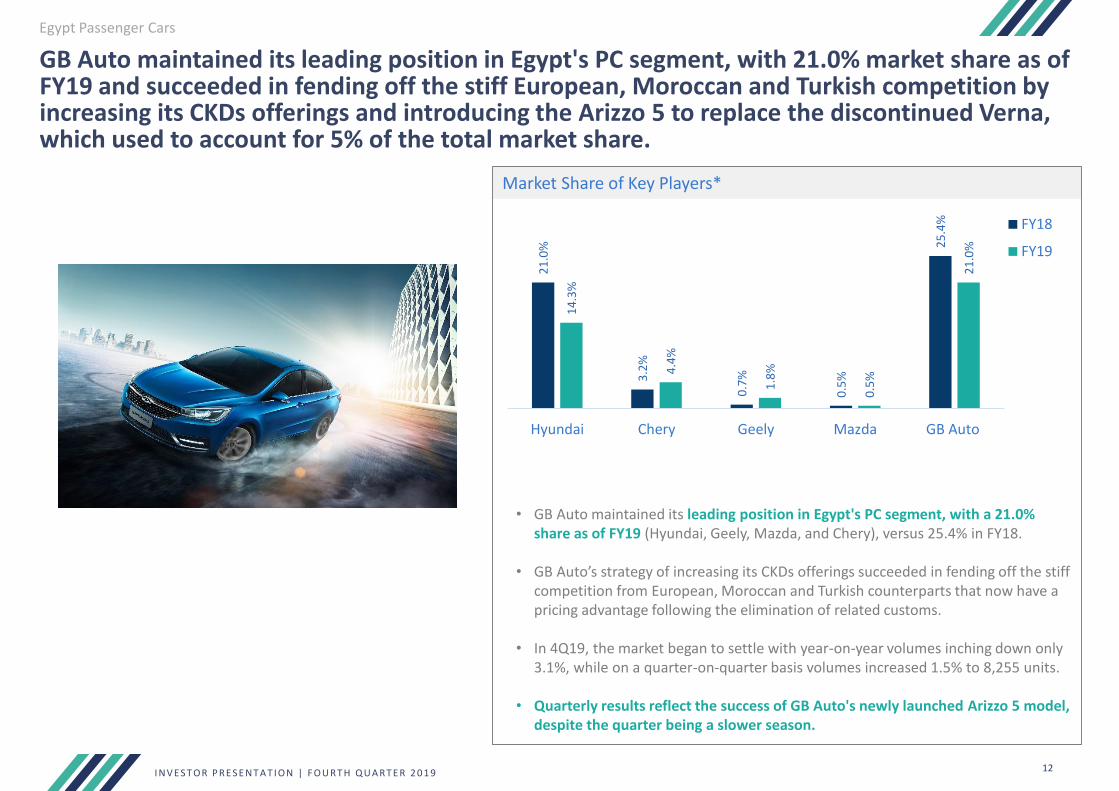
GB Auto maintained its leading position in Egypt's PC segment, with 21.0% market share as of FY19 and succeeded in fending off the stiff European, Moroccan and Turkish competition by increasing its CKDs offerings and introducing the Arizzo 5 to replace the discontinued Verna, which used to account for 5% of the total market share.
Egypt Passenger Cars
• GB Auto maintained its leading position in Egypt's PC segment, with a 21.0% share as of FY19 (Hyundai, Geely, Mazda, and Chery), versus 25.4% in FY18.
• GB Auto’s strategy of increasing its CKDs offerings succeeded in fending off the stiff competition from European, Moroccan and Turkish counterparts that now have a pricing advantage following the elimination of related customs.
• In 4Q19, the market began to settle with year-on-year volumes inching down only 3.1%, while on a quarter-on-quarter basis volumes increased 1.5% to 8,255 units.
• Quarterly results reflect the success of GB Auto's newly launched Arizzo 5 model, despite the quarter being a slower season.
Location of GB Auto Distribution and After-Sales Facilities
Market Share of Key Players*
21
.0%
3.2
%
0.7
%
0.5
%
25
.4%
14
.3%
4.4
%
1.8
%
0.5
%
21
.0%
Hyundai Chery Geely Mazda GB Auto
FY18
FY19
I N V E S T OR P RE S E N T A T I ON | F OU RT H Q U A RT E R 2 0 1 9 13
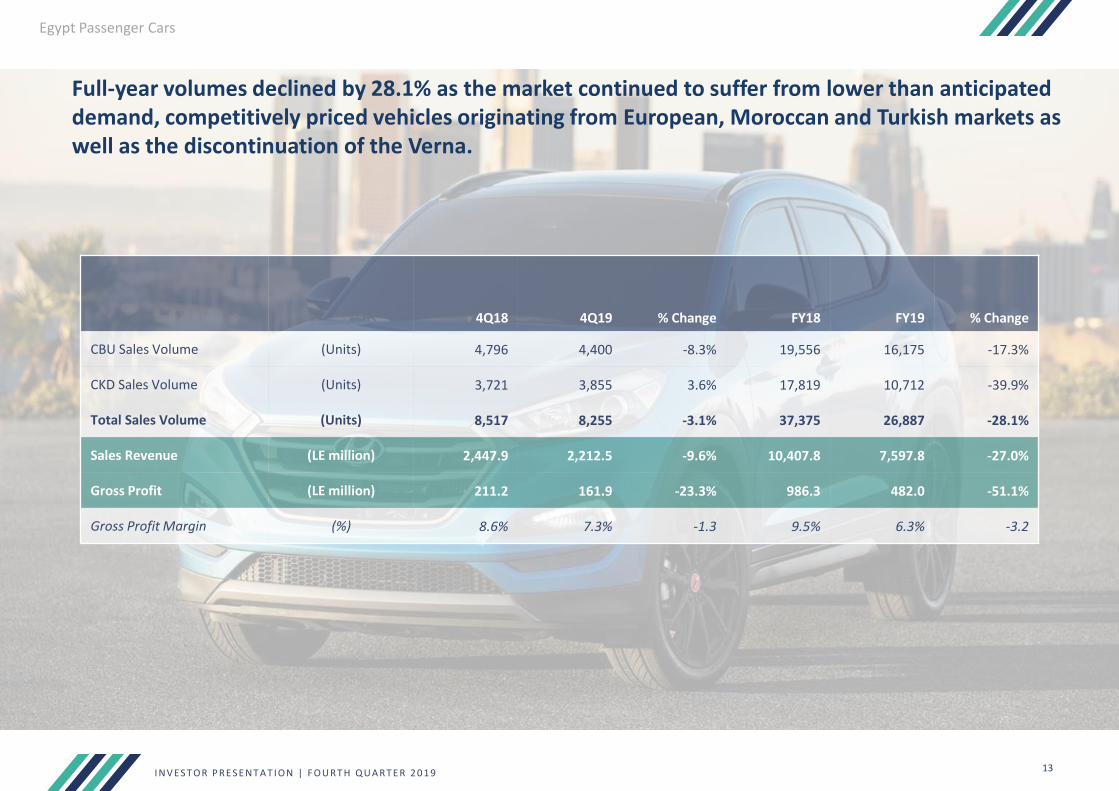
4Q18 4Q19 % Change FY18 FY19 % Change
CBU Sales Volume (Units) 4,796 4,400 -8.3% 19,556 16,175 -17.3%
CKD Sales Volume (Units) 3,721 3,855 3.6% 17,819 10,712 -39.9%
Total Sales Volume (Units) 8,517 8,255 -3.1% 37,375 26,887 -28.1%
Sales Revenue (LE million) 2,447.9 2,212.5 -9.6% 10,407.8 7,597.8 -27.0%
Gross Profit (LE million) 211.2 161.9 -23.3% 986.3 482.0 -51.1%
Gross Profit Margin (%) 8.6% 7.3% -1.3 9.5% 6.3% -3.2
Egypt Passenger Cars
Full-year volumes declined by 28.1% as the market continued to suffer from lower than anticipated demand, competitively priced vehicles originating from European, Moroccan and Turkish markets as well as the discontinuation of the Verna.
I N V E S T OR P RE S E N T A T I ON | F OU RT H Q U A RT E R 2 0 1 9 14
Egypt Motorcycles & Three-Wheelers
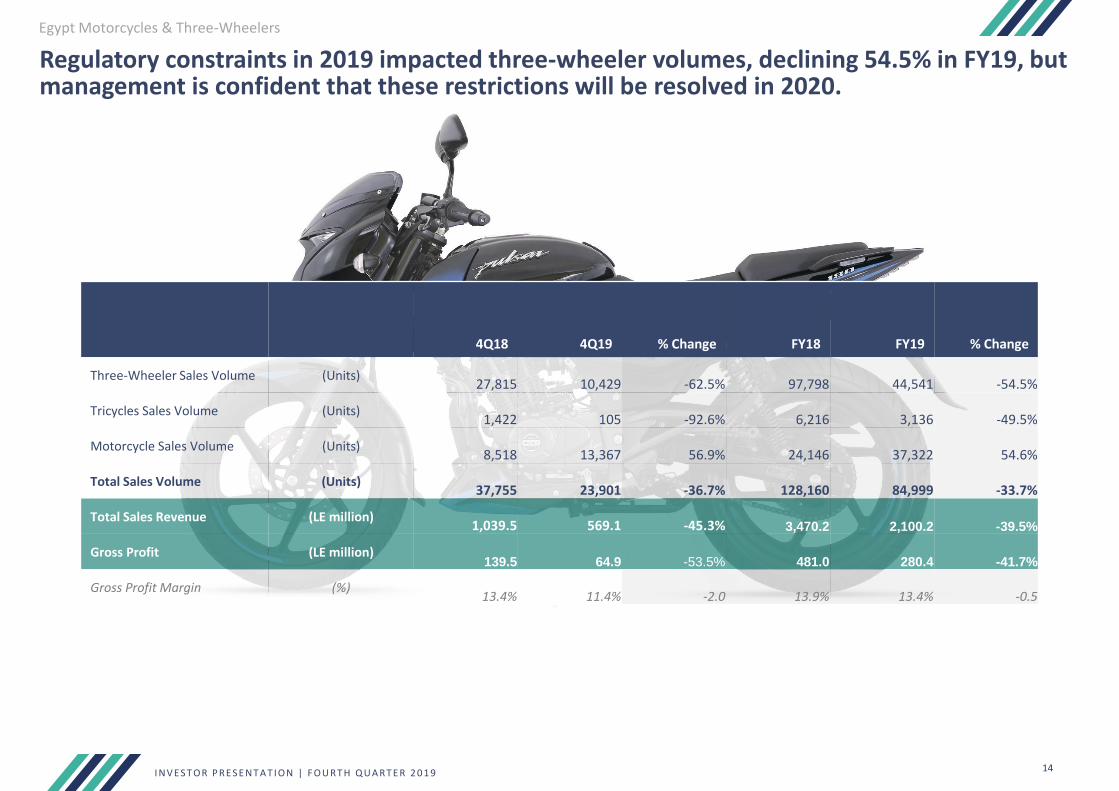
Regulatory constraints in 2019 impacted three-wheeler volumes, declining 54.5% in FY19, but management is confident that these restrictions will be resolved in 2020.
4Q18 4Q19 % Change FY18 FY19 % Change
Three-Wheeler Sales Volume (Units)27,815 10,429 -62.5% 97,798 44,541 -54.5%
Tricycles Sales Volume (Units)1,422 105 -92.6% 6,216 3,136 -49.5%
Motorcycle Sales Volume (Units)8,518 13,367 56.9% 24,146 37,322 54.6%
Total Sales Volume (Units)37,755 23,901 -36.7% 128,160 84,999 -33.7%
Total Sales Revenue (LE million)1,039.5 569.1 -45.3% 3,470.2 2,100.2 -39.5%
Gross Profit (LE million)139.5 64.9 -53.5% 481.0 280.4 -41.7%
Gross Profit Margin (%)13.4% 11.4% -2.0 13.9% 13.4% -0.5
I N V E S T OR P RE S E N T A T I ON | F OU RT H Q U A RT E R 2 0 1 9 15
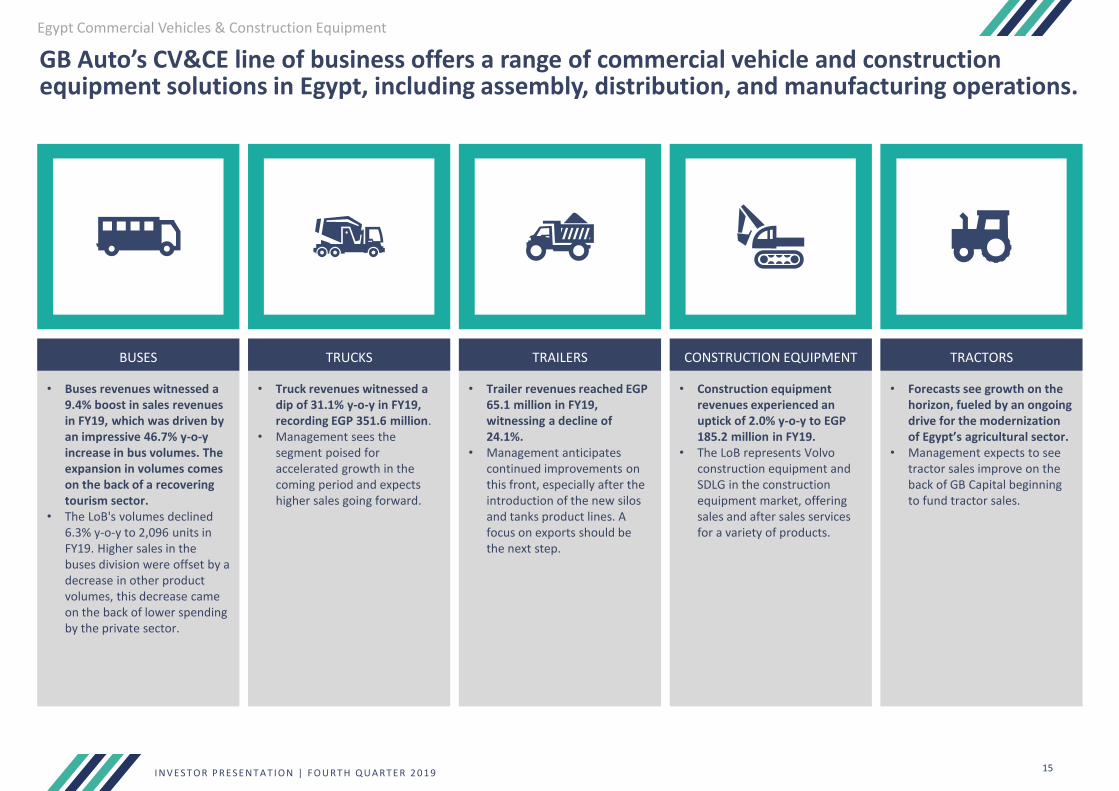
GB Auto’s CV&CE line of business offers a range of commercial vehicle and construction equipment solutions in Egypt, including assembly, distribution, and manufacturing operations.
Egypt Commercial Vehicles & Construction Equipment
• Buses revenues witnessed a 9.4% boost in sales revenues in FY19, which was driven by an impressive 46.7% y-o-y increase in bus volumes. The expansion in volumes comes on the back of a recovering tourism sector.
• The LoB's volumes declined 6.3% y-o-y to 2,096 units in FY19. Higher sales in the buses division were offset by a decrease in other product volumes, this decrease came on the back of lower spending by the private sector.
• Truck revenues witnessed a dip of 31.1% y-o-y in FY19, recording EGP 351.6 million.
• Management sees the segment poised for accelerated growth in the coming period and expects higher sales going forward.
• Trailer revenues reached EGP 65.1 million in FY19, witnessing a decline of 24.1%.
• Management anticipates continued improvements on this front, especially after the introduction of the new silos and tanks product lines. A focus on exports should be the next step.
• Construction equipment revenues experienced an uptick of 2.0% y-o-y to EGP 185.2 million in FY19.
• The LoB represents Volvo construction equipment and SDLG in the construction equipment market, offering sales and after sales services for a variety of products.
• Forecasts see growth on the horizon, fueled by an ongoing drive for the modernization of Egypt’s agricultural sector.
• Management expects to see tractor sales improve on the back of GB Capital beginning to fund tractor sales.
BUSES TRUCKS TRAILERS CONSTRUCTION EQUIPMENT TRACTORS

I N V E S T OR P RE S E N T A T I ON | F OU RT H Q U A RT E R 2 0 1 9 16
Management is focusing on sales that have smoother conversion cycles and higher margins to drive growth in the LoB and streamline the A&AR segment’s cash flow cycle.
Egypt Commercial Vehicles & Construction Equipment
4Q18 4Q19 % Change FY18 FY19 % Change
Bus Sales Volume (Units)207 289 39.6% 763 1,119 46.7%
Truck Sales Volume (Units)229 154 -32.7% 998 646 -35.3%
Tractor Sales Volume (Units)34 0 - 78 38 -51.3%
Trailer Sales Volume (Units)51 -15 - 254 168 -33.9%
Construction Equipment Sales Volume
(Units)49 42 -14.3% 145 125 -13.8%
Total Sales Volume (Units)570 470 -17.5% 2,238 2,096 -6.3%
Sales Revenue (LE million)446.5 288.5 -35.4% 1,507.1 1,394.6 -7.5%
Gross Profit (LE million)24.3 40.9 68.2% 161.9 205.0 26.6%
Gross Profit Margin (%)5.4% 14.2% 8.8 10.7% 14.7% 4.0
I N V E S T OR P RE S E N T A T I ON | F OU RT H Q U A RT E R 2 0 1 9 17
Commercial Vehicles & Construction Equipment
Motorcycles & Three-Wheelers
Passenger Cars
Egypt After-Sales 5-Year Revenues Progression(all figures in LE million)
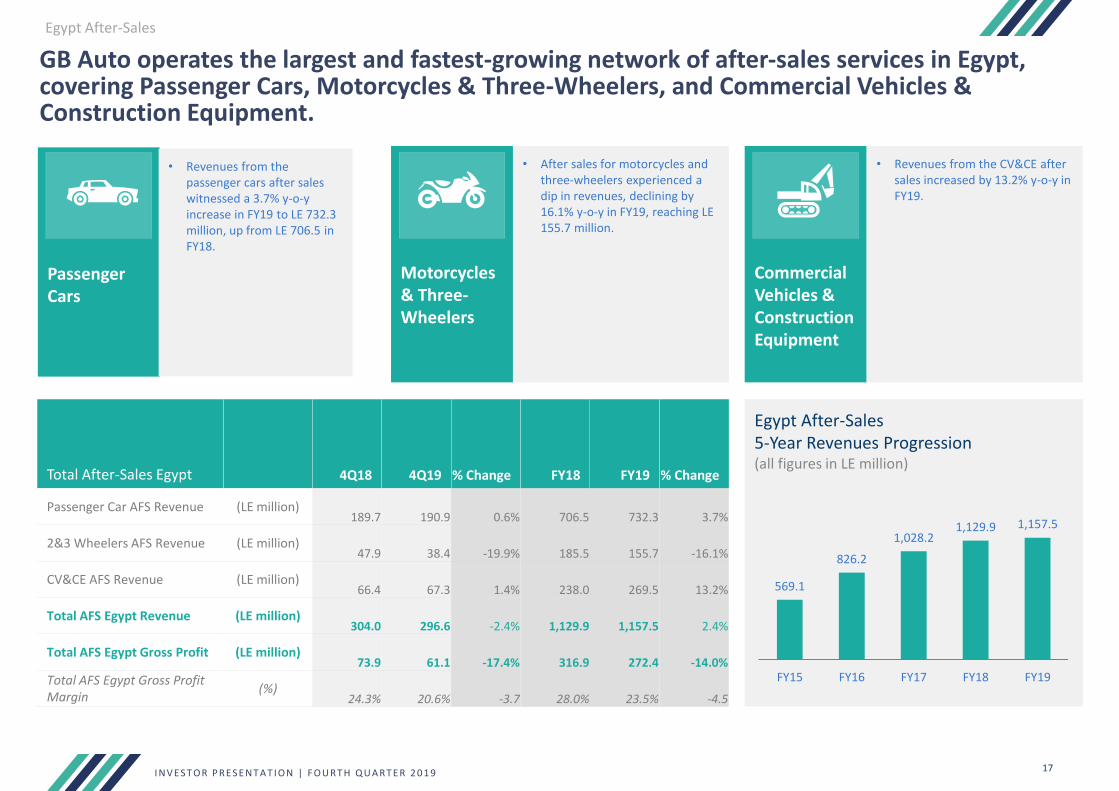
GB Auto operates the largest and fastest-growing network of after-sales services in Egypt, covering Passenger Cars, Motorcycles & Three-Wheelers, and Commercial Vehicles & Construction Equipment.
Egypt After-Sales
569.1
826.2
1,028.21,129.9 1,157.5
FY15 FY16 FY17 FY18 FY19
Total After-Sales Egypt 4Q18 4Q19 % Change FY18 FY19 % Change
Passenger Car AFS Revenue (LE million)189.7 190.9 0.6% 706.5 732.3 3.7%
2&3 Wheelers AFS Revenue (LE million)47.9 38.4 -19.9% 185.5 155.7 -16.1%
CV&CE AFS Revenue (LE million)66.4 67.3 1.4% 238.0 269.5 13.2%
Total AFS Egypt Revenue (LE million)304.0 296.6 -2.4% 1,129.9 1,157.5 2.4%
Total AFS Egypt Gross Profit (LE million)73.9 61.1 -17.4% 316.9 272.4 -14.0%
Total AFS Egypt Gross Profit Margin
(%)24.3% 20.6% -3.7 28.0% 23.5% -4.5
• Revenues from the passenger cars after sales witnessed a 3.7% y-o-y increase in FY19 to LE 732.3 million, up from LE 706.5 in FY18.
• After sales for motorcycles and three-wheelers experienced a dip in revenues, declining by 16.1% y-o-y in FY19, reaching LE 155.7 million.
• Revenues from the CV&CE after sales increased by 13.2% y-o-y in FY19.

I N V E S T OR P RE S E N T A T I ON | F OU RT H Q U A RT E R 2 0 1 9 18
Location of GB Auto’s After-Sales Facilities.
PASSENGER CARS
2 & 3 WHEELERS
50
25
13 Commercial Vehicles
SALES OR SERVICE OR SPARE PARTS CENTER
SALES & SPARE PARTS CENTER
SALES, SERVICES & SPARE PARTS CENTER
I N V E S T OR P RE S E N T A T I ON | F OU RT H Q U A RT E R 2 0 1 9 19
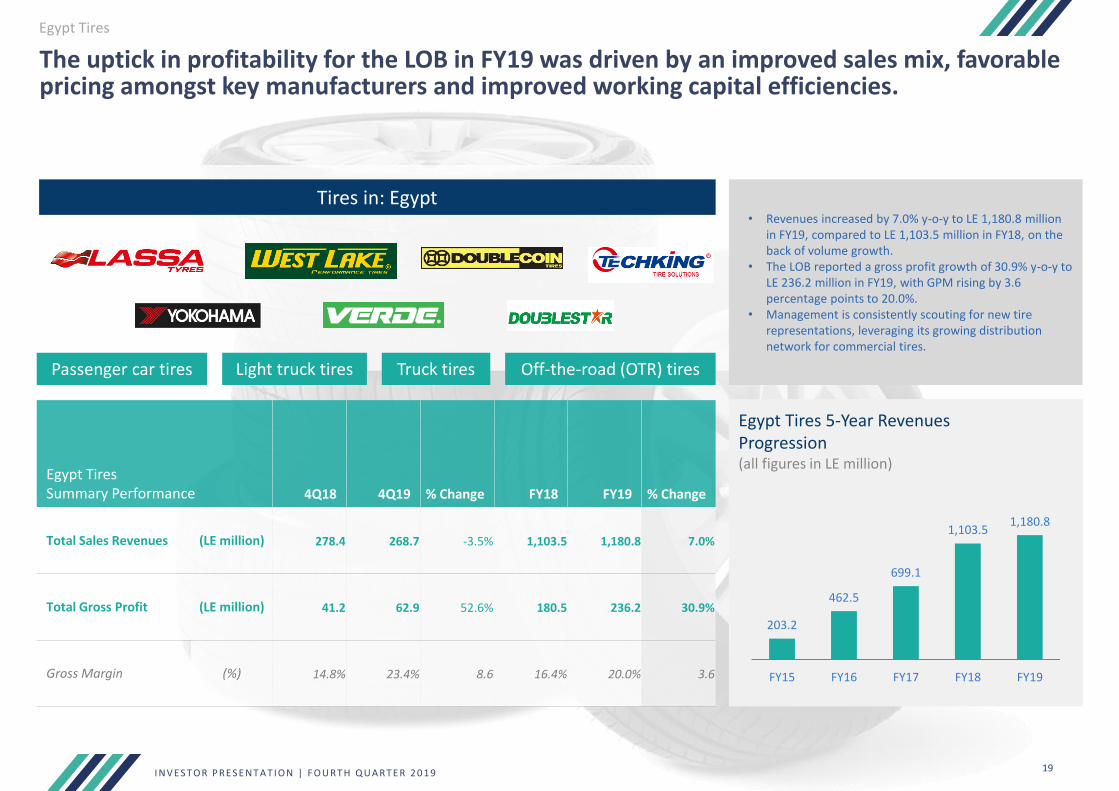
The uptick in profitability for the LOB in FY19 was driven by an improved sales mix, favorable pricing amongst key manufacturers and improved working capital efficiencies.
Egypt Tires 5-Year Revenues Progression(all figures in LE million)
Tires in: Egypt
Passenger car tires Light truck tires Truck tires Off-the-road (OTR) tires
• Revenues increased by 7.0% y-o-y to LE 1,180.8 million in FY19, compared to LE 1,103.5 million in FY18, on the back of volume growth.
• The LOB reported a gross profit growth of 30.9% y-o-y to LE 236.2 million in FY19, with GPM rising by 3.6 percentage points to 20.0%.
• Management is consistently scouting for new tire representations, leveraging its growing distribution network for commercial tires.
203.2
462.5
699.1
1,103.51,180.8
FY15 FY16 FY17 FY18 FY19
Egypt Tires Summary Performance 4Q18 4Q19 % Change FY18 FY19 % Change
Total Sales Revenues (LE million) 278.4 268.7 -3.5% 1,103.5 1,180.8 7.0%
Total Gross Profit (LE million) 41.2 62.9 52.6% 180.5 236.2 30.9%
Gross Margin (%) 14.8% 23.4% 8.6 16.4% 20.0% 3.6
Egypt Tires

I N V E S T OR P RE S E N T A T I ON | F OU RT H Q U A RT E R 2 0 1 9 20
On a regional level, GB Auto distributes CBU units of Hyundai passenger cars in Iraq; Bajaj motorcycles & three-wheelers in Iraq; and operates after-sales service centers in Iraq. However, GB Auto will discontinue its representation of Hyundai in Iraq in 2020.
Regional Operations• On the regional front, GB Auto posted solid growth in FY19, witnessing an impressive
79.9% y-o-y boost in revenues in FY19, driven by robust market demand. However, management has decided to discontinue its representation of Hyundai in Iraq, following the latter's new policy of adopting a multi-distributor model within its markets, resulting in a potentially less lucrative representation for GB Auto.
• It is worth noting that the division was recording losses at the net profit level in 2015, 2016 and 2017; and broke even in 2018 and 2019.
IraqPassenger Cars• Iraq PC Operations reported an exceptional growth of 96.7% y-o-y in FY19, coming in
at 19,737 units compared to 10,034 in FY18.• Management’s decision to discontinue its representation in Iraq will see GB Auto
liquidate its remaining Hyundai inventory during 2020 and will explore opportunities to introduce new PC models.
Two- and Three-Wheelers• Volumes witnessed a strong 47.7% y-o-y increase in FY19 to 30,661 units, with
average sales per month increasing to 2,555 units/month in FY19 compared to 1,730 units/month in FY18.
Regional Operations
Regional Performance 4Q18 4Q19 % Change FY18 FY19 % Change
Total Regions Revenues
(LE million) 1,301.2 2,006.7 54.2% 3,977.7 7,156.6 79.9%
Total RegionsGross Profit
(LE million) 64.8 179.4 - 367.4 619.4 68.6%
Gross Margin (%) 5.0% 8.9% 3.9 9.2% 8.7% -0.5
Two & Three-Wheelers in Iraq
Motorcycles
Three-Wheelers
Hyundai Passenger Cars in Iraq

I N V E S T OR P RE S E N T A T I ON | F OU RT H Q U A RT E R 2 0 1 9 21
GB Auto & Auto Related Income Statement
(LE million) 4Q18 3Q19 4Q19 Q-o-Q Y-o-Y FY18 FY19* % Change
Revenues 5,630.7 5,451.7 5,490.1 0.7% -2.5% 20,918.1 20,208.8 -3.4%
Inter-Segment Revenues 336.5 210.8 255.4 21.2% -24.1% 1,200.4 839.7 -30.1%
Total Revenues 5,967.2 5,662.5 5,745.5 1.5% -3.7% 22,118.4 21,048.5 -4.8%
COGS (5,007.6) (4,890.4) (4,914.6) 0.5% -1.9% (18,370.3) (18,061.7) -1.7%
Inter-Segment Cost of Sales (336.5) (210.8) (255.4) 21.2% -24.1% (1,200.4) (839.7) -30.1%
Total Cost of Sales (5,344.1) (5,101.2) (5,170.0) 1.3% -3.3% (19,570.7) (18,901.4) -3.4%
Gross Profit 623.1 561.3 575.6 2.5% -7.6% 2,547.7 2,147.1 -15.7%
Gross Profit Margin 10.4% 9.9% 10.0% 0.1 -0.4 11.5% 10.2% -1.3
SG&A (400.0) (376.5) (378.0) 0.4% -5.5% (1,263.2) (1,474.4) 16.7%
Other operating income 42.3 24.1 37.3 54.4% -11.9% 132.1 118.6 -10.2%
Provisions (Net) 40.0 (56.1) (153.5) - - 58.2 (231.1) -
Operating Profit 305.4 152.8 81.3 -46.8% -73.4% 1,474.9 560.2 -62.0%
Operating Profit Margin 5.1% 2.7% 1.4% -1.3 -3.7 6.7% 2.7% -4.0
Finance cost / income (305.4) (365.5) (295.6) -19.1% -3.2% (1,199.9) (1,372.7) 14.4%
FOREX (1.2) 43.6 18.7 -57.0% - (8.6) 130.8 -
Net Profit / (loss) Before Tax (1.2) (169.0) (195.5) 15.7% - 266.3 (681.6) -
Income tax (37.0) 37.9 23.9 -37.0% - (63.9) 143.2 -
Net Profit / (loss) After Tax and Before NCI (38.2) (131.1) (171.6) 30.9% - 202.4 (538.4) -
NCI 1.2 (24.9) 32.9 - - (48.2) (39.6) -17.8%
Net Profit / (loss) After NCI (37.0) (156.0) (138.7) -11.1% - 154.2 (578.1) -
EBITDA 353.6 193.0 164.2 -14.9% -53.6% 1,672.4 796.2 -52.4%
EBITDA Margin 5.9% 3.4% 2.9% -0.5 -3.0 7.6% 3.8% -3.8
(LE million) 4Q18 1Q19 2Q19 3Q19 4Q19
Inventory 4,769.1 4,956.9 4,530.2 3,428.3 3,719.5
Receivables 1,920.0 2,372.4 2,337.6 2,071.2 1,730.9
Advances 704.5 536.6 426.4 357.1 452.1
Debtors & Other Debit Balances 779.4 821.3 734.2 1,105.4 708.7
Payables (Net)* 2,631.3 3,148.7 2,448.8 2,549.2 2,478.2Working Capital 5,541.7 5,538.7 5,579.6 4,412.8 4,133.0
GB Auto & Auto Related Key Working Capital Components
* The finance cost includes leasing expenses of LE (31.9) million for 4Q19 and LE (147.9) million for FY19.
* Payables are shown net of operating lease-related liabilities, which are now added to our Net Debt calculations. Due to a change in Egyptian AccountingStandards, the related leased assets have been recorded on the balance sheet under PP&E, while the liabilities have been booked under Payables, starting from 2Q19 onwards.
I N V E S T OR P RE S E N T A T I ON | F OU RT H Q U A RT E R 2 0 1 9 22
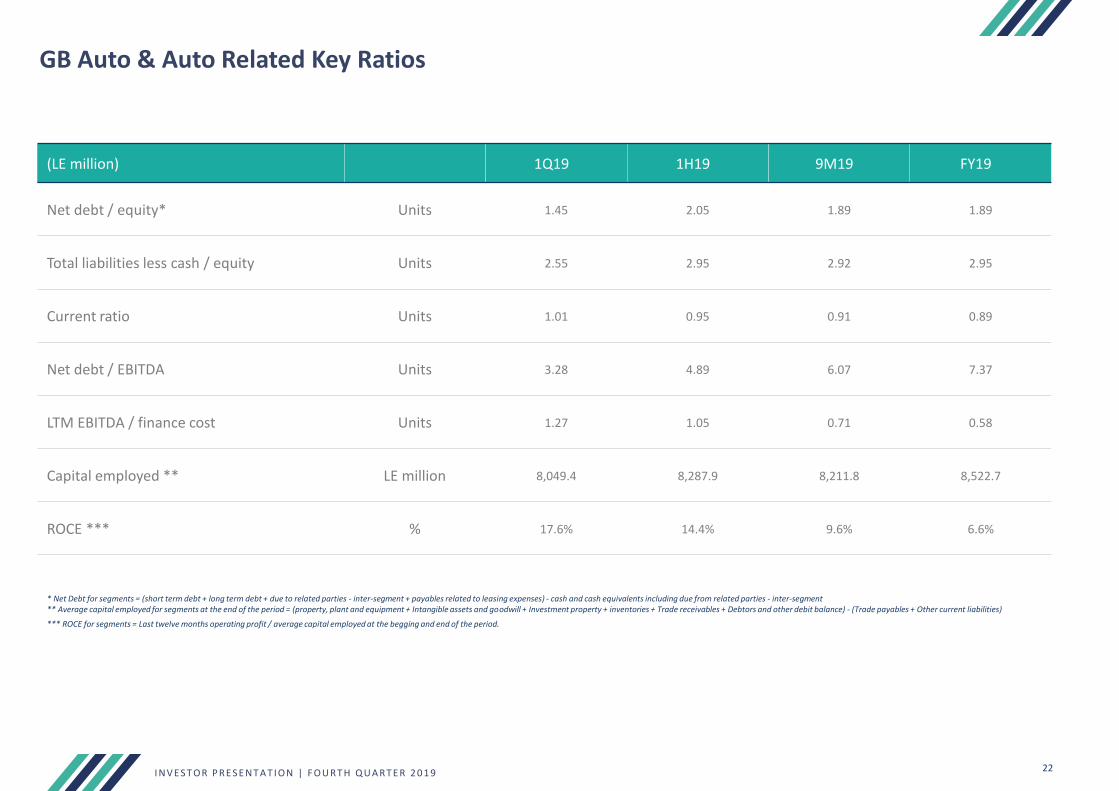
GB Auto & Auto Related Key Ratios
(LE million) 1Q19 1H19 9M19 FY19
Net debt / equity* Units 1.45 2.05 1.89 1.89
Total liabilities less cash / equity Units 2.55 2.95 2.92 2.95
Current ratio Units 1.01 0.95 0.91 0.89
Net debt / EBITDA Units 3.28 4.89 6.07 7.37
LTM EBITDA / finance cost Units 1.27 1.05 0.71 0.58
Capital employed ** LE million 8,049.4 8,287.9 8,211.8 8,522.7
ROCE *** % 17.6% 14.4% 9.6% 6.6%
* Net Debt for segments = (short term debt + long term debt + due to related parties - inter-segment + payables related to leasing expenses) - cash and cash equivalents including due from related parties - inter-segment ** Average capital employed for segments at the end of the period = (property, plant and equipment + Intangible assets and goodwill + Investment property + inventories + Trade receivables + Debtors and other debit balance) - (Trade payables + Other current liabilities)
*** ROCE for segments = Last twelve months operating profit / average capital employed at the begging and end of the period.

III. GB CAPITAL
I N V E S T OR P RE S E N T A T I ON | F OU RT H Q U A RT E R 2 0 1 9 24
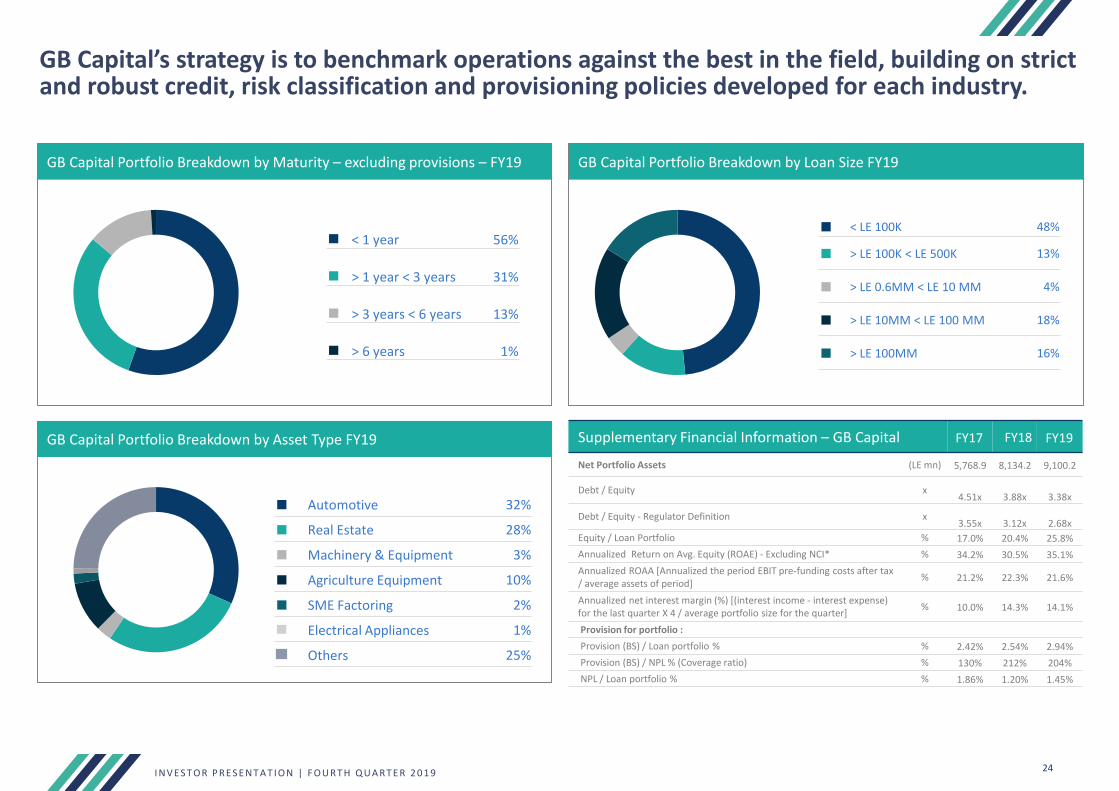
GB Capital’s strategy is to benchmark operations against the best in the field, building on strict and robust credit, risk classification and provisioning policies developed for each industry.
GB Capital Portfolio Breakdown by Maturity – excluding provisions – FY19 GB Capital Portfolio Breakdown by Loan Size FY19
◼ < 1 year 56%
◼ > 1 year < 3 years 31%
◼ > 3 years < 6 years 13%
◼ > 6 years 1%
◼ < LE 100K 48%
◼ > LE 100K < LE 500K 13%
◼ > LE 0.6MM < LE 10 MM 4%
◼ > LE 10MM < LE 100 MM 18%
◼ > LE 100MM 16%
GB Capital Portfolio Breakdown by Asset Type FY19
◼ Automotive 32%
◼ Real Estate 28%
◼ Machinery & Equipment 3%
◼ Agriculture Equipment 10%
◼ SME Factoring 2%
Electrical Appliances 1%
Others 25%
Supplementary Financial Information – GB Capital FY17 FY18 FY19
Net Portfolio Assets (LE mn) 5,768.9 8,134.2 9,100.2
Debt / Equity x4.51x 3.88x 3.38x
Debt / Equity - Regulator Definition x3.55x 3.12x 2.68x
Equity / Loan Portfolio % 17.0% 20.4% 25.8%
Annualized Return on Avg. Equity (ROAE) - Excluding NCI* % 34.2% 30.5% 35.1%
Annualized ROAA [Annualized the period EBIT pre-funding costs after tax / average assets of period]
% 21.2% 22.3% 21.6%
Annualized net interest margin (%) [(interest income - interest expense) for the last quarter X 4 / average portfolio size for the quarter]
% 10.0% 14.3% 14.1%
Provision for portfolio :
Provision (BS) / Loan portfolio % % 2.42% 2.54% 2.94%
Provision (BS) / NPL % (Coverage ratio) % 130% 212% 204%
NPL / Loan portfolio % % 1.86% 1.20% 1.45%

I N V E S T OR P RE S E N T A T I ON | F OU RT H Q U A RT E R 2 0 1 9 25
GB Capital Income Statement (Before Elimination)
(LE million) 4Q18 3Q19 4Q19% Change
4Q19 vs. 3Q19% Change
4Q19 vs. 4Q18 FY18 FY19% Change
FY19 vs. FY18
Revenue 882.3 706.1 973.1 37.8% 10.3% 2,988.1 2,858.3 -4.3%
Interest Income 544.8 647.3 661.5 2.2% 21.4% 1,867.3 2,489.7 33.3%
Total Revenues 1,427.1 1,353.4 1,634.6 20.8% 14.5% 4,855.4 5,347.9 10.1%
Cost of Sales (818.6) (632.5) (806.9) 27.6% -1.4% (2,746.8) (2,474.5) -9.9%
Cost of Funds (271.2) (320.3) (261.9) -18.2% -3.4% (1,023.4) (1,184.9) 15.8%
Total Cost of Revenues (1,089.7) (952.8) (1,068.9) 12.2% -1.9% (3,770.1) (3,659.4) -2.9%
Gross Profit 337.3 400.7 565.7 41.2% 67.7% 1,085.2 1,688.6 55.6%
SG&A (126.8) (172.1) (238.2) 38.4% 87.8% (410.7) (711.7) 73.3%
Provisions (27.5) (26.0) (18.1) -30.5% -34.2% (117.4) (75.3) -35.9%
Operating Profit 183.1 202.6 309.5 52.8% 69.1% 557.1 901.6 61.8%
Other Income 9.2 10.0 13.6 36.6% 48.0% 30.5 41.9 37.6%
EBIT 192.3 212.5 323.1 52.0% 68.1% 587.5 943.5 60.6%
Other Interest & Similar Income 1.9 (3.1) (4.8) 55.7% - (18.4) 2.7 -
FOREX (3.5) 31.4 6.4 -79.5% - (21.3) 51.3 -
EBT 190.7 240.8 324.8 34.9% 70.3% 547.8 997.6 82.1%
Income Tax (35.4) (49.1) (103.7) - - (111.8) (235.6) -
Profit After Tax & Before NCI 155.3 191.7 221.1 15.3% 42.4% 436.0 762.0 74.8%
NCI (29.8) (45.3) (40.2) -11.4% 34.6% (76.6) (146.6) 91.4%
Net Profit After Tax & NCI 125.4 146.4 180.9 23.6% 44.2% 359.4 615.3 71.2%
Breakdown of Revenue By CompanyGB Capital* - 6.8 6.2 -7.9% - - 13.0 -
GB Lease** 201.5 176.3 179.7 1.9% -10.9% 745.4 768.7 3.1%
Drive 600.3 558.6 733.7 31.3% 22.2% 1,979.1 2,146.7 8.5%
Mashroey 415.0 295.0 362.9 23.0% -12.6% 1,439.5 1,235.6 -14.2%
Tasaheel 191.7 292.9 330.9 13.0% 72.6% 625.9 1,098.5 75.5%
Haram 18.6 23.8 21.2 -10.8% 14.3% 65.5 85.5 30.5%
Total 1,427.1 1,353.4 1,634.6 20.8% 14.5% 4,855.4 5,347.9 10.1%
*GB capital revenue appears in 2019 for the first time making use of the new Venture Capital License obtained in Q3 allowing GB Capital to book finance leasing contracts.**GB Lease revenue numbers have been restated for the new Egyptian Accounting Standards which no longer record depreciation of the financed assets in the revenues line.

IV. CONSOLIDATED FINANCIAL PERFORMANCE

I N V E S T OR P RE S E N T A T I ON | F OU RT H Q U A RT E R 2 0 1 9 27
GB Auto Segregated Income Statement
FY19*
(LE million)GB Auto
(Auto and Auto Related) GB Capital
(Financing Business) Elimination
GB Auto Consolidation
Revenues 20,208.8 5,189.2 - 25,398.0
Inter-segment revenues 839.7 158.7 (998.3) -
Total revenues 21,048.5 5,347.9 (998.3) 25,398.0
Cost of sales (18,061.7) (3,520.3) - (21,582.1)
Inter-segment cost of sales (839.7) (139.0) 978.7 -
Cost of Sales (18,901.4) (3,659.4) 978.7 (21,582.1)
Gross Profit 2,147.1 1,688.6 (19.7) 3,816.0
General, selling and administrative expenses (1,474.4) (712.1) 2.3 (2,184.2)
Other operating income 118.6 41.2 (2.3) 157.5
Provisions (Net) (231.1) (75.3) - (306.4)
Operating profit 560.2 942.4 (19.7) 1,483.0
Finance cost / income (1,372.7) 3.9 19.7 (1,349.2)
FOREX 130.8 51.3 - 182.1
Net profit / (loss) before tax (681.6) 997.6 - 315.9
Income tax 143.2 (235.6) - (92.4)
Net profit / (loss) after tax and before NCI (538.4) 762.0 - 223.6
NCI (39.6) (146.6) 5.4 180.9
Net profit / (loss) after NCI (578.1) 615.3 5.4 42.7
Eliminations of inter-segment items compose of trading of Auto and Auto related, Leased items as well as reclassification between cost of sales and finance cost for consistent application of consolidation procedure of the group.
Historical data for GB Auto Group's segregated financials can be downloaded at ir.ghabbourauto.com/fundamentals

I N V E S T OR P RE S E N T A T I ON | F OU RT H Q U A RT E R 2 0 1 9 28
GB Auto Segregated Balance SheetAs at 31 December 2019
(LE million)GB Auto (Auto and Auto Related)
GB Capital (Financing Business) Elimination GB Auto Consolidation
Property Plant & Equipment 3,771.6 256.5 15.1 4,043.2
Intangible Assets & Goodwill 432.9 1.0 - 433.9
Investments in Subsidiaries (GB Capital) 322.1 58.0 (322.0) 58.1
Notes Receivable 11.8 3,905.0 (683.5) 3,233.2
Investments Property 90.9 - - 90.9
Deferred Tax Assets 615.4 2.9 - 618.3
Non-Current Assets 5,244.7 4,223.4 (990.4) 8,477.7
Inventories 3,719.5 68.7 - 3,788.2
Trade Receivables 1,719.1 4,934.0 (217.6) 6,435.5
Advance Payments to Suppliers 452.1 10.9 - 463.0
Debtors & Other Debit Balance 708.8 1,055.2 - 1,764.0
Due from Related Parties 202.1 70.1 - 272.2
Due from Related Parties - Inter-Segment 229.4 95.5 (324.9) -
Cash and Cash Equivalents 981.2 427.7 - 1,408.9
Current Assets 8,012.2 6,662.1 (542.5) 14,131.8
Total Assets 13,256.9 10,885.5 (1,532.9) 22,609.5
Share Capital 1,094.0 318.0 (318.0) 1,094.0
Legal Reserves 317.3 63.8 0.4 381.5
Private Reserve 2,287.1 (42.5) (2.5) 2,242.0
Accumulated Profit (Losses) (1,067.1) 1,068.9 20.8 22.6
Net Income / (Loss) for The Period (578.1) 615.3 5.4 42.7
Total Shareholders' Equity Before NCI 2,053.3 2,023.5 (294.0) 3,782.8
Total NCI 1,050.8 327.0 (12.9) 1,364.9
Total Equity 3,104.1 2,350.5 (306.9) 5,147.7
Trade Payables 2,665.0 304.9 (217.6) 2,752.3
Loans & Overdraft 5,727.9 4,933.1 - 10,661.0
Due to Related Parties 67.7 5.9 - 73.5
Due to Related Parties - Inter-Segment 291.4 33.5 (324.9) -
Provision 225.6 - - 225.6
Other Current Liabilities 3.2 231.3 - 234.5
Total Current Liabilities 8,980.9 5,508.6 (542.5) 13,947.0
Loans - 3,002.1 - 3,002.1
Provision 4.2 - 4.2
Trade and Notes Payable 847.0 - (683.5) 163.5
Deferred Tax Liabilities 320.7 24.4 - 345.1
Total Non-Current Liabilities 1,171.9 3,026.5 (683.5) 3,514.8
Total Equity And Liabilities 13,256.9 10,885.5 (1,532.9) 22,609.5
Historical GB Auto Group segregated financials can be downloaded at ir.ghabbourauto.com/fundamentals

V. KEY CORPORATE & SHAREHOLDER INFORMATION

I N V E S T OR P RE S E N T A T I ON | F OU RT H Q U A RT E R 2 0 1 9 30
GB Auto is focused on the long-term sustainability of the business and its ability to deliver to shareholders.
A closer look at our shareholding structure as of 31 December 2019
DR Symbol : GBAXYCUSIP : 368290102DR Exchange : OTCDR ISIN : US3682901026Ratio : 01:50Depositary : BK (Sponsored)Effective Date : 05/28/09Underlying ISIN : EGS673T1C012Underlying SEDOL : B1Y9TD5
GB Auto’s Shareholding Structure (%) Geographic Distribution of the Free Float (%)
◼ Ghabbour Family 62.9%
◼ Free Float 37.1%
◼ Egypt 28%
◼ Saudi Arabia 25%
◼ Rest of Europe 21%
◼ Rest of World 15%
◼ United Kingdom 7%
◼ United States 4%
GB Auto Stock 52-Week Performance DR Information
0
10,000,000
20,000,000
30,000,000
40,000,000
50,000,000
50
70
90
110
130
Jan-19 Feb-19 Mar-19 Apr-19 May-19 Jun-19 Jul-19 Aug-19 Sep-19 Oct-19 Nov-19 Dec-19
GB Volume EGX (Rebased 100) GB Auto (Rebased 100)
I N V E S T OR P RE S E N T A T I ON | F OU RT H Q U A RT E R 2 0 1 9 31
Management Biographies (1/4)
1. Dr. Raouf Ghabbour, Chairman of the Board of Directors and Chief Executive Officer Dr. Raouf Ghabbour founded the Ghabbour Group of Companies, which he began incepting in 1985. Dr. Ghabbour began his career working in his family’s auto-related trading business, where he initially established himself in the tire division. Having quickly gained a commendable reputation in the market for his business savvy, Dr. Ghabbour went on to acquire agency agreements from global OEMs, which he transformed into successful businesses. Dr. Ghabbour has grown the Company to a leading automotive assembler and distributor in the Middle East and North Africa.
2. Mr. Nader Ghabbour, Deputy Chief Executive OfficerMr. Nader Ghabbour started his career at GB Auto as a showroom sales representative for the passenger car division. He worked his way up to running the daily sales operations within the showroom and later assumed the role of showroom sales supervisor and manager. Mr. Ghabbour’s managerial capabilities were proven when he took on the more strategic role of managing the business-to-business arm of the passenger car segment. He currently serves as the Deputy Chief Executive Officer for the passenger car division, managing the passenger car sales and after-sales functions, regional operations, and the Motorcycle and Three-Wheeler operations. Mr. Ghabbour graduated with a Bachelor of Arts in Business Administration from Boston University and holds an MBA from IE School of Business.
3. Mr. George Sedky, Chief Human Resources Officer Mr. George Sedky has two decades of experience in personnel management, having held positions in the Human Resources divisions of several major corporations. He has a long track record of success in recruiting and gaining top talent, organizational transformation, and building cultures of engagement. He was successful in re-engineering GB Auto’s Human Resources department goals and practices, aligning them with the Group’s strategic business goals. He is specialized in strategic management and planning; directing all HR functions; introducing new methodologies that maximize performance through training and development; compensation and benefits; and organizational development. He holds a BSc. In Aerospace Engineering from Cairo University and an MBA with an HR Specialization from Arab Academy for Science, Technology and Maritime Transport.
4. Mr. Wissam Al-Adany, Chief Information Technology Officer Mr. Wissam Al-Adany joined GB Auto in 2014 bringing with him more than 19 years of experience in IT management, including four years of international experience in Brazil, France and Kazakhstan. Prior to joining GB Auto, Mr. Al-Adany served as Group Chief Information Technology Officer of the Americana Group — whose major shareholder is the multinational Al Kharafi Conglomerate — where he managed the Group’s IT Operations for 15 companies. He started his career with GlaxoSmithKline as a Senior Systems Engineer, and from there moved on to Lafarge as Country IT Director for four years. Mr. Al-Adany has deep techno-functional knowledge in all facets of IT and a robust track record in IT infrastructure management, service delivery, ERP implementation and techno-commercial support. He holds a BSc in Communications & Electronics Engineering from Ain Shams University in Cairo, and an MBA from the American University in Cairo.
5. Mrs. Odette Gamil, Senior Vice President, Internal AuditMrs. Odette Gamil joined Ghabbour in September 2013 as Senior Vice President – CEO Assistant. Mrs. Gamil has 22 years of experience in finance and internal audit, including 14 years in multinational companies (Nestle & Heineken). Prior to joining GB Auto, Mrs. Odette was Head of Internal Audit for Heineken Egypt for 5 years. Before the 9 years spent in Nestle Egypt, she held positions in finance, budgeting and reporting, financial analysis, costing and cost analyst and ended her career in Nestle as cost controller. In May 2017, Mrs. Gamil was appointed as the Head of Internal Audit in GB Auto. She has graduated from the Faculty of Commerce at Ain Shams University.

I N V E S T OR P RE S E N T A T I ON | F OU RT H Q U A RT E R 2 0 1 9 32
Management Biographies (2/4)
GB Auto & Auto-Related Management
6. Mr. Ramez Adeeb, Chief Manufacturing OfficerMr. Ramez Adeeb joined GB Auto in 1995, holding a number of positions and gaining experience in functions including planning, engineering, and quality control until he left the company in 2001 for a position as a project manager at RITEC Consultancy. Mr. Adeeb rejoined GB Auto in 2003, garnering additional experience in the segments of localization management, aggregate planning, sales technical support, industrial projects management and, finally, the group technical support directorship. Mr. Adeebgraduated with a Bachelor’s degree from Cairo University’s Mechanical Engineering Department in 1993. He served as a Research Assistant in Rotor Dynamics and Vibration at Cairo University from 1994-95. He earned an MBA in Marketing Management from the Netherlands’ Maastricht School of Management in 2005.
7. Mr. Abbas El Sayed, GB Auto & Auto Related Finance DirectorMr. Abbas El Sayed joined GB Auto in 2014 as Group Vice President Finance. He has 14 years of experience gained from KPMG and Deloitte including 1.5 years in the UK at KPMG UK LLP. Mr. El Sayed has vast experience in corporate finance, restructuring, strategic planning, audit, internal controls, advisory and compliance. He holds a Bsc. in Accounting from Ain Shams University. He is a member of the Association of Chartered Certified Accountants (ACCA) in the UK and Certified Management Accountant (CMA) in the USA.
8. Mr. Ghassan Kabbani, Chief Operating Officer of Two- and Three-Wheelers Mr. Ghassan Kabbani brings more than 30 years experience to GB Auto. He first worked in the family textile business from 1980 through 1994, when he left to join T.E.S. sheet metal. In 1996, together with Dr. Ghabbour and other partners, he established CITI (a 2- and 3-Wheeler company). In 2007 CITI merged with GB Auto, at which time Mr. Kabbani joined the company. Mr. Kabbani graduated from AUC in 1979 with a BA in Economics and Business Administration.
9. Mr. Karim Gaddas, Group Chief Operating OfficerMr. Karim Gaddas joined GB Auto in 2015 as Chief Executive Officer of Tires, boasting 20 years of experience in general management, operations, and sales and marketing. In the last 16 years he occupied various positions at Pirelli that included headquarter-level roles in Milan and regional-level roles in Paris, Cairo, Alexandria, and Dubai. In addition to being the Global Sales Director for BU trucks, the CEO of the company’s Middle East and India operations, and the CEO of African and Egyptian operations, Mr. Gaddas also served as Pirelli’s Vice Chairman. He was also a member of the board at the Alexandria Tire Company for eight years. Mr. Gaddas began his career in 1996 at Gewiss, an electrical materials company based in Bergamo, Italy, where he was the Area Manager for Central America, the Middle East, and Africa. He holds a B.A. in Business Administration from the Sup de Co Montpellier in France and an MBA from SDA Bocconi in Milan, Italy.

I N V E S T OR P RE S E N T A T I ON | F OU RT H Q U A RT E R 2 0 1 9 33
Management Biographies (3/4)
GB Auto & Auto-Related Management
10. Mr. Saad Habib, Senior Vice President, TiresMr. Saad Habib has a decade of experience in the tire industry having held various managerial positions in sales and operation in the tires division. He joined GB auto in 2009 coming with 6 years of experience in a senior operation role at Americana Group, UAE.
11. Mr. Ibrahim Naguib, Chief Operating Officer of Passenger Car OperationsMr. Ibrahim Naguib has accumulated over 15 years of experience in the automotive industry. Mr. Naguib currently serves as Chief Operating Officer of the Passenger Car Operations where he is responsible for both Sales and After Sales operations. Mr. Naguib first joined GB Auto in 2003 as the Tires Department General Manager where he managed to double the business turnover in a period of three years. In 2007, he took charge of the Commercial Vehicles business where he managed to grow sales volumes and expand market share. In 2009, he assumed the role of Sales and Marketing Director for the Hyundai and Mazda franchises. After briefly relocating abroad, Mr. Naguib returned to GB Auto in 2016 where he was appointed SVP of the Passenger Cars sales operations where under his leadership, market share surged to an unprecedented 36%. Mr. Naguib holds a BA from the American International University in London, UK and an MBA from the Maastricht School of Management, The Netherlands.
12. Eng. Sameh Ali, Chief Operating Officer for Commercial Vehicles and Construction EquipmentEng. Sameh Ali started his career with a British mining company for four years after which he joined GB Auto as a service manager for Commercial Vehicles where he worked his way up to After Sales Head. In 2014, he was tasked with managing Sales as well as After Sales operations. In addition to his responsibilities, Sameh was appointed in 2017 Managing Director of GB Polo bus manufacturing company, where he oversaw a successful company turn around by end of 2018. Sameh holds a degree in mechanical engineering, as well as an MBA degree from Faculty of Business and Innovation at Toledo University, USA.
I N V E S T OR P RE S E N T A T I ON | F OU RT H Q U A RT E R 2 0 1 9 34
Management Biographies (4/4)
GB Capital Management
13. Mr. Sherif Tawadros, Senior Vice President Finance Mr. Tawadros is currently the Senior Vice President Finance for GB Capital. He has under his belt over 29 years of experience in the field of finance in Treasury & Cash Management, Banking, Leasing Company Portfolio Management, Financial & Strategic planning. He holds a BA in Business Administration and MBA from the American University in Cairo.
14. Mr. Ahmed Ossama, GB Capital Finance Director, Haram Tourism and Drive Chairman and MD Mr. Ahmed Ossama bolds the position of GB Capital Head of Finance and Chairman and MD of Haram Tourism. He has under his belt over two decades of experience in accounting and finance across a broad range of industries, including telecoms, petroleum, manufacturing, mining, and financial institutions. He holds a BA in Accounting.
15. Mr. Mounir Nakhla, Mashroey & Tasaheel Co-founder and MDMr. Mounir Nakhla is the Co-founder and Managing Director of Tasaheel, leveraging his entrepreneurial drive, calculated management style and hands-on problem-solving to grow the company to the positioning it holds today. Prior to his establishment of Tasaheel, he founded Mashroey, Egypt’s fastest growing asset-based microfinance company, and assumed the role of Managing Director in 2009. He was part of EQI’s growth story, holding several positions with the company and bookending his career there as Managing Partner in 2008. Mr. Nakhla holds a BSc. in International Business Studies from the European Business School and an MSc in Environment & Development from the London School of Economics.
16. Mr. Sherif Sabry, GB Lease Chairman and MD Mr. Sherif Sabry is the Chairman and MD of GB Lease, having held the post since 2008 when he was appointed to manage the restructuring of the company upon GB Auto Group’s acquisition of the firm under its financing arm. He has been a member of the GB Auto family since 1995 in several capacities, including Group Treasury Division Head and Group Treasury Director. He holds a BA of Commerce from Cairo University and an MBA in Finance and Banking from Maastricht School of Management. He is also a graduate of the Chase Manhattan Bank Credit Program.

I N V E S T OR P RE S E N T A T I ON | F OU RT H Q U A RT E R 2 0 1 9 35
Board of Directors Biographies (1/2)
1. Dr. Raouf Ghabbour, Chairman of the Board of Directors and Chief Executive Officer, founded the Ghabbour Group of Companies, which he began incepting in 1985. Dr. Ghabbour began his career working in his family’s auto-related trading business, where he initially established himself in the tire division. Having quickly gained a commendable reputation in the market for his business savvy, Dr. Ghabbour went on to acquire agency agreements from global OEMs, which he transformed into successful businesses. Dr. Ghabbour has grown the Company to a leading automotive assembler and distributor in the Middle East and North Africa. He has chaired the Board of Directors since 2007.
2. Mr. Sherif Samy, Non-Executive Director, serves on the board of several companies, including a post as Non-executive Chairman of the National Asset Management & Investment SAE, and on the Investment Board of the State Pension Funds and the Waqf Authority. He is also a member of the International Advisory Board of the UAE Securities & Commodities Authority. Most recently, he completed a four-year term as head of Egypt’s Financial Regulatory Authority after having spent two consecutive terms on the board of the International Organization of Securities Commissions and serving on the board of the CBE and its Monetary Policy Committee for four years. Prior to that, he was a board member for Banque Du Caire and was appointed for several consecutive terms to the board of Egypt’s GAFI. He has a long track record in investment management and consulting, having spent years working in the fields both in Egypt and other parts of the Arab world. He holds a BA from Alexandria University’s Faculty of Commerce. He has sat on the Board of Directors since 2018.
3. Mr. Mansour Kabbani, Non-Executive Director, brings more than 30 years of experience to GB Auto, where he joined as VP for project co-ordination in 2015 and currently overseas group investments as well as investor relations. Mr. Kabbani spent a decade working in textile spinning before becoming CFO at Technological and Electrical Systems (TES) for two years. With Dr. Ghabbour and partners, he helped establish CITI in 1997 which later merged with GB Auto. From 1997 to 2015, Mr. Kabbani has run his family investments and accumulated vast experience in capital markets. Mr. Kabbani graduated from AUC in 1981 with a BA in Economics. He has sat on the Board of Directors since 2015.
4. Mr. Nader Ghabbour, Deputy Chief Executive Officer, started his career at GB Auto as a showroom sales representative for the passenger car division. He worked his way up to running the daily sales operations within the showroom and later assumed the role of showroom sales supervisor and manager. Mr. Ghabbour’s managerial capabilities were proven when he took on the more strategic role of managing the business-to-business arm of the passenger car segment. He currently serves as the Deputy Chief Executive Officer for the passenger car division, managing the passenger car sales and after-sales functions, regional operations, and the Motorcycle and Three-Wheeler operations. Mr. Ghabbour graduated with a Bachelor of Arts in Business Administration from Boston University and holds an MBA from IE School of Business. He has sat on the Board of Directors since 2007.

I N V E S T OR P RE S E N T A T I ON | F OU RT H Q U A RT E R 2 0 1 9 36
Board of Directors Biographies (2/2)
5. Mr. Abbas El Sayed, Executive Director, joined GB Auto in 2014 as Group Vice President Finance. He has 14 years of experience gained from KPMG and Deloitte including 1.5 years in the UK at KPMG UK LLP. Mr. El Sayed has vast experience in corporate finance, restructuring, strategic planning, audit, internal controls, advisory and compliance. He holds a BA in Accounting from Ain Shams University. He is a member of the Association of Chartered Certified Accountants (ACCA) in the UK and is a Certified Management Accountant (CMA). He has sat on the Board of Directors since 2019.
6. Mr. Mounir Fakhry Abdelnour, Non-Executive Director, brings more than 40 years of economy-centric experience to GB Auto’s Board of Directors. Since 1970, he has occupied various high-ranking positions at a number of reputable banking institutions and also served in different ministerial posts, including Minister of Tourism and Minister of Industry and Trade, among others. In 1976, he co-founded American Express Middle East (AMEX), where he served as Vice President and board member until 1980. He was also a founder and Chairman of the Egyptian-French Agro-foods Company between 1983-2014. Throughout his career, Mr. Abdelnour served as a board member at the EGX, the National Council for Human Rights, and the Federation of Egyptian Industries. He currently sits on the boards of Beltone Financial, Edita and Domty. As an active participant in Egyptian political life, Mr. Abdelnour headed the opposition bloc in parliament between 2000-2005 and was a member of the time-honored political party Al Wafd from 2005-2011. He has sat on the Board of Directors since 2016.
7. Mr. Mohamed Naguib, Non-Executive Director, has served at the boards of various prominent banks and corporations in Egypt and has accumulated nearly 40 years of experience in the fields of Banking, Leasing and Credit. Between 2011 and 2018, Mr. Naguib was Chairman and Managing Director of SAIB Bank and prior to that as Vice-Chairman and Head of the Credit and Investment Committee at Banque Misr. Mr. Naguib had also served at MisrInternational (MIBank) for over 20 years as General Manager of Credit and Marketing before joining Incolease as Member of the board from 2000 till 2010. Furthermore, Mr. Naguib served as Non-Executive Chairman of Misr Bank-Europe in Germany for two years as well as his membership of the boards of the National Bank of Egypt, the Civil Aviation Finance Holding Company, and the Small and Medium Sized Projects Fund among many others. Mr. Naguib has attended various banking and credit seminars across the United States and the UK in addition to retaining a CPA certification in the state of Colorado for 12 years. Mr. Naguib holds a bachelor’s in Accounting from Cairo University and an MBA from the American University in Cairo. He has sat on the Board of Directors since 2019.
I N V E S T OR P RE S E N T A T I ON | F OU RT H Q U A RT E R 2 0 1 9 37
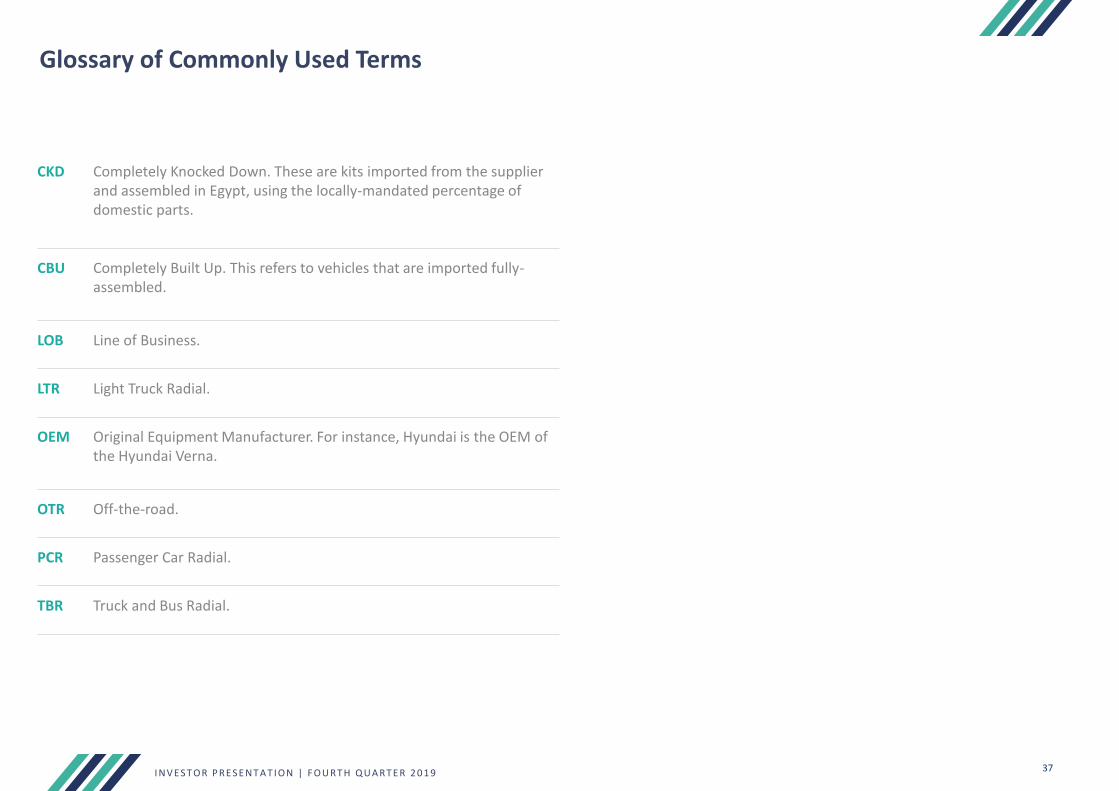
Glossary of Commonly Used Terms
CKD Completely Knocked Down. These are kits imported from the supplier and assembled in Egypt, using the locally-mandated percentage of domestic parts.
CBU Completely Built Up. This refers to vehicles that are imported fully-assembled.
LOB Line of Business.
LTR Light Truck Radial.
OEM Original Equipment Manufacturer. For instance, Hyundai is the OEM of the Hyundai Verna.
OTR Off-the-road.
PCR Passenger Car Radial.
TBR Truck and Bus Radial.

INVESTOR RELATIONSMansour KabbaniBoard of Directors Member
Andre ValavanisInvestor Relations AVP
Sarah MagedInvestor Relations Communications Manager
Marina KamalInvestor Relations Associate
Direct: +202 3910 0485Fax: +202 3539 0139
E-mail: [email protected]
Thank youir.ghabbourauto.com
Shareholder InformationReuters Code: AUTO.CABloomberg Code: AUTO.EY
Number of Shares Outstanding1,094,009,733