Embed Size (px)
Citation preview

INVESTOR PRESENTATION
MARCH 2020

Holly Energy Partners (NYSE: HEP) 2
Safe Harbor Disclosure Statement
Statements made during the course of this presentation that are not historical facts are “forward-looking statements” within themeaning of the U.S. Private Securities Litigation Reform Act of 1995. Forward-looking statements are inherently uncertain andnecessarily involve risks that may affect the business prospects and performance of HollyFrontier Corporation and/or Holly EnergyPartners, L.P., and actual results may differ materially from those discussed during the presentation. Such risks and uncertaintiesinclude but are not limited to risks and uncertainties with respect to the actions of actual or potential competitive suppliers andtransporters of refined petroleum products in HollyFrontier’s and Holly Energy Partners’ markets, the demand for and supply of crudeoil and refined products, the spread between market prices for refined products and market prices for crude oil, the possibility ofconstraints on the transportation of refined products, the possibility of inefficiencies or shutdowns in refinery operations or pipelines,effects of governmental regulations and policies, the availability and cost of financing to HollyFrontier and Holly Energy Partners, theeffectiveness of HollyFrontier’s and Holly Energy Partners’ capital investments and marketing strategies, HollyFrontier's and HollyEnergy Partners’ efficiency in carrying out construction projects, HollyFrontier's ability to acquire refined product operations orpipeline and terminal operations on acceptable terms and to integrate any existing or future acquired operations, the possibility ofterrorist attacks and the consequences of any such attacks, pandemic or outbreak of infectious disease, the impact of recent orproposed changes in tax laws and regulations that affect master limited partnerships, and general economic conditions. Additionalinformation on risks and uncertainties that could affect the business prospects and performance of HollyFrontier and Holly EnergyPartners is provided in the most recent reports of HollyFrontier and Holly Energy Partners filed with the Securities and ExchangeCommission. All forward-looking statements included in this presentation are expressly qualified in their entirety by the foregoingcautionary statements. The forward-looking statements speak only as of the date hereof and, other than as required by law,HollyFrontier and Holly Energy Partners undertake no obligation to publicly update or revise any forward-looking statements,whether as a result of new information, future events or otherwise.

Holly Energy Partners (NYSE: HEP) 3
Holly Energy Partners
A system of petroleum product and crude pipelines, storage tanks, distribution terminals, loading racks and processing units located at or near HFC’s refining assets in high growth markets
• Revenues are nearly 100% fee-based with de minimus commodity risk
• Customer base consisting of refining companies (contracts not with E&Ps)
• Minimum Volume Commitments comprise 70% of total revenue
• Substantially all MVC revenues tied to PPI and/or FERC
• IDR simplification transaction completed in 2017
Financial Guidance & Targets:
• Expect to maintain annual distribution of $2.69 per LP unit in 2020
• Target distribution coverage at or above 1.0x
• Target leverage of 4.0x 1Distributions are split adjusted reflecting HEP’s January 2013 two-for-one unit split.
$0
$40
$80
$120
$160
$0.00
$0.20
$0.40
$0.60
$0.80
Consistent Distribution Despite Crude Price Volatility
DPU*
WTI
Distribution $/LP Unit WTI Price

Holly Energy Partners (NYSE: HEP) 4
Minimum Volume Commitments
MVC Contract Renewal Schedule
10-15 years = typical contract lengths with HFC
6 years = weighted-average remaining contract duration
2022 = next notable 3rd Party renewal on UNEV Pipeline
(UNEV 3rd Party = 3% of 2019 Total Revenue)
80% of MVC contracts expire 2024 or later
HFC65%
3rd Party5%
Non-MVC30%
Inflation Escalators as % of Total Revenue1 MVC Contract Profile
MVCs as % of Total Revenue1
1) Based on 2019 total revenue of $533 million
$0
$10
$20
$30
$40
$50
$60
$70
$80
$90
$100
'20 '21 '22 '23 '24 '25 '26 '27 '28 '29 '30 '31
Rev
enu
e $
(in
mill
ion
s)
HFC 3rd Party
PPI65%
FERC30%
Other 5%
Holly Energy Partners (NYSE: HEP) 5
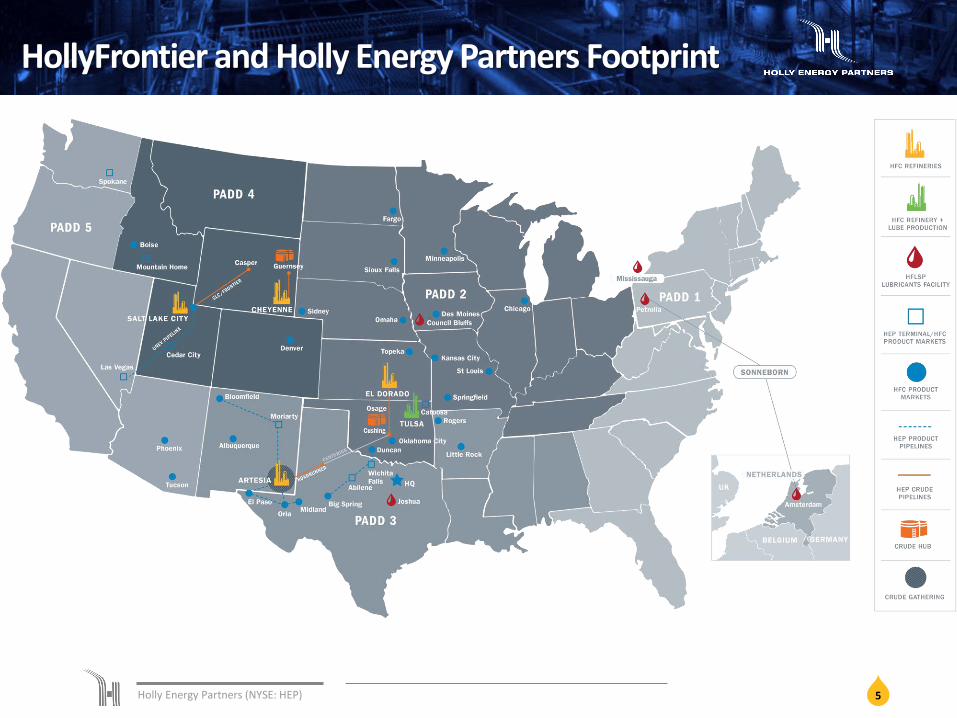
HollyFrontier and Holly Energy Partners Footprint

Holly Energy Partners (NYSE: HEP) 6
HollyFrontier Business Segment Highlights
REFINING MIDSTREAM SPECIALTY LUBRICANTS
Inland merchant refiner
5 refineries in the Mid Continent, Southwest and Rockies regions
Flexible refining system with fleet wide discount to WTI
Premium niche product markets versus Gulf Coast
Organic initiatives to drive growth and enhance returns
Disciplined capital structure & allocation
Operate crude and product pipelines, loading racks, terminals and tanks in and around HFC’s refining assets
HFC owns 57% of the LP Interest in HEP and the non-economic GP interest
Eliminated IDRs in 2017 to simplify structure
Over 70% of revenues tied to long term contracts and minimum volume commitments
Integrated specialty lubricants producer with 34,000 barrels per day of production capacity
Sells finished lubricants & specialty products in over 80 countries under the Petro-Canada Lubricants, Sonneborn, Red Giant Oil and HollyFrontier product lines
Production facilities in Mississauga, Ontario; Tulsa, Oklahoma; Petrolia, Pennsylvania; and the Netherlands
HollyFrontier Lubricants & Specialty Products is one of the largest North American white oil and group III base oil producer

Holly Energy Partners (NYSE: HEP)
100% Interest
45.8mm HEP units1
43% LP Interest$666.5M Value2
59.6mm HEP units1
57% LP Interest$866.0M Value2
HOLLYFRONTIER CORPORATION (HFC)
GENERAL PARTNER (GP)HOLLY LOGISTIC SERVICES, L.L.C.
HOLLY ENERGYPARTNERS, L.P. (HEP)
PUBLIC
Non-economicGP Interest
HEP Ownership Structure
Eliminated IDRs in 2017 to simplify structure
71) Unit Count as of December 31, 20192) Based on HEP unit closing price on March 10, 2020

Holly Energy Partners (NYSE: HEP) 8
Distributable Cash Flow / LP Unit Since Inception
$1.35 $1.47 $1.58
$1.85
$1.98 $2.06
$2.20
$2.75
$2.52
$2.94
$3.36
$3.65
$3.46
$2.52 $2.57
$-
$0.50
$1.00
$1.50
$2.00
$2.50
$3.00
$3.50
$4.00
2005 2006 2007 2008 2009 2010 2011 2012 2013 2014 2015 2016 2017 2018 2019
Distributable Cash Flow per LP Unit1
1) LP units outstanding are split adjusted reflecting HEP’s January 2013 two-for-one unit split. Amounts based on distributable cash flow earned during the period.
DCF/LP Unit
LP Units Outstanding
(in mil l ions)30.8 32.2 32.2 32.6 36.6 44.2 45.7 55.7 58.2 58.7 58.7 59.9 70.3 105.0 105.4
2013: public offering of HEP common units2017: IDR simplification 2018: private offering of HEP common units

Holly Energy Partners (NYSE: HEP) 9
Historical Leverage and Coverage Ratios
3.6
3.3 2.7
5.1
3.9 4.0 4.04.5
4.2 4.1 4.3 4.5 4.1 4.3 4.1
0.0x
1.0x
2.0x
3.0x
4.0x
5.0x
6.0x
'05 '06 '07 '08 '09 '10 '11 '12 '13 '14 '15 '16 '17 '18 '19
Leverage Ratio
1.2
1.1 1.1
1.2
1.1 1.1 1.0
1.2
1.01.1
1.11.1 1.0 1.0 1.0
0.0x
0.2x
0.4x
0.6x
0.8x
1.0x
1.2x
1.4x
'05 '06 '07 '08 '09 '10 '11 '12 '13 '14 '15 '16 '17 '18 '19
Coverage Ratio
Majority of contracts tied to MVCs allow for lower coverage
Maintained average 1.1x since 2005
Conservative annual capital need allows for modest leverage
Averaged 4.0x leverage since 2005

Holly Energy Partners (NYSE: HEP) 10
HEP Historical Growth
Committed to Continuing Successful Track Record of Growth
2004 2005 2006 2007 2008 2009
MLP IPO
(July 2004)
Holly intermediate
feedstock pipeline
dropdown
(July 2005)
25% JV with
Plains for
SLC pipeline
(Mar 2009)
Holly Tulsa
dropdown of
loading rack
(Tulsa West)
(Aug 2009)
Holly crude oil
and tankage
assets
dropdown
(Feb 2008)
Alon pipeline
and terminal
asset
acquisition
(Feb 2005)
Holly 16”
intermediate
pipeline
facilities
acquisition
(June 2009)
Tulsa East
acquisition &
Roadrunner /
Beeson
dropdown
(Dec 2009)
Sale of 70%
interest in Rio
Grande to
Enterprise
(Dec 2009)
2010
Purchase of
additional
Tulsa tanks
& racks and
Lovington rack
(Mar 2010)
2011
HFC
dropdown of
El Dorado &
Cheyenne
assets
(Nov 2011)
Holly South
Line expansion
project
(2007-2008)
Holly Corporation
and Frontier Oil
Corporation
complete merger
(July 2011)
2012
HEP purchases
75% interest in
UNEV from HFC
(July 2012)
Tulsa
interconnect
pipelines
(Aug 2011)
2013
Crude gathering
system expansion
(2014)
2014 2015 2016 2017
Acquired remaining
interests in SLC /
Frontier pipelines
(Oct 2017)
IDR
Simplification
(Oct 2017)
Purchase of
Tulsa West
Tanks
(March 2016)
HFC dropdown
of El Dorado
processing
units
(Nov 2015)
50% JV with
Plains for
Frontier
pipeline
(Aug 2015)
50% JV with
Plains for
Cheyenne
pipeline
(June 2016)
HFC
dropdown of
Woods Cross
processing
units
(Oct 2016)
Acquisition of
El Dorado
tank farm
(Mar 2015)
2018 2019
Constructed
Orla Truck
Rack
(Jan 2019)
Purchase of
Catoosa
Lubricants
Terminal
(June 2018)
HEP purchases
50% interest in
Osage from HFC
(Feb 2016)
50% JV with
Plains for
Cushing Connect
pipeline and
Cushing terminal
(October 2019)

Holly Energy Partners (NYSE: HEP) 11
HEP Avenues for Growth
ORGANIC EXTERNAL TRANSACTIONS DROPDOWNS FROM HFC
Leverage HEP’s existing footprint to capitalize on commercial opportunities
Contractual PPI/FERC escalators
Replace incumbent HFC service providers with HEP
Pursue logistics assets in HEP’s current geographic region
Replace incumbent HFC service providers with HEP
Leverage HFC refining and commercial footprint
Participate in expected MLP sector consolidation
Partnering with HFC to build and/or acquire new assets / businesses
Target high tax basis assets with durable cash flow characteristics that also add to HFC EBITDA
Example: Orla Truck Rack Example: Cushing Connect JV Example: El Dorado Processing Unit

Holly Energy Partners (NYSE: HEP) 12
Cushing Connect Joint Venture
Deal Highlights
JV estimated total capital of $130 million with expected initial EBITDA1
multiple of 8x-9x.
HEP to build and operate pipeline, PAA to build terminal connections
and operate terminal
Pro-forma leverage of 4.05x, expected to be DCF1 accretive in 2021
HFC entered into 15 year minimum volume commitment of 100 KBPD
with HEP, which will commence upon completion of pipeline
Asset Description
HEP formed a 50/50 JV with Plains All American Pipeline, L.P. (PAA)
consisting of:
New build, 50-mile, 160 KBPD common carrier crude pipeline
from Cushing to Tulsa
1.5 million barrels of crude storage in Cushing
Terminal anticipated in-service 2Q2020
Pipeline anticipated in-service 1Q2021
Strategic Rationale
Generates HEP growth while providing long term control of a
strategic asset
Insources HFC’s logistics spend to HEP
New pipeline provides capability to supply 100% of HFC’s
Tulsa Refinery crude throughput
HFC El Dorado Refinery
Crude Capacity 160 KBPD
HFC Tulsa Refinery
Crude Capacity 140 KBPD
Plains Cushing Terminal System
Cushing Connect Pipeline JV
Osage Pipeline JV
1) See definition page in appendix

Holly Energy Partners (NYSE: HEP) 13
Organic Growth
Crude system expansion benefits both HEP and HFC
• HEP owns and operates over 800 miles of crude gathering pipelines in the Permian Basin
25
50
75
100
125
150
2011 2012 2013 2014 2015 2016 2017 2018 2019
Tho
usa
nd
Bar
rels
Pe
r D
ay (
KB
PD
)
Crude Gathering Volume Growth

Holly Energy Partners (NYSE: HEP)
HEP Capital Budget
2020 Capex Budget$58-69mm
Turnarounds$5-7mm
Maintenance$8-12mm
Expansion/JV Investment$45-50
14

Holly Energy Partners (NYSE: HEP)
HEP Financial Strength
Reimbursable$15-20mm
Maintenance$10-15mm
Expansion$40-50mm
HEP Capital Structure ($ millions) 12/31/2019
Revolver Capacity (matures 7/2022) $ 1,400
Revolver Borrowings $ (966)
Revolver Availability $ 435
Total Liquidity $ 448
6.00% Senior Notes due 2024* $ 500
Revolver Borrowings $ 966
Total HEP Debt $ 1,466
Adjusted TTM EBITDA $ 359
Debt/TTM EBITDA 4.1x
15
Credit Ratings
HEP Corporate S&P BB+ Moody’s Ba2
HFC Corporate Investment Grade Ratings S&P BBB- Moody’s Baa3 Fitch BBB-
*strong parent credit rating that represents significant revenues for HEP
*February 2020, redeemed 6% senior notes due 2024 and issued 5% senior notes due 2028

Holly Energy Partners (NYSE: HEP) 16
HFC Environmental, Social, and Governance (ESG)
Board leadership provides significant industry expertise, alongside diverse business, financial and EHS expertise
Environmental, Health, Safety, and Public Policy Committee at Board level
9 of 10 directors independent, including chair
2 female board members
Long standing commitment to ethical behavior is inherently tied to how we do business
Code of Business Conduct and Ethics among governing principles
Executive compensation strongly aligned with shareholders and long-term performance
ROCE, TSR, Operational Efficiency, and Safety drive performance pay
33% reduction in NOX, SO2, CO, PM2.5 and VOC emissions since 2011
Investments in reverse osmosis water conservation at Navajo refinery
Wetland cultivation and conservation at El Dorado refinery
Converting waste to energy at Tulsa refinery
PCLI became first white oils, specialty base oils and lubricants refiner and manufacturer in the world to achieve newest International Organization of Standardization (ISO) 14001:2015 environmental certification
Reduction in GHG emissions
Investment in Renewable Diesel Project in Artesia, New Mexico to produce cleaner burning fuel with 50% lower GHG emissions than conventional diesel
20% reduction in Tier 1 & 2 process safety incidents vs 2017
Annual Corporate Citizenship Report highlighting ESG efforts
“Goal Zero” policy has helped deliver >50% accident rate reduction
“One HFC Culture” program instilled at every level with focus and commitment to safety, integrity, teamwork, and ownership
Active volunteering and philanthropic involvement in communities where we operate
Commitment to creating a diverse workforce
Environmental Social
* Please see HFC 2018 Corporate Citizenship Report for additional ESG related information. https://www.hollyfrontier.com/Citizenship/default.aspx

Holly Energy Partners (NYSE: HEP) 17
Appendix

Holly Energy Partners (NYSE: HEP) 18
HEP Assets
Holly Energy Partners owns and operates substantially all of the refined product pipeline and terminaling assets that support HollyFrontier’s refining and marketing operations in the Mid-Continent, Southwest and Rocky Mountain regions of the United States.
Approximately 3,400 miles of crude oil and petroleum product pipelines
Approximately 15 million barrels of refined product and crude oil storage with 8 terminals and 7 loading rack facilities in 9 western and mid-continent states
Refinery processing units in Woods Cross, Utah and El Dorado, Kansas
75% joint venture interest in UNEV Pipeline, LLC – the owner of a 400-mile refined products pipeline system connecting Salt Lake area refiners to the Las Vegas product market
50% joint venture interest in Cheyenne Pipeline LLC – the owner of an 87-mile crude oil pipeline from Fort Laramie, Wyoming to Cheyenne, Wyoming.
50% joint venture interest in Osage Pipe Line Company, LLC – the owner of a 135-mile crude oil pipeline from Cushing, Oklahoma to El Dorado, Kansas
50% joint venture interest in Cushing Connect Pipeline & Terminal LLC – the owner of a 160,000 barrel per day crude oil pipeline from Cushing, Oklahoma to Tulsa, Oklahoma and 1.5 million barrels of crude oil storage in Cushing, Oklahoma

Holly Energy Partners (NYSE: HEP) 19
Contract Renewal Schedule
1. Per HEP 2019 10-K ($533 million)2. Reflects minimum revenues leased on Delek partial renewal
Renewal Year HFC MVC 3rd Party MVC2 Total MVC Tariff
MVC as % of 2019
Total Revenue1
2020 $0 $4 $4 PPI (84%), FERC (9%) 1%
2021 4 0 4 FERC 1%
2022 22 12 34 PPI (5%), FERC (93%) 6%
2023 36 0 36 PPI (88%), FERC (10%) 7%
2024 89 0 89 PPI (89%), FERC (11%) 17%
2025 6 11 17 PPI 3%
2026 60 0 60 PPI 11%
2028 1 0 1 PPI 0%
2029 52 0 52 PPI 10%
2030 16 0 16 PPI 3%
2031 61 0 61 PPI 11%
2036 1 0 1 PPI 0%
$348 $27 $375 70%
2020 MVC (revenue $ in millions)

Holly Energy Partners (NYSE: HEP) 20
Definitions
KBPD: Thousand barrels per day
CAGR: The compound annual growth rate is calculated by dividing the ending value by the beginning value, raise the result to the power of one divided by the period length, and subtract one from the subsequent result. CAGR is the mean annual growth rate of an investment over a specified period of time longer than one year.
DISTRIBUTABLE CASH FLOW: Distributable cash flow (DCF) is not a calculation basedupon GAAP. However, the amounts included in the calculation are derived fromamounts separately presented in our consolidated financial statements, with theexception of excess cash flows over earnings of SLC Pipeline, maintenance capitalexpenditures and distributable cash flow from discontinued operations. Distributablecash flow should not be considered in isolation or as an alternative to net income oroperating income as an indication of our operating performance or as an alternative tooperating cash flow as a measure of liquidity. Distributable cash flow is not necessarilycomparable to similarly titled measures of other companies. Distributable cash flow ispresented here because it is a widely accepted financial indicator used by investors tocompare partnership performance. We believe that this measure provides investors anenhanced perspective of the operating performance of our assets and the cash ourbusiness is generating. Our historical distributable cash flow for the past five years isreconciled to net income in footnote 3 to the table in "Item 6. Selected Financial Data"of HEP's 2019 10-K.
EBITDA: Earnings before interest, taxes, depreciation and amortization which iscalculated as net income plus (i) interest expense net of interest income and (ii)depreciation and amortization. EBITDA is not a calculation based upon U.S. generallyaccepted accounting principles (“U.S. GAAP”). However, the amounts included in theEBITDA calculation are derived from amounts included in our consolidated financialstatements. EBITDA should not be considered as an alternative to net income oroperating income, as an indication of our operating performance or as an alternative tooperating cash flow as a measure of liquidity. EBITDA is not necessarily comparable tosimilarly titled measures of other companies. EBITDA is presented here because it is awidely used financial indicator used by investors and analysts to measure performance.EBITDA is also used by our management for internal analysis and as a basis forcompliance with financial covenants. Our historical EBITDA for the past five years isreconciled to net income in footnote 2 to the table in “Item 6. Selected Financial Data”of HEP’s 2019 10-K.
NON GAAP MEASUREMENTS: We report certain financial measures that are notprescribed or authorized by U. S. generally accepted accounting principles("GAAP"). We discuss management's reasons for reporting these non-GAAPmeasures below. Although management evaluates and presents these non-GAAPmeasures for the reasons described below, please be aware that these non-GAAPmeasures are not alternatives to revenue, operating income, income fromcontinuing operations, net income, or any other comparable operating measureprescribed by GAAP. In addition, these non-GAAP financial measures may becalculated and/or presented differently than measures with the same or similarnames that are reported by other companies, and as a result, the non-GAAPmeasures we report may not be comparable to those reported by others.