Embed Size (px)
Citation preview

Investor PresentationMarch 2015

Presenters
Lynn Schweinfurth, Chief Financial Officer
1

Forward Looking Statements
This contains “forward-looking” statements within the meaning of Section 27A of the Securities Act of 1933, as amended, and Section 21E of the Securities Exchange Act of 1934, as amended. “Forward-looking statements” are any statements that are not based on historical information. Statements other than statements of historical facts included herein, including, without limitation, statements regarding our future financial position and results of operations, business strategy, budgets, projected costs and plans and objectives of management for future operations, are “forward-looking statements.” Forward-looking statements generally can be identified by the use of forward-looking terminology such as “may,” “will,” “expect,” “anticipate,” “intend,” “plan,” “believe,” “seek,” “estimate” or “continue” or the negative of such words or variations of such words and similar expressions. These statements are not guarantees of future performance and involve certain risks, uncertainties and assumptions, which are difficult to predict. Therefore, actual outcomes and results may differ materially from what is expressed or forecasted in such forward-looking statements and we can give no assurance that such forward-looking statements will prove to be correct. Important factors that could cause actual results to differ materially from those expressed or implied by the forward-looking statements, or “cautionary statements,” include, but are not limited to: increases in food and other commodity costs; risks associated with the expansion of our business; our ability to manage our growth and successfully implement our business strategy; general economic conditions, particularly in the retail sector; competitive conditions; weather conditions; fuel prices; significant disruptions in service or supply by any of our suppliers or distributors; changes in consumer perception of dietary health and food safety; labor and employment benefit costs; regulatory factors; the outcome of pending or future legal claims or proceedings; environmental conditions and regulations; our borrowing costs; the availability and terms of necessary or desirable financing or refinancing and other related risks and uncertainties; the risk of an act of terrorism or escalation of any insurrection or armed conflict involving the United States or any other national or international calamity; factors that affect the restaurant industry generally, including product recalls, liability if our products cause injury, ingredient disclosure and labeling laws and regulations, reports of cases of food borne illnesses such as “mad cow” disease and “avian” flu, and the possibility that consumers could lose confidence in the safety and quality of certain food products, as well as negative publicity regarding food quality, illness,injury or other health concerns.
2

Strategic and Operational Overview

Investment Considerations
Two Leading, Differentiated Brands
Well Positioned Within the Growing Fast-Casual Segment
Accelerating Development Given Significant Potential
Compelling Business Model
Proven Financial Results
4

Long-term Business Model
8%-10% Company
Restaurant Growth
2%-3% SSS
Growth
10%-12% Revenue Growth
Margin Expansion
Meaningful EPS
Growth
5

Freshly Prepared, Caribbean-inspired Menu
6

Freshly Prepared, Caribbean-inspired Menu
Add food shorts
7

Our Rapid Expansion Vehicle
8

Our Rapid Expansion Vehicle
9

Our Rapid Expansion Vehicle
10

Reaching Media Efficiency
Market 2011 2012 2013 2014 2015FAd Mass
Reached atS. Florida 63 65 66 74 77 20Orlando 13 14 15 16 20 17Dallas - - - 5 10 30Atlanta 1 2 5 5 10 18Naples/Ft Myers 3 3 4 6 7 5Tampa 4 4 6 6 6 14Houston - - - 3 6 30Jacksonville 2 3 3 4 5 4San Antonio - - - 2 5 10Nashville - - 2 2 4 4
11Note: the above excludes the Gainesville DMA where we have one restaurant as of December 28, 2014.

LEGACY SOUTH FLORIDA MARKETSMiami-Dade, Broward, & Palm Beach Counties
• High recognition and superior performance• Planned cannibalization but existing stores steadily build back
LOWER TO MEDIUM PENETRATED MARKETSJacksonville, Fort Myers, Tampa, & Orlando
• Driving higher brand awareness through increased media penetration and new openings
EMERGING MARKETSTexas, Atlanta & Nashville
• Robust development pipeline in Texas• Build out Nashville and Atlanta over time as trade areas develop
Development Strategy
12

Attractive New Restaurant Economics
($s in millions)
Average Unit Volume $2.2+Cash Investment Costs1 $1.4 - $2.0Cash-on-Cash Return ~25%+
Targeted New Restaurant Economics(2nd Year of Opening)
1. Pre-opening cost not included in investment cost. Assumes land lease with cash investment for building and FF&E. Company targets free-standing locations due to drive-thru. In the event of an existing building conversion, cash investment cost would be on the lower end of the range.
13

Accelerating Growth and National Potential
124 Company and 37 Franchise Restaurants 26-28 New Company Restaurants in 2015, or ~ 20% Company
Restaurant Growth Short-term Southeast Focus; Long-term National Potential Non-traditional U.S. Licensing Opportunities
10 / 0
5 / 0
107 / 5
Current U.S. FootprintNew Company-Owned Restaurants Opened2010................................................................2011................................................................2012................................................................2013..............................................................2014……………………………...…………….2015……………………………………….
225
1222
26-28E
14
Note: Where two numbers appear in the map, the first represents company-owned restaurants and the second represents franchised restaurants.
Figures as of December 28, 2014.

Fresh, Authentic Flavors of Mexico
15

Fresh, Authentic Flavors of Mexico
16

Potential Secondary Growth Vehicle
17

Potential Secondary Growth Vehicle
18

Potential Secondary Growth Vehicle
167 Company and 7 Franchise Restaurants Opportunistic development of Taco Cabana in Texas Cabana Grill Potential Growth Vehicle Outside of Texas Non-traditional U.S. Licensing Opportunities
Note: Where two numbers appear in the map, the first represents company-owned restaurants and the second represents franchised restaurants.
Figures as of December 28, 2014.
New Company-Owned Restaurants Opened2010....................................................................2011....................................................................2012....................................................................2013....................................................................2014 ....................................................................2015 ..............................................................
14564
2-4E
Current U.S. Footprint
162 / 31 / 0
3 / 0
19
0 / 4
1 / 0

2010 2011 2012 2013 2014
*Sources: Latest company filings and equity research. PBPB and ZOES data are as of 2013.
Taco Cabana AUV GrowthCAGR = 3.2%
$1.6
$1.7
$1.8 $1.8
2010 2011 2012
(FY 2014, $s in millions)*
Pollo Tropical AUV GrowthCAGR = 7.3%
$2.1
$2.3
$2.5 $2.7
$2.7
$2.5 $2.4
$1.8$1.2 $1.1 $1.0
2013
$1.5
Industry-leading AUVs
20
$2.7
2014
$1.8

(FY 2014, % of Restaurant Sales)*
25.9%27.2%
17.9%17.9%
19.1%19.2%
Restaurant-level EBITDA is defined as restaurant sales minus cost of sales, labor, occupancy, other operating and advertising expenses. Pre-opening cost is excluded from the calculation. *Sources: Latest company filings and equity research. ZOES data is as of FY 2013
20.0%
18.3%
Compelling Restaurant-level EBITDA
21

Restaurant Growth Potential
Number of System-wide Restaurants in U.S.
Sources: Company filings, Wall Street research, and company websites. Domestic system wide unit counts as of the most recent filings. Moe’s locations based on an estimate as of 7/14/14.
Note: Company and franchise Taco Cabana and Pollo Tropical restaurants as of December 28, 2014.
1,880
641
550
439 415
363
174
Unit 3,200 4,500 2,000 N/A 2,500 N/A N/A N/A 1,600 N/APotential% of Unit 59% 40% 32% N/A 18% N/A N/A N/A 8% N/APotential
1,783
129
22
132

Financial Overview

Sales Growth and Margin Trends8.1%
5.9%6.6%
0.0%1.0%2.0%3.0%4.0%5.0%6.0%7.0%8.0%9.0%
2012 2013 2014
SSS Growth
25.6%
26.3%
25.9%
25.2%
25.4%
25.6%
25.8%
26.0%
26.2%
26.4%
2012 2013 2014
Restaurant-level EBITDA
Note: restaurant-level EBITDA excludes pre-opening costs
24

Sales Growth and Margin Trends
16.9%16.7%
17.9%
16.0%16.2%16.4%16.6%16.8%17.0%17.2%17.4%17.6%17.8%18.0%
2012 2013 2014
Restaurant-level EBITDA
4.7%
0.5%
3.3%
0.0%0.5%1.0%1.5%2.0%2.5%3.0%3.5%4.0%4.5%5.0%
2012 2013 2014
SSS Growth
Note: restaurant-level EBITDA excludes pre-opening costs
25

Strong 2014 Financial Results
($s in millions) 2014 2013 % GrowthRestaurant Sales $608.5 $549.0Franchise Revenues $2.6 $2.4
Total Revenues $611.1 $551.3 10.8%Restaurant-level EBITDA $133.2 $116.5 14.3%
% Restaurant Sales 21.9% 21.2%Income from Operations $59.4 $47.5 25.0%
% Revenues 9.7% 8.6%Adjusted Net Income $36.4 $20.2 80.4%
% Revenues 6.0% 3.7%Adj. Diluted Earnings Per Share $1.36 $0.84 61.9%
26Note: restaurant-level EBITDA excludes pre-opening costs.

Focused Capital Allocation
($s in millions) 2015F Capital ExpendituresHigh Low
New Restaurant Development $77 $70Remodeling, Reimaging & Maintenance $15 $14IT & Other Projects $8 $6
Total Capital Expenditures $100 $90
New Restaurant Development Focused on Pollo Tropical
Will Complete the Remodeling Initiative at Taco Cabana By Mid 2015
Implementing a New Remodeling Initiative at Pollo Tropical
Ongoing Strategic Investments to Optimize Restaurant Management, Guest Experience and Infrastructure
27

Improved Leverage and Liquidity
($s in millions) FY 2014 FY 2013 FY 2012Senior Secured Second Lien Notes - - $200.0Senior Secured Credit Facility $66.0 $71.0 -Capital Leases $1.3 $1.4 $1.0Lease Financing Obligations $1.7 $1.7 $3.0
Total Debt $69.0 $74.0 $204.0Less: Cash and Cash Equivalents $5.1 $11.0 $15.5
Total Net Debt $63.9 $63.0 $188.5Total Adjusted EBITDA (TTM) $85.7 $69.8 $64.2Total Net Debt / Total Adjusted EBITDA 0.7x 0.9x 2.9x
Repurchased $200M, 8.875% Notes in Q4 2013$135M equity offering net proceeds New 5-year $150M revolving credit facility (currently, LIBOR + 150 bps)
End of Q4 2014, $75.2M in Borrowing Capacity New Capital Structure Contributed ~ 25% EPS Growth in 2014
28

Commodity Cost Overview
Commodity% of
COGSChicken 43.9 %Pork 6.4 %Dinner Rolls 2.4 %Plantains 2.3 %Rice 2.0 %
Commodity% of
COGSFajita Beef 12.0 %Cheese 9.4 %Fajita Chicken 5.3 %Tortilla Dough 5.0 %Avocado Pulp 2.4 %
The Company Contracts Commodities With Some Suppliers
2015 Projected Commodity Increase ~ Mid Single Digits
2015 Commodities Under Fixed Pricing ~ 70%-80% COGS
The Company Plans to Offset Commodity Cost Increases with Pricing, Cost Mitigation Tactics and Expense Savings Opportunities
Top 5 Food Purchases Top 5 Food Purchases
29

Appendix
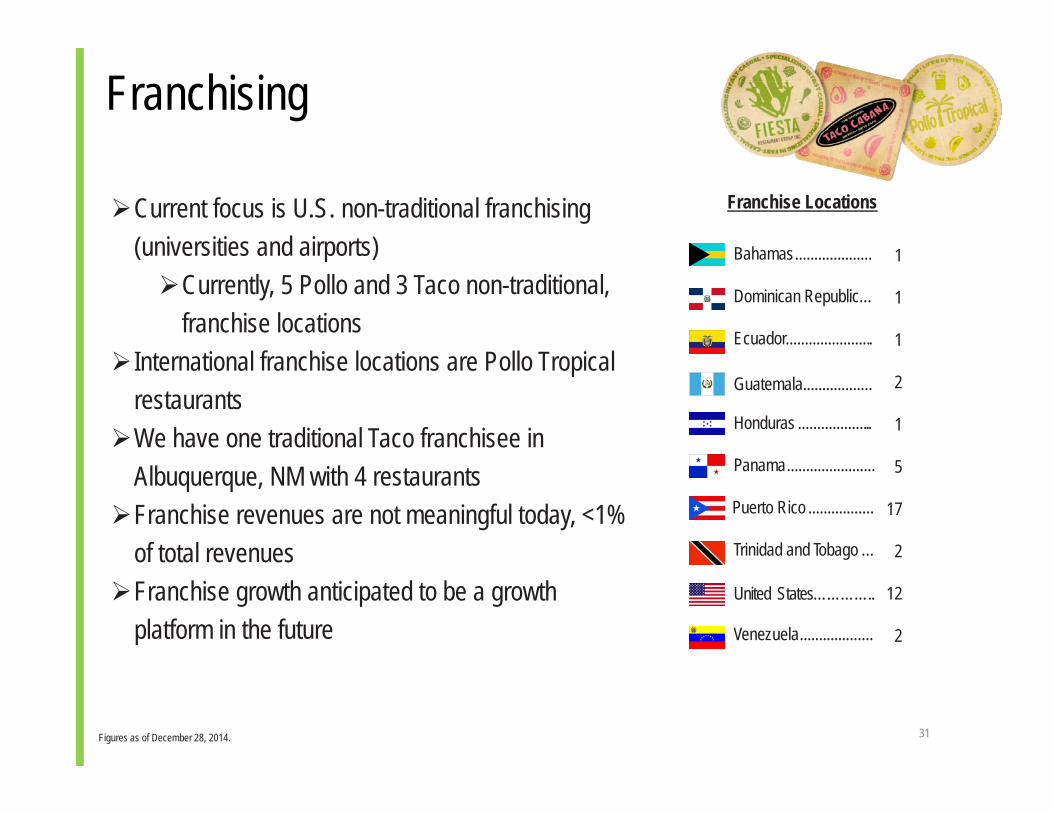
Franchise Locations
Bahamas....................
Dominican Republic…
Ecuador.......................
Honduras ....................
Guatemala..................
Panama.......................
Puerto Rico .................
Trinidad and Tobago …
Venezuela...................
Figures as of December 28, 2014.
1
1
1
2
1
5
17
2
12
2
Current focus is U.S. non-traditional franchising (universities and airports)Currently, 5 Pollo and 3 Taco non-traditional,
franchise locationsInternational franchise locations are Pollo Tropical
restaurantsWe have one traditional Taco franchisee in
Albuquerque, NM with 4 restaurantsFranchise revenues are not meaningful today, <1%
of total revenuesFranchise growth anticipated to be a growth
platform in the futureUnited States…………..
Franchising
31

1. Adjusted EBITDA for each of our Pollo Tropical and Taco Cabana segments includes an allocation of general and administrative expenses associated with administrative support for executive management; information systems; and certain accounting, legal, supply chain, development, and other administrative functions.
($s in millions) FY2012 FY2013 FY2014
Restaurant-level Adjusted EBITDA Excluding Pre-Opening Costs:Pollo Tropical 58.2$ 67.8$ 79.0$ Taco Cabana 47.2 48.7 54.2Consolidated 105.4$ 116.5$ 133.2$
Less:Pre-Opening Costs 1.7 2.8 4.1
Restaurant-level Adjusted EBITDA:Pollo Tropical 57.1 65.7 75.6Taco Cabana 46.6 48.0 53.5Consolidated 103.7$ 113.7$ 129.1$
Add:Franchise Royalty Revenues and Fees 2.4 2.4 2.6
Less:General and Administrative (Excluding Stock-based Compensation) 41.8 46.2 46.0
Adjusted EBITDA1:Pollo Tropical 38.6 43.7 52.7Taco Cabana 25.6 26.1 33.0Consolidated 64.2$ 69.8$ 85.7$
Less:Depreciation and Amortization 18.3 20.4 23.0Impairment and Other Lease Charges 7.0 0.2 0.4Interest Expense 24.4 18.0 2.2Loss on Extinguishment of Debt - 16.4 - Provision for Income Taxes 4.3 3.8 21.0Stock-Based Compensation 2.0 2.3 3.5Other Expense / (Gain) (0.1) (0.6) (0.6)Net Income 8.3$ 9.3$ 36.2$
Total Adjusted EBITDA Reconciliation
32

1. Restaurant-level adjusted EBITDA does not include franchise royalty revenues and fees or the allocation of corporate G&A expenses and brand G&A expenses for the applicable segment. Pre-opening expenses include costs incurred prior to opening a restaurant, including restaurant employee wages and related expenses, travel expenditures, recruiting, training and rent, in addition to promotional costs associated with the restaurant opening.
2. Adjusted EBITDA is defined as earnings attributable to the applicable segment before interest, loss on extinguishment of debt, income taxes, depreciation and amortization, impairment and other lease charges, stock-based compensation expense and other income and expense. It includes an allocation of corporate G&A expenses and brand G&A expenses (each excluding stock-based compensation).
3. Excludes stock-based compensation.
($s in millions) FY2012 FY2013 FY2014
Restaurant Sales 227.4$ 257.8$ 305.4$ Less:Cost of Sales 75.4 85.5 100.5Restaurant Wages and Related Expenses3 53.6 57.9 67.5Restaurant Rent Expense 7.7 10.1 12.5Other Restaurant Operating Expenses 26.8 30.8 38.3Advertising Expense 5.7 5.7 7.7Restaurant-Level Adjusted EBITDA Excluding Pre-Opening Costs1 58.2$ 67.8$ 79.0$ Less: Pre-Opening Costs 1.1 2.0 3.4Restaurant-Level Adjusted EBITDA1 57.1$ 65.7$ 75.6$ Add: Franchise Revenue 1.9 1.9 2.1Less: General and Administrative Expenses3 20.4 23.9 24.9Adjusted EBITDA2 38.6$ 43.7$ 52.7$
Adjusted EBITDA Reconciliation
33

1. Restaurant-level adjusted EBITDA does not include franchise royalty revenues and fees or the allocation of corporate G&A expenses and brand G&A expenses for the applicable segment. Pre-opening expenses include costs incurred prior to opening a restaurant, including restaurant employee wages and related expenses, travel expenditures, recruiting, training, and rent, in addition to promotional costs associated with the restaurant opening.
2. Adjusted EBITDA is defined as earnings attributable to the applicable segment before interest, loss on extinguishment of debt, income taxes, depreciation and amortization, impairment and other lease charges, stock-based compensation expense and other income and expense. It includes an allocation of corporate G&A expenses and brand G&A expenses (each excluding stock-based compensation).
3. Excludes stock-based compensation.
($s in millions) FY2012 FY2013 FY2014
Restaurant Sales 279.9$ 291.1$ 303.1$ Less:Cost of Sales 88.1 90.6 91.8Restaurant Wages and Related Expenses3 82.6 85.5 87.6Restaurant Rent Expense 13.9 16.7 17.2Other Restaurant Operating Expenses 37.0 38.2 40.6Advertising Expense 11.1 11.4 11.8Restaurant-Level Adjusted EBITDA Excluding Pre-Opening Costs1 47.2$ 48.7$ 54.2$ Less: Pre-Opening Costs 0.6 0.7 0.7Restaurant-Level Adjusted EBITDA1 46.6$ 48.0$ 53.5$ Add: Franchise Revenue 0.5 0.5 0.5Less: General and Administrative Expenses3 21.4 22.4 21.1Adjusted EBITDA2 25.6$ 26.1$ 33.0$
Adjusted EBITDA Reconciliation
34
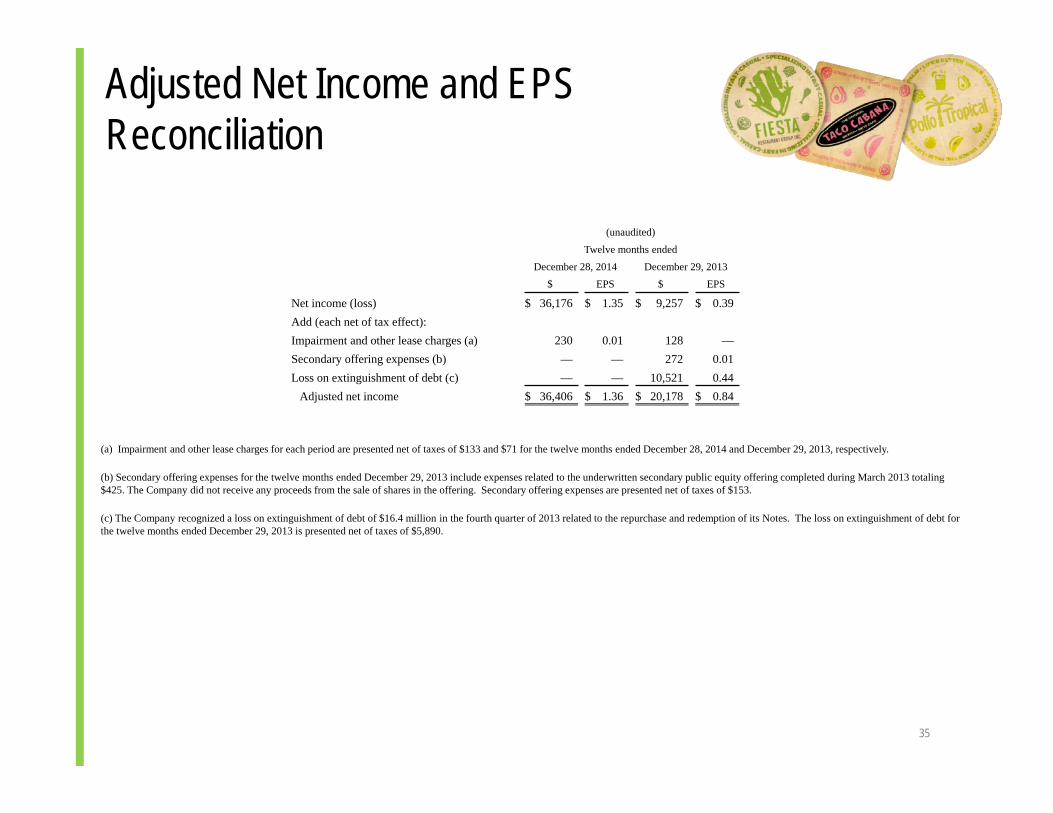
(a) Impairment and other lease charges for each period are presented net of taxes of $133 and $71 for the twelve months ended December 28, 2014 and December 29, 2013, respectively.
(b) Secondary offering expenses for the twelve months ended December 29, 2013 include expenses related to the underwritten secondary public equity offering completed during March 2013 totaling $425. The Company did not receive any proceeds from the sale of shares in the offering. Secondary offering expenses are presented net of taxes of $153.
(c) The Company recognized a loss on extinguishment of debt of $16.4 million in the fourth quarter of 2013 related to the repurchase and redemption of its Notes. The loss on extinguishment of debt for the twelve months ended December 29, 2013 is presented net of taxes of $5,890.
Adjusted Net Income and EPS Reconciliation
35
(unaudited)Twelve months ended
December 28, 2014 December 29, 2013$ EPS $ EPS
Net income (loss) $ 36,176 $ 1.35 $ 9,257 $ 0.39Add (each net of tax effect):Impairment and other lease charges (a) 230 0.01 128 —Secondary offering expenses (b) — — 272 0.01Loss on extinguishment of debt (c) — — 10,521 0.44
Adjusted net income $ 36,406 $ 1.36 $ 20,178 $ 0.84

Adjusted EBITDA, restaurant-level adjusted EBITDA, and restaurant-level adjusted EBITDA excluding pre-opening costsfor both of our brands and total adjusted EBITDA, total restaurant-level adjusted EBITDA, and total restaurant-leveladjusted EBITDA excluding pre-opening costs are all non-GAAP financial measures. Management believes that suchfinancial measures, when viewed with our results of operations calculated in accordance with GAAP and our reconciliationof total restaurant-level adjusted EBITDA and total restaurant-level adjusted EBITDA excluding pre-opening costs (andrestaurant-level adjusted EBITDA and restaurant-level adjusted EBITDA excluding pre-opening costs for each of our PolloTropical and Taco Cabana segments) and total adjusted EBITDA (and adjusted EBITDA for each of our Pollo Tropical andTaco Cabana segments) to net income (i) provide useful information about our operating performance and period-over-period growth (including at the restaurant level), (ii) provide additional information that is useful for evaluating the operatingperformance of our business, and (iii) permit investors to gain an understanding of the factors and trends affecting ourongoing earnings, from which capital investments are made and debt is serviced. However, such measures are notmeasures of financial performance or liquidity under GAAP and, accordingly, should not be considered as alternatives tonet income or cash flow from operating activities as indicators of operating performance or liquidity. Also these measuresmay not be comparable to similarly titled captions of other companies.
Adjusted net income and related adjusted earnings per share are non-GAAP financial measures. Adjusted net income isdefined as net income before impairment and other lease charges, secondary offering expenses and loss onextinguishment of debt. Management believes that adjusted net income and related adjusted earnings per share, whenviewed with our results of operations calculated in accordance with GAAP (i) provide useful information about ouroperating performance and period-over-period growth, (ii) provide additional information that is useful for evaluating theoperating performance of our business, and (iii) permit investors to gain an understanding of the factors and trendsaffecting our ongoing earnings, from which capital investments are made and debt is serviced. However, such measuresare not measures of financial performance or liquidity under GAAP and, accordingly should not be considered asalternatives to net income or net income per share as indicators of operating performance or liquidity. Also these measuresmay not be comparable to similarly titled captions of other companies.
Use of Non-GAAP Financial Measures
36