Embed Size (px)
Citation preview

Investor Presentation
B. Riley/FBR Meetings - January 2019Information as of September 30, 2018 Unless Otherwise Noted
11 Fan Pier Blvd. & 50 Northern Ave., Boston, MASquare Feet: 1,651,000

2
WARNING REGARDING FORWARD LOOKING STATEMENTS AND DISCLAIMERS
THIS PRESENTATION CONTAINS FORWARD LOOKING STATEMENTS WITHIN THE MEANING OF THE PRIVATE SECURITIES LITIGATION REFORM ACT OF 1 995AND OTHER SECURITIES LAWS. OUR FORWARD LOOKING STATEMENTS REFLECT OUR CURRENT VIEWS, INTENTS AND EXPECTATIONS WITH RESPECT TO, AMONG OTHER THINGS, OUR OPERATIONS AND FINANCIAL PERFORMANCE. OUR FORWARD LOOKING STATEMENTS CAN BE IDENTIFIED BY THE USE OF
WORDS SUCH AS “OUTLOOK,” “BELIEVE,” “EXPECT,” “POTENTIAL,” “WILL,” “MAY,” “ESTIMATE,” “ANTICIPATE” AND DERIVATIVES OR NEGATIV ES OF SUCH WORDS OR SIMILAR WORDS. SUCH FORWARD LOOKING STATEMENTS ARE SUBJECT TO VARIOUS RISKS AND UNCERTAINTIES. ACCORDINGLY, THERE ARE OR WILL BE FACTORS THAT COULD CAUSE ACTUAL OUTCOMES OR RESULTS TO DIFFER MATERIALLY FROM THOSE STATED OR IMPLIED IN THESE
STATEMENTS. WE BELIEVE THESE FACTORS INCLUDE, BUT ARE NOT LIMITED TO THE FOLLOWING: A) SUBSTANTIALLY ALL OF OUR REVENUES ARE DERIVED FROM SERVICES TO A LIMITED NUMBER OF CLIENT COMPANIES; B) OUR REVENUES ARE HIGHLY VARIABLE; C) CHANGING MARKET CONDITIONS, INCLUDING RISING INTEREST RATES MAY ADVERSELY IMPACT OUR CLIENT COMPANIES AND OUR BUSINESS WITH THEM; D) POTENTIAL TERMINATIONS OF
OUR MANAGEMENT AGREEMENTS WITH OUR CLIENT COMPANIES; E) OUR ABILITY TO EXPAND OUR BUSINESS DEPENDS UPON THE GROWTH AND PERFORMANCE OF OUR CLIENT COMPANIES AND OUR ABILITY TO OBTAIN OR CREATE NEW CLIENTS FOR OUR BUSINESS AND IS OFTEN DEPENDENT UPON CIRCUMSTANCES BEYOND OUR CONTROL; F) LITIGATION RISKS; G) ALLEGATIONS, EVEN IF UNTRUE, OF ANY CONFLICTS OF INTEREST ARIS ING
FROM OUR MANAGEMENT ACTIVITIES; H) OUR ABILITY TO RETAIN THE SERVICES OF OUR KEY PERSONNEL; AND I) RISKS ASSOCIATED WITH AND COSTS OF COMPLIANCE WITH LAWS AND REGULATIONS, INCLUDING SECURITIES REGULATIONS, EXCHANGE LISTING STANDARDS AND OTHER LAWS AND REGULATIONS AFFECTING PUBLIC COMPANIES. IN ADDITION, THIS PRESENTATION STATES THAT IT IS EXPECTED THAT THE RMR OFFICE PROPERTY FUND
WILL RAISE $1 BILLION IN AUM OVER THE NEXT FIVE YEARS. THERE ARE OR WILL BE ADDITIONAL IMPORTANT FACTORS THAT COULD CAUSE BUS INESS OUTCOMES OR FINANCIAL RESULTS TO DIFFER MATERIALLY FROM THOSE STATED OR IMPLIED IN OUR FORWARD LOOKING STATEMENTS. FOR EXAMPL E, CHANGING MARKET CONDITIONS, INCLUDING RISING INTEREST RATES, MAY LOWER THE MARKET VALUE OF OUR MANAGED EQUITY REITS OR CAUSE
THE REVENUES OF OUR MANAGED OPERATORS TO DECLINE AND, AS A RESULT, OUR REVENUES MAY DECLINE. WE HAVE BASED OUR FORWARD LOOKING STATEMENTS ON OUR CURRENT EXPECTATIONS ABOUT FUTURE EVENTS THAT WE BELIEVE MAY AFFECT OUR BUSINESS, FINANCIAL CONDITI ON AND RESULTS OF OPERATIONS. BECAUSE FORWARD LOOKING STATEMENTS ARE INHERENTLY SUBJECT TO RISKS AND UNCERTAINTIES, SOME OF WHICH
CANNOT BE PREDICTED OR QUANTIFIED, OUR FORWARD LOOKING STATEMENTS SHOULD NOT BE RELIED ON AS PREDICTIONS OF FUTURE EVENTS. THE EVENTS AND CIRCUMSTANCES REFLECTED IN OUR FORWARD LOOKING STATEMENTS MAY NOT BE ACHIEVED OR OCCUR AND ACTUAL RESULTS COULD DIFFER MATERIALLY FROM THOSE PROJECTED OR IMPLIED IN OUR FORWARD LOOKING STATEMENTS. THE MATTERS DISCUSSED IN THIS WARNING SHOULD NOT BE CONSTRUED AS EXHAUSTIVE AND SHOULD BE READ IN CONJUNCTION WITH RMR’S FILINGS WITH THE SECURITIES AND EXCHANGE
COMMISSION, OR THE SEC, INCLUDING RMR’S 10-K FILED ON DECEMBER 3, 2018, ESPECIALLY THE SECTIONS ENTITLED “RISK FACTORS” AND “WARNING CONCERNING FORWARD LOOKING STATEMENTS”, FOR OTHER REASONS WHY OUR FORWARD LOOKING STATEMENTS MAY NOT OCCUR. WE UNDERTAKE NO OBLIGATION TO UPDATE ANY FORWARD LOOKING STATEMENT, WHETHER AS A RESULT OF NEW INFORMATION, FUTURE DEVELOPMENTS
OR OTHERWISE, EXCEPT AS REQUIRED BY LAW.
THIS PRESENTATION INCLUDES EBITDA, ADJUSTED EBITDA AND ADJUSTED EBITDA MARGIN FOR RMR, WHICH ARE NOT MEASURES PRESCRIBED BY
ACCOUNTING PRINCIPLES GENERALLY ACCEPTED IN THE UNITED STATES (“U.S. GAAP”), AND THIS INFORMATION SHOULD NOT BE CONSIDERED AS ANALTERNATIVE TO NET INCOME, INCOME FROM CONTINUING OPERATIONS, OPERATING PROFIT, CASH FLOW FROM OPERATIONS OR ANY OTHER OPERATING OR LIQUIDITY PERFORMANCE MEASURE PRESCRIBED BY U.S. GAAP.

3
THE RM R GROUP IS A DYNAMIC ALTERNATIVE ASSET M ANAGER
$30.1 Billion in
AUM
(1) Management team can be found in the Appendix on slide 24.
(2) Map of offices can be found in the Appendix on slide 25.
Almost 600 CRE
Professionals(1)
More than 30 Offices
Throughout the U.S.(2)
C O M B INE D R M R
M ANAG E D C O M PANIE S :
$12 Billion in
Annual Revenues
Over
52,000 Employees
Over 1,700
Properties
The RMR Group Inc. (Nasdaq: RMR) is a holding company and substantially all of its business is conducted by its
majority owned operating subsidiary, The RMR Group LLC, an alternative asset management company
principally engaged in commercial real estate (CRE) businesses. It was founded in 1986 to manage CRE
companies and related businesses.
R M R ’S R E AL E S TATE
E XPE R TIS E
Office
Industrial
Government
Medical Office
Life Science
Senior Living
Hotels
Travel Centers

4
New Growth
Platforms
• In the past 18 months, RMR has:• Created three new client companies:➢ Tremont Mortgage Trust (Nasdaq: TRMT).
➢ Industrial Logistics Properties Trust (Nasdaq: ILPT).➢ RMR Office Property Fund LP (Private).
• Merged two REITS to become Office Properties Income Trust (Nasdaq: OPI)
Security with
Substantial
Upside
• 20-year evergreen contracts with the four equity REITs that include substantial
termination payments.
• Recurring management fees provide stable revenue stream (82.7% of RMR’s
revenues).
• Incentive management fee provides upside potential.
WHY YOU SHOULD BE INTERESTED IN RM R
Credibility • Since becoming public in 2015, RMR has delivered on its strategic goals.
Spectrum of
Client
Companies
• Four equity REITs(1).
• Three real estate operating companies.
• Three other real estate related businesses.
Track Record
&
Cash Position
• Proven track record of sustainable growth since the IPO.
• $256.8 million in cash and cash equivalents and no debt.
• Recent 40% increase in annual dividend rate to $1.40 per share.
• For 2018 earned additional $120.1 million in incentive fees payable to RMR by
January 31, 2019.
(1) As of 12/31/2018

5
The managed equity REITs have no employees; RMR is responsible for all their day to day operations.
Hospitality Properties Trust
(Nasdaq: HPT)
Industrial Logistics Properties
Trust
(Nasdaq: ILPT)
Office Properties Income
Trust(1)
(Nasdaq: OPI)
Senior Housing Properties
Trust
(Nasdaq: SNH)
HPT owns 524 hotel and retail
properties, located in 45 states, Puerto Rico and
Canada.
• AUM: $10.2 billion.
• Investment Grade Rated: Baa2 (Moody’s) / BBB-
(S&P).
ILPT was formed in 2017, as a
carve out of SIR’s industrial portfolio. ILPT owns 269
industrial and logistics properties, located in 26
states, including 226 properties (buildings, leasable land
parcels and easements) located on the island of
Oahu, Hawaii.
• AUM: $1.5 billion.
OPI owns 213 office and
industrial properties that are majority leased to single
tenants and those with high credit quality characteristics
like government entities, located in 38 states and
Washington, D.C.
• AUM: $5.9 billion
• Investment Grade Rated: Baa3 (Moody’s) / BBB-
(S&P).
SNH owns 443 senior living
communities and medical office buildings, located in 42
states and Washington, D.C.
• AUM: $8.6 billion.
• Investment Grade Rated: Baa3 (Moody’s) / BBB-
(S&P).
RM R M ANAGED EQUITY REI T S
(1) As of December 31, 2018

6
Five Star Senior
Living Inc.
(Nasdaq: FVE)
Sonesta International
Hotels Corporation
(Private)
TravelCenters of
America LLC
(Nasdaq: TA)
FVE operates more than 270
senior living communities throughout the U.S.
• Annual revenues of $1.4
billion.(1)
• Approximately 24,500 employees.
Sonesta manages or franchises
more than 70 hotels and cruise ships in seven countries.
• Annual revenues of $383
million.(1)
• Approximately 3,500 employees.
TA operates more than 250 full
service travel centers located along the U.S. Interstate
Highway System.
• Annual revenues of $6.1 billion.(1)
• Approximately 25,000
employees.
RM R REAL EST AT E RELAT ED OPERAT ING COMPANIES
(1) Actual results for the year ended December 31, 2017.
7
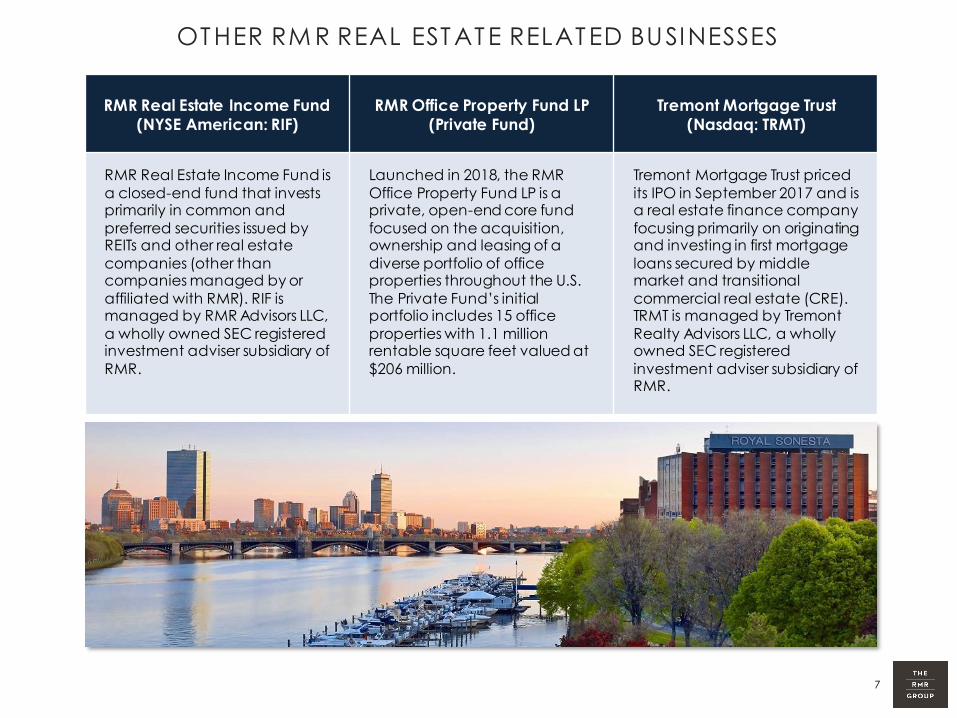
RMR Real Estate Income Fund
(NYSE American: RIF)
RMR Office Property Fund LP
(Private Fund)
Tremont Mortgage Trust
(Nasdaq: TRMT)
RMR Real Estate Income Fund is
a closed-end fund that invests primarily in common and
preferred securities issued by REITs and other real estate
companies (other than companies managed by or
affiliated with RMR). RIF is managed by RMR Advisors LLC,
a wholly owned SEC registered investment adviser subsidiary of
RMR.
Launched in 2018, the RMR
Office Property Fund LP is a private, open-end core fund
focused on the acquisition, ownership and leasing of a
diverse portfolio of office properties throughout the U.S.
The Private Fund’s initial portfolio includes 15 office
properties with 1.1 million rentable square feet valued at
$206 million.
Tremont Mortgage Trust priced
its IPO in September 2017 and is a real estate finance company
focusing primarily on originating and investing in first mortgage
loans secured by middle market and transitional
commercial real estate (CRE). TRMT is managed by Tremont
Realty Advisors LLC, a wholly owned SEC registered
investment adviser subsidiary of RMR.
OTHER RM R REAL ESTATE RELATED BUSINESSES

8
RECENT DEVELOPMENTS AT RM R COM PANIES
• The merger between Government Properties
Income Trust, or GOV, and Select Income REIT, or SIR, to form Office Properties Income Trust closed on
December 31, 2018. OPI started trading on the Nasdaq on January 2, 2019.
• The transaction eliminates cross ownership and the
co-dependence on financial results between GOV, SIR and ILPT.
➢ GOV has sold its 27.8% ownership in SIR to pay
down debt.
➢ SIR has distributed its 69.2% ownership in ILPT to SIR shareholders.
• The combined company has increased scale,
enhanced diversification and a broader investment strategy.
• OPI focuses on owning office buildings primarily
leased to single tenants and high credit quality tenants like government entities.
GOV & SIR Merge to Form OPI
• On December 5, 2018, TA completed the sale of the
Minit Mart convenience store (c-store) business for $330.8 million to EG Group.
• The portfolio being sold includes 225 standalone c-
stores.
• The sale will enable TA to exit the c-store business and focus on its core travel center business.
• TA plans to use the proceeds from the sale to reduce
leverage and/or invest in travel center growth initiatives.
TA Completes Sale of C-Stores
These transactions each help make these client companies stronger over the long-term,
which will ultimately benefit RMR in the long-term.

9
• RMR earns fees pursuant to 20 year Business
Management Agreements and 20 year
Property Management Agreements with the
managed equity REITs.
➢ Business management revenues
principally consist of annual fees based
on 50 bps multiplied by the lower of:
(1) the historical cost of real estate, or
(2) total market capitalization.
➢ Property management revenues
principally consist of annual fees based
on 3.0% of gross rents collected at
certain managed properties.
➢ Business management incentive fees
are equal to 12% of value generated in
excess of benchmark index total returns
per share, subject to caps.(1)
• Revenues earned from TA, FVE and Sonesta
consist of annual fees based on 60 bps
multiplied by revenues (as defined).
• Revenues earned from RIF consist of annual
fees based on 85 bps multiplied by average
assets under management.
• Revenues earned from TRMT consist of an
annual base management fee based on
1.5% of equity and an incentive fee based
on 20% of core earnings over a 7% hurdle
rate.
• Revenues earned from the RMR Office
Property Fund consist of annual fees equal to
1.0% of the Fund’s net asset value, as well as
property management fees based on 3.0%
of gross rents collected.
RMR Managed Equity REITs
Other RMR Real Estate Related Businesses
HOW DOES RM R EARN FEES?
(1) Example of business management incentiv e fee can be found in the Appendix on slide 19.

10
RM R’S EARNED INCENT IVE FEES
JA NUA RY 1, 2015 – DECEMBER 31, 2018
$0
$20
$40
$60
$80
$100
$120
$140
$160
$180
2015 2016 2017 2018
Incentive Fees Paid to RMR by
Managed REITs
($ in millions)
HPT SIR SNH
$62.3
$120.1
$155.9
$52.4

11
TRACK RECORD OF SUSTAINABLE GROWTH SINCE IPO
$140,000,000
$150,000,000
$160,000,000
$170,000,000
$180,000,000
$190,000,000
$200,000,000
2015 2016 2017 2018
Recurring Revenues($ in 000s)
$24,000,000
$25,000,000
$26,000,000
$27,000,000
$28,000,000
$29,000,000
$30,000,000
$31,000,000
2015 2016 2017 2018
AUM($ in 000s)
$0
$50,000,000
$100,000,000
$150,000,000
$200,000,000
$250,000,000
$300,000,000
2015 2016 2017 2018
Cash($ in 000s)
45.0%
50.0%
55.0%
60.0%
Adjusted EBITDA Margin

12
REVENUE BASE
($ in 000s) Three Months Ended September 30, 2018
Business Property Advisory
Management Management Services Total
Client Company Revenues Revenues Revenues $ %
SNH $ 9,684 $ 3,058 $ - $ 12,742 25.7%
HPT 10,586 18 - 10,604 21.4%
SIR 4,405 3,574 - 7,979 16.1%
GOV 4,206 2,318 - 6,524 13.1%
ILPT 1,975 1,205 3,180 6.4%
Managed Equity REITs 30,856 10,173 - 41,029 82.7%
TA 3,906 - - 3,906 7.9%
Fiv e Star 2,307 - - 2,307 4.6%
Sonesta 690 - - 690 1.4%
Managed Operators 6,903 - - 6,903 13.9%
Other (RIF, TRMT, AIC, Tremont, ABP Trust, OEF) 400 456 860 1,716 3.4%
Total $ 38,159 $ 10,629 $ 860 $ 49,648 100.0%
Business Management
77%
Property Management
21%
Advisory2%
Recurring Revenues by Contract
SNH26%
HPT21%
SIR16%
GOV13%
TA8%
ILPT6%
Five Star5%
Other (RIF, TRMT, AIC,
Tremont, ABP Trust)
4%
Sonesta1%
Recurring Revenues by Client

13
Summary Operati ng Statement
(1) The RM R Group Inc intends to pay a cash dividend equal to $0.35 per share of Class A Common Stock per quarter ($1.40 per share per year). Dividends per share
presented assumes all of the membership units of The RM R Group LLC owned by ABP Trust are converted into Class A Common Stock of The RM R Group Inc. The
declaration and payment of dividends is at the discretion of The RM R Group Inc.’s Board of Directors, w hich may change RM R’s dividend policy or discontinue
dividends at any time. As of and for the three month period and fiscal year ending September 30, 2018, w e paid cash dividends of $0.25 per share and $1.00 per
share, respectively.
(2) These adjusted recurring revenues are the base business management fees, property management fees and advisory fees The RMR G roup Inc. earns pursuant to
its management and investment advisory agreements with its client companies. These amounts are calculated pursuant to the contractual formulas and do not
deduct other asset amortization of $2,354 for the three months ended September 30, 2018 and $9,416 for the nine months ended September 30, 2018, required to
be recognized as a reduction to management services revenues in accordance w ith GAAP and do not include the incentive busines s management fee of
$155,881 that The RM R Group Inc. recognized under GAAP during the tw elve months ended September 30, 2018, w hich w as earned fo r the calendar year 2017.
(3) See page 18 for a reconciliation to nearest GAAP measure.
As of and for the
Three Months Ended
September 30, 2018
As of and for the
Fiscal Year Ended
September 30, 2018($ in 000s, except per share data)
Total Revenue $ 65,073 $ 404,979
EBITDA $ 22,639 $ 277,536
Net income attributable to The RMR Group Inc. $ 8,184 $ 96,041
Net income attributable to The RMR Group Inc. per share (diluted) $ 0.50 $ 5.92
Div idends per share(1) $ 0.35 $ 1.40
Adjusted Recurring Operating Results:
Adjusted recurring revenues(2) $ 52,351 $ 205,362
Adjusted recurring EBITDA(3) $ 31,234 $ 120,324
As a % of adjusted recurring revenues 59.7% 58.6%

14
SUMMARY BALANCE SHEET
• $31.2 million of recurring Adjusted EBITDA per quarter.
• No current outstanding debt.
• We expect to principally use operating cash flow to fund growth.
• Flexibility to use debt and/or equity to finance expansion, including possible acquisitions.
($ in 000s) As of
September 30,
2018
Cash and cash equivalents $ 256,848
Other assets 247,580
Total assets $ 504,428
Total debt $ -
Total liabilities 69,767
Total equity 434,661
Total liabilities and equity $ 504,428

15
Three new client companies in
the past 18 months.
AUM has grown by 43.3%.Stock price has appreciated
by 544.0%.
$31.2 million of recurring
Adjusted EBITDA per quarter
Annual revenues have
grown by 19%.
Stable management and advisory
service revenue anchored by long
term contracts.
Diverse sources of revenue.
Well positioned for growth.
Attractive cash flow.
PromisedDecember 2015
Deliveredas of September 30, 2018
RM R HAS DELIVERED ON STRATEGIC GOALS SINCE THE IPO
Recently increased by 40% to
annual rate of $1.40 per shareDividend
16
OUR PLAN OVER THE NEXT 12 -18 M ONTHS
✓ Actively marketing and fundraising the RMR Office Property Fund LP toward stated goal of
$1 billion in AUM.(1)
✓ Find businesses to acquire that either expand existing businesses or are tangential to current
real estate businesses.
✓ Manage our REITs in a manner that leads to being paid based on historical asset value for all
REITs.
✓ Manage our REITs in a manner that results in outperformance relative to the peer indices to
earn incentive management fees.
✓ Grow our existing REITs.
(1) To be completed within the next fiv e years.

17
➢
Clean up if you can.
Appendix

18
RECONCILIATION OF NON-GAAP FINANCIAL METRICS
(1) EBI TDA, Adjust ed EBI TDA and Adjust ed EBI TDA M argin are non-GAAP financial measures calculat ed as present ed in t he t ables above. The RM R Group I nc. cons iders EBI TDA, Adjust ed EBI TDA and
Adjust ed EBI TDA M argin t o be appropriat e supplement al measures of it s operat ing performance, along w it h net income, net incom e at tributable t o The RM R Group I nc. and operat ing income. The RM R Group I nc. believes t hat EBITDA, Adjust ed EBI TDA and Adjust ed EBI TDA M argin provide useful informat ion t o investors becau se by excluding t he effect s of cert ain amount s, such as income tax
expense, depreciat ion and amort izat ion, ot her asset amort izat ion, operat ing expenses paid in The RM R Group I nc. 's common shares, separat ion cost s , transact ion and acquis it ion relat ed cost s,
bus iness email compromise fraud cost s , t ax receivable agreement remeasurement due t o t he Tax Cut s and Jobs Act , incent ive bus iness management fees earned, and cert ain ot her net
adjust ment s , EBITDA, Adjust ed EBI TDA and Adjust ed EBI TDA M argin may facilit at e a comparison of current operat ing performance w it h The RM R Group I nc.’s historical operat ing performance and w it h the performance of ot her asset management bus inesses. In addit ion, The RM R Group I nc. believes that providing Adjust ed EBI TDA M argin may help invest ors assess The RM R Group I nc.’s
performance of it s bus iness by providing t he margin t hat Adjust ed EBI TDA represent s t o it s contract ual management and advisory fees (excluding any incent ive bus iness management fees). EBITDA,
Adjust ed EBI TDA and Adjust ed EBI TDA M argin do not represent cash generat ed by operat ing act ivit ies in accordance w it h GAAP and should not be cons idered as alt ernat ives to net income, net
income at t ribut able t o The RM R Group I nc. or operat ing income as an indicat or of The RM R Group I nc.’s financial performance or as a measure of The RM R Group I nc.’s liquidity. These measures should be cons idered in conjunct ion w ith net income, net income at tributable t o The RM R Group I nc. and operat ing income as present ed in The RM R Group I nc. 's condensed consolidat ed
st at ements of income. Also, ot her asset management bus inesses may calculat e EBI TDA, Adjust ed EBI TDA and Adjust ed EBI TDA M argi n different ly t han The RM R Group I nc. does.
(2) These cont ract ual management fees are t he base bus iness management fees, propert y management fees and advisory fees The RM R Group I nc. earns pursuant t o it s management and
invest ment advisory agreement s w ith its client companies. These amount s are calculat ed pursuant t o t he cont ract ual formulas and do not deduct ot her asset amort izat ion of $2,354 for t he t hree mont hs ended Sept ember 30, 2018 and $9,416 for t he t w elve months ended June 30, 2018, required t o be recognized as a reduct ion t o management services revenues in accordance w it h GAAP
and do not include t he incent ive bus iness management fee of $155,881 t hat The RM R Group I nc. recognized under GAAP during t he t w elve months ended Sept ember 30, 2018, w hich w as earned
for t he calendar year 2017.
For the Three Months Ended For the Fiscal Year Ended
($ in 000s) September 30, September 30,
2018 2018
Reconciliation of Adjusted Revenues:(1)
Total rev enues $ 65,073 $ 404,979
Plus: other asset amortization 2,354 9,416
Less: incentiv e business management fees earned - (155,881)
Less: reimbursable payroll and related costs (15,076) (53,152)
Adjusted Rev enues $ 52,351 $ 205,362
Reconciliation of EBITDA and Adjusted EBITDA From Net Income:(1)
Net income $ 19,011 $ 217,426
Plus: income tax expense 3,376 58,862
Plus: depreciation and amortization 252 1,248
EBITDA 22,639 277,536
Plus: other asset amortization 2,354 9,416
Plus: operating expenses paid in The RMR Group Inc.'s common shares 1,567 4,348
Plus: separation costs 1,372 3,247
Plus: transaction and acquisition related costs 780 1,697
Plus: business email compromise fraud costs - 225
Plus: impairment loss on TRMT investment 4,359 4,359
Less: certain one time compensation adjustments (1,847) -
Less: tax receivable agreement remeasurement due to the Tax Cuts and Jobs Act - (24,710)
Less: incentive business management fees earned - (155,881)
Certain other net adjustments 10 87
Adjusted EBITDA $ 31,234 $ 120,324
Calculation of Adjusted EBITDA Margin:(1)
Contractual management and advisory fees(2) $ 52,351 $ 205,362
Adjusted EBITDA $ 31,234 $ 120,324
Adjusted EBITDA Margin 59.7% 58.6%

19
HOW T O CALCULATE INCENT IVE M ANAGEMENT FEESThe annual incentive fee is equal to twelve percent (12%) of the product of the Equity Market Capitalization and the amount by which the Total Return per share exceeds the Benchmark Return per share for each Managed Equity REIT. For example, the calculation of the 2017 annual incentive fee from Hospitality Properties Trust (HPT) is below:
(1) Weighted amounts are adjusted for additional common shares issued during the M easurement Period.
(2) The average closing price for the 10 consecutive trading days having the highest average closing prices during the final 30 t rading days of the
M easurement Period.
Measurement Period:
Begin Date 1/1/2015
End Date 12/31/2017
Incentive fee calculation:
Weighted shares outstanding(1) 157,118,566
Weighted share price at beginning of measurement period(1) $ 30.97
Equity Market Capitalization $ 4,865,961,989
Total return % in excess of benchmark return % or adjusted benchmark return % 15.01%
Product $ 730,380,895
Contractual percentage 12%
Incentive fee calculation $ 87,645,707
Total return in excess of benchmark return calculation:
Weighted share price at beginning of measurement period(1) $ 30.97
Final share price at end of measurement period(2) 30.25
Change (0.72)
Weighted dividends declared during the measurement period(1) 6.14
Total return per share $ 5.42
Weighted total return %(1) 17.50%
Weighted SNL U.S. REIT Hotel Index total return % (benchmark)(1) 2.49%
Total return % in excess of benchmark return % 15.01%
Maximum incentive fee calculation:
Total shares at end of measurement period 164,349,141
Percentage 1.50%
Subtotal 2,465,237
Final share price at end of measurement period(2) $ 30.25
Incentive Fee cap $ 74,573,423
Incentive fee payable (lessor of calculated amount or maximum fee) $ 74,573,423

20
EXPLANAT ION OF RM R INC.’S EFFECT IVE TAX RATE
RMR LLC is treated as a partnership for U.S. federal and most applicable state and local income tax purposes. As a
partnership, RMR LLC is generally not subject to U.S. federal and most state income taxes. Any taxable income or
loss generated by RMR LLC is passed through to and included in the taxable income or loss of its members,
including RMR Inc. and ABP Trust. RMR Inc. is a corporation subject to U.S. federal and state income tax with
respect to our allocable share of any taxable income of RMR LLC.
The following is an illustration calculating our effective tax rate for the three months ending September 30, 2018
and for our 2019 Fiscal Year:
(1) On December 22, 2017, the U.S. gov ernment enacted comprehensiv e tax legislation commonly referred to as the Tax Cuts and Jobs Act. Since we
hav e a September 30 fiscal year end, the lower corporate income tax rate of 21.0% will be phased in, resulting in a federal statutory tax rate of approximately 24.5% for our fiscal year ending September 30, 2018, and the new corporate income tax rate of 21.0% for subsequent fiscal years
thereafter.
Three Months Ending
September 30, 20182019 Fiscal Year
Federal Statutory Rate(1) 24.5% 21.0%
Blended State Statutory Rate 5.5% 5.7%
Subtotal 30.0% 26.7%
RMR Inc. Ownership Percentage in RMR LLC 51.9% 52.0%
Effective Tax Rate 15.6% 13.9%
21
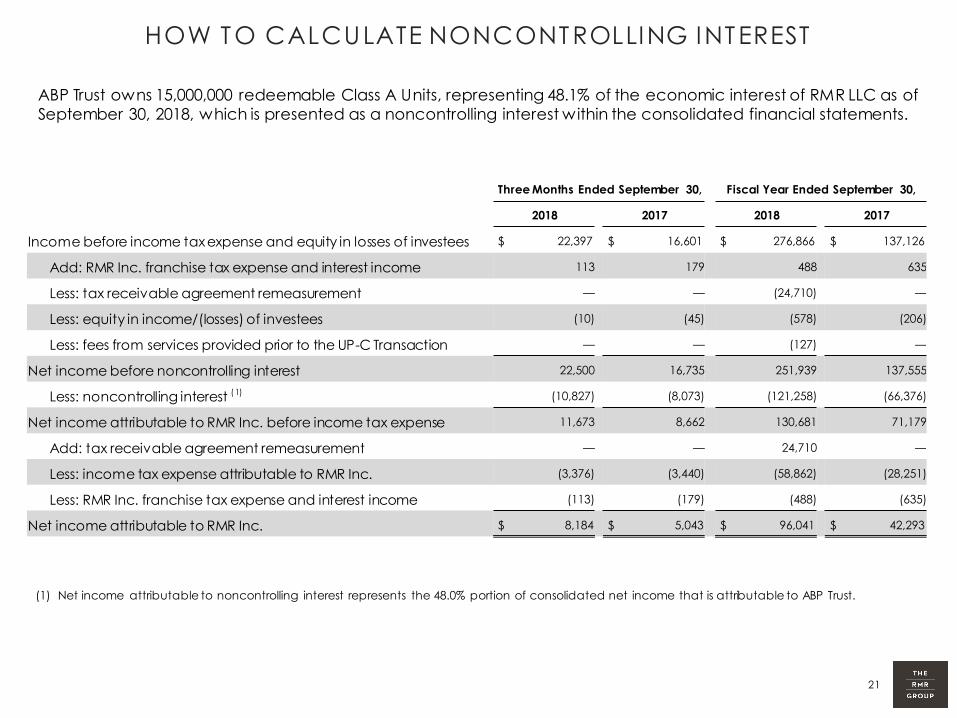
HOW TO CALCULATE NONCONTROLLING INTEREST
ABP Trust owns 15,000,000 redeemable Class A Units, representing 48.1% of the economic interest of RMR LLC as of
September 30, 2018, which is presented as a noncontrolling interest within the consolidated financial statements.
(1) Net income attributable to noncontrolling interest represents the 48.0% portion of consolidated net income that is attributable to ABP Trust.
Three Months Ended September 30, Fiscal Year Ended September 30,
2018 2017 2018 2017
Income before income tax expense and equity in losses of investees $ 22,397 $ 16,601 $ 276,866 $ 137,126
Add: RMR Inc. franchise tax expense and interest income 113 179 488 635
Less: tax receivable agreement remeasurement — — (24,710) —
Less: equity in income/(losses) of investees (10) (45) (578) (206)
Less: fees from services provided prior to the UP-C Transaction — — (127) —
Net income before noncontrolling interest 22,500 16,735 251,939 137,555
Less: noncontrolling interest (1) (10,827) (8,073) (121,258) (66,376)
Net income attributable to RMR Inc. before income tax expense 11,673 8,662 130,681 71,179
Add: tax receivable agreement remeasurement — — 24,710 —
Less: income tax expense attributable to RMR Inc. (3,376) (3,440) (58,862) (28,251)
Less: RMR Inc. franchise tax expense and interest income (113) (179) (488) (635)
Net income attributable to RMR Inc. $ 8,184 $ 5,043 $ 96,041 $ 42,293

22
Earnings per common share reflects net income attributable to RMR Inc. div ided by our weighted av erage common shares outstand ing. Basic and
diluted weighted av erage common shares outstanding represents our outstanding Class A Common Shares and our Class B-1 Common Shares during the applicable periods. Our Class B-2 Common Shares, which are paired with ABP Trust’s Class A Units, hav e no independent economic interest in RMR Inc. and thus
are not included as common shares outstanding for purposes of calculating our net income attributable to RMR Inc. per share.
Unv ested Class A Common Shares granted to our employees are deemed participating securities for purposes of calculating earnings per common share, as they hav e div idend rights. We calculate earnings per share using the two-class method. Under the two-class method, we allocate earnings
proportionately to v ested Class A Common Shares and Class B-1 Common Shares outstanding and unv ested Class A Common Shares outstanding for the period. Earnings attributable to unv ested Class A Common Shares are excluded from earnings per share under the two-class method as reflected in our condensed
consolidated statements of comprehensiv e income.
The calculation of basic and diluted earnings per share is as follows:
The 15,000,000 Class A Units that we do not own may be redeemed for our Class A Common Shares on a one for one basis, or upon such redemption, we
may elect to pay cash instead of issuing Class A Common Shares. Upon redemption of a Class A Unit, our Class B-2 Common Shares “paired” with such unit is canceled for no additional consideration. If all outstanding Class A Units that we do not own had been redeemed for our Class A Common Shares in the periods
presented, our Class A Common Shares outstanding as of September 30, 2018, would hav e been 30,229,957. In computing the dilutiv e effect, if any, that the aforementioned redemption would hav e on earnings per share, we considered that net income av ailable to holders of our Class A Common Shares would
increase due to elimination of the noncontrolling interest (including any tax impact). For the periods presented, such redemption is not reflected in diluted earnings per share as the assumed redemption would be anti-dilutiv e.
COMMON SHARE AM OUNTS
Three Months Ended September 30, Fiscal Year Ended September 30,
2018 2017 2018 2017
Basic EPS
Numerator:
Net income attributable to RMR Inc. $ 8,184 $ 5,043 $ 96,041 $ 42,293
Income attributable to unvested participating securities (47) (21) (564) (158)
Net income attributable to RMR Inc. used in calculating basic EPS $ 8,137 $ 5,022 $ 95,477 $ 42,135
Denominator:
Weighted average common shares outstanding - basic 16,094 16,041 16,077 16,032
Net income attributable to RMR Inc. per common share - basic $ 0.51 $ 0.31 $ 5.94 $ 2.63
Diluted EPS
Numerator:
Net income attributable to RMR Inc. $ 8,184 $ 5,043 $ 96,041 $ 42,293
Income attributable to unvested participating securities (47) (21) (564) (158)
Net income attributable to RMR Inc. used in calculating diluted EPS $ 8,137 $ 5,022 $ 95,477 $ 42,135
Denominator:
Weighted average common shares outstanding - basic 16,094 16,041 16,077 16,032
Dilutive effect of incremental unvested shares 52 21 43 16
Weighted average common shares outstanding - diluted 16,146 16,062 16,120 16,048
Net income attributable to RMR Inc. per common share - diluted $ 0.50 $ 0.31 $ 5.92 $ 2.63

23
CORPORATE STRUCTURE (1)
(1) Based on 15,229,957 shares of Class A common stock and 1,000,000 million shares of Class B -1 common stock outstanding as of September 30, 2018.
(2) The indirect economic interest in The RM R Group LLC is held through The RM R Group Inc.
(3) ABP Trust is beneficially ow ned by Adam Portnoy. In addition to ownership of 1,000,000 million shares of Class B -1 Common Stock,ABP Trust and Adam Portnoy
collectively own 173,365 shares of Class A common stock of The RM R Group Inc. and 15,000,000 million shares of Class B -2 Common Stock, w hich collectively
provide them voting control of The RMR Group Inc.
Public Shareholders
(7.1 million shares of Class A Common
Stock)
Managed REITs (HPT, SNH & OPI)
ABP Trust (Adam
Portnoy)(3)
The RMR Group Inc.
(Nasdaq: RMR)
RMR Advisors LLCTremont Realty Advisors LLC
The RMR
Group LLC
52.0% 48.0%
48.9% 7.3%43.8%
100% 100%
ABP Trust
(Adam Portnoy),
51.8%(3)
Managed
REITs
(HPT, SNH & OPI), 25.4%
Public
Shareholders
(7.1 million shares of Class A
Common Stock),
22.8%
The RMR Group LLC Indirect Economic Interest(2)

24
RMR’s Operations Include:
Accounting Construction Financial Planning Marketing
Acquisitions Development Human Resources Market Research
Administration Dispositions Information Services Risk Management
Building Operations Engineering Investor Relations Tax
Compliance / Internal Audit Finance Leasing
M ANAGEMENT TEAM
* Member of the RMR Executive Operating Committee
1. Adam Portnoy President & Chief Executiv e Officer 19. Richard Siedel Senior Vice President
2. David Blackman* Executiv e Vice President 20. Mark Young Senior Vice President
3. Jennifer Clark* Executiv e Vice President, General Counsel & Secretary 21. Jacquelyn Anderson Vice President, Legal & Assistant General Counsel
4. Matthew Jordan* Executiv e Vice President, Chief Financial Officer & Treasurer 22. Diane Bastianelli Vice President, Acquisitions Diligence & Dispositions
5. John Murray* Executiv e Vice President 23. Christopher Bilotto Vice President, Asset Management
6. Andrew Rebholz* Executiv e Vice President 24. Scott Bloomfield Vice President, Accounting Information Systems
7. Timothy Bonang Senior Vice President 25. Matthew Brown Vice President, Accounting
8. Ethan Bornstein Senior Vice President 26. Fernando Diaz Vice President
9. David Campoli Senior Vice President 27. Brian Donley Vice President, Accounting
10. Richard Doyle Senior Vice President 28. Todd Hargreaves Vice President, Acquisitions
11. Carlos Flores Senior Vice President 29. Jared Lewis Vice President, Underwriting
12. Jennifer Francis Senior Vice President 30. George Martin Vice President, Tax
13. Eileen Kiley Senior Vice President 31. Dan Melia Vice President
14. Douglas Lanois Senior Vice President 32. Steve Milano Vice President, Accounting
15. Jeffrey Leer Senior Vice President 33. Diane Proctor Vice President, Human Resources
16. Bill Myers Senior Vice President 34. Lynn Schemmel Vice President
17. Katherine Potter Senior Vice President, Legal & Assistant General Counsel 35. Vern Larkin Director of Internal Audit
18. Barry Richards Senior Vice President

25
NAT IONAL REAL EST AT E OPERAT ING PLATFORM
Long Island
Newton (Boston)
Los Angeles
San Diego
Baltimore / Annapolis
Honolulu (2)
Washington D.C. (3)
Albuquerque
Austin (2)
Minneapolis
Chicago (2)
Atlanta (2)
Indianapolis
ColumbiaPhoenix
Denver
Dallas
Kansas City (2)
PhiladelphiaSacramento
Houston
Richmond
Seattle
San Jose
Hartford
Ontario, Canada
RMR corporate headquarters
RMR offices
RMR managed property or real estate business location
Puerto Rico
Norfolk

Investor Presentation
B. Riley/FBR Meetings- January 2019Information as of September 30, 2018 Unless Otherwise Noted
11 Fan Pier Blvd. & 50 Northern Ave., Boston, MASquare Feet: 1,651,000