Embed Size (px)
Citation preview

Coastal Profile for Tanzania 2014 - Map and Table Volume III
Investment Prioritization for Resilient Livelihoods and
Ecosystems in Coastal Zones of Tanzania

2
Investment Prioritization for Resilient Livelihoods and Ecosystems in Coastal Zones of Tanzania
For more information contact: WORLD BANK – AFRICA REGION, Tanzania Contact: Ann Jeannette Glauber E-mail: [email protected] DHI, Denmark Contact: Gorm Jeppesen E-mail: [email protected] SAMAKI Consultants, Tanzania Contact: Matthew Richmond E-mail: [email protected]
Introduction The Government of Tanzania with World Bank assistance has through the project “Investment Prioritisation for Resilient Livelihoods and Ecosystems in Coastal Zones of Tanzania” identified and prioritised threats and developed fundable adaptation measures to address the most pertinent of these threats.
The study has been financed by the World Bank (WB) with trust funds provided by Nordic Development Fund (NDF).
The client for the project is Fisheries Department at the Ministry for Livestock and Fisheries Development (MLFD) in Dar es Salaam and the Department of Fisheries and Marine Resources at the Ministry of Agriculture, Livestock and Environment (MALE) in Zanzibar.
The objective of the study has been to prioritise geographically and thematically the actions to promote sustainable coastal livelihoods and ecosystems in Tanzania (both Mainland and Zanzibar). The results comprise proposals for measures for coastal management and climate change adaptation in Tanzania, which the Government of Tanzania, NGOs, and donors can use to guide their support and investments over a five year period and beyond.
This document is Volume III of a rapidly compiled Coastal Profile presenting a baseline on current information in the coastal areas of mainland Tanzania and Zanzibar. It presents the Geographical Information System developed and applied in the study, as well as a series of maps and tables.
Further details on the project are provided in the thematic part of the Coastal Profiles for Tanzania and Zanzibar (Volume I).
List of Contents Introduction ................................................................................................................................................... 2
List of Contents ............................................................................................................................................. 2
List of Maps ................................................................................................................................................... 3
List of Tables ................................................................................................................................................. 3
The Coastal Profile ....................................................................................................................................... 4
Coastal Profile Maps .................................................................................................................................... 4
Meta description ....................................................................................................................................... 4 Meta description standard ...................................................................................................................................... 4 Presentation of structure and its origin ................................................................................................................. 5
Metadata base ........................................................................................................................................... 6 Detailed description ............................................................................................................................................ 6 More Detailed Assessment of GIS based on meta database content ........................................................... 7
Maps ........................................................................................................................................................... 7 Map Overview ........................................................................................................................................................ 7
GIS issues of importance for mitigating threats to local communities and ecosystems. ............... 7
Meta Data Section ......................................................................................................................................... 8
Map Section ................................................................................................................................................. 17
Table Section ............................................................................................................................................... 54

3
List of Maps Map 1: Administrative and Infrastructure features in the Coastal Zone of Tanzania ..................... 18
Map 2: Land Cover and Uses of Nearshore Waters in the Coastal Zone of Tanzania ..................... 19
Map 3: Habitats and Resources in the Coastal Zone of Tanzania ....................................................... 20
Map 4: Administrative and Infrastructure features in Zanzibar (Pemba and Unguja) ................... 21
Map 5: Land Cover and Uses of Nearshore Waters in Zanzibar (Pemba and Unguja) ................... 22
Map 6: Coastal Habitats and Resources in Zanzibar (Pemba and Unguja) ....................................... 23
Map 7: Pangani District. Administrative and Infrastructure features. ............................................... 24
Map 8: Pangani District. Coastal Habitats and Resources. .................................................................. 25
Map 9: Mkinga, Tanga and Muheza Districts. Administrative and Infrastructure features. .......... 26
Map 10: Mkinga, Tanga and Muheza Districts. Coastal Habitats and Resources. ........................... 27
Map 11: Kinondoni, Ilala and Temeke Districts. Administrative and Infrastructure features. ...... 28
Map 12: Kinondoni, Ilala and Temeke Districts. Coastal Habitats and Resources. .......................... 29
Map 13: Rufiji District. Administrative and Infrastructure features. ................................................. 30
Map 14: Rufiji District.. Coastal Habitats and Resources. .................................................................... 31
Map 15: Mafia District. Administrative and Infrastructure features. ................................................. 32
Map 16: Mafia District.. Coastal Habitats and Resources. ................................................................... 33
Map 17: Mkuranga District. Administrative and Infrastructure features. ......................................... 34
Map 18: Mkuranga District.. Coastal Habitats and Resources. ........................................................... 35
Map 19: Bagamoyo District. Administrative and Infrastructure features. ........................................ 36
Map 20: Bagamoyo District.. Coastal Habitats and Resources. ........................................................... 37
Map 21: Lindi Urban and Lindi Rural Districts. Administrative and Infrastructure features. ....... 38
Map 22: Lindi Urban and Lindi Rural Districts. Coastal Habitats and Resources. .......................... 39
Map 23: Kilwa District Northern Part. Administrative and Infrastructure features. ....................... 40
Map 24: Kilwa District Northern Part. Coastal Habitats and Resources. .......................................... 41
Map 25: Kilwa District Southern Part. Administrative and Infrastructure features. ....................... 42
Map 26: Kilwa District Southern Part. Coastal Habitats and Resources. ........................................... 43
Map 27: Mtwara Urban and Mtwara Rural Districts. Administrative and Infrastructure features.44
Map 28: Mtwara Urban and Mtwara Rural District. Coastal Habitats and Resources. ................... 45
Map 29: Pemba Island, Northern Part. Administrative and Infrastructure features. ...................... 46
Map 30: Pemba Island, Northern Part. Coastal Habitats and Resources. .......................................... 47
Map 31: Pemba Island, Southern Part. Administrative and Infrastructure features. ....................... 48
Map 32: Pemba Island, Southern Part. Coastal Habitats and Resources. .......................................... 49
Map 33: Unguja Island, Northern Part. Administrative and Infrastructure features. ..................... 50
Map 34: Unguja Island, Northern Part. Coastal Habitats and Resources. ......................................... 51
Map 35: Unguja Island, Southern Part. Administrative and Infrastructure features. ...................... 52
Map 36: Unguja Island, Southern Part. Coastal Habitats and Resources. ......................................... 53
List of Tables Table 1: Metadata describing the coastal geographic information compiled and used as part of the prioritisation study. ................................................................................................................................................. 9
Table 2: Population data for coastal regions and districts of mainland Tanzania and Zanzibar. Data include number of households, male, female and total population, population density and average household size. Change in population and household size in past inter-census period (2002 - 2012). ..... 55
Table 3: Population data for coastal regions and districts of mainland Tanzania and Zanzibar. Data include number urban and rural population, urbanisation, working age population, non-working age population and dependency ratios. Change in urbanisation and dependency ratio in past inter-census period (2002 - 2012). Considerable amount of data is missing in the table, which however should be available with the National Bureau of Statistics once the 2012 population data has been cleaned. .......... 56
Table 4: Inundation scenarios for coastal regions and districts of mainland Tanzania and Zanzibar in one meter steps of sea level rise up to five meter and at ten meter. Data include land lost in hectares and as percentage of administrative area. The higher sea level rise have been included to illustrate area impacted in situations with high surge and wave action during period of extreme weather, pending the development of a surge impact assessment model. .......................................................................................... 57
Table 5: Inundation scenarios on agriculture land use for coastal regions and districts of mainland Tanzania and Zanzibar in one meter steps of sea level rise up to five meter and at ten meter. Data include agriculture land lost in hectares and as percentage of current agriculture land use. The higher sea level rise have been included to illustrate area impacted in situations with high surge and wave action during period of extreme weather, pending the development of a surge impact assessment model. ...................................................................................................................................................................... 58
Table 6: Inundation scenarios on built up land use for coastal regions and districts of mainland Tanzania and Zanzibar in one meter steps of sea level rise up to five meter and at ten meter. Data include built up land lost in hectares and as percentage of current built up land use. The higher sea level rise have been included to illustrate area impacted in situations with high surge and wave action during period of extreme weather, pending the development of a surge impact assessment model. ...... 59
Table 7: Inundation scenarios on bush land use for coastal regions and districts of mainland Tanzania and Zanzibar in one meter steps of sea level rise up to five meter and at ten meter. Data include bush land lost in hectares and as percentage of current bush land. The higher sea level rise have been included to illustrate area impacted in situations with high surge and wave action during period of extreme weather, pending the development of a surge impact assessment model. .................................... 60
Table 8: Inundation scenarios on grassland use for coastal regions and districts of mainland Tanzania and Zanzibar in one meter steps of sea level rise up to five meter and at ten meter. Data include grassland lost in hectares and as percentage of current grassland. The higher sea level rise have been included to illustrate area impacted in situations with high surge and wave action during period of extreme weather, pending the development of a surge impact assessment model. .................................... 61
Table 9: Inundation scenarios on natural forests for coastal regions and districts of mainland Tanzania and Zanzibar in one meter steps of sea level rise up to five meter and at ten meter. Data include natural forest lost in hectares and as percentage of current natural forest. The higher sea level rise have been included to illustrate area impacted in situations with high surge and wave action during period of extreme weather, pending the development of a surge impact assessment model. .................................... 62
Table 10: Inundation scenarios on woodlands for coastal regions and districts of mainland Tanzania and Zanzibar in one meter steps of sea level rise up to five meter and at ten meter. Data include woodland lost in hectares and as percentage of current woodland. The higher sea level rise have been included to illustrate area impacted in situations with high surge and wave action during period of extreme weather, pending the development of a surge impact assessment model. .................................... 63

4
Table 11: Inundation scenarios on salt pans for coastal regions and districts of mainland Tanzania and Zanzibar in one meter steps of sea level rise up to five meter and at ten meter. Data include loss of salt pans in hectares and as percentage of current area of salt pans. The higher sea level rise have been included to illustrate area impacted in situations with high surge and wave action during period of extreme weather, pending the development of a surge impact assessment model. .................................... 64
The Coastal Profile The coastal profile is based primarily on secondary data, acquired from key stakeholders during the study period. A database has been established listing all relevant documents identified and links to soft copies have been included in the database as available.
A Geographical Information Systems (GIS) has been established to contain acquired themes. The GIS has furthermore been used to examine inundation and flooding consequences of various Sea Level Rise scenarios. These analyses have been based on a Digital Elevation Model (DEM) developed for the coastal areas of the country. The GIS has also been used to produce district level statistical information.
The coastal profile is presented in five volumes:
Volume I: Coastal Themes, presenting the situation in the coastal zone thematically, i.e. from the perspective of various sectors and other country wide themes.
Volume II: Coastal Districts, offering an overview of the situation in the coastal zone of each district, localising and adding detail to the information in Volume I.
Volume III: Maps and Tables, presenting thematic and district maps in A3 format and offering tabulated information, collected from documents consulted or generated from the GIS. This is a combined volume for Mainland Tanzania and Zanzibar.
Volume IV: Overall Threat Mitigation, presenting action areas for the identified threats emerging from discussions in the two working groups established after the Inception stakeholder meetings. The working groups, one in Zanzibar and one in Dar es Salaam, assisted in validating and prioritising threats and in proposing overall adaption measures to address such threats. This is a combined volume for Mainland Tanzania and Zanzibar.
Volume V: A portfolio of prioritised actions to address threats to local communities and ecosystems in the coastal areas of Mainland Tanzania and Zanzibar. There are separate volumes for Mainland Tanzania and Zanzibar.
This is Volume III of the Coastal Profile. Although outside the resources of the study a comprehensive coastal profile will benefit from additional socio-economic and sector statistical information. The data from the 2012 population census would be very useful together with a more comprehensive 2002 data set to investigate in more detail development trends.
Coastal Profile Maps
Meta description
Spatial data from various sources have been compiled and used to build the Geographical Information System (GIS) supporting the prioritisation study. In this process it has become apparent that although many GIS providers and consumers exist in Tanzania and Zanzibar, a shared and structured directory for accessing geographical information is lacking both in Zanzibar and Tanzania. The lack of such a system leads to inefficient use of data and resources, causes ambiguous use of information sources in management and clouds for a thorough understanding of the current information baseline.
Meta description standard
It is imperative for coastal management stakeholders in general and in decision making in particular to have easy access to spatial data sets and services and to establish whether such datasets may be used and for what purpose.
Institutions and organisations that use and produce GIS should provide descriptions in the form of metadata for spatial data sets. In order to make such metadata compatible and usable among all

5
stakeholders, it is required to lay down rules concerning the metadata used to describe the spatial data sets.
The selection and definition of metadata elements is important to allow identification and assessment of the information resource for which metadata is created, its classification and identification of its geographic location and temporal reference, quality and validity, constraints related to access and use, and organisation responsible for the resource. Metadata elements related to the metadata record itself are also necessary to monitor to ensure that the metadata are kept up to date, and for identifying the organisation responsible for the creation and maintenance of the metadata.
We have in our approach to setting up the GIS in support of the prioritisation study used a structured system to describe the datasets that have been incorporated. The resultant meta database is included in this Volume III of the Coastal Profile in the Meta Data Section (Table 1, page 9). With the resources available and given the wanting situation concerning systematic meta descriptions of data sets among GIS producers in Tanzania it has not been possible to provide a complete and coherent database but the effort does provide easier direction for interested parties to GIS resources that are important to support management of the coastal areas. Importantly the presentation of the meta data should be seen as a contribution to addressing the need for the much required development of a structured national system for overviewing production and storage of spatial data and for facilitation interchange of such data.
Presentation of structure and its origin
The fields used in the meta description of GIS data sets for the coastal profile have been based on the efforts in the European Community to create a spatial data infrastructure directed by the INSPIRE directive which came into force on 15 May 2007 (with full implementation targeted by 2019) with the view to enable the sharing of environmental spatial information among public sector organizations and better facilitate public access to spatial information across Europe1.
The following fields are included in the meta description of data sets:
Dataset Title, which is the filename of the spatial dataset in the GIS.
Dataset Abstract, which is a short description of the spatial dataset.
Dataset Category, which is a high-level classification scheme to assist in the grouping and topic-based search of available spatial data resources. The following classes have been pursued in the coastal GIS:
o Farming
o Imagery / Base Maps / Earth Cover
o Intelligence / Military
o Inland Waters
o Location
o Oceans
o Planning / Cadastre
o Society
o Structure
1 INSPIRE is based on the following principles: i) Data should be collected only once and kept where it can be maintained
most effectively; ii) It should be possible to combine seamless spatial information from different sources across Europe and share it with many users and applications; iii) It should be possible for information collected at one level/scale to be shared with all levels/scales; detailed for thorough investigations, general for strategic purposes; iv) Geographic information needed for good governance at all levels should be readily and transparently available; and v) Easy to find
o Transportation
o Utilities / Communication
o Biota
o Boundaries
o Climatology / Meteorology / Atmosphere
o Economy
o Elevation
o Environment
o Geo-scientific Information
o Health
o Other
Dataset Type. The typology used to describe the datasets in the coastal GIS are:
o Raster
o Vector (point)
o Vector (line)
o Vector (polygon)
o Tabular
o Document
o Other
Dataset Format. Examples of formats include:
o ESRI shapefile (*.shp)
o GeoTiff (*.tif)
o Google Earth (kml/kmz)
o Other raster
o Other vector
o Tabular data (*.txt,*.dbf)
Geographic Extent, which is the extent of the resource in the geographic space in nominal terms (i.e. national or by specifying coverage in term of regions or districts)
Temporal extent, which should define the time period covered by the layer either as an individual date or as interval of dates (i.e. start and end date)
Spatial reference, which is the coordinate system of the input spatial dataset.
Spatial resolution or equivalent scale, which refers to the level of detail of the data set. It is expressed as a resolution distance with a unit of length (raster) or as equivalent scales i.e. integer value expressing the scale denominator (vectors).
what geographic information is available, how it can be used to meet a particular need, and under which conditions it can be acquired and used.

6
Conditions for access and use, clarifying constraints related to access and use.
Lineage, which is a statement on process history and/or overall quality of the spatial dataset.
Date of latest revision
Responsible party, identifying the organisation responsible for the establishment, management, maintenance and distribution of the resource.
Role of responsible party
Metadata point of contact identifying the party who has prepared the metadata and can be contacted for acquiring knowledge about or acquisition of the resource.
Metadata base
Detailed description
The meta database in this volume provides an overview or directory of the actual spatial data compilation. Thematically, the collection include base maps (e.g., administrative boundaries), biological features (e.g., mangroves, coral reefs, charismatic fish species), physical environment (e.g., bathymetry/elevations), socio-economic features (fish landing sites, aquaculture, infrastructure), and coastal management (e.g., marine managed areas or MPAs).
Most of the spatial data was obtained from the Institute of Marine Sciences (IMS), which is part of the University of Dar es Salaam. IMS hosts the Tanzania National Oceanographic Data Centre (TzNODC) and is also the custodian of the Tanzania Sensitivity Atlas project spatial data. The GIS database at IMS contains mainly marine and coastal data. IMS scientists have over time worked together with different specialised institutions in the process of data gathering. For example data on fish landing sites and aquaculture was a result of team work involving Fisheries Department staff (mainland and Zanzibar). The boundaries of Marine Protected areas were based on information contributed by Marine Parks and Reserves Unit (Dar es Salaam) and the Marine Conservation Unit (Zanzibar). Community mapping approaches were deployed in gathering data on the distribution of marine charismatic species and other features. Some of the data was sourced from previous reports, e.g., Wells et al. (2004), Muhando and Rumisha (2008), TanSea (2013).
Physical environment data such as bathymetry, land elevations (including DEMs), were downloaded or sourced from World Data Centres (e.g., World Atlas – GEBCO) or through partners, e.g., IODE and ODINAFRICA who have access to various oceanographic data. The administrative boundaries data (regions, districts, and wards) was sourced from Global Administrative (GADM) areas database and modified to include recent changes. This data was comparable to that obtained from National Bureau of Statistics, especially in the coastal areas. The Survey and Mapping Division of Tanzania, which is responsible for national mapping activities are still working on the new district and wards boundaries and may therefore have the most accurate administrative data. The meta data provides information on the source of each layer. Some additional information about the source is contained in some of the layers under a field named source (or src).
At the moment there are no clear responsibilities on marine and coastal data collection. Each institution collects and uses spatial data that is useful for a particular activity, after which the data is summarised in thematic reports and the raw data is kept by the principal investigator or lost when he/she is moved to another department. A systematic archive of spatial data is required to make available historical and recent data on one side and to minimise duplication of efforts in the collection of new information. GIS
for the marine environment is now expanding and there are national plans to harmonise institutions in the collection and sharing of data.
The spatial database rapidly compiled for this study is not complete. Although additional information may be available, it is assessed that existing GIS information is not adequate for efficiently supporting decision making processes.
Only datasets with national coverage have been used in this study. There is more data available in areas located near urban centres which can be accessed through university departments dealing with marine sciences, e.g., in Dar es Salaam and Zanzibar. There is also more data and information available for marine managed areas (parks, reserves and conservation areas). Academic interests (Researcher/ Postgraduate students) as well as financial factors or development partner’s support have been the main factors for where to collect spatial data. In the future, data collection sites should be guided by managers and decision maker’s needs.
Most of the spatial data used in this study is project-based and can be considered in need of updating. For example, mangrove maps are based on 1990 aerial photos (Semesi et al. 1991) and Wang et al. 2001). Coral reef maps are based on 1997 coral reef mapping project with partial update in 2009 for the area north of Tanga. The distribution of threatened fish species (dugongs, turtle nesting sites, etc) is based on 2004 and 2008 projects (Wells MACEMP WWF, Sea Sense project, Samaki Consultants, etc.). There are no systematic data collection or update activities by responsible institutions (e.g. Department of Fisheries, Division of Environment, University Department, etc.). This weakness has been recognised and strategies are underway to rectify the situation.
The Tanzania coastline features were digitised from Tanzania topographic maps produced by the Survey and Mapping Department, Ministry of Lands, at a scale of 1:50,000. The target was for all other features to fit into this scale. This has proved difficult in the field, especially with community mapping procedures using questionnaires. Accuracy of some datasets especially those with predetermined geographic references, e.g., boundaries of marine parks can be considered high. Maps produced in this study are a mix of layers with different spatial scale. Unfortunately, there is still no easy solution to this problem.
Coastal GIS was initiated by UNEP in 1993 mainly through its EAF 14 project which was executed by the Institute of Marine Sciences in Tanzania. Weak political interest has since diluted the momentum built. It has however now been recognised that GIS has a substantial role to play in coastal management and many institutions are paying more attention to coastal GIS. IMS through TzNODC has established a small GIS working group with the purpose of developing a coastal and marine atlas. This activity is however, experiencing technical and financial difficulties at the moment.
The TCMP and NEMC have established an environmental GIS units which covers some aspects of coastal features. Similarly, the SMOLE project which is executed by Surveys and Mapping Unit and Department of Environment in Zanzibar is now collecting data on coastal fishing, aquaculture and tourism. The State University of Zanzibar has established a ZanSEA project, which intends to cover both terrestrial and coastal GIS. The department of Fisheries in Dar es Salaam have shown interest in working together with IMS in establishing a database of fish landing sites. IMS has developed a GIS based Masters Course (MSc.) in Marine Sciences to alleviate the lack of trained manpower. While the interest on coastal GIS is very high, there is still a coordination problem.
The first stage of the coordination process could be the initiation of exchange of data and experience between institutions. IMS and the SMOLE project in Zanzibar has started to exchange information about their data holdings and the project has greatly assisted IMS to complete its meta database. The National Environmental Management Council (NEMC) in Dar es Salaam has established an environmental data information unit which among others is tasked with collection, analysis and dissemination of environmental data.

7
Institutions engaged with social, economic and politics of coastal communities are increasingly collecting and using coastal data and information. Universities and other training institutions placed along the coastal area have over the years collected data through academic projects (MSc., PhD, etc.) or research projects. So in theory there are several sources of sectorial datasets, the main concerns are: data format, quality, quantity, consistency, and availability.
More Detailed Assessment of GIS based on meta database content
Descriptions given in the meta database are complete for layers that have been developed at the Institute of Marine Sciences. Layers that have been developed as collaborative work between IMS and other institutes are also well described. Layers downloaded from global data centres have meta data details as provided from the source. Data sets digitized from Google Earth or downloaded from the internet are not complete in the meta description.
Potentially all collected spatial data sets belonging to or under the custodian of the Institute of Marine Sciences (IMS) are freely available upon request. This project and IMS doesn’t distribute data sets sourced from elsewhere unless officially allowed. Free exchange of data is very much encouraging. Some institutions however may require compensation for costs incurred in the gathering, analysis and packaging processes, for capable clients.
The spatial scales or resolution of themes used in this study varies. Most of the layers have been digitised from topographic maps with a scale of 1:50,000. Other features like fish landing sites were digitized from Google Earth zoomed to a scale of about 1:5,000. Layers digitised from community based mapping had the lowest accuracy (sometimes estimated at 1:1,000,000).
Maps
In this volume maps display various features of interest to coastal zone managers, researcher and communities, covering coastal zones of Mainland Tanzania and Zanzibar.
There are five Regions and 15 Districts along the mainland Tanzania coastline. Tanga region have four coastal districts (Mkinga, Tanga City, Muheza and Pangani); Pwani Region has three (Bagamoyo, Mkuranga and Rufiji); Dar es Salaam region has three coastal districts (Kinondoni, Ilala and Temeke); Lindi has three coastal districts (Lindi Urban, Lindi Rural and Kilwa; and Mtwara region has two coastal districts (Mtwara Urban and Mtwara Rural).
Zanzibar is subdivided into five regions and ten districts: Unguja North (North A and North B districts), Unguja South (Central and South districts), Unguja West (Urban and West districts), Pemba North (Micheweni and Wete) and Pemba South (Mkoani and Chakechake districts). All districts in Zanzibar have access to the sea.
Important coastal infrastructures such as road and railway network, airports, harbours, gas pipes and shipping lanes are displayed in Maps 1 and 4. Maps 2 and 5 displays land cover and some of the uses or activities taking place in the near shore water. Key features include agricultural land, built areas, bushes, grassland, mangroves, forests and coral reefs. The location of Marine Protected Areas (Parks, reserves, conservation areas and community no-take zones) as well as seaweed farming, fish culture areas are displayed. The distribution of coastal habitats (mangroves, sandy beaches, tidal reef, as well as important bird areas are displayed in Maps 3 and 6. Turtle nesting sites, sea horse, dugong sightings, coelacanth catch, dolphin, shark and humpback sightings (or preference areas) as well as fish landing sites, local ports are also shown in Maps 3 and 6.
Map Overview
Map Type Map
Administrative and Infrastructure features in the Coastal Zone of Tanzania: Map 1
Land Cover and Uses of Nearshore Waters in the Coastal Zone of Tanzania Map 2
Habitats and Resources in the Coastal Zone of Tanzania Map 3
Administrative and Infrastructure features in Zanzibar (Pemba and Unguja) Map 4
Land Cover and Uses of Nearshore Waters in Zanzibar (Pemba and Unguja) Map 5
Coastal Habitats and Resources in Zanzibar (Pemba and Unguja) Map 6
District Administrative and Infrastructure Features Maps 7, 9, 11, 13, 15, 17, 19, 21, 23, 25, 27, 29 ,31, 33, 35
District Coastal Habitats and Resources Maps, 8, 10, 12, 14, 16, 18, 20, 22, 24, 26, 28, 30, 32, 34, 36
GIS issues of importance for mitigating threats to local communities and ecosystems.
GIS is an important and powerful decision support tool critical for planning and management, particularly in complex and dynamic environments under development pressure as is often the case in coastal areas. Both mainland Tanzania and Zanzibar experience threats associated with such development as amply identified in Volumes I and II of the coastal profiles.
As discussed above and as illustrated in the Metadata and Map Sections there are many users and producers of GIS in Tanzania and Zanzibar, but the efficiency and usefulness of these resources are limited due to a number of factors. These include:
Responsibilities for producing and maintaining various themes are not well defined at times leading to duplicating efforts.
There is no system in place which clearly defines modalities for sharing spatial data.
There is no system in place defining baseline requirements in terms of geographical datasets for management (planning, monitoring, and development control).
Many important themes are not available in sufficiently updated form
Many important themes are not available in sufficient resolution for spatial analysis
Spatial information is not readily accessible for the stakeholders
A system with national mapping standards is wanting

8
Meta Data Section

9
Table 1: Metadata describing the coastal geographic information compiled and used as part of the prioritisation study.
Dataset Title Dataset Abstract Dataset Category Dataset Type
Dataset Format
Geographic Extent
Temporal extent
Spatial reference Spatial resolution or Equivalent
scale
Conditions for access and use
Lineage (i.e. process history)
Date of latest
revision
Responsible party Role of responsible party Metadata point of contact
Coastal_Landuse_wgs84 (C:\TANSEA_2\Gorm)
Source:- Gorm & World Bank (only the coastal area) - In decimal degrees West: 37.729565 East: 40.449648 North: -3.546324 South: -11.557810
Land cover Vector (polygon)
ESRI shapefile (*.shp)
Coastal Tanzania
Ca. 1995 GCS_WGS_1984 unknown No conditions apply
unknown ? FAO ? ? Christopher Muhando; [email protected]
faolc_geo.shp (C:\GIS_DATABASE_2010\Land_use_cover\FAO_LC)
FAO Land use Land cover Vector (polygon)
ESRI shapefile (*.shp)
Tanzania ? GCS_Arc_1960 unknown No conditions apply
unknown ? FAO ? ? Christopher Muhando; [email protected]
Lake_Afr_DD.shp C:\GIS_WCMC_09\3_TZ\LAY_WCMC\
Lakes found in East Africa. Sourced from UNEP-WCMC
Inland Waters Vector (polygon
ESRI shapefile (*.shp)
East Africa ? GCS_WGS_1984 unknown No conditions apply
unknown ? UNEP-WCMC Resource Provider (Party that supplies the resource)
Christopher Muhando; [email protected]
River_Afr_UTM375 C:\GIS_WCMC_09\3_TZ\LAY_WCMC\
Major Rivers in East Africa. Sourced from UNEP-WCMC
Inland Waters Vector (line)
ESRI shapefile (*.shp)
East Africa ? GCS_WGS_1984 unknown No conditions apply
unknown ? UNEP-WCMC Resource Provider (Party that supplies the resource)
Christopher Muhando; [email protected]
srtm_tz.tif SRTM 90m Digital Elevation Database v4.1
Elevation Raster GeoTiff (*.tif)
National ca. 2000 GCS_WGS_1984 0.000833 Degree ~ 90 m
No conditions apply
SRTM version 4.1
2008 CGIAR-CSI (http://srtm.csi.cgiar.org)
Processor (Party who has processed the data in a manner such that the resource has been modified)
DHI-GRAS; [email protected]
srtm_tz_central_coast.tif SRTM 90m Digital Elevation Database v4.3
Elevation Raster GeoTiff (*.tif)
Pwani, Dar-Es-Salam, Zanzibar
ca. 2000 GCS_WGS_1984 0.000833 Degree ~ 90 m
No conditions apply
SRTM version 4.1
2008 CGIAR-CSI (http://srtm.csi.cgiar.org)
Processor (Party who has processed the data in a manner such that the resource has been modified)
DHI-GRAS; [email protected]
srtm_tz_north_coast.tif SRTM 90m Digital Elevation Database v4.2
Elevation Raster GeoTiff (*.tif)
Tanga, Pemba
ca. 2000 GCS_WGS_1984 0.000833 Degree ~ 90 m
No conditions apply
SRTM version 4.1
2008 CGIAR-CSI (http://srtm.csi.cgiar.org)
Processor (Party who has processed the data in a manner such that the resource has been modified)
DHI-GRAS; [email protected]
srtm_tz_south_coast.tif SRTM 90m Digital Elevation Database v4.4
Elevation Raster GeoTiff (*.tif)
Lindi, Mtwara
ca. 2000 GCS_WGS_1984 0.000833 Degree ~ 90 m
No conditions apply
SRTM version 4.1
2008 CGIAR-CSI (http://srtm.csi.cgiar.org)
Processor (Party who has processed the data in a manner such that the resource has been modified)
DHI-GRAS; [email protected]
Tanzania_landuseR.shp (Not in IMS Database)
Tanzania Land use2 Farming) Vector (polygon)
ESRI shapefile (*.shp)
National ? GCS_WGS_1984 ? No conditions apply
? ? DHI-GRAS; [email protected]
Tanzania_rivers.shp C:\GIS_DATABASE_2010\Tz_data_from_YB\TanSEA Master OBSCOM Nov13\TANSEA\VECTOR\tansea
Rivers in mainland Tanzania
Inland Waters Vector (line)
ESRI shapefile (*.shp)
Tanzania mainland
unknown GCS_WGS_1984 approx. 1:250.000 No conditions apply
unknown ? ILRI (International Livestock Research Institute) (http://www.ilri.org/)
Resource Provider (Party that supplies the resource)
Christopher Muhando; [email protected]
tz_lcu.shp C:\GIS_DATABASE_2010\Land_use_cover\LC_1995)
Tanzania Land cover - sourced from Ardhi University in 20043.
Land cover Vector (polygon)
ESRI shapefile (*.shp)
National Ca. 1995 <Undefined> unknown No conditions apply
unknown ? Sourced from Ardhi University
Unknown Christopher Muhando; [email protected]
tz_lcu_DD_WGS84 C:\GIS_DATABASE_2010\Land_use_cover\LC_1995)
Land cover (1995)? Land cover Vector (polygon)
ESRI shapefile (*.shp)
Tanzania mainland
Ca. 1995 GCS_WGS_1984 unknown Unknown Unknown ? Sourced from Ardhi University
'Unknown Christopher Muhando; [email protected]
TZA_adm0.shp Tanzania National boundary from geographic database of global administrative areas (GADM)4.
Boundaries Vector (polygon)
ESRI shapefile (*.shp)
National unknown GCS_WGS_1984 approx. 1:250.000 No conditions apply
GADM version 1.0
March 2009
http://www.gadm.org Resource Provider (Party that supplies the resource)
Christopher Muhando; [email protected]
2 Airport, bare soil, bush land, cultivated land, grassland, ice, mangrove forest, natural forest, permanent swamp, plantation forest, rock outcrops, urban area, water, woodland 3 A better and updated land cover may exist at Institute of Resource Assessment (IRA), Surveys and Mapping Division Dar es Salaam , and SMOLE for Zanzibar. 4 This layer was downloaded from DIVA GIS (http://www.diva-gis.org/gdata or http://www.gadm.org/)

10
Dataset Title Dataset Abstract Dataset Category Dataset Type
Dataset Format
Geographic Extent
Temporal extent
Spatial reference Spatial resolution or Equivalent
scale
Conditions for access and use
Lineage (i.e. process history)
Date of latest
revision
Responsible party Role of responsible party Metadata point of contact
TZA_adm1.shp Tanzania Region boundaries from geographic database of global administrative areas (GADM)5.
Boundaries Vector (polygon)
ESRI shapefile (*.shp)
National unknown GCS_WGS_1984 approx. 1:250.000 No conditions apply
GADM version 1.0
March 2009
http://www.gadm.org Resource Provider (Party that supplies the resource)
Christopher Muhando; [email protected]
TZA_adm2.shp Tanzania District boundaries from geographic database of global administrative areas (GADM)6.
Boundaries Vector (polygon)
ESRI shapefile (*.shp)
National unknown GCS_WGS_1984 approx. 1:250.000 No conditions apply
GADM version 1.0
March 2009
http://www.gadm.org Resource Provider (Party that supplies the resource)
Christopher Muhando; [email protected]
TZA_adm3.shp Tanzania Wards boundaries from geographic database of global administrative areas (GADM) 7.
Boundaries Vector (polygon)
ESRI shapefile (*.shp)
National unknown GCS_WGS_1984 approx. 1:250.000 No conditions apply
GADM version 1.0
March 2009
http://www.gadm.org Resource Provider (Party that supplies the resource)
Christopher Muhando; [email protected]
tza_africover_spatial_agg_50k.shp
The land cover classes have been developed using the FAO/UNEP international standard LCCS classification system.
Land cover Vector (polygon)
ESRI shapefile (*.shp)
National mainly 1997
GCS_WGS_1984 1:50.000 No conditions apply
LANDSAT TM images (Bands 4,3,2) acquired mainly in the year 19978.
1997 AFRICOVER (http://www.fao.org/geonetwork/srv/en/main.home)
Resource Provider (Party that supplies the resource)
Christopher Muhando; [email protected]
tza_airport_infrastructures_5k.shp
Airport Buildings and landing strips
Transportation Vector (polygon)
ESRI shapefile (*.shp)
National Ca. 2012 GCS_WGS_1984 1:5.000 No conditions apply
Digitized from Google Earth
2012 TANSEA Team Resource Provider (Party that supplies the resource)
Christopher Muhando; [email protected]
tza_airport_points_5k.shp Airport locations represented as points
Transportation Vector (point)
ESRI shapefile (*.shp)
National Ca. 2012 GCS_WGS_1984 1:5.000 No conditions apply
Digitized from Google Earth
2012 TANSEA Team Resource Provider (Party that supplies the resource)
Christopher Muhando; [email protected]
tza_airport_poly_5k.shp The whole Airport area circumferences
Transportation Vector (polygon)
ESRI shapefile (*.shp)
National Ca. 2012 GCS_WGS_1984 1:5.000 No conditions apply
Digitized from Google Earth
2012 TANSEA Team Resource Provider (Party that supplies the resource)
Christopher Muhando; [email protected]
tza_atlas_A1_50k.shp Window delimitations for plotting
Other Vector (polygon)
ESRI shapefile (*.shp)
Coastal Tanzania
Ca. 2012 GCS_WGS_1984 1:50.000 No conditions apply
Prepared by OBSCOM
2011 OBSCOM (http://www.obscom.eu/)
Resource Provider (Party that supplies the resource)
Christopher Muhando; [email protected]
tza_atlas_A4_50k.shp Window delimitations for plotting
Other Vector (polygon)
ESRI shapefile (*.shp)
Coastal Tanzania
Ca. 2012 GCS_WGS_1984 1:50.000 No conditions apply
Prepared by OBSCOM
2011 OBSCOM (http://www.obscom.eu/)
Resource Provider (Party that supplies the resource)
Christopher Muhando; [email protected]
tza_bathy_1000k.shp Bathymetry of Tanzania waters based on marine charts (20m) and Gebco 2003 database9.
Elevation Vector (polygon)
ESRI shapefile (*.shp)
Tanzania Seas
Gebco 2003
GCS_WGS_1984 1:1.000.000 No conditions apply
Digitized from Bathymetric Charts
2009 GEBCO (http://www.gebco.net/data_and_products/gridded_bathymetry_data/documents/gridhelp.pdf)
Resource Provider (Party that supplies the resource)
Christopher Muhando; [email protected]
tza_coastal_features_250k.shp
Layer showing locations of named coastal features10
Other Vector (point)
ESRI shapefile (*.shp)
Coastal Tanzania
Ca. 2012 GCS_WGS_1984 1:250.000 No conditions apply
Digitized from many sources11
2012 SAMAKI Resource Provider (Party that supplies the resource)
Christopher many sources Muhando; [email protected]
tza_coastal_forests_.shp Tanzania coastal regions forest reserves boundaries in mainland Tanzania. Pemba and Unguja (Zanzibar) forests are not included??
Environment Vector (polygon).
ESRI shapefile (*.shp)
Coastal Regions of Mainland Tanzania
Ca. 2005 GCS_WGS_1984 approx. 1:250.000 No conditions apply
Sourced from WCMC (2009)
2009 UNEP-WCMC UNEP-WCMC Christopher Muhando; [email protected]
5 This layer is downloaded from DIVA GIS (http://www.diva-gis.org/gdata or http://www.gadm.org/) 6 This layer is downloaded from DIVA GIS (http://www.diva-gis.org/gdata or http://www.gadm.org/) 7 This layer is downloaded from DIVA GIS (http://www.diva-gis.org/gdata or http://www.gadm.org/) 8 The full resolution land cover has been produced from visual interpretation of digitally enhanced high-resolution images 9 Depth ranges: 0-20m, 20-100m, 100-200m, 200-500m. 500-1000m, 1000-2000m, 2000-3000m, above 3000m 10 Bay, river, ras, island, depot, bank, beach, bridge, cabo, channel, chem, creek, gap, harbour, haven, hill, lagoon, light house, mouth, mto, mwamba, paman, pass, patch, peninsula, ponta, ponto, port, puna, reef, rocks, terminal, misc.) 11 OMEGA USA Map DSM to Mchinga Bay 61190, 1983, Admiralty Chart Cabo Delgado to Fanjove 3308, 1966 [1972]Admiralty Chart Pangani to Ras Kimbiji 640, 1875 [1964]Admiralty Chart Approaches to Zanzibar 665, 1956 [1990]Admiralty Chart SW Coast of Pemba Island 1310, 1958 [1969]Admiralty Chart Ponta Uifundo
to Cabo Delgado 2938, 1960 [1991]Admiralty Chart Approaches to DSM 764, 1983 [1994]PEMBA UK Ordnance Survey URT 1987 1:100,000, 1987MBREMP Map, 2005MIMP Map, 2000OMEGA USA Map DSM to Mchinga Bay 61190, 1983Admiralty Chart N Mafia Channel to Kilwa Point 1032, 1986 [1992]Admiralty Chart DSM to Wasin Island 3310, 1966 [1994]Admiralty Chart Cabo Delgado to Fanjove 3308, 1966 [1972]Admiralty Chart Pangani to Ras Kimbiji 640, 1875 [1964]Admiralty Chart Approaches to Zanzibar 665, 1956 [1990]Admiralty Chart SW Coast of Pemba Island 1310, 1958 [1969]Admiralty Chart Ponta Uifundo to Cabo Delgado 2938, 1960 [1991]Admiralty Chart Approaches to DSM 764, 1983 [1994]PEMBA UK Ordnance Survey URT 1987 1:100,000, 1987MBREMP Map, 2005MIMP Map, 2000.

11
Dataset Title Dataset Abstract Dataset Category Dataset Type
Dataset Format
Geographic Extent
Temporal extent
Spatial reference Spatial resolution or Equivalent
scale
Conditions for access and use
Lineage (i.e. process history)
Date of latest
revision
Responsible party Role of responsible party Metadata point of contact
tza_coastal_land_cover_50k.shp
Tanzania coastal land cover classes12.
Land cover Vector (polygon)
ESRI shapefile (*.shp)
Coastal Tanzania
Ca. 2010 GCS_WGS_1984 1:50.000 No conditions apply
Digitized from topographical maps
2005 Institute of Marine Sciences (IMS) (http://www.ims.udsm.ac.tz/)
Resource Provider (Party that supplies the resource)
Christopher Muhando; [email protected]
tza_coastal_villages_nbs.shp Tanzania village boundaries layer sourced from National Bureau of Statistics.
Boundaries Vector (polygon)
ESRI shapefile (*.shp)
Tanzania Ca. 2010 UTM_Arc_1960 1:1.000.000 Unknown Prepared by National Bureau of Statistics - Dar es Salaam Tanzania
2009 National Bureau of Statistics - Dar es Salaam
Resource Provider (Party that supplies the resource)
Christopher Muhando; [email protected]
tza_coastline_ge_20k.shp The coastline of Tanzania based on Google Earth13.
Elevation Vector (line)
ESRI shapefile (*.shp)
Tanzania 2013 (digitized from Google Earth)
GCS_WGS_1984 1:20.000 No conditions apply
Digitized from Google Earth
2013 Institute of Marine Sciences (IMS) (http://www.ims.udsm.ac.tz/)
Resource Provider (Party that supplies the resource)
Christopher Muhando; [email protected]
tza_coelacanth_200k.shp Locations where Coelacanths (Latimeria chalumnae) were sighted14.
Biota Vector (point)
ESRI shapefile (*.shp)
Coastal Tanzania
Ca. 2004-2008
GCS_WGS_1984 1:200.000 No conditions apply
Digitized from field observations
2012 Institute of Marine Sciences (IMS) (http://www.ims.udsm.ac.tz/)
Resource Provider (Party that supplies the resource)
Christopher Muhando; [email protected]
tza_coral_reefs_50k.shp The distribution of coral reefs in Tanzania15.
Biota Vector (line)
ESRI shapefile (*.shp)
Coastal Tanzania
Ca. 2010 GCS_WGS_1984 1:50.000 No conditions apply
Digitized from topographical maps, Navigational charts and visual observations (manta tows).
2010 Institute of Marine Sciences (IMS) (http://www.ims.udsm.ac.tz/)
Resource Provider (Party that supplies the resource)
Christopher Muhando; [email protected]
tza_district_nbs This layer shows the Tanzania district boundaries16.
Boundaries Vector (polygon)
ESRI shapefile (*.shp)
Tanzania Ca. 2010 UTM_Arc_1960 1:50.000 No conditions apply
A map of Tanzania Constituencies17
2009 National Bureau of Statistics - Dar es Salaam
Resource Provider (Party that supplies the resource)
Christopher Muhando; [email protected]
tza_districts_Clip.shp Tanzania Coastal District boundaries from geographic database of global administrative areas (GADM)18.
Boundaries Vector (polygon)
ESRI shapefile (*.shp)
Coastal Tanzania
Ca. 2010 GCS_WGS_1984 1:50.000 No conditions apply
Prepared at Institute of Marine Sciences.
Ca. 2007 Institute of Marine Sciences (IMS) (http://www.ims.udsm.ac.tz/)
Resource Provider (Party that supplies the resource)
Christopher Muhando; [email protected]
tza_districts_Clip_l.shp Tanzania Coastal District boundaries in line format. This layer is similar to tza_districts_Clip.shp
Boundaries Vector (line)
ESRI shapefile (*.shp)
Coastal Tanzania
Ca. 2010 GCS_WGS_1984 1:50.000 No conditions apply
Prepared by Institute of Marine Sciences.
Ca. 2007 Institute of Marine Sciences (IMS) (http://www.ims.udsm.ac.tz/)
Resource Provider (Party that supplies the resource)
Christopher Muhando; [email protected]
tza_dive_sites_200k.shp The location of diving sites in Tanzania19.
Location Vector (point)
ESRI shapefile (*.shp)
Coastal Tanzania
Ca. 2010 GCS_WGS_1984 1:200.000 No conditions apply
Digitized from field observations
2013 Institute of Marine Sciences (IMS) (http://www.ims.udsm.ac.tz/)
Resource Provider (Party that supplies the resource)
Christopher Muhando; [email protected]
tza_dolphin_sites_200k.shp Locations where Dolphins (Marine mammals) are commonly seen to aggregate seasonally or full time20.
Biota Vector (point)
ESRI shapefile (*.shp)
Coastal Tanzania
Ca. 2010 GCS_WGS_1984 1:200.000 No conditions apply
Digitized from field observations
2013 Institute of Marine Sciences (IMS) (http://www.ims.udsm.ac.tz/)
Resource Provider (Party that supplies the resource)
Christopher Muhando; [email protected]
12 Digitized by IMS in Zanzibar (1997) from 1:50,000 topographic maps produced by Surveys and Mapping Divisions Dar es Salaam and Zanzibar. Features shown include: Coral (Tanga and Zanzibar), Estate, Forest Reserve, Island, Lake, Land, Mangrove, Ocean, Ponds,, Reservoir, Saline bare area, Salt marsh, Salt pan, Sand,
Sand banks, Seagrass, Shallow water, Swamp, Tidal reef. 13 The coastline is defined as the boundary of the sea landwards, i.e. the coastline is located in front of mangroves. The coastline was assumed to extend inwards on creeks up to where mangroves stand ends. Digitization was done at a about 1: 10000) or higher. 14 First compilation of the sightings was in 2004 (Wells et al. 2005) and was updated in 2008 by WWF Tanzania (Muhando and Rumisha) and last update was by TanSea Project in 2012. 15 First mapping was done at the Institute of Marine Sciences with financial support from SIDA in 1997. The second update was in 2009 through Cora Reef Targeted Research Project. Otherwise, updating of the coral reef distribution map an ongoing activity by the Institute of Marine Sciences. At the moment this activity is
supervised by Dr Christopher Muhando 16 It does not include the recent changes. It looks very similar to those in layer 9 - TZA_adm2.shp. 17 Sourced from National Bureau of Statistics (NBS) in 2012 18 This layer is clipped and modified to separate Mkinga District from Muheza District polygon. Source layer (tza_adm2, shp) was downloaded from DIVA GIS (http://www.diva-gis.org/gdata. 19 Data is based in field observations as well as internet and Google Earth search. There is no independent verification for most sites, thus the accuracy is not yet verified - likely to be low. 20 The commonest species are probably the Indo-Pacific bottlenose dolphin Tursiops aduncus, the Indo-Pacific humpback dolphin Sousa chinensis and the spinner Stenella longirostris. First compilation of the sightings was in 2004 (Wells et al. 2005) and in 2008 by WWF Tanzania (Muhando and Rumisha) and last update was
by TanSea Project in 2012.

12
Dataset Title Dataset Abstract Dataset Category Dataset Type
Dataset Format
Geographic Extent
Temporal extent
Spatial reference Spatial resolution or Equivalent
scale
Conditions for access and use
Lineage (i.e. process history)
Date of latest
revision
Responsible party Role of responsible party Metadata point of contact
tza_dugong_sightings_200k.shp
Locations where Dugongs (marine mammals also known as Sea cows) were sighted or caught by fishers21.
Biota Vector (point)
ESRI shapefile (*.shp)
Coastal Tanzania
Ca. 2010 GCS_Arc_1960 1:200.000 No conditions apply
For sightings and landings post 199022.
2013 Institute of Marine Sciences (IMS) (http://www.ims.udsm.ac.tz/)
Resource Provider (Party that supplies the resource)
Christopher Muhando; [email protected]
tza_elevation_200k.shp Land vertical contours based on SRTM 90m Digital Elevation Data
Elevation Vector (point)
ESRI shapefile (*.shp)
Tanzania Ca. 2003 GCS_WGS_1984 1:200.000 No conditions apply
NASA Shuttle Radar Topographic Mission
2013 http://srtm.csi.cgiar.org/ Resource Provider (Party that supplies the resource)
Christopher Muhando; [email protected]
tza_esi_line_v4_50k.shp Ecological Sensitivity Indexing. Prepared by TanSea - version 2.
Environment Vector (line)
ESRI shapefile (*.shp)
Tanzania coast
2013 GCS_WGS_1984 1:50.000 No conditions apply
TANNSEA indexing
2013 OBSCOM (http://www.obscom.eu/)
Resource Provider (Party that supplies the resource)
Christopher Muhando; [email protected]
tza_fish_prawn_culture_10k.shp
The locations where ponds for fish and/or prawn farming is practiced23.
Farming Vector (polygon)
ESRI shapefile (*.shp)
Tanzania coast
2012 GCS_WGS_1984 1:10.000 No conditions apply
Digitized from Google Earth
2013 Institute of Marine Sciences (IMS) (http://www.ims.udsm.ac.tz/)
Resource Provider (Party that supplies the resource)
Christopher Muhando; [email protected]
tza_gas_pipeline_1000k.shp Possible and existing gas lines
Utilities / Communication
Vector (line)
ESRI shapefile (*.shp)
Tanzania Ca. 2012 GCS_WGS_1984 1:100.000 No conditions apply
Prepared by OBSCOM
2012 TanSea Team? Resource Provider (Party that supplies the resource)
Christopher Muhando; [email protected]
tza_harbours_and_ports.shp Locations of harbours and ports (harbour, port, ferry, local port)
Transportation Vector (point)
ESRI shapefile (*.shp)
Tanzania coast
Ca. 2012 GCS_WGS_1984 '1:50.000 No conditions apply
Digitized from Google Earth
2012 Institute of Marine Sciences (IMS) (http://www.ims.udsm.ac.tz/)
Resource Provider (Party that supplies the resource)
Christopher Muhando; [email protected]
tza_historical_sites_50k.shp Field observations of Location of historical sites (coastal Islamic site, cultural site, historical site, stone age site
Society Vector (point)
ESRI shapefile (*.shp)
Tanzania coast
2013 GCS_WGS_1984 1:50.000 No conditions apply
Digitized from field observations
2013 Institute of Marine Sciences (IMS) (http://www.ims.udsm.ac.tz/)
Resource Provider (Party that supplies the resource)
Christopher Muhando; [email protected]
tza_hotels_points_10k.shp Map showing key Hotels located along the sea fronts or coastline of Tanzania24.
Location Vector (point)
ESRI shapefile (*.shp)
Tanzania coast
2013 GCS_WGS_1984 1:10.000 No conditions apply
Digitized from field observations and Google Earth
2012 Institute of Marine Sciences (IMS) (http://www.ims.udsm.ac.tz/)
Resource Provider (Party that supplies the resource)
Christopher Muhando; [email protected]
tza_house_counting_10K.shp
Digitised during TanSea project. Work on this layer is still ongoing.
Location Vector (polygon)
ESRI shapefile (*.shp)
Mtwara and Lindi
2013 GCS_WGS_1984 '1:10.000 No conditions apply
Prepared by OBSCOM
2009-2012
OBSCOM (http://www.obscom.eu/)
Resource Provider (Party that supplies the resource)
Christopher Muhando; [email protected]
tza_humpbackwhales_sightings_250k.shp
This layer shows locations where humpback whale are often sighted nursing their young ( in August-September)25.
Biota Vector (point)
ESRI shapefile (*.shp)
Tanzania coast
2011 GCS_WGS_1984 1:250.000 No conditions apply
Based on Humpback sighting (group) that is led by Dr Matthew Richmond - SAMAKI
2012 Institute of Marine Sciences (IMS) (http://www.ims.udsm.ac.tz/) and SAMAKI Consultants.
Resource Provider (Party that supplies the resource)
Christopher Muhando; [email protected]
tza_iba_1000k.shp Location of Important Bird Areas (IBAs) as designated by Birdlife International through a widely accepted scientific process26.
Biota Vector (polygon)
ESRI shapefile (*.shp)
Tanzania coast
2009 GCS_WGS_1984 1:1.000.000 No conditions apply
Birdlife International. Digitization of these zones was based on Baker and Baker (2002).
2002 Birdlife International Resource Provider (Party that supplies the resource)
Christopher Muhando; [email protected]
tza_important_bird_areas_.shp
Location of Important Bird Areas (IBAs) as designated by Birdlife International through a widely accepted scientific process27.
Biota Vector (polygon)
ESRI shapefile (*.shp)
Tanzania coast
2009 GCS_WGS_1984 1:1.000.000 No conditions apply
Digitization of these zones was based on Baker and Baker (2002).
2002 Birdlife International Resource Provider (Party that supplies the resource)
Christopher Muhando; [email protected]
21 First compilation of the sightings was in 2004 (Wells et al. 2005) and in 2008 by WWF Tanzania (Muhando and Rumisha, 2008) and the last update was by TanSea Project in 2012. 22 Muir C. E., Sallema, A., Adbdallah, I., De Luca, D., & Davenport, T.R.B. 2004. Tanzania. Chapter 8.2 p. 21-28. In: Towards a Western Indian Ocean Dugong Conservation Strategy. WWF Eastern African Marine Ecoregion. WWF. 68 pp. 2004. 23 Information was sourced from Drs Mmochi and Muhando (at IMS). Additional data was extracted from Bartazary MSc theses draft by Mr M. Semba. These locations were also verified or cross-checked in Google Earth. Most of the aquaculture ponds are found in or adjacent to saltpans. 24 Spatial data was sourced from previously digitized hotels (Muhando et al., 2004), Google Earth (digitized) and from TanSea field observations in May-September 2012. 25 This spatial information was contributed by Samaki Consultants 26 Ten IBAs have been designated along the coast of Tanzania and digitization of these zones was based on Baker and Baker (2002). 27 Ten IBAs have been designated along the coast of Tanzania and digitization of these zones was based on Baker and Baker (2002).

13
Dataset Title Dataset Abstract Dataset Category Dataset Type
Dataset Format
Geographic Extent
Temporal extent
Spatial reference Spatial resolution or Equivalent
scale
Conditions for access and use
Lineage (i.e. process history)
Date of latest
revision
Responsible party Role of responsible party Metadata point of contact
tza_inland_water_1000k.shp Inland waters East Africa - Lakes, ponds and small water bodies.
Inland Waters Vector (polygon)
ESRI shapefile (*.shp)
East Africa 2009 GCS_WGS_1984 1:1.000.000 No conditions apply
unknown ? VMAP0 Resource Provider (Party that supplies the resource)
Christopher Muhando; [email protected]
tza_international_bnd_50k.shp
International boundary Tanzania
Boundaries Vector (polygon)
ESRI shapefile (*.shp)
Tanzania Ca. 2010 GCS_WGS_1984 1:50.000 No conditions apply
Digitized from topographical maps
Ca. 2007 Institute of Marine Sciences (IMS) (http://www.ims.udsm.ac.tz/)
Resource Provider (Party that supplies the resource)
National Bureau of Statistics - Dar es Salaam
tza_land_islands_50k.shp This layer shows coastal land and Islands. It was digitized from National Topographic maps (1:50.000) at IMS in 1997.
Geo-scientific Information
Vector (polygon)
ESRI shapefile (*.shp)
Tanzania 2012 GCS_WGS_1984 1:50.000 No conditions apply
Clipped from coastal habitats layer (tzcsis)
2005 Institute of Marine Sciences (IMS) (http://www.ims.udsm.ac.tz/)
Resource Provider (Party that supplies the resource)
Christopher Muhando; [email protected]
tza_languages_5000k.shp Layer showing the location of languages spoken along the coastal zone of Tanzania28.
Society Vector (polygon)
ESRI shapefile (*.shp)
Tanzania 2013 GCS_WGS_1984 1:5.000.000 No conditions apply
Digitized from field observations
2012 Digitized by TanSea Team Resource Provider (Party that supplies the resource)
Christopher Muhando; [email protected]
tza_lighthouse_point.shp A layer showing the location of lighthouses along the Tanzania Coast. Data was sourced and digitized by Samaki team.
Transportation Vector (point)
ESRI shapefile (*.shp)
Tanzania Ca. 2012 GCS_WGS_1984 1:100.000 No conditions apply
Digitized 2012 Samaki Resource Provider (Party that supplies the resource)
Christopher Muhando; [email protected]
tza_mangroves_50k.shp The distribution of mangroves in Tanzania29.
Environment Vector (polygon)
ESRI shapefile (*.shp)
Tanzania 1990 GCS_WGS_1984 1:50.000 No conditions apply
Digitized from topographical maps
2012 Institute of Marine Sciences (IMS) (http://www.ims.udsm.ac.tz/)
Resource Provider (Party that supplies the resource)
Christopher Muhando; [email protected]
tza_marine_protected_areas_xx.shp
The distribution of Marine Managed Areas (Marine Parks, Reserves, Conservation Areas and Sanctuaries) in Tanzania.
Environment Vector (polygon)
ESRI shapefile (*.shp)
Tanzania coast
2012 GCS_WGS_1984 1:50.000 No conditions apply
Various sources30.
2013 Institute of Marine Sciences (IMS) (http://www.ims.udsm.ac.tz/)
Resource Provider (Party that supplies the resource)
Christopher Muhando; [email protected]
tza_marine_ramsar_rumaki.shp
The location of RUMAKI Marine Ramsar Site.
Environment Vector (polygon)
ESRI shapefile (*.shp)
Tanzania 2013 GCS_WGS_1984 1:50.000 No conditions apply
Boundaries Approximated by Dr Muhando based of RUMAKI project boundaries
2013 Institute of Marine Sciences (IMS) (http://www.ims.udsm.ac.tz/)
Resource Provider (Party that supplies the resource)
Christopher Muhando; [email protected]
tza_railways_1000k.shp Tanzania Railways. Transportation Vector (line)
ESRI shapefile (*.shp)
Tanzania Ca. 2012 GCS_WGS_1984 1:1.000.000 No conditions apply
GE DIGIT, Field, Open Street Map, Mapping and Survey Division of Zanzibar
2012 VMAP0 Resource Provider (Party that supplies the resource)
Christopher Muhando; [email protected]
tza_regions_clip_50k.shp Tanzania Coastal District boundaries from geographic database of global administrative areas (GADM)31.
Boundaries Vector (polygon)
ESRI shapefile (*.shp)
Tanzania Coastal Regions
Ca. 2010 GCS_WGS_1984 1:50.000 No conditions apply
Data was clipped from TZA_adm1.shp which was downloaded from http://www.gadm.org/country/Tanzania
Ca. 2007 Institute of Marine Sciences (IMS) (http://www.ims.udsm.ac.tz/)
Resource Provider (Party that supplies the resource)
National Bureau of Statistics - Dar es Salaam
28 Field data collection was in Feb 2012 by SAMAKI/IMS team 29 This layer was compiled at IMS in 2009 based on a combination of previously produced mangrove distribution maps: IMS mangrove map digitized from Topographic maps based on aerial images of mid 1980s, Semesi et al (1991) mangrove maps and Wang et al (2001) maps sourced from NEMC. 30 Based on MPAs Declaration documents, Institute of Marine Sciences, discussions with Marin Parks and Reserves Unit (Dar es Salaam) and Zanzibar Marine Conservation Unit. 31 This layer is clipped and modified to separate Mkinga District from Muheza District polygon. Source layer (tza_adm2,shp) was downloaded from DIVA GIS (http://www.diva-gis.org/gdata.

14
Dataset Title Dataset Abstract Dataset Category Dataset Type
Dataset Format
Geographic Extent
Temporal extent
Spatial reference Spatial resolution or Equivalent
scale
Conditions for access and use
Lineage (i.e. process history)
Date of latest
revision
Responsible party Role of responsible party Metadata point of contact
tza_regions_Clip_l_50k.shp Tanzania Coastal District boundaries in line format. Source layer 52 (tza_regions_clip_50k.shp)
Boundaries Vector (line)
ESRI shapefile (*.shp)
Tanzania Coastal Regions
Ca. 2010 GCS_WGS_1984 1:50.000 No conditions apply
Data was clipped from TZA_adm1.shp which was downloaded from http://www.gadm.org/country/Tanzania
Ca. 2007 Institute of Marine Sciences (IMS) (http://www.ims.udsm.ac.tz/)
Resource Provider (Party that supplies the resource)
National Bureau of Statistics - Dar es Salaam
tza_regions_nbs This layer shows the Tanzania regional boundaries32.
Boundaries Vector (polygon)
ESRI shapefile (*.shp)
Tanzania 2010 UTM_Arc_1960 1:50.000 No conditions apply
National Bureau of Statistics - Dar es Salaam
2009 National Bureau of Statistics - Dar es Salaam
National Bureau of Statistics - Dar es Salaam
National Bureau of Statistics - Dar es Salaam
tza_river_mouth.shp River entry points (River mouths)
Inland Waters Vector (point)
ESRI shapefile (*.shp)
Tanzania coast
2012 GCS_WGS_1984 1:10.000 No conditions apply
Digitized based on field observation and Google Earth
Ca. 2003 Institute of Marine Sciences (IMS) (http://www.ims.udsm.ac.tz/)
Resource Provider (Party that supplies the resource)
Christopher Muhando; [email protected]
tza_road_50k.shp The Tanzania Road Network33.
Transportation Vector (line)
ESRI shapefile (*.shp)
Tanzania Ca. 2012 GCS_WGS_1984 1:50.000 No conditions apply
GE DIGIT, Field, Open Street Map, Mapping and Survey Division of Zanzibar
2012 Institute of Marine Sciences (IMS) (http://www.ims.udsm.ac.tz/)
Resource Provider (Party that supplies the resource)
Christopher Muhando; [email protected]
tza_saltpans_points_10k.shp The locations where salt pans (point) are found. A better layer (in polygons) tza_saltpans_poly_5k.shp (58) exists. So delete this layer
Farming Vector (point)
ESRI shapefile (*.shp)
Tanzania 2012 GCS_WGS_1984 1:10.000 No conditions apply
Digitized from Google Earth
2012 Institute of Marine Sciences (IMS) (http://www.ims.udsm.ac.tz/)
Resource Provider (Party that supplies the resource)
Christopher Muhando; [email protected]
tza_saltpans_poly_5k.shp Saltpan areas Farming Vector (polygon)
ESRI shapefile (*.shp)
Tanzania 2012 GCS_WGS_1984 1:5.000 No conditions apply
Digitized from field observations and Google Earth
2012 Institute of Marine Sciences (IMS) (http://www.ims.udsm.ac.tz/)
Resource Provider (Party that supplies the resource)
Christopher Muhando; [email protected]
tza_seahorses_points_200k.shp
Locations where Sea horse (Hippocampus) are found in appreciable aggregations34.
Biota Vector (point)
ESRI shapefile (*.shp)
Tanzania 2008 - 2012
GCS_WGS_1984 1:200.000 No conditions apply
Various sources35.
? Institute of Marine Sciences (IMS) (http://www.ims.udsm.ac.tz/)
Resource Provider (Party that supplies the resource)
Christopher Muhando; [email protected]
tza_seaweed_farming_10k.shp
Locations with sea weed farming as points
Farming Vector (point)
ESRI shapefile (*.shp)
Coastal Tanzania
2012 GCS_WGS_1984 1:10.000 No conditions apply
Digitised at the Institute of Marine Sciences36.
2012 Institute of Marine Sciences (IMS) (http://www.ims.udsm.ac.tz/)
Resource Provider (Party that supplies the resource)
Christopher Muhando; [email protected]
tza_settlements_50k.shp Named settlements (District HQ, Regional HQ, settlements) as points37.
Location Vector (point)
ESRI shapefile (*.shp)
Coastal Tanzania
2013 GCS_WGS_1984 1:50.000 No conditions apply
Digitized from topographical maps
Ca. 2003 Institute of Marine Sciences (IMS) (http://www.ims.udsm.ac.tz/)
Resource Provider (Party that supplies the resource)
Christopher Muhando; [email protected]
tza_shark_sites_50k.shp This layer shows the areas known to have relatively higher concentrations of sharks and/or shark fishery38.
Biota Vector (point)
ESRI shapefile (*.shp)
Coastal Tanzania
2008 - 2012
GCS_WGS_1984 1:50.000 No conditions apply
Digitized from topographical maps
? Institute of Marine Sciences (IMS) (http://www.ims.udsm.ac.tz/)
Resource Provider (Party that supplies the resource)
Christopher Muhando; [email protected]
32 Obtained from National Bureau of Statistics. However it doesn't include the recent changes and it looks very similar to layer number 8 - TZA_adm1.shp. 33 Roads are classified as footpath, footway, living street, main road, primary link, residential, road, secondary, secondary road, service, tertiary, track, trail, trunk, two lanes main road, unclassified, unknown, unsurfaced) 34 This spatial dataset was contributed by Samaki Consultants under the leadership of Dr M.D. Richmond. Seahorses are sometimes regarded as the jewels and some species have been listed as endangered marine fish. Species composition of Tanzania seahorses is not yet known. 35 McPherson & Vincent 2004 Assessing East African trade in seahorse species as a basis for conservation under international controls Aquatic Conservation: Marine and Freshwater Ecosystems, 14 (5), p. 521-538, 2004) + (ZNZ Dive Centre Newsletter Vol. 1 (2) 2nd Qtr, 2009) + (Pers. Obs. (MR) Mafia Chole Bay, 2009) +
(Pers. Comm. (MR) with Isobel Pring, ECO2 Manager, Mikindani Mtwara, 2009 36 Data contributed by Zanzibar Fisheries Department (Mr Hamad), Dr. Flower Msuya. 37 Source of information is National Topographic maps prepared by Surveys and Mapping Division in Dar es Salaam and Zanzibar. 38 First digitisation of shark areas was in 2004 (Wells et al. 2005) and information was later updated in 2008 by WWF Tanzania (Muhando and Rumisha, 2008). Last update was by TanSea Project in 2012

15
Dataset Title Dataset Abstract Dataset Category Dataset Type
Dataset Format
Geographic Extent
Temporal extent
Spatial reference Spatial resolution or Equivalent
scale
Conditions for access and use
Lineage (i.e. process history)
Date of latest
revision
Responsible party Role of responsible party Metadata point of contact
tza_sport_fishing_sites_200k.shp
Sport fishing sites in Tanzania. Data was based on interviewed tourist operators and Field observations
Society Vector (point)
ESRI shapefile (*.shp)
Coastal Tanzania
Ca. 2012 GCS_WGS_1984 1:200.000 No conditions apply
Digitized from field observations
2012 Institute of Marine Sciences (IMS) (http://www.ims.udsm.ac.tz/)
Resource Provider (Party that supplies the resource)
Christopher Muhando; [email protected]
tza_srtm_contours_10m_250k.shp
Land elevation contours (lines) at an interval of 10 m39.
Elevation Vector (line)
ESRI shapefile (*.shp)
Southern coastal Tanzania
Ca. 2003 GCS_WGS_1984 1:250.000 No conditions apply
Derived from SRTM data (v4.1)
Ca. 2003 OBSCOM (http://www.obscom.eu/)
Resource Provider (Party that supplies the resource)
Christopher Muhando; [email protected]
tza_srtm_hs.tif SRTM DEM Image covering the southern part of Tanzania only.
Elevation Raster GeoTiff (*.tif)
Southern coastal Tanzania
Ca. 2003 GCS_WGS_1984 1:250.000 No conditions apply
SRTM data (v4.1)
Ca. 2003 OBSCOM (http://www.obscom.eu/)
Resource Provider (Party that supplies the resource)
Christopher Muhando; [email protected]
tza_srtm_streams_250k.shp Streams derived from DEM Inland Waters Vector (line)
ESRI shapefile (*.shp)
Southern coastal Tanzania
Ca. 2003 GCS_WGS_1984 1:250.000 No conditions apply
Derived from SRTM data (v4.1)
Ca. 2003 OBSCOM (http://www.obscom.eu/)
Resource Provider (Party that supplies the resource)
Christopher Muhando; [email protected]
tza_turtle_nesting_points_10k.shp
This layer shows locations of turtle nesting sites40.
Biota Vector (point)
ESRI shapefile (*.shp)
Coastal Tanzania
2008 - 2012
GCS_WGS_1984 1:10.000 No conditions apply
Spatial information from Sea Sense (NGO), Samaki Consultants, Wells et al. (2004) and Muhando and Rumisha (2008).
2012 Sea Sense (NGO), Samaki Consultants, Wells et al. (2004) and Muhando and Rumisha (2008).
Resource Provider (Party that supplies the resource)
Christopher Muhando; [email protected]
tza_VIL_Point_10k.shp Layer of settlements or villages in Lindi and Mtwara Regions
Location Vector (point)
ESRI shapefile (*.shp)
Southern coastal Tanzania
1999 UTM_Arc_1960 1:50.000 No conditions apply
Digitised by Naliendele College of Agriculture
Ca. 2002 Institute of Marine Sciences (IMS) (http://www.ims.udsm.ac.tz/)
Resource Provider (Party that supplies the resource)
Christopher Muhando; [email protected]
tza_Wards.shp Tanzania Wards boundaries from geographic database of global administrative areas (GADM)41.
Boundaries Vector (polygon)
ESRI shapefile (*.shp)
Tanzania Ca. 2010 GCS_WGS_1984 1:50.000 No conditions apply
Data was clipped from TZA_adm3.shp which was downloaded from http://www.gadm.org/country/Tanzania
Ca. 2007 Institute of Marine Sciences (IMS) (http://www.ims.udsm.ac.tz/)
Resource Provider (Party that supplies the resource)
National Bureau of Statistics - Dar es Salaam
tza_Wards_Clip_l.shp Tanzania coastal Wards boundaries clipped from tza_wards.shp (69).
Boundaries Vector (line)
ESRI shapefile (*.shp)
Coastal Tanzania
Ca. 2010 GCS_WGS_1984 1:50.000 No conditions apply
Data was clipped from TZA_adm3.shp which was downloaded from http://www.gadm.org/country/Tanzania
Ca. 2007 Institute of Marine Sciences (IMS) (http://www.ims.udsm.ac.tz/)
Resource Provider (Party that supplies the resource)
National Bureau of Statistics - Dar es Salaam
tza_wards_nbs Tanzania Wards boundaries layer sourced from National Bereau of Statistics.
Boundaries Vector (polygon)
ESRI shapefile (*.shp)
Tanzania 2012 UTM_Arc_1960 1:50.000 No conditions apply
National Bureau of Statistics - Dar es Salaam
2010 National Bureau of Statistics - Dar es Salaam
Resource Provider (Party that supplies the resource)
National Bureau of Statistics - Dar es Salaam
tza_watercourse_1000k.shp Rivers in mainland Tanzania.
Inland Waters Vector (line)
ESRI shapefile (*.shp)
Tanzania 2010 GCS_WGS_1984 1:1.000.000 No conditions apply
Prepared by OBSCOM
Ca. 2003 OBSCOM (http://www.obscom.eu/)
Resource Provider (Party that supplies the resource)
Christopher Muhando; [email protected]
tza_whale_sharks_areas_200k.shp
This layer shows locations where whale sharks are often sighted seasonally or otherwise use as a nursery area42.
Biota Vector (point)
ESRI shapefile (*.shp)
Coastal Tanzania
2008 - 2012
GCS_WGS_1984 1:200.000 No conditions apply
Originally based on interviewed fishers43.
2012 Wells et al. (2004) Muhando and Rumisha (2008) and TanSea Team
Resource Provider (Party that supplies the resource)
Christopher Muhando; [email protected]
39 The contour lines are extracted or constructed from srtm_tz.tif Digital Elevation Model (DEM) that eas provided by Christian 40 This spatial information was contributed by Sea Sense (NGO) and Samaki Consultants. Some data was also sourced from Wells et al. (2004) and Muhando and Rumisha (2008). 41 This layer is downloaded from DIVA GIS (http://www.diva-gis.org/gdata or http://www.gadm.org/) 42 This spatial information was contributed by Samaki Consultants under the leadership of Dr. M.D. Richmond. The whale shark (Rhincodon typus) is a slow-moving filter feeding shark and the largest known extant fish species. 43 Wells et al. (2004; Muhando and Rumisha, 2008) and recently updated by Samaki Consultants (2012).

16
Dataset Title Dataset Abstract Dataset Category Dataset Type
Dataset Format
Geographic Extent
Temporal extent
Spatial reference Spatial resolution or Equivalent
scale
Conditions for access and use
Lineage (i.e. process history)
Date of latest
revision
Responsible party Role of responsible party Metadata point of contact
tza_zan_fish_landing_sites_10k.shp
This layer shows the location of the Fish Landing Sites in Tanzania mainland and Zanzibar44.
Location Vector (point)
ESRI shapefile (*.shp)
Coastal Tanzania
2013 GCS_WGS_1984 1:10.000 No conditions apply
Digitized from field observation and Google Earth
2012 Institute of Marine Sciences (IMS) (http://www.ims.udsm.ac.tz/)
Resource Provider (Party that supplies the resource)
Christopher Muhando; [email protected]
tza_zanzibar_hospitals_etc_50k
The location of hospitals and other health centres or facilities in Unguja and Pemba, Zanzibar45.
Location Vector (point)
ESRI shapefile (*.shp)
Zanzibar (Pemba and Unguja) Island
2008 plus Arc_1960_UTM_Zone_37S
1:50.000 Unknown Zanzibar Survey and Mapping Department though Mr Omar Issa Khamis
Ca. 2008 Zanzibar Department of Survey and Mapping
Resource Provider (Party that supplies the resource)
Christopher Muhando; [email protected]
tza_zanzibar_schools_50k The location of schools in Unguja and Pemba, Zanzibar46.
Location Vector (point)
ESRI shapefile (*.shp)
Zanzibar (Pemba and Unguja) Island
2008 plus Arc_1960_UTM_Zone_37S
1:50.000 Unknown Zanzibar Survey and Mapping Department though Mr Omar Issa Khamis
Ca. 2008 Zanzibar Department of Survey and Mapping
Resource Provider (Party that supplies the resource)
Christopher Muhando; [email protected]
44 All fish landing sites for Unguja Island are shown. Some updates are required for Pemba districts. Fish landing sites for Mtwara, Lindi, Kilwa, Temeke, Ilala, Kinondoni and Bagamoyo are complete. Updating is required for Tanga districts (Pangani, Muheza, Tanga urban, and Mkinga). Fishing capacity data is included for
some Districts only - efforts are underway to get and link fishing gear, vessels and fishermen data to the corresponding fish landing sites 45 This layer is still under development. Information is gathered and coordinated by Zanzibar Department of Survey and Mapping. 46 This layer is still under development. Information is gathered and coordinated by Zanzibar Department of Survey and Mapping.

17
Map Section

18
Map 1: Administrative and Infrastructure features in the Coastal Zone of Tanzania

19
Map 2: Land Cover and Uses of Nearshore Waters in the Coastal Zone of Tanzania

20
Map 3: Habitats and Resources in the Coastal Zone of Tanzania
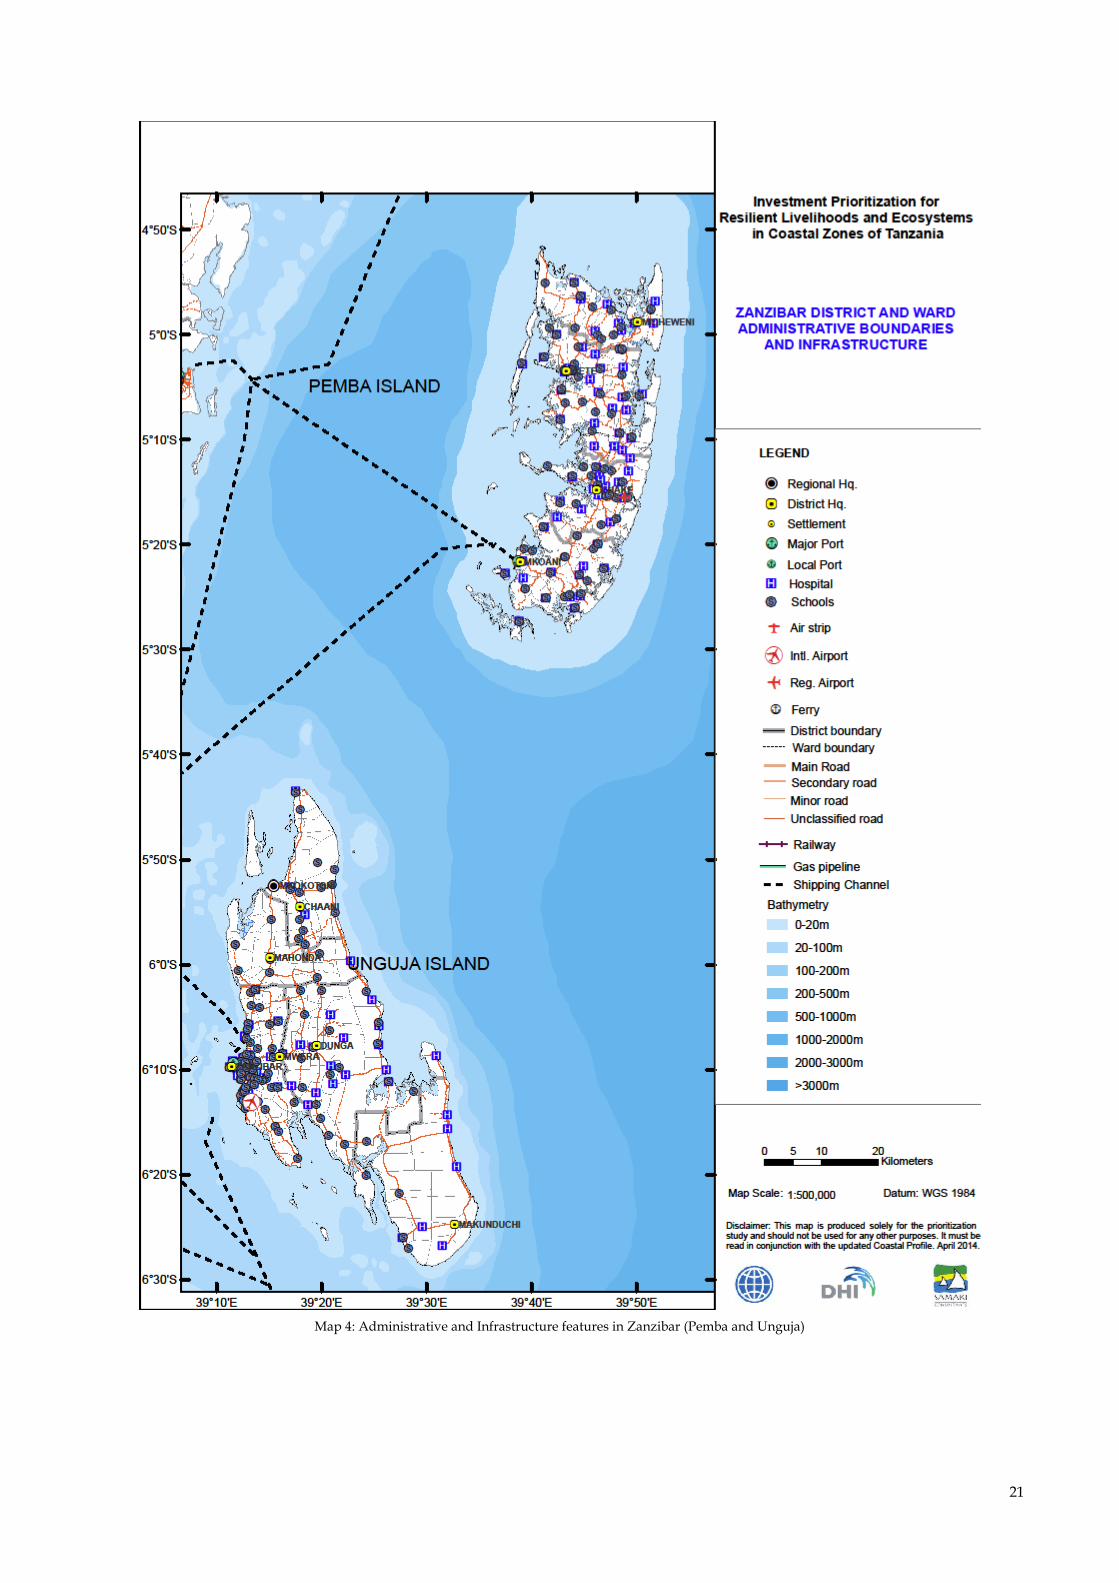
21
Map 4: Administrative and Infrastructure features in Zanzibar (Pemba and Unguja)

22
Map 5: Land Cover and Uses of Nearshore Waters in Zanzibar (Pemba and Unguja)

23
Map 6: Coastal Habitats and Resources in Zanzibar (Pemba and Unguja)

24
Map 7: Pangani District. Administrative and Infrastructure features.
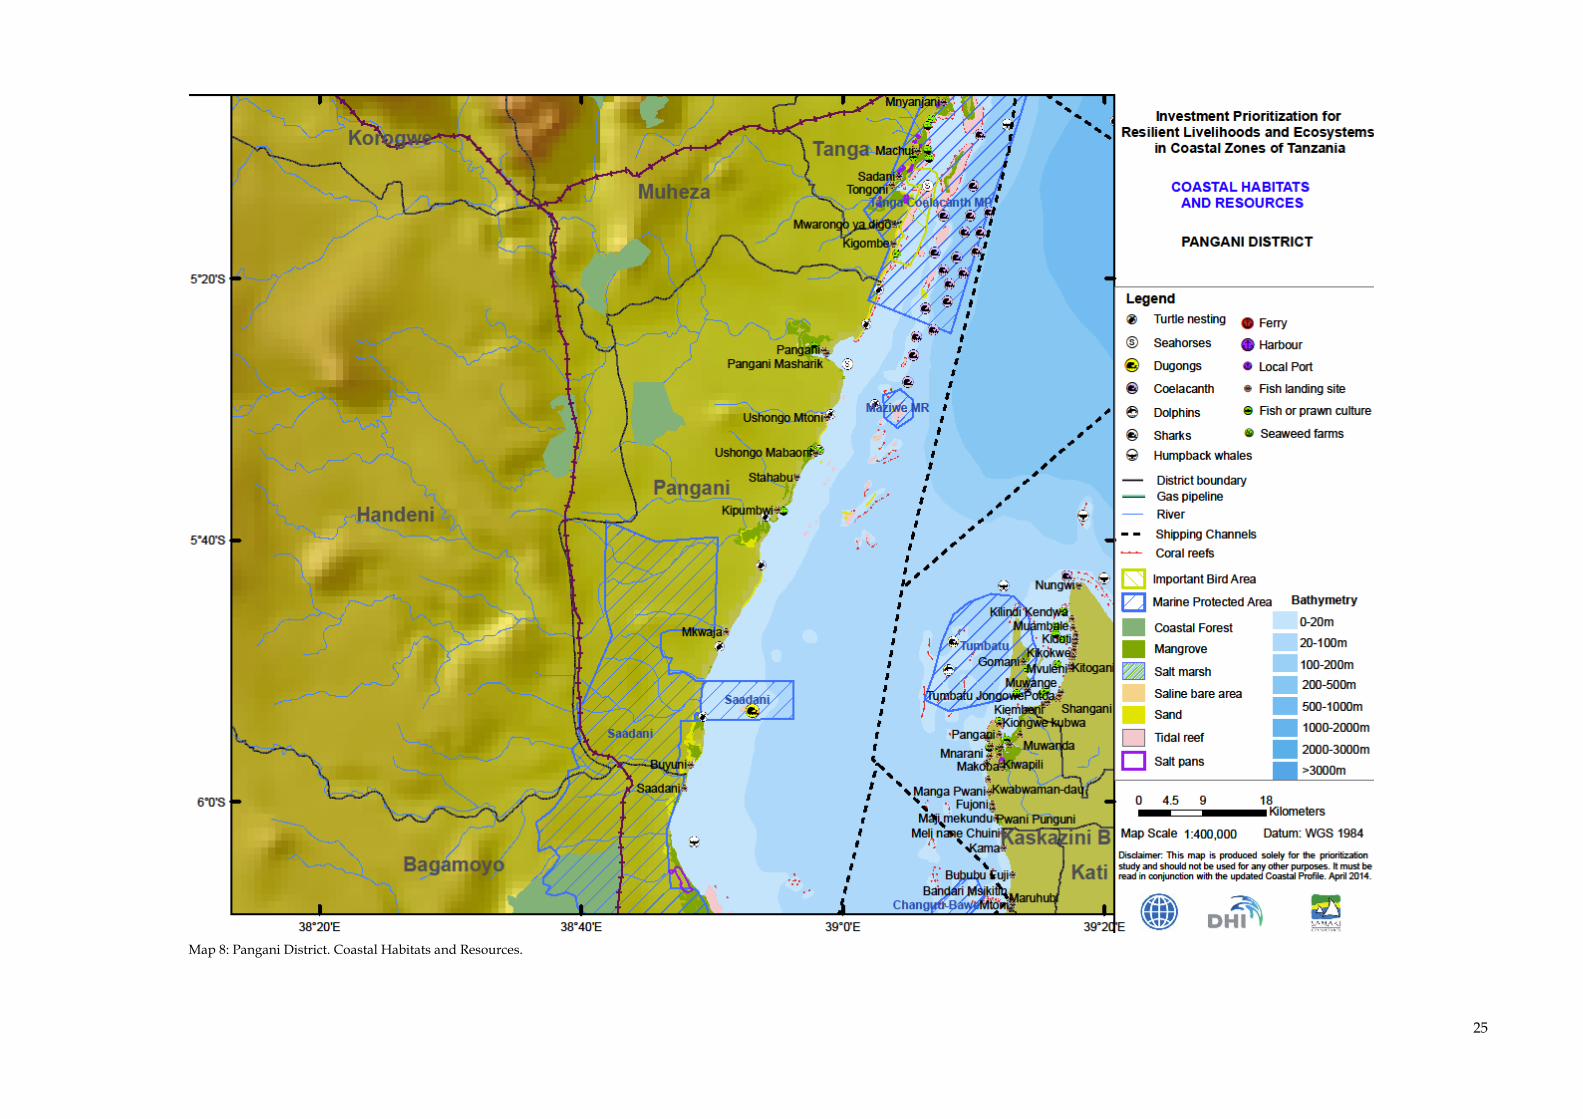
25
Map 8: Pangani District. Coastal Habitats and Resources.

26
Map 9: Mkinga, Tanga and Muheza Districts. Administrative and Infrastructure features.

27
Map 10: Mkinga, Tanga and Muheza Districts. Coastal Habitats and Resources.

28
Map 11: Kinondoni, Ilala and Temeke Districts. Administrative and Infrastructure features.
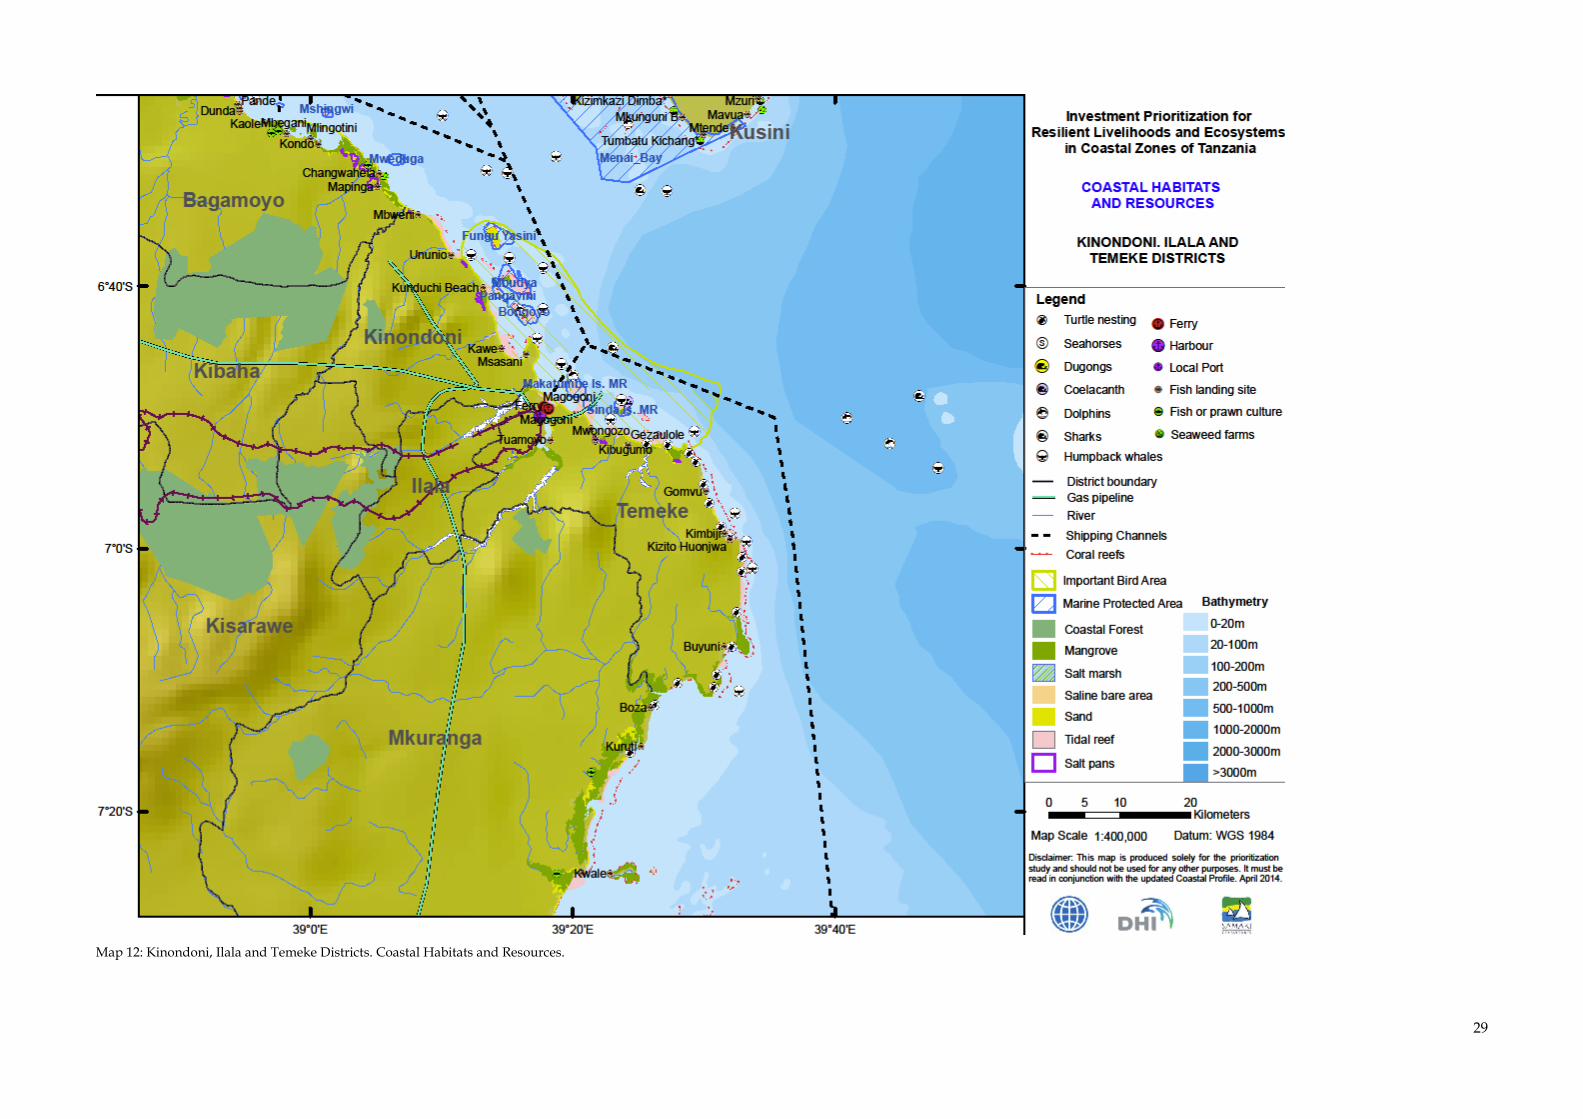
29
Map 12: Kinondoni, Ilala and Temeke Districts. Coastal Habitats and Resources.

30
Map 13: Rufiji District. Administrative and Infrastructure features.

31
Map 14: Rufiji District.. Coastal Habitats and Resources.

32
Map 15: Mafia District. Administrative and Infrastructure features.

33
Map 16: Mafia District.. Coastal Habitats and Resources.
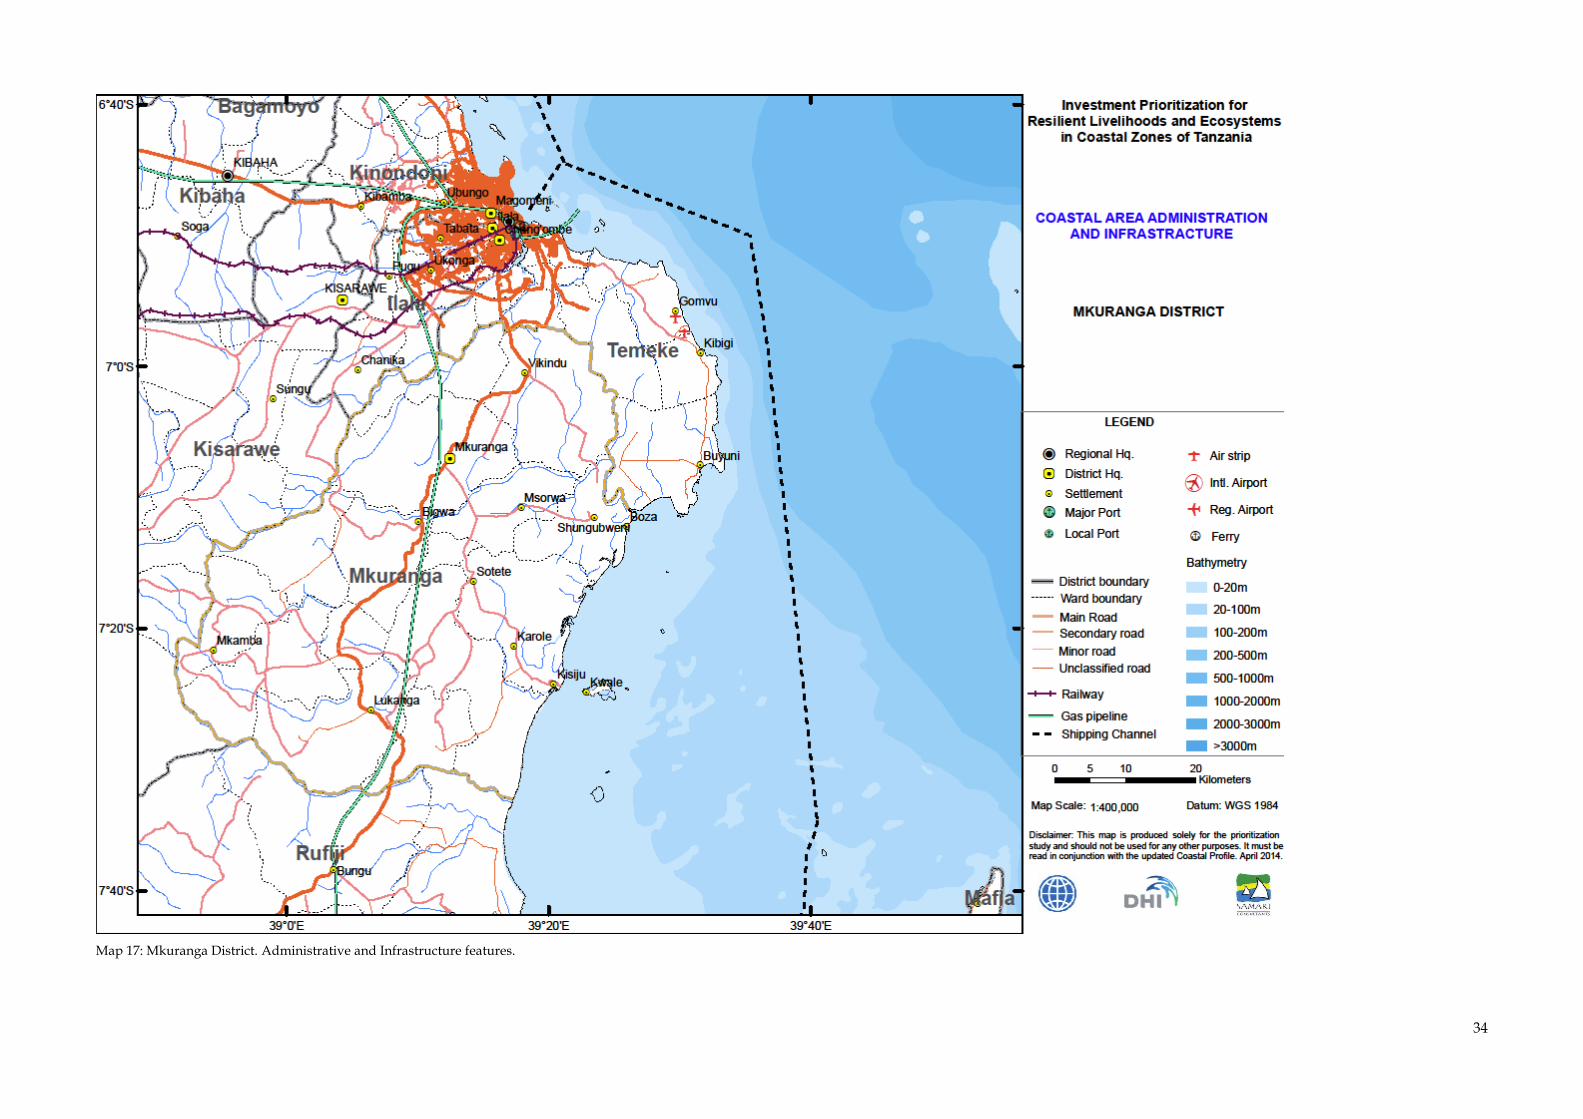
34
Map 17: Mkuranga District. Administrative and Infrastructure features.

35
Map 18: Mkuranga District.. Coastal Habitats and Resources.

36
Map 19: Bagamoyo District. Administrative and Infrastructure features.

37
Map 20: Bagamoyo District.. Coastal Habitats and Resources.

38
Map 21: Lindi Urban and Lindi Rural Districts. Administrative and Infrastructure features.

39
Map 22: Lindi Urban and Lindi Rural Districts. Coastal Habitats and Resources.
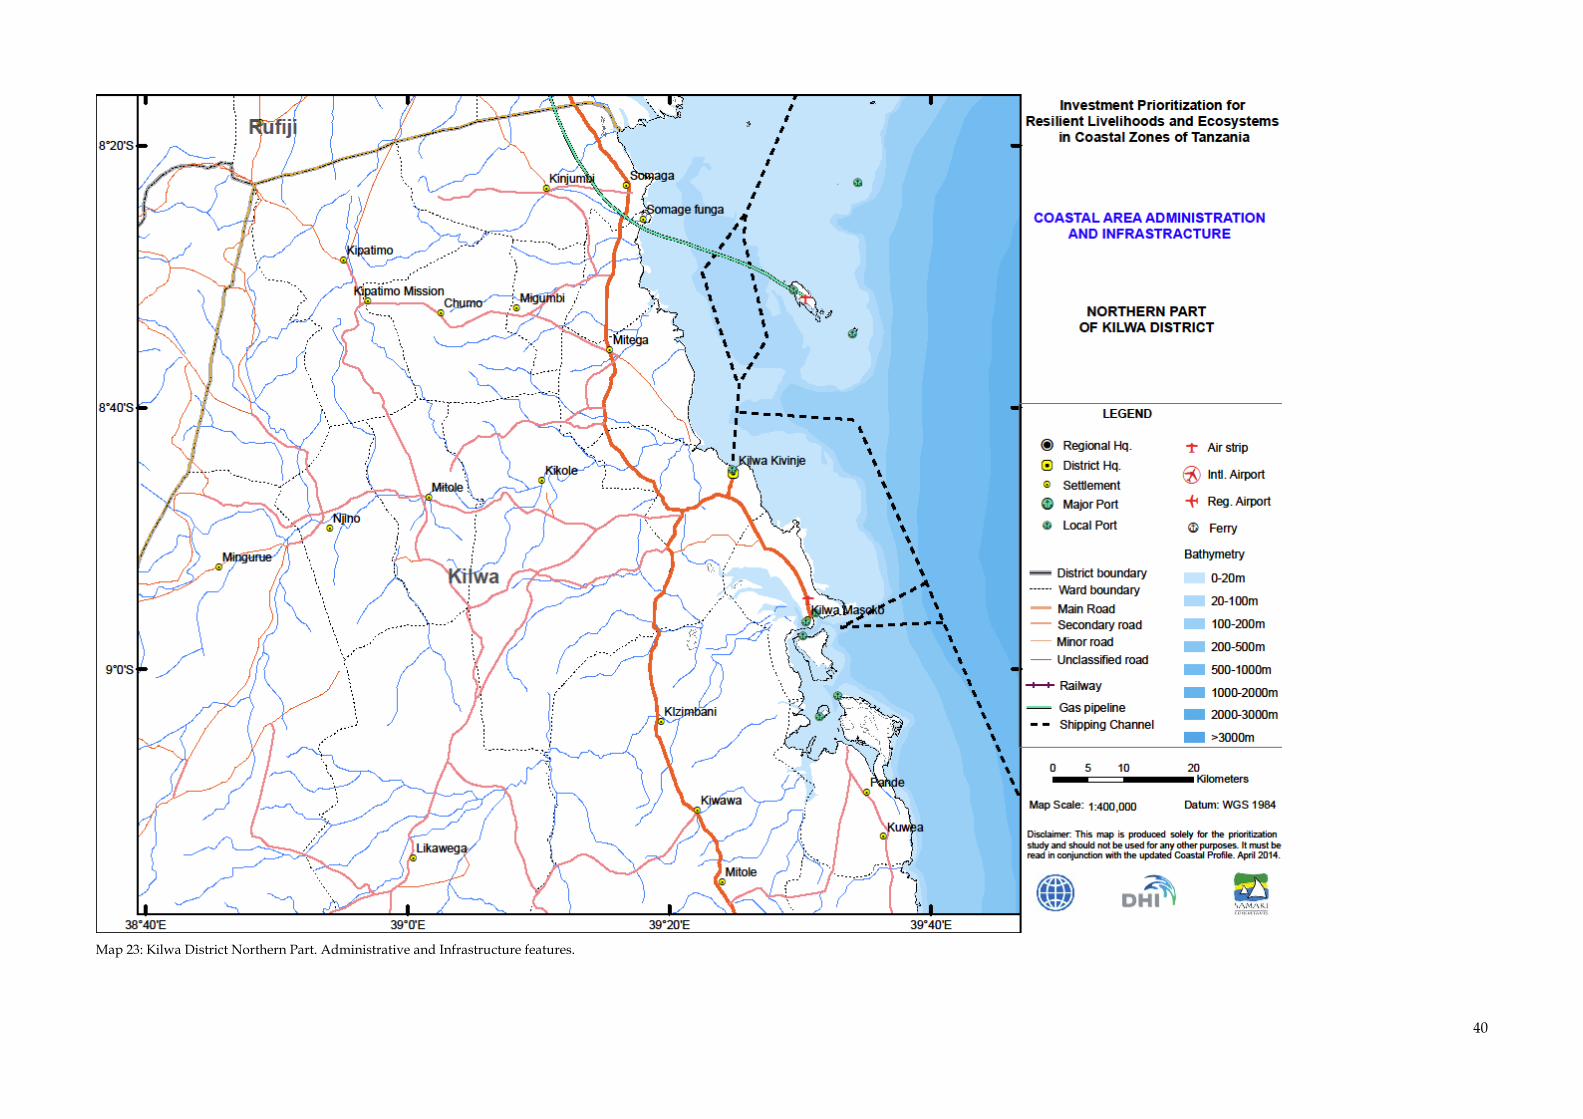
40
Map 23: Kilwa District Northern Part. Administrative and Infrastructure features.
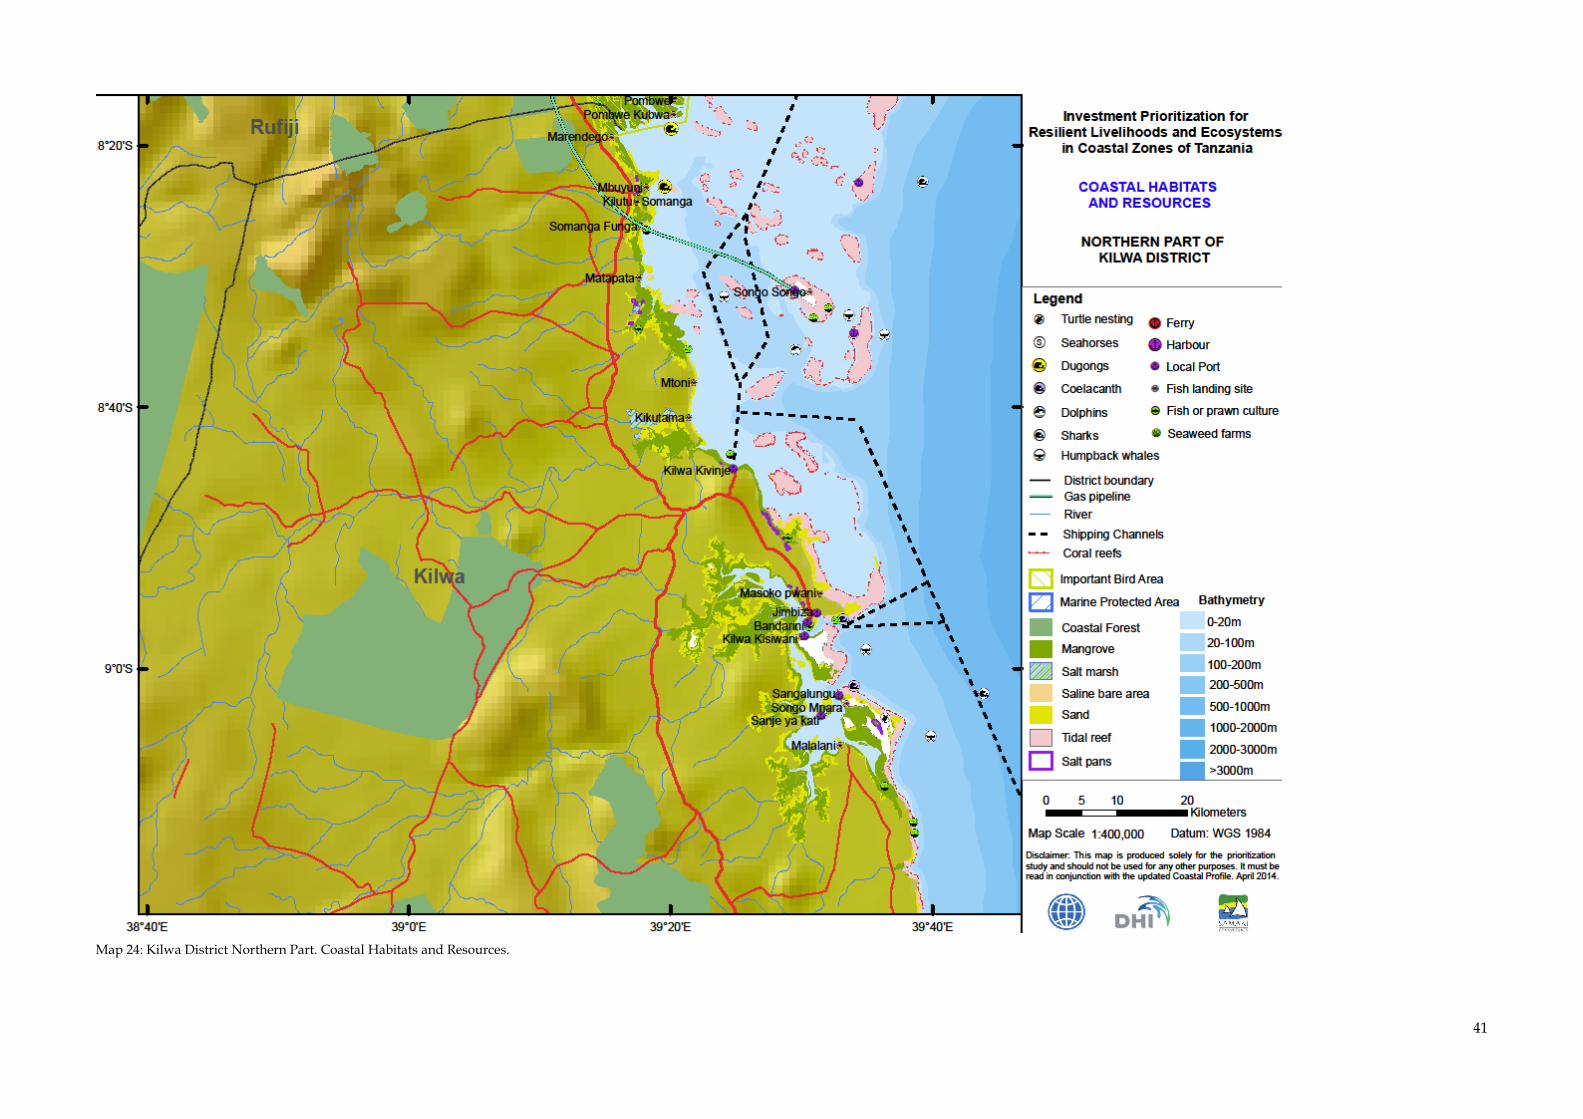
41
Map 24: Kilwa District Northern Part. Coastal Habitats and Resources.

42
Map 25: Kilwa District Southern Part. Administrative and Infrastructure features.

43
Map 26: Kilwa District Southern Part. Coastal Habitats and Resources.

44
.
Map 27: Mtwara Urban and Mtwara Rural Districts. Administrative and Infrastructure features.

45
Map 28: Mtwara Urban and Mtwara Rural District. Coastal Habitats and Resources.

46
Map 29: Pemba Island, Northern Part. Administrative and Infrastructure features.

47
Map 30: Pemba Island, Northern Part. Coastal Habitats and Resources.

48
Map 31: Pemba Island, Southern Part. Administrative and Infrastructure features.

49
Map 32: Pemba Island, Southern Part. Coastal Habitats and Resources.
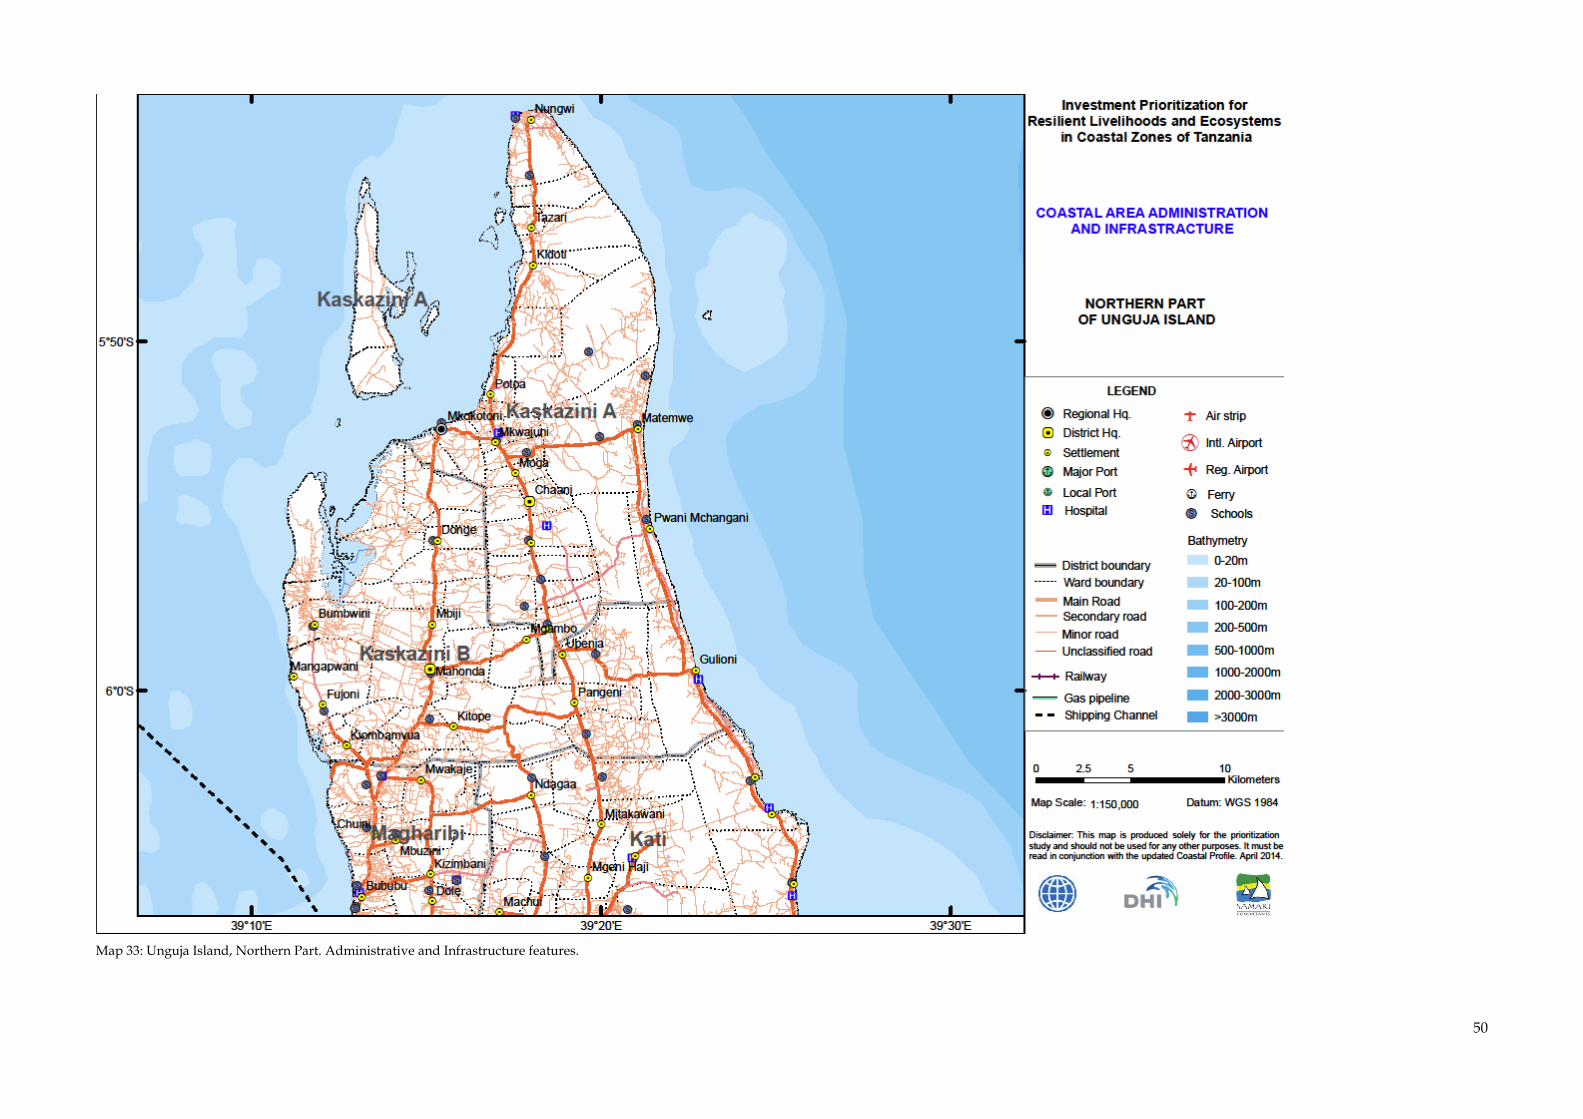
50
Map 33: Unguja Island, Northern Part. Administrative and Infrastructure features.

51
Map 34: Unguja Island, Northern Part. Coastal Habitats and Resources.

52
Map 35: Unguja Island, Southern Part. Administrative and Infrastructure features.
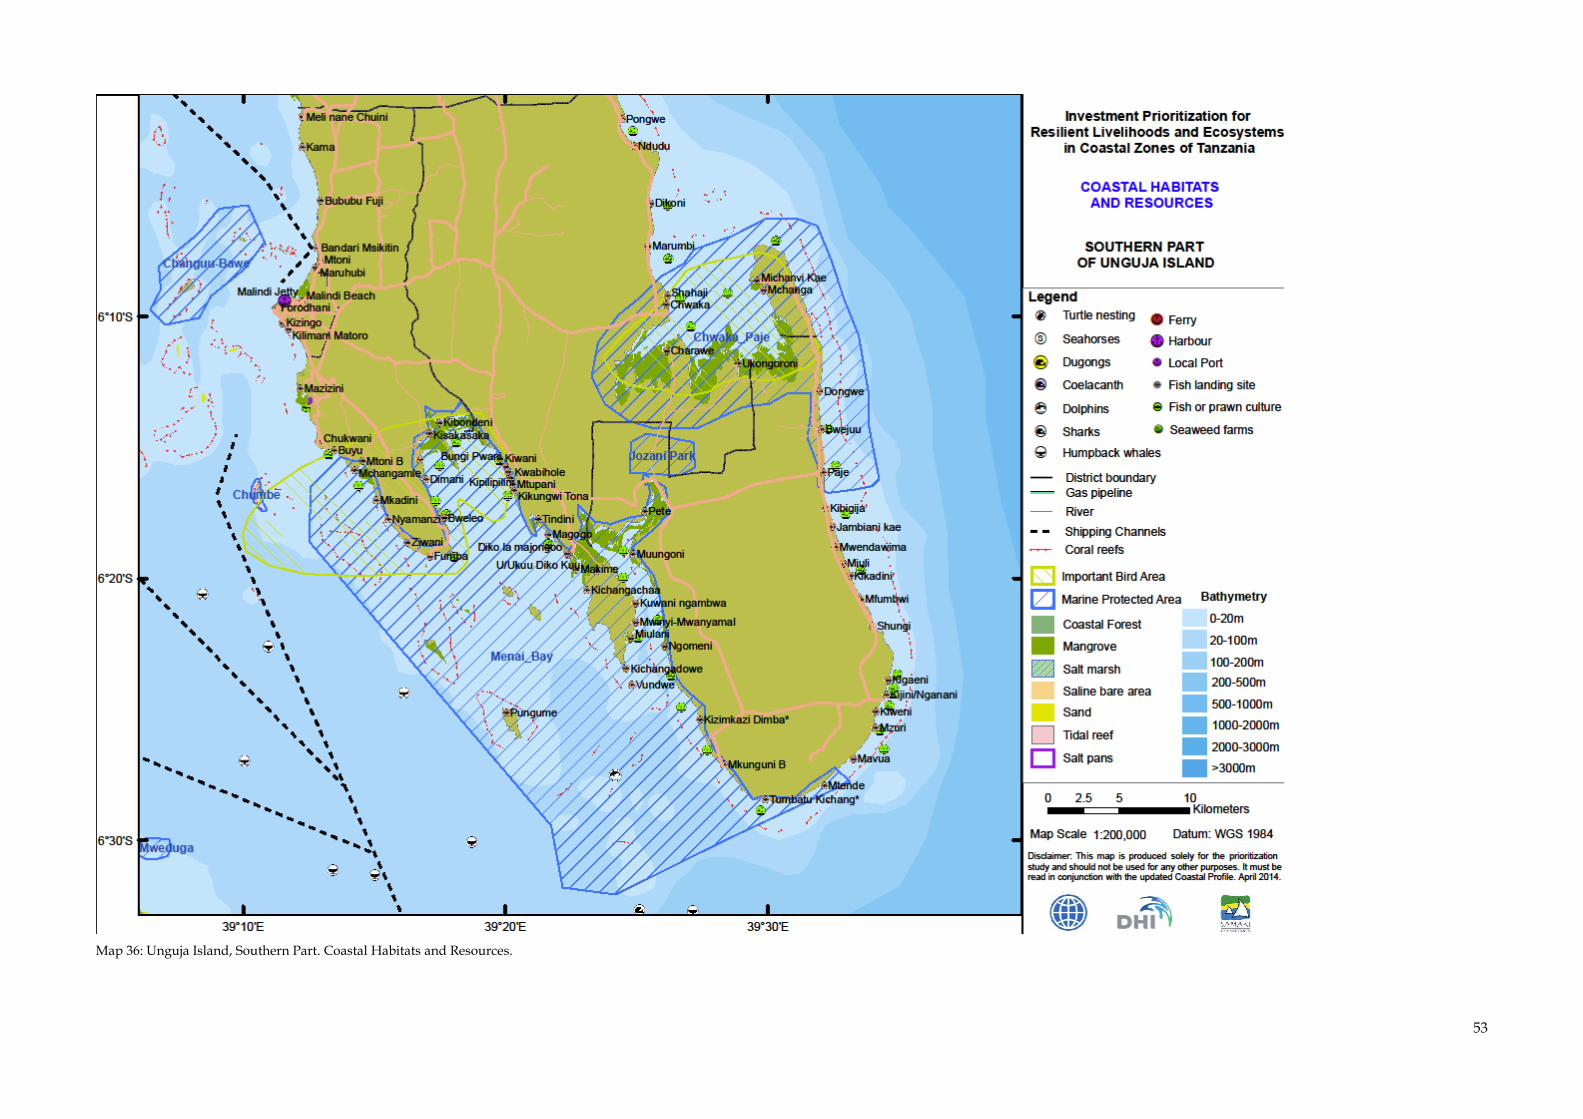
53
Map 36: Unguja Island, Southern Part. Coastal Habitats and Resources.

54
Table Section

55
Table 2: Population data for coastal regions and districts of mainland Tanzania and Zanzibar. Data include number of households, male, female and total population, population density and average household size. Change in population and household size in past inter-census period (2002 - 2012).
Area2 2002 Census 2012 Census Average Annual Change
Households1 Male
Population2 Female
Population2 Total
Population2 Population
Density Household
Size Households1 Male
Population1 Female
Population1 Total
Population1 Population
Density Household
Size Population Household
Size
km² households males females persons persons/
km² persons/
household households males females persons persons/ km² persons/
household % %
TANZANIA 895,753 no data 16,759,333 17,553,938 34,313,271 38 NA 9,362,758 21,869,990 23,058,933 44,928,923 50 4.8 2.70% NA
MAINLAND TANZANIA 893,246 no data 16,291,371 17,065,831 33,357,202 37 NA 9,109,150 21,239,313 22,386,041 43,625,354 49 4.8 2.68% NA
Mainland Tanzania Coastal Regions 146,353 1,638,845 3,370,822 3,504,703 6,875,525 47 4.2 2,361,689 4,670,114 4,973,806 9,643,920 66 4.1 3.38% -0.27%
Mainland Tanzania Coastal Districts 57,534 no data 2,181,716 2,211,065 4,392,781 76 NA no data 3,212,023 3,400,804 6,612,827 115 NA 4.09% NA
Tanga Region 28,211 356,993 792,646 843,018 1,635,664 58 4.6 438,277 992,347 1,052,858 2,045,205 72 4.7 2.23% 0.18% Tanga Coastal Districts 6,543 no data 280,602 284,203 564,805 86 NA no data 316,393 333,490 649,883 99 NA 1.40% NA
Pangani 1,767 no data 22,094 21,825 43,919 25 NA no data 26,870 27,155 54,025 31 NA 2.07% NA Muheza (split in 2007?) 4,204 no data 138,965 139,368 278,333 66 NA no data 100,843 103,618 204,461 49 NA -3.08% NA Tanga 572 no data 119,543 123,010 242,553 424 NA no data 130,920 142,412 273,332 477 NA 1.19% NA Mkinga (2007) no data no data no data no data NA NA NA no data 57,760 60,305 118,065 NA NA 0.00% NA
Dar es Salaam Region 1,591 596,264 1,238,964 1,221,383 2,460,347 1,547 4.1 1,095,095 2,125,786 2,238,755 4,364,541 2,744 4.0 5.73% -0.35% Dar es Salaam Coastal Districts 1,591 no data 1,238,964 1,221,383 2,460,347 1,547 NA no data 2,125,786 2,238,755 4,364,541 2,744 NA 5.73% NA
Temeke 704 no data 383,783 379,030 762,813 1,084 NA no data 669,056 699,825 1,368,881 1,945 NA 5.85% NA Ilala 341 no data 317,700 313,358 631,058 1,853 NA no data 595,928 624,683 1,220,611 3,583 NA 6.60% NA Kinondoni 546 no data 537,481 528,995 1,066,476 1,952 NA no data 860,802 914,247 1,775,049 3,249 NA 5.09% NA
Pwani Region 31,995 200,919 430,015 440,261 870,276 27 4.3 257,511 537,826 560,842 1,098,668 34 4.3 2.33% -0.15% Pwani Coastal Districts 25,011 no data 317,017 328,083 645,100 26 NA no data 390,027 408,346 798,373 32 NA 2.13% NA
Rufiji 13,008 no data 95,402 101,720 197,122 15 NA no data 104,851 112,423 217,274 17 NA 0.97% NA Mafia 668 no data 20,428 19,971 40,399 61 NA no data 22,954 23,484 46,438 70 NA 1.39% NA Mkuranga 2,818 no data 91,385 95,513 186,898 66 NA no data 108,024 114,897 222,921 79 NA 1.76% NA Bagamoyo 8,517 no data 109,802 110,879 220,681 26 NA no data 154,198 157,542 311,740 37 NA 3.45% NA
Lindi Region 66,660 190,761 378,675 408,418 787,093 12 4.1 225,972 414,507 450,145 864,652 13 3.8 0.94% -0.75% Lindi Coastal Districts 20,240 no data 204,039 222,539 426,578 21 NA no data 220,833 242,895 463,728 23 NA 0.84% NA
Lindi Rural 6,333 no data 101,960 112,922 214,882 34 NA no data 91,647 102,496 194,143 31 NA -1.01% NA Lindi Urban 251 no data 19,874 21,014 40,888 163 NA no data 37,525 41,316 78,841 314 NA 6.57% NA Kilwa 13,656 no data 82,205 88,603 170,808 13 NA no data 91,661 99,083 190,744 14 NA 1.10% NA
Mtwara Region 17,896 293,908 530,522 591,623 1,122,145 63 3.8 344,834 599,648 671,206 1,270,854 71 3.7 1.24% -0.35% Mtwara Coastal Districts 4,150 no data 141,094 154,857 295,951 71 NA no data 158,984 177,318 336,302 81 NA 1.28% NA
Mtwara Rural 3,972 no data 96,459 107,684 204,143 51 NA no data 107,922 120,081 228,003 57 NA 1.11% NA Mtwara Urban 178 no data 44,635 47,173 91,808 517 NA no data 51,062 57,237 108,299 610 NA 1.65% NA
ZANZIBAR 2,507 184,949 467,962 488,107 956,069 381 5.2 253,608 630,677 672,892 1,303,569 520 5.1 3.10% -0.06%
Kaskazini Unguja Region 472 27,854 66,835 69,756 136,591 289 4.9 38,651 92,114 95,341 187,455 397 4.8 3.17% -0.11% Kaskazini A 238 no data 40,533 43,566 84,099 354 NA no data 51,566 54,214 105,780 445 NA 2.29% NA Kaskazini B 235 no data 26,302 26,190 52,492 224 NA no data 40,548 41,127 81,675 348 NA 4.42% NA
Mjini Magharibi Region 275 74,363 178,990 188,212 367,202 1,335 4.9 113,420 283,590 310,088 593,678 2,158 5.2 4.80% 0.58% Magharibi 260 no data 80,103 81,596 161,699 622 NA no data 176,979 193,666 370,645 1,426 NA 8.30% NA Mjini 15 no data 98,887 106,616 205,503 13,478 NA no data 106,611 116,422 223,033 14,628 NA 0.82% NA
Kusini Unguja Region 883 19,937 46,278 45,273 91,551 104 4.6 25,947 57,880 57,708 115,588 131 4.5 2.33% -0.30% Kati 510 no data 32,190 30,195 62,385 122 NA no data 38,538 37,808 76,346 150 NA 2.02% NA Kusini 372 no data 14,088 15,078 29,166 78 NA no data 19,342 19,900 39,242 105 NA 2.97% NA
Kaskazini Pemba Region 473 33,019 90,461 94,809 185,270 392 5.6 39,706 103,222 108,510 211,732 448 5.3 1.34% -0.51% Micheweni 219 no data 40,733 42,533 83,266 380 NA no data 50,874 52,942 103,816 474 NA 2.21% NA Wete 254 no data 49,728 52,276 102,004 402 NA no data 52,348 55,568 107,916 425 NA 0.56% NA
Kusini Pemba Region 405 29,776 85,398 90,057 175,455 434 5.9 35,884 93,871 101,245 195,116 482 5.4 1.06% -0.80% Mkoani 203 no data 45,175 47,282 92,457 457 NA no data 47,460 50,407 97,867 483 NA 0.57% NA Chakechake 202 no data 40,223 42,775 82,998 411 NA no data 46,411 50,838 97,249 481 NA 1.58% NA
Sources: 1: 2013 KBS, 2012 Population and Housing Census: Population distribution by administrative areas 2: Tanzania_Village_EA_2002_region.shp

56
Table 3: Population data for coastal regions and districts of mainland Tanzania and Zanzibar. Data include number urban and rural population, urbanisation, working age population, non-working age population and dependency ratios. Change in urbanisation and dependency ratio in past inter-census period (2002 - 2012). Considerable amount of data is missing in the table, which however should be available with the National Bureau of Statistics once the 2012 population data has been cleaned.
Area2 2002 Census 2012 Census Average Annual Change
Urban
Population Rural
Population Population
15-64 Population <15 & >64
Urbanisation Dependency Ratio
Urban Population
Rural Population
Population 15-64
Population <15 & >64
Urbanisation Dependency Ratio
Urbanisation Dependency Ratio
km² persons persons females persons % persons persons females persons % % % %
TANZANIA 895,753 no data no data 17,779,969 16,533,302 NA 0.93 no data no data no data no data NA NA NA NA
MAINLAND TANZANIA 893,246 no data no data 17,276,284 16,080,918 NA 0.93 no data no data no data no data NA NA NA NA
Mainland Tanzania Coastal Regions 146,353 no data no data 3,979,691 2,895,834 NA 0.73 no data no data no data no data NA NA NA NA
Mainland Tanzania Coastal Districts 57,534 no data no data 2,655,948 1,736,833 NA 0.65 12 no data no data no data NA NA NA NA
Tanga Region 28,211 no data no data 838,813 796,851 NA 0.95 no data no data no data no data NA NA NA NA Tanga Coastal Districts 6,543 no data no data 313,767 251,038 NA 0.80 no data no data no data no data NA NA NA NA
Pangani 1,767 no data no data 24,521 19,398 NA 0.79 no data no data no data no data NA NA NA NA Muheza (split in 2007?) 4,204 no data no data 146,691 131,642 NA 0.90 no data no data no data no data NA NA NA NA Tanga 572 no data no data 142,555 99,998 NA 0.70 no data no data no data no data NA NA NA NA Mkinga (2007) no data no data no data no data no data NA NA no data no data no data no data NA NA NA NA
Dar es Salaam Region 1,591 no data no data 1,599,490 860,857 NA 0.54 no data no data no data no data NA NA NA NA Dar es Salaam Coastal Districts 1,591 no data no data 1,599,490 860,857 NA 0.54 12 no data no data no data NA NA NA NA
Temeke 704 no data no data 480,556 282,257 NA 0.59 4 no data no data no data NA NA NA NA Ilala 341 no data no data 407,259 223,799 NA 0.55 3 no data no data no data NA NA NA NA Kinondoni 546 no data no data 711,675 354,801 NA 0.50 5 no data no data no data NA NA NA NA
Pwani Region 31,995 no data no data 464,716 405,560 NA 0.87 no data no data no data no data NA NA NA NA Pwani Coastal Districts 25,011 no data no data 337,224 307,876 NA 0.91 no data no data no data no data NA NA NA NA
Rufiji 13,008 no data no data 97,906 99,216 NA 1.01 no data no data no data no data NA NA NA NA Mafia 668 no data no data 22,833 17,566 NA 0.77 no data no data no data no data NA NA NA NA Mkuranga 2,818 no data no data 94,946 91,952 NA 0.97 no data no data no data no data NA NA NA NA Bagamoyo 8,517 no data no data 121,539 99,142 NA 0.82 no data no data no data no data NA NA NA NA
Lindi Region 66,660 no data no data 435,725 351,368 NA 0.81 no data no data no data no data NA NA NA NA Lindi Coastal Districts 20,240 no data no data 233,789 192,789 NA 0.82 no data no data no data no data NA NA NA NA
Lindi Rural 6,333 no data no data 122,696 92,186 NA 0.75 no data no data no data no data NA NA NA NA Lindi Urban 251 no data no data 25,064 15,824 NA 0.63 no data no data no data no data NA NA NA NA Kilwa 13,656 no data no data 86,029 84,779 NA 0.99 no data no data no data no data NA NA NA NA
Mtwara Region 17,896 no data no data 640,947 481,198 NA 0.75 no data no data no data no data NA NA NA NA Mtwara Coastal Districts 4,150 no data no data 171,678 124,273 NA 0.72 no data no data no data no data NA NA NA NA
Mtwara Rural 3,972 no data no data 114,306 89,837 NA 0.79 no data no data no data no data NA NA NA NA Mtwara Urban 178 no data no data 57,372 34,436 NA 0.60 no data no data no data no data NA NA NA NA
ZANZIBAR 2,507 no data no data 503,685 452,384 NA 0.90 no data no data no data no data NA NA NA NA
Kaskazini Unguja Region 472 no data no data 69,423 67,168 NA 0.97 no data no data no data no data NA NA NA NA Kaskazini A 238 no data no data 41,687 42,412 NA 1.02 no data no data no data no data NA NA NA NA Kaskazini B 235 no data no data 27,736 24,756 NA 0.89 no data no data no data no data NA NA NA NA
Mjini Magharibi Region 275 no data no data 211,253 155,949 NA 0.74 no data no data no data no data NA NA NA NA Magharibi 260 no data no data 88,789 72,910 NA 0.82 no data no data no data no data NA NA NA NA Mjini 15 no data no data 122,464 83,039 NA 0.68 no data no data no data no data NA NA NA NA
Kusini Unguja Region 883 no data no data 48,784 42,767 NA 0.88 no data no data no data no data NA NA NA NA Kati 510 no data no data 33,100 29,285 NA 0.88 no data no data no data no data NA NA NA NA Kusini 372 no data no data 15,684 13,482 NA 0.86 no data no data no data no data NA NA NA NA
Kaskazini Pemba Region 473 no data no data 88,974 96,296 NA 1.08 no data no data no data no data NA NA NA NA Micheweni 219 no data no data 39,089 44,177 NA 1.13 no data no data no data no data NA NA NA NA Wete 254 no data no data 49,885 52,119 NA 1.04 no data no data no data no data NA NA NA NA
Kusini Pemba Region 405 no data no data 85,251 90,204 NA 1.06 no data no data no data no data NA NA NA NA Mkoani 203 no data no data 44,683 47,774 NA 1.07 no data no data no data no data NA NA NA NA Chakechake 202 no data no data 40,568 42,430 NA 1.05 no data no data no data no data NA NA NA NA
Sources: 1: 2013 KBS, 2012 Population and Housing Census: Population distribution by administrative areas 2: Tanzania_Village_EA_2002_region.shp

57
Table 4: Inundation scenarios for coastal regions and districts of mainland Tanzania and Zanzibar in one meter steps of sea level rise up to five meter and at ten meter. Data include land lost in hectares and as percentage of administrative area. The higher sea level rise have been included to illustrate area impacted in situations with high surge and wave action during period of extreme weather, pending the development of a surge impact assessment model.
Area2 Coastline 1 m SLR 2 m SLR 3 m SLR 4 m SLR 5 m SLR 10 m SLR
km² km hectares % hectares % hectares % hectares % hectares % hectares %
TANZANIA 895,753 3,939 7,855 0.01 14,050 0.02 21,124 0.02 33,839 0.04 56,305 0.06 380,507 0.42
MAINLAND TANZANIA 893,208 2,887 3,396 0.00 7,481 0.01 12,035 0.01 20,931 0.02 39,174 0.04 329,052 0.37
Mainland Tanzania Coastal Regions 145,802 2,887 3,396 0.02 7,481 0.05 12,035 0.08 20,931 0.14 39,174 0.27 329,052 2.26
Mainland Tanzania Coastal Districts 57,615 2,887 3,396 0.06 7,481 0.13 12,035 0.21 20,931 0.36 39,174 0.68 329,052 5.71
Tanga Region 28,240 447 409 0.01 1,232 0.04 3,032 0.11 6,616 0.23 11,123 0.39 80,434 2.85 Tanga Coastal Districts 6,679 447 409 0.06 1,232 0.18 3,032 0.45 6,616 0.99 11,123 1.67 80,434 12.04
Pangani 1,800 182 67 0.04 264 0.15 697 0.39 1,269 0.71 2,250 1.25 48,593 27.00 Muheza (split in 2007?) 1,537 46 26 0.02 75 0.05 159 0.10 268 0.17 422 0.27 704 0.46 Tanga 624 67 151 0.24 491 0.79 1,306 2.09 2,786 4.46 4,218 6.76 8,625 13.82 Mkinga (2007) 2,718 151 165 0.06 402 0.15 870 0.32 2,293 0.84 4,233 1.56 22,512
Dar es Salaam Region 1,617 181 81 0.05 226 0.14 496 0.31 1,299 0.80 2,304 1.42 21,998 13.60 Dar es Salaam Coastal Districts 1,617 181 81 0.05 226 0.14 496 0.31 1,299 0.80 2,304 1.42 21,998 13.60
Temeke 739 122 61 0.08 157 0.21 332 0.45 821 1.11 1,436 1.94 14,920 20.18 Ilala 335 11 1 0.00 2 0.01 2 0.01 8 0.03 17 0.05 564 1.68 Kinondoni 542 49 20 0.04 68 0.13 162 0.30 470 0.87 851 1.57 6,514 12.01
Pwani Region 31,666 907 991 0.03 3,426 0.11 5,283 0.17 8,387 0.26 18,928 0.60 127,826 4.04 Pwani Coastal Districts 24,979 907 991 0.04 3,426 0.14 5,283 0.21 8,387 0.34 18,928 0.76 127,826 5.12
Rufiji 13,229 320 733 0.06 2,299 0.17 3,073 0.23 3,946 0.30 5,209 0.39 62,953 4.76 Mafia 477 238 64 0.13 286 0.60 656 1.38 1,091 2.29 1,843 3.87 10,972 23.02 Mkuranga 2,739 144 51 0.02 167 0.06 282 0.10 573 0.21 1,650 0.60 12,019 4.39 Bagamoyo 8,534 205 143 0.02 674 0.08 1,271 0.15 2,778 0.33 10,225 1.20 41,881 4.91
Lindi Region 66,610 1,027 1,070 0.02 1,441 0.02 1,856 0.03 2,806 0.04 4,260 0.06 62,663 0.94 Lindi Coastal Districts 20,401 1,027 1,070 0.05 1,441 0.07 1,856 0.09 2,806 0.14 4,260 0.21 62,663 3.07
Lindi Rural 6,483 246 111 0.02 268 0.04 425 0.07 659 0.10 1,148 0.18 11,880 1.83 Lindi Urban 239 68 incl above incl above incl above incl above incl above incl above incl above incl above incl above incl above incl above incl above Kilwa 13,679 713 959 0.07 1,173 0.09 1,431 0.10 2,147 0.16 3,112 0.23 50,783 3.71
Mtwara Region 17,669 325 844 0.05 1,155 0.07 1,368 0.08 1,822 0.10 2,560 0.14 36,130 2.04 Mtwara Coastal Districts 3,938 325 844 0.21 1,155 0.29 1,368 0.35 1,822 0.46 2,560 0.65 36,130 9.17
Mtwara Rural 3,745 282 844 0.23 1,155 0.31 1,368 0.37 1,822 0.49 2,560 0.68 36,130 9.65 Mtwara Urban 193 43 incl above incl above incl above incl above incl above incl above incl above incl above incl above incl above incl above incl above
ZANZIBAR 2,546 1,052 4,459 1.75 6,569 2.58 9,089 3.57 12,908 5.07 17,131 6.73 51,455 20.21
Unguja 1,534 366 594 0.39 1,456 0.95 2,432 1.59 3,836 2.50 5,207 3.39 21,780 14.20
Kaskazini Unguja Region 450 103 Kaskazini A 240 53 Kaskazini B 210 50
Mjini Magharibi Region 232 64 Magharibi 216 54 Mjini 15 10
Kusini Unguja Region 852 199 Kati 483 117 Kusini 370 82
Pemba 1,012 687 3,866 3.82 5,113 5.05 6,657 6.58 9,072 8.97 11,924 11.78 29,675 29.33
Kaskazini Pemba Region 552 346 Micheweni 205 132 Wete 347 214
Kusini Pemba Region 460 341 Mkoani 255 163 Chakechake 205 178
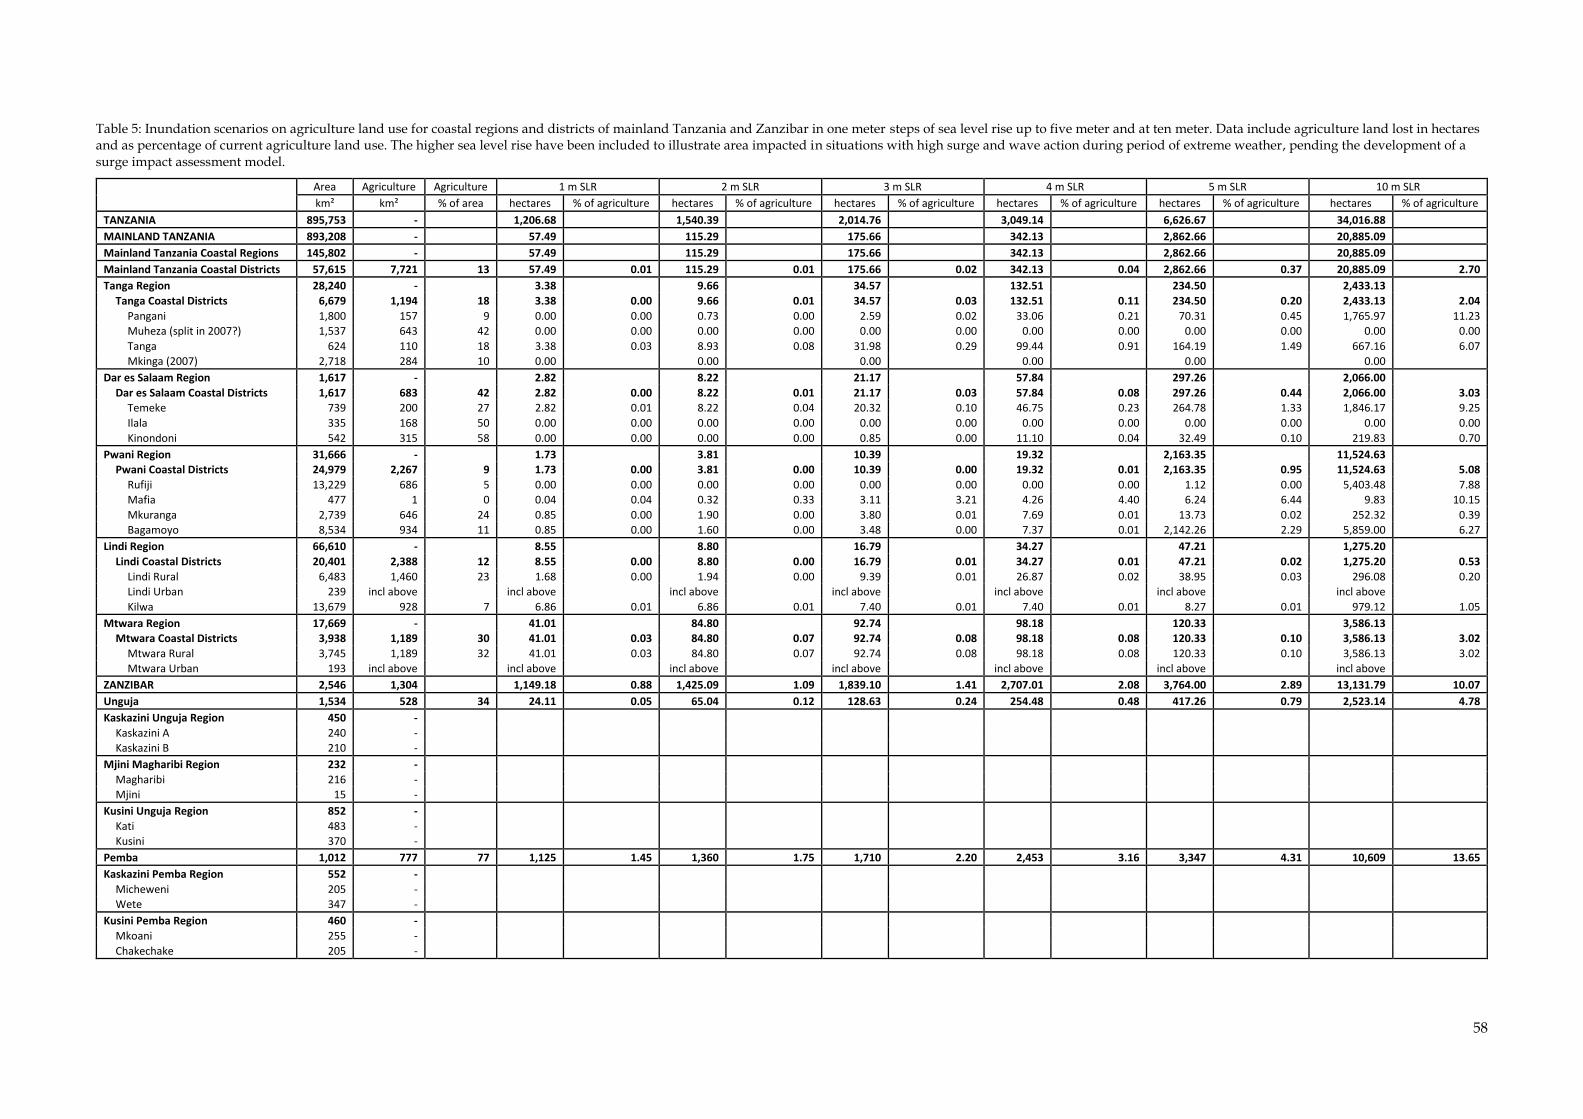
58
Table 5: Inundation scenarios on agriculture land use for coastal regions and districts of mainland Tanzania and Zanzibar in one meter steps of sea level rise up to five meter and at ten meter. Data include agriculture land lost in hectares and as percentage of current agriculture land use. The higher sea level rise have been included to illustrate area impacted in situations with high surge and wave action during period of extreme weather, pending the development of a surge impact assessment model.
Area Agriculture Agriculture 1 m SLR 2 m SLR 3 m SLR 4 m SLR 5 m SLR 10 m SLR
km² km² % of area hectares % of agriculture hectares % of agriculture hectares % of agriculture hectares % of agriculture hectares % of agriculture hectares % of agriculture
TANZANIA 895,753 - 1,206.68 1,540.39 2,014.76 3,049.14 6,626.67 34,016.88
MAINLAND TANZANIA 893,208 - 57.49 115.29 175.66 342.13 2,862.66 20,885.09
Mainland Tanzania Coastal Regions 145,802 - 57.49 115.29 175.66 342.13 2,862.66 20,885.09
Mainland Tanzania Coastal Districts 57,615 7,721 13 57.49 0.01 115.29 0.01 175.66 0.02 342.13 0.04 2,862.66 0.37 20,885.09 2.70
Tanga Region 28,240 - 3.38 9.66 34.57 132.51 234.50 2,433.13
Tanga Coastal Districts 6,679 1,194 18 3.38 0.00 9.66 0.01 34.57 0.03 132.51 0.11 234.50 0.20 2,433.13 2.04
Pangani 1,800 157 9 0.00 0.00 0.73 0.00 2.59 0.02 33.06 0.21 70.31 0.45 1,765.97 11.23
Muheza (split in 2007?) 1,537 643 42 0.00 0.00 0.00 0.00 0.00 0.00 0.00 0.00 0.00 0.00 0.00 0.00
Tanga 624 110 18 3.38 0.03 8.93 0.08 31.98 0.29 99.44 0.91 164.19 1.49 667.16 6.07
Mkinga (2007) 2,718 284 10 0.00 0.00 0.00 0.00 0.00 0.00
Dar es Salaam Region 1,617 - 2.82 8.22 21.17 57.84 297.26 2,066.00
Dar es Salaam Coastal Districts 1,617 683 42 2.82 0.00 8.22 0.01 21.17 0.03 57.84 0.08 297.26 0.44 2,066.00 3.03
Temeke 739 200 27 2.82 0.01 8.22 0.04 20.32 0.10 46.75 0.23 264.78 1.33 1,846.17 9.25
Ilala 335 168 50 0.00 0.00 0.00 0.00 0.00 0.00 0.00 0.00 0.00 0.00 0.00 0.00
Kinondoni 542 315 58 0.00 0.00 0.00 0.00 0.85 0.00 11.10 0.04 32.49 0.10 219.83 0.70
Pwani Region 31,666 - 1.73 3.81 10.39 19.32 2,163.35 11,524.63
Pwani Coastal Districts 24,979 2,267 9 1.73 0.00 3.81 0.00 10.39 0.00 19.32 0.01 2,163.35 0.95 11,524.63 5.08
Rufiji 13,229 686 5 0.00 0.00 0.00 0.00 0.00 0.00 0.00 0.00 1.12 0.00 5,403.48 7.88
Mafia 477 1 0 0.04 0.04 0.32 0.33 3.11 3.21 4.26 4.40 6.24 6.44 9.83 10.15
Mkuranga 2,739 646 24 0.85 0.00 1.90 0.00 3.80 0.01 7.69 0.01 13.73 0.02 252.32 0.39
Bagamoyo 8,534 934 11 0.85 0.00 1.60 0.00 3.48 0.00 7.37 0.01 2,142.26 2.29 5,859.00 6.27
Lindi Region 66,610 - 8.55 8.80 16.79 34.27 47.21 1,275.20
Lindi Coastal Districts 20,401 2,388 12 8.55 0.00 8.80 0.00 16.79 0.01 34.27 0.01 47.21 0.02 1,275.20 0.53
Lindi Rural 6,483 1,460 23 1.68 0.00 1.94 0.00 9.39 0.01 26.87 0.02 38.95 0.03 296.08 0.20
Lindi Urban 239 incl above incl above incl above incl above incl above incl above incl above
Kilwa 13,679 928 7 6.86 0.01 6.86 0.01 7.40 0.01 7.40 0.01 8.27 0.01 979.12 1.05
Mtwara Region 17,669 - 41.01 84.80 92.74 98.18 120.33 3,586.13
Mtwara Coastal Districts 3,938 1,189 30 41.01 0.03 84.80 0.07 92.74 0.08 98.18 0.08 120.33 0.10 3,586.13 3.02
Mtwara Rural 3,745 1,189 32 41.01 0.03 84.80 0.07 92.74 0.08 98.18 0.08 120.33 0.10 3,586.13 3.02
Mtwara Urban 193 incl above incl above incl above incl above incl above incl above incl above
ZANZIBAR 2,546 1,304 1,149.18 0.88 1,425.09 1.09 1,839.10 1.41 2,707.01 2.08 3,764.00 2.89 13,131.79 10.07
Unguja 1,534 528 34 24.11 0.05 65.04 0.12 128.63 0.24 254.48 0.48 417.26 0.79 2,523.14 4.78
Kaskazini Unguja Region 450 -
Kaskazini A 240 -
Kaskazini B 210 -
Mjini Magharibi Region 232 -
Magharibi 216 -
Mjini 15 -
Kusini Unguja Region 852 -
Kati 483 -
Kusini 370 -
Pemba 1,012 777 77 1,125 1.45 1,360 1.75 1,710 2.20 2,453 3.16 3,347 4.31 10,609 13.65
Kaskazini Pemba Region 552 -
Micheweni 205 -
Wete 347 -
Kusini Pemba Region 460 -
Mkoani 255 -
Chakechake 205 -

59
Table 6: Inundation scenarios on built up land use for coastal regions and districts of mainland Tanzania and Zanzibar in one meter steps of sea level rise up to five meter and at ten meter. Data include built up land lost in hectares and as percentage of current built up land use. The higher sea level rise have been included to illustrate area impacted in situations with high surge and wave action during period of extreme weather, pending the development of a surge impact assessment model.
Area2 Built up Built up 1 m SLR 2 m SLR 3 m SLR 4 m SLR 5 m SLR 10 m SLR
km² km² % of area hectares % of Built up hectares % of Built up hectares % of Built up hectares % of Built up hectares % of Built up hectares % of Built up
TANZANIA 895,753 - 11.46 36.85 102.36 281.51 392.98 2,272.73
MAINLAND TANZANIA 893,208 - 10.61 33.11 97.76 270.60 380.88 2,006.36
Mainland Tanzania Coastal Regions 145,802 - 10.61 33.11 97.76 270.60 380.88 2,006.36
Mainland Tanzania Coastal Districts 57,615 325 0.56 10.61 0.03 33.11 0.10 97.76 0.30 270.60 0.83 380.88 1.17 2,006.36 6.17
Tanga Region 28,240 - 7.17 11.38 12.21 13.84 14.98 58.98 Tanga Coastal Districts 6,679 15 0.23 7.17 0.47 11.38 0.74 12.21 0.80 13.84 0.90 14.98 0.98 58.98 3.85
Pangani 1,800 1 0.07 7.17 6.04 9.71 8.19 9.71 8.19 10.57 8.91 11.70 9.86 47.22 39.81 Muheza (split in 2007?) 1,537 2 0.11 0.00 0.00 0.00 0.00 0.00 0.00 0.00 0.00 0.00 0.00 0.00 0.00 Tanga 624 12 1.99 0.00 0.00 1.67 0.13 2.50 0.20 3.28 0.26 3.28 0.26 11.76 0.95 Mkinga (2007) 2,718 - 0.00 0.00 0.00 0.00 0.00 0.00
Dar es Salaam Region 1,617 - 2.59 19.20 81.46 251.17 353.18 1,684.84 Dar es Salaam Coastal Districts 1,617 234 14.47 2.59 0.01 19.20 0.08 81.46 0.35 251.17 1.07 353.18 1.51 1,684.84 7.20
Temeke 739 79 10.63 0.85 0.01 2.07 0.03 5.91 0.08 15.68 0.20 28.04 0.36 310.42 3.95 Ilala 335 62 18.37 0.74 0.01 1.43 0.02 1.43 0.02 3.77 0.06 9.18 0.15 180.56 2.93 Kinondoni 542 94 17.30 1.01 0.01 15.70 0.17 74.12 0.79 231.71 2.47 315.97 3.37 1,193.85 12.72
Pwani Region 31,666 - 0.00 0.00 0.00 0.66 2.96 20.83 Pwani Coastal Districts 24,979 22 0.09 0.00 0.00 0.00 0.00 0.00 0.00 0.66 0.03 2.96 0.13 20.83 0.94
Rufiji 13,229 10 0.08 0.00 0.00 0.00 0.00 0.00 0.00 0.00 0.00 0.00 0.00 0.00 0.00 Mafia 477 - 0.00 - 0.00 - 0.00 - 0.00 - 0.00 - 0.00 - Mkuranga 2,739 0 0.00 0.00 0.00 0.00 0.00 0.00 0.00 0.00 0.00 0.00 0.00 0.00 0.00 Bagamoyo 8,534 12 0.14 0.00 0.00 0.00 0.00 0.00 0.00 0.66 0.06 2.96 0.25 20.83 1.74
Lindi Region 66,610 - 0.84 0.84 0.84 0.84 1.68 144.14 Lindi Coastal Districts 20,401 14 0.07 0.84 0.06 0.84 0.06 0.84 0.06 0.84 0.06 1.68 0.12 144.14 9.97
Lindi Rural 6,483 14 0.22 0.00 0.00 0.00 0.00 0.00 0.00 0.00 0.00 0.84 0.06 69.92 4.84 Lindi Urban 239 incl above incl above incl above incl above incl above incl above incl above Kilwa 13,679 - 0.84 - 0.84 - 0.84 - 0.84 - 0.84 - 74.22 -
Mtwara Region 17,669 - 0.00 1.68 3.24 4.08 8.08 97.58 Mtwara Coastal Districts 3,938 40 1.00 0.00 0.00 1.68 0.04 3.24 0.08 4.08 0.10 8.08 0.20 97.58 2.47
Mtwara Rural 3,745 40 1.06 0.00 0.00 1.68 0.04 3.24 0.08 4.08 0.10 8.08 0.20 97.58 2.47 Mtwara Urban 193 incl above incl above incl above incl above incl above incl above incl above
ZANZIBAR 2,546 37 1.44 0.85 0.02 3.75 0.10 4.60 0.13 10.91 0.30 12.10 0.33 266.37 7.26
Unguja 1,534 34 2.19 0.00 0.00 0.00 0.00 0.00 0.00 3.81 0.11 4.68 0.14 250.84 7.47
Kaskazini Unguja Region 450 - Kaskazini A 240 - Kaskazini B 210 -
Mjini Magharibi Region 232 - Magharibi 216 - Mjini 15 -
Kusini Unguja Region 852 - Kati 483 - Kusini 370 -
Pemba 1,012 3 0.31 1 0.27 4 1.20 5 1.47 7 2.27 7 2.38 16 4.97
Kaskazini Pemba Region 552 - Micheweni 205 - Wete 347 -
Kusini Pemba Region 460 - Mkoani 255 - Chakechake 205 -

60
Table 7: Inundation scenarios on bush land use for coastal regions and districts of mainland Tanzania and Zanzibar in one meter steps of sea level rise up to five meter and at ten meter. Data include bush land lost in hectares and as percentage of current bush land. The higher sea level rise have been included to illustrate area impacted in situations with high surge and wave action during period of extreme weather, pending the development of a surge impact assessment model.
Area2 Bush land Bush land 1 m SLR 2 m SLR 3 m SLR 4 m SLR 5 m SLR 10 m SLR
km² km² % of Area hectares % of Bush land hectares % of Bush land hectares % of Bush land hectares % of Bush land hectares % of Bush land hectares % of Bush land
TANZANIA 895,753 - 1,015.62 1,259.36 1,791.08 2,911.73 4,922.39 39,819.52
MAINLAND TANZANIA 893,208 - 136.99 311.55 746.80 1,726.41 3,489.50 35,985.86
Mainland Tanzania Coastal Regions 145,802 - 136.99 311.55 746.80 1,726.41 3,489.50 35,985.86
Mainland Tanzania Coastal Districts 57,615 11,863 20.59 136.99 0.01 311.55 0.03 746.80 0.06 1,726.41 0.15 3,489.50 0.29 35,985.86 3.03
Tanga Region 28,240 - 47.01 145.25 460.26 1,260.16 2,453.22 11,080.58 Tanga Coastal Districts 6,679 2,064 30.90 47.01 0.02 145.25 0.07 460.26 0.22 1,260.16 0.61 2,453.22 1.19 11,080.58 5.37
Pangani 1,800 722 40.10 7.09 0.01 22.70 0.03 74.93 0.10 196.76 0.27 561.20 0.78 5,242.11 7.26 Muheza (split in 2007?) 1,537 396 25.77 9.14 0.02 25.04 0.06 54.01 0.14 103.15 0.26 134.04 0.34 227.69 0.57 Tanga 624 316 50.59 0.85 0.00 9.43 0.03 118.25 0.37 304.75 0.97 536.28 1.70 2,236.62 7.08 Mkinga (2007) 2,718 630 23.18 29.92 88.09 213.07 655.50 1,221.70 3,374.15
Dar es Salaam Region 1,617 - 2.92 11.66 17.02 20.42 26.20 525.72 Dar es Salaam Coastal Districts 1,617 104 6.42 2.92 0.03 11.66 0.11 17.02 0.16 20.42 0.20 26.20 0.25 525.72 5.06
Temeke 739 12 1.65 2.13 0.18 3.38 0.28 3.69 0.30 5.32 0.44 5.57 0.46 364.99 30.00 Ilala 335 81 24.25 0.00 0.00 0.00 0.00 0.00 0.00 0.00 0.00 0.00 0.00 0.00 0.00 Kinondoni 542 10 1.90 0.79 0.08 8.29 0.80 13.33 1.29 15.10 1.46 20.62 2.00 160.73 15.59
Pwani Region 31,666 - 3.48 27.05 78.77 170.57 533.39 8,042.62 Pwani Coastal Districts 24,979 3,889 15.57 3.48 0.00 27.05 0.01 78.77 0.02 170.57 0.04 533.39 0.14 8,042.62 2.07
Rufiji 13,229 1,605 12.13 0.21 0.00 9.36 0.01 21.23 0.01 25.74 0.02 29.92 0.02 2,829.80 1.76 Mafia 477 3 0.61 0.58 0.20 6.75 2.32 18.33 6.31 25.39 8.73 35.55 12.23 105.25 36.21 Mkuranga 2,739 210 7.66 0.00 0.00 0.00 0.00 0.00 0.00 0.00 0.00 0.00 0.00 0.00 0.00 Bagamoyo 8,534 2,072 24.28 2.69 0.00 10.94 0.01 39.21 0.02 119.43 0.06 467.92 0.23 5,107.56 2.47
Lindi Region 66,610 - 79.26 113.69 158.10 195.44 290.03 7,401.58 Lindi Coastal Districts 20,401 4,472 21.92 79.26 0.02 113.69 0.03 158.10 0.04 195.44 0.04 290.03 0.06 7,401.58 1.65
Lindi Rural 6,483 2,583 39.83 20.53 0.01 52.46 0.02 92.85 0.04 122.05 0.05 187.90 0.07 3,005.73 1.16 Lindi Urban 239 incl above incl above incl above incl above incl above incl above incl above Kilwa 13,679 1,890 13.81 58.73 0.03 61.23 0.03 65.25 0.03 73.39 0.04 102.13 0.05 4,395.85 2.33
Mtwara Region 17,669 - 4.32 13.90 32.64 79.82 186.67 8,935.36 Mtwara Coastal Districts 3,938 1,334 33.87 4.32 0.00 13.90 0.01 32.64 0.02 79.82 0.06 186.67 0.14 8,935.36 6.70
Mtwara Rural 3,745 1,334 35.62 4.32 0.00 13.90 0.01 32.64 0.02 79.82 0.06 186.67 0.14 8,935.36 6.70 Mtwara Urban 193 incl above incl above incl above incl above incl above incl above incl above
ZANZIBAR 2,546 112 4.42 878.63 7.81 947.81 8.43 1,044.28 9.29 1,185.32 10.54 1,432.89 12.74 3,833.66 34.10
Unguja 1,534 57 3.69 8.17 0.14 25.22 0.45 58.86 1.04 83.27 1.47 107.51 1.90 496.58 8.78
Kaskazini Unguja Region 450 - Kaskazini A 240 - Kaskazini B 210 -
Mjini Magharibi Region 232 - Magharibi 216 - Mjini 15 -
Kusini Unguja Region 852 - Kati 483 - Kusini 370 -
Pemba 1,012 56 5.52 870 15.58 923 16.51 985 17.64 1,102 19.73 1,325 23.72 3,337 59.73
Kaskazini Pemba Region 552 - Micheweni 205 - Wete 347 -
Kusini Pemba Region 460 - Mkoani 255 - Chakechake 205 -

61
Table 8: Inundation scenarios on grassland use for coastal regions and districts of mainland Tanzania and Zanzibar in one meter steps of sea level rise up to five meter and at ten meter. Data include grassland lost in hectares and as percentage of current grassland. The higher sea level rise have been included to illustrate area impacted in situations with high surge and wave action during period of extreme weather, pending the development of a surge impact assessment model.
Area2 Grassland Grassland 1 m SLR 2 m SLR 3 m SLR 4 m SLR 5 m SLR 10 m SLR
km² km² % of Area hectares % hectares % hectares % hectares % hectares % hectares %
TANZANIA 895,753 15.57 60.21 170.57 676.00 2,324.55 43,567.60
MAINLAND TANZANIA 893,208 10.52 40.42 140.01 618.06 2,224.91 42,615.07
Mainland Tanzania Coastal Regions 145,802 10.52 40.42 140.01 618.06 2,224.91 42,615.07
Mainland Tanzania Coastal Districts 57,615 5,882 10.21 10.52 0.00 40.42 0.01 140.01 0.02 618.06 0.11 2,224.91 0.38 42,615.07 7.25
Tanga Region 28,240 - 0.00 0.00 0.00 0.00 0.00 860.17 Tanga Coastal Districts 6,679 293 4.39 0.00 0.00 0.00 0.00 0.00 0.00 0.00 0.00 0.00 0.00 860.17 2.93
Pangani 1,800 270 15.02 0.00 0.00 0.00 0.00 0.00 0.00 0.00 0.00 0.00 0.00 860.17 3.18 Muheza (split in 2007?) 1,537 13 0.81 0.00 0.00 0.00 0.00 0.00 0.00 0.00 0.00 0.00 0.00 0.00 0.00 Tanga 624 - 0.00 0.00 0.00 0.00 0.00 0.00 Mkinga (2007) 2,718 10 0.38 0.00 0.00 0.00 0.00 0.00 0.00
Dar es Salaam Region 1,617 - 0.18 5.09 20.87 270.29 554.85 3,822.17 Dar es Salaam Coastal Districts 1,617 392 24.22 0.18 0.00 5.09 0.01 20.87 0.05 270.29 0.69 554.85 1.42 3,822.17 9.76
Temeke 739 349 47.26 0.00 0.00 0.85 0.00 8.19 0.02 168.60 0.48 272.44 0.78 2,340.27 6.70 Ilala 335 8 2.47 0.11 0.01 0.27 0.03 0.27 0.03 0.27 0.03 1.10 0.13 197.03 23.80 Kinondoni 542 34 6.27 0.07 0.00 3.97 0.12 12.41 0.36 101.42 2.98 281.31 8.27 1,284.87 37.79
Pwani Region 31,666 - 6.60 24.84 90.75 281.02 1,538.66 30,772.81 Pwani Coastal Districts 24,979 3,769 15.09 6.60 0.00 24.84 0.01 90.75 0.02 281.02 0.07 1,538.66 0.41 30,772.81 8.17
Rufiji 13,229 2,379 17.98 0.00 0.00 0.00 0.00 29.37 0.01 49.87 0.02 82.12 0.03 21,514.58 9.04 Mafia 477 2 0.45 0.00 0.00 0.76 0.35 1.16 0.55 1.80 0.84 3.28 1.54 25.71 12.06 Mkuranga 2,739 464 16.96 0.00 0.00 0.00 0.00 1.64 0.00 7.86 0.02 22.67 0.05 1,399.91 3.01 Bagamoyo 8,534 923 10.82 6.60 0.01 24.08 0.03 58.57 0.06 221.49 0.24 1,430.58 1.55 7,832.60 8.48
Lindi Region 66,610 - 3.75 10.49 28.38 65.48 130.14 3,289.94 Lindi Coastal Districts 20,401 1,339 6.56 3.75 0.00 10.49 0.01 28.38 0.02 65.48 0.05 130.14 0.10 3,289.94 2.46
Lindi Rural 6,483 475 7.33 1.05 0.00 2.73 0.01 7.72 0.02 14.61 0.03 56.60 0.12 1,181.63 2.49 Lindi Urban 239 incl above incl above incl above incl above incl above incl above incl above Kilwa 13,679 864 6.31 2.70 0.00 7.75 0.01 20.66 0.02 50.88 0.06 73.55 0.09 2,108.31 2.44
Mtwara Region 17,669 - 0.00 0.00 0.00 1.26 1.26 3,869.98 Mtwara Coastal Districts 3,938 89 2.27 0.00 0.00 0.00 0.00 0.00 0.00 1.26 0.01 1.26 0.01 3,869.98 43.26
Mtwara Rural 3,745 89 2.39 0.00 0.00 0.00 0.00 0.00 0.00 1.26 0.01 1.26 0.01 3,869.98 43.26 Mtwara Urban 193 incl above 0.00 0.00 0.00 incl above incl above incl above
ZANZIBAR 2,546 113 4.43 5.04 0.04 19.79 0.18 30.56 0.27 57.94 0.51 99.64 0.88 952.54 8.45
Unguja 1,534 105 6.85 0.65 0.01 1.51 0.01 3.28 0.03 4.92 0.05 8.45 0.08 608.66 5.79
Kaskazini Unguja Region 450 - Kaskazini A 240 - Kaskazini B 210 -
Mjini Magharibi Region 232 - Magharibi 216 - Mjini 15 -
Kusini Unguja Region 852 - Kati 483 - Kusini 370 -
Pemba 1,012 8 0.75 4 0.58 18 2.40 27 3.58 53 6.96 91 11.96 344 45.11
Kaskazini Pemba Region 552 - Micheweni 205 - Wete 347 -
Kusini Pemba Region 460 - Mkoani 255 - Chakechake 205 -

62
Table 9: Inundation scenarios on natural forests for coastal regions and districts of mainland Tanzania and Zanzibar in one meter steps of sea level rise up to five meter and at ten meter. Data include natural forest lost in hectares and as percentage of current natural forest. The higher sea level rise have been included to illustrate area impacted in situations with high surge and wave action during period of extreme weather, pending the development of a surge impact assessment model.
Area2 Natural Forest Natural Forest 1 m SLR 2 m SLR 3 m SLR 4 m SLR 5 m SLR 10 m SLR
km² km² % of Area hectares % hectares % hectares % hectares % hectares % hectares %
TANZANIA 895,753 - 286.57 406.96 575.87 747.40 965.96 5,207.33
MAINLAND TANZANIA 893,208 - 60.46 97.37 138.97 201.32 313.62 3,613.19
Mainland Tanzania Coastal Regions 145,802 - 60.46 97.37 138.97 201.32 313.62 3,613.19
Mainland Tanzania Coastal Districts 57,615 5,511 9.57 60.46 0.01 97.37 0.02 138.97 0.03 201.32 0.04 313.62 0.06 3,613.19 0.66
Tanga Region 28,240 - 59.29 93.96 129.42 182.61 267.64 2,939.58 Tanga Coastal Districts 6,679 530 7.94 59.29 0.11 93.96 0.18 129.42 0.24 182.61 0.34 267.64 0.50 2,939.58 5.54
Pangani 1,800 - 0.00 - 0.00 - 0.00 - 0.00 - 0.19 - 18.29 - Muheza (split in 2007?) 1,537 300 19.52 0.00 0.00 0.00 0.00 0.00 0.00 0.00 0.00 0.00 0.00 0.00 0.00 Tanga 624 2 0.37 0.27 0.12 0.27 0.12 3.78 1.64 12.52 5.41 24.28 10.50 124.86 53.98 Mkinga (2007) 2,718 228 8.39 59.02 93.69 125.64 170.09 243.16 2,796.43
Dar es Salaam Region 1,617 - 0.00 0.00 0.00 0.00 0.00 0.00 Dar es Salaam Coastal Districts 1,617 26 1.61 0.00 0.00 0.00 0.00 0.00 0.00 0.00 0.00 0.00 0.00 0.00 0.00
Temeke 739 - 0.00 - 0.00 - 0.00 - 0.00 - 0.00 - 0.00 - Ilala 335 6 1.77 0.00 0.00 0.00 0.00 0.00 0.00 0.00 0.00 0.00 0.00 0.00 0.00 Kinondoni 542 20 3.70 0.00 0.00 0.00 0.00 0.00 0.00 0.00 0.00 0.00 0.00 0.00 0.00
Pwani Region 31,666 - 1.17 3.42 9.55 18.71 45.77 627.00 Pwani Coastal Districts 24,979 3,305 13.23 1.17 0.00 3.42 0.00 9.55 0.00 18.71 0.01 45.77 0.01 627.00 0.19
Rufiji 13,229 1,986 15.01 0.00 0.00 0.00 0.00 0.00 0.00 0.00 0.00 0.00 0.00 33.26 0.02 Mafia 477 9 1.92 0.66 0.07 1.79 0.20 4.55 0.50 7.67 0.84 8.90 0.97 26.46 2.90 Mkuranga 2,739 186 6.78 0.00 0.00 0.00 0.00 0.00 0.00 0.00 0.00 0.00 0.00 0.00 0.00 Bagamoyo 8,534 1,125 13.18 0.51 0.00 1.62 0.00 4.99 0.00 11.04 0.01 36.87 0.03 567.28 0.50
Lindi Region 66,610 - 0.00 0.00 0.00 0.00 0.21 46.61 Lindi Coastal Districts 20,401 1,649 8.08 0.00 0.00 0.00 0.00 0.00 0.00 0.00 0.00 0.21 0.00 46.61 0.03
Lindi Rural 6,483 308 4.75 0.00 0.00 0.00 0.00 0.00 0.00 0.00 0.00 0.00 0.00 0.00 0.00 Lindi Urban 239 incl above 0.00 0.00 0.00 0.00 0.00 0.00 Kilwa 13,679 1,342 9.81 0.00 0.00 0.00 0.00 0.00 0.00 0.00 0.00 0.21 0.00 46.61 0.03
Mtwara Region 17,669 - 0.00 - 0.00 - 0.00 - 0.00 - 0.00 - 0.00 - Mtwara Coastal Districts 3,938 - 0.00 - 0.00 - 0.00 - 0.00 - 0.00 - 0.00 -
Mtwara Rural 3,745 - 0.00 - 0.00 - 0.00 - 0.00 - 0.00 - 0.00 - Mtwara Urban 193 - 0.00 0.00 0.00 0.00 0.00 0.00
ZANZIBAR 2,546 64 2.53 226.12 3.52 309.59 4.81 436.90 6.79 546.08 8.49 652.34 10.14 1,594.14 24.78
Unguja 1,534 42 2.77 19.32 0.46 40.60 0.96 78.64 1.85 105.82 2.49 142.74 3.36 833.18 19.64
Kaskazini Unguja Region 450 - Kaskazini A 240 - Kaskazini B 210 -
Mjini Magharibi Region 232 - Magharibi 216 - Mjini 15 -
Kusini Unguja Region 852 - Kati 483 - Kusini 370 -
Pemba 1,012 22 2.16 207 9.44 269 12.29 358 16.36 440 20.11 510 23.27 761 34.75
Kaskazini Pemba Region 552 - Micheweni 205 - Wete 347 -
Kusini Pemba Region 460 - Mkoani 255 - Chakechake 205 -

63
Table 10: Inundation scenarios on woodlands for coastal regions and districts of mainland Tanzania and Zanzibar in one meter steps of sea level rise up to five meter and at ten meter. Data include woodland lost in hectares and as percentage of current woodland. The higher sea level rise have been included to illustrate area impacted in situations with high surge and wave action during period of extreme weather, pending the development of a surge impact assessment model.
Area2 Woodland Woodland 1 m SLR 2 m SLR 3 m SLR 4 m SLR 5 m SLR 10 m SLR
km² km² % of Area hectares % hectares % hectares % hectares % hectares % hectares %
TANZANIA 895,753 - 37.92 98.62 237.39 404.96 726.77 23,179.01
MAINLAND TANZANIA 893,208 - 12.15 35.78 118.20 194.01 315.27 12,861.01
Mainland Tanzania Coastal Regions 145,802 - 12.15 35.78 118.20 194.01 315.27 12,861.01
Mainland Tanzania Coastal Districts 57,615 23,562 40.90 12.15 0.00 35.78 0.00 118.20 0.01 194.01 0.01 315.27 0.01 12,861.01 0.55
Tanga Region 28,240 - 7.30 26.85 102.14 149.11 215.63 5,029.40 Tanga Coastal Districts 6,679 2,259 33.82 7.30 0.00 26.85 0.01 102.14 0.05 149.11 0.07 215.63 0.10 5,029.40 2.23
Pangani 1,800 536 29.78 5.70 0.01 19.02 0.04 78.96 0.15 93.93 0.18 126.01 0.24 4,861.67 9.07 Muheza (split in 2007?) 1,537 168 10.92 0.00 0.00 0.00 0.00 0.00 0.00 0.00 0.00 0.00 0.00 0.00 0.00 Tanga 624 133 21.27 0.00 0.00 1.74 0.01 11.94 0.09 30.23 0.23 53.15 0.40 86.86 0.65 Mkinga (2007) 2,718 1,422 52.33 1.60 6.09 11.24 24.95 36.46 80.87
Dar es Salaam Region 1,617 - 0.00 0.00 0.42 1.83 2.11 112.54 Dar es Salaam Coastal Districts 1,617 120 7.41 0.00 0.00 0.00 0.00 0.42 0.00 1.83 0.02 2.11 0.02 112.54 0.94
Temeke 739 41 5.60 0.00 0.00 0.00 0.00 0.42 0.01 1.83 0.04 2.11 0.05 112.54 2.72 Ilala 335 10 3.03 0.00 0.00 0.00 0.00 0.00 0.00 0.00 0.00 0.00 0.00 0.00 0.00 Kinondoni 542 68 12.58 0.00 0.00 0.00 0.00 0.00 0.00 0.00 0.00 0.00 0.00 0.00 0.00
Pwani Region 31,666 - 1.16 3.30 8.22 16.09 37.60 4,983.56 Pwani Coastal Districts 24,979 10,049 40.23 1.16 0.00 3.30 0.00 8.22 0.00 16.09 0.00 37.60 0.00 4,983.56 0.50
Rufiji 13,229 5,553 41.97 0.00 0.00 0.00 0.00 0.00 0.00 0.00 0.00 0.00 0.00 609.70 0.11 Mafia 477 5 1.13 1.16 0.21 3.30 0.61 8.22 1.53 12.56 2.33 20.21 3.76 51.15 9.51 Mkuranga 2,739 1,153 42.11 0.00 0.00 0.00 0.00 0.00 0.00 3.10 0.00 5.63 0.00 830.30 0.72 Bagamoyo 8,534 3,338 39.11 0.00 0.00 0.00 0.00 0.00 0.00 0.44 0.00 11.77 0.00 3,492.40 1.05
Lindi Region 66,610 - 3.68 3.93 5.73 17.28 37.25 2,163.75 Lindi Coastal Districts 20,401 9,956 48.80 3.68 0.00 3.93 0.00 5.73 0.00 17.28 0.00 37.25 0.00 2,163.75 0.22
Lindi Rural 6,483 1,800 27.76 0.85 0.00 0.85 0.00 1.75 0.00 9.01 0.01 16.93 0.01 809.16 0.45 Lindi Urban 239 incl above incl above incl above incl above incl above incl above incl above Kilwa 13,679 8,156 59.63 2.83 0.00 3.08 0.00 3.98 0.00 8.27 0.00 20.32 0.00 1,354.59 0.17
Mtwara Region 17,669 - 0.02 1.70 1.70 9.70 22.68 571.77 Mtwara Coastal Districts 3,938 1,178 29.91 0.02 0.00 1.70 0.00 1.70 0.00 9.70 0.01 22.68 0.02 571.77 0.49
Mtwara Rural 3,745 1,178 31.45 0.02 0.00 1.70 0.00 1.70 0.00 9.70 0.01 22.68 0.02 571.77 0.49 Mtwara Urban 193 incl above incl above incl above incl above incl above incl above incl above
ZANZIBAR 2,546 805 31.61 25.76 0.03 62.85 0.08 119.19 0.15 210.95 0.26 411.50 0.51 10,318.00 12.82
Unguja 1,534 756 49.28 5.65 0.01 17.30 0.02 40.04 0.05 83.25 0.11 172.60 0.23 7,772.68 10.28
Kaskazini Unguja Region 450 - Kaskazini A 240 - Kaskazini B 210 -
Mjini Magharibi Region 232 - Magharibi 216 - Mjini 15 -
Kusini Unguja Region 852 - Kati 483 - Kusini 370 -
Pemba 1,012 49 4.85 20 0.41 46 0.93 79 1.61 128 2.60 239 4.87 2,545 51.91
Kaskazini Pemba Region 552 - Micheweni 205 - Wete 347 -
Kusini Pemba Region 460 - Mkoani 255 - Chakechake 205 -
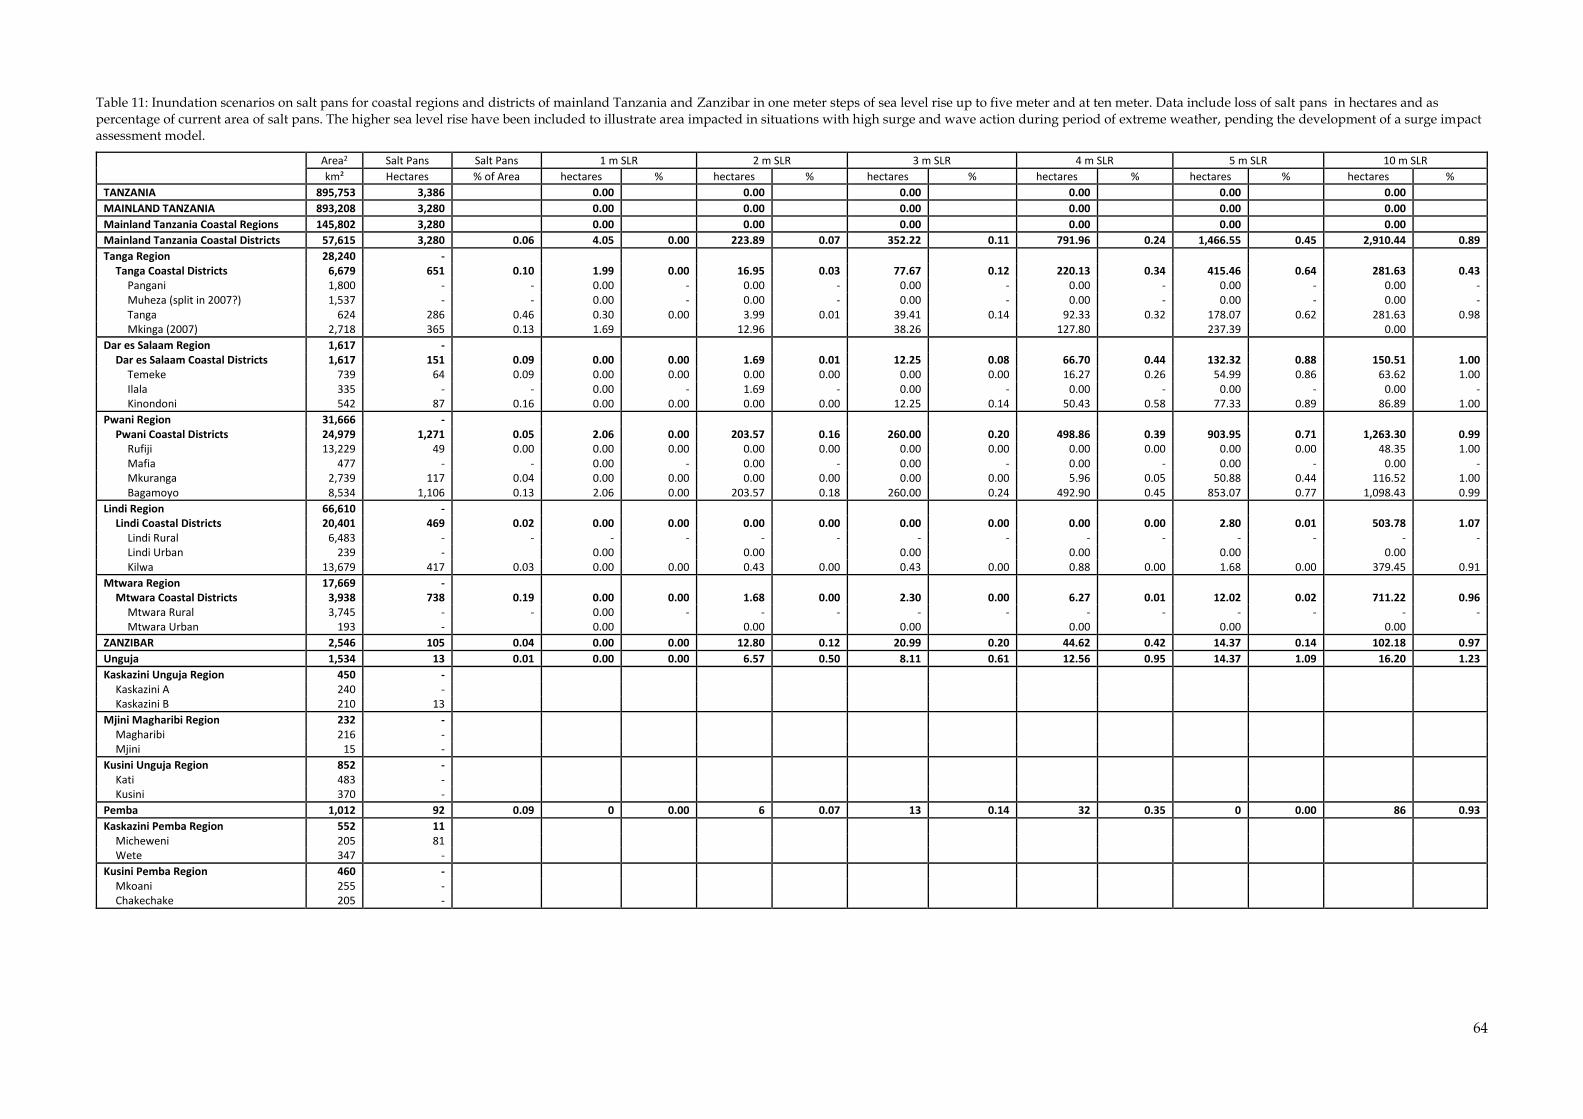
64
Table 11: Inundation scenarios on salt pans for coastal regions and districts of mainland Tanzania and Zanzibar in one meter steps of sea level rise up to five meter and at ten meter. Data include loss of salt pans in hectares and as percentage of current area of salt pans. The higher sea level rise have been included to illustrate area impacted in situations with high surge and wave action during period of extreme weather, pending the development of a surge impact assessment model.
Area2 Salt Pans Salt Pans 1 m SLR 2 m SLR 3 m SLR 4 m SLR 5 m SLR 10 m SLR
km² Hectares % of Area hectares % hectares % hectares % hectares % hectares % hectares %
TANZANIA 895,753 3,386 0.00 0.00 0.00 0.00 0.00 0.00
MAINLAND TANZANIA 893,208 3,280 0.00 0.00 0.00 0.00 0.00 0.00
Mainland Tanzania Coastal Regions 145,802 3,280 0.00 0.00 0.00 0.00 0.00 0.00
Mainland Tanzania Coastal Districts 57,615 3,280 0.06 4.05 0.00 223.89 0.07 352.22 0.11 791.96 0.24 1,466.55 0.45 2,910.44 0.89
Tanga Region 28,240 - Tanga Coastal Districts 6,679 651 0.10 1.99 0.00 16.95 0.03 77.67 0.12 220.13 0.34 415.46 0.64 281.63 0.43
Pangani 1,800 - - 0.00 - 0.00 - 0.00 - 0.00 - 0.00 - 0.00 - Muheza (split in 2007?) 1,537 - - 0.00 - 0.00 - 0.00 - 0.00 - 0.00 - 0.00 - Tanga 624 286 0.46 0.30 0.00 3.99 0.01 39.41 0.14 92.33 0.32 178.07 0.62 281.63 0.98 Mkinga (2007) 2,718 365 0.13 1.69 12.96 38.26 127.80 237.39 0.00
Dar es Salaam Region 1,617 - Dar es Salaam Coastal Districts 1,617 151 0.09 0.00 0.00 1.69 0.01 12.25 0.08 66.70 0.44 132.32 0.88 150.51 1.00
Temeke 739 64 0.09 0.00 0.00 0.00 0.00 0.00 0.00 16.27 0.26 54.99 0.86 63.62 1.00 Ilala 335 - - 0.00 - 1.69 - 0.00 - 0.00 - 0.00 - 0.00 - Kinondoni 542 87 0.16 0.00 0.00 0.00 0.00 12.25 0.14 50.43 0.58 77.33 0.89 86.89 1.00
Pwani Region 31,666 - Pwani Coastal Districts 24,979 1,271 0.05 2.06 0.00 203.57 0.16 260.00 0.20 498.86 0.39 903.95 0.71 1,263.30 0.99
Rufiji 13,229 49 0.00 0.00 0.00 0.00 0.00 0.00 0.00 0.00 0.00 0.00 0.00 48.35 1.00 Mafia 477 - - 0.00 - 0.00 - 0.00 - 0.00 - 0.00 - 0.00 - Mkuranga 2,739 117 0.04 0.00 0.00 0.00 0.00 0.00 0.00 5.96 0.05 50.88 0.44 116.52 1.00 Bagamoyo 8,534 1,106 0.13 2.06 0.00 203.57 0.18 260.00 0.24 492.90 0.45 853.07 0.77 1,098.43 0.99
Lindi Region 66,610 - Lindi Coastal Districts 20,401 469 0.02 0.00 0.00 0.00 0.00 0.00 0.00 0.00 0.00 2.80 0.01 503.78 1.07
Lindi Rural 6,483 - - - - - - - - - - - - - - Lindi Urban 239 - 0.00 0.00 0.00 0.00 0.00 0.00 Kilwa 13,679 417 0.03 0.00 0.00 0.43 0.00 0.43 0.00 0.88 0.00 1.68 0.00 379.45 0.91
Mtwara Region 17,669 - Mtwara Coastal Districts 3,938 738 0.19 0.00 0.00 1.68 0.00 2.30 0.00 6.27 0.01 12.02 0.02 711.22 0.96
Mtwara Rural 3,745 - - 0.00 - - - - - - - - - - - Mtwara Urban 193 - 0.00 0.00 0.00 0.00 0.00 0.00
ZANZIBAR 2,546 105 0.04 0.00 0.00 12.80 0.12 20.99 0.20 44.62 0.42 14.37 0.14 102.18 0.97
Unguja 1,534 13 0.01 0.00 0.00 6.57 0.50 8.11 0.61 12.56 0.95 14.37 1.09 16.20 1.23
Kaskazini Unguja Region 450 - Kaskazini A 240 - Kaskazini B 210 13
Mjini Magharibi Region 232 - Magharibi 216 - Mjini 15 -
Kusini Unguja Region 852 - Kati 483 - Kusini 370 -
Pemba 1,012 92 0.09 0 0.00 6 0.07 13 0.14 32 0.35 0 0.00 86 0.93
Kaskazini Pemba Region 552 11 Micheweni 205 81 Wete 347 -
Kusini Pemba Region 460 - Mkoani 255 - Chakechake 205 -