Embed Size (px)
Citation preview
Investment Strategy Summits, Prioritization 3.0 & Mobility Fund Prioritization
NCDOT Strategic Planning Office
May 3, 2012 – NC AMPO Conference
Prioritization 2.0 (P2.0) Investment Strategy Summits
Prioritization 3.0 (P3.0)
Mobility Fund
Outline
Prioritization 2.0Investment Strategy Summits
1. Score
Prioritize Projects using
• Data
• Local Input
• Multimodal Characteristics
2. Strategize
Set Investment Strategy
• Classify ranked Projects into Buckets (Mode, Goal, Tier)
• Conduct Scenario/Trade-off Analysis with DOT & Partners
• Constrained only by Total Available Revenue
3. Schedule
Program Projects
• Develop STIP using Project Rankings & Investment Strategy
• Apply Constraints
• Compare Selected Strategy vs. Applied Constraints
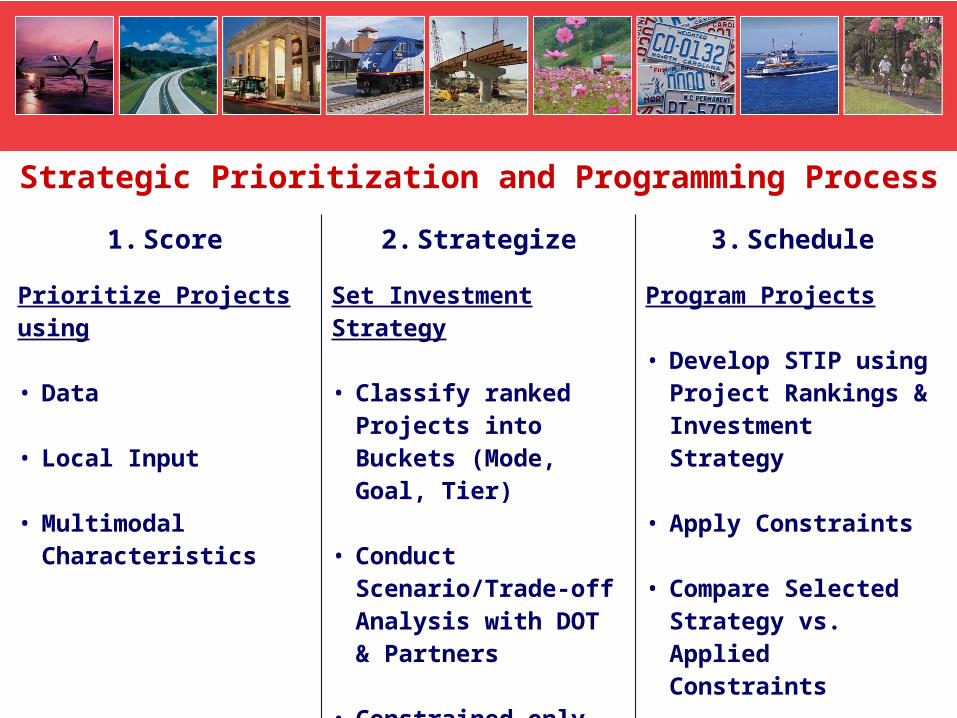
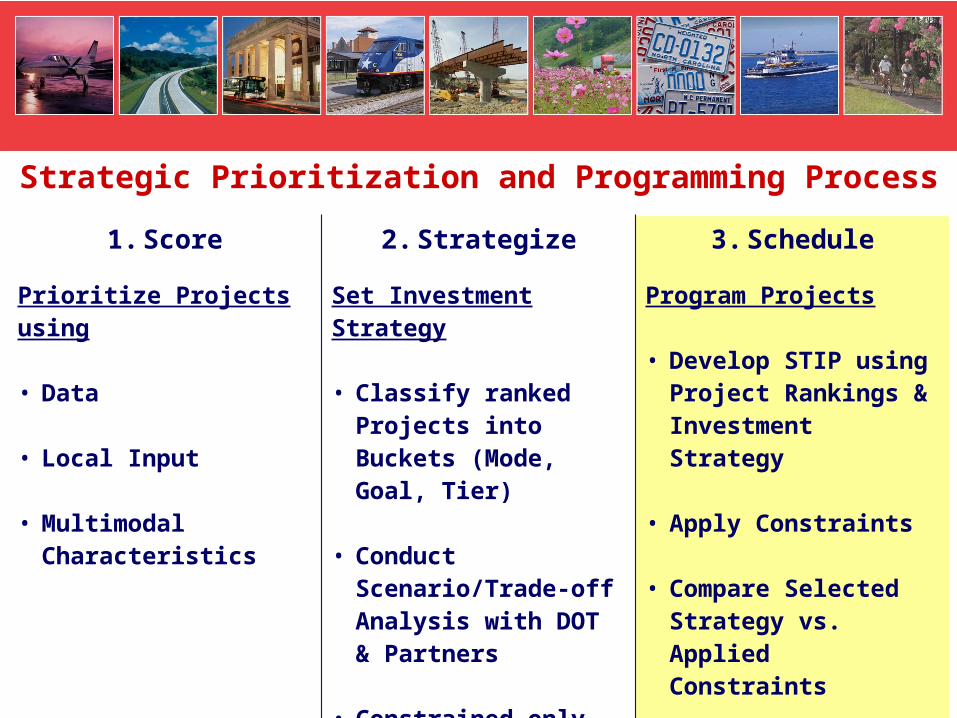
Strategic Prioritization and Programming Process

1. Score
Prioritize Projects using
• Data
• Local Input
• Multimodal Characteristics
2. Strategize
Set Investment Strategy
• Classify ranked Projects into Buckets (Mode, Goal, Tier)
• Conduct Scenario/Trade-off Analysis with DOT & Partners
• Constrained only by Total Available Revenue
3. Schedule
Program Projects
• Develop STIP using Project Rankings & Investment Strategy
• Apply Constraints
• Compare Selected Strategy vs. Applied Constraints
Strategic Prioritization and Programming Process
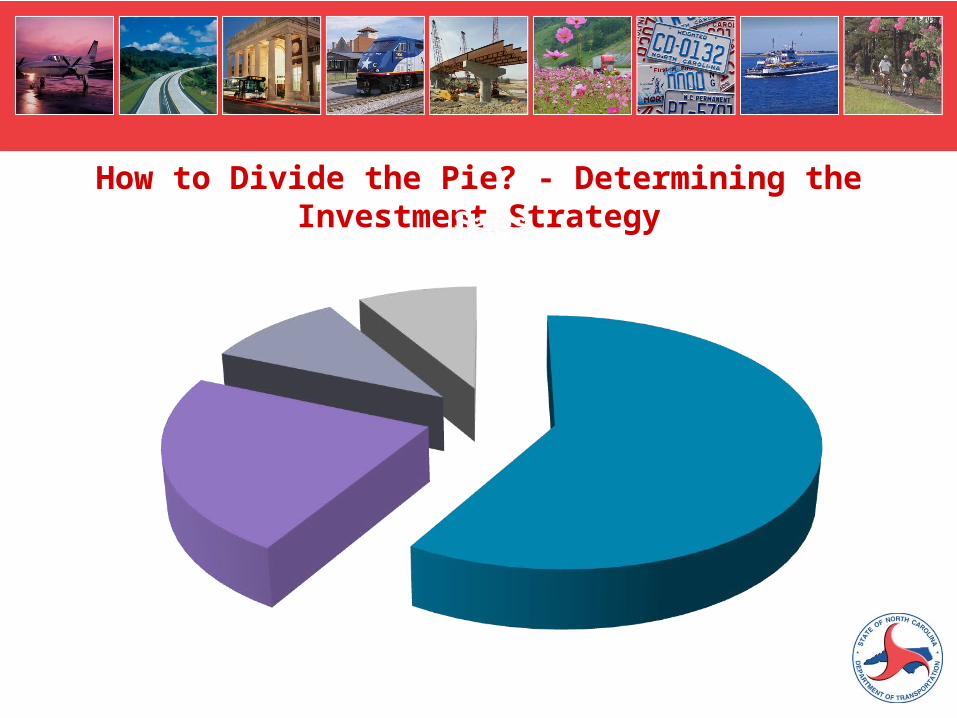
How to Divide the Pie? - Determining the Investment Strategy
? %? %
? %? %
Summits throughout NC – 7 Summits• Partner and public input opportunity (220 participants)
Purpose is to provide analysis of where to apply expected revenue• What are the high-level priorities?• What is the investment needed to achieve those priorities?• Revenue is based on expected 10 Year total, unconstrained
Participants allocate $ to Prioritization Buckets
Use LOS to determine return on investment(i.e., if $X are allocated to Bucket “Y”, expected 10 Year LOS is “Z”)
Outcome is a “picture of where transportation $ should be spent”
Investment Strategy Summits
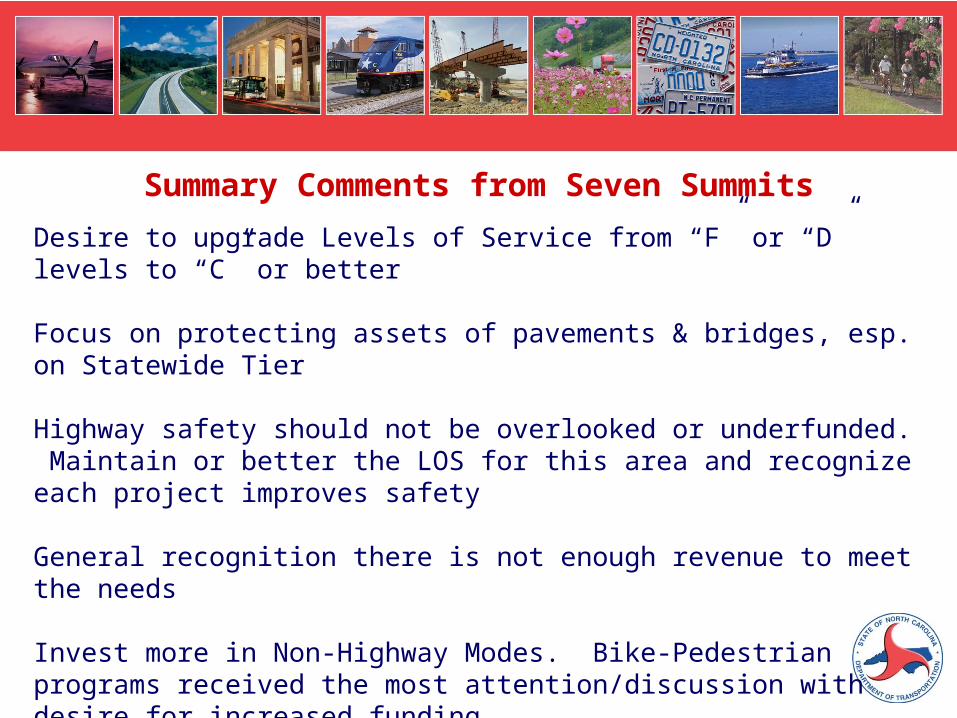
Desire to upgrade Levels of Service from “F” or “D” levels to “C” or better
Focus on protecting assets of pavements & bridges, esp. on Statewide Tier
Highway safety should not be overlooked or underfunded. Maintain or better the LOS for this area and recognize each project improves safety
General recognition there is not enough revenue to meet the needs
Invest more in Non-Highway Modes. Bike-Pedestrian programs received the most attention/discussion with desire for increased funding.
Support to keep Ferry system operating at a high level.
Ensure any commitment to Rail Program maximizes benefits to NC citizens
Summary Comments from Seven Summits
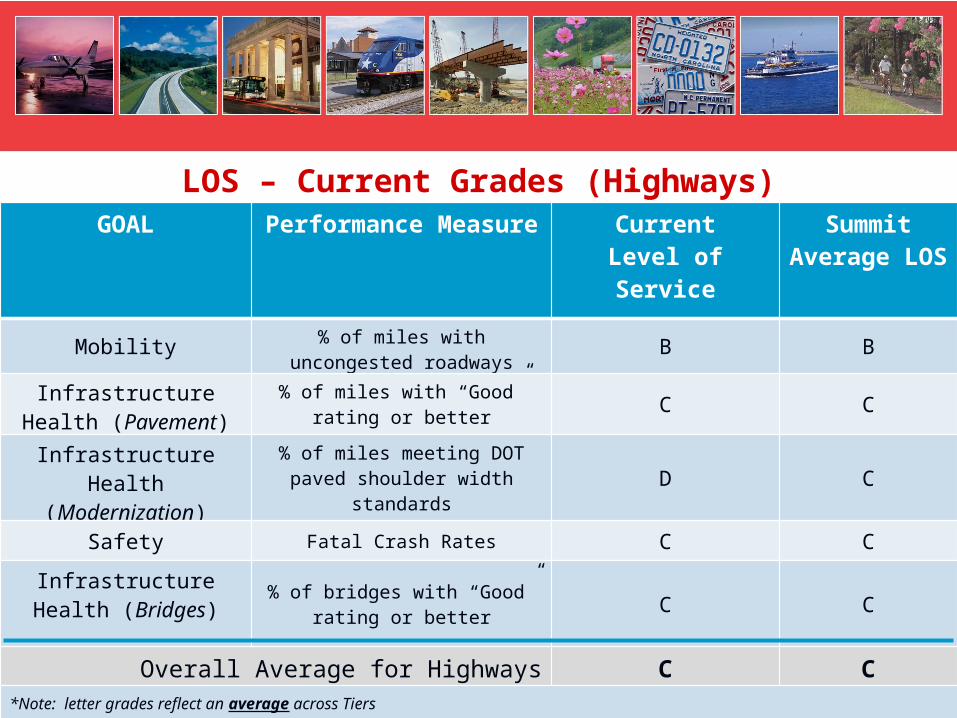
LOS – Current Grades (Highways)GOAL Performance Measure Current
Level of ServiceSummit
Average LOS
Mobility % of miles with uncongested roadways B B
Infrastructure Health (Pavement)
% of miles with “Good” rating or better C C
Infrastructure Health (Modernization)
% of miles meeting DOT paved shoulder width standards D C
Safety Fatal Crash Rates C C
Infrastructure Health (Bridges) % of bridges with “Good” rating or
better C C
Overall Average for Highways C C
*Note: letter grades reflect an average across Tiers
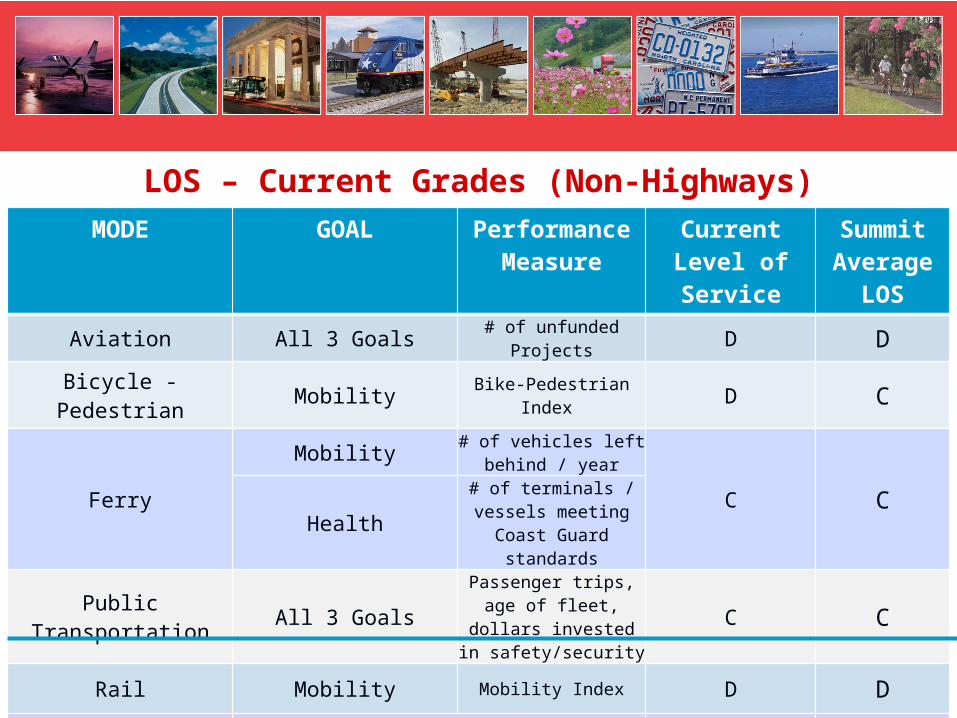
LOS – Current Grades (Non-Highways)MODE GOAL Performance
MeasureCurrentLevel of Service
Summit Average
LOS
Aviation All 3 Goals # of unfunded Projects D D
Bicycle - Pedestrian Mobility Bike-Pedestrian Index D C
Ferry
Mobility # of vehicles left behind / year
C CHealth
# of terminals / vessels meeting Coast Guard
standards
Public Transportation All 3 GoalsPassenger trips, age of fleet, dollars invested in
safety/securityC C
Rail Mobility Mobility Index D D
Overall Average for Non-Highways D C
*Note: letter grades reflect an average across Tiers
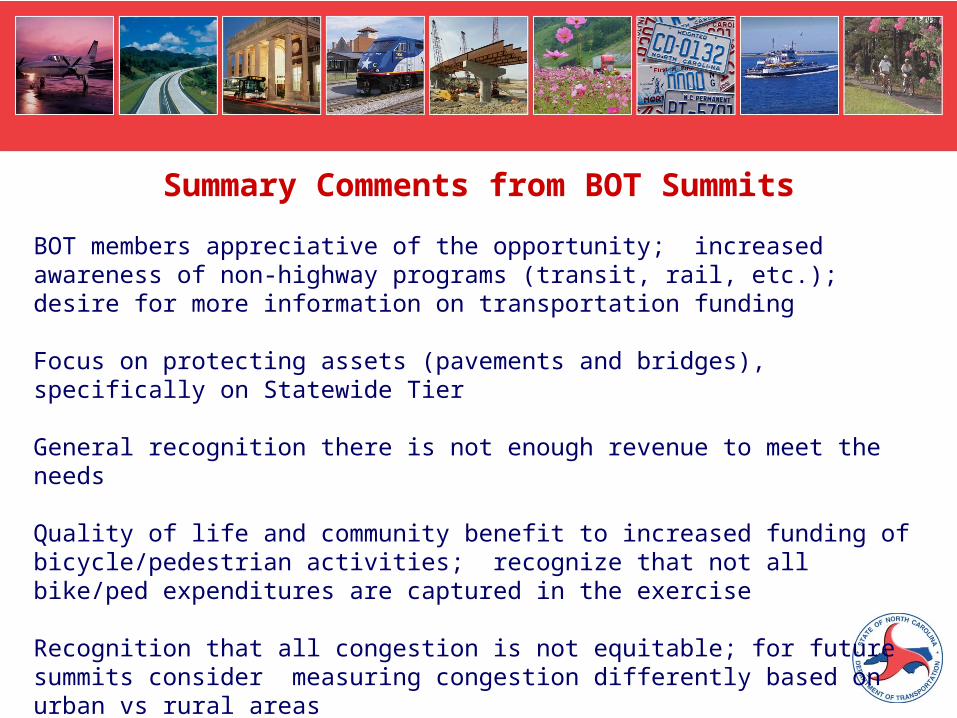
BOT members appreciative of the opportunity; increased awareness of non-highway programs (transit, rail, etc.); desire for more information on transportation funding
Focus on protecting assets (pavements and bridges), specifically on Statewide Tier
General recognition there is not enough revenue to meet the needs
Quality of life and community benefit to increased funding of bicycle/pedestrian activities; recognize that not all bike/ped expenditures are captured in the exercise
Recognition that all congestion is not equitable; for future summits consider measuring congestion differently based on urban vs rural areas
For future summits consider how to compare ROI of investing in different modes (i.e. investment level per user or per capita?)
Summary Comments from BOT Summits

Mode Goal TierSubmitted
Needs
Current LOS (A-F)
Stay the Course(2018-2022)
Average from 7 Summits(2018-2022)
Statewide BOT Average
$% of Total
LOS $% of Total
LOS $% of Total
LOS
Aviation
SafetyRegional & Subregional
$500 D $230 2.3% D $339 3.4% D $234 2.3% DMobility
Health
Bicycle & Pedestrian
Mobility All Tiers $390 D $20 0.2% F $237 2.4% C $134 1.3% D
FerryMobility
All Tiers $630 C $70 0.7% D $330 3.3% D $293 2.9% DHealth
Public Transportation
Safety
All Tiers $4,090 C $740 7.2% C $848 8.5% C $653 6.5% DMobility
Health
Rail Mobility Statewide $6,020 D $0 0.0% D $911 9.1% D $352 3.5% D
Total NON-HIGHWAY $11,630 $1,060 10.4% $2,665 26.7% $1,665 16.7%
Highway
Safety All Tiers $1,010 C $150 1.5% D $581 5.8% C $370 3.7% C
Mobility
Statewide $22,070 B $3,920 38.4% A $1,092 10.9% B $2,316 23.2% B
Regional $10,080 A $430 4.2% A $195 2.0% A $401 4.0% A
Subregional $7,630 A $530 5.2% A $187 1.9% A $419 4.2% A
Health
Statewide $1,740 C $980 9.6% B $873 8.7% B $972 9.7% B
Regional $3,320 D $700 6.9% D $837 8.4% C $801 8.0% C
Subregional $3,830 D $960 9.4% F $2,586 25.9% D $2,103 21.0% D
Bridge (All Tiers) $1,520 C $1,480 14.5% C $984 9.8% C $952 9.5% C
Total HIGHWAY $51,200 $9,150 89.7% $7,335 73.3% $8,333 83.3%
GRAND TOTAL $62,830 $10,210 100.1% $10,000 100.0% $10,000 100.0%
1. Score
Prioritize Projects using
• Data
• Local Input
• Multimodal Characteristics
2. Strategize
Set Investment Strategy
• Classify ranked Projects into Buckets (Mode, Goal, Tier)
• Conduct Scenario/Trade-off Analysis with DOT & Partners
• Constrained only by Total Available Revenue
3. Schedule
Program Projects
• Develop STIP using Project Rankings & Investment Strategy
• Apply Constraints
• Compare Selected Strategy vs. Applied Constraints
Strategic Prioritization and Programming Process
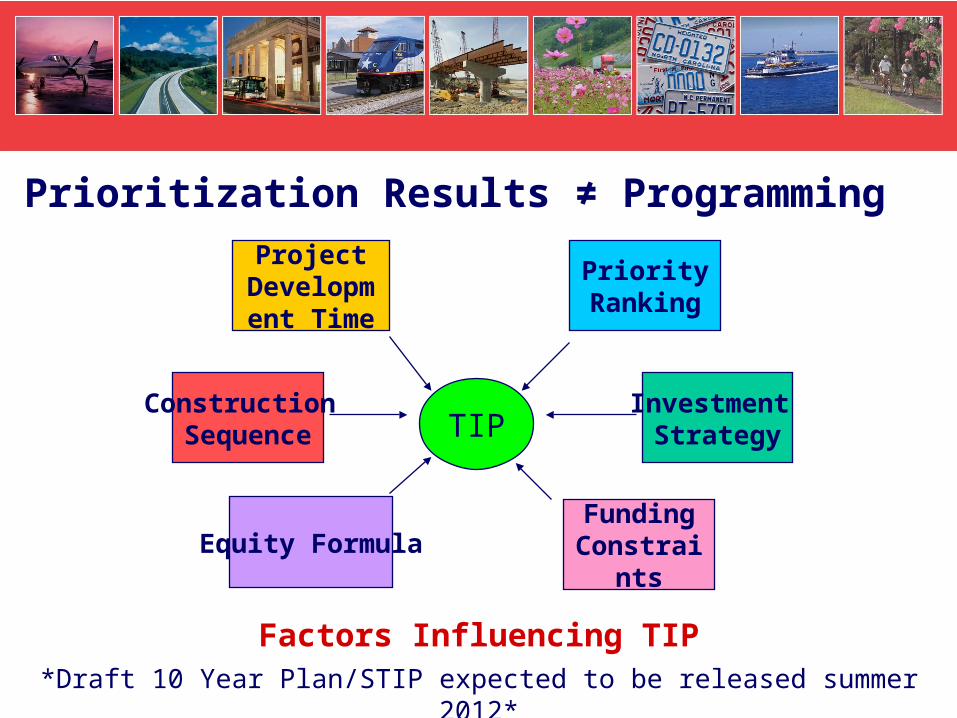
TIP
Project Developmen
t Time
PriorityRanking
Equity Formula Funding Constraints
Investment Strategy
Construction Sequence
Factors Influencing TIP
Prioritization Results ≠ Programming
*Draft 10 Year Plan/STIP expected to be released summer 2012*
Prioritization 3.0
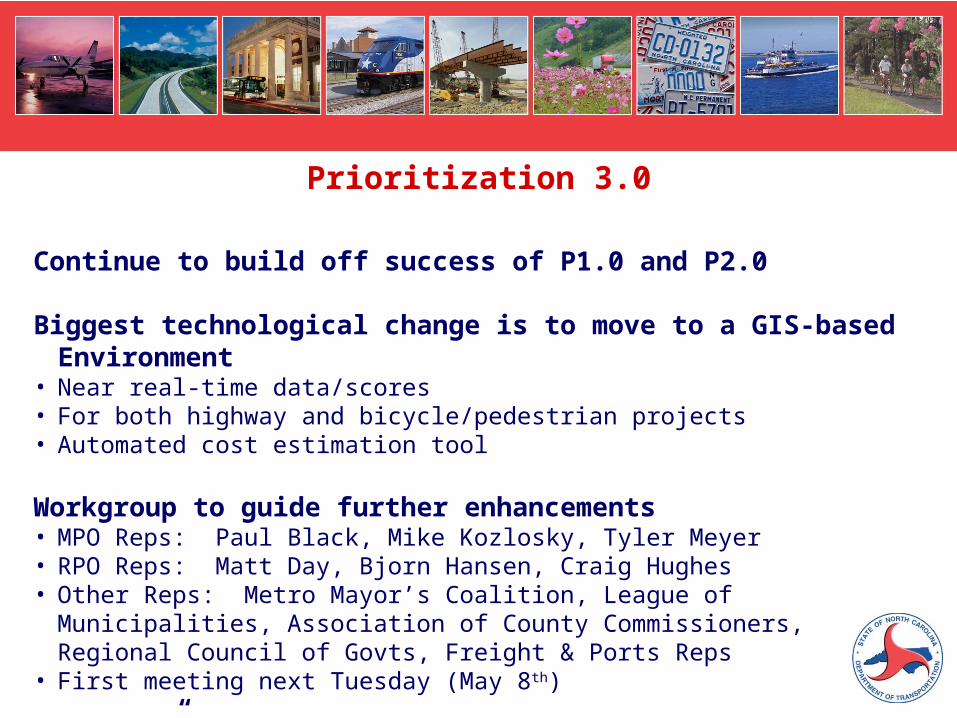
Continue to build off success of P1.0 and P2.0
Biggest technological change is to move to a GIS-based Environment• Near real-time data/scores• For both highway and bicycle/pedestrian projects• Automated cost estimation tool
Workgroup to guide further enhancements• MPO Reps: Paul Black, Mike Kozlosky, Tyler Meyer• RPO Reps: Matt Day, Bjorn Hansen, Craig Hughes• Other Reps: Metro Mayor’s Coalition, League of Municipalities, Association of
County Commissioners, Regional Council of Govts, Freight & Ports Reps• First meeting next Tuesday (May 8th)
“Go-Live” expected in Spring 2013
Prioritization 3.0
North Carolina Mobility FundProject Scoring
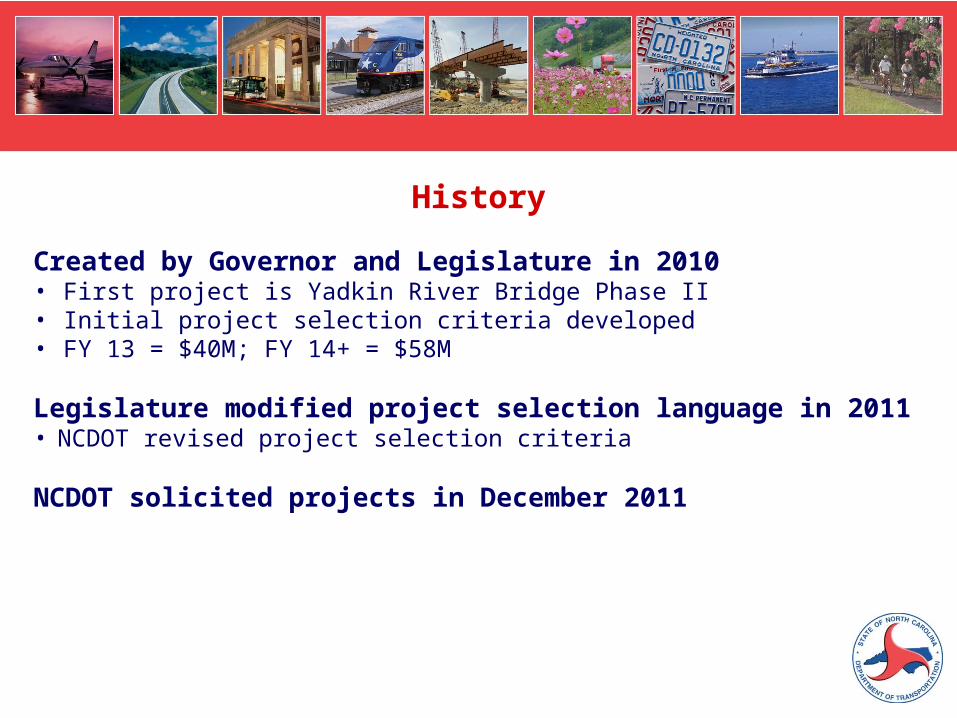
Created by Governor and Legislature in 2010• First project is Yadkin River Bridge Phase II• Initial project selection criteria developed• FY 13 = $40M; FY 14+ = $58M
Legislature modified project selection language in 2011• NCDOT revised project selection criteria
NCDOT solicited projects in December 2011
History
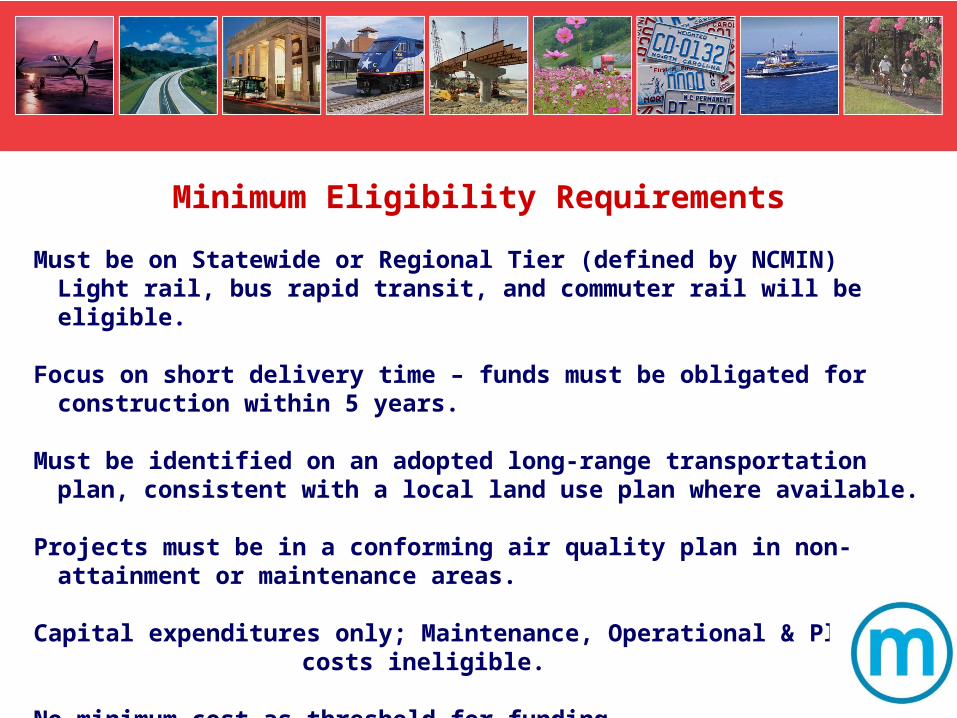
Must be on Statewide or Regional Tier (defined by NCMIN)Light rail, bus rapid transit, and commuter rail will be eligible.
Focus on short delivery time – funds must be obligated for construction within 5 years.
Must be identified on an adopted long-range transportation plan, consistent with a local land use plan where available.
Projects must be in a conforming air quality plan in non-attainment or maintenance areas.
Capital expenditures only; Maintenance, Operational & Planning costs ineligible.
No minimum cost as threshold for funding.
Minimum Eligibility Requirements
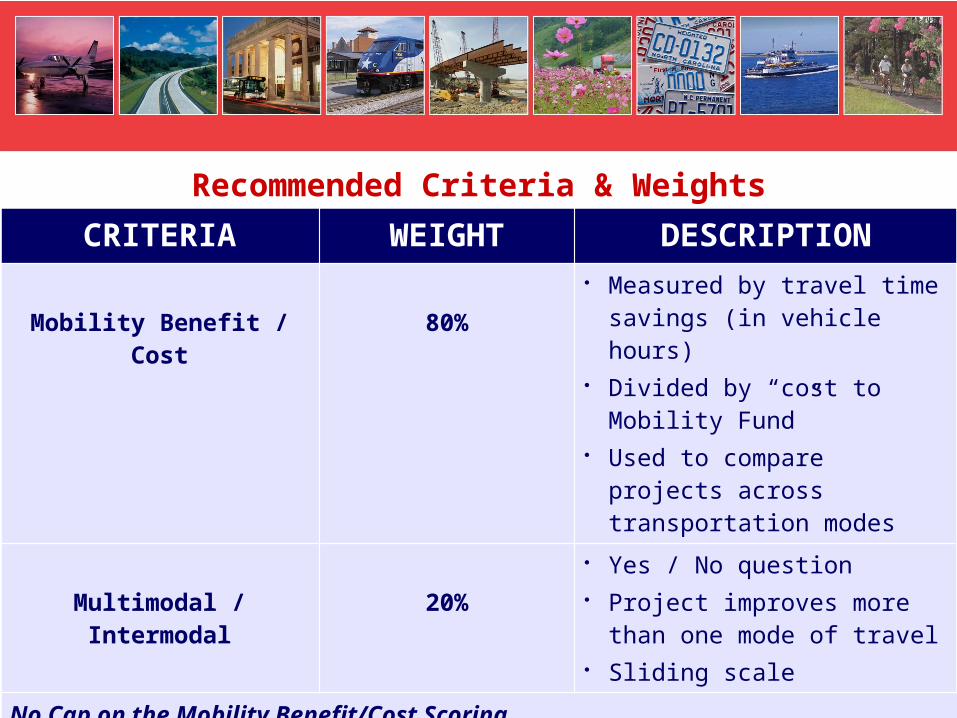
Recommended Criteria & Weights
CRITERIA WEIGHT DESCRIPTION
Mobility Benefit / Cost 80%
• Measured by travel time savings (in vehicle hours)
• Divided by “cost to Mobility Fund”
• Used to compare projects across transportation modes
Multimodal / Intermodal 20%
• Yes / No question • Project improves more than one
mode of travel• Sliding scale
No Cap on the Mobility Benefit/Cost Scoring
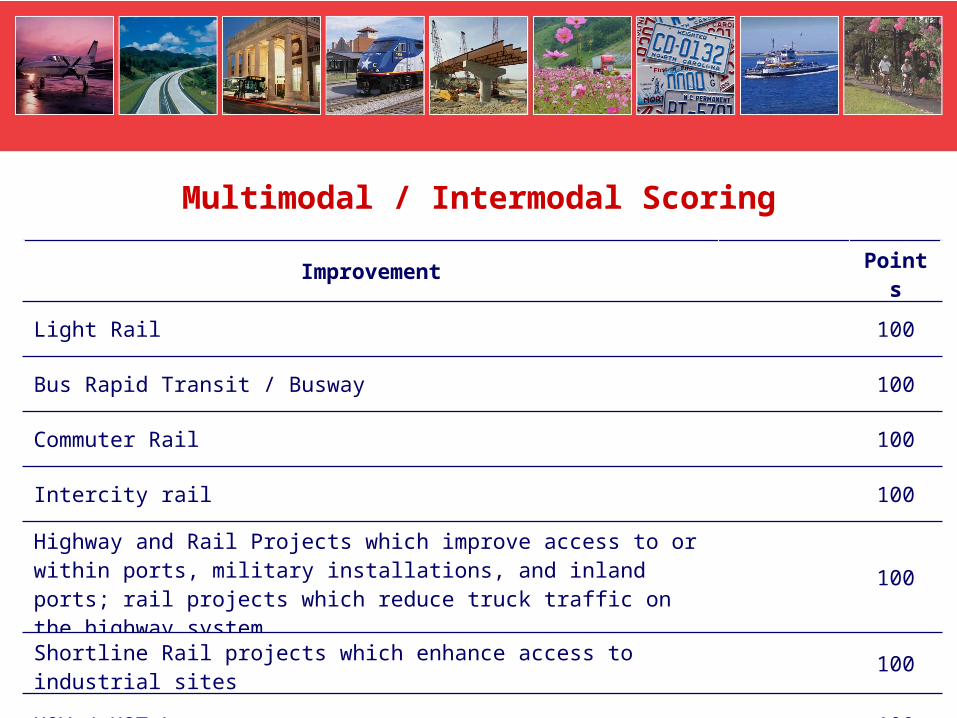
Multimodal / Intermodal Scoring
Improvement Points
Light Rail 100
Bus Rapid Transit / Busway 100
Commuter Rail 100
Intercity rail 100
Highway and Rail Projects which improve access to or within ports, military installations, and inland ports; rail projects which reduce truck traffic on the highway system
100
Shortline Rail projects which enhance access to industrial sites 100
HOV / HOT Lanes 100
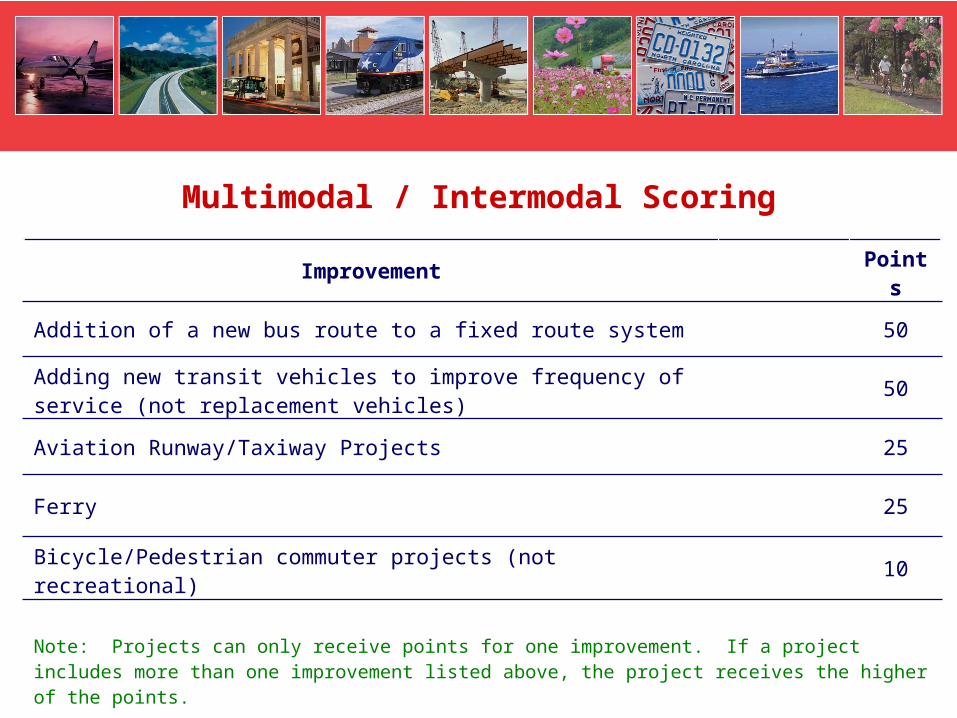
Multimodal / Intermodal Scoring
Improvement Points
Addition of a new bus route to a fixed route system 50
Adding new transit vehicles to improve frequency of service (not replacement vehicles) 50
Aviation Runway/Taxiway Projects 25
Ferry 25
Bicycle/Pedestrian commuter projects (not recreational) 10
Note: Projects can only receive points for one improvement. If a project includes more than one improvement listed above, the project receives the higher of the points.
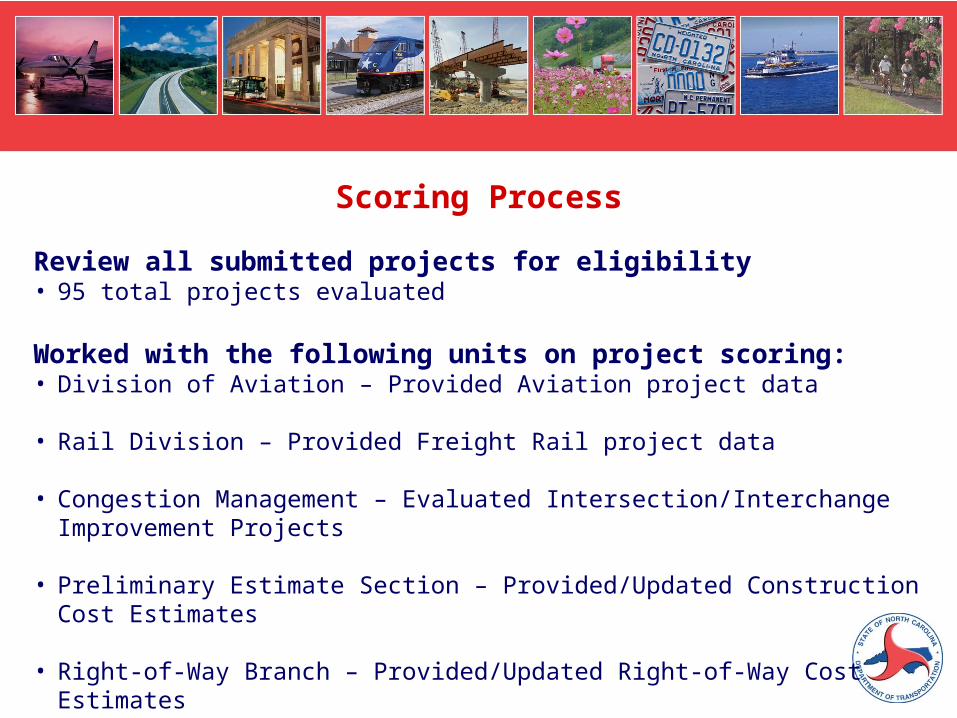
Review all submitted projects for eligibility• 95 total projects evaluated
Worked with the following units on project scoring:• Division of Aviation – Provided Aviation project data
• Rail Division – Provided Freight Rail project data
• Congestion Management – Evaluated Intersection/Interchange Improvement Projects
• Preliminary Estimate Section – Provided/Updated Construction Cost Estimates
• Right-of-Way Branch – Provided/Updated Right-of-Way Cost Estimates
Scoring Process
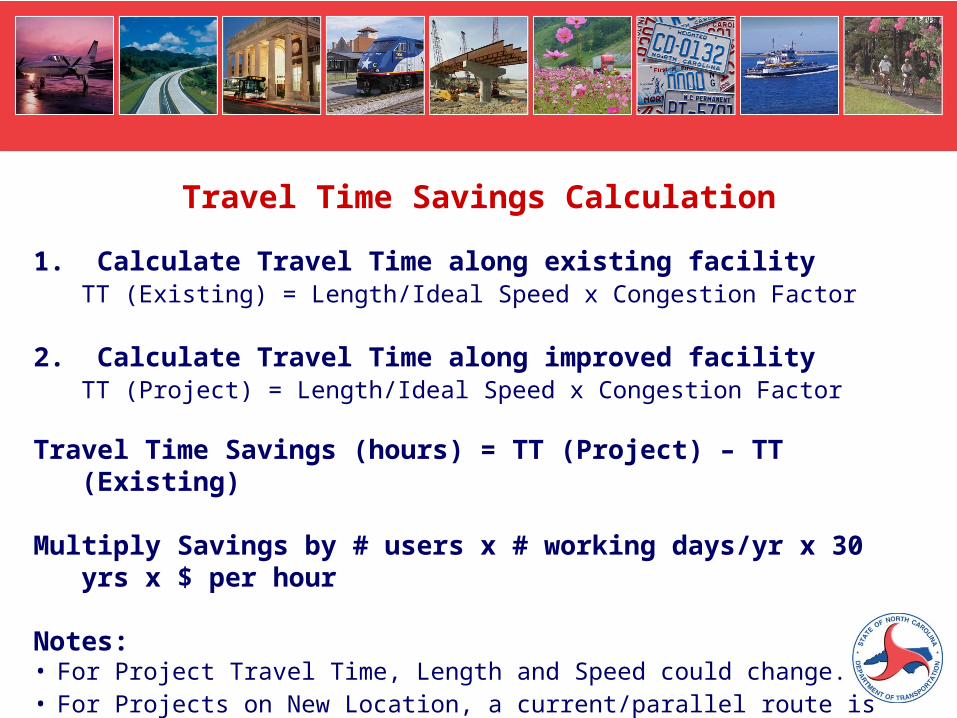
1. Calculate Travel Time along existing facilityTT (Existing) = Length/Ideal Speed x Congestion Factor
2. Calculate Travel Time along improved facilityTT (Project) = Length/Ideal Speed x Congestion Factor
Travel Time Savings (hours) = TT (Project) – TT (Existing)
Multiply Savings by # users x # working days/yr x 30 yrs x $ per hour
Notes:• For Project Travel Time, Length and Speed could change.• For Projects on New Location, a current/parallel route is used for existing
travel time; and the new route is used for the project travel time
Travel Time Savings Calculation
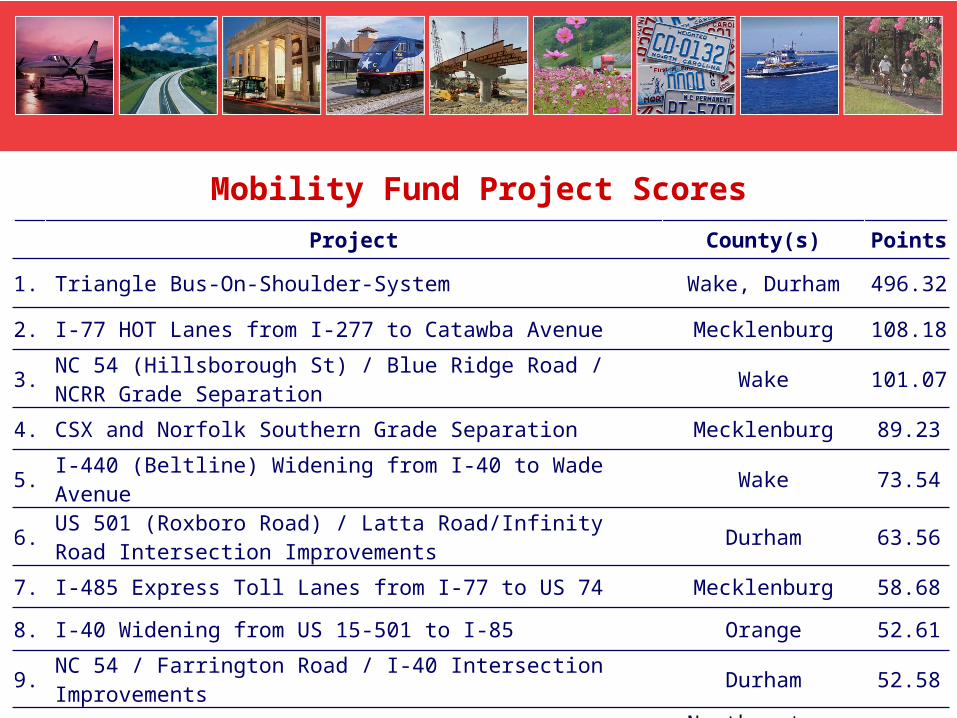
Mobility Fund Project Scores
Project County(s) Points
1. Triangle Bus-On-Shoulder-System Wake, Durham 496.32
2. I-77 HOT Lanes from I-277 to Catawba Avenue Mecklenburg 108.18
3. NC 54 (Hillsborough St) / Blue Ridge Road / NCRR Grade Separation Wake 101.07
4. CSX and Norfolk Southern Grade Separation Mecklenburg 89.23
5. I-440 (Beltline) Widening from I-40 to Wade Avenue Wake 73.54
6. US 501 (Roxboro Road) / Latta Road/Infinity Road Intersection Improvements Durham 63.56
7. I-485 Express Toll Lanes from I-77 to US 74 Mecklenburg 58.68
8. I-40 Widening from US 15-501 to I-85 Orange 52.61
9. NC 54 / Farrington Road / I-40 Intersection Improvements Durham 52.58
10. NCVA Railroad Mainline Track Improvements Northampton, Bertie, Hertford 50.75

Mobility Fund Project Scores
Project County(s) Points
11. Pembroke Northeast Rail Connector Robeson 47.88
12. US 70 / Brier Creek Parkway Interchange Wake 47.87
13. I-40 / Aviation Parkway Interchange Improvements Wake 42.75
14. I-295 (Fayetteville Loop) from Cliffdale Road to Yadkin Road Cumberland 40.67
15. NC 54 Widening from I-40 to Barbee Chapel Road Durham, Orange 39.18
16. US 70 / Slocum Road Intersection Improvements Craven 36.27
17. US 74 (Independence Blvd) Upgrade from NC 27 to Idlewild Rd Mecklenburg 35.92
18. I-40 Widening from US 70 Bus. to US 70 Bypass Wake 34.57
19. Wallace to Castle Hayne Rail Improvements New Hanover, Pender 34.46
20. US 70 (Glenwood Ave) Widening from Duraleigh Road to Triangle Drive Wake 33.02
Program Development Branch scheduling top projects
Considering:• Project readiness (i.e. when project can be let)• Available Mobility Fund dollars
Programmed projects included in Draft STIP in Summer
Mobility Fund Next Steps
Don Voelker – Director of Strategic Planning [email protected](919) 707-4740
Alpesh Patel – Senior Transportation [email protected](919) 707-4742
David Wasserman, P.E. – Senior Transportation [email protected](919) 707-4743
NCDOT Strategic Planning Office1501 Mail Service CenterRaleigh, NC 27699-1501http://ncdot.gov/performance/reform/prioritization/
Contact Information