Embed Size (px)
Citation preview

Investment Analyst Case Study
Iron Bank Real Estate Investors
“The Lyric” (215 10th Ave E)
Seattle-Tacoma-Bellevue Metro

OVERVIEW
The Lyric (“Property”) is being offered for sale with an asking price of $120 million. The Iron Bank Investment Committee is expecting a 2-page proposal from you that includes both a recommendation and an assessment regarding the potential acquisition of The Lyric.
Your 2-page proposal should answer the following questions:
• What is the most you would recommend paying for this property? Is the $120 million asking price appropriate?
• What are the strengths, weaknesses, and opportunities of this investment? • How could you mitigate the downside risk in this investment? • In what areas would you need to perform additional due diligence before making a
decision?
In addition to this written proposal, you should also submit an Excel model that includes your analysis and responses to the questions at the end of this case study. These questions are SEPARATE from the 2-page proposal above, and you must answer them separately.
You should submit an electronic copy of your proposal, your Excel file, and your responses to the case study questions within 1 week of receiving this case study.
PROPERTY SUMMARY
The Lyric (215 10th Ave E in Seattle, Washington in the United States) is a 7-story, 234-unit apartment building in the Seattle-Tacoma-Bellevue metro area. It was built in 2012 and is currently 97% occupied. It has a unit mix consisting of 15% studios, 40% 1-bedroom units, and 45% 2-bedroom units.
Unit amenities include custom self-closing cabinets, stainless steel and energy-efficient appliances, granite countertops, private balconies and patios, sunken kitchen sinks, vessel bathroom sinks, walk-in closets, floor-to-ceiling windows, front-load washers and dryers, and air conditioning.
Community amenities include a rooftop deck with views of Seattle and Mt. Rainier, a dog run and resident sky lounge, a high-tech theater, a state-of-the-art fitness center, underground parking, a gated electronic entrance, a multi-purpose media / gaming room, building-wide WiFi, a recycling center, and on-site management and concierge services.
There are 361 underground parking spaces at the Property.

PROPERTY LOCATION
The Property is located in Capitol Hill, one of the most densely populated and fastest-growing areas of the Seattle-Tacoma-Bellevue metro area.
The location provides convenient access to transportation, including the I-5, I-90, SR-520 and SR-99. Additional, the Property is one block north of a future Capitol Hill Light Rail Station that will serve the area.
It also provides easy office access for staff members of the four biggest employers in the region: Boeing, Microsoft, the University of Washington, and Amazon. The Seattle-Tacoma International Airport is 15 miles south on the I-5.
Additionally, the Property is within walking distance of Seattle University, Seattle Central Community College, the Swedish Medical Center, and three shopping and dining hubs: Broadway, Fifteenth, and the Pike-Pine Corridor.
MARKET DESCRIPTION
The Seattle-Tacoma-Bellevue metro area has been one of the fastest-growing areas in the US, with over 57,000 new residents in the past year.
The key renter demographic of 20-34-year-olds represented 28% of Seattle’s population and increased by 2.5% last year; it is expected to grow by 10% over the next five years.
The population in the metropolitan area also tends to be highly educated, with a median household income of $70,272, compared to a national median household income of $51,939. The area also has an unemployment rate of 3.9%, compared to the national unemployment rate of 5.5%.
The entire Seattle-Tacoma-Bellevue metro area has seen strong residential performance with respect to occupancy and rental rates over the past several years.
This performance is due to the growth of large employers such as Amazon and Microsoft, other companies opening or expanding their Seattle offices, and significantly more high-quality apartment units becoming available each year. Over 49,000 new jobs were added in the past year, up from 17,000 new jobs in 2010.
The region’s new apartment units, going back to 1900 and projected to 2018 based on properties currently under construction, are shown below:

The Lyric is in a highly developed office submarket, which includes over 33 million square feet of office space within a 5-mile radius.
Additionally, Capitol Hill alone has 6 million square feet of office space less than one mile from the Property, with a 6% vacancy rate and average gross rents of $37 per square foot, compared to a 10-12% vacancy rate and $30 per square foot averages for King County as a whole.
Amazon just announced plans to lease 817,000 square feet of office space currently under construction in the Troy Block in the South Lake Union area; it is also constructing a 3.3 million square foot project near downtown, and is expected to have enough office space in Seattle by 2019 to house 70,000 employees.
Amazon has grown its employee count from 33,700 at the end of 2010 to 154,100 in 2014; Microsoft has grown from 89,000 to 128,000; and Boeing has grown from 161,000 to 165,500 in that same time period.
As a result of these underlying fundamentals, the pace of new apartment construction has been rapid.
Within the Capitol Hill neighborhood, apartment construction has accelerated even more rapidly: there were only 8 developments in 2011, but that climbed to 30 by the end of 2012, and there are currently 50 apartment buildings under development within a 2-mile radius of the Property (for a total of 4,700 units). There are more than 90 planned or permitted projects in the area.

These developments are expected to result in 1,326 new apartment units in 2015, as well as 682 new units in 2016 and 738 in 2017 (for comparison, 778 new units opened in 2014). In the greater Seattle region, 56,721 apartment units are expected by 2019.
Despite this supply growth, the average rent in Capitol Hill rose by 7.4% last year, with the average rent in the greater Seattle area increasing by 5.4%.
Competitive properties currently under development near The Lyric include:
• A 248-unit apartment complex near Seattle University with a hotel-style lobby area, a central courtyard, and 12,500 square feet of retail space.
• A 135-unit 6-story apartment complex with an underground parking facility and 6,000 square feet of commercial space.
• A 260-unit 7-story apartment complex at Harvard and Pine, currently being converted from a former BMW dealership.
• A 300-unit apartment complex with 20,000 square feet of retail space (currently being converted from a former Mercedes Benz dealership).
The images below show apartment complex near the Property completed within the past year (left) and planned or permitted projects in the area (right):

MAPS

PHOTOS

UNIT MIX
(1) Effective Rent is the current Asking Rent minus discounts and rental concessions (e.g., free months of rent or other free amenities).

COMPARABLES – COMPETITIVE PROPERTIES
COMPARABLE APARTMENT SALES
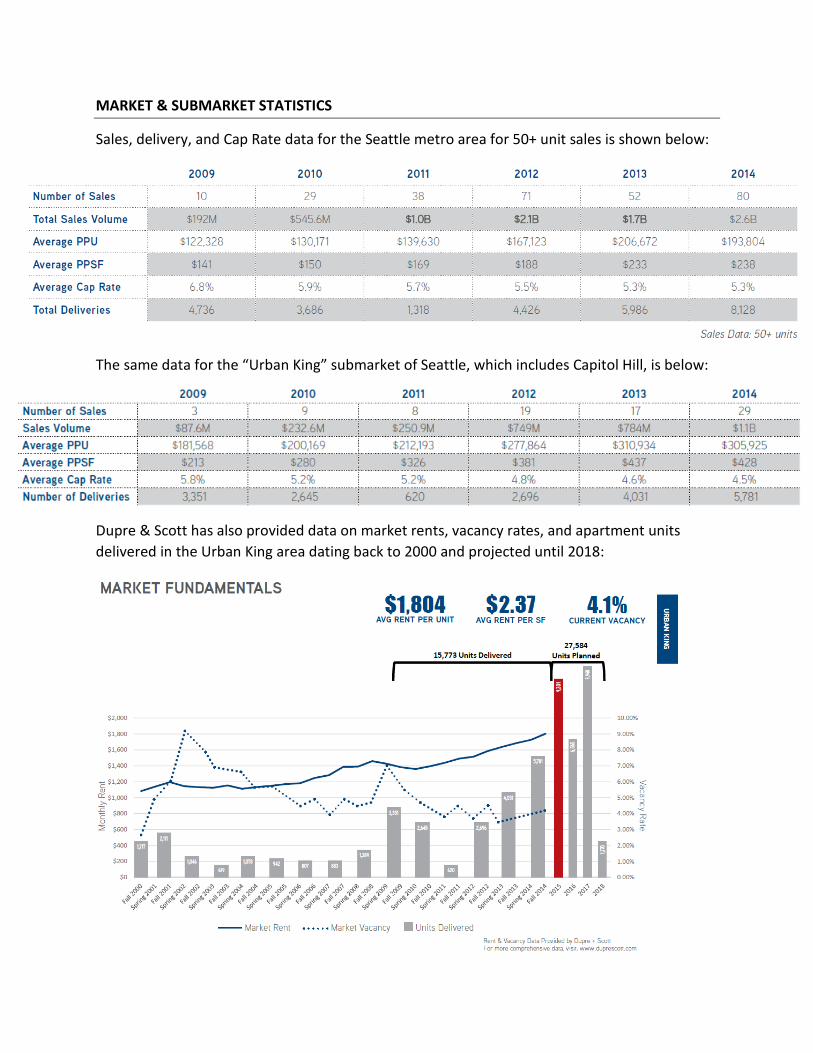
MARKET & SUBMARKET STATISTICS
Sales, delivery, and Cap Rate data for the Seattle metro area for 50+ unit sales is shown below:
The same data for the “Urban King” submarket of Seattle, which includes Capitol Hill, is below:
Dupre & Scott has also provided data on market rents, vacancy rates, and apartment units delivered in the Urban King area dating back to 2000 and projected until 2018:

Data on vacancy rates and net completions and absorptions is shown below:

Finally, apartment sale Cap Rates and $ / SF sale values for the Urban King Area going back to 2000 are shown below:
DEMOGRAPHICS
As noted above, the Seattle metro area has been among the top 10 fastest growing regions in the US in recent years.
Additional data on population, employment, and the number of households in the broader region (King County and Snohomish Country) is shown below:

REPLACEMENT COST ANALYSIS
(1) Construction financing assumes a 65% LTC with 70% of the loan outstanding for 24 months at a 6% interest rate.

APARTMENT COMPLEX PRO-FORMA ANALYSIS AND VALUATION
Based on the data above and the mix of units for The Lyric, please construct a Pro-Forma for the complex for the past year (2014) and project it over the next ten years.
The current owners have provided the following information on the property’s financial performance over the past 12 months and its future expected performance:
Key Assumption: Units: Value:
Net Rentable Area: Square Feet 186,215
Number of Units: # 234
Average Rent: $ / Square Foot / Month $3.16
Other Income: $ / Unit / Month $150
Vacancy / Collection Loss (Applies to Rent and Other
Income): % 5.0%
Operating Expenses (Utilities, Repairs / Maintenance, Insurance, Payroll, etc.):
$ / Unit / Year $3,300
Real Estate & Property Taxes: $ / Square Foot / Month $0.30
Replacement Reserve: $ / Unit / Year $1,500
Annual Income Growth Rate: % 3.0%
Annual Expense Growth Rate: % 3.0%
The items above should factor into the property’s Net Operating Income (NOI).
Next, you will create projections for “below the NOI line” items, such as other Capital Expenditures (CapEx), Tenant Improvements (TIs), and Leasing Commissions (LCs).
You will subtract these items from NOI to calculate the property’s Adjusted NOI. Please use the following assumptions in your Pro-Forma:

Key Assumption: Units: Value:
Capital Expenditures: $ / Unit / Year $2,000
Tenant Improvements (TIs): $ / Unit / Year $800
Leasing Commissions (LCs): $ / Unit / Year $600
Taxes: % Assume no taxes on capital gains or annual cash flow
CapEx Growth Rate: % 2.0%
TI Growth Rate: % 2.0%
LC Growth Rate: % 2.0%
Make sure your financial model can support different scenarios.
For example, one scenario might correspond to the assumptions above; another scenario might correspond to a market decline and a recovery.
Determine which scenarios seem likely and how events such as a market decline or recovery would impact rental income growth, the vacancy rate, and the other assumptions in the tables above.
Transaction Assumptions:
Please use the following assumptions for the initial acquisition:
Key Assumption: Units: Value:
Purchase Price: $ as Stated $120 million
Purchase Date: Date 2014-12-31
Purchase Fees: % 1.0%

Loan-to-Value (LTV) Ratio: % 70.0%
Loan Issuance Fees: % 1.0%
Loan Interest Rate (Fixed): % 4.0%
Loan Amortization Period: # Years 30
Loan Maturity: # Years 10
Prepayment Penalty (% of remaining principal): % 3.0%
Please use the following assumptions for the resale of the property in the future:
Key Assumption: Units: Value:
Exit Date: Date 2024-12-31
Exit Cap Rate: % Determine based on the market data and your model
Selling Costs: % 2.0%
Calculate BOTH Unleveraged IRR (Project IRR) and Leveraged IRR (IRR to Equity Investors) over this 10-year period, making sure you factor in fees, prepayment penalties, and the required debt principal repayment when the property is sold. Your model should support any exit year between 2015 and 2024.
Once you’ve finished this initial analysis, please complete a DCF valuation of the property and value it using comparable apartment sales.
You can assume that Iron Bank Real Estate Investors is targeting a 10% levered return on stabilized (“core”) properties; pick a Terminal Cap Rate and Terminal Cash Flow Growth Rate in-line with the assumptions you used in the Pro-Forma Analysis.
You can also factor in the Replacement Cost Analysis shown above when valuing the Property.

EXCEL / CASE STUDY QUESTIONS
In addition to your 2-page proposal on whether or not to acquire the property for $120 million, please answer the following case study questions:
1) Calculate the Net Operating Income and the annual unleveraged return for Year 1, using the “Base Case” numbers in the section above.
2) Assume that IBREI uses no debt for the initial purchase, and that it sells the building in December 2024 for a gross price of $130 million. Also assume that there are no capital gains taxes or income taxes, and use Excel to calculate IBREI’s unleveraged IRR on this investment.
3) Use the scenario provided in question #2, but now assume that 70% leverage (along with the debt assumptions in the previous section) is used.
4) Calculate the present value of the 2019 annual operating cash flow at a 10% discount rate. Assume no debt is used to fund the acquisition.
5) When calculating the net present value of cash flows to equity, should the discount rate be higher, lower, or equal to the discount rate used for the same investment if no leverage were used? Justify your answer in 5 or fewer sentences.
6) Could the cap rate on an acquisition (based on Year 1 projected NOI) be higher than the projected IRR over a 5-year holding period (assuming a resale at the end of Year 5)? Explain your answer in 5 or fewer sentences.
7) Explain the relationship between projected IRR and NPV for an investment. Once again, justify your answer in 5 or fewer sentences.