Embed Size (px)
Citation preview

Page 1 of 12
Investment Analyst Case Study Prudential Real Estate Investors
2015-2016 Montlake Crest Apartments
Seattle, WA
Page 2 of 12
INSTRUCTIONS – READ FIRST This case study consists of two sections. Each is based on Montlake Crest Apartments (the “Subject” or “Property”), a hypothetical apartment complex in the Seattle metropolitan area. Please read the below information carefully. Per the instructions in the email, you will return the completed case study by the specified date to [email protected]. This case study is designed as a data point to value what you understand and how well you understand it. Deliverables include the following:
1) Excel workbook 2) Word Document (not to exceed 2 pages in length)
The information in this case study is meant to be fully self-contained. All necessary material to answer each question is available in this packet and outside sources are not required. You must cite the source of any data obtained from outside of this case study. --------------------------------------------------------------------------------------------------------------------------------------- Section 1 - Excel Pro-Forma & Calculations Section 1 is purely quantitative and meant to test basic Excel skills and calculations.
Use only the information within this section to construct a model in Excel. Do not use facts given in Section 2 to make or modify the assumptions provided in Section 1. Save the model and clearly label your answers, highlighting them in yellow. If you do not know or are uncertain about a question, you may provide written explanations to
support your numeric answer (but this is not required). Section 2 - Data Interpretation & Written Responses Section 2 is meant to evaluate your understanding and analysis of the investment opportunity as well as writing skills.
This section consists of three open-ended questions requiring a written response, which should be based on the additional information provided following the questions.
Answer these questions in a separate Word file. The written response should be 1-2 pages in length, size 10 Arial font, single spaced.
It is important that the assumptions provided and your answers given to the questions in Section 1 SHOULD NOT impact your responses in Section 2.
Your responses can be written in paragraph form or bullet point answers are also acceptable. You may reference any additional calculations performed in Excel to support your written
responses.
Page 3 of 12
Section 1 – Excel Pro-Forma & Calculations
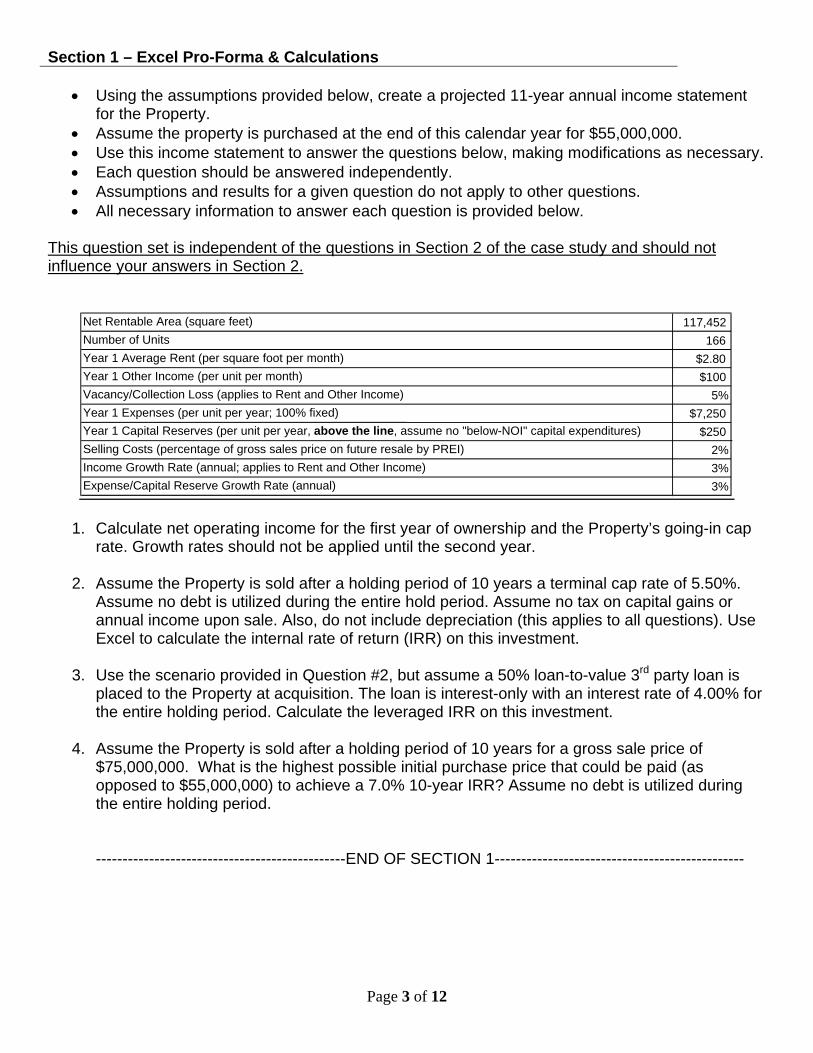
Using the assumptions provided below, create a projected 11-year annual income statement for the Property.
Assume the property is purchased at the end of this calendar year for $55,000,000. Use this income statement to answer the questions below, making modifications as necessary. Each question should be answered independently. Assumptions and results for a given question do not apply to other questions. All necessary information to answer each question is provided below.
This question set is independent of the questions in Section 2 of the case study and should not influence your answers in Section 2.
1. Calculate net operating income for the first year of ownership and the Property’s going-in cap rate. Growth rates should not be applied until the second year.
2. Assume the Property is sold after a holding period of 10 years a terminal cap rate of 5.50%.
Assume no debt is utilized during the entire hold period. Assume no tax on capital gains or annual income upon sale. Also, do not include depreciation (this applies to all questions). Use Excel to calculate the internal rate of return (IRR) on this investment.
3. Use the scenario provided in Question #2, but assume a 50% loan-to-value 3rd party loan is
placed to the Property at acquisition. The loan is interest-only with an interest rate of 4.00% for the entire holding period. Calculate the leveraged IRR on this investment.
4. Assume the Property is sold after a holding period of 10 years for a gross sale price of
$75,000,000. What is the highest possible initial purchase price that could be paid (as opposed to $55,000,000) to achieve a 7.0% 10-year IRR? Assume no debt is utilized during the entire holding period.
-----------------------------------------------END OF SECTION 1-----------------------------------------------
Net Rentable Area (square feet) 117,452 Number of Units 166 Year 1 Average Rent (per square foot per month) $2.80
Year 1 Other Income (per unit per month) $100
Vacancy/Collection Loss (applies to Rent and Other Income) 5%
Year 1 Expenses (per unit per year; 100% fixed) $7,250
Year 1 Capital Reserves (per unit per year, above the line, assume no "below-NOI" capital expenditures) $250
Selling Costs (percentage of gross sales price on future resale by PREI) 2%
Income Growth Rate (annual; applies to Rent and Other Income) 3%
Expense/Capital Reserve Growth Rate (annual) 3%
Page 4 of 12
Section 2 – Data Interpretation & Written Responses Use the information on the following pages to answer these three questions in a separate Word file.
1. Explain three positives and three potential risks of purchasing this Property (regardless of price).
2. What do you believe is a fair market price for the property? Provide a specific dollar value (not a range), and support your answer.
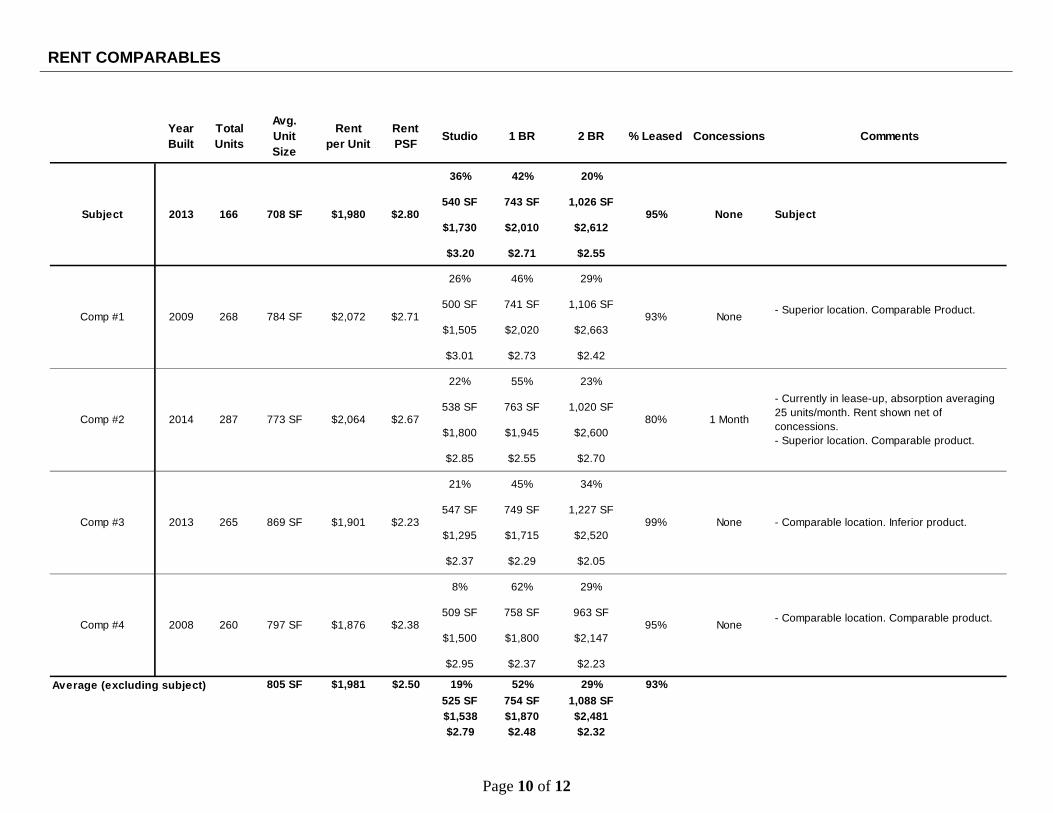
3. Refer to the rent comps on page 10 and focus on year built, total units, and average unit sizes for each property. How does Montlake Crest Apartments compare to the competition? What do these metrics mean for the success or challenge facing Montlake Crest Apartments in the Seattle market?
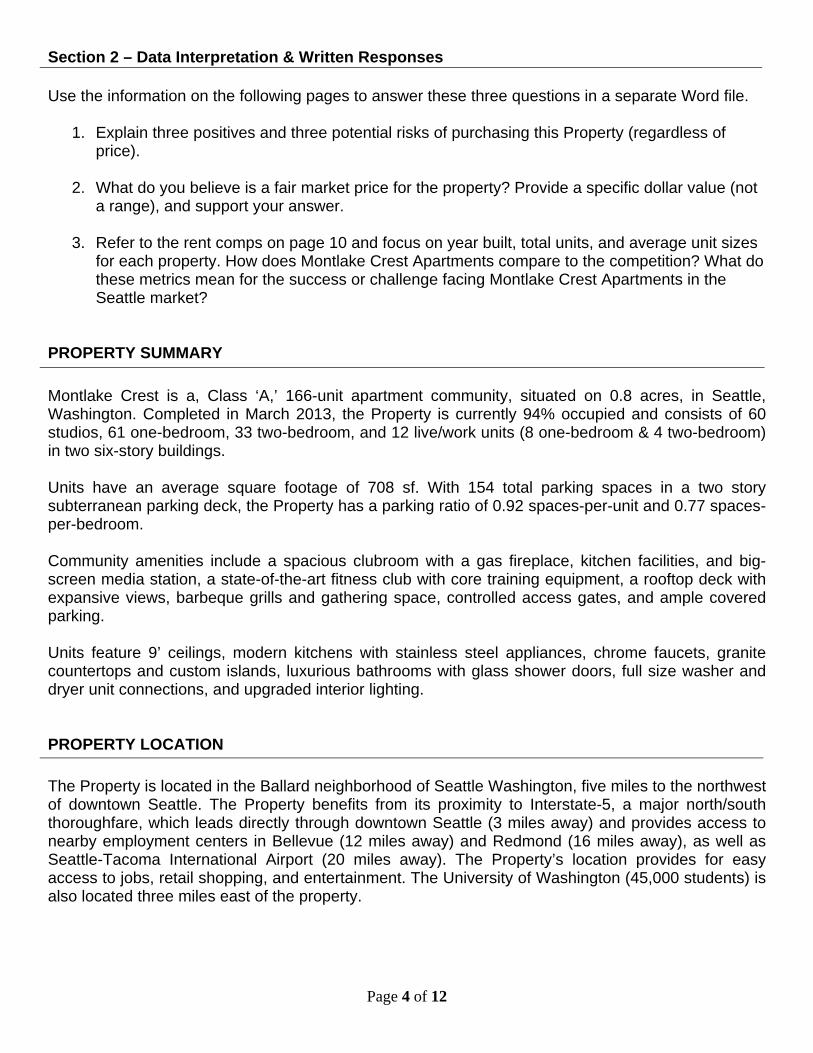
PROPERTY SUMMARY
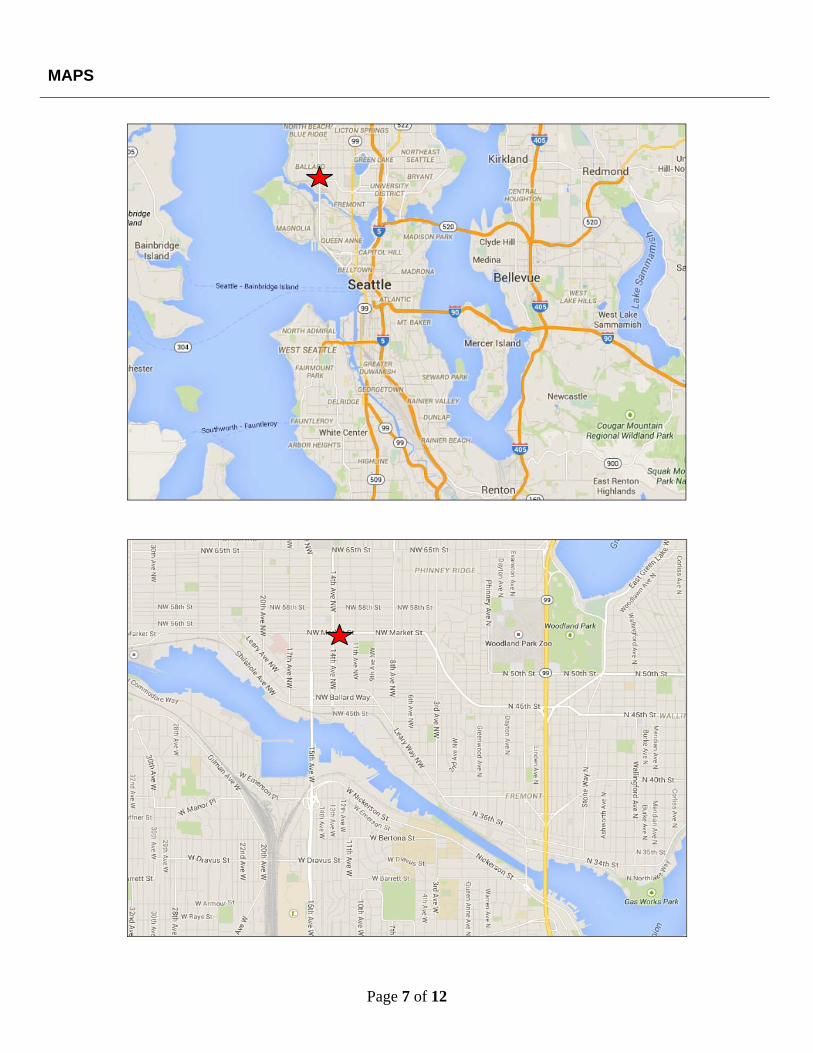
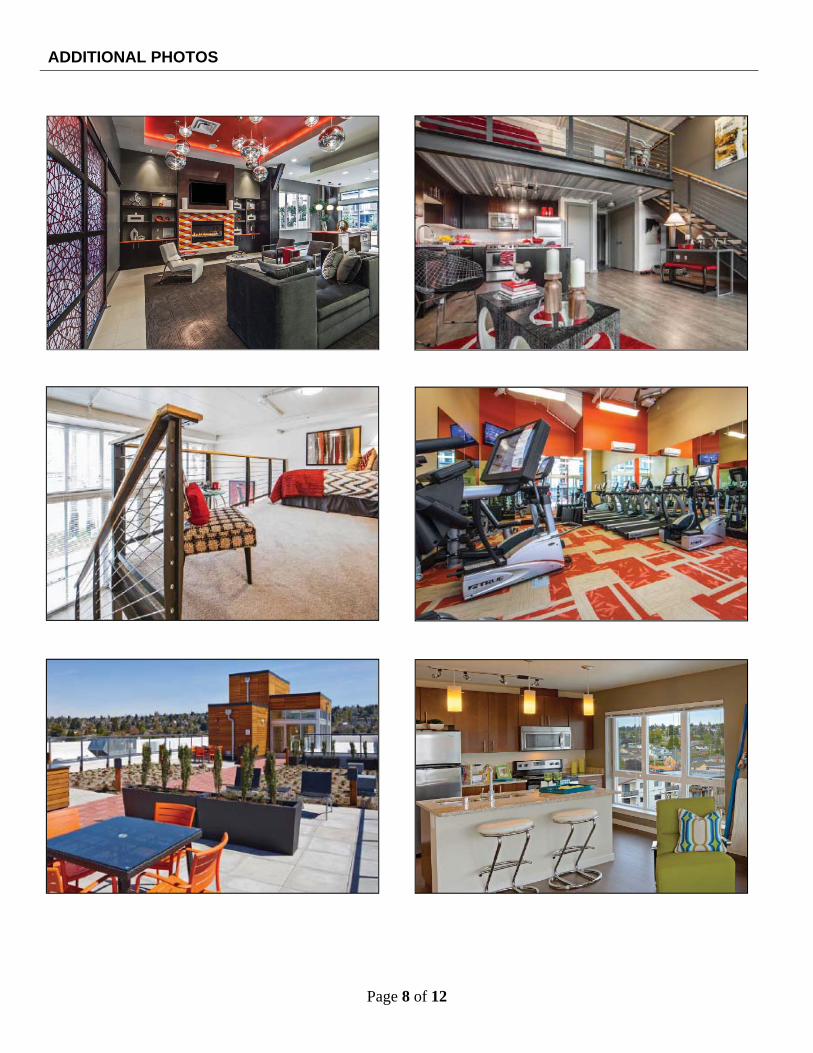
Montlake Crest is a, Class ‘A,’ 166-unit apartment community, situated on 0.8 acres, in Seattle, Washington. Completed in March 2013, the Property is currently 94% occupied and consists of 60 studios, 61 one-bedroom, 33 two-bedroom, and 12 live/work units (8 one-bedroom & 4 two-bedroom) in two six-story buildings. Units have an average square footage of 708 sf. With 154 total parking spaces in a two story subterranean parking deck, the Property has a parking ratio of 0.92 spaces-per-unit and 0.77 spaces-per-bedroom. Community amenities include a spacious clubroom with a gas fireplace, kitchen facilities, and big-screen media station, a state-of-the-art fitness club with core training equipment, a rooftop deck with expansive views, barbeque grills and gathering space, controlled access gates, and ample covered parking. Units feature 9’ ceilings, modern kitchens with stainless steel appliances, chrome faucets, granite countertops and custom islands, luxurious bathrooms with glass shower doors, full size washer and dryer unit connections, and upgraded interior lighting. PROPERTY LOCATION
The Property is located in the Ballard neighborhood of Seattle Washington, five miles to the northwest of downtown Seattle. The Property benefits from its proximity to Interstate-5, a major north/south thoroughfare, which leads directly through downtown Seattle (3 miles away) and provides access to nearby employment centers in Bellevue (12 miles away) and Redmond (16 miles away), as well as Seattle-Tacoma International Airport (20 miles away). The Property’s location provides for easy access to jobs, retail shopping, and entertainment. The University of Washington (45,000 students) is also located three miles east of the property.
Page 5 of 12
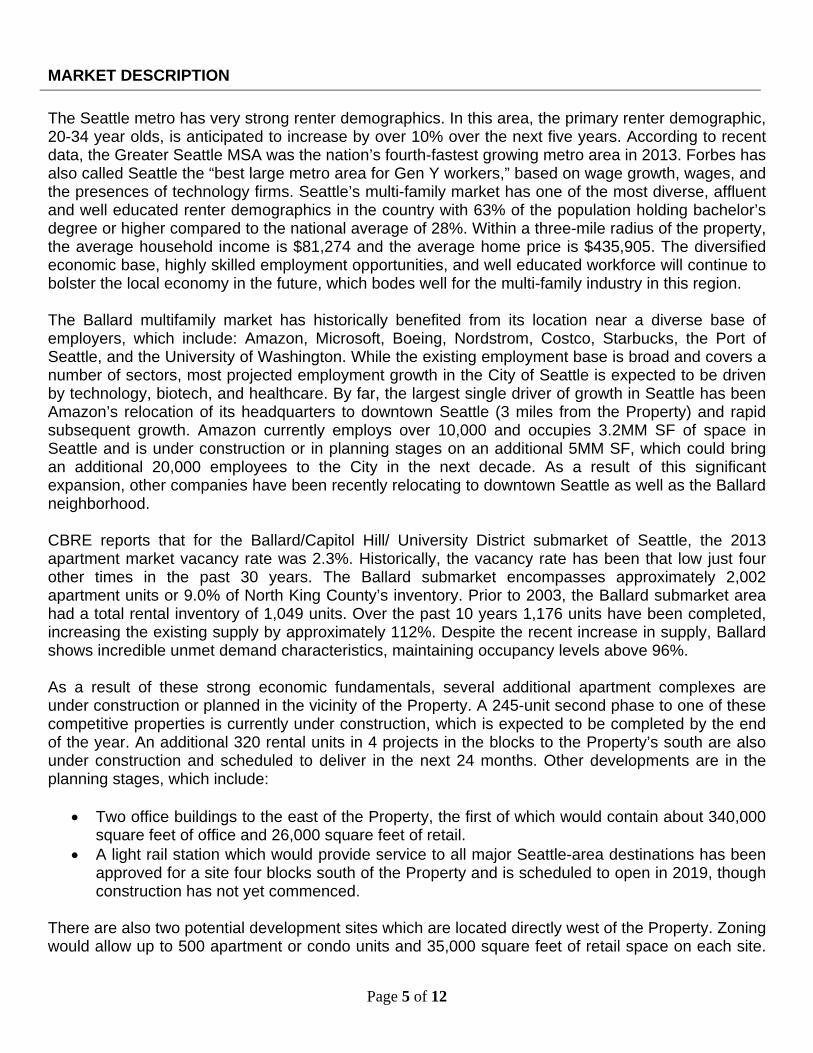
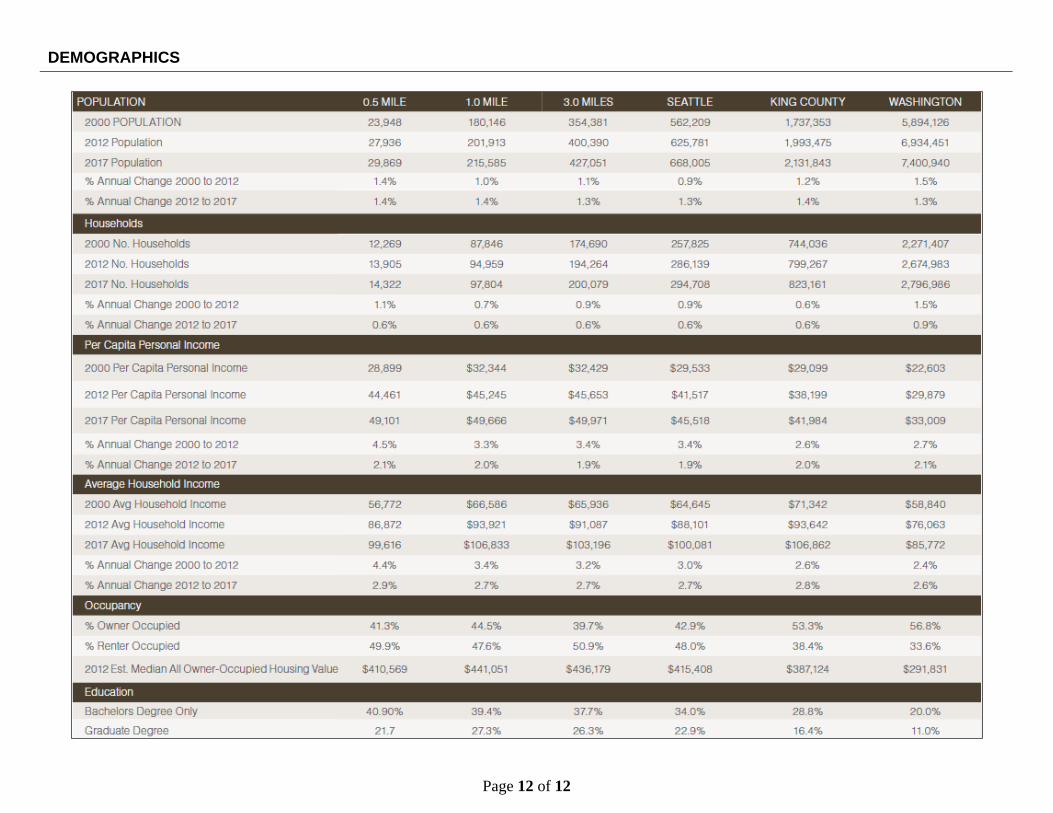
MARKET DESCRIPTION
The Seattle metro has very strong renter demographics. In this area, the primary renter demographic, 20-34 year olds, is anticipated to increase by over 10% over the next five years. According to recent data, the Greater Seattle MSA was the nation’s fourth-fastest growing metro area in 2013. Forbes has also called Seattle the “best large metro area for Gen Y workers,” based on wage growth, wages, and the presences of technology firms. Seattle’s multi-family market has one of the most diverse, affluent and well educated renter demographics in the country with 63% of the population holding bachelor’s degree or higher compared to the national average of 28%. Within a three-mile radius of the property, the average household income is $81,274 and the average home price is $435,905. The diversified economic base, highly skilled employment opportunities, and well educated workforce will continue to bolster the local economy in the future, which bodes well for the multi-family industry in this region. The Ballard multifamily market has historically benefited from its location near a diverse base of employers, which include: Amazon, Microsoft, Boeing, Nordstrom, Costco, Starbucks, the Port of Seattle, and the University of Washington. While the existing employment base is broad and covers a number of sectors, most projected employment growth in the City of Seattle is expected to be driven by technology, biotech, and healthcare. By far, the largest single driver of growth in Seattle has been Amazon’s relocation of its headquarters to downtown Seattle (3 miles from the Property) and rapid subsequent growth. Amazon currently employs over 10,000 and occupies 3.2MM SF of space in Seattle and is under construction or in planning stages on an additional 5MM SF, which could bring an additional 20,000 employees to the City in the next decade. As a result of this significant expansion, other companies have been recently relocating to downtown Seattle as well as the Ballard neighborhood. CBRE reports that for the Ballard/Capitol Hill/ University District submarket of Seattle, the 2013 apartment market vacancy rate was 2.3%. Historically, the vacancy rate has been that low just four other times in the past 30 years. The Ballard submarket encompasses approximately 2,002 apartment units or 9.0% of North King County’s inventory. Prior to 2003, the Ballard submarket area had a total rental inventory of 1,049 units. Over the past 10 years 1,176 units have been completed, increasing the existing supply by approximately 112%. Despite the recent increase in supply, Ballard shows incredible unmet demand characteristics, maintaining occupancy levels above 96%. As a result of these strong economic fundamentals, several additional apartment complexes are under construction or planned in the vicinity of the Property. A 245-unit second phase to one of these competitive properties is currently under construction, which is expected to be completed by the end of the year. An additional 320 rental units in 4 projects in the blocks to the Property’s south are also under construction and scheduled to deliver in the next 24 months. Other developments are in the planning stages, which include:
Two office buildings to the east of the Property, the first of which would contain about 340,000 square feet of office and 26,000 square feet of retail.
A light rail station which would provide service to all major Seattle-area destinations has been approved for a site four blocks south of the Property and is scheduled to open in 2019, though construction has not yet commenced.
There are also two potential development sites which are located directly west of the Property. Zoning would allow up to 500 apartment or condo units and 35,000 square feet of retail space on each site.

Page 6 of 12
However, one of the sites has contaminated soil that would require mitigation and environmental testing prior to being developed. A very old and small, yet iconic restaurant is currently located on the other site, which would need to be demolished. The restaurant could easily be purchased at a fraction of the cost of the underlying land.
Page 7 of 12
MAPS
Page 8 of 12
ADDITIONAL PHOTOS
Page 9 of 12
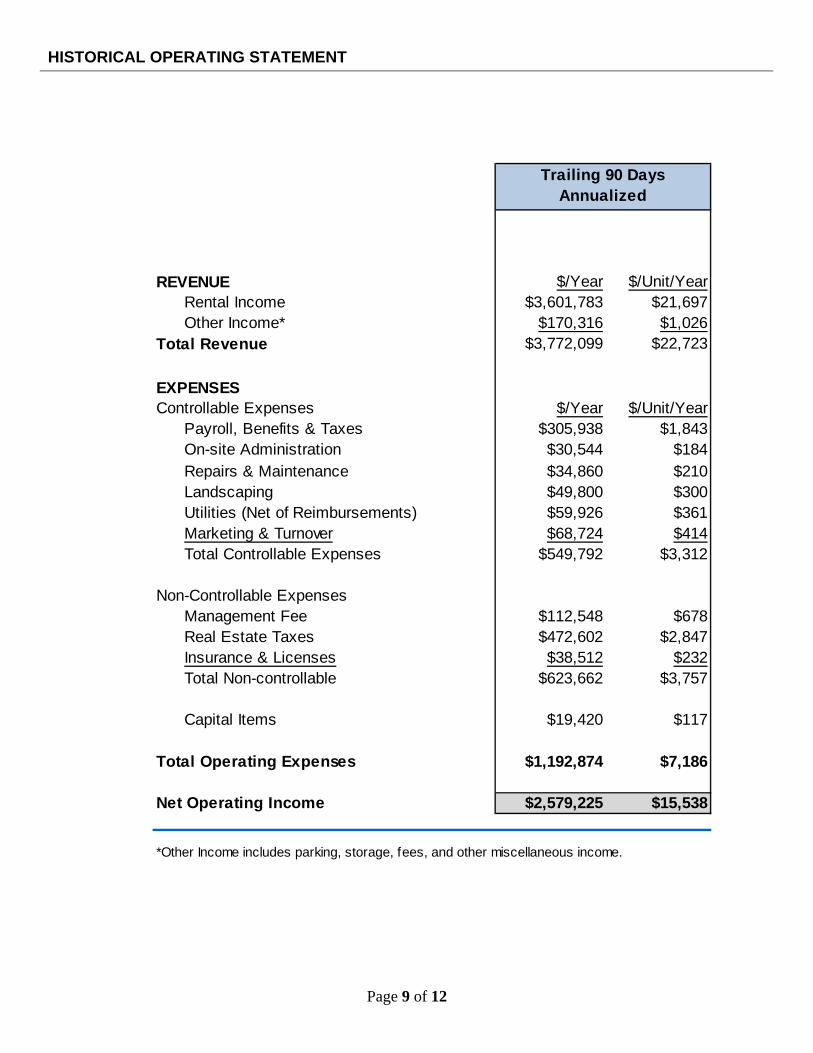
HISTORICAL OPERATING STATEMENT
Location SeattleYear Built N/AREV 166REVENUE $/Year $/Unit/Year
Rental Income $3,601,783 $21,697Other Income* $170,316 $1,026
Total Revenue $3,772,099 $22,723
EXPENSESControllable Expenses $/Year $/Unit/Year
Payroll, Benefits & Taxes $305,938 $1,843On-site Administration $30,544 $184Repairs & Maintenance $34,860 $210Landscaping $49,800 $300Utilities (Net of Reimbursements) $59,926 $361Marketing & Turnover $68,724 $414Total Controllable Expenses $549,792 $3,312
Non-Controllable ExpensesManagement Fee $112,548 $678Real Estate Taxes $472,602 $2,847Insurance & Licenses $38,512 $232Total Non-controllable $623,662 $3,757
Capital Items $19,420 $117
Total Operating Expenses $1,192,874 $7,186
Net Operating Income $2,579,225 $15,538
Trailing 90 Days Annualized
*Other Income includes parking, storage, fees, and other miscellaneous income.
Page 10 of 12
RENT COMPARABLES
YearBuilt
TotalUnits
Avg. Unit Size
Rentper Unit
RentPSF
Studio 1 BR 2 BR % Leased Concessions Comments
36% 42% 20%
540 SF 743 SF 1,026 SF
$1,730 $2,010 $2,612
$3.20 $2.71 $2.55
26% 46% 29%
500 SF 741 SF 1,106 SF
$1,505 $2,020 $2,663
$3.01 $2.73 $2.42
22% 55% 23%
538 SF 763 SF 1,020 SF
$1,800 $1,945 $2,600
$2.85 $2.55 $2.70
21% 45% 34%
547 SF 749 SF 1,227 SF
$1,295 $1,715 $2,520
$2.37 $2.29 $2.05
8% 62% 29%
509 SF 758 SF 963 SF
$1,500 $1,800 $2,147
$2.95 $2.37 $2.23
Average (excluding subject) 805 SF $1,981 $2.50 19% 52% 29%
525 SF 754 SF 1,088 SF
$1,538 $1,870 $2,481
$2.79 $2.48 $2.32
- Comparable location. Comparable product.2008 None
None
- Currently in lease-up, absorption averaging 25 units/month. Rent shown net of concessions.- Superior location. Comparable product.
1 Month
2013
Comp #4 260
287
265
Comp #2 2014
Comp #3 2013
93%
$2,064
797 SF $1,876 $2.38 95%
869 SF $1,901 $2.23 99%
773 SF $2.67 80%
Subject
Comp #1 2009 268 784 SF
708 SF $1,980 $2.80 95%
$2,072 $2.71- Superior location. Comparable Product.
None
None93%
166Subject
- Comparable location. Inferior product.
Page 11 of 12
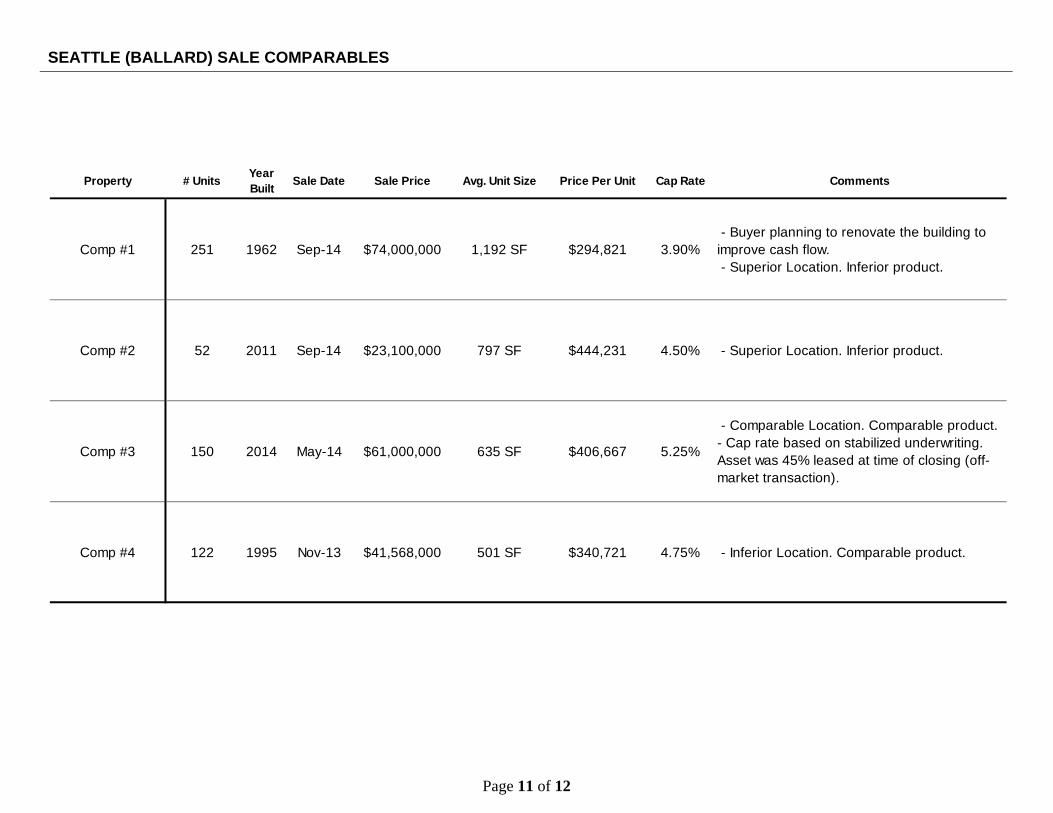
SEATTLE (BALLARD) SALE COMPARABLES
Property # UnitsYear Built
Sale Date Sale Price Avg. Unit Size Price Per Unit Cap Rate Comments
Comp #1 251 1962 Sep-14 $74,000,000 1,192 SF $294,821 3.90% - Buyer planning to renovate the building to improve cash flow. - Superior Location. Inferior product.
Comp #2 52 2011 Sep-14 $23,100,000 797 SF $444,231 4.50% - Superior Location. Inferior product.
Comp #3 150 2014 May-14 $61,000,000 635 SF $406,667 5.25%
- Comparable Location. Comparable product.- Cap rate based on stabilized underwriting. Asset was 45% leased at time of closing (off-market transaction).
Comp #4 122 1995 Nov-13 $41,568,000 501 SF $340,721 4.75% - Inferior Location. Comparable product.
Page 12 of 12
DEMOGRAPHICS