Embed Size (px)
Citation preview

For comments, suggestions or further inquiries please contact:
Philippine Institute for Development StudiesSurian sa mga Pag-aaral Pangkaunlaran ng Pilipinas
The PIDS Discussion Paper Seriesconstitutes studies that are preliminary andsubject to further revisions. They are be-ing circulated in a limited number of cop-ies only for purposes of soliciting com-ments and suggestions for further refine-ments. The studies under the Series areunedited and unreviewed.
The views and opinions expressedare those of the author(s) and do not neces-sarily reflect those of the Institute.
Not for quotation without permissionfrom the author(s) and the Institute.
The Research Information Staff, Philippine Institute for Development Studies5th Floor, NEDA sa Makati Building, 106 Amorsolo Street, Legaspi Village, Makati City, PhilippinesTel Nos: (63-2) 8942584 and 8935705; Fax No: (63-2) 8939589; E-mail: [email protected]
Or visit our website at http://www.pids.gov.ph
December 2011
DISCUSSION PAPER SERIES NO. 2011-38
Gilberto M. Llanto
Investing in Local Roadsfor Economic Growth

1
Abstract
Local road investments work for growth and poverty reduction in local areas. The
paper highlights the importance of investing in local roads and directs attention to the
critical role of local government units (LGUs) in improving the local road network.
Raising additional monies to fund local roads is only partly a solution. Much more will
depend on the quality and strength of governance and adherence to good planning,
budgeting, and procurement practices in the national government and local government
units. This paper identifies what local government units can do to improve local road
networks.
Key words: road network, transport infrastructure, logistics, fiscal capacity, local
governments

2
Investing in Local Roads for Economic Growth
Gilberto M. Llanto1
Introduction
Recent literature has documented the critical role played by efficient transport
and logistics in trade facilitation and growth.2 The World Bank (2010) stresses that
efficient transport and logistics performance is essential for countries to compete in the
global marketplace as traders need to be able to move goods and services across
borders on time and with low transaction costs. The ability of countries to participate in
global and regional production and distribution networks depends a great deal on
efficient transport and logistics infrastructure.
In the Philippines Kimura and Maeda (2005) regard unreliable and inadequate
infrastructure to be a major impediment for economic growth. While neighboring
countries have made substantial investments in transport infrastructure and logistics
services to become significant players in global markets, the Philippines has lagged
behind. Kimura and Maeda pointed out that poor road condition in the Philippines is one
of the major concerns in order to effectively utilizing globalization forces for economic
development3. For example, major transport and logistical bottlenecks have hampered
the export of agricultural commodities from Mindanao,4 namely:
1 Senior Research Fellow, Philippine Institute for Development Studies. The author thanks Larraine Zafe, PIDS for her invaluable research assistance on data and figures reported in the paper. The usual disclaimer applies: the views expressed in the paper are solely the responsibility of the author. 2 X. Clark, D. Dollar, and A. Micco, Port Efficiency, Maritime Transport Costs, and Bilateral Trade, NBER Working Paper 10353 (Cambridge: National Bureau of Economic Research, 2004). 3 Kimura, Fukunari and MItsuhiro Maeda (2005), “Transport Development in Japan and Korea: Drawing Lessons for the Philippines,” November http://www.bnm.gov.my/microsites/rcicc/papers/s5.kimura.pdf (date accessed November 10, 2011) 4 J. Arnold and T. Villareal, Philippines Logistics Study (World Bank, 2002).

3
Limited market information available to farmers and traders, arising from poor
telecommunications facilities;
Limited transport services in rural areas, where locally manufactured ‘jeepneys’
and animal-drawn carts carry produce over bad rural roads;
Inefficient shipping; and
Onerous government regulations and public monopolies that increase the cost of
interisland transport.
Exporting countries, which have been able to effectively address both border
(e.g., tariffs) and behind border issues (e.g., transport and logistics), have been able to
exploit new and bigger markets opened by globalization and trade liberalization. New
opportunities in the global markets require an intensified focus on making transport and
logistics much more efficient.
The Philippines has recently made a relatively significant improvement in
transport and logistics performance as shown in Table 1. It is currently ranked 44th out
of 155 countries in logistics performance, which is an improvement over its 65th rank in
2007. While this performance is certainly an achievement, it pales, however, in
comparison with those of neighboring ASEAN countries such as Malaysia and Thailand.
If the Philippines wants to exploit opportunities in global markets, it has to do better and
continue to improve transport and logistics infrastructure.
Table 1. Comparative logistics performance index, East Asia, 2007 and 2010 Country 2010 LPI Rank 2010 LPI Score 2007 LPI Rank 2007 LPI Score
Singapore 2 4.09 1 4.19 Japan 7 3.97 6 4.02 China 27 3.49 30 3.32 Malaysia 29 3.44 27 3.48 Thailand 35 3.29 31 3.31 Philippines 44 3.14 65 2.69 Vietnam 53 2.96 53 2.89 Indonesia 75 2.76 43 3.01
Memo Item Germany:
rank 1 4.11 Singapore:
rank 1 4.19 Source: World Bank (2010)

4
An important dimension of transport infrastructure is the network of roads that
provide a physical link to various communities in urban and rural areas with outside
markets. A good network of roads at the local level is indispensable in the timely
movement of people and transport of goods with low transaction costs. Good local road
infrastructure is correlated not only with local economic growth but also instrumental with
poverty reduction as shown by several studies. In a study of road infrastructure In
Europe and Central Asia, Shepherd and Wilson (2006) found that improved road
network quality is robustly associated with higher intraregional trade flows. Their
simulations using a gravity model suggest that an ambitious but feasible road upgrade
could increase trade by 50% over baseline5. In a study of a rural fishing community in
the Philippines characterized by poor transport conditions and poor accessibility to major
markets, Olsson (2008) demonstrated that the improvement of road accessibility leads to
considerable benefits to the community6.
This paper highlights the importance of investing in local roads and directs
attention to the critical role of local government units (LGUs) in improving the local road
network. The importance of investing in local roads cannot be underemphasized and
the 1991 Local Government Code has given local government units that task of
improving road service delivery. This paper identifies what local government units can
do to improve local road networks.
The present situation of local roads
Infrastructure is a driver of sustained growth. Recent studies find that
infrastructure has a positive and significant effect on growth in regional incomes, and
regions with better infrastructure have had higher growth rates.7 An ADB study has
5 Shepherd, Ben and John Wilson (2004). “Road Infrastructure in Europe and Central Asia: Does Network Quality Affect Trade?” World Bank Policy Research Working Paper 4104, December 6 Olsson, J., (2008) “Improved road accessibility and indirect development effects: evidence from rural Philippines, “ Journal of Transport Geography, doi:10.1016/j.jtrangeo.2008.09.001 7 G. Llanto, Infrastructure Development: Experience and Policy Options for the Future (Makati City: Philippine Institute for Development Studies, 2004); L. Basilio and D. Gundaya, The Impact of Collective Public Infrastructure on Regional Income Disparities, unpublished undergraduate thesis (Quezon City: University of the Philippines, School of Economics, 1997).

5
identified the inadequacy of infrastructure as a binding constraint to Philippine growth.8
Those studies found that expensive and unreliable electric supply and inefficient
transport network are the two of most critical constraints economic growth.
Local road investments work for growth and poverty reduction in local areas. An
empirical study finds that investing in road improvements and the construction of high-
quality roads at the regional (local) level, particularly in provinces, municipalities, and
barangays could be more beneficial to the region than investments in the national road
network alone.9 The integration of peripheral areas with the rapidly growing urban nodes
such as San Fernando City (Pampanga), Cabanatuan City (Nueva Ecija), Metro Cebu,
Metro Iloilo, Davao, and General Santos cities, among others, fundamentally depends
on an efficient road network. The link provides rural economic agents with access to
urban markets, technologies, and modern inputs.
Local roads are an important element of the transport network. Table 2 shows
roads divided into national and local roads. There are 29,000 kilometers of national
roads and 172,000 kilometers of local roads based on latest data (2005) made available
by the Department of Public Works and Highways. The bulk of Philippine roads consists
of barangay roads of around 100,000 to 122, 000 kilometers of total local roads and
these are mostly unpaved roads in poor or bad condition. Barangays especially those in
the remote rural and upland areas do not simply have the resources to improve road
surface and condition. Funding for barangay roads come practically from congressional
pork or insertions made by legislators to the General Appropriations Act, taking
advantage of the legislative basis for such insertions, Sections 17 (c) and (f) of the 1991
Local Government Code.
Section 17 (c) allows central government agencies to continue to implement
devolved public works and infrastructure projects and other facilities, programs, and
8 Asian Development Bank (ADB), Philippines: Critical Development Constraints, Country Diagnostic Studies (Mandaluyong City: ADB, 2007); G. Llanto, Infrastructure, Chapter 6 in Diagnosing the Philippine Economy: Toward Inclusive Growth, edited by D. Canlas, M.E. Khan, and J. Zhuang (London: Anthem Press, 2009); G. Llanto, Infrastructure and Regional Growth, Chapter 10 in The Dynamics of Regional Development: the Philippines in East Asia, edited by A. Balisacan and H. Hill (Cheltenham, UK: Edward Elgar, 2007). 9 Llanto (2007) ibid. The national government takes care of constructing national roads while local government units (provinces, cities, and municipalities) are in charge of local roads.
6
services provided these are "funded by the national government under the annual
General Appropriations Act, other special laws, pertinent executive orders, and those
wholly or partially funded from foreign sources." On the other hand, Section 17 (f),
allows the national government or the next higher level of local government unit to
"provide or augment the basic services and facilities assigned to a lower level of local
government unit when such services or facilities are not made available or, if made
available, are inadequate to meet the requirements of its inhabitants.10"
In terms of road density the National Capital Region (NCR) has 7.3 kilometers of
roads per square kilometer of land area whereas Northern Mindanao, the region with the
second highest road density, has only 1.2 kilometers. Caraga has the lowest road
density per square kilometer. Higher income local government units are better able to
provide the road network needed in the local areas. Poor local government units cannot
simply provide the necessary road network of sufficient quality and capacity in their
respective areas. It is a question of both lack of adequate resources to fund road
construction, rehabilitation and maintenance and weak technical and administrative
capacity for road planning, programming and budgeting.
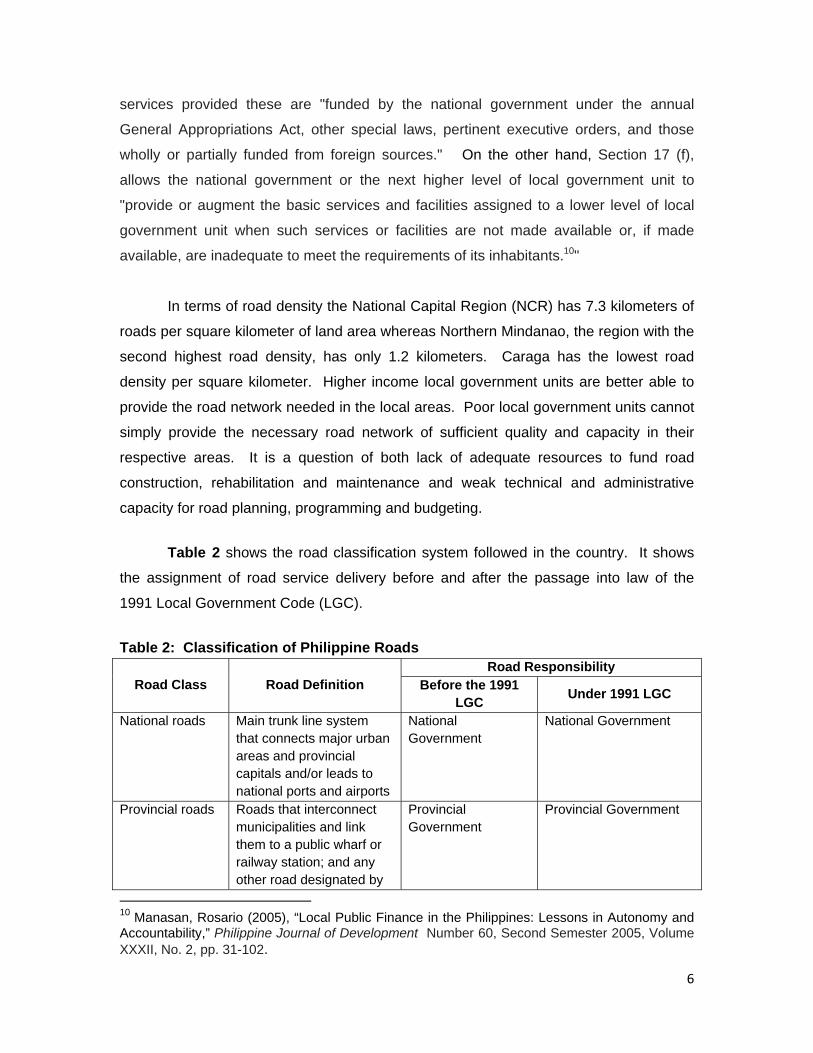
Table 2 shows the road classification system followed in the country. It shows
the assignment of road service delivery before and after the passage into law of the
1991 Local Government Code (LGC).
Table 2: Classification of Philippine Roads
Road Class Road Definition Road Responsibility
Before the 1991 LGC
Under 1991 LGC
National roads Main trunk line system that connects major urban areas and provincial capitals and/or leads to national ports and airports
National Government
National Government
Provincial roads Roads that interconnect municipalities and link them to a public wharf or railway station; and any other road designated by
Provincial Government
Provincial Government
10 Manasan, Rosario (2005), “Local Public Finance in the Philippines: Lessons in Autonomy and Accountability,” Philippine Journal of Development Number 60, Second Semester 2005, Volume XXXII, No. 2, pp. 31-102.

7
the Sangguniang Panlalawigan
City roads Roads within the urban areas of cities designated by the Sangguniang Panlungsod
City Government City Government
Municipal roads Roads in the center of municipalities or poblacion (where the municipal hall, plaza, church, etc. are usually located) designated by the Sangguniang Bayan
Municipal Government
Municipal Government
Barangay roads Roads outside the urban, industrial, commercial or residential areas of cities and municipalities, and link farms to markets
National Government (primarily DPWH)
Barangays for their maintenance Unclear responsibility for their construction and improvement
National Aid roads
Local roads with full or partial funding from the national government
National Government and/or Local Government
None (abolished in 1992)
Source: DPWH
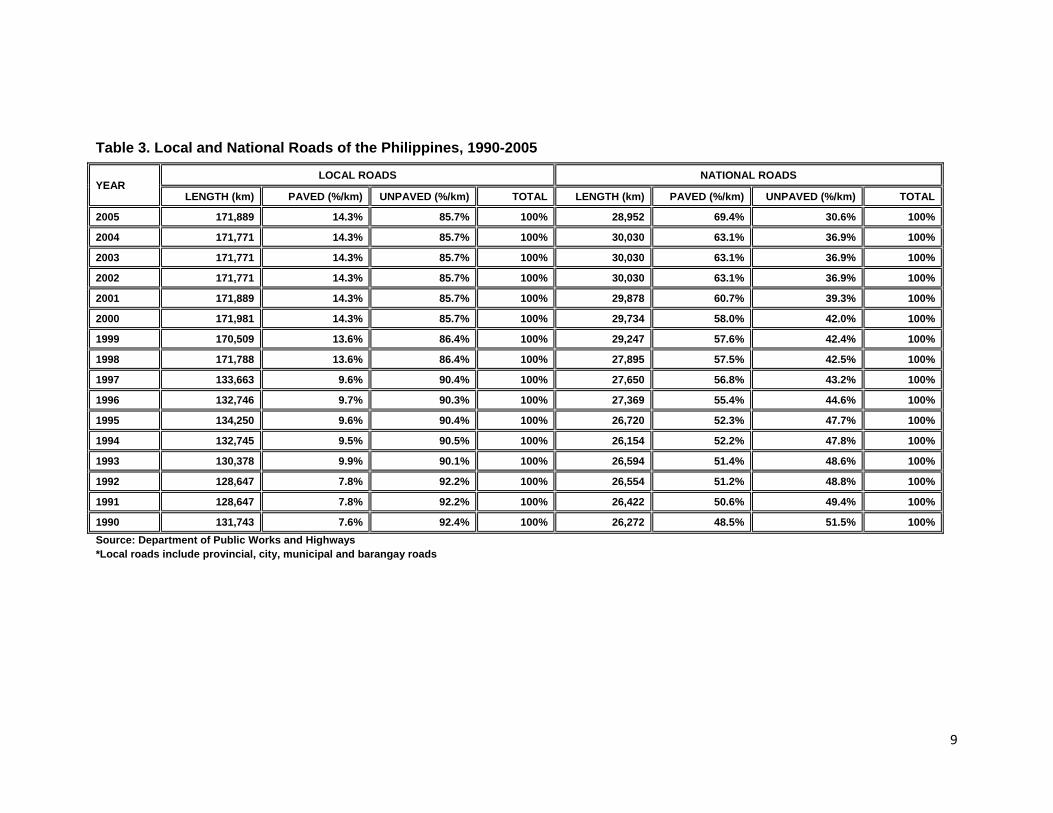
To have an efficient road network, there is a need to invest in good quality local
roads. In terms of road quality, 69 percent of national roads are paved in contrast to 14
percent of paved local roads. Almost all (98 percent) roads in the NCR are paved while
only 35 percent of roads in Central Luzon, the next best-off region based on road quality
are paved. The Autonomous Region of Muslim Mindanao (ARMM) has the lowest paved
road ratio11. The situation on road quality is shown in Figure 1, and Tables 3 and 4.
Among local governments, available data indicate that cities consistently have
better quality roads than provinces. This may be due to the fact that cities have much
more revenue sources (IRA and local own source taxes) than provinces and are thus,
better able to repair, rehabilitate and maintain the quality of their roads. Table 5
classifies local roads according to surface type (paved vs. unpaved) and condition (good,
fair, poor, bad). Local city roads are mostly paved and in fair condition while provinces
11 The table provided by DILG shows that in 2010, around 98 percent of NCR roads are on “unknown” quality, that is, it is not known whether these are paved or not paved. I think this is a clerical error. What the table wants to report perhaps is that around 98 percent of NCR roads are paved roads. Please see my comment below on the need for a good road inventory database.

8
have more unpaved roads which are reported to be in fair condition. It seems
contradictory to say that unpaved roads are in fair condition because by international
standards, unpaved roads are of poor quality and easily deteriorate, which increases the
transaction costs of economic agents.
Based on limited available data the general conclusion one can make is that local
roads are generally of poor quality and condition. This is indicative of the inability of local
government units to maintain local roads, which hampers local growth and development.
A severe underinvestment in good quality roads has certainly contributed to the high
cost of doing business in the country.
9
Table 3. Local and National Roads of the Philippines, 1990-2005
Source: Department of Public Works and Highways *Local roads include provincial, city, municipal and barangay roads
YEAR LOCAL ROADS NATIONAL ROADS
LENGTH (km) PAVED (%/km) UNPAVED (%/km) TOTAL LENGTH (km) PAVED (%/km) UNPAVED (%/km) TOTAL
2005 171,889 14.3% 85.7% 100% 28,952 69.4% 30.6% 100%
2004 171,771 14.3% 85.7% 100% 30,030 63.1% 36.9% 100%
2003 171,771 14.3% 85.7% 100% 30,030 63.1% 36.9% 100%
2002 171,771 14.3% 85.7% 100% 30,030 63.1% 36.9% 100%
2001 171,889 14.3% 85.7% 100% 29,878 60.7% 39.3% 100%
2000 171,981 14.3% 85.7% 100% 29,734 58.0% 42.0% 100%
1999 170,509 13.6% 86.4% 100% 29,247 57.6% 42.4% 100%
1998 171,788 13.6% 86.4% 100% 27,895 57.5% 42.5% 100%
1997 133,663 9.6% 90.4% 100% 27,650 56.8% 43.2% 100%
1996 132,746 9.7% 90.3% 100% 27,369 55.4% 44.6% 100%
1995 134,250 9.6% 90.4% 100% 26,720 52.3% 47.7% 100%
1994 132,745 9.5% 90.5% 100% 26,154 52.2% 47.8% 100%
1993 130,378 9.9% 90.1% 100% 26,594 51.4% 48.6% 100%
1992 128,647 7.8% 92.2% 100% 26,554 51.2% 48.8% 100%
1991 128,647 7.8% 92.2% 100% 26,422 50.6% 49.4% 100%
1990 131,743 7.6% 92.4% 100% 26,272 48.5% 51.5% 100%

10

11
Table 4. Provincial and City Roads by Region, 2006
CITY ROADS PROVINCIAL ROADS GRDP (million)
POVERTY INCIDENCE LENGTH
(km) PAVED (%/km)
UNPAVED (%/km)
UNKNOWN (%/km)
TOTAL LENGTH (km)
PAVED (%/km)
UNPAVED (%/km)
UNKNOWN (%/km)
TOTAL
PHILIPPINES 11,306.9 29.9% 24.9% 45.2% 100.0% 30,491.7 24.3% 61.0% 14.7% 100.0% 5,980,007 26.4
NCR 3,495.8 9.1% 0.2% 90.8% 100.0% 0.0% 2,244,863 5.4
CAR 142.7 100.0% 0.0% 0.0% 100.0% 1,631.8 19.3% 79.2% 1.6% 100.0% 128,695 23.0
ARMM 28.1 0.0% 0.0% 100.0% 100.0% 1,497.2 24.3% 61.0% 14.8% 100.0% 52,901 42.8
REGION I 443.0 27.3% 23.2% 49.5% 100.0% 1,562.0 65.0% 35.0% 0.0% 100.0% 171,988 26.6
REGION II 207.2 29.5% 4.1% 66.4% 100.0% 1,722.5 20.6% 76.1% 3.3% 100.0% 106,101 20.0
REGION III 803.8 54.7% 19.4% 25.9% 100.0% 2,647.6 58.2% 33.5% 8.3% 100.0% 464,295 15.2
REGION IV-A 282.7 38.2% 0.8% 60.9% 100.0% 1,589.6 67.2% 32.6% 0.2% 100.0% 693,876 12.3
REGION IV-B 254.7 48.8% 51.2% 0.0% 100.0% 2,585.5 18.0% 73.2% 8.8% 100.0% 123,584 42.2
REGION V 225.5 47.5% 14.5% 38.0% 100.0% 1,734.5 45.9% 50.8% 3.3% 100.0% 148,019 45.2
REGION VI 1,839.8 47.4% 51.9% 0.7% 100.0% 2,044.0 15.1% 65.5% 19.4% 100.0% 396,370 28.6
REGION VII 551.8 66.3% 26.8% 6.9% 100.0% 2,822.1 24.7% 73.6% 1.7% 100.0% 416,917 38.8
REGION VIII 490.1 34.7% 62.2% 3.1% 100.0% 1,566.8 17.1% 46.0% 36.9% 100.0% 137,380 39.0
REGION IX 180.3 28.5% 54.0% 17.5% 100.0% 1,516.3 7.2% 83.9% 9.0% 100.0% 134,892 39.8
REGION X 834.5 15.3% 9.0% 75.7% 100.0% 1,742.3 8.6% 91.5% 0.0% 100.1% 277,011 39.7
REGION XI 706.6 18.1% 57.3% 24.6% 100.0% 2,695.9 3.9% 67.3% 28.9% 100.0% 263,710 31.7
REGION XII 671.1 25.2% 52.2% 22.6% 100.0% 1,967.8 0.9% 42.4% 56.8% 100.0% 195,534 33.1
REGION XIII 149.3 54.0% 26.4% 19.6% 100.0% 1,165.9 10.6% 88.8% 0.5% 100.0% 76,773 44.0 Source: Department of Interior and Local Government

12
Table 5. Provincial and City Roads by Surface Type and Condition: 2006-2010 (%) 2010 2009 2008 2007 2006 2005
CITY PROVINCIAL CITY PROVINCIAL CITY PROVINCIAL CITY PROVINCIAL CITY PROVINCIAL CITY PROVINCIAL
LENGTH (kms.) 13,325.2 30,962.9 14,810.4 30,924.8 14,778.4 31,198.1 14,778.4 31,198.1 11,306.9 30,491.7 10,093.7 30,483.6
ROAD DENSITY
0.487 0.108 0.518 0.107 0.599 0.108 0.683 0.11 0.11 0.11
SURFACE TYPE
PAVED 62.0% 28.8% 61.7% 30.2% 60.7% 28.4% 60.4% 28.4% 29.9% 24.3% 18.0% 20.9%
UNPAVED 35.0% 70.9% 35.8% 69.4% 36.8% 70.1% 37.2% 70.1% 24.9% 60.9% 15.0% 56.4%
UNKNOWN 3.0% 0.4% 2.5% 0.4% 2.5% 1.5% 2.5% 1.5% 45.2% 14.7% 67.0% 22.6%
TOTAL 100.0% 100.0% 100.0% 100.0% 100.0% 100.0% 100.0% 100.0% 100.0% 100.0% 100.0% 100.0%
SURFACE CONDITION
GOOD 23.6% 16.5% 22.0% 16.4% 20.9% 18.4% 20.9% 18.4% 11.8% 13.2% 9.5% 12.0%
FAIR 30.9% 49.3% 32.6% 47.3% 32.4% 46.1% 32.4% 46.1% 16.5% 41.6% 9.2% 40.9%
POOR 10.1% 14.6% 10.0% 15.3% 10.2% 16.3% 10.2% 16.3% 7.3% 13.5% 3.9% 11.4%
BAD 6.6% 5.2% 6.1% 5.7% 6.4% 5.0% 6.4% 5.0% 3.9% 4.3% 2.5% 5.5%
NO ASSESSMENT
28.8% 14.3% 29.3% 15.3% 30.2% 14.3% 30.2% 14.3% 60.6% 27.4% 74.8% 30.2%
TOTAL 100.0% 100.0% 100.0% 100.0% 100.0% 100.0% 100.0% 100.0% 100.0% 100.0% 100.0% 100.0%
Source: Department of Interior and Local Government

13
An acute underinvestment in good quality local roads
There has been an acute underinvestment in good quality local roads. Compared
with investments in other devolved activities and sectors, local government investments
in infrastructure have remained insignificant. Local governments allocate the biggest
portion of their budgets to general public services. General public services are basically
for general administration needed for the daily routine of running a local government. It
can be safely assumed that most of local expenditure goes to pay for the wages and
salaries of local government officials and personnel. Expenditure for economic services
follows as the second biggest item of expense. There is a need to review local public
expenditure management for more efficient allocation of resources. It seems that there
is a relatively low spending for investment in human capital (education, health and
nutrition) and infrastructure, including local roads, relative to other expenditure items12.
Table 6 disaggregates total expenditure of local government units based on the latest
available data. A finer breakdown of the different expenditure items reported in the table
is not available although one may probably be able to further disaggregate those items if
one has access to data with the Department of Budget and Management.
Table 6. Distribution of Total Expenditure, All LGUs, 2001-2009
2001 2002 2003 2004 2005 2006 2007 2008 2009
EXPENDITURES 100.00 100.00 100.00 100.00 100.00 100.00 100.00 100.00 100.00
General Public Services 40.51 41.34 40.41 40.02 39.63 40.36 41.74 44.14 53.91
Education, Culture & Sports/ Manpower Development 7.09 6.53 6.85 6.61 6.95 6.86 6.53 5.94 6.11
Health, Nutrition & Population Control 11.50 11.72 10.85 10.97 10.18 9.80 9.78 9.76 11.35
Labor and Employment 0.16 0.15 0.12 0.06 0.07 0.07 0.07 0.06 0.07
Housing and Community Development 4.38 4.42 2.40 2.05 2.18 2.05 2.01 2.13 3.28
Social Security /Social Services & Welfare 3.02 2.83 2.57 2.39 2.39 2.35 2.45 2.41 5.16
Economic Services 18.55 16.74 15.76 15.76 15.75 15.04 15.22 15.09 18.55
Debt Service 2.41 2.39 2.87 2.73 3.27 3.21 3.23 3.29 1.59
12 Llanto (2011)

14
Other Purposes 12.37 13.88 18.18 19.42 19.59 20.26 18.97 17.17 0.00
Both national government and LGUs cannot ignore this fact of underinvestment
in maintenance and construction of good quality local roads. Poor road quality,
according to the World Bank, results in intercity freight rates that are 50 percent higher
than in Thailand or Vietnam,13 which is due to the low proportion of paved roads, the low
proportion of roads in good or fair condition, and how they function as a network.14
What explains the underinvestment in local roads?
Several factors may help understand why there has been an underinvestment in
quality local roads.
Weak local capacity for planning and budgeting. Under the Local Government Code,
local government units have full responsibility for road service delivery. This means
developing and maintaining local roads, which are not easy tasks in view of technical
and managerial limitations in many local government units. Planning, programming,
financing and implementing local road projects, which compete with other local
development initiatives for technical and financial resources, are not easy tasks.
However, it is generally noted that many local government units do not have the
capacity to plan and implement a local roads construction, rehabilitation and
maintenance program. Such a program requires technical and managerial capacity
for developing a local road network plan, local roads design standards, local roads
maintenance schedule and cost standards, and mechanisms for allocating resources
and prioritizing road maintenance projects, etc. This may not be a problem with
highly urbanized cities or high-income class local government units but it will be a
13 World Bank, Philippines Transport for Growth: an Institutional Assessment of Transport Infrastructure, Report No.
47281-PH (2009).
14 See World Bank (2009), ibid., which states that the key questions in transport infrastructure are not about the number
of facilities but their effective capacity, the quality of services they can provide, their location, and how they work as a
network (p.11).

15
significant issue for many provinces and municipalities belonging to the lower income
category.
Lack of a good local road inventory. Sound planning depends on a good database15.
There is need for a first-rate, good quality road data base but there is no updated
and accurate database on road surface and condition, road function, traffic volume,
reports of road accidents, geometric and structural standards, and other related
information, which weakens planning of local road projects. ADB (2003) indicates
that geometric standards for roads will vary depending on the nature of the terrain
through which the road is constructed and also on the types of materials used in the
construction of road embankments and/or cuttings. The standards currently used for
roads in the Philippines are those given under the DPWH Design Guidelines Criteria
and Standards for Public Works and Highways16. Incorporating information such as
this and other information in a comprehensive road inventory database is a massive
task for many local governments that lack technical and financial resources.
The present data base of DILG has information on road surface and condition only
for cities and provinces, which constitute only roughly one fourth of total local roads.
In 2006, DILG reported that around 45 percent of city roads and 15 percent of
provincial roads are of “unknown” quality. There seems to be better information in
2010 when it was reported that only 3 percent of city roads and 0.4 percent of
provincial roads were of unknown quality. Doing surveys of rural road conditions
need not necessarily be expensive for local government units if there is good
coordination with DPWH and DILG. The Department of Public Works and Highway
(DPWH) and the Department of the Interior and Local Government (DILG) must work
with local government units in building a good data base of all roads in the country,
national and local for efficient planning, programming and budgeting purposes.
Because of limited resources, coordination and cooperation among these agencies
and local government units will be essential.
15 Asian Development Bank (2003). “Rural Roads Development Policy Framework Philippines- T.A. 3805,” Final Report, November. 16 ADB (2003), page 8.

16
Weak local fiscal capacity. Local government units can draw from local own-source
revenues, intergovernmental fiscal transfer, basically the Internal Revenue Allotment
(IRA), and the Road Fund to fund local roads. Cities are better off than provinces
and municipalities because they effectively have a bigger share of the IRA, and more
importantly, they can levy more productive taxes and have more buoyant tax bases
than provinces and cities do have. The majority of local government units that is,
provinces and municipalities have narrower tax bases and thus, do not raise
proportionately as much in own-source revenues. Cities derived about 52 percent of
their revenues from own sources in 2009, compared with only about 20 percent for
municipalities and provinces. The latter have remained dependent on fiscal transfers,
principally the internal revenue allotment (IRA), for funding local development
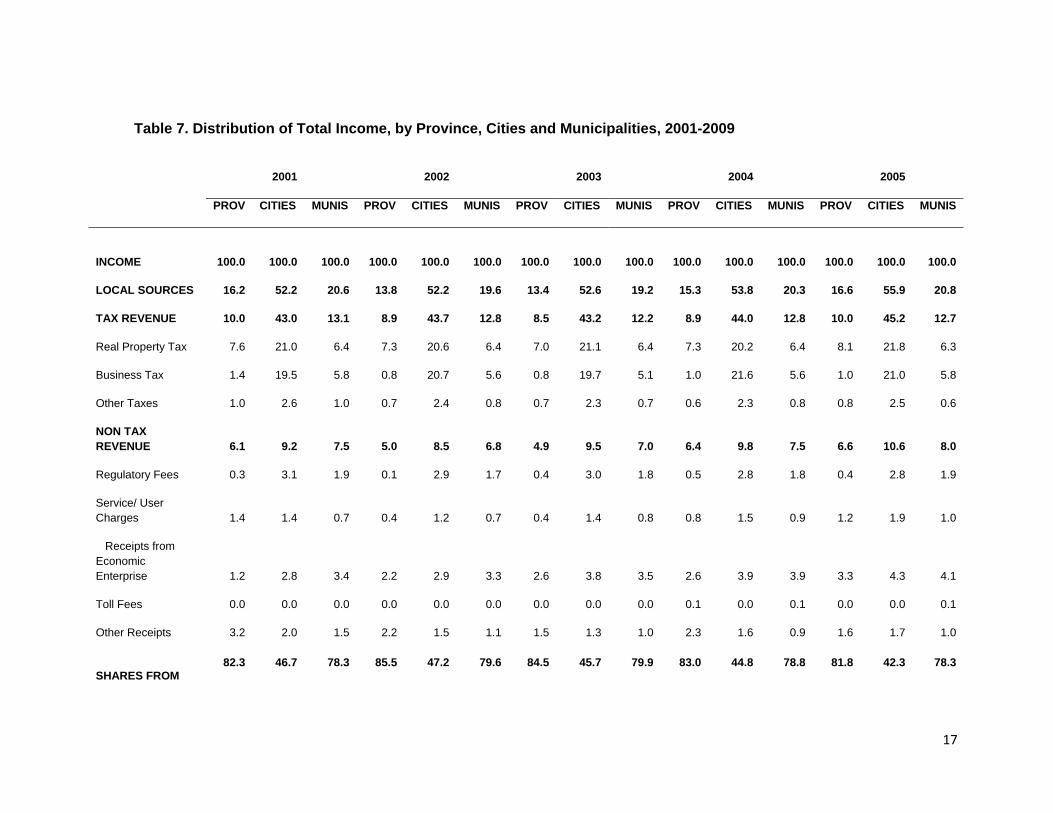
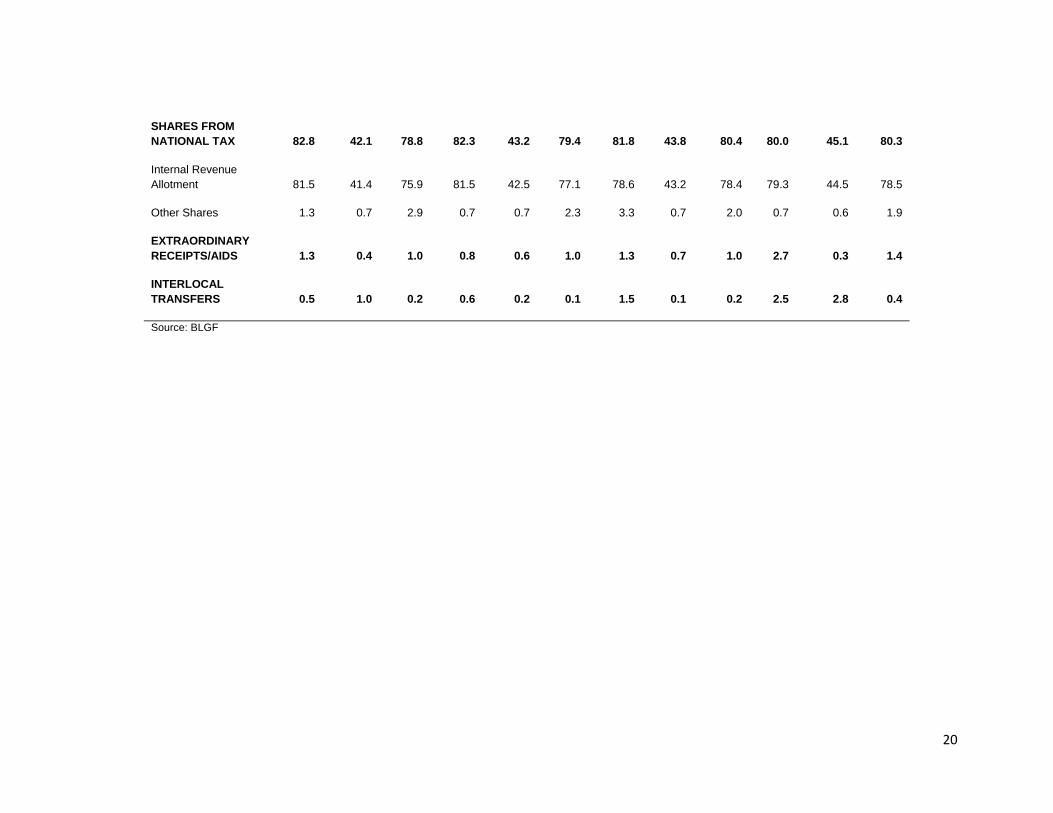
activities17. Weak local fiscal capacity has hamstrung the provision of good quality
roads. Table 7 disaggregates total annual revenue income by level of local
government.
17 Llanto, Gilberto M. (2011). “Fiscal Decentralization in the Philippines: Status and Emerging Policy Issues” UN-HABITAT, Nairobi, Kenya, October
17
Table 7. Distribution of Total Income, by Province, Cities and Municipalities, 2001-2009
2001 2002 2003 2004 2005
PROV CITIES MUNIS PROV CITIES MUNIS PROV CITIES MUNIS PROV CITIES MUNIS PROV CITIES MUNIS
INCOME 100.0 100.0 100.0 100.0 100.0 100.0 100.0 100.0 100.0 100.0 100.0 100.0 100.0 100.0 100.0
LOCAL SOURCES 16.2 52.2 20.6 13.8 52.2 19.6 13.4 52.6 19.2 15.3 53.8 20.3 16.6 55.9 20.8
TAX REVENUE 10.0 43.0 13.1 8.9 43.7 12.8 8.5 43.2 12.2 8.9 44.0 12.8 10.0 45.2 12.7
Real Property Tax 7.6 21.0 6.4 7.3 20.6 6.4 7.0 21.1 6.4 7.3 20.2 6.4 8.1 21.8 6.3
Business Tax 1.4 19.5 5.8 0.8 20.7 5.6 0.8 19.7 5.1 1.0 21.6 5.6 1.0 21.0 5.8
Other Taxes 1.0 2.6 1.0 0.7 2.4 0.8 0.7 2.3 0.7 0.6 2.3 0.8 0.8 2.5 0.6
NON TAX REVENUE 6.1 9.2 7.5 5.0 8.5 6.8 4.9 9.5 7.0 6.4 9.8 7.5 6.6 10.6 8.0
Regulatory Fees 0.3 3.1 1.9 0.1 2.9 1.7 0.4 3.0 1.8 0.5 2.8 1.8 0.4 2.8 1.9
Service/ User Charges 1.4 1.4 0.7 0.4 1.2 0.7 0.4 1.4 0.8 0.8 1.5 0.9 1.2 1.9 1.0
Receipts from Economic Enterprise 1.2 2.8 3.4 2.2 2.9 3.3 2.6 3.8 3.5 2.6 3.9 3.9 3.3 4.3 4.1
Toll Fees 0.0 0.0 0.0 0.0 0.0 0.0 0.0 0.0 0.0 0.1 0.0 0.1 0.0 0.0 0.1
Other Receipts 3.2 2.0 1.5 2.2 1.5 1.1 1.5 1.3 1.0 2.3 1.6 0.9 1.6 1.7 1.0
SHARES FROM 82.3 46.7 78.3 85.5 47.2 79.6 84.5 45.7 79.9 83.0 44.8 78.8 81.8 42.3 78.3

18
NATIONAL TAX
Internal Revenue Allotment 81.1 46.4 77.1 84.8 47.2 79.3 82.3 44.8 78.2 81.9 44.0 76.8 80.1 41.7 75.2
Other Shares 1.2 0.3 1.3 0.7 0.1 0.4 2.2 0.9 1.7 1.1 0.8 2.1 1.7 0.6 3.0
EXTRAORDINARY RECEIPTS/AIDS 0.8 0.8 0.8 0.3 0.3 0.5 0.4 1.7 0.7 0.9 0.3 0.7 0.5 0.7 0.8
INTERLOCAL TRANSFERS 0.7 0.3 0.3 0.3 0.3 0.2 1.7 0.0 0.2 0.8 1.2 0.2 1.1 1.1 0.2
Source: BLGF

19
(Cont..) Table 7. Distribution of Total Income, by Province, Cities and Municipalities, 2001-2009
2006 2007 2008 2009
PROV CITIES MUNIS PROV CITIES MUNIS PROV CITIES MUNIS PROV CITIES MUNIS
INCOME 100.0 100.0 100.0 100.0 100.0 100.0 100.0 100.0 100.0 100.0 100.0 100.0
LOCAL SOURCES 15.3 56.6 19.9 16.4 56.0 19.5 15.4 55.4 18.4 14.9 51.8 17.9
TAX REVENUE 8.5 44.5 12.1 9.0 43.5 11.6 8.7 41.7 10.9 7.7 39.8 10.1
Real Property Tax 6.8 20.8 5.7 7.0 19.8 5.3 6.4 18.5 5.1 6.0 17.0 4.8
Business Tax 1.1 21.3 5.7 1.3 21.3 5.7 1.1 20.6 5.2 0.9 20.7 4.7
Other Taxes 0.7 2.5 0.7 0.7 2.5 0.6 1.2 2.5 0.6 0.7 2.1 0.6
NON TAX REVENUE 6.8 12.0 7.9 7.4 12.5 7.8 6.7 13.7 7.6 7.2 12.0 7.8
Regulatory Fees 0.3 3.1 1.9 0.4 3.3 1.9 0.3 3.1 1.8 0.3 3.0 1.9
Service/ User Charges 1.4 2.1 0.9 1.2 2.1 1.0 1.5 2.1 0.9 2.1 2.0 1.2
Receipts from Economic Enterprise 3.2 4.3 3.8 4.1 4.7 3.9 3.3 4.2 3.7 3.3 4.6 3.7
Toll Fees 0.0 0.0 0.1 0.0 0.0 0.1 0.0 0.0 0.1 0.0 0.0 0.0
Other Receipts 1.8 2.4 1.2 1.6 2.4 1.0 1.5 4.2 1.0 1.5 2.4 1.0
20
SHARES FROM NATIONAL TAX 82.8 42.1 78.8 82.3 43.2 79.4 81.8 43.8 80.4 80.0 45.1 80.3
Internal Revenue Allotment 81.5 41.4 75.9 81.5 42.5 77.1 78.6 43.2 78.4 79.3 44.5 78.5
Other Shares 1.3 0.7 2.9 0.7 0.7 2.3 3.3 0.7 2.0 0.7 0.6 1.9
EXTRAORDINARY RECEIPTS/AIDS 1.3 0.4 1.0 0.8 0.6 1.0 1.3 0.7 1.0 2.7 0.3 1.4
INTERLOCAL TRANSFERS 0.5 1.0 0.2 0.6 0.2 0.1 1.5 0.1 0.2 2.5 2.8 0.4
Source: BLGF
21
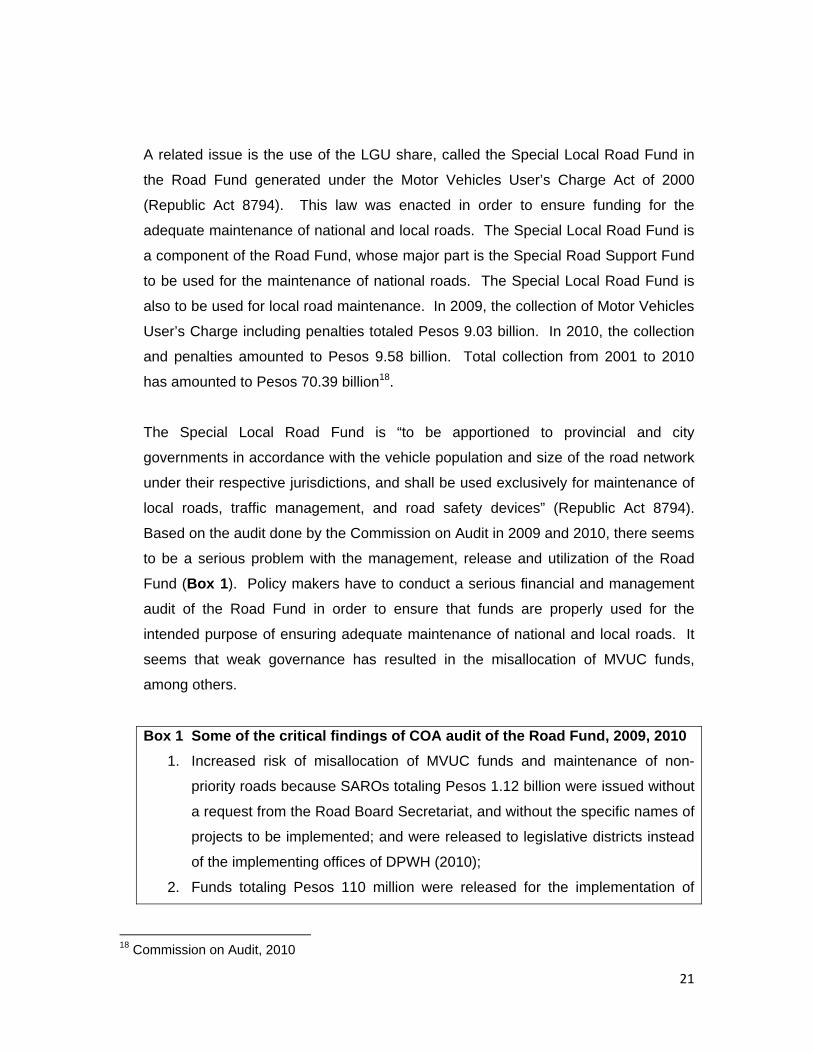
A related issue is the use of the LGU share, called the Special Local Road Fund in
the Road Fund generated under the Motor Vehicles User’s Charge Act of 2000
(Republic Act 8794). This law was enacted in order to ensure funding for the
adequate maintenance of national and local roads. The Special Local Road Fund is
a component of the Road Fund, whose major part is the Special Road Support Fund
to be used for the maintenance of national roads. The Special Local Road Fund is
also to be used for local road maintenance. In 2009, the collection of Motor Vehicles
User’s Charge including penalties totaled Pesos 9.03 billion. In 2010, the collection
and penalties amounted to Pesos 9.58 billion. Total collection from 2001 to 2010
has amounted to Pesos 70.39 billion18.
The Special Local Road Fund is “to be apportioned to provincial and city
governments in accordance with the vehicle population and size of the road network
under their respective jurisdictions, and shall be used exclusively for maintenance of
local roads, traffic management, and road safety devices” (Republic Act 8794).
Based on the audit done by the Commission on Audit in 2009 and 2010, there seems
to be a serious problem with the management, release and utilization of the Road
Fund (Box 1). Policy makers have to conduct a serious financial and management
audit of the Road Fund in order to ensure that funds are properly used for the
intended purpose of ensuring adequate maintenance of national and local roads. It
seems that weak governance has resulted in the misallocation of MVUC funds,
among others.
Box 1 Some of the critical findings of COA audit of the Road Fund, 2009, 2010
1. Increased risk of misallocation of MVUC funds and maintenance of non-
priority roads because SAROs totaling Pesos 1.12 billion were issued without
a request from the Road Board Secretariat, and without the specific names of
projects to be implemented; and were released to legislative districts instead
of the implementing offices of DPWH (2010);
2. Funds totaling Pesos 110 million were released for the implementation of
18 Commission on Audit, 2010

22
projects not approved by the Road Board nor evaluated by the DPWH-RPO
(2010);
3. The distribution/allocation of MVUC funds totaling Pesos 3,84 billion for the
implementation of projects approved by the Road Board was not in
accordance with the Road Board Operating Procedures Manual (RBOPM)
and the IRR of RA 8794 (2010)
4. The distribution/allocation and release of the Special Road Support Fund
totaling Pesos 5.49 billion was not in accordance with the RBOPM; the
amount of Pesos 28.29 million allocated and released to the provinces of
Quezon and Rizal under the SLRF was based on a request of a government
official, and not on the vehicle population and size of the road network as
provided under Section 7 of RA 8794 (2009);
5. Of the 39 prior year’s (2008) audit recommendations for nineteen
observations, six were fully implemented, 21 were partially implemented, and
12 were not implemented (2009);
6. Expenditures totaling Pesos 84.29 million were irregular and contrary to
Section 7 of RA 8794 . . . and expenditures totaling Pesos 40.60 million were
not related to road maintenance and improvement of road drainage (2009);
7. MVUC funds totaling Pesos 360 million were released for 41 preventive
maintenance projects, which were not approved by the Road Board nor
evaluated by the DPWH-RPO contrary to Section 9 of RA 8794 (2009).
Source: Commission on Audit, 2009 and 2010.
Concluding remarks
Investing in quality local road networks requires not only monies but also
importantly strong political will at the national and local levels. Raising additional monies
to fund local roads is only partly a solution. Much more will depend on the quality and
strength of governance and adherence to good planning, budgeting, and procurement
practices in the national government and local government units. There are constraints
to overcome to have good quality roads but they can be hurdled. In this light, the
following recommendations are submitted:

23
Raise more local revenues. Local governments should therefore launch a
vigorous revenue mobilization campaign, which may involve plugging tax leakages,
explaining to the public the cost of local development, e.g., local roads, and raising local
taxes. In particular, the collection efficiency of the real property tax should be improved
starting from a review and adjustment of assessment levels. Real property taxation is an
underutilized source of local revenue in the country in contrast to its being a mainstay of
local finances in more developed countries.
Apart from improving the tax administration machinery, e.g. improve local
property tax collection, there is a need to revisit the taxing powers given to local
government units under the Local Government Code and review the formula for
intergovernmental fiscal transfers.
Use local revenues to produce local public goods that serve the people, not a few
vested groups. People will be convinced to support government efforts to raise revenues
once they experience an improvement in public services, e.g., police protection, good
traffic management, and quality local roads that do not function as parking spaces for
errant jeepneys. However, weak governance and corruption erode the credibility of local
governments, which may face strong resistance to attempts to increase the level of local
taxation. A good example of a serious neglect committed by a local government is its
failure to rid a recently widened street in Quezon City of illegal parking by jeepneys and
tricycles. Local citizens did not pay for said road’s improvement only to have it used by
some groups exclusively for their parking needs. The irony is that the traffic violation is
done in full view of supposedly city traffic “enforcers.” It has also been noted that the
proliferation of informal settlers who illegally occupy both private and government lands
cannot happen without the implicit tolerance by corrupt local government officials.
Improve procurement for local roads. National government and local
governments should coordinate in providing local governments with the capacity for
project identification and development, and improving road construction through
competitive procurement practices.
Ensure that local roads form part of an efficient road network. Key to having an
efficient road network is the planning and coordination of the maintenance and
24
improvement of road networks among concerned government agencies. However,
nothing will come out from the planning and coordination if, as already mentioned, local
governments tolerate the conversion of roads into parking spaces, or when portions of
the road are used as location for micro-businesses (e.g., vulcanizing shops, small
restaurants ) and amusement (e.g., basketball courts right in the middle of several
streets in Metro Manila). Roads should serve the purpose for which they were built—to
ensure on-time and low-transaction costs movement of people, cargo, and general
commerce.
Conduct an audit of past utilization of the Road Funds for more effective and
efficient use. Introduced in 2001, the Motor Vehicle User’s Charge (MVUC) was to be
used for road maintenance, safety, and vehicle pollution control. In the last four years,
the MVUC special fund for national road maintenance has amounted to around Pesos 4
to Pesos 6 billion a year. Going by the high frequency of road accidents in the country,
very poor road maintenance, and the air pollution contributed by thousands of
dilapidated smoke-belching jeepneys and buses that ply the main thoroughfares of
Metro Manila, conducting an honest and intensive audit of the Road Fund is therefore an
important first step toward having good quality roads and transport in the country.19
19 By law, all public and private vehicles have to pass an emissions test conducted by the Land Transportation Office prior
to registration. However, air pollution in Metro Manila, especially EDSA, Taft Avenue, and España Street in Manila is
among the worst in the region courtesy of thousands of smoke-belching jeepneys and buses, which should not have been
allowed on the streets.

25
References
Arnold, J. and T. Villareal (2002) Philippines Logistics Study, Washington D.C., The World Bank
Asian Development Bank (2007), Philippines: Critical Development Constraints, Country Diagnostic Studies, Mandaluyong City: Asian Development Bank
Asian Development Bank (2003). “Rural Roads Development Policy Framework Philippines- T.A. 3805,” Final Report, November.
Basilio, L. and D. Gundaya (1997) “The Impact of Collective Public Infrastructure on Regional Income Disparities”, unpublished undergraduate thesis, Quezon City: University of the Philippines, School of Economics
Clark, X., D. Dollar, and A. Micco (2004) “Port Efficiency, Maritime Transport Costs, and Bilateral Trade,” NBER Working Paper 10353, Cambridge: National Bureau of Economic Research Kimura, Fukunari and MItsuhiro Maeda (2005), “Transport Development in Japan and Korea: Drawing Lessons for the Philippines,” November http://www.bnm.gov.my/microsites/rcicc/papers/s5.kimura.pdf (date accessed November 10, 2011) Llanto, Gilberto M. (2011). “Fiscal Decentralization in the Philippines: Status and Emerging Policy Issues” UN-HABITAT, Nairobi, Kenya, October Llanto, Gilberto M. (2009) “Infrastructure”, Chapter 6 in Diagnosing the Philippine Economy: Toward Inclusive Growth, edited by D. Canlas, M.E. Khan, and J. Zhuang, London: Anthem Press Llanto, Gilberto M. (2007), “Infrastructure and Regional Growth”, Chapter 10 in The Dynamics of Regional Development: the Philippines in East Asia, edited by A. Balisacan and H. Hill, Cheltenham, UK: Edward Elgar Llanto, Gilberto M. (2007) Infrastructure Development: Experience and Policy Options for the Future, Makati City: Philippine Institute for Development Studies Manasan, Rosario (2005), “Local Public Finance in the Philippines: Lessons in Autonomy and Accountability,” Philippine Journal of Development Number 60, Second Semester 2005, Volume XXXII, No. 2, pp. 31-102. Olsson, J., (2008) “Improved Road Accessibility and Indirect Development Effects: Evidence from Rural Philippines,“ Journal of Transport Geography, doi:10.1016/j.jtrangeo.2008.09.001

26
Shepherd, Ben and John Wilson (2004). “Road Infrastructure in Europe and Central Asia: Does Network Quality Affect Trade?” World Bank Policy Research Working Paper 4104, December
World Bank (2009) Philippines Transport for Growth: an Institutional Assessment of Transport Infrastructure, Report No. 47281-PH, Washington D.C.: The World Bank