Embed Size (px)
Citation preview

Investigation of Resource
Monitoring Capabilities of KVM and
OpenStack
Simon A. Balkau
Zurich, Switzerland
Student ID: 09-926-569
Supervisor: Patrick G. Poullie
Date of Submission: May 24, 2015
University of Zurich
Department of Informatics (IFI)
Binzmühlestrasse 14, CH-8050 Zürich, Switzerlandifi
VE
RT
IEF
UN
GS
AR
BE
IT–
Co
mm
un
ica
tio
nS
yste
ms
Gro
up,
Pro
f.D
r.B
urk
ha
rdS
tille
r

Vertiefungsarbeit
Communication Systems Group (CSG)
Department of Informatics (IFI)
University of Zurich
Binzmühlestrasse 14, CH-8050 Zürich, Switzerland
URL: http://www.csg.uzh.ch/

1
Investigation of Resource Monitoring Capabilities of
KVM and OpenStackSimon A. Balkau
Institute for Informatics, University of Zurich
Binzmuehlestrasse 14, CH-8050 Zurich, Switzerland
Abstract—In clouds resources are deployed by virtual
machines (VMs), i.e., if a cloud customer wants to run a
job in a cloud, he starts an according VM that executes
the jobs. In case cloud resources, or rather resources of
a physical machine (PM) in the cloud, become scarce,
elaborated resource reallocation between the PM’s VMs
is necessary to ensure performance goals of VMs. When
reallocating resources it is important to know about the
current consumptions of VMs, in order choose efficiency-
and fairness-optimal reallocations. Therefore this paper
investigates resource monitoring capabilities of the Kernel-
based Virtual Machine (KVM) hypervisor and the Open-
Stack cloud computing software platform, to provide an
essential part of a cloud resource reallocation study.
Keywords—cloud computing, private cloud, measurement,
performance, virtualisation, kvm, ceilometer, OpenStack
I. STRUCTURE OF THE PAPER
The paper first provides a list of resources relevant to
cloud monitoring activities which is defined by resources
that can be shared by customers through a cloud. It
covers inter alia: CPU, RAM, Disk (I/O and capacity),
bandwidth.
Next, the capabilities of Linux monitoring have been ex-
amined, which leads to KVM and its resource monitoring
capabilities. It was investigated which resource can be
monitored with which granularity, which system call is
used to do so, and whether the measurement is possible
on a system/PM level or only done per VM.
Next, these capabilities are mapped to monitoring ca-
pabilities of OpenStack. Since OpenStack’s resource
monitoring component is Ceilometer, the latter was in-
vestigated in more detail. More precisely, it was inves-
tigated, which resources can be monitored in a cloud
that runs OpenStack as orchestration layer and KVM
as its hypervisors. It was concluded on whether certain
monitoring information accessible via KVM can not
be inquired via OpenStack. Also, it was investigated
Thanks to my supervisor Patrick G. Poullie, who is with the De-
partment of Informatics Communication Systems Group, University
of Zurich, Binzmuehlestrasse 14, CH-8050 Zurich, Switzerland
whether OpenStack allows to partition the monitoring
information by user/tenant and whether alarms can be
triggered by OpenStack, if resource overload on a PM
occurs.
II. COMPONENTS OF A CLOUD
The term cloud is today splitted in three different
components, which also can be represented in layers (see
fig. 1). The highest layer is the Software as a Service
(SaaS), which is renting or borrowing an online software.
[1] This is the most known type which many people
sloppy refer as cloud. SaaS are software from web-mail
(Google Gmail, Outlook.com, etc.), CRM (Salesforce,
Microsoft Dynamics CRM, etc.) to full flavored business
collaboration suites (Google Apps for Work, Office 365,
etc.)
Another component, the middle layer, is the Platform
as a Service (PaaS). PaaS brings the benefits that SaaS
bought [sic!] for applications, but over to the software
development world. PaaS can be defined as a computing
platform that allows the creation of web applications
quickly and easily and without the complexity of buying
and maintaining the software and infrastructure under-
neath it. [2, 3]
The last component and lowest layer is the Infrastruc-
ture as a Service (IaaS). IaaS is the foundation of the
two other components and delivers Cloud Computing
infrastructure – servers, storage, network and operating
systems – as an on-demand service. Rather than pur-
chasing servers, software, datacenter space or network
equipment, clients instead buy those resources as a fully
outsourced service on demand. [2, 4]
III. LIST OF RELEVANT RESOURCES TO CLOUD
(IAAS) MONITORING
The fundamental key parts of a IaaS are servers
which consists of processors, RAM and storage. Addi-
tionally bandwidth of the network must not be neglected.
Nonetheless the services which keep up the cloud itself.
These can be monitored in a per server basis (see

2
Fig. 1. Diagram of the components of a cloud
section IV) or over the entire infrastructure (see section
V). Smith and Sommerville [5] tried to predict power
consumption of VMs. The problem behind measuring
power consumption of a VM is that, compared to a PM,
one cannot simple plug in the powercable in a power
meter. Another resource are licenses whether for the
infrastructure operating systems (OSs) or consumer OSs
or anything else which is liable for costs.
IV. LINUX MONITORING
Linux offers built-in and a vast number of third party
monitoring applications. The commonest built-in tools
are top and vmstat. With third party applications as
iostat, iotop, sar and IPTraf the monitoring can
deliver more and detailed data.
A. top
top is a command line tool which prints the current
running processes of the system, the workload of the
CPU, the utilization of the RAM and some other useful
data. In Linux every process has a folder in /proc/
with its corresponding distinct process id. In these folders
Linux kernel provides statistics relevant for the process.
top consolidates these values and present it to the user
in an easy-to-read manner. iotop is a third party tool
to deliver statistics for I/Os per process.
B. vmstat
vmstat displays information about memory, cpu,
disk and block I/O usage of the host.
C. iostat
The iostat command is used for monitoring sys-
tem input/output device load by observing the time the
devices are active in relation to their average transfer
rates. The iostat command generates reports that can
Fig. 2. Screenshot of top on an OpenStack controller.
Fig. 3. Screenshot of vmstat on an OpenStack controller.
be used to change system configuration to better balance
the input/output load between physical disks.[6] A neat
feature is, that subsequent reports display data since the
previous call.
Fig. 4. Screenshot of iostat on an OpenStack controller.
D. sar
sar is used for recording and analyzing of vari-
ous information on system activity. When performance
problems occur sar also allows with the benefit of
hindsight to analyze the load values of different subsys-
tems (CPU, memory, disk, interrupts, network interfaces,
etc.). After installing and configuring sar, sar will
collect system load values and save it for the specified
duration in the configuration. sar will save the logs
in /var/log/sa/sa[d-o-m] while [d-o-m] rep-
resents the day of month of recording.
To display CPU loads of a specific day the command
sar -P ALL -f /var/log/sa/sa12 will display
the CPU load of the 12th day of the month. As has
3
been said one can replace 12 with the desired day of
month. Parameter -f is optional. When it is omitted sar
displays values of the current day. Further the output can
be specified for a timeframe:
• -s [ hh:mm:ss ] sets the start time. When no
time indication is made sar will use 08:00:00 as
begin.
• -e [ hh:mm:ss ] sets the ending time of the
report. When no time indication is made sar will
use 18:00:00 as end.
To display RAM load one can issue sar -r. For
displaying overall I/O sar -b and for block device I/O
sar -d -p and for network interface load sar -n
DEV. [7]
This was only a small subset what sar can deliver.
Beside CPU, RAM, block I/O and network interface load
sar can deliver statistics for memory paging, memory
swapping, interrupts, power management statistics, net-
work statistics about sockets, IPv4, IPv6, TCP, UDP and
many more. [8]
One can see that this tool is a convenient tool for
monitoring, reporting and analyzing. For sar there also
exists graphical representation of collected samples like
sarface. Downside is, that sar only gathers data
system-wide and not per process.
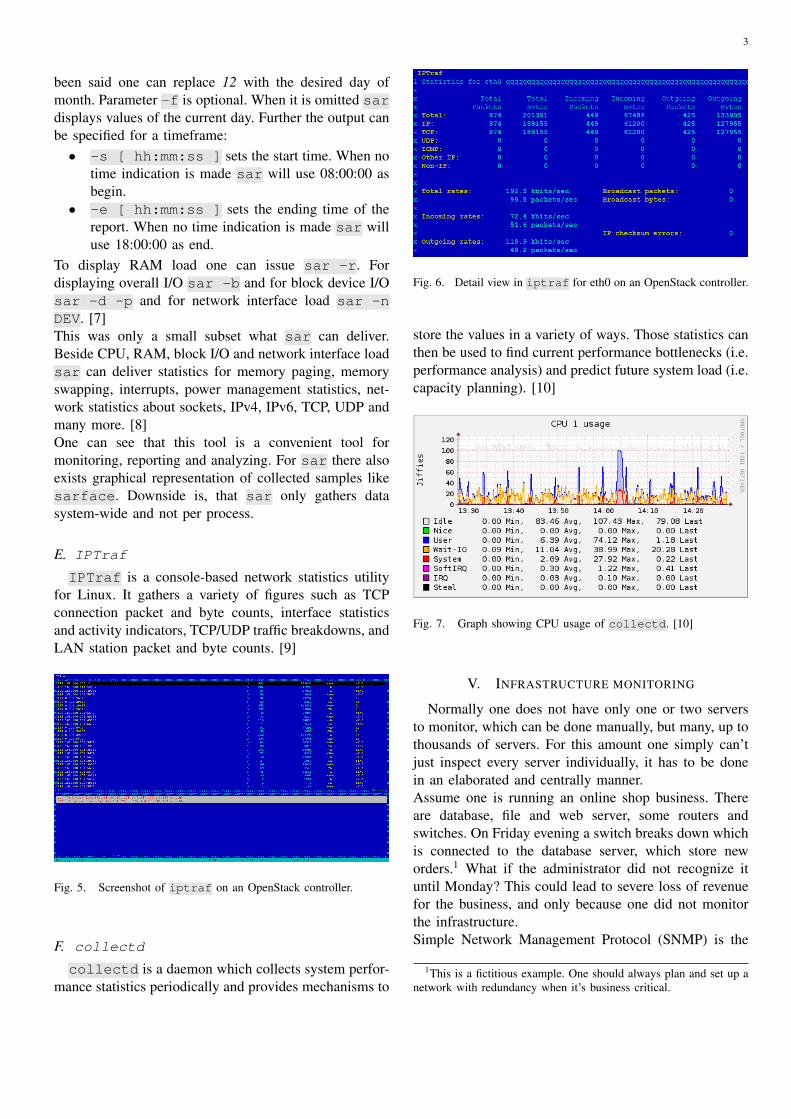
E. IPTraf
IPTraf is a console-based network statistics utility
for Linux. It gathers a variety of figures such as TCP
connection packet and byte counts, interface statistics
and activity indicators, TCP/UDP traffic breakdowns, and
LAN station packet and byte counts. [9]
Fig. 5. Screenshot of iptraf on an OpenStack controller.
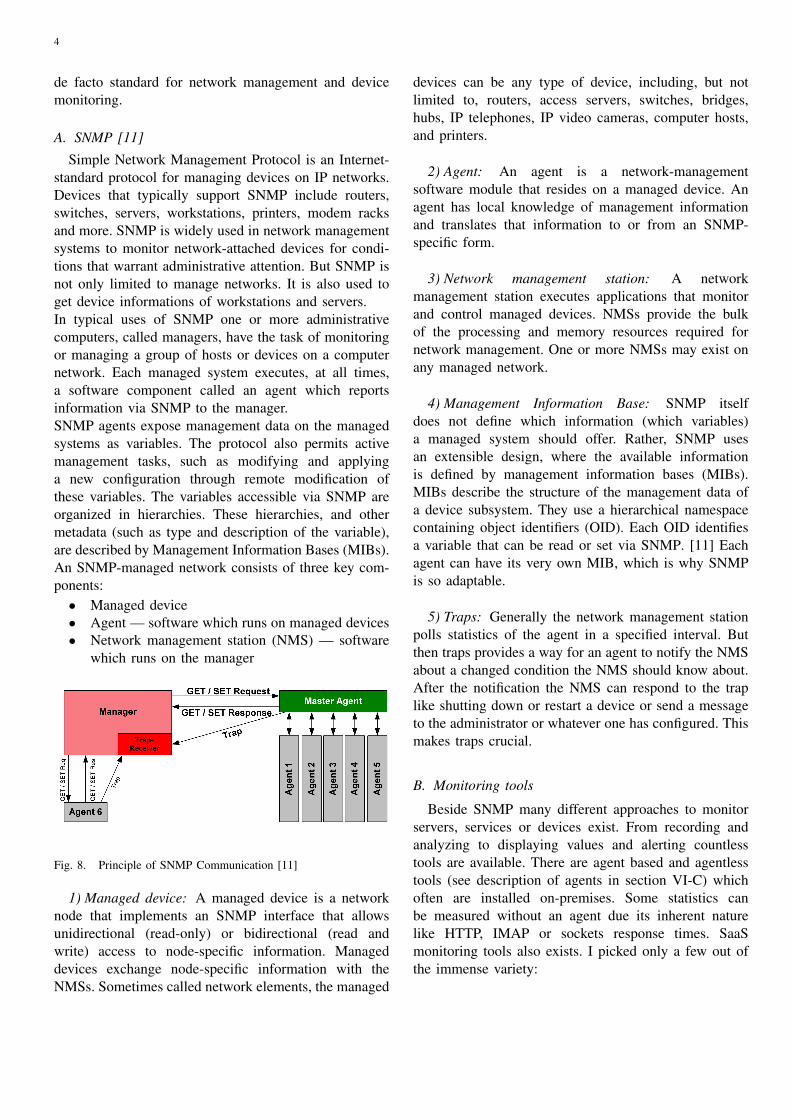
F. collectd
collectd is a daemon which collects system perfor-
mance statistics periodically and provides mechanisms to
Fig. 6. Detail view in iptraf for eth0 on an OpenStack controller.
store the values in a variety of ways. Those statistics can
then be used to find current performance bottlenecks (i.e.
performance analysis) and predict future system load (i.e.
capacity planning). [10]
Fig. 7. Graph showing CPU usage of collectd. [10]
V. INFRASTRUCTURE MONITORING
Normally one does not have only one or two servers
to monitor, which can be done manually, but many, up to
thousands of servers. For this amount one simply can’t
just inspect every server individually, it has to be done
in an elaborated and centrally manner.
Assume one is running an online shop business. There
are database, file and web server, some routers and
switches. On Friday evening a switch breaks down which
is connected to the database server, which store new
orders.1 What if the administrator did not recognize it
until Monday? This could lead to severe loss of revenue
for the business, and only because one did not monitor
the infrastructure.
Simple Network Management Protocol (SNMP) is the
1This is a fictitious example. One should always plan and set up a
network with redundancy when it’s business critical.
4
de facto standard for network management and device
monitoring.
A. SNMP [11]
Simple Network Management Protocol is an Internet-
standard protocol for managing devices on IP networks.
Devices that typically support SNMP include routers,
switches, servers, workstations, printers, modem racks
and more. SNMP is widely used in network management
systems to monitor network-attached devices for condi-
tions that warrant administrative attention. But SNMP is
not only limited to manage networks. It is also used to
get device informations of workstations and servers.
In typical uses of SNMP one or more administrative
computers, called managers, have the task of monitoring
or managing a group of hosts or devices on a computer
network. Each managed system executes, at all times,
a software component called an agent which reports
information via SNMP to the manager.
SNMP agents expose management data on the managed
systems as variables. The protocol also permits active
management tasks, such as modifying and applying
a new configuration through remote modification of
these variables. The variables accessible via SNMP are
organized in hierarchies. These hierarchies, and other
metadata (such as type and description of the variable),
are described by Management Information Bases (MIBs).
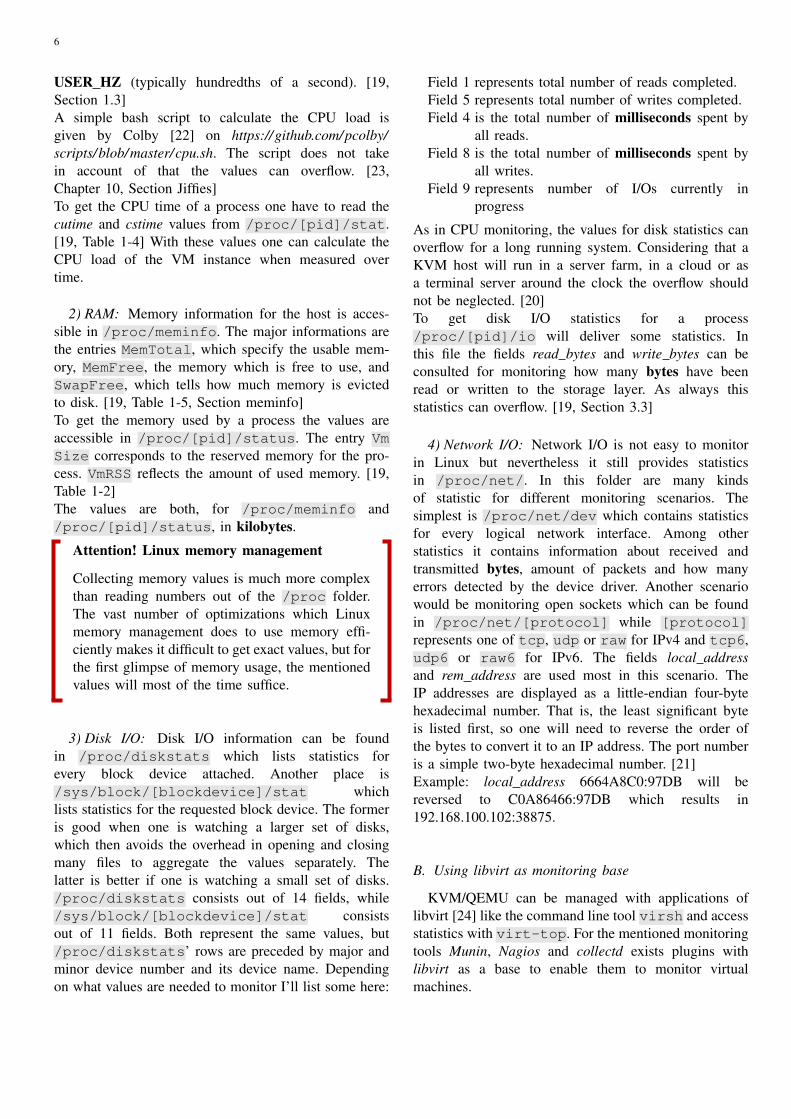
An SNMP-managed network consists of three key com-
ponents:
• Managed device
• Agent — software which runs on managed devices
• Network management station (NMS) — software
which runs on the manager
Fig. 8. Principle of SNMP Communication [11]
1) Managed device: A managed device is a network
node that implements an SNMP interface that allows
unidirectional (read-only) or bidirectional (read and
write) access to node-specific information. Managed
devices exchange node-specific information with the
NMSs. Sometimes called network elements, the managed
devices can be any type of device, including, but not
limited to, routers, access servers, switches, bridges,
hubs, IP telephones, IP video cameras, computer hosts,
and printers.
2) Agent: An agent is a network-management
software module that resides on a managed device. An
agent has local knowledge of management information
and translates that information to or from an SNMP-
specific form.
3) Network management station: A network
management station executes applications that monitor
and control managed devices. NMSs provide the bulk
of the processing and memory resources required for
network management. One or more NMSs may exist on
any managed network.
4) Management Information Base: SNMP itself
does not define which information (which variables)
a managed system should offer. Rather, SNMP uses
an extensible design, where the available information
is defined by management information bases (MIBs).
MIBs describe the structure of the management data of
a device subsystem. They use a hierarchical namespace
containing object identifiers (OID). Each OID identifies
a variable that can be read or set via SNMP. [11] Each
agent can have its very own MIB, which is why SNMP
is so adaptable.
5) Traps: Generally the network management station
polls statistics of the agent in a specified interval. But
then traps provides a way for an agent to notify the NMS
about a changed condition the NMS should know about.
After the notification the NMS can respond to the trap
like shutting down or restart a device or send a message
to the administrator or whatever one has configured. This
makes traps crucial.
B. Monitoring tools
Beside SNMP many different approaches to monitor
servers, services or devices exist. From recording and
analyzing to displaying values and alerting countless
tools are available. There are agent based and agentless
tools (see description of agents in section VI-C) which
often are installed on-premises. Some statistics can
be measured without an agent due its inherent nature
like HTTP, IMAP or sockets response times. SaaS
monitoring tools also exists. I picked only a few out of
the immense variety:

5
1) Paessler PRTG Network Monitor: Paessler PRTG
Network Monitor (PRTG) is a proprietary software
which collects statistics in a centrally manner. PRTG
is used as a network management station (NMS). The
downside of SNMP is, that one has to know the MIB
of the device one wants to monitor. PRTG provides
many so called sensors out of the box, including
SNMP sensors of known MIBs, which do simplify the
configuration of a NMS. The sensors monitor uptime,
bandwidth, application server, virtual server and some
more using (inter alia) SNMP and WMI.
PRTG does not only acquire data, it also provides
alerting, reporting and displaying the statistics. PRTG
is mainly used for Windows but Linux is also possible.
Either through installing net-SNMP or without agent.
When monitoring without an agent one has to give
PRTG SSH access to the station it has to monitor. With
PRTG it is not easily possible to monitor the KVM
hypervisor, but VMware, Xen and Microsoft Hyper-V
monitoring is available. [12]
2) Nagios: Nagios is a free and open-source powerful
monitoring system that enables organizations to identify
and resolve IT infrastructure problems before they affect
critical business processes. Nagios also provides, beside
monitoring, alerting and reporting. Nagios is extensible
by plugins. With plugins it’s possible to gather statistics
for anything and everything. It exists a libvirt plugin to
monitor KVM VMs. [13]
3) Munin: Munin is a free and open-source
computer system monitoring, network monitoring
and infrastructure monitoring software application.
Munin offers monitoring and alerting services for
servers, switches, applications, and services. It alerts the
users when things go wrong and alerts them a second
time when the problem has been resolved. Munin has
a master/node architecture (agent based) in which the
master connects to all the nodes at regular intervals and
asks them for data. [14] Munin often runs in parallel
with Nagios, because in Munin it’s easier to setup
new monitoring rules than in Nagios. It can also tie
into Nagios, sending notifications of thresholds being
exceeding with Nagios notification system. Munin is
also extensible by plugins. As for Nagios, a plugin
exists to monitor KVM VMs.
4) Monitis: Monitis is a monitor-software as a service.
It monitors applications, websites, servers, networks and
other cloud services and more. Monitoring is done in an
agentless or agent based manner. Monitis also delivers
an API and a SDK for extending Monitis’ monitor
capabilities. [15]
VI. KVM HYPERVISOR MONITORING CAPABILITIES
KVM in combination with Quick Emulator (QEMU)
provides QEMU Monitor Protocol (QMP), a JSON-
based protocol, which one can use to interact with a
QEMU instance (VM) and manage it too. [16, 17] QMP
allows applications to communicate with a running
QEMUed instance.
The library libvirt comes in handy for managing and
monitor the KVM hypervisor. Libvirt is a toolkit
to interact with the virtualization capabilities of
recent versions of Linux (and other OSes). [18]
When KVM is managed with libvirt one can use
grep pid /var/run/libvirt/qemu/* to get
the process ids (pids) of the currently running VMs.
Then one can use top -p pid-of-VM to get
statistics how much resources the VM uses of the
host. In figure 9 one can see, that currently one VM
Fig. 9. Screenshot of instance-pids on an OpenStack compute node.
is running, named instance-0000004b, and it uses 2
virtual central processing units (VCPUs). Now one can
run top -p 1463 and watch the details of the VM
process in relation to the hosts resources.
Fig. 10. Screenshot of top of an VM instance. The VM uses 6.8%
CPU and 18.6% RAM of the host.
A. Using /proc/ as monitoring base
KVM/QEMU creates a separate process for each VM.
Therefore one can use the /proc/ filesystem to gather
statistics not only of a VM but also for the host.
In the next few subsections the granularity of the /proc/
data is summarized. The summary is based on the Linux
kernel documentation for its filesystems [19] and a
separate documentation of iostats [20] and a blog entry
about network monitoring with /proc/net/. [21]
1) CPU: CPU information is accessible in
/proc/stat. The very first “cpu” line aggregates
the numbers in all of the other “cpuN” lines. These
numbers identify the amount of time the CPU has spent
performing different kinds of work. Time units are in
6
USER HZ (typically hundredths of a second). [19,
Section 1.3]
A simple bash script to calculate the CPU load is
given by Colby [22] on https://github.com/pcolby/
scripts/blob/master/cpu.sh. The script does not take
in account of that the values can overflow. [23,
Chapter 10, Section Jiffies]
To get the CPU time of a process one have to read the
cutime and cstime values from /proc/[pid]/stat.
[19, Table 1-4] With these values one can calculate the
CPU load of the VM instance when measured over
time.
2) RAM: Memory information for the host is acces-
sible in /proc/meminfo. The major informations are
the entries MemTotal, which specify the usable mem-
ory, MemFree, the memory which is free to use, and
SwapFree, which tells how much memory is evicted
to disk. [19, Table 1-5, Section meminfo]
To get the memory used by a process the values are
accessible in /proc/[pid]/status. The entry Vm
Size corresponds to the reserved memory for the pro-
cess. VmRSS reflects the amount of used memory. [19,
Table 1-2]
The values are both, for /proc/meminfo and
/proc/[pid]/status, in kilobytes.
Attention! Linux memory management
Collecting memory values is much more complex
than reading numbers out of the /proc folder.
The vast number of optimizations which Linux
memory management does to use memory effi-
ciently makes it difficult to get exact values, but for
the first glimpse of memory usage, the mentioned
values will most of the time suffice.
3) Disk I/O: Disk I/O information can be found
in /proc/diskstats which lists statistics for
every block device attached. Another place is
/sys/block/[blockdevice]/stat which
lists statistics for the requested block device. The former
is good when one is watching a larger set of disks,
which then avoids the overhead in opening and closing
many files to aggregate the values separately. The
latter is better if one is watching a small set of disks.
/proc/diskstats consists out of 14 fields, while
/sys/block/[blockdevice]/stat consists
out of 11 fields. Both represent the same values, but
/proc/diskstats’ rows are preceded by major and
minor device number and its device name. Depending
on what values are needed to monitor I’ll list some here:
Field 1 represents total number of reads completed.
Field 5 represents total number of writes completed.
Field 4 is the total number of milliseconds spent by
all reads.
Field 8 is the total number of milliseconds spent by
all writes.
Field 9 represents number of I/Os currently in
progress
As in CPU monitoring, the values for disk statistics can
overflow for a long running system. Considering that a
KVM host will run in a server farm, in a cloud or as
a terminal server around the clock the overflow should
not be neglected. [20]
To get disk I/O statistics for a process
/proc/[pid]/io will deliver some statistics. In
this file the fields read bytes and write bytes can be
consulted for monitoring how many bytes have been
read or written to the storage layer. As always this
statistics can overflow. [19, Section 3.3]
4) Network I/O: Network I/O is not easy to monitor
in Linux but nevertheless it still provides statistics
in /proc/net/. In this folder are many kinds
of statistic for different monitoring scenarios. The
simplest is /proc/net/dev which contains statistics
for every logical network interface. Among other
statistics it contains information about received and
transmitted bytes, amount of packets and how many
errors detected by the device driver. Another scenario
would be monitoring open sockets which can be found
in /proc/net/[protocol] while [protocol]
represents one of tcp, udp or raw for IPv4 and tcp6,
udp6 or raw6 for IPv6. The fields local address
and rem address are used most in this scenario. The
IP addresses are displayed as a little-endian four-byte
hexadecimal number. That is, the least significant byte
is listed first, so one will need to reverse the order of
the bytes to convert it to an IP address. The port number
is a simple two-byte hexadecimal number. [21]
Example: local address 6664A8C0:97DB will be
reversed to C0A86466:97DB which results in
192.168.100.102:38875.
B. Using libvirt as monitoring base
KVM/QEMU can be managed with applications of
libvirt [24] like the command line tool virsh and access
statistics with virt-top. For the mentioned monitoring
tools Munin, Nagios and collectd exists plugins with
libvirt as a base to enable them to monitor virtual
machines.

7
1) virt-top: Virt-top is a top-like utility for
showing stats of virtualized domains. Many keys and
command line options are the same as for ordinary top.
A domain is an instance of an operating system running
on a virtualized machine provided by the hypervisor. [25]
2) libvirt API: To get further insight in a domain I’ll
list here some API calls from the C-library. [26] For CPU
and memory usage virDomainGetInfo() provides
informations in a struct virDomainInfo:
s t r u c t v i r D o m a i n I n f o {unsigned char s t a t e
unsigned long maxMem
unsigned long memory
unsigned s h o r t n r V i r t C p u
unsigned long long cpuTime
}
In this struct one can extract the maximum allowed
(maxMem) and the used memory (memory) in kilobytes,
the number of virtual CPUs (nrVirtCpu) for the domain
and the CPU time used (cpuTime) in nanoseconds.
The function virDomainBlockStats() provides
block I/O statistics:
s t r u c t v i r D o m a i n B l o c k S t a t s S t r u c t {long long r d r e q number o f r e a d r e q u e s t s
long long r d b y t e s number o f r e a d b y t e s
long long wr req number o f w r i t e r e q u e s t s
long long w r b y t e s number o f w r i t t e n b y t e s
long long e r r s In Xen t h i s r e t u r n s
t h e m y s t e r i o u s ’ oo req ’
}
And with virDomainInterfaceStats() we get
statistics for an interface. Therefore if a domain as
multiple interfaces, multiple calls to this function is
needed.
s t r u c t v i r D o m a i n I n t e r f a c e S t a t s S t r u c t {long long r x b y t e s r e c e i v e d b y t e s
long long r x p a c k e t s r e c e i v e d p a c k e t s
long long r x e r r s e r r o r s i n r e c e i v i n g
long long r x d r o p dropped p a c k e t s
long long t x b y t e s t r a n s m i t t e d b y t e s
long long t x p a c k e t s t r a n s m i t t e d p a c k e t s
long long t x e r r s e r r o r s i n t r a n s m i t t i n g
long long t x d r o p dropped p a c k e t s
}
C. Monitoring VMs
Monitoring of VMs can be done in two ways. First
way is to collect statistics from the hypervisor and host;
this is called agentless monitoring. Second way is to in-
stall a piece of software inside the guest OS (VM) which
allows an aggregator collecting statistics from inside the
VM; this is called agent based monitoring. Monitoring
with an agent delivers deeper and more granular data
for advanced monitoring, alerting and reporting. The
downside is the need to deploy and update agents to
systems. Sometimes there are restrictions or not allowed
to deploy an agent to the system, e.g. a public cloud.
[27]
VII. SETTING UP OPENSTACK
For section VIII I had to have a running Open-
Stack infrastructure. OpenStack is a cloud operating
system that controls large pools of compute, storage,
and networking resources throughout a datacenter. [28]
From the UZH ifi I’ve got three server (nodes, namely
n01, n02 and n03) in its testbed. With this in mind I
stuck to http://docs.openstack.org/havana/ install-guide/
install/apt/content/ch preface.html as a guide. The basic
architecture for a virtual machine OpenStack cloud needs
two nodes:
• a controller node and
• a compute node
The controller, as its name imply, manages the Open-
Stack cloud, while a compute node provides the hyper-
visor for the VMs. The services OpenStack currently has
are the following:
TABLE I. SERVICES OF OPENSTACK
Service Project name
Dashboard HorizonCompute NovaNetworking Neutron
Storage
Object Storage SwiftBlock Storage Cinder
Shared services
Identity Service KeystoneImage Service GlanceTelemetry Ceilometer
Higher-level services
Orchestration Heat
From these services the controller node runs the
Identity Service, Image Service, Dashboard, and the
management portion of Compute2. The controller addi-
tionally runs the Telemetry service. It also contains the
associated API services, MySQL databases, and mes-
saging system. The compute node runs the hypervisor
portion of Compute. By default, Compute uses KVM as
the hypervisor. Compute also provisions networks and
implements security groups.
I chose to deploy n01 as the controller of the OpenStack
cloud and n02 and n03 as compute nodes as shown in
figure 11.
2I write the type of nodes in lower letter, when referring the service
in capital.

8
Fig. 11. Chosen architecture for OpenStack
VIII. MONITORING IN OPENSTACK
OpenStack has a web page where the operators sum-
marize meetups. It turns out that operators are unhappy
with monitoring OpenStack in general. There are too
many tools and too many places in OpenStack that
require monitoring. It’s not clear how and what to
monitor. [29] I took only OpenStack’s integrated project
Ceilometer. For monitoring and alerting the OpenStack’s
Operating Guide mentions Nagios for process and service
monitoring. For trend-monitoring collectd. [30]
A. Ceilometer
The Telemetry module was originally designed to
support billing systems for OpenStack cloud resources.
The list of meters is continuously growing, which makes
it possible to use the data collected by Telemetry for
different purposes, other than billing.
Samples can be collected in three different ways:
• Notifications Processing notifications from other
OpenStack services, by consuming messages from
the configured message queue system.
• Polling Retrieve information directly from the
hypervisor or from the host machine using SNMP,
or by using the APIs of other OpenStack services.
• RESTful API Pushing samples via the RESTful
API of Telemetry.
The VMs are monitored by the Compute agent. This
agent is responsible for collecting resource usage data
of VM instances on individual compute nodes within
an OpenStack deployment. This mechanism requires a
closer interaction with the hypervisor. As Telemetry
supports libvirt the KVM hypervisor can be monitored.
Ceilometer’s Compute agent measures typical resources
like CPU usage, memory and disk I/O3 for every VM
instance. A short list is given in table II.
TABLE II. EXCERPT OF COMPUTE METERS
Name Type Unit Notecpu Cumulative ns CPU time used.cpu util Gauge % Average CPU utilisation.memory Gauge MB Volume of RAM allocated
to the instance.disk.read.bytes Cumulative B Volume of reads.disk.read.bytes.rate Gauge B/s Average rate of reads.
The collected statistics can be accessed in four differ-
ent ways: with the REST API, with the command line
interface, or with the Metering tab on the OpenStack
dashboard or publish-subscribe method. [31]
The Compute samples are available per VM instance.
To gather statistics for a tenant, one has first to get
all the VMs a tenant is running and then requesting
the samples per VM. OpenStack’s dashboard Metering
tab lacks capabilities to visualize the collected data
(see figure 12). Nagios and collectd can find a remedy
with consuming the REST API [32] or command line
interface to access Ceilometer’s collected statistics. The
ICCLab of ZHAW has written a plugin for Nagios
and is available at GitHub: https://github.com/kobe6661/
nagios ceilometer plugin.
Ceilometer also provides an alerting system but is still
in development. [33] Three different types of alarms are
currently available:
• A static threshold value with a comparison opera-
tor such as greater than or less than.
• A statistic selection to aggregate the data.
• A sliding time window to indicate how far back
into the recent past you want to look.
3The full list of meters for the Compute service can be
found here: http://docs.openstack.org/admin-guide-cloud/content/
section telemetry-compute-meters.html. For every OpenStack
service: http://docs.openstack.org/admin-guide-cloud/content/
section telemetry-measurements.html.

9
Fig. 12. Graph showing CPU usage in Openstack Horizon.
OpenStack Metering tab only can display statistics for the
whole tenant (project) and is lacking capabilities to visualize
data of a single VM.
An alarm can be set to every meter of Ceilometer.
Due that Ceilometer only gathers data from OpenStack
services alarms cannot be set for a Physical Machine.
IX. CONCLUSION
Linux offers great and deep insight at the hosts re-
sources, but is not that easy to correctly collect data. It
is easier to use an existing monitoring tool like collectd
and for an advanced monitoring Nagios.
When virtual machines has to be monitored libvirt pro-
vides an excellent library to gather statistics.
OpenStack’s Ceilometer is a flexible monitoring tool,
but the dashboard tab has to be further developed. Like
setting up alarm thresholds or visualizing statistics per
VM/PM. When alarms are needed at PM-level one has
to use a third party tool like Nagios.

10
GLOSSARY
cloud Cloud computing is a model for enabling ubiq-
uitous, convenient, on-demand network access
to a shared pool of configurable computing
resources (e.g., networks, servers, storage, ap-
plications, and services) that can be rapidly
provisioned and released with minimal man-
agement effort or service provider interaction.
daemonIn multitasking computer operating systems, a
daemon is a computer program that runs as a
background process, rather than being under
the direct control of an interactive user. [34].
IaaS Infrastructure as a Service.
KVM Kernel-based Virtual Machine.
MIB Management Information Base.
NMS network management station.
OS operating system.
PaaS Platform as a Service.
pid process id.
PM physical machine.
QEMU Quick Emulator.
QMP QEMU Monitor Protocol.
SaaS Software as a Service.
SNMP Simple Network Management Protocol.
VCPU virtual central processing unit.
VM virtual machine.
WMI Windows Management Instrumentation allows
to manage and monitor Microsoft Windows
PCs and server.
APPENDIX A
SNMP
For further information on the SNMP there is a
book Essential SNMP written by Douglas R. Mauro and
Kevin J. Schmidt (ISBN: 0-596-00020-0, First edition,
published July 2001.) and it is also available as a website
at http://docstore.mik.ua/orelly/networking 2ndEd/snmp/
index.htm.

REFERENCES 11
REFERENCES
[1] Paul Gil. FAQ: What Is ’SaaS’? URL: http :
/ / netforbeginners . about . com / od / s / f / what
is SaaS software as a service . htm (visited on
02/26/2015).
[2] Rackspace Support. Understanding the Cloud
Computing Stack: SaaS, PaaS, IaaS. URL: http :
/ / www . rackspace . com / knowledge center /
whitepaper/understanding- the- cloud-computing-
stack-saas-paas-iaas (visited on 02/26/2015).
[3] Brandon Butler. FAQ: What Is ’SaaS’? URL: http:
//www.networkworld.com/article/2163430/cloud-
computing/paas-primer--what- is-platform-as-a-
service-and-why-does-it-matter-.html (visited on
02/26/2015).
[4] Diversity Ltd. Moving your Infrastructure to the
Cloud, How to Maximize Benefits and Avoid Pit-
falls. URL: http : / / diversity. net . nz / wp - content /
uploads / 2011 / 01 / Moving - to - the - Clouds . pdf
(visited on 02/28/2015).
[5] J. W. Smith and I. Sommerville. Workload Clas-
sification & Software Energy Measurement for
Efficient Scheduling on Private Cloud Platforms.
Tech. rep. School of Computer Science, University
of St Andrews, 2011. URL: http:/ /arxiv.org/ftp/
arxiv / papers / 1105 / 1105 . 2584 . pdf (visited on
03/02/2015).
[6] iostat(1) Linux User’s Manual. July 2013.
[7] Werner Fischer. Linux Performance Aufzeich-
nung und Auswertung mit sar. May 26, 2009.
URL: https : / / www . thomas - krenn . com /
de/wiki /Linux Performance Aufzeichnung und
Auswertung mit sar (visited on 04/30/2015).
[8] sar manual. Mar. 2015. URL: http : / / sebastien .
godard . pagesperso - orange . fr / man sar . html
(visited on 04/30/2015).
[9] About IPTraf. URL: http: / / iptraf .seul .org/about .
html (visited on 03/16/2015).
[10] collectd – The system statistics collection daemon.
URL: https://collectd.org/ (visited on 05/09/2015).
[11] Simple Network Management Protocol. URL: http:
/ / en . wikipedia . org / wiki / Simple Network
Management Protocol (visited on 03/20/2015).
[12] Paessler PRTG Network Monitor. URL: https : / /
www. paessler . com / prtg / features # easy to use
interface (visited on 04/19/2015).
[13] Nagios. URL: https : / / www . nagios . org / about /
overview/ (visited on 04/19/2015).
[14] Munin. URL: http://en.wikipedia.org/wiki/Munin
(software) (visited on 04/19/2015).
[15] Monitis. URL: http : / /www.monitis .com/product
(visited on 04/19/2015).
[16] QMP - QEMU. URL: http://wiki.qemu.org/QMP
(visited on 04/20/2015).
[17] Luiz Capitulino. A Quick Tour of the QEMU
Monitor Protocol. Slideshow. Aug. 2010. URL:
http : / /www.linux- kvm.org/ images/1/17/2010-
forum-qmp-status-talk.pp.pdf.
[18] libvirt: The virtualization API. URL: http://libvirt.
org/ (visited on 03/16/2015).
[19] T H E /proc F I L E S Y S T E M. June 9, 2009.
URL: http: / /git .kernel .org/cgit / linux/kernel /git /
torvalds/linux.git/tree/Documentation/filesystems/
proc.txt?id=HEAD.
[20] I/O statistics fields. Apr. 29, 2013. URL: http://git.
kernel.org/cgit/linux/kernel/git/torvalds/linux.git/
plain/Documentation/iostats.txt.
[21] Terry Dawson. Exploring the /proc/net/ Directory.
Nov. 16, 2000. URL: http://www.onlamp.com/pub/
a/linux/2000/11/16/LinuxAdmin.html (visited on
05/02/2015).
[22] Paul Colby. CPU load bash script. https://github.
com/pcolby/scripts /blob/master /cpu.sh. Oct. 6,
2013.
[23] Robert Love. Linux Kernel Development -. 2.
Edition. Sams Publishing, Jan. 12, 2005. ISBN: 0-
672-32720-1.
[24] Applications using libvirt. URL: http://libvirt.org/
apps.html (visited on 05/10/2015).
[25] Terminology and goals. URL: http : / / libvirt . org /
goals.html (visited on 05/10/2015).
[26] API Module libvirt-domain from libvirt. URL:
https://libvirt.org/html/libvirt-libvirt-domain.html
(visited on 05/10/2015).
[27] up.time. The Truth about Agent vs. Agentless Mon-
itoring. URL: http : / / www. uptimesoftware . com /
pdfs / TruthAboutAgentVsAgentLess . pdf (visited
on 05/12/2015).
[28] OpenStack - Logging and Monitoring. URL: https:
//www.openstack.org/ (visited on 05/06/2015).
[29] Openstack - Operations/Monitoring. URL: https :
//wiki.openstack.org/wiki/Operations/Monitoring
(visited on 05/07/2015).
[30] OpenStack - Logging and Monitoring. URL: http:
/ / docs . openstack . org / openstack - ops / content /
logging monitoring.html (visited on 05/07/2015).
[31] Openstack - Telemetry. URL: http : / / docs .
openstack . org / admin - guide - cloud / content /
ch admin - openstack - telemetry. html (visited on
05/14/2015).
12
[32] Openstack - Ceilometer REST API. URL: http:/ /
docs.openstack.org/developer/ceilometer/webapi/
v2.html.
[33] Openstack - Alerting. URL: https://wiki.openstack.
org/wiki/Ceilometer/Alerting.
[34] Daemon (computing). URL: http: / /en.wikipedia .
org / wiki / Daemon (computing) (visited on
05/19/2015).