Embed Size (px)
Citation preview
Introduction to revenue, cost and
profit terms
Variable and fixed costs, cost-volume-profit analysis
Pia Nylinder
Organization of the presentation
• Variable cost
• Fixed cost
• Cost volume profit (CVP) analysis
• Decision-making
• Opportunity costs
• Sunk costs
Variable and fixed costs
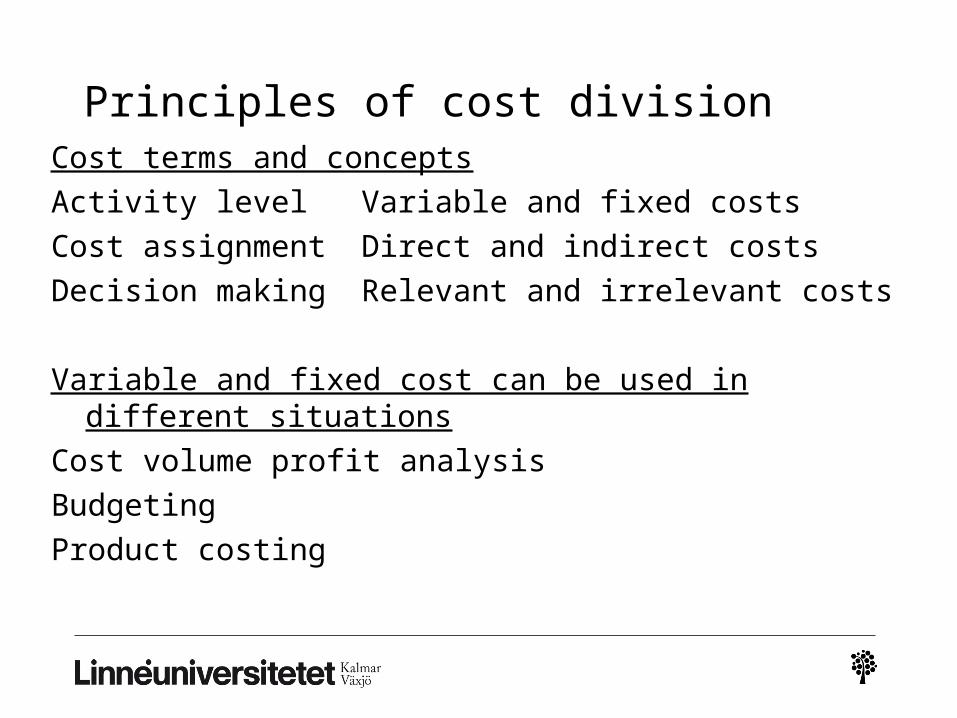
Principles of cost divisionCost terms and concepts
Activity level Variable and fixed costs
Cost assignment Direct and indirect costs
Decision making Relevant and irrelevant costs
Variable and fixed cost can be used in different situations
Cost volume profit analysis
Budgeting
Product costing
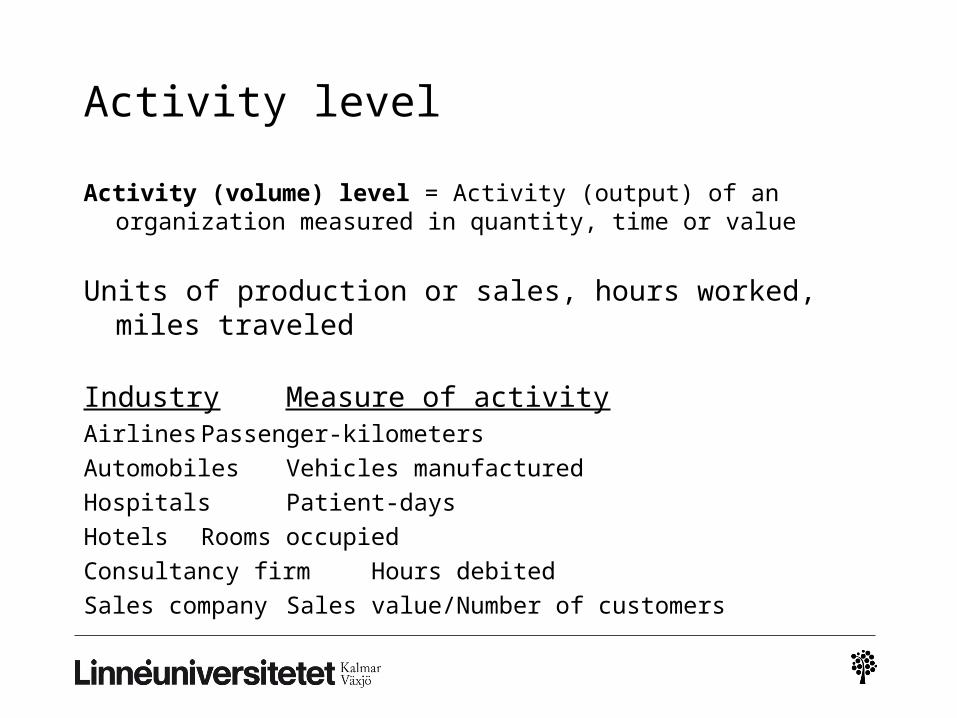
Activity level
Activity (volume) level = Activity (output) of an organization measured in quantity, time or value
Units of production or sales, hours worked, miles traveled
Industry Measure of activityAirlines Passenger-kilometers
Automobiles Vehicles manufactured
Hospitals Patient-days
Hotels Rooms occupied
Consultancy firm Hours debited
Sales company Sales value/Number of customers
Variable costs
Variable Cost = A cost that varies in total when the volume of activity changes
Linearity of variable costs
Nonlinearity of variable costs (two types of nonlinierity)
Linearity of variable costs
Cost per unit
Activity level Activity level
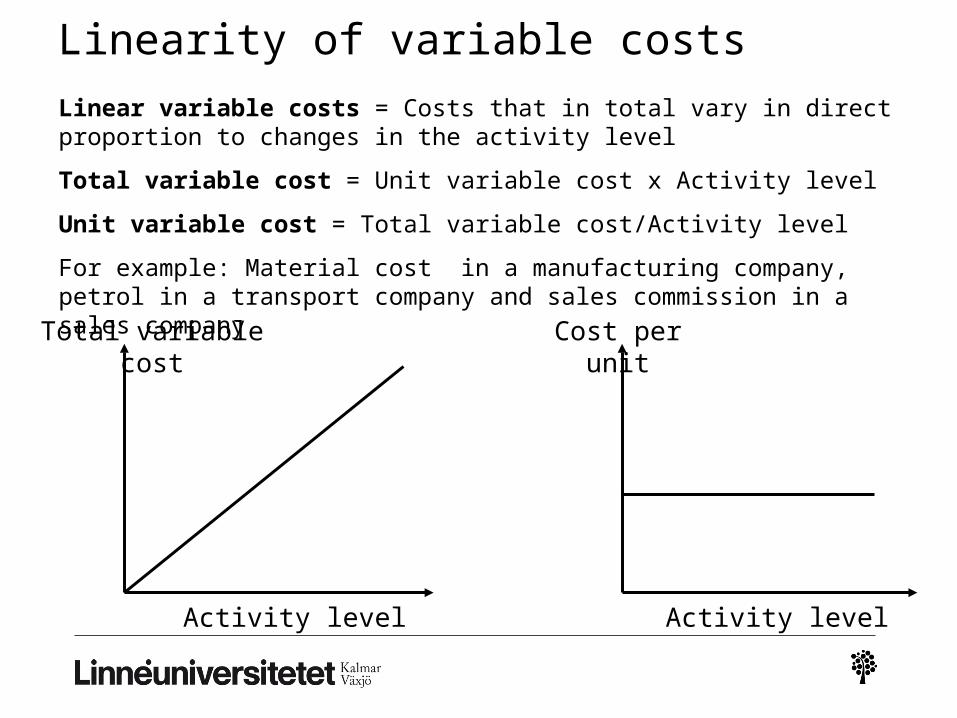
Linear variable costs = Costs that in total vary in direct proportion to changes in the activity level
Total variable cost = Unit variable cost x Activity level
Unit variable cost = Total variable cost/Activity level
For example: Material cost in a manufacturing company, petrol in a transport company and sales commission in a sales company
Total variable cost
Nonlinearity of variable costs
Cost per unit
Activity level Activity level
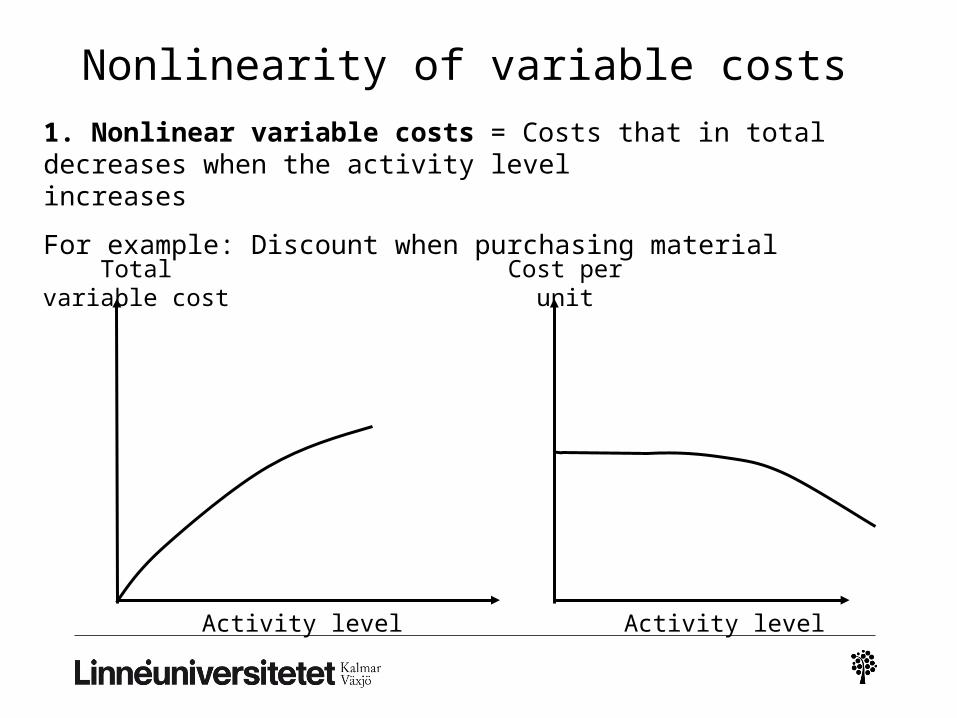
1. Nonlinear variable costs = Costs that in total decreases when the activity level increases
For example: Discount when purchasing material
Total variable cost
Nonlinearity of variable costs
Total variable cost Cost per unit
Activity level Activity level
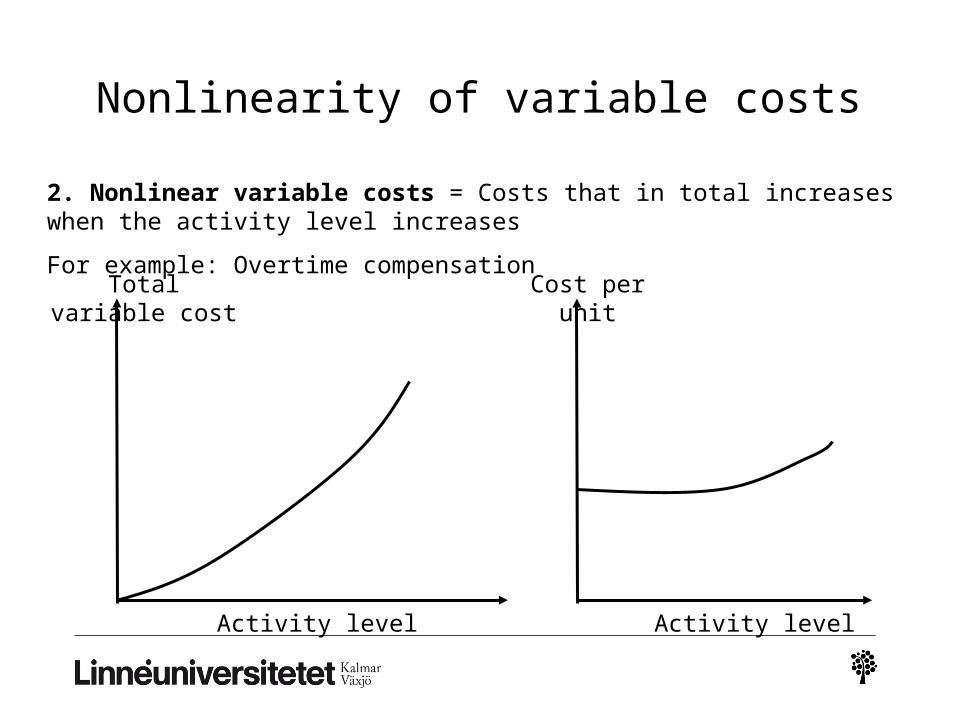
2. Nonlinear variable costs = Costs that in total increases when the activity level increases
For example: Overtime compensation
Fixed costs
Fixed costs
Step fixed costs (Semi-fixed)
Fixed costs
Total fixed cost
Unit fixed cost
Activity level
Activity level
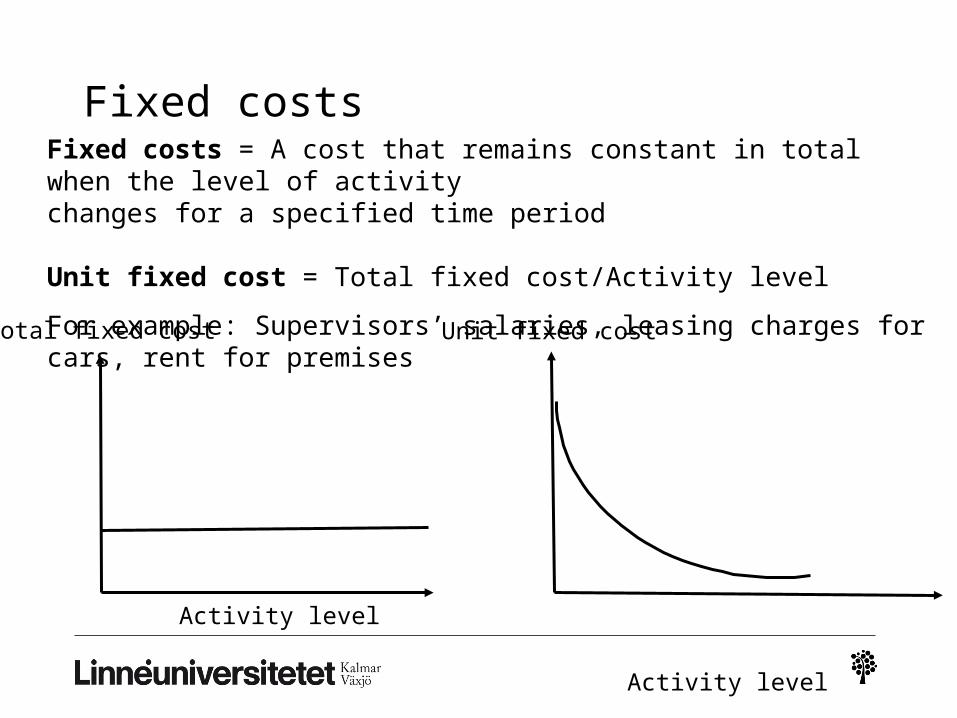
Fixed costs = A cost that remains constant in total when the level of activity changes for a specified time period
Unit fixed cost = Total fixed cost/Activity level
For example: Supervisors’ salaries, leasing charges for cars, rent for premises
Fixed costs
Two important assumptions
Relevant rangeAn output range of activity level that the firm expects to be operating
within period of time
Time spanA cost is only fixed for a short period of time, for instance a month or a
year
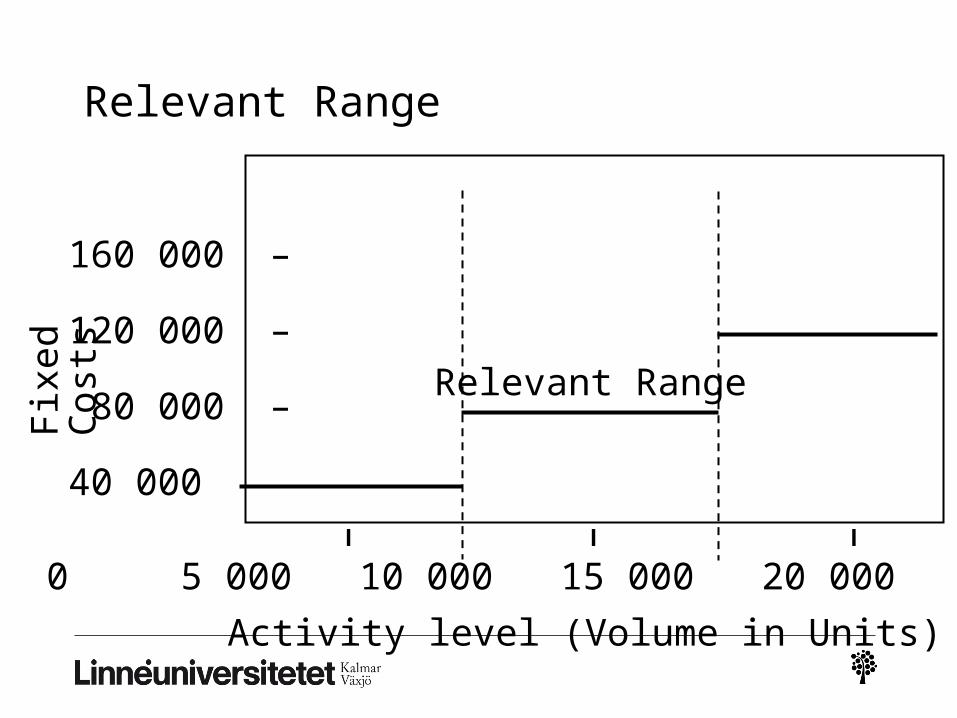
Relevant Range
Fix
ed
Cos
ts
Activity level (Volume in Units)
160 000 –
120 000 –
80 000 –
40 000
0 5 000 10 000 15 000 20 000 25 000
– – –
Relevant Range
Step fixed costs
Total fixed costs
Activity level
Unit fixed costs
Activity level
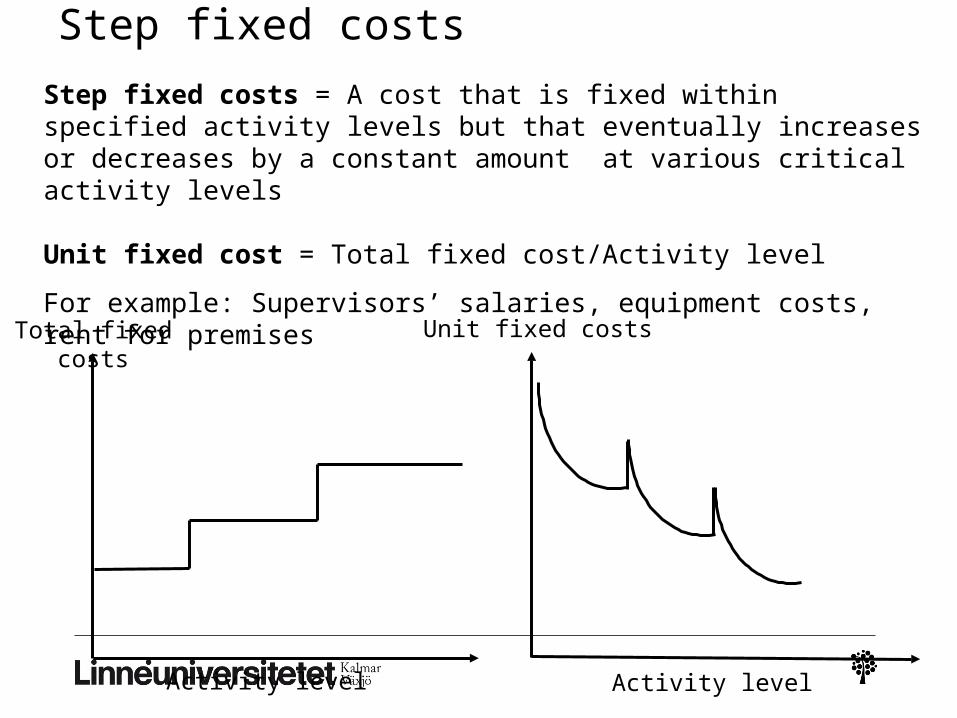
Step fixed costs = A cost that is fixed within specified activity levels but that eventually increases or decreases by a constant amount at various critical activity levels
Unit fixed cost = Total fixed cost/Activity level
For example: Supervisors’ salaries, equipment costs, rent for premises
Mixed costs (Semi-variable costs)
Activity level Activity level
Total fixed cost
Total variable cost
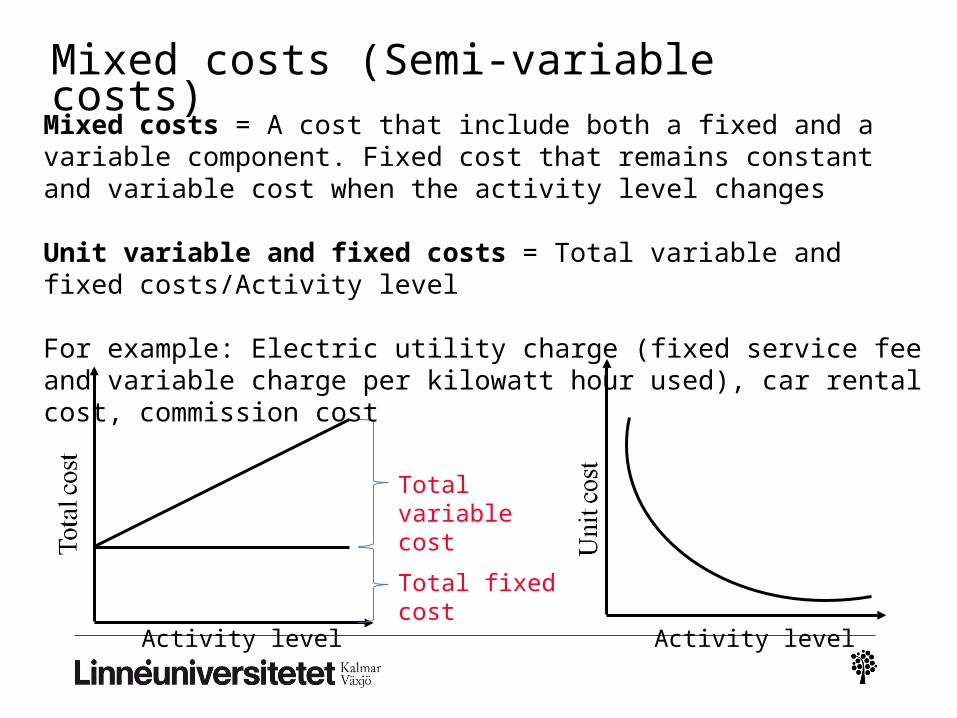
Mixed costs = A cost that include both a fixed and a variable component. Fixed cost that remains constant and variable cost when the activity level changes
Unit variable and fixed costs = Total variable and fixed costs/Activity level
For example: Electric utility charge (fixed service fee and variable charge per kilowatt hour used), car rental cost, commission cost
To conclude…
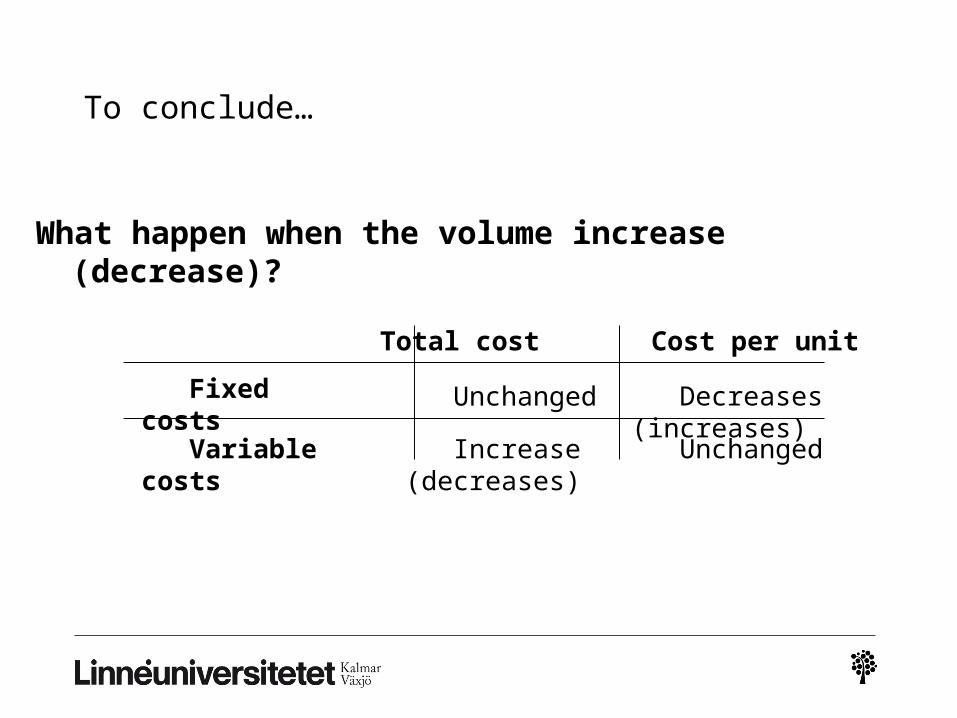
What happen when the volume increase (decrease)?
Total cost Cost per unit
Fixed costs
Variable costs
Unchanged Decreases (increases)
Increase (decreases)
Unchanged
Cost volume profit (CVP) relationship
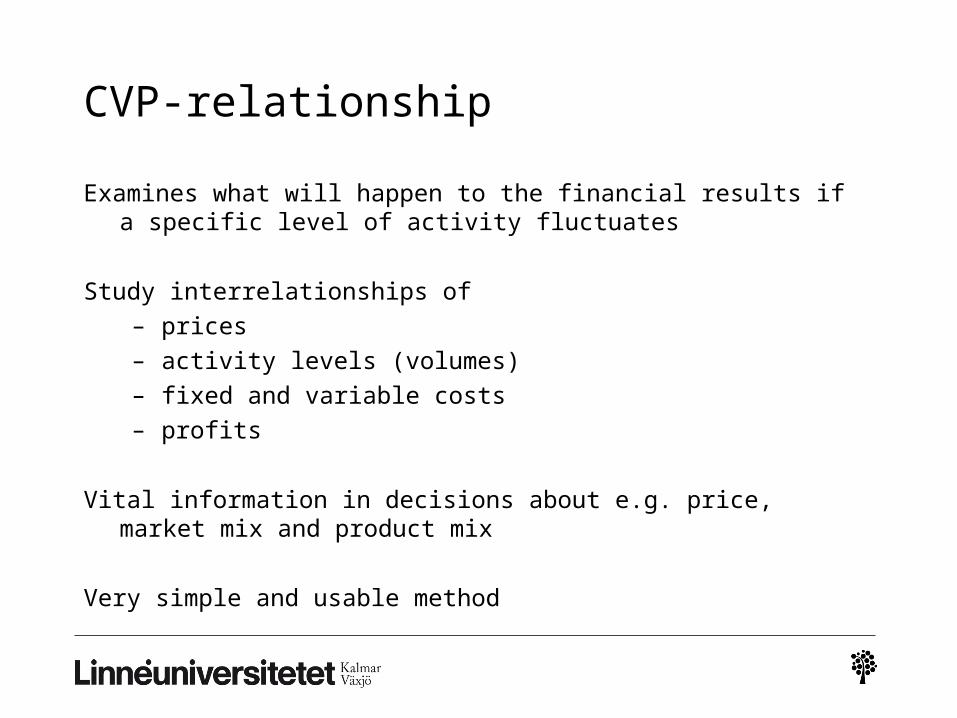
CVP-relationship
Examines what will happen to the financial results if a specific level of activity fluctuates
Study interrelationships of
– prices
– activity levels (volumes)
– fixed and variable costs
– profits
Vital information in decisions about e.g. price, market mix and product mix
Very simple and usable method
CVP-relationship
Sensitivity analysis
– Sensitivity analysis is a “what-if” technique that examines how a result
will change if the original predicted data are not achieved or if an
underlying assumption changes
A CVP-analysis can answer a lot of questions
– What will happen to operating income if volume declines by 5%?
– What will happen to operating income if variable costs increase by 10%
per unit?
– What operating income is expected when sales are 10 000 units?
– Suppose that fixed costs increased by $30,000. What are the new fixed
costs? What is the new breakeven point?
CVP – Different approaches
Two main approaches to CVP-analysis:
Total revenue function
Contribution function
Both approaches can be performed with:
Equation method
Graph method
Total revenue function
Revenue• Unit selling price x Units sold = Total revenue
Costs• Unit variable cost x Units sold = Total variable costs• Total variable cost + Total fixed costs = Total costs
Result• Total revenue – Total costs = Operating profit• Total revenue – Total variable costs – Total fixed costs =
Operating profit• Unit selling price x Units sold - Unit variable cost x Units
sold - Fixed costs = Operating profit
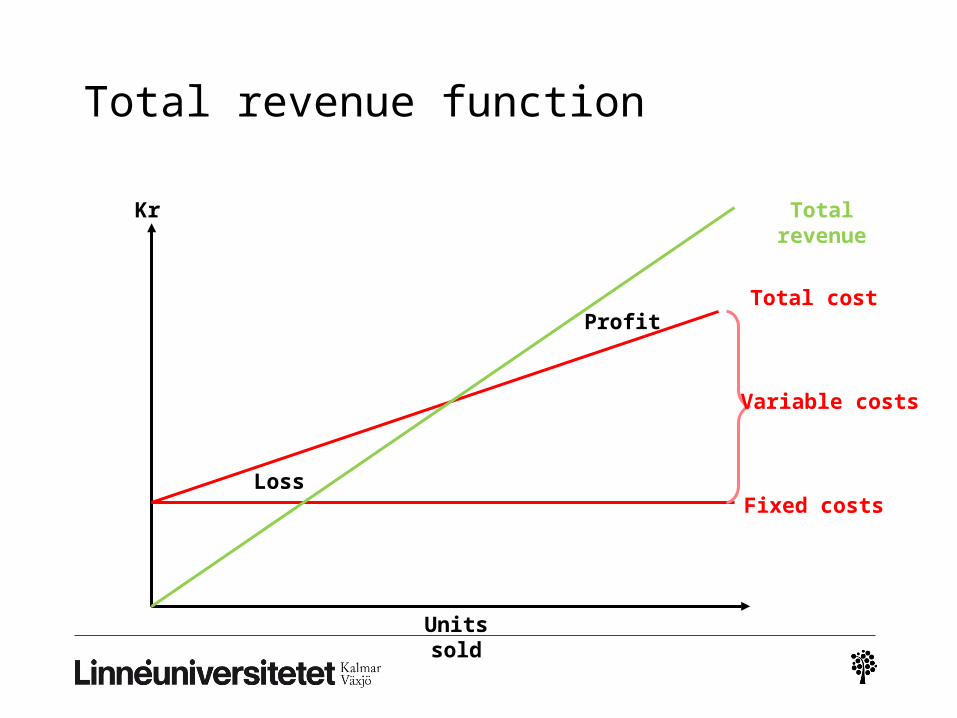
Total revenue function
Kr
Units sold
Fixed costs
Variable costs
Total cost
Total revenue
Loss
Profit
Total revenue function – Break- even point
Kr
Units sold
Fixed costs
Variable costs
Total cost
Total revenue
Break-even point in units
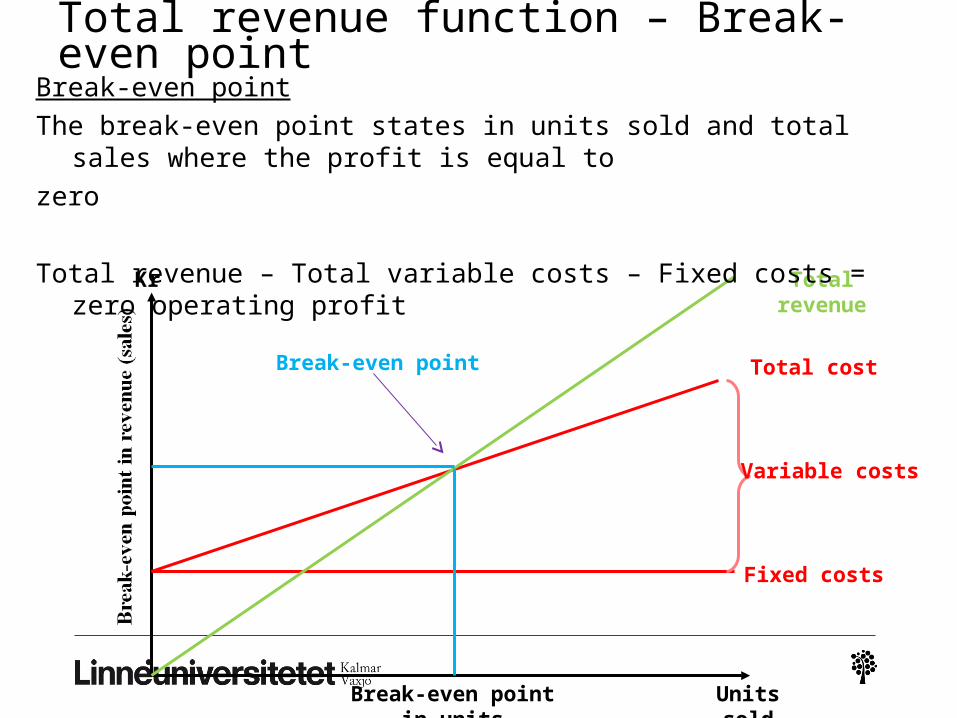
Break-even point
Break-even point
The break-even point states in units sold and total sales where the profit is equal to
zero
Total revenue – Total variable costs – Fixed costs = zero operating profit
Total revenue function – Safety of margin
Safety of margin
• Indicates by how much sales may decrease before a loss occurs
• Can be expressed in actual units and actual sales
• Margin of safety percentage
Total revenue function – Break- even point
Kr
Units sold
Fixed costs
Variable costs
Total cost
Total revenue
Break-even point in units
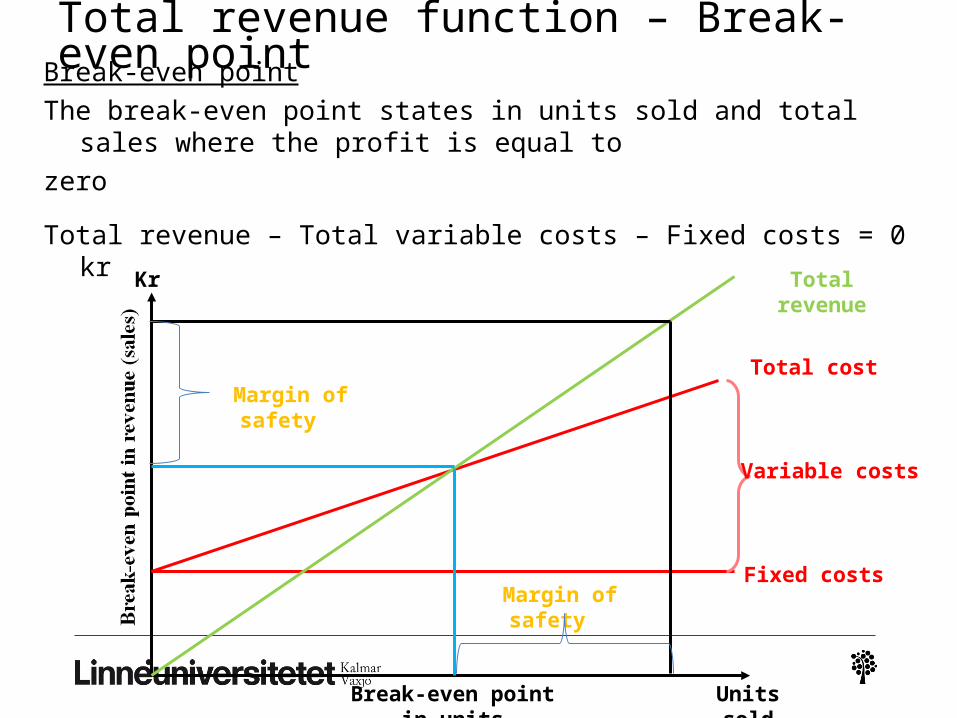
Break-even point
The break-even point states in units sold and total sales where the profit is equal to
zero
Total revenue – Total variable costs – Fixed costs = 0 kr
Margin of safety
Margin of safety
Total revenue function – Break- even point
Kr
Units sold
Fixed costs
Variable costs
Total cost
Total revenue
Break-even point in units
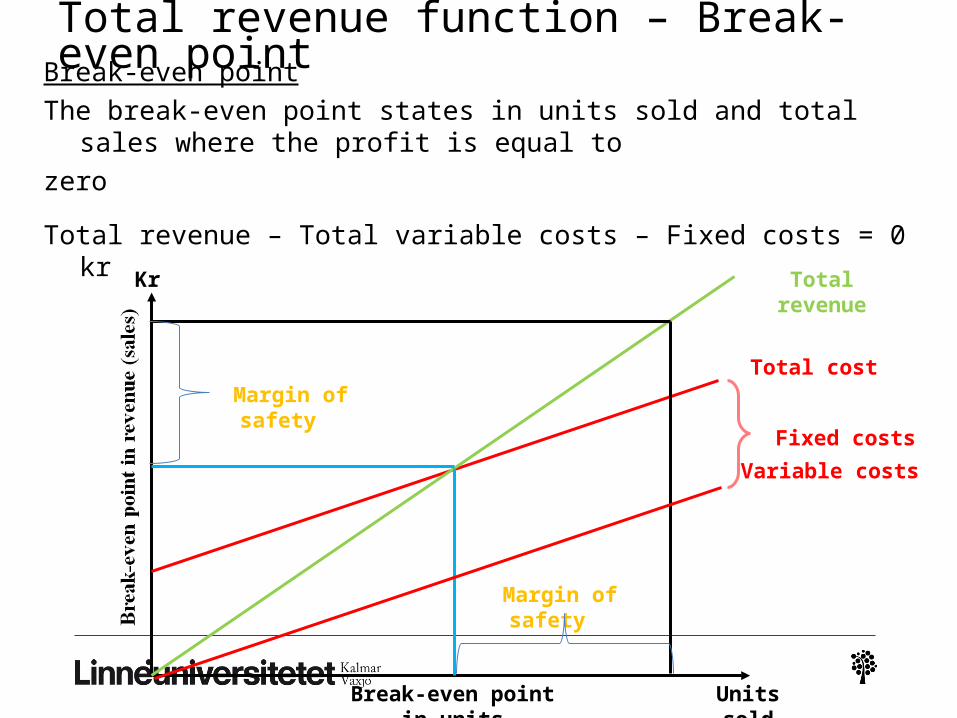
Break-even point
The break-even point states in units sold and total sales where the profit is equal to
zero
Total revenue – Total variable costs – Fixed costs = 0 kr
Margin of safety
Margin of safety
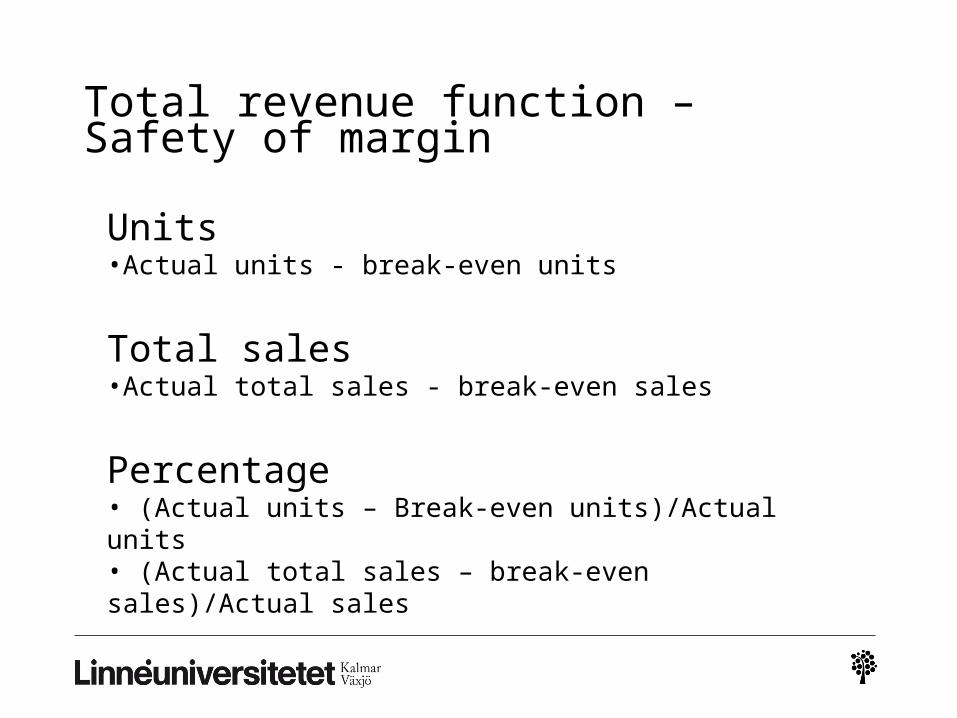
Total revenue function – Safety of margin
Units •Actual units - break-even units
Total sales •Actual total sales - break-even sales
Percentage• (Actual units – Break-even units)/Actual units• (Actual total sales – break-even sales)/Actual sales
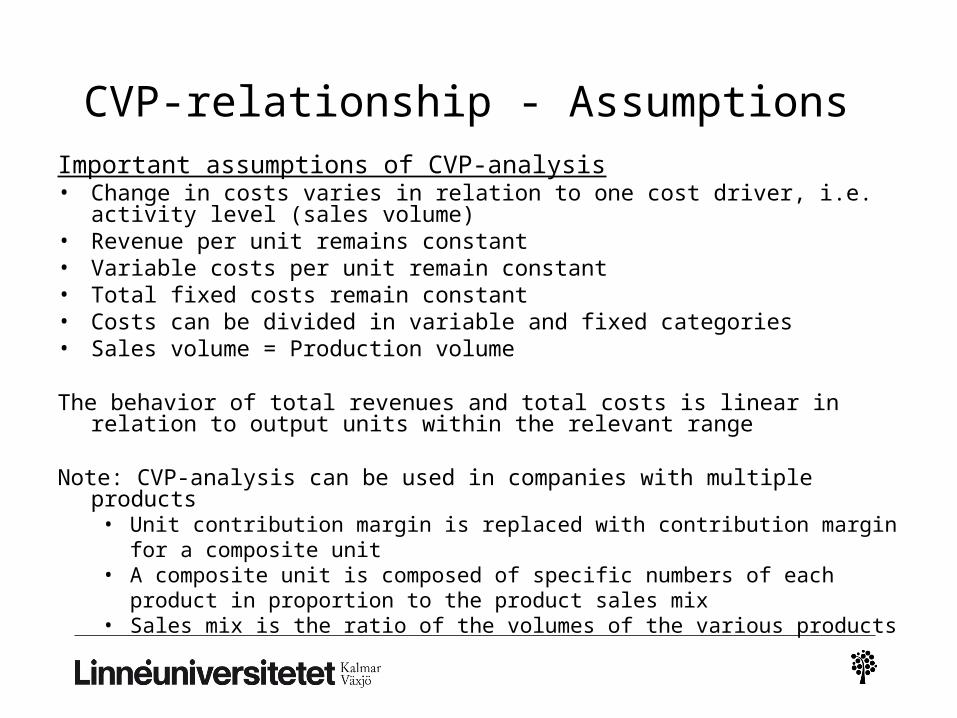
CVP-relationship - AssumptionsImportant assumptions of CVP-analysis• Change in costs varies in relation to one cost driver, i.e. activity level (sales
volume) • Revenue per unit remains constant• Variable costs per unit remain constant• Total fixed costs remain constant• Costs can be divided in variable and fixed categories• Sales volume = Production volume
The behavior of total revenues and total costs is linear in relation to output units within the relevant range
Note: CVP-analysis can be used in companies with multiple products• Unit contribution margin is replaced with contribution margin for a composite unit• A composite unit is composed of specific numbers of each product in proportion to
the product sales mix• Sales mix is the ratio of the volumes of the various products
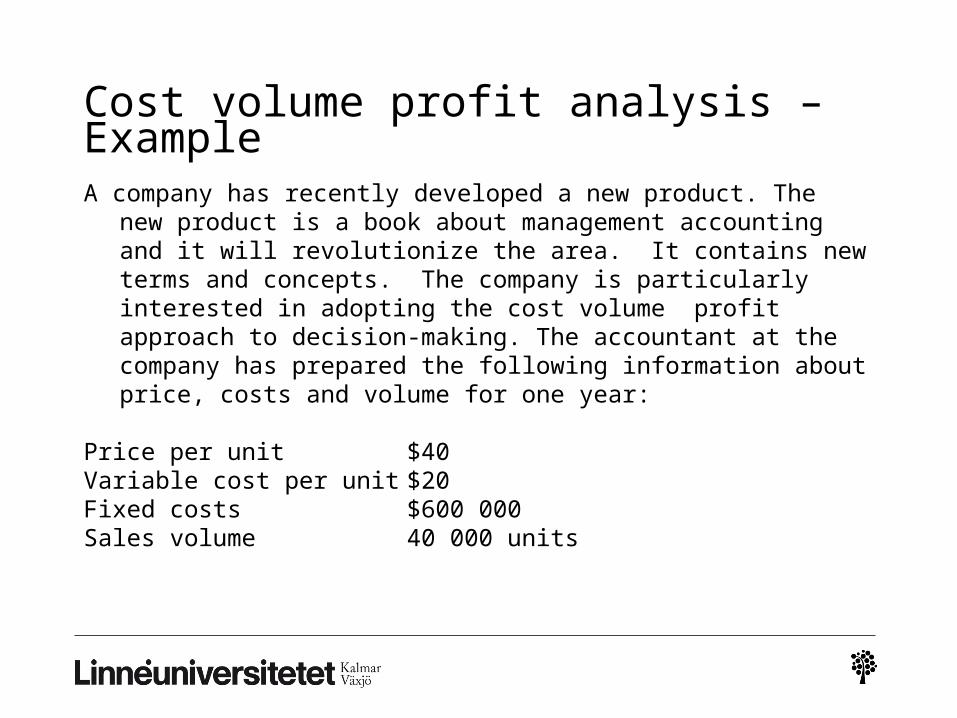
Cost volume profit analysis – Example
A company has recently developed a new product. The new product is a book about management accounting and it will revolutionize the area. It contains new terms and concepts. The company is particularly interested in adopting the cost volume profit approach to decision-making. The accountant at the company has prepared the following information about price, costs and volume for one year:
Price per unit $40Variable cost per unit $20Fixed costs $600 000Sales volume 40 000 units
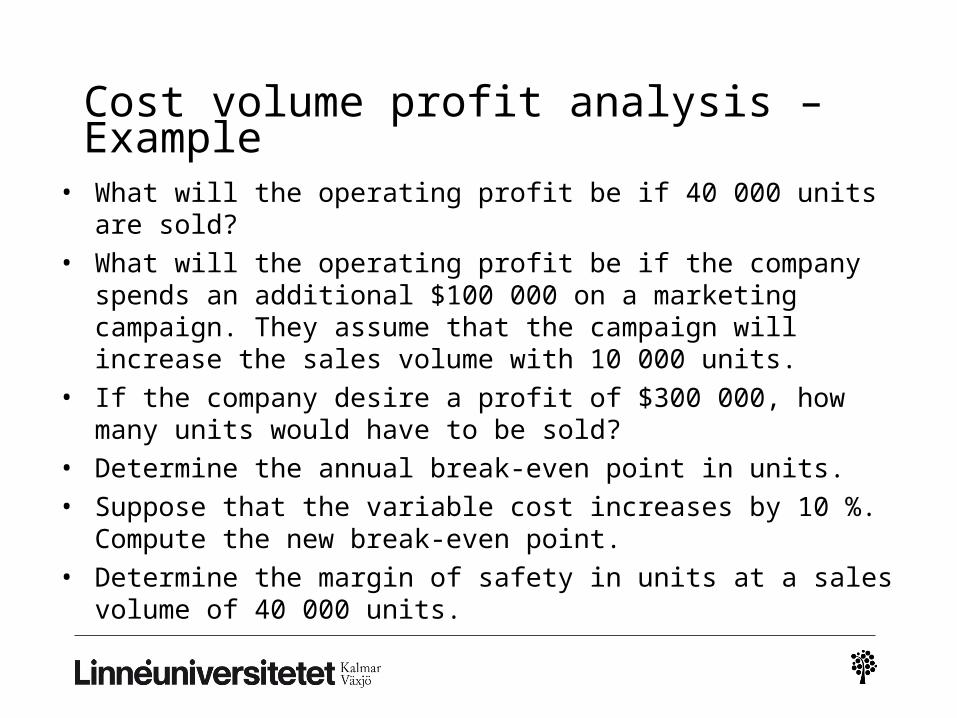
Cost volume profit analysis – Example
• What will the operating profit be if 40 000 units are sold?
• What will the operating profit be if the company spends an additional $100 000 on a marketing campaign. They assume that the campaign will increase the sales volume with 10 000 units.
• If the company desire a profit of $300 000, how many units would have to be sold?
• Determine the annual break-even point in units.
• Suppose that the variable cost increases by 10 %. Compute the new break-even point.
• Determine the margin of safety in units at a sales volume of 40 000 units.
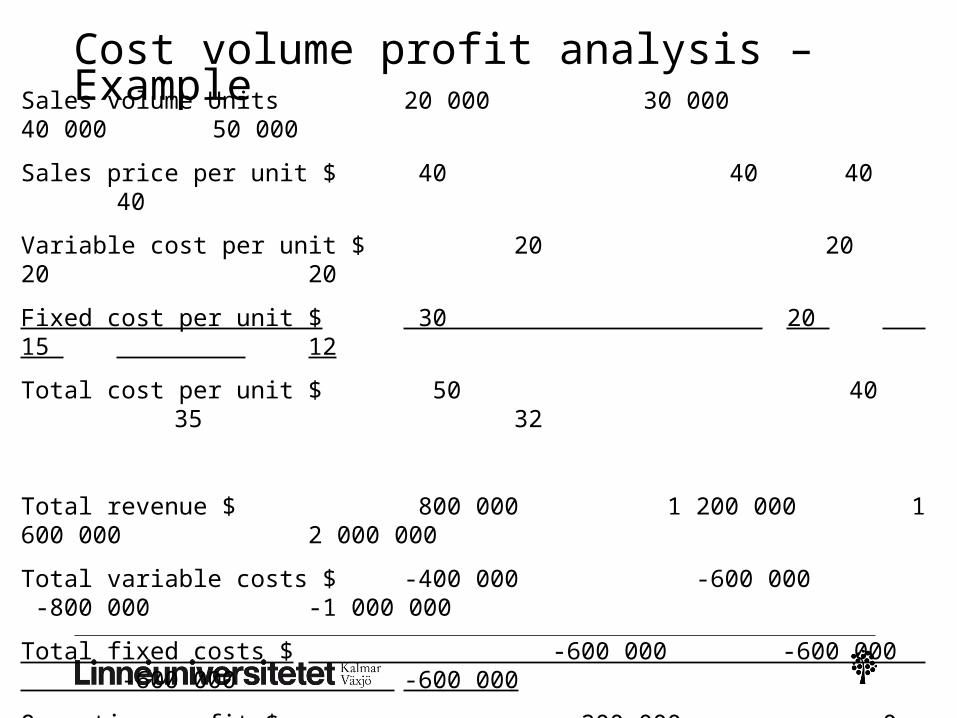
Cost volume profit analysis – Example Sales volume Units 20 000 30 000 40 000 50 000
Sales price per unit $ 40 40 40 40
Variable cost per unit $ 20 20 20 20
Fixed cost per unit $ 30 20 15 12
Total cost per unit $ 50 40 35 32
Total revenue $ 800 000 1 200 000 1 600 000 2 000 000
Total variable costs $ -400 000 -600 000 -800 000 -1 000 000
Total fixed costs $ -600 000 -600 000 -600 000 -600 000
Operating profit $ -200 000 0 200 000 400 000
(Total costs 1 000 000 1 200 000 1 400 000 1 600 000)
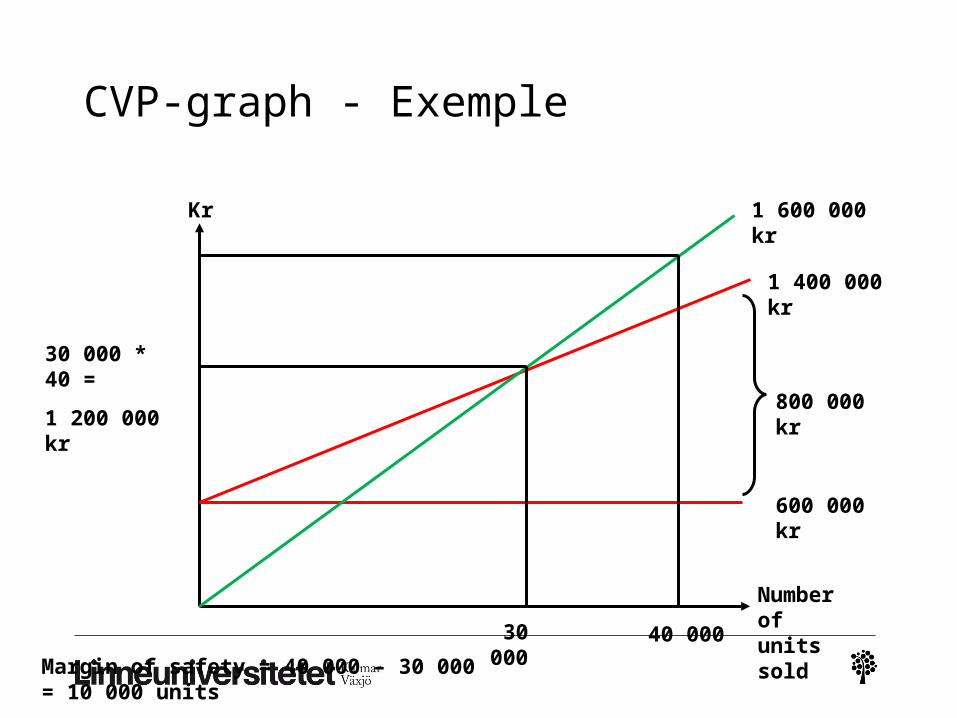
CVP-graph - Exemple
Kr
Number of units sold
600 000 kr
800 000 kr
1 400 000 kr
1 600 000 kr
30 000
30 000 * 40 =
1 200 000 kr
40 000 Margin of safety = 40 000 – 30 000 = 10 000 units
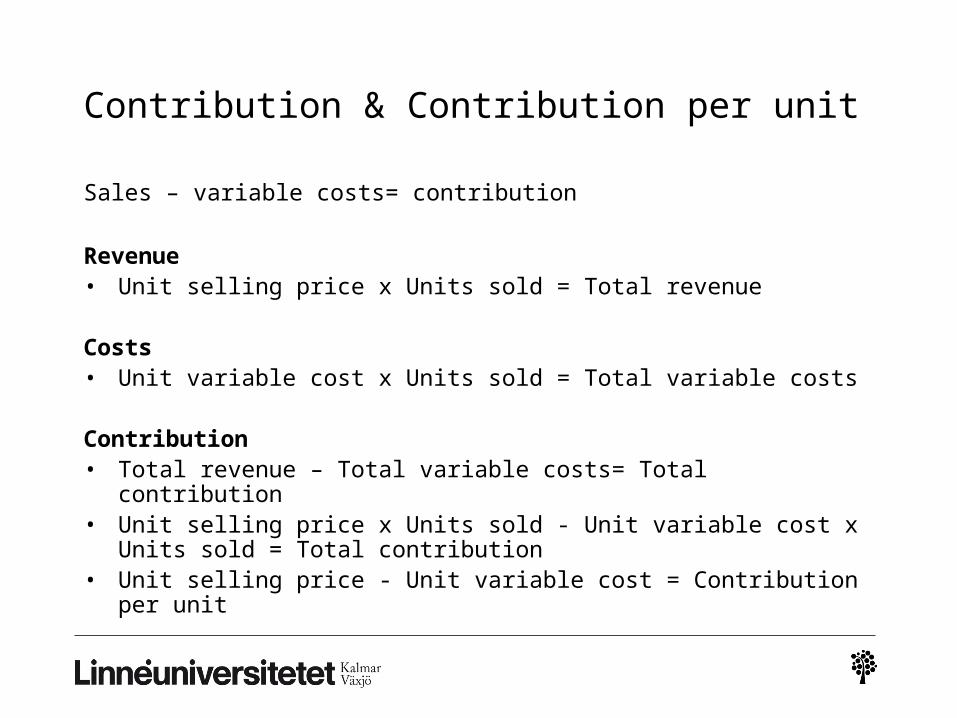
Contribution & Contribution per unit
Sales – variable costs= contribution
Revenue• Unit selling price x Units sold = Total revenue
Costs• Unit variable cost x Units sold = Total variable costs
Contribution• Total revenue – Total variable costs= Total contribution• Unit selling price x Units sold - Unit variable cost x Units
sold = Total contribution• Unit selling price - Unit variable cost = Contribution per unit
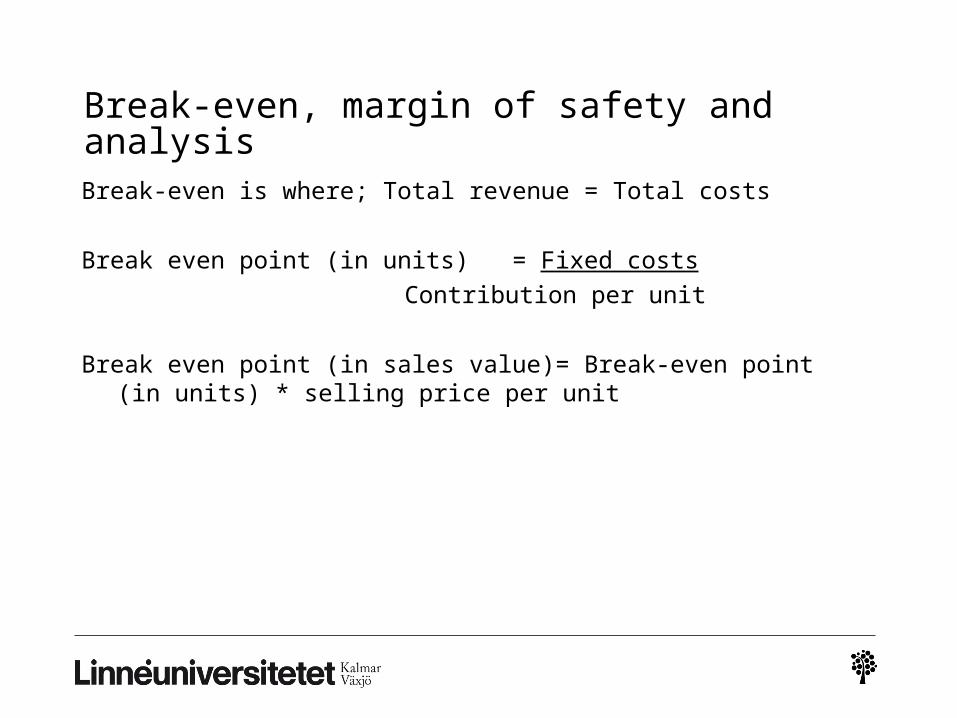
Break-even, margin of safety and analysis
Break-even is where; Total revenue = Total costs
Break even point (in units) = Fixed costs
Contribution per unit
Break even point (in sales value)= Break-even point (in units) * selling price per unit
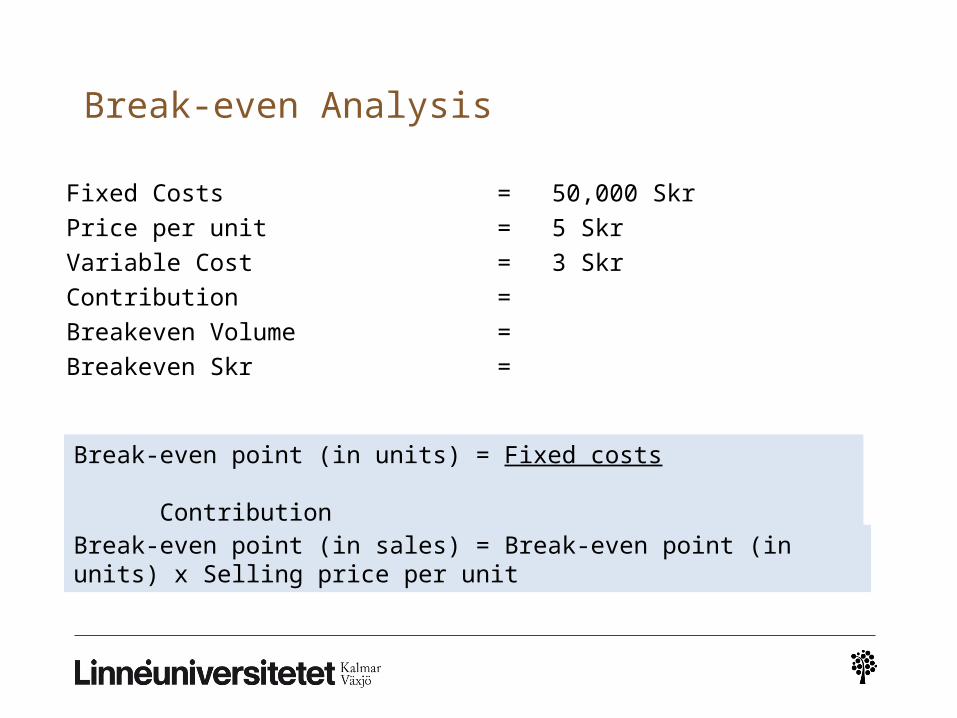
Break-even Analysis
Fixed Costs = 50,000 Skr
Price per unit = 5 Skr
Variable Cost = 3 Skr
Contribution =
Breakeven Volume =
Breakeven Skr =
Break-even point (in units) = Fixed costs Contribution
Break-even point (in sales) = Break-even point (in units) x Selling price per unit

Break-even Analysis
Fixed Costs = 50,000 Skr
Price per unit = 5 Skr
Variable Cost = 3 Skr
Contribution =
Breakeven Volume =
Breakeven Skr =
Break-even point (in units) = Fixed costs Contribution
Break-even point (in sales) = Break-even point (in units) x Selling price per unit
Relevant costs for decision-making are:
Future expenditures unique to the decision alternatives under
consideration.
Expected to occur in the future
Differ among marketing alternatives being considered
In general, opportunity costs are considered relevant
costs
Sunk costs for decision-making are:
The direct opposite of relevant costs.
Past expenditures for a given activity
Typically irrelevant in whole or in part to future decisions
Examples of sunk costs:Past marketing research and development expendituresLast year’s advertising expense
When opportunity costs are relevant, an example:
The oportunity cost represent ”by the forgone potential benefit from the best rejected cource of action”
Sid 178
+ Selling price- Variable cost- Opportunity cost= Operational profit or loss
Limiting factors
Avalable capacity
Limited capacity

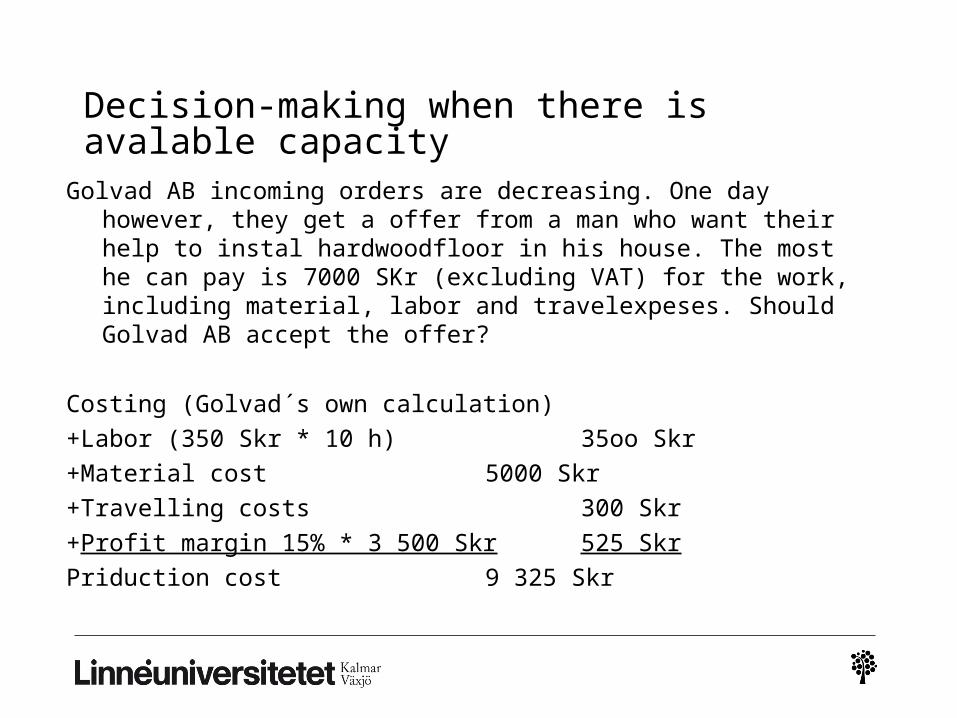
Decision-making when there is avalable capacity
Golvad AB incoming orders are decreasing. One day however, they get a offer from a man who want their help to instal hardwoodfloor in his house. The most he can pay is 7000 SKr (excluding VAT) for the work, including material, labor and travelexpeses. Should Golvad AB accept the offer?
Costing (Golvad´s own calculation)
+Labor (350 Skr * 10 h) 35oo Skr
+Material cost 5000 Skr
+Travelling costs 300 Skr
+Profit margin 15% * 3 500 Skr 525 Skr
Priduction cost 9 325 Skr

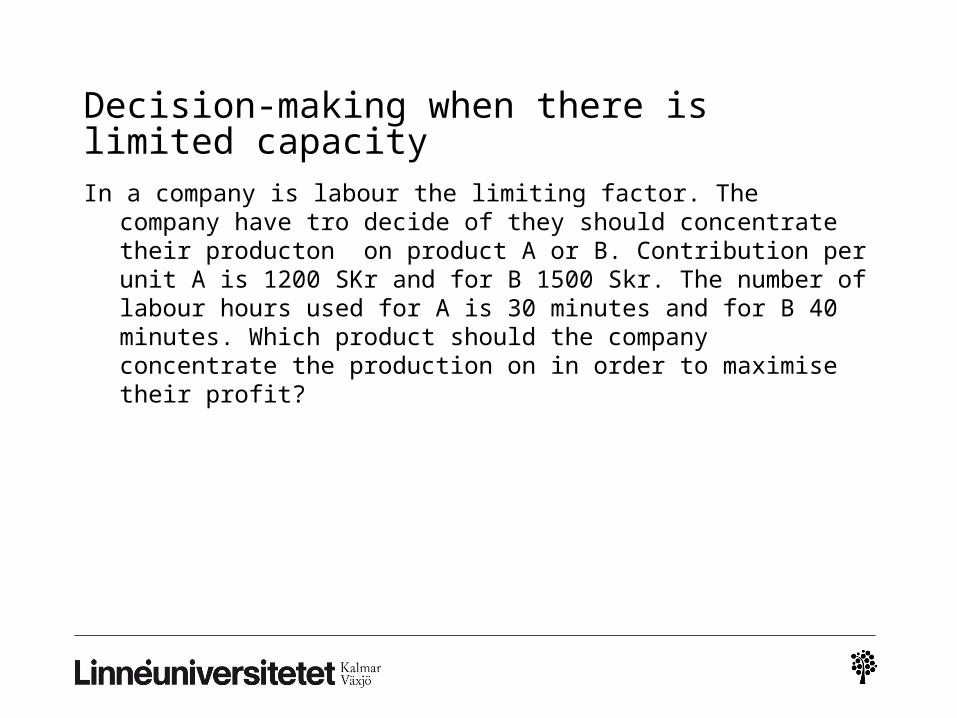
Decision-making when there is limited capacity
In a company is labour the limiting factor. The company have tro decide of they should concentrate their producton on product A or B. Contribution per unit A is 1200 SKr and for B 1500 Skr. The number of labour hours used for A is 30 minutes and for B 40 minutes. Which product should the company concentrate the production on in order to maximise their profit?
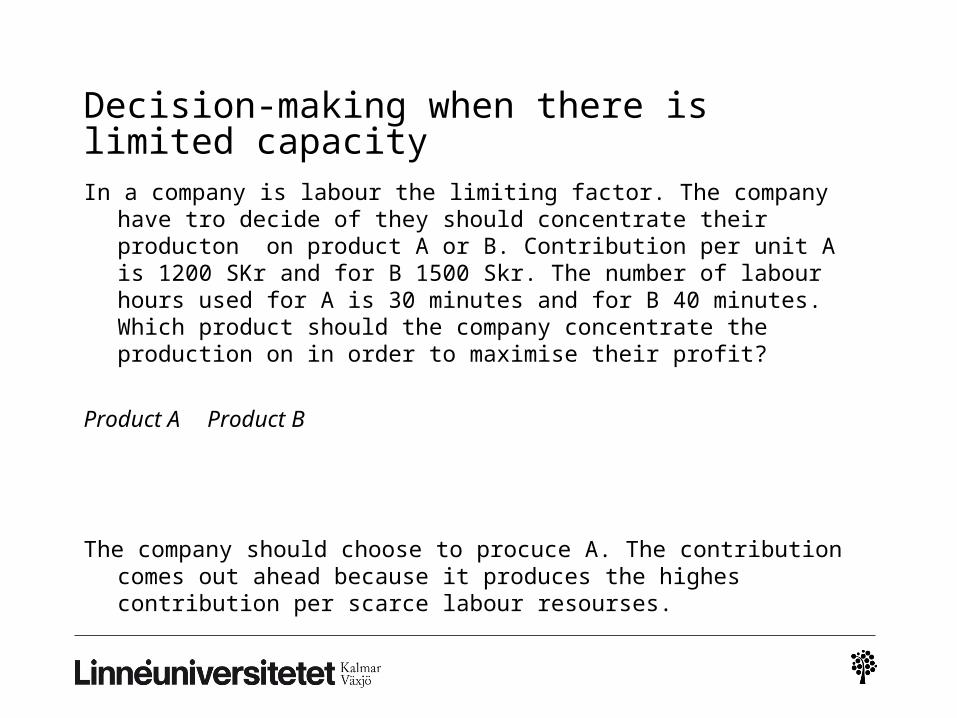
Product A Product B
The company should choose to procuce A. The contribution comes out ahead because it produces the highes contribution per scarce labour resourses.
Limiting factors (cont.)
We continue with the company in the last example. We know the contribution per limiting factor (labour hours). In order to count the total contribution we need to know how many units which can be produced.
Suppose the capacity is 4000 labour hours = 240 000 minutes (4000 hours * 60 minutes).
The maximum products of A that can be produced is 240 000 minutes / 30 minutes per unit = 8000 units.
Product B can produce 240 000 minutes/40 minutes per unit = 6 000 units.
Which product gives the best profit? The total contribution is counted as:
Product A 1200 SKr * 8000 units = 9600 000 SKr
Product B 1500 SKr * 6000 units = 9 000 000 Skr
The calculation shows that we should choose product A because it gives the best profit.