Embed Size (px)
Citation preview

INTERNATIONAL HYDROLOGICAL PROGRAMME ____________________________________________________________
Hydrology of wadi systemsIHP regional network on wadi hydrology in the Arab region
In co-operation with the Arab League Educational, Cultural and ScientificOrganization (ALECSO) and the Arab Centre for Studies of Arid Zonesand Dry Lands (ACSAD)
Edited by Howard Wheater and Radwan A. Al-Weshah
_____________________________________________________________
IHP-V Technical Documents in Hydrology No. 55UNESCO, Paris, 2002

ii
The designations employed and the presentation of material throughout the publication do not imply the expression of any
opinion whatsoever on the part of UNESCO concerning the legal status of any country, territory, city or of its authorities, or
concerning the delimitation of its frontiers or boundaries.
SC-2002/WS/33

iii
TABLE OF CONTENTS
Chapter One:
Introduction …………………………………………………………...…
Howard S. Wheater and Radwan A. Al-Weshah
1
PART 1 THE SCIENCE OF WADI SYSTEMS
Chapter Two:
Hydrological processes in arid and semi-arid areas …………………
Howard S. Wheater
5
Chapter Three:
Applications of geochemical and isotopic methods:……………………
A case study of Wadi Hawad, Sudan
W. Mike Edmunds
23
Chapter Four:
Sediment and the vulnerability of water resources ……………………
Abdulaziz A. Alhamid and Ian Reid
37
PART II OPERATIONAL WADI HYDROLOGY AND HYDROLOGICAL MODELLING
Chapter Five:
Data acquisition …………………………………………………………
Jean Khouri
57
Chapter Six:
Rainfall-runoff analysis and modelling in wadi systems ………………
Radwan A. Al-Weshah
87
PART III MANAGEMENT OF WADI SYSTEMS
Chapter Seven:
Integrated development of wadi systems ………………………………
Majid Benbiba
113
Chapter Eight:
Developpement integre de l'hydrologie des oueds (in French) ………
Mohamed Ridha Kallel
123
Chapter Nine:
Sustainable management of wadi systems ……………………………
Abdin M. A. Salih and Ashraf H. M. Ghanem
147

1
CHAPTER ONE
INTRODUCTION
Howard. S. Wheater1 and Radwan Al-Weshah2
1 Professor of Hydrology, Imperial College, London SW7 2BU, UK2 Regional Hydrologist, UNESCO Cairo Office, Cairo, Egypt and Associate Professor of Hydrology and Water Resources Engineering, The University of Jordan, Amman, Jordan (on leave); e-mail: [email protected]
Wadi Hydrology has emerged as a distinct scientific area within the last decade, due mainlyto the initiative of a small number of individuals within and without the Arab region, and the active support of UNESCO, assisted by ACSAD and ALECSO. This has been due to the recognition that the hydrology of arid and semi-arid areas is very different from that of humid areas and raises important scientific, technical and logistical challenges, and that an improvedscience base is essential to meet current and future needs of water management.
By definition, water is a scarce resource in arid regions, and most countries of the Arabregion and other arid and semi-arid areas are facing severe pressures due to limited water resources. These pressures are expected to increase in the face of expanding populations and the increased per capita water use associated with economic development. Globally,projections are that by 2025, 5 billion people will live in countries experiencing moderate or severe water stress (WMO, 1997, Arnell, 1999); evidently conditions will be most severe for the driest regions of the world.
In addition, there is growing recognition that climate change is a significant factor in waterresource planning. While projections of future climate vary greatly between different models and emissions scenarios (IPCC, 1997), there is concensus that most of the arid and semi-aridregions of the world can expect an increase in water stress.
Given these challenges, improved planning, development and management of scarce waterresources is essential to maximise the available resource and balance competing uses, i.e.industrial, domestic and agricultural and the needs of the environment. And associated withthe management of water quantity is the management of wastes and water quality, to protect natural systems and maintain the quality of available resources. However, appropriatedevelopment of water resources and their integrated management depends on an adequatescientific understanding of the hydrological processes. In addition, to achieve sustainable use of water resources requires a good understanding of the variability of hydrological processes in time, both within and between years.
This publication has arisen from a UNESCO initiative to develop a programme in WadiHydrology for the Arab region, leading to an improved science base and appropriate decision support tools for the integrated management of wadi systems. This programme has beendeveloped through a series of regional workshops, and has led, for example, to international

2
training programmes, a recent international conference (Sharm el Sheikh, 2000), and theformulation of an international Wadi Hydrology Network to provide high quality data and atest-bed for the development of appropriate tools for modelling and analysis. The aim of this publication is to summarise the scientific, technical and management issues associated withthe integrated management of Wadi systems.
The individual contributions are as follows:
PART 1 THE SCIENCE OF WADI SYSTEMS
In Chapter 2, Wheater reviews the scientific understanding of arid and semi-arid hydrological processes, focussing particularly on rainfall variability in space and time, runoff processes,and transmission losses from ephemeral wadi flows, and discusses the implications of thisprocess understanding for rainfall-runoff and water resource modelling.
Groundwater is a vital resource for the region, and the estimation of groundwater recharge one of the most difficult aspects in defining sustainable rates of groundwater abstraction. InChapter 3 Edmunds presents a case study from Sudan which demonstrates the potential ofgeochemical and isotopic methods to give quantitative insight into groundwater systems andsurface water-groundwater interactions.
Sediment transport is a major practical issue in considering sustainability of surface watermanagement, whether for floods or water resources, and data and desgn guidance areextremely limited. The state-of-the-art is reviewed by Alhamid and Reid in Chapter 4.
PART II OPERATIONAL WADI HYDROLOGY AND HYDROLOGICAL MODELLING
Data are essential to underpin both scientific advancement and effective management of wadi systems, yet the harsh environment and infrequent nature of hydrological events pose major problems for instrumentation and operational management, and the complex nature of theprocesses means that networks must be carefully designed for a given purpose. In Chapter 5, Khouri discusses the essential issue of data acquisition. Specific aspects covered include data needs, and the development and design of surface water and groundwater networks.
Hydrological modelling is a powerful tool to support hydrological and water resource designand management, yet few methods have been developed and validated for arid areas. InChapter 5, Al-Weshah describes commonly-applied methods of rainfall-runoff analysis and modelling in wadi systems. He points the way forward to research needs and futuredevelopments, and review selected computer models that can be applied to arid regions. Acase study was presented at the end of this chapter.
PART III MANAGEMENT OF WADI SYSTEMS
This final section draws on extensive operational experience from the region to discuss the context for water resource management. In Chapter 7, Benbiba discusses constraints on water resources development, the assessment, planning and management of water resources,legislative aspects and the needs for research and training.

3
In Chapter 8, Kallel presents an integrated view of hydrological management, including the development of hydrological services, the development of monitoring infrastructure, methods of analysis, process understanding and provision of technical support.
Finally, in Chapter 9, Salih and Ghanem provide the context of sustainable management,including the challenges of integrating technical, socio-economic, environmental andinstitutional and legal aspects, drawing on case study experience from Saudi Arabia.
This study is implemented by UNESCO Cairo Office under the activities of the ArabNetwork in Wadi Hydrology established in 1996 in cooperation with ALECSO (ArabLeaguge Educational, Cultural, and Scientific Organization), and ACSAD (Arab Center forStudies of Arid Zones and Dry Lands). All articles presented in this book peer reviewed. The efforts of Dr. Abdin Salih and his successor Dr. Radwan Al-Weshah, as a regionalhydrologist in UNESCO Cairo Office, to this publications are highly appreciated.
REFERENCES
Arnell N.W., 1999b, “Climate change and global water resources”, Global Environmental Change 9, pp. S31-S49, Elsevier Science Ltd.
IPCC, 1997, “An Introduction to Simple Climate Models used in the IPCC Second AssessmentReport”, (ed.) Houghton J.T., Filho L.G.M., Griggs D.J., and Maskell K., IPCC Working Group I, Web Site: http://www.ipcc.ch
World Meteorological Organisation, 1997. Comprehensive Assessment of the FreshwaterResources of the World. WMO, Geneva, 34pp.
5
CHAPTER TWO
HYDROLOGICAL PROCESSES IN ARID AND SEMI ARID AREAS
Howard S. Wheater
Professor of Hydrology, Department of Civil and Environmental Engineering,
Imperial College of Science, Technology and Medicine, London SW7 2BU, UK
2.1 INTRODUCTION
The arid and semi-arid regions of the world are under severe and increasing pressure due to expanding populations, increasing per capita water use, and limited water resources.Increasing volumes of industrial and domestic waste provide a major threat to those scarce resources, and increasing development also creates new pressures for flood protection of lives and infrastructure. Effective management is essential, and this requires appropriateunderstanding of the hydrological processes in these areas.
Despite the critical importance of water in arid and semi-arid areas, hydrological data have historically been severely limited. It has been widely stated that the major limitation of the development of arid zone hydrology is the lack of high quality observations (McMahon,1979; Nemec and Rodier, 1979; Pilgrim et al., 1988). There are many good reasons for this. Populations are usually sparse and economic resources limited; in addition the climate isharsh and hydrological events infrequent, but damaging. However, in the general absence of reliable long-term data and experimental research, there has been a tendency to rely on humid zone experience and modelling tools, and data from other regions. At best, such results willbe highly inaccurate. At worst, there is a real danger of adopting inappropriate managementsolutions, which ignore the specific features of dryland response.
Despite the general data limitations, there has been some substantial and significant progress in development of national data networks and experimental research. This has given newinsights and we can now see with greater clarity the unique features of arid zone hydrological systems and the nature of the dominant hydrological processes. This provides an important opportunity to develop methodologies for flood and water resource management which are appropriate to the specific hydrological characteristics of arid areas and the associatedmanagement needs, and hence to define priorities for research and hydrological data. The aim of this introductory chapter is to review this progress and the resulting insights, and toconsider some of the implications.

6
2.2 RAINFALL
Rainfall is the primary hydrological input, but rainfall in arid and semi-arid areas iscommonly characterised by extremely high spatial and temporal variability. The temporalvariability of point rainfall is well-known. Although most records are of relatively shortlength, a few are available from the 19th century. For example, Table 2.1 presents illustrative data from Muscat (Sultanate of Oman) (Wheater and Bell, 1983), which shows that a wet month is one with one or two raindays. Annual variability is marked and observed dailymaxima can exceed annual rainfall totals.
For spatial characteristics, information is much more limited. Until recently, the majorsource of detailed data has been from the South West U.S.A., most notably the two, relatively small, densely instrumented basins of Walnut Gulch, Arizona (150km2) and AlamogordoCreek, New Mexico (174km2), established in the 1950s (Osborn et al., 1979). The dominantrainfall for these basins is convective; at Walnut Gulch 70% of annual rainfall occurs frompurely convective cells, or from convective cells developing along weak, fast-moving cold fronts, and falls in the period July to September (Osborn and Reynolds, 1963). Raingauge densities were increased at Walnut Gulch to give improved definition of detailed stormstructure and are currently better than 1 per 2km2. This has shown highly localised rainfall occurrence, with spatial correlations of storm rainfall of the order of 0.8 at 2km separation, but close to zero at 15-20km spacing. Osborn et al. (1972) estimated that to observe a correlation of r2 = 0.9, raingauge spacings of 300-500m would be required.
Recent work has considered some of the implications of the Walnut Gulch data forhydrological modelling. Michaud and Sorooshian (1994) evaluated problems of spatialaveraging for rainfall-runoff modelling in the context of flood prediction. Spatial averagingon a 4kmx4km pixel basis (consistent with typical weather radar resolution) gave anunderestimation of intensity and led to a reduction in simulated runoff of on average 50% of observed peak flows. A sparse network of raingauges (1 per 20km2), representing a typical density of flash flood warning system, gave errors in simulated peak runoff of 58%.Evidently there are major implications for hydrological practice, and we will return to thisissue, below.
The extent to which this extreme spatial variability is characteristic of other arid areas hasbeen uncertain. Anecdotal evidence from the Middle East underlay comments that spatial and temporal variability was extreme (FAO, 1981), but recent data from South West Saudi Arabia obtained as part of a five-year intensive study of five basins (Saudi Arabian Dames and Moore, 1988), undertaken on behalf of the Ministry of Agriculture and Water, Riyadh, have provided a quantitative basis for assessment. The five study basins range in area from 456 to 4930 km2 and are located along the Asir escarpment, three draining to the Red Sea, two to the interior, towards the Rub al Khali. The mountains have elevations of up to 3000m a.s.l.,hence the basins encompass a wide range of altitude, which is matched by a marked gradient in annual rainfall, from 30-100mm on the Red Sea coastal plain to up to 450mm at elevations in excess of 2000m a.s.l.

7
The spatial rainfall distributions are described by Wheater et al.(1991a). The extremespottiness of the rainfall is illustrated for the 2869km2 Wadi Yiba by the frequencydistributions of the number of gauges at which rainfall was observed given the occurrence of a catchment rainday. Typical inter-gauge spacings were 8-10km, and on 51% of raindays only one or two raingauges out of 20 experienced rainfall. For the more widespread events, sub-daily rainfall showed an even more spotty picture than the daily distribution. Ananalysis of relative probabilities of rainfall occurrence, defined as the probability of rainfalloccurrence for a given hour at Station B given rainfall at Station A, gave a mean value of 0.12 for Wadi Yiba, with only 5% of values greater that 0.3. The frequency distribution of rainstorm durations shows a typical occurrence of one or two-hour duration point rainfalls, and these tend to occur in mid-late afternoon. Thus rainfall will occur at a few gauges and die out, to be succeeded by rainfall in other locations. In general, the storm patterns appear to be consistent with the results from the South West USA and area reduction factors were also generally consistent with results from that region (Wheater et al., 1989).
The effects of elevation were investigated, but no clear relationship could be identified forintensity or duration. However, a strong relationship was noted between the frequency ofraindays and elevation. It was thus inferred that once rainfall occurred, its point properties were similar over the catchment, but occurrence was more likely at the higher elevations. It is interesting to note that a similar result has emerged from a recent analysis of rainfall inYemen (UNDP, 1992), in which it was concluded that daily rainfalls observed at any location are effectively samples from a population that is independent of position or altitude.
It is dangerous to generalise from samples of limited record length, but it is clear that most events observed by those networks are characterized by extremely spotty rainfall, so much so that in the Saudi Arabian basins there were examples of wadi flows generated from zeroobserved rainfall. However, there were also some indications of a small population of more wide-spread rainfalls, which would obviously be of considerable importance in terms ofsurface flows and recharge. This reinforces the need for long-term monitoring ofexperimental networks to characterise spatial variability.
For some other arid or semi-arid areas, rainfall patterns may be very different. For example, data from arid New South Wales, Australia have indicated spatially extensive, low intensityrainfalls (Cordery et al., 1983), and recent research in the Sahelian zone of Africa has also indicated a predominance of widespread rainfall. This was motivated by concern to develop improved understanding of land-surface processes for climate studies and modelling, whichled to a detailed (but relatively short-term) international experimental programme, theHAPEX-Sahel project based on Niamey, Niger (Goutorbe et al., 1997). Although designed to study land surface/atmosphere interactions, rather than as an integrated hydrological study, it has given important information. For example, Lebel et al. (1997) and Lebel and Le Barbe (1997) note that a 100 raingauge network was installed and report information on theclassification of storm types, spatial and temporal variability of seasonal and event rainfall,and storm movement. 80% of total seasonal rainfall was found to fall as widespread events which covered at least 70% of the network. The number of gauges allowed the authors to analyse the uncertainty of estimated areal rainfall as a function of gauge spacing and rainfall depth.

8
Recent work in southern Africa (Andersen et al., 1998, Mocke, 1998) has been concerned with rainfall inputs to hydrological models to investigate the resource potential of the sandrivers of N.E.Botswana. Here, annual rainfall is of the order of 600mm, and available rainfall data is spatially sparse, and apparently highly variable, but of poor data quality. Investigation of the representation of spatial rainfall for distributed water resource modelling showed that use of convential methods of spatial weighting of raingauge data, such as Theissen polygons, could give large errors. Large sub-areas had rainfall defined by a single, possibly inaccurate gauge. A more robust representation resulted from assuming catchment-average rainfall tofall uniformly, but the resulting accuracy of simulation was still poor.
2.3 RAINFALL-RUNOFF PROCESSES
The lack of vegetation cover in arid and semi-arid areas removes protection of the soil from raindrop impact, and soil crusting has been shown to lead to a large reduction in infiltration capacity for bare soil conditions (Morin and Benyamini, 1977). Hence infiltration ofcatchment soils can be limited. In combination with the high intensity, short durationconvective rainfall discussed above, extensive overland flow can be generated. This overland flow, concentrated by the topography, converges on the wadi channel network, with the result that a flood flow is generated. However, the runoff generation process due to convective rainfall is likely to be highly localised in space, reflecting the spottiness of the spatial rainfallfields, and to occur on only part of a catchment, as illustrated above.
Linkage between inter-annual variability of rainfall, vegetation growth and runoff productionmay occur. Current modelling in Botswana suggests that runoff production is lower in a year that follows a wet year, due to enhanced vegetation cover, which supports observationsreported by Hughes (1995).
Commonly, flood flows move down the channel network as a flood wave, moving over a bed that is either initially dry or has a small initial flow. Hydrographs are typically characterised by extremely rapid rise times, of as little as 15-30 minutes. However, losses from the flood hydrograph through bed infiltration are an important factor in reducing the flood volume as the flood moves downstream. These transmission losses dissipate the flood, and obscure the interpretation of observed hydrographs. It is not uncommon for no flood to be observed at a gauging station, when further upstream a flood has been generated and lost to bed infiltration.
As noted above, the spotty spatial rainfall patterns observed in Arizona and Saudi Arabia are extremely difficult, if not impossible, to quantify using conventional densities of raingaugenetwork. This, taken in conjunction with the flood transmission losses, means thatconventional analysis of rainfall-runoff relationships is problematic, to say the least. Wheater and Brown (1989) present an analysis of Wadi Ghat, a 597 km2 sub-catchment of wadi Yiba, one of the Saudi Arabian basins discussed above. Areal rainfall was estimated from 5raingauges and a classical unit hydrograph analysis was undertaken. Runoff coefficientsranged from 5.9 to 79.8%, and the greatest runoff volume was apparently generated by the smallest observed rainfall! Goodrich et al. (1997) show that the combined effects of limited storm areal coverage and transmission loss give important differences from more humidregions. Whereas generally basins in more humid climates show increasing linearity with

9
increasing scale, the response of Walnut Gulch becomes more non-linear with increasingscale. It is argued that this will give significant errors in application of rainfall depth-area-frequency relationships beyond the typical area of storm coverage, and that channel routingand transmission loss must be explicitly represented in watershed modelling.
The transmission losses from the surface water system are a major source of potentialgroundwater recharge. The characteristics of the resulting groundwater resource will depend on the underlying geology, but bed infiltration may generate shallow water tables, within afew metres of the surface, which can sustain supplies to nomadic people for a few months (as in the Hesse of the North of South Yemen), or recharge substantial alluvial aquifers withpotential for continuous supply of major towns (as in Northern Oman and S.W. SaudiArabia).
The balance between localised recharge from bed infiltration and diffuse recharge fromrainfall infiltration of catchment soils will vary greatly depending on local circumstances.However, soil moisture data from Saudi Arabia (Macmillan, 19XX) and Arizona (Liu et al., 1995), for example, show that most of the rainfall falling on soils in arid areas is subsequently lost by evaporation. Methods such as the chloride profile method (e.g. Bromley et al., 1997) and isotopic analyses (Allison and Hughes, 1978) have been used to quantify the residualpercolation to groundwater in arid and semi-arid areas.
In some circumstances runoff occurs within an internal drainage basin, and fine deposits cansupport widespread surface ponding. A well known large-scale example is the Azraq oasis in N.E. Jordan, but small-scale features (Qaa’s) are widespread in that area. Small scaleexamples were found in the HAPEX-Sahel study (Desconnets et al., 1997). Infiltration from these areas is in general not well understood, but may be extremely important for aquiferrecharge. Desconnets et al. report aquifer recharge of between 5 and 20% of basinprecipitation for valley bottom pools, depending on the distribution of annual rainfall.
The characteristics of the channel bed infiltration process are discussed in the followingsection. However, it is clear that the surface hydrology generating this recharge is complex and extremely difficult to quantify using conventional methods of analysis.
2.4 WADI BED TRANSMISSION LOSSES
Wadi bed infiltration has an important effect on flood propagation, but also provides recharge to alluvial aquifers. The balance between distributed infiltration from rainfall and wadi bed infiltration is obviously dependant on local conditions, but soil moisture observations fromS.W. Saudi Arabia imply that, at least for frequent events, distributed infiltration ofcatchment soils is limited, and that increased near surface soil moisture levels aresubsequently depleted by evaporation. Hence wadi bed infiltration may be the dominantprocess of groundwater recharge. As noted above, depending on the local hydrogeology,alluvial groundwater may be a readily accessible water resource. Quantification oftransmission loss is thus important, but raises a number of difficulties.

10
One method of determining the hydraulic properties of the wadi alluvium is to undertakeinfiltration tests. Infiltrometer experiments give an indication of the saturated hydraulicconductivity of the surface. However, if an infiltration experiment is combined withmeasurement of the vertical distribution of moisture content, for example using a neutronprobe, inverse solution of a numerical model of unsaturated flow can be used to identify the unsaturated hydraulic conductivity relationships and moisture characteristic curves. This isillustrated for the Saudi Arabian Five Basins Study by Parissopoulos and Wheater (1992a).
In practice, spatial heterogeneity will introduce major difficulties to the up-scaling of point profile measurements. The presence of silt lenses within the alluvium was shown to haveimportant effects on surface infiltration as well as sub-surface redistribution (Parissopoulosand Wheater, 1990), and sub-surface heterogeneity is difficult and expensive to characterise.In a series of two-dimensional numerical experiments it was shown that “infiltrationopportunity time”, i.e. the duration and spatial extent of surface wetting, was more important than high flow stage in influencing infiltration, that significant reductions in infiltration occuronce hydraulic connection is made with a water table, and that hysteresis effects weregenerally small (Parissopoulos and Wheater, 1992b). Also sands and gravels appearedeffective in restricting evaporation losses from groundwater (Parissopoulos and Wheater,1991).
Additional process complexity arises, however. General experience from the Five BasinsStudy was that wadi alluvium was highly transmissive, yet observed flood propagationindicated significantly lower losses than could be inferred from in situ hydraulic properties,even allowing for sub-surface heterogeneity. Possible causes are air entrapment, which could restrict infiltration rates, and the unknown effects of bed mobilisation and possible poreblockage by the heavy sediment loads transmitted under flood flow conditions.
A commonly observed effect is that in the recession phase of the flow, deposition of a thin (1-2mm) skin of fine sediment on the wadi bed occurs, which is sufficient to sustain flow over an unsaturated and transmissive wadi bed. Once the flow has ceased, this skin dries and breaks up so that the underlying alluvium is exposed for subsequent flow events. Crerar et al., (1988) observed from laboratory experiments that a thin continous silt layer was formed at low velocities. At higher velocities no such layer occurred, as the bed surface was mobilised, but infiltration to the bed was still apparently inhibited. It was suggested that this could be due to clogging of the top layer of sand due to silt in the infiltrating water, or formation of a silt layer below the mobile upper part of the bed.
Further evidence for the heterogeneity of observed response comes from the observations of Hughes and Sami (1992) from a 39.6 km2 semi-arid catchment in S.Africa. Soil moisture was monitored by neutron probe following two flow events. At some locations immediateresponse (monitored 1day later) occurred throughout the profile, at others, an immediateresponse near surface was followed by a delayed response at depth. Away from the inundated area, delayed response, assumed due to lateral subsurface transmission, occurred after 21 days.

11
The overall implication of the above observations is that it is not possible at present toextrapolate from in-situ point profile hydraulic properties to infer transmission losses fromwadi channels. However, analysis of observed flood flows at different locations can allowquantification of losses, and studies by Walters (1990) and Jordan (1977), for example,provide evidence that the rate of loss is linearly related to the volume of surface discharge.
For S.W. Saudi Arabia, the following relationships were defined:-
LOSSL = 4.56 + 0.02216 UPSQ - 2034 SLOPE + 7.34 ANTEC
(s.e. 4.15)
LOSSL = 3.75 x 10⁻⁵ UPSQ0.821 SLOPE -0.865 ACWW0.497
(s.e. 0.146 log units (±34%))
LOSSL = 5.7 x 10⁻⁵ UPSQ0.968 SLOPE -1.049
(s.e. 0.184 loge units (±44%))
Where:-
LOSSL = Transmission loss rate (1000m3/km) (O.R.1.08-87.9)UPSQ = Upstream hydrograph volume (1000m3) (O.R. 69-3744)
SLOPE = Slope of reach (m/m) (O.R. 0.001-0.011)
ANTEC = Antecedent moisture index (O.R. 0.10-1.00)
ACWW = Active channel width (m) (O.R. 25-231)
and O.R. = Observed range
However, generalisation from limited experience can be misleading. Wheater et al. (1977)analysed transmission losses between 2 pairs of flow gauges on the Walnut Gulch catchment for a ten year sequence and found that the simple linear model of transmission loss asproportional to upstream flow was inadequate. Considering the relationship:
Vx = V0 (1- α)x

12
where Vx is flow volume (m3) at distance x downstream of flow volume V0 and α representsthe proportion of flow lost per unit distance, then α was found to decrease with discharge volume:
α = 118.8 (V0)-0.71
The events examined had a maximum value of average transmission loss of 4076 m3 km-1 in comparison with the estimate of Lane et al. (1971) of 4800-6700 m3 km-1 as an upper limit of available alluvium storage.
The role of available storage was also discussed by Telvari et al. (1998), with reference to the Fowler’s Gap catchment in Australia. Runoff plots were used to estimate runoff production as overland flow for a 4km2 basin. It was inferred that 7000 m3 of overland flow becomes transmission loss and that once this alluvial storage is satisfied, approximately two-thirds ofoverland flow is transmitted downstream.
A similar concept was developed by Andersen et al. (1998) at larger scale for the sand rivers of Botswana, which have alluvial beds of 20-200m width and 2-20m depth. Detailedobservations of water table response showed that a single major event after a seven weeks dry period was sufficient to fully satisfy available alluvial storage (the river bed reached fullsaturation within 10 hours). No significant drawdown occurred between subsequent events and significant resource potential remained throughout the dry season. It was suggested that two sources of transmission loss could be occurring, direct losses to the bed, limited byavailable storage, and losses through the banks during flood events.
It can be concluded that transmission loss is complex, that where deep unsaturated alluvial deposits exist the simple linear model as developed by Jordan (1977) and implicit in the results of Walters (1990) may be applicable, but that where alluvial storage is limited, this must be taken into account.
2.5 GROUNDWATER RECHARGE FROM EPHEMERAL FLOWS
The relationship between wadi flow transmission losses and groundwater recharge willdepend on the underlying geology. The effect of lenses of reduced permeability on theinfiltration process has been discussed and illustrated above, but once infiltration has takenplace, the alluvium underlying the wadi bed is effective in minimising evaporation lossthrough capillary rise (the coarse structure of alluvial deposits minimises capillary effects).Thus Hellwig (1973), for example, found that dropping the water table below 60cm in sand with a mean diameter of 0.53mm effectively prevented evaporation losses, and Sorey andMatlock (1969) reported that measured evaporation rates from streambed sand were lower than those reported for irrigated soils.
Parrisopoulos and Wheater (1991) combined two-dimensional simulation of unsaturatedwadi-bed response with Deardorff’s (1977) empirical model of bare soil evaporation to show

13
that evaporation losses were not in general significant for the water balance or water table response in short-term simulation (i.e. for periods up to 10 days). However, the influence of vapour diffusion was not explicitly represented, and long term losses are not well understood.Andersen et al. (1998) show that losses are high when the alluvial aquifer is fully saturated, but are small once the water table drops below the surface.
Sorman and Abdulrazzak (1993) provide an analysis of groundwater rise due to transmission loss for an experimental reach in Wadi Tabalah, S.W. Saudi Arabia and estimate that onaverage 75% of bed infiltration reaches the water table. There is in general little informationavailable to relate flood transmission loss to groundwater recharge, however. The differences between the two are expected to be small, but will depend on residual moisture stored in the unsaturated zone and its subsequent drying characteristics. But if water tables approach the surface, relatively large evaporation losses may occur.
Again, it is tempting to draw over-general conclusions from limited data. In the study of the sand-rivers of Botswana, referred to above, it was expected that recharge of the alluvial river beds would involve complex unsaturated zone response. In fact, observations showed that the first flood of the wet season was sufficient to fully recharge the alluvial river bed aquifer.This storage was topped up in subsequent floods, and depleted by evaporation when the water table was near-surface, but in many sections sufficient water remained throughout the dryseason to provide adequate sustainable water supplies for rural villages. And as noted above, Wheater et al. (1997) showed for Walnut Gulch and Telvari et al. (1998) for Fraser’s Gap that limited river bed storage affected transmission loss. It is evident that surfacewater/groundwater interactions depend strongly on the local characteristics of the underlyingalluvium and the extent of their connection to, or isolation from, other aquifer systems.
2.6 HYDROLOGICAL MODELLING AND THE REPRESENTATION OFRAINFALL
The preceding discussion illustrates some of the particular characteristics of arid areas whichplace special requirements on hydrological modelling, for example for flood management or water resources evaluation. One evident area of difficulty is rainfall, especially whereconvective storms are an important influence. The work of Michaud and Sorooshian (1994) demonstrated the sensitivity of flood peak simulation to the spatial resolution of rainfallinput. This obviously has disturbing implications for flood modelling, particularly where data availability is limited to conventional raingauge densities. Indeed, it appears highly unlikelythat suitable raingauge densities will ever be practicable for routine monitoring. However, the availability of 2km resolution radar data in the USA can provide adequate information and radar could be installed elsewhere for particular applications. Morin et al. (1995) reportresults from a radar located at Ben-Gurion airport in Israel, for example.
One way forward is to develop an understanding of the properties of spatial rainfall based on high density experimental networks and/or radar data, and represent those properties within a spatialrainfall model for more general application. It is likely that this would have to be done within astochastic modelling framework in which equally-likely realisations of spatial rainfall are produced, possibly conditioned by sparse observations.
14
Some simple empirical first steps in this direction were taken by Wheater et al. (1991a,b) for S.W. Saudi Arabia and Wheater et al. (1995) for Oman. In the Saudi Arabian studies, as noted earlier, raingauge data was available at approximately 10km spacing and spatialcorrelation was low. Hence a multi-variate model was developed, assuming independence of raingauge rainfall. Based on observed distributions, seasonally-dependent catchment raindayoccurrence was simulated, dependent on whether the preceding day was wet or dry. The number of gauges experiencing rainfall was then sampled, and the locations selected based on observed occurrences (this allowed for increased frequency of raindays with increasedelevation). Finally, start-times, durations and hourly intensities were generated. Modelperformance was compared with observations. Rainfall from random selections of raingauges was well reproduced, but when clusters of adjacent gauges were evaluated, a degree of spatial organisation of occurrence was observed, but not simulated. It was evident that a weak degree of correlation was present, which should not be neglected. Hence in extension of thisapproach to Oman (Wheater et al., 1995), observed spatial distributions were sampled, with satisfactory results.
However, this multi-variate approach suffers from limitations of raingauge density, and ingeneral a model in continuous space (and continuous time) is desirable. A family ofstochastic rainfall models of point rainfall was proposed by Rodriguez-Iturbe, Cox and Isham (1987, 1988) and applied to UK rainfall by Onof and Wheater (1993,1994). The basicconcept is that a Poisson process is used to generate the arrival of storms. Associated with a storm is the arrival of raincells, of uniform intensity for a given duration (sampled fromspecified distributions). The overlapping of these rectangular pulse cells generates the stormintensity profile in time. These models were shown to have generally good performance for the UK in reproducing rainfall properties at different time-scales (from hourly upwards), and extreme values.
Cox and Isham (1989) extended this concept to a model in space and time, whereby the raincells are circular and arrive in space within a storm region. As before, the overlapping of cells produces a complex rainfall intensity profile, now in space as well as time. This modelhas been developed further by Northrop (199X) to include elliptical cells and storms and is being applied to UK rainfall (Northrop et al., 1999).
Recent work (Samuel, 1999) has been exploring the capability of these models to reproduce the convective rainfall of Walnut Gulch. In modelling point rainfall, the Bartlett-LewisRectangular Pulse Model was generally slightly superior to other model variants tested. Table 2.1 shows representative performance of the model in comparing the hourly statistics from500 realisations of July rainfall in comparison with 35 years from one of the Walnut Gulchgauges (gauge 44).

15
Table 2.1 Performance of the Bartlett-Lewis Rectangular Pulse Model in representing Julyrainfall at gauge 44, Walnut Gulch
Mean Var ACF1 ACF2 ACF3 Pwet Mint Mno Mdur
Model 0.103 1.082 0.193 0.048 0.026 0.032 51.17 14.34 1.68
Data 0.100 0.968 0.174 0.040 0.036 0.042 53.71 13.23 2.38
Where Mean is the mean hourly rainfall (mm), Var its variance, ACF1,2,3 theautocorrelations for lags 1,2,3, Pwet the proportion of wet intervals, Mint the mean storminter-arrival time (h), Mno the mean number of storms per month, Mdur the mean stormduration (h).
This performance is generally encouraging (although the mean storm duration isunderestimated), and extreme value performance is excellent.
2.7 INTEGRATED MODELLING FOR WATER RESOURCE EVALUATION
Appropriate strategies for water resource development must recognise the essential physicalcharacteristics of the hydrological processes. Surface water storage, although subject to high evaporation losses, is widely used, although temporal variability of flows must be adequately represented to define long term yields. It can be noted that in some regions, for example, the northern areas of southern Yemen, small scale storage has been developed as an appropriate method to maximise the available resource from spatially-localised rainfall. Numbers ofsmall storages have been developed, some of which fill from localised rainfall. These thenprovide a short-term resource for a nomadic family and its livestock.
Groundwater is a resource particularly well suited to arid regions. Subsurface storageminimises evaporation loss and can provide long-term yields from infrequent rechargeevents. The recharge of alluvial groundwater systems by ephemeral flows can provide anappropriate resource, and this has been widely recognised by traditional development, such as the “afalaj” of Oman and elsewhere. There may, however, be opportunities for augmentingrecharge and more effectively managing these groundwater systems. In any case, it isessential to quantify the sustainable yield of such systems, for appropriate resourcedevelopment.
It has been seen that observations of surface flow do not define the available resource, and similarly observed groundwater response does not necessarily indicate upstream recharge.
In addition, records of surface flows and groundwater levels, coupled with ill-definedhistories of abstraction, are generally insufficient to define long term variability of theavailable resource.

16
To capture the variability of rainfall and the effects of transmission loss on surface flows, a distributed approach is necessary. If groundwater is to be included, integrated modelling ofsurface water and groundwater is needed. Distributed surface water models includeKINEROS (Wheater and Bell, 1983, Michaud and Sorooshian, 1994) and the model ofSharma (1997, 1998). A distributed approach to the integrated modelling of surface andgroundwater response following Wheater et al.(1995) is illustrated in Fig 2.8. This requires the characterisation of the spatial and temporal variability of rainfall, distributed infiltration,runoff generation and flow transmission losses, the ensuing groundwater recharge andgroundwater response. This presents some technical difficulties, although the integration ofsurface and groundwater modelling allows maximum use to be made of availableinformation, so that, for example, groundwater response can feed back information toconstrain surface hydrological parameterisation. It does, however, provide the only feasible method of exploring the internal response of a catchment to management options.
In a recent application, this integrated modelling approach was developed for Wadi Ghulaji, Sultanate of Oman, to evaluate options for groundwater recharge management (Wheater et al., 1995). The catchment, of area 758 km2, drains the southern slopes of Jebal Hajar in the Sharqiyah region of Northern Oman. Proposals to be evaluated included recharge dams to attenuate surface flows and provide managed groundwater recharge in key locations. Themodelling framework involved the coupling of a distributed rainfall model, a distributedwater balance model (incorporating rainfall-runoff processes, soil infiltration and wadi flowtransmission losses), and a distributed groundwater model.
The representation of rainfall spatial variability presents technical difficulties, since data arelimited. Detailed analysis was undertaken of 19 rain gauges in the Sharqiyah region, and of six raingauges in the catchment itself. A stochastic multi-variate temporal- spatial model was devised for daily rainfall, a modified version of a scheme orgininally developed by Wheater et al., 1991a,b. The occurrence of catchment rainfall was determined according to aseasonally-variable first order markov process, conditioned on rainfall occurrence from theprevious day. The number and locations of active raingauges and the gauge depths werederived by random sampling from observed distributions.
The distributed water balance model represents the catchment as a network of two-dimensional plane and linear channel elements. Runoff and infiltration from the planes was simulated using the SCS approach. Wadi flows incorporate a linear transmission lossalgorithm based on work by Jordan (1977) and Walters (1990).
Finally, a groundwater model was developed based on a detailed hydrogeologicalinvestigation which led to a multi-layer representation of uncemented gravels,weakly/strongly cemented gravels and strongly cemented/fissured gravel/bedrock, usingMODFLOW.
The model was calibrated to the limited flow data available (a single event), and was able to reproduce the distribution of runoff and groundwater recharge within the catchment through a rational association on loss parameters with topography, geology and wadi characteristics.Extended synthetic data sequences were then run to investigate catchment water balances

17
under scenarios of different runoff exceedance probabilities (20%, 50%, 80%), andmanagement options.
2.8 CONCLUSIONS
It has been shown that for many applications, the hydrological characteristics of arid areas present severe problems for conventional methods of analysis. Recent data are providingnew insights. These insights must be used as the basis for development of more appropriate methods for flood design and water resource evaluation, and in turn, to define data needs and research priorities. Much high quality research is needed, particularly to investigateprocesses such as spatial rainfall, and infiltration and groundwater recharge from ephemeralflows.
For developments to maximise the resource potential, define long-term sustainable yields and protect traditional sources, it is argued that distributed modelling is a valuable, if not essential tool. However, this confronts severe problems of characterisation of rainfall, rainfall-runoffprocesses, and groundwater recharge, and of understanding the detailed hydrogeologicalresponse of what are often complex groundwater systems. Similarly, new approaches toflood design and management are required which represent the extreme value characteristics of arid areas and recognise the severe problems of conventional rainfall-runoff analysis.
Above all, basic requirements are for high quality data of rainfall, surface water flows and groundwater response to support regional analyses and the development of appropriatemethodologies. Too often, studies focus on either surface or subsurface response withouttaking an integrated view. Too often, networks are reduced after a few years withoutrecognition that the essential variability of wadi response can only be characterised byrelatively long records. Quality control of data is vital, but can easily be lost sight of withready access to computerised data-bases.
Superimposed on these basic data needs are the requirement for specific process studies, including sediment transport, surface water/groundwater interactions in the active wadichannel, evaporation processes and consumptive use of wadi vegetation, and the wider issues of groundwater recharge. These are challenging studies, with particularly challenginglogistical problems, and require the full range of advanced hydrological experimentalmethods to be applied, particularly integrating quantity and quality data to deduce systemresponses, and making full use of remote sensing and geophysical methods to characterise system properties.
It must not be forgotten that in general, data networks are under threat world-wide, and a major priority for hydrologists must be to promote recognition of the value of data for water management, the importance of long records in a region characterised by high inter-annualvariability, and of the particular technical and logistical difficulties in capturing hydrologicalresponse in arid areas. The current International Hydrological Programme rightly prioritizes
18
hydrological data as the essential foundation for effective management. The results of bothdetailed research and regional analyses are required for the essential understanding of wadihydrology which must underlie effective management.
2.9 REFERENCES
Allison, G.B. and Hughes, M.W. (1978) The use of environmental chloride and tritium toestimate total recharge to an unconfined aquifer. Aust.J.Soil Res.,16, 181-195
Andersen, N.J., Wheater, H.S., Timmis, A.J.H. and Gaongalelwe, D. (1998) Sustainabledevelopment of alluvial groundwater in sand rivers of Botswana. In Sustainability ofWater Resources under Increasing Uncertainty, IAHS Pubn. No. 240, pp 367-376.
Bromley, J., Edmunds, W.M., Fellman E., Brouwer, J., Gaze, S.R., Sudlow, J. and Taupin, J.-D. (1997) Estimation of rainfall inputs and direct recharge to the deep unsaturatedzone of southern Niger using the chloride profile method. J. Hydrol. 188-189, pp.139-154
Cordery, I., Pilgrim, D.H and Doran, D.G. (1983) Some hydrological characteristics of arid western New South Wales. The Institution of Engineers, Australia, Hydrology andWater Resources Symp, Nov.
Crerar,S., Fry, R.G., Slater, P.M., van Langenhove, G. and Wheeler, D. (1988) Anunexpected factor affecting recharge from ephemeral river flows in SWA/Namibia. In Estimation of Natural Groundwater Recharge, I.Simmers (ed.), pp.11-28, D.Reidel Publishing Company.
Deardorff, J.W. (1977) A parameterization of ground-surface moisture content for use inatmospheric prediction models. J. Applied. Meteorol., 16, 1182-1185.
Desconnets, J.C., Taupin, J.D., Lebel, T. and Leduc, C. (1997) Hydrology of the HAPEX-Sahel Central Super-Site: surface water drainage and aquifer recharge through thepool systems. J. Hydrol. 188-189, pp.155-178
Eagleson, P.S., Fennessey, N.M., Qinliang, W. and Rodriguez-Iturbe, I., (1987) Application of spatial Poisson models to air mass thunderstorm rainfall. J. Geophys. Res., 92:9661-9678.
Food and Agriculture organization, (1981) Arid zone hydrology for agriculturaldevelopment. F.A.O, Rome, Irrig. Drain. Pap. 37, 271pp.

19
Goodrich, D.C., Lane, L.J., Shillito, R.M., Miller, S.N., Syed, K.H. and Woolhiser, D.A. (1997) Linearity of basin response as a function of scale in a semi-arid watershed. Water Resour. Res., 33,12, 2951-2965.
Goutorbe, J.P., Dolman, A.J., Gash, J.H.C., Kerr, Y.H., Lebel, T., Prince S.D., and Stricker, J.N.M. (1997) (Eds). HAPEX-Sahel. Elsevier, 1079 pp.(reprinted from J.Hydrol. 188-189/1-4)
Hellwig, D.H.R. (1973) Evaporation of water from sand, 3: The loss of water into theatmosphere from a sandy river bed under arid climatic condtions. J. Hydrol., 18, 305-316.
Hughes, D.A. (1995) Monthly rainfall-runoff models applied to arid and semiarid catchments for water resource estimation purposes. Hydr. Sci. J.,40, 6, 751-769.
Hughes, D.A. and Sami, K., (1992) Transmission losses to alluvium and associated moisture dynamics in a semiarid ephemeral channel system in Southern Africa. HydrologicalProcesses, 6, 45-53
Jacobs, B.L., Rodrigues-Iturbe, I. and Eagleson, P.S., (1988) Evaluation of a homogeneous point process description of Arizona thunderstorm rainfall. Water Resour. Res.,24(7): 1174-1186.
Jordan, P.R. (1977) Streamflow transmission losses in Western Kansas. Jul of Hydraulics Division, ASCE, 108, HY8, 905-919.
Lane, L.J., Diskin, M.H. and Renard, K.G. (1971) Input-output relationships for an ephemeral stream channel system. J.Hydrol. 13, pp.22-40.
Lebel, T., Taupin, J.D., and D’Amato, N. (1997) Rainfall monitoring during HAPEX-Sahel.1.General rainfall conditions and climatology. J.Hydrol. 188-189,pp.74-96
Lebel, T., and Le Barbe, L. (1997) Rainfall monitoring during HAPEX-Sahel.2. Point and areal estimation at the event and seasonal scales. J.Hydrol. 188-189, pp.97-122
Liu, B., Phillips, F., Hoines, S., Campbell, A.R., Sharma,P. (1995) Water movement in desert soil traced by hydrogen and oxygen isotopes, chloride, and chlorine-36, southernArizona. J.Hydrol. 168, pp.91-110.
Michaud, J.D and Sorooshian, S (1994) Effect of rainfall-sampling errors on simulations ofdesert flash floods. Water Resour.Res., 30, 10, pp. 2765-2775.
20
Morin, J. and Benyamini, Y. (1977) Rainfall infiltration into bare soils. Water. Resour. Res., 13, 5, 813-817.
Morin,J., Rosenfeld,D. and Amitai, E. (1995) Radar rain field evaluation and possible use of its high temporal and spatial resolution for hydrological purposes. J.Hydrol., 172,275-292.
McMahon, T.A., (1979) Hydrological characteristics of arid zones. Proceedings of aSymposium on The Hydrology of Areas of Low Precipitation, Canberra, IAHS Publ. No. 128, pp. 105-123.
Nemec, J. and Rodier, J.A., (1979) Streamflow characteristics in areas of low precipitation. Proceedings of a Symposium on the Hydrology of Areas of Low Precipitation,Canberra, IAHS Publ. No. 128, pp. 125-140.
Osborn, H.B., Renard, K.G. and Simanton, J.R., (1979) Dense networks to measureconvective rainfalls in the Southwestern United States. Water Resour.Res.,15(6):1701-1711.
Parissopoulos, G.A. and Wheater, H.S. (1990) Numerical study of the effects of layers onunsaturated-saturated two-dimensional flow. Water Resources Mgmt 4, 97-122.
Parissopoulos, G.A. & Wheater, H.S. (1991) Effects of evaporation on groundwater recharge from ephemeral flows. In: Advances in Water Resources Technology, Ed. G.Tsakiris, A.A. Balkema, 235-245, 1991.
Parrisopoulos, G.A. & Wheater, H.S. (1992a) Experimental and numerical infiltration studies in a wadi stream-bed. J. Hydr. Sci. 37, 27-37.
Parissopoulos, G.A. & Wheater H.S. (1992b) Effects of hysteresis on groundwater recharge from ephemeral flows, Water Resour. Res., 28, 11, 3055-3061.
Pilgrim, D.H., Chapman, T.G. and Doran, D.G., (1988) Problems of rainfall-runoffmodelling in arid and semi-arid regions. Hydrol. Sci. J., 33(4): 379-400.
Reid, I., and Frostick, L.E. (1987) Flow dynamics and suspended sediment properties in arid zone flash floods. Hydrol. Processes, 1,3, 239-253.
Saudi Arabian Dames and Moore, (1988) Representative Basins Study. Final Report toMinistry of Agriculture and Water, Riyadh, 84 vols.

21
Sharma, K.D. (1997) Integrated and sustainable development of water resources of the Luni basin in the Indian arid zone. In Sustainability of Water Resources under IncreasingUncertainty, IAHS Publn. No.240, pp 385-393.
Sharma, K.D. (1998) Resource asessment and holistic management of the Luni River Basinin the Indian desert. In Hydrology in a changing environment, Vol II, Eds. Howard Wheater and Celia Kirby, Wiley. pp 387-395
Sorey, M.L. and Matlock, W.G. (1969) Evaporation from an ephemeral streambed. J.Hydraul. Div. Am. Soc. Civ. Eng., 95, 423-438.
Sorman, A.U. and Abdulrazzak, M.J. (1993) Infiltration - recharge through wadi beds in arid regions. Hydr. Sci. Jnl., 38, 3, 173-186.
Telvari, A., Cordery, I. and Pilgrim, D.H. (1998) Relations between transmission losses and bed alluvium in an Australian arid zone stream. In Hydrology in a ChangingEnvironment. Eds Howard Wheater and Celia Kirby,Wiley, Vol II, pp 361-36
Travers Morgan (1993) Detailed hydrotechnical recharge studies in Wadi Ghulaji. FinalReport to Ministry of Water Resources, Oman.
UNDP (1992) Surface Water Resources. Final report to the Government of the Republic of Yemen High Water Council UNDP/DESD PROJECT YEM/88/001 Vol III, June.
Walters, M.O. (1990) Transmission losses in arid region. Jnl of Hydraulic Engineering, 116, 1, 127-138.
Wheater, H.S. and Bell, N.C. (1983) Northern Oman flood study. Proc. Instn. Civ. Engrs. Part II, 75, 453-473.
Wheater, H.S. & Brown , R.P.C. (1989) Limitations of design hydrographs in arid areas - an illustration from southwest Saudi Arabia. Proc. 2nd Natl. BHS Symp. (1989), 3.49-3.56.
Wheater, H.S., Larentis, P. and Hamilton, G.S., (1989) Design rainfall characteristics forsouthwest Saudi Arabia. Proc. Inst. Civ. Eng., Part 2, 87: 517-538.

22
Wheater, H.S., Butler, A.P., Stewart, E.J. & Hamilton, G.S. (1991a) A multivariate spatial-temporal model of rainfall in S.W. Saudi Arabia. I. Data characteristics and modelformulation. J. Hydrol., 125, 175-199.
Wheater, H.S., Onof, C., Butler, A.P. and Hamilton, G.S., (1991b) A multivariate spatial-temporal model of rainfall in southwest Saudi Arabia. II Regional analysis and long-term performance. J. Hydrol., 125, 201-220.
Wheater, H.S., Jakeman, A.J. and Beven, K.J., (1993) Progress and directions in rainfall-runoff modelling. In: Modelling Change in Environmental Systems, Ed. A.J.Jakeman, M.B. Beck and M.J. McAleer, Wiley, 101-132.
Wheater, H.S., Jolley, T.J. and Peach, D. (1995) A water resources simulation model for groundwater recharge studies: an application to Wadi Ghulaji, Sultanate of Oman. In:Proc. Intnl. Conf. on Water Resources Management inArid Countries (Muscat), 502-510.
Wheater, H.S., Woods Ballard, B. and Jolley, T.J., (1997) An integrated model of arid zone water resources: evaluation of rainfall-runoff simulation performance. In:Sustainability of Water Resources under Increasing Uncertainty, IAHS Pubn. No.240, pp 395-405.
23
CHAPTER THREE
WADI HYDROLOGY
APPLICATIONS OF GEOCHEMICAL AND ISOTOPIC METHODS: A CASE STUDY OF WADI HAWAD, SUDAN
W M Edmunds
British Geological Survey, Wallingford, UK
3.1 INTRODUCTION
Wadi Hawad is an ephemeral tributary of the River Nile which it joins some 20kmdownstream of Shendi. This major wadi (or khor) is joined in turn by a series of smaller khors, which are fed by monsoonal rains. This system has been the subject of regional water resource assessment (Kotoub 1987; Edmunds et al. 1987), within which geochemical andisotopic studies illustrate well the relationship between the wadi system and the underlyinggroundwaters, as well as the river Nile. Some of these studies are focused on Abu Delaig, a small town some 200 km NE of Khartoum (Figure 3.1) lying on the banks of a small khor, which normally flows for short periods several times per year. It is typical of manysettlements of the Sahel margin, which rely upon water from shallow dug wells in alluviumand Nubian Sandstone. This case study shows how the local groundwater has evolved from rainfall and from surface waters of the wadi, and most importantly, its sources of recharge and how it can be protected as a valuable and sustainable natural resource. In fact the wadi flow has little value as a resource in its own right; its main importance is in sustaining the shallow aquifer system.
Natural replenishment of groundwater in semi-arid regions can take place by twomechanisms: 1) direct or diffuse infiltration of rainfall via the soil and unsaturated zone, and 2) local recharge by surface runoff via permeable wadi beds. The flashy and unpredictable nature of precipitation in semi-arid regions makes the accurate determination of rainfallamounts and surface runoff extremely difficult. Conventional, physical means for rechargeestimation are often inappropriate, and in any case with large errors involved. In this case study, chemical and isotopic results are used to demonstrate where and how recharge istaking place and to consider the wider implications for water resources development insimilar regions of the Sahel. It will also be shown that much of the groundwater beingexploited is fossil water, derived from wetter periods of the past.
3.2 REGIONAL SETTING
Wadi Hawad lies in the Butana region of Sudan between the Nile and the Atbara Rivers,underlain by an embayment of the Nubian Sandstone Series (Cretaceous). Abu Delaig lies almost on the boundary between the Nubian sandstone and the Basement Complex, which is

24
encountered at shallow depth (26 m) in wells to the south of the town. The basal Nubiansandstone at Abu Delaig is rather heterogeneous, comprising pebble beds, thin clay layersand feldspathic sands. The Basement Complex is mainly granodiorite with somemetasediments. The interfluve areas are flat grassland with sandy soil but often with a clay matrix, which imparts a relatively impermeable surface; gravel ridges are also common near the basement/Nubian contact. Much of the area is grazed by local or nomadic farmers who rely not only on the shallow groundwater resource exploited by hand dug wells (to 26 m) but also on several deep (to 150 m) pumped boreholes drilled further north in the Nubiansandstone
3.3 METHODS OF STUDY
Sampling was carried out over a three-year period from 1982-1985 during which timerainfall, wadi flow, Nile river, shallow groundwaters, deep groundwaters and unsaturatedzone moisture samples were collected around the Wadi Hawad area. Samples of rainfallwere collected on an event basis. The short wadi floods were sampled by local people during the summer rainy season, although their short duration, often in the middle of the night meant that some were missed. Samples of groundwater were collected from traditional wells and the deep boreholes with fitted pumps. Field measurements were made for pH, T, SEC andalkalinity and filtered samples (0.45um) collected for inorganic and isotopic analysis.
Unsaturated zone sampling was carried out at a number of sites in the Abu Delaig area from sandy sediment profiles obtained using either a power auger attached to a Land Rover or from traditional hand dug wells. Samples were collected at 0.25- 0.5 m intervals and sealed in glass jars. Moisture content was measured in the field. Fifty gram sand samples were eluted using 30 ml ultrapure (< 1 µS cm-1) demineralised water and the eluates then filtered through a 0.45 µm filter after settling. Specific electrical conductance (EC25) was determined in the field, providing a good check on salinity. Filtered samples of eluate were analysed for Cl and NO3.
3.4 RAINFALL CHEMISTRY
1982-1985 proved to be one of the most arid since records began. The Sahel drought from 1969 onwards produced a weighted mean average annual rainfall of 154 mm against a longer term average (1938-1968) of 225 mm. The years 1983 and 1984 each produced only 15 mmof rain. The most significant feature of the rain chemistry is the relatively high totalmineralisation for a continental site (Abu Delaig is about 700 km from the Red Sea and over 2000 km from the Indian Ocean). Rainfall at Abu Delaig has chloride concentrations in the range 0.9-18.4 mg l-1 with a weighted mean value of 4.6 mg l-1 over the four year period1982-85. In general, the lightest rains (i.e. the smallest storms) have the highest chlorinity.
It is considered that the rainfall analyses closely reflect the total annual deposition for most parts of the area. There is considerable cycling of dust throughout much of the dry season although this is considered to be a close-to steady-state process with little or no net deposition in the very open landscape of the Wadi Hawad basin. During rain storms, however, the

25
situation is different and rainout of soluble and particulate material takes place and there is the opportunity for solutes to enter the soil. These rainfall data are probably typical of the highly variable inputs to semi-arid/arid zone soils and illustrate the necessity for long-termdata sets for accurate estimation of solute inputs. The chemistry of the heavier rains is more important in determining the character of runoff and recharge and this is reflected in the wadi floods (see below).
Stable isotope data for rain collected during the period 1982-85 are shown, relative to the world meteoric line and the regression line for Khartoum rainfall measured by IAEA(Vienna) for the 9 years between 1962-77. Distinction is made between rain storms ofdifferent intensity and it can be seen that the heaviest rainfall (with two important exceptions) usually has the lightest isotopic composition. There is no correlation between 2H and Cl in rainfall, which suggests that there is no evaporative control on Cl concentrations.
3.5 CHEMISTRY OF WADI (KHOR) FLOODS
Samples of flood water were obtained at Abu Delaig in a tributary of Wadi Hawad in 1983 and 1985. These data represent only two floods in 1983 and five in 1985 with no flood recorded at all in 1984. Chloride concentrations are lower in the flash flood waters than in the weighted mean rainfall for the whole period, as expected, correlating with the heaviestrains. For 1985 the flood waters have mean chloride concentrations of 2.6 mg l-1 against a weighted mean average of 4.6 for rainfall. Stable isotope evidence for wadi floods confirms that no significant evaporation of rainfall has occurred. Although Cl is lower, there ishowever indication of some geochemical modification of rainwater during turbulent wadiflow. In addition to a doubling of total mineralisation, an increase in Mg/Ca ratio is observed which probably indicates the release of Mg by cation exchange from the weathering of clayminerals or Mg-rich soil carbonates.
3.6 WADI RECHARGE - SHALLOW GROUNDWATERS
Waters from 36 shallow groundwaters found within a few km of the wadi in the vicinity of Abu Delaig (Figure 3.1) were sampled in 1983 and 1985 only. These are all hand dug wells, typically 2 m in diameter with depths to the water table from 5 to 26 m.
The oxygen and hydrogen stable isotope results (Figure 3.3) all group near the Khartoummeteoric line and show only slight evidence of evaporation from rainfall, all samplesoverprinting the weighted mean value for Khartoum. Many well waters are isotopicallyslightly lighter than any of the rainfall measured. It is likely that wadi recharge would notreflect the same seasons’s rainfall. In 1983 the wadi at Abu Delaig did however containwater with isotopic values similar to the dug wells. Like rainfall, wadi flood events can vary significantly in isotopic content, but unlike rainfall appear to be relatively consistent within a particular wet season (Darling et al, 1987).

26
Tritium was measured on ten samples of shallow water at a distance of up to 1km from the wadi line, all of which indicated a large component of recent recharge (24-76 TU). Samples of deep wells from north of the area away from Wadi Hawad all gave values ≤ 9 T.U.
Despite the lack of significant evaporation the salinity of the dug well samples is much higher than in rainfall with SEC between 300-1700 µS cm-1. Chloride and sulphate concentrations are higher in water samples further from the wadis and SO4/Cl ratios are generally in excess of 2.75 in the shallow groundwaters compared with about 1.0 in the rainfall, indicating a netaddition of sulphate to groundwater subsequent to recharge. The cation distribution in water from the shallow wells is highly variable. Although the ionic ratio of the rainfall, or wadiflood, is preserved in three wells close to the wadi, the trend is for an increase in the Mg and the Na relative to Ca, so that most of the wells contain Mg/Ca ratios near to 1 and withsodium the dominant cation. Calculations using WATEQF (Plummer et al., 1977) show that all the Abu Delaig groundwaters are saturated or slightly supersaturated with respect tocalcite, indicating that carbonates must be present in the soils or sandstones as a primary or as a secondary interstitial mineral. The high Mg/Ca ratios of the shallow groundwaters aredistinct from the chemistry of deeper palaeowaters and offer one way to distinguish modern recharge to the deeper aquifer.
Nitrate concentrations are relatively high - up to 52.4 mg l-1 NO3-N. The distribution ofnitrate is irregular and high values are often, but not always, correlated with proximity to Abu Delaig town and must represent partly an anthropogenic source. High potassiumconcentrations (or high K/Na ratios), being additional contaminant indicators, are not found and it is therefore difficult to apportion the source of nitrate.
3.7 THE UNSATURATED ZONE
Chloride concentrations in elutriate samples from twelve unsaturated zone sites at Abu Delaig were used to compare the possible direct recharge in the interfluve areas as compared withthe wadis and to study the evolution of groundwater quality in the shallow water cycle.Representative results are illustrated for 4 of the profiles. The moisture contents in thesesamples plotted on a dry weight basis, range from 2% to nearly 11%, depending uponlithology; the highest values correspond to clay-rich profiles and the lowest values tosandstones.
Chloride concentrations reach plateau concentrations within 1-1.5 m. The upper metrecontains consistently low salinities indicating that atmospherically-derived solutes are beingwashed into the profile during rainfall events and do not accumulate as salts on the surface.In these profiles, therefore the chloride acts as a 'cumulative rain gauge'. The absence of any chloride accumulation at the surface is evidence that net recharge must be occurring, although from the salinities observed the recharge rate is very low.
Recharge estimates have been derived using the basic formula (Edmunds et al., 1987;Herczeg and Edmunds 1999):

27
Rd = P. Cp/Cs
using the 1936-1968 mean value for rainfall for Abu Delaig and the 4-year (1982-1985)weighted mean value of 4.6 mg l-1 Cl-1 as the best (only) available value for rainfall chloride (Cp). Only the steady-state sections of the profiles (Cs) have been used to estimate the long-term mean direct recharge values (Rd); these intervals range from 0.55 to 9.80 m belowground level.
Mean chloride concentrations in these 4 profiles lie between 1350 and 4600 mg l-1. The highest value (profile N) occurs at the top of a sandstone ridge above the wadi where surface runoff would have been highest. Nearly all other sites on the plain have lower chlorideconcentrations implying higher recharge. The chloride concentrations indicate that there isan effectively negligible direct (diffuse) recharge component in the range 0.2 to 1.3 mm yr-1.The cumulative chloride in the top 10 m of the unsaturated zone therefore represents of the order of 2000 yrs storage.
Very high nitrate concentrations up to 2800 mg l-1 NO3-N are found in several interstitialsolutions from profiles drilled south of Wadi Abu Delaig (e.g. E, G, Q) but in profiles to the north (e.g. A, C) background values as low as 10 mg l-1 NO3-N are found. The unsaturated zone is considered to be strongly oxidising and therefore both high and low nitrateconcentrations must be related to variable inputs, possibly from different cycles of vegetation or settlement, over a period of hundreds of years giving rise to spatial variability.
The stable isotope compositions of the unsaturated zone moisture from shallow profiles(0-20 m) from this area all show strong evaporative increase derived from local rainfall inline with the Cl increase (Darling et al., 1987).
3.8 SOURCES OF RECHARGE IN THE BASIN OF WADI HAWAD
The rainfall at the time of this study was well below that of previous decades. Thepalaeoclimatic history of the region (Williams and Adamson, 1980) shows that during theearly Holocene at least 400 mm/yr rainfall occurred but that by 4500 BP, the region became arid (< 100 mm/yr, or even below that of the present). It is likely that the regional water table has declined steadily over historical times (this may be shown archaeologically by thepresence of Roman markings in some dug wells at levels considerably above the presentwater table, which is up to 100 m below the land surface).
Over large interfluve areas covering the Butana plain and typified by the results from AbuDelaig, diffuse recharge must currently be taking place only on an intermittent basis. Thelong-term diffuse or direct recharge is likely to be no more than about 1mm yr-1, under the conditions typical of the average rainfall of around 220 mm/yr during the past century. The presence of clay soils and the clay matrix (to sand or gravel surfaces) effectively restrictsinfiltration in this type of terrain, although more sandy areas may permit more recharge.

28
The overall situation may be summarised using the isotopic compositions of the differentwater types in this region (Figure 3.6) and with reference to the summary diagram. Theshallow aquifer serving Abu Delaig is likely to be a perched aquifer created by clay horizons in the basal Nubian Sandstone. This is demonstrated hydraulically by the relatively shallowpermanent water table in the vicinity of the town compared with outlying wells which have water levels tens of metres lower than near the wadi at Abu Delaig. The chemical andisotopic evidence from shallow wells in the vicinity of the wadis and in outlying areasindicate only local modern waters and there is no evidence from the isotopic signatures that significant recharge to the Nubian Sandstone aquifer on a regional scale is taking place.
The main groundwater body beneath the Butana plain has a radiocarbon age of 5500-8000years indicating regional replenishment during the Holocene and possibly earlier perods ofrecharge during the late Pleistocene. Only one well shows a composition intermediatebetween the shallow groundwater and the isotopically much lighter and distinct palaeo-water;other outlying wells sampled at the water table by traditional methods gave palaeo-watersignatures indicating that neither direct recharge nor wadi recharge had been effectiveregionally for several millennia. It is however unlikely that present day recharge beneath thewadi system is zero but a dedicated programme of drilling beneath and adjacent to the wadi would be necessary to demonstrate this adequately.
Groundwaters sampled from the Nubian sandstone aquifer in the Nile valley indicate that the River Nile is a source of modern recharge for several kilometres distant. The Nile valleygroundwaters all group around the regression line for the river with values near to -3‰ d2Hand –1.5‰ d18O. This value is intermediate between the White Nile baseflow and floodwaters from the Blue Nile, indicating a contribution from both sources.
The only effective source of water supply for the Wadi Hawad basin as exemplified by the area around Abu Delaig , is the recharge which takes placed during the few annual flashfloods taking place via the wadi systems. Surface runoff saturates the wadi sediments andthen infiltrates the shallow, perched, aquifer system. This infiltration is rapid and withoutany significant evaporation as shown by the stable isotope evidence, is sufficient, as shown by tritium, to sustain lateral flow for up to at least 1km from the wadi source. The annual oscillations of the water table saturate the lowest horizons of the interfluve sediments. This allows leaching of solutes from the lower unsaturated zone which have accumulated anddrained during the much slower recharge process - this imparts the main chemicalcharacteristics to the shallow groundwaters.
This case study of one small town in Sudan, representative of the Wadi Hawad catchment, is probably typical of the water resources situation in many other regions of the African Sahel.Direct recharge is insignificant due to the highly weathered nature of superficial sedimentscontaining clays which restrict rapid infiltration of rain. These wadi systems containephemeral freshwater mounds which may, under favourable geological conditions, rechargethe regional aquifer system. They represent linear recharge sources, which offer possibilities for sustaining and stabilising local population. The recharge rates will vary according to wadi flow, and thus evaluation of the recharge rates will be closely linked to rainfall intensity as

29
opposed to rainfall amount. Many wadi systems cease to flow in Sudan and elsewhere before they reach the Nile so that headwater regions may be favourable for development. This is the only alternative to depletion and mining of the deeper palaeowater resource in such areas.
Figure 3.1. The location of Wadi Hawad and Abu Delaig, Sudan with locations of additional sites refered to in this study.

30
Figure 3.2. Weighted mean rainfall at Khartoum and Abu Delaig (from 1938), showing the onset of the recent drought in the later 1960s. The mean concentrations in mm are given for Abu Delaig.

31
Figure 3.3. Stable isotopic composition of rainfall and wadi floods at Abu Delaig compared with that of shallow groundwaters and unsaturated zones (from Darling et al. 1987).

32
Figure 3.4. Cation chemistry of shallow groundwaters, Abu Delaig, relative to thecomposition of other waters.

33
Figure 3.5. Four profiles of chloride in the unsaturated zone from Abu Delaig, Butana region, Sudan.
Figure 3.6. Summary diagram of all isotopic data from the area of Wadi Hawad – rains, surface and groundwaters, including waters from the unsaturated zone.

34
Figure 3.7. Schematic cross-section of the Wadi Hawad showing groundwater recharge and likely water resources.
3.9 ACKNOWLEDGEMENTS
The work described in this paper is based on previously published and unpublished workcited in the references. It formed part of the Lower Atbara River Basin Project, acollaborative study carried out by British Geological Survey, the Arab Centre for Semi-aridZones and Dry Lands (ACSAD, Damascus) and the National Administration for Water ,Khartoum. Numerous colleagues from each of these organisations are thanked for assistingin the collection and analysis of samples. The UK Overseas Development Administrationprovided financial support for this work and their help is acknowledged together with that ofthe British Embassy, Khartoum. Finally, the assistance of the people of Abu Delaig who

35
helped in this work, not least in the collection of rainfall samples, is appreciated. This paper is published with the permission of the Director, British Geological Survey, NaturalEnvironment Research Council.
3.10 REFERENCES
DARLING W G, EDMUNDS W M and KINNIBURGH D K. 1987. Sources of recharge to the Basal Nubian Sandstone aquifer, Butana region, Sudan. pp 205-224: in: 'Isotope Techniques in Water Resources Development. IAEA Vienna.
EDMUNDS W M, DARLING W G and KINNIBURGH D K. 1987. Estimation of aquifer recharge using geochemical techniques. Unpubl. Rep. Brit. Geol. Surv. WD/OS/87/1.
EDMUNDS W M, DARLING W.G. KINNIBURGH D K, KOTOUB S, and MAHGOUB S. 1992. Sources of recharge at Abu Delaig, Sudan. J. Hydrology, 131, 1-24.
HERCZEG, A.L. AND EDMUNDS, W.M. 1999. Inorganic ions as tracers. Pp. 31-77 inEnvironmental Tracers in Subsurface Hydrology. (P.G Cook and A.L. Herczeg eds.). Kluwer. Boston
IAEA. 1981. Statistical treatment of environmental isotope data in precipitation. TechnicalRep. 206, Internat. Atomic Energy. Agency, Vienna.
KOTOUB S. 1987. Hydrogeological investigations of the Nubian Sandstone formation,Sudan. Unpubl. Report ACSAD HS.R58. Damascus.
WILLIAMS M A J and ADAMSON D A. 1980. Late Quaternary depositional history of the Blue and White Nile rivers in Central Sudan. pp 281-304. In. 'The Sahara and the Nile'. Eds. Williams M J and Faure H. Balkema, Rotterdam.
37
CHAPTER FOUR
SEDIMENT AND THE VULNERABILITY OF WATER RESOURCES
Abdulaziz A. Alhamid1 and Ian Reid2
1. Associated Professor, College of Engineering, King Saud Univ., P.O.Box 800, Riyadh 11421,
Saudi Arabia
2. Professor of Physical Geography, Loughborough University, Loughborough LE11 3TU, UK
4.1 INTRODUCTION
Dryland water catchments are characterised by remarkably high drainage densities despite the infrequency of rainfall-runoff (Melton, 1958). A value of 90 km/km2 (channel length per unit area), assessed from large-scale aerial photographs for a particular catchment in thesemi-arid province of northern Kenya, is high but unremarkable. It reflects the physicalresponse of the scantily vegetated landscape to the spasmodic and sporadic process of coping with rainfall (Reid and Frostick, 1987). Water reaches the ephemeral channel network by a number of routes, but these are dominated by overland flow from catchment hillslopes,reflecting the low infiltration capacities commonly associated with unvegetated soils andexposed rock (Thornes, 1985; Bowyer-Bower, 1993; Bonell and Williams, 1986). However, in some circumstances, ground water can contribute to total discharge as a slow-velocitymatrix flow within the alluvial channel-fill. This may occasionally find surface expressionwhere inclined, impermeable country rock structure intersects the channel surface (Andersonet al., 1998).
Because overland flow is an important process in drylands, considerable quantities ofsediment are moved by runoff. Indeed, drylands - particularly semi-deserts with circa 250 -300 mm of rain per year - have long been known to produce record levels of sediment yield (Langbein and Schumm, 1958). The exact nature of the generalised relation betweensediment yield and rainfall is complex and will continue to evolve as more and more data become available (Walling and Kleo, 1979). However, the transfer of such large amounts of material provides considerable problems for dryland water resource management in thatimpoundment structures are rapidly compromised by the reduction of reservoir volume assediment accumulates (Tolouie et al., 1993). In order to minimise the nuisance caused bythese high rates of sedimentation and to optimise the utilisation of water resources, it isessential for managers and water engineers to understand the physical processes that govern the sedimentary behaviour of wadis, whether these are in a state which is largely natural or affected in various ways by human agency.
4.2 SOURCES OF SEDIMENT
River sediments originate from two main sources within a drainage basin – the hillslopes and the alluvial beds of the channel network. The amount of sediment derived from a watercatchment is influenced by both storm and drainage basin characteristics. Basin

38
characteristics include the nature of the soil and rock materials and the amount of vegetation (Bowyer-Boyer, 1993; Yair et al., 1978). Here, there are two factors of importance. First is the range of infiltration capacities of the hillslope soils and the effect that these have on the generation of overland flow (Thornes, 1985). Second is the erodibility of the soil. This may be dependent, among other things, upon the amount and type of clay that is present or upon the amount of protection afforded by coarse-grained surface lags either directly in absorbing rain impact energy or indirectly in increasing the hydraulic roughness of the surface duringepisodes of surface runoff (Poesen et al., 1994). Other basin characteristics of importance are the steepness of the hillslopes and the drainage density. Of particular significance is that the high drainage density which is typical of drylands places a rapid-transit conduit within ten to a hundred metres of most parts of the water catchment, ensuring the rapid translation ofoverland flow and the sediment that it carries into channel flow. Indeed, in the upper parts of dryland water catchments, the high drainage densities often ensure hydrologic and hydraulic connectivity between the hillslopes and channel system such that the opportunity for transient or quasi-permanent storage of displaced sediment is minimised (Frostick and Reid, 1982).Because of this, sediment that has been mobilised from its source is moved directly into the channel system and thence downstream, a major factor in promoting the high levels ofsediment yield recorded in these environments.
Inter-rill sheet erosion is undoubtedly an important source of sediment, especially that whichis of silt and clay calibre. It occurs when rainfall intensity exceeds the rate of infiltration and after depression storage is satisfied by a storm. Because overland flow has been observed to occur within minutes of the start of rainfall, even those rainfalls of modest intensity (Reid et al., 1994), its incidence is more or less coincident with that of all but the lightest rains. Even so, the relation between runoff and rainfall has been shown to be complex, similar stormsproducing significantly different runoff volumes (Yair et al., 1978). However, the spottiness of desert rain (Renard and Keppel, 1966; Sharon, 1972; Wheater et al., 1991) dictates that the occurrence of overland flow is sporadic from event to event. This in itself may be one factor that encourages high river sediment loads. This is because the effects of supply-exhaustion -known from rainfall-runoff simulation to be a feature of events that succeed each other inrapid succession - might be reduced where successive rainfalls affect different parts of adrainage basin and where, on each occasion, there has been a comparatively long intervalsince the preceding deluge.
Runoff usually travels only a short distance as sheet flow before it concentrates into smallchannels or rills (Abrahams and Parsons, 1991). These rills may develop into gullies andthese can become an important source of sediment, not only that which is fine-grained but also that of gravel and larger calibre (Casili et al., 1999). Processes that have beenrecognised as important in gully development include mass wasting of the sidewalls and the breakdown and transport of the resulting soil falls. Gullying is often, but not exclusively,associated with human activities such as agriculture, grazing, mining, and urbanisation. These alterations of the landscape include, variously, a change of slope gradient, the removal ofvegetation, disturbance of the surface soil and a realignment of the channel system(Vandekerckhove et al., 1998).
Channel-bed sediments are the other major source of material. These vary in calibre fromboulder-cobble in steep headwater reaches through cobble-pebble in headwater and middle
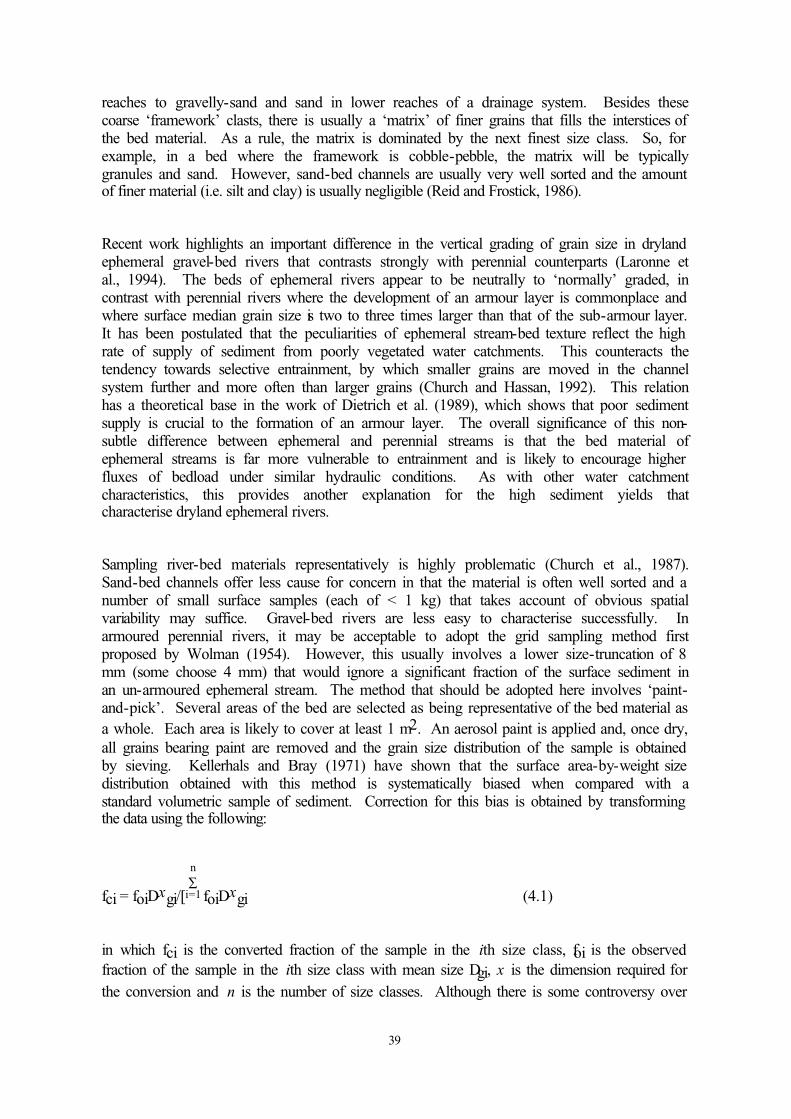
39
reaches to gravelly-sand and sand in lower reaches of a drainage system. Besides thesecoarse ‘framework’ clasts, there is usually a ‘matrix’ of finer grains that fills the interstices of the bed material. As a rule, the matrix is dominated by the next finest size class. So, for example, in a bed where the framework is cobble-pebble, the matrix will be typicallygranules and sand. However, sand-bed channels are usually very well sorted and the amount of finer material (i.e. silt and clay) is usually negligible (Reid and Frostick, 1986).
Recent work highlights an important difference in the vertical grading of grain size in dryland ephemeral gravel-bed rivers that contrasts strongly with perennial counterparts (Laronne etal., 1994). The beds of ephemeral rivers appear to be neutrally to ‘normally’ graded, incontrast with perennial rivers where the development of an armour layer is commonplace and where surface median grain size is two to three times larger than that of the sub-armour layer.It has been postulated that the peculiarities of ephemeral stream-bed texture reflect the high rate of supply of sediment from poorly vegetated water catchments. This counteracts thetendency towards selective entrainment, by which smaller grains are moved in the channelsystem further and more often than larger grains (Church and Hassan, 1992). This relationhas a theoretical base in the work of Dietrich et al. (1989), which shows that poor sedimentsupply is crucial to the formation of an armour layer. The overall significance of this non-subtle difference between ephemeral and perennial streams is that the bed material ofephemeral streams is far more vulnerable to entrainment and is likely to encourage higher fluxes of bedload under similar hydraulic conditions. As with other water catchmentcharacteristics, this provides another explanation for the high sediment yields thatcharacterise dryland ephemeral rivers.
Sampling river-bed materials representatively is highly problematic (Church et al., 1987).Sand-bed channels offer less cause for concern in that the material is often well sorted and a number of small surface samples (each of < 1 kg) that takes account of obvious spatialvariability may suffice. Gravel-bed rivers are less easy to characterise successfully. Inarmoured perennial rivers, it may be acceptable to adopt the grid sampling method firstproposed by Wolman (1954). However, this usually involves a lower size-truncation of 8 mm (some choose 4 mm) that would ignore a significant fraction of the surface sediment inan un-armoured ephemeral stream. The method that should be adopted here involves ‘paint-and-pick’. Several areas of the bed are selected as being representative of the bed material as a whole. Each area is likely to cover at least 1 m2. An aerosol paint is applied and, once dry, all grains bearing paint are removed and the grain size distribution of the sample is obtained by sieving. Kellerhals and Bray (1971) have shown that the surface area-by-weight size distribution obtained with this method is systematically biased when compared with astandard volumetric sample of sediment. Correction for this bias is obtained by transforming the data using the following:
fci = foiDxgi/[∑
i=1
n
foiDxgi (4.1)
in which fci is the converted fraction of the sample in the ith size class, foi is the observed fraction of the sample in the ith size class with mean size Dgi, x is the dimension required for the conversion and n is the number of size classes. Although there is some controversy over

40
the exponent x, it has been generally agreed, following exhaustive tests, that it can be set at -1for the conversion of an area-by-weight to volume-by-weight grain-size distribution (Church et al., 1987).
4.3 SEDIMENT TRANSPORT
Sediment is transported by the flow in one or more of the following ways:
(i) Sliding or rolling along the bed;
(ii) Saltation, i.e. being propelled ballistically into the flow and then resting or rolling for a short distance on the bed before being again thrust upward into the flow;
(ii) Suspension, i.e. being supported by the flow for the entire duration of motion.
Sediment transported by saltation or involved in continuous bed-surface contact is referred to as bedload, while that transported entirely out of contact with the bed is called the suspended load. Although bedload and suspended load are usually considered separately, there is no clear line of separation between them and bedload material can be thrown into suspensionwhen and where hydraulic conditions dictate. Total sediment load is the summation of the two components. A further distinction is often made. This separates the washload -considered to have originated outside the channel system - from the bed material load, which derives largely from the channel bed, at least over a finite period such as a flashflood. While washload is always suspended in the flow, the bed material load can be transported both as bedload and as suspended load. Where the bed material is mono-grade, as in a sand-bedriver, it is easy to ascribe the silt and clay loads to non-channel sources since the bed material will contain no material of this calibre (e.g. Reid and Frostick, 1986). There is lessconfidence in defining source areas where the interstitial matrices of gravel-bed rivers also contribute fine-grained material.
4.3.1 Basinwide hillslope erosion
One of the principal sources of stream-borne sediment is sheet erosion on catchmenthillslopes. Sheet erosion is defined as the removal of surface soil by overland flow in amanner that does not lead to the formation of rills. Rills and, more spectacularly, gullyingalso furnishes part of the stream sediment load in a catchment basin. Therefore, it isimportant to predict the amount of soil erosion occurring in order to provide conservationpractices or corrective measures.
Numerous mathematical and statistical models have been developed to predict soil erosion. Most of these require extensive data for appropriate calibration and involve complexcalculations. Pacheco-Ceballos (1993) has developed a simple analytical solution to predict watershed erosion that takes the following form:
PCSqtan
60.0qSE ⋅⋅⋅⋅=
θ (4.2)

41
in which qSE is the watershed erosion rate per unit contour width, q is the flow discharge per unit width, tanθ is the soil angle of repose, S is the slope, C is a cropping and management factor and P is an erosion control practices factor. Both C and P are empirically derived.Expanded tables of C and P values have been presented by Wischmeier and Smith (1978);these represent most crop management schemes and control practices in use in the United States. Roose (1977) developed values for cropping and control practice in use in WestAfrica; these values are given in Table 4.1 and 4.2 for C and P, respectively.
Table 4.1 Cropping-management factor, C, for West Africa (after Roose, 1977)
Vegetal cover
Bare soil
Cotton
Peanuts
Crop cover of slow development or late planting first year
First year cassava and yam
Palm tree, coffee, cocoa with crop cover
Over-grazed savannah or prairie
Savannah, prairie in good condition
Forest or dense shrub, high mulch crop
Annual average value
1.0
0.5 to 0.7
0.4 to 0.8
0.3 to 0.8
0.2 to 0.8
0.1 to 0.3
0.1
0.01
0.001
Table 4.2 Erosion control practices factor, F, for West Africa (after Roose, 1977).
Control practices
2-3 years of temporary grassland
Anti-erosive buffer strips from 2 to 4 meters width
Tied-ridging
Reinforced ridges of earth or low dry stone walls
Straw mulch
P factor
0.50 to 0.10
0.30 to 0.10
0.20 to 0.10
0.1
0.01
4.3.2 In-channel sediment transport
It is almost certain that suspended sediment dominates the total sediment yield of drylandwater catchments. The level of uncertainty in making a statement such as this comes fromthe fact that the amount of data which describes sediment yield is small by comparison with that available for more humid environments while that for bedload is minuscule. So, forexample, a long-term study of a small, hyper-arid, rocky drainage basin of the southernNegev where bedload has been differentiated as part of the total load provides an interesting

42
contradiction in that bedload is shown to be dominant at 68% (Schick and Lekach, 1993).However, a shorter study of a larger basin that drains part of the Hebron Hills further north inthe Negev where bedload flux has been measured along with suspended sediment provides a ratio that is less surprising. Here, bedload comprises 8% of the total load (Powell et al., 1996).
4.3.2.1 Suspended load
Wash load refers to the finest portion of sediment, generally silt and clay, that is washed through the channel. The discharge of wash load depends primarily on the rate of supplyfrom hillslopes, rills and gullies, and slumps from the alluvial banks of incised channels.This depends, in turn, on a host of variables, not least of which are the nature of the rainfall and its spatial distribution and the amount of vegetation cover - itself a variable, generallyincreasing as a rain season progresses and annuals such as grasses germinate. In addition,there may be significant levels of human activity that affect a variable fraction of a watercatchment, such as the ploughing and sowing of crops. In places, this may have encouraged the development of badlands and accelerated rates of erosion (De Ploey, 1974).
Given the dynamic nature of the permutation of processes, it should not be surprising that the relation between suspended sediment concentration and instantaneous water discharge isfound to be fairly indeterminate, showing a general direct trend but one that is characterised by considerable scatter (Negev, 1969; Renard and Laursen, 1975; Lekach and Schick, 1982; Powell et al., 1996; Fig. 6.2). Indeed, the relation is usually considered too complex to justify any attempt at hydraulic modelling from first principles.
An integration of information at the level of individual floods appears to give a statisticalrelation between sediment yield and flood discharge that is reasonably deterministic (Reid et al., 1998b; Fig. 4.3). However, this relies heavily upon an empirical least-squares rating of sediment concentration against instantaneous water discharge and ignores the scatter inherent in the data. Negev’s (1969) analysis of the suspended load of the Quishon River illustrates that caution is required when relying on rating curves which are derived from lumped data.In this example, there is progressive exhaustion of sediment supply in the water catchment as the flood season progresses, each event having its own rating curve and each producing lower and lower sediment concentration at the same water discharge, flood by flood. Integrationover even longer time, as in plots of annual specific sediment yield versus annual rainfall for drainage basins of a single region, also appears to provide the potential for generalisedrelations (e.g. Heusch and Millies-Lacroix, 1971). However, differences in soil and rock type and in the effects of human occupancy on landuse make it difficult to transpose theserelations even between regions with broadly similar climate (Inbar, 1992).
In circumstances where the bed material is a major source of suspensible material, such as is the case with sand-bed ephemeral streams, it has been shown that a mechanistic approach to predicting suspended sediment flux can be more successful (Frostick et al., 1983; Reid and Frostick, 1987). Here, a suspended sediment load formula (Laursen, 1958) that takes its sedimentary information from a definable zone - the stream bed - and uses this in conjunction with hydraulic conditions estimated from hydrographic information can be shown to predict the flux of sand reasonably well (Fig. 4.4). It is, however, still unable to provide an

43
assessment of the clay and silt washload material because this is generated by overland flow on the hillslopes of the catchment and this cannot be parameterised for the equation. For sand-bed and gravelly sand-bed streams and for grains between 0.063 and 2 mm, Laursen’s equation might be deployed to estimate suspended sediment concentration. This can be used in conjunction with a hydrograph to derive partial sediment flux. Laursen’s equation is:
C' = p[D/Y]1.167[(τ'0/τc) - 1]f[(vτ/ρ)/w] (4.3)
in which C' is the concentration of suspended sediment by size class, p is the fraction of the bed material in the size class C', Y is water depth, τ'0 is boundary shear stress associated with the bed material, τc is the critical shear stress for grains of diameter, D, D is the mean
diameter of the grain-size class, f is the Darcy-Weisbach resistance coefficient, τ is boundary shear stress, ρ is fluid density and w is the fall velocity of grains of diameter, D. It should be noted that the concentration of suspended sediment in flash floods is usually high, in therange 101 to 103 kg/m3, significantly affecting the fluid density, and this needs to be taken into account, preferably as a variable but at least in average terms.
4.3.2.2 Bedload
There is little information about the flux of bedload sediment in dryland ephemeral rivers(Chang, 1994). That which is available from direct measurement comes from two upland gravel-bed streams in the northern Negev (Laronne and Reid, 1993; Reid et al., 1998a).Given the complex relation expected between bedload flux and hydraulics from the manystudies carried out in perennial systems (Gomez and Church, 1989), it is interesting andencouraging to note that these two Levantine streams show a behaviour that is significantlydifferent. Indeed, in contrast with the comparatively chaotic pattern that marks suspendedsediment, bedload flux is a simple function of the excess boundary shear stress that is exerted by the flow (Fig. 6.5). There are a number of reasons for the uncomplicated pattern, but the principal one seems to be the fact that the bed is un-armoured. There is an abundance of comparatively fine-grained material available for transport, continually supplied fromhillslopes and gullies, such that the stream bed reacts in a reasonably predictable manner.
The Yatir River dataset has been used to test the ‘performance’ of a number of bedload transport formulae (Reid et al., 1996). These had previously been shown by Gomez andChurch (1989) to provide comparatively poor predictions when rated against a carefullyscreened dataset derived for an armoured perennial gravel-bed river. However, for the Yatir there is a reasonable degree of predictability in some cases. So, for example, while themedian values of the ratios of calculated to observed bedload flux is 1.47 using the formula of Parker (1979) and 0.44 using that of Bagnold (1980), that using the formula of Meyer-Peter and Müller (1948) is 1.18.
Of course, all bedload formulae are highly sensitive to the grain-size used to characterise the bed material, giving the determination of bed material calibre a crucial role in the successful prediction of bedload. In the case of the Yatir, this is shown by taking the median grain size (D50) rather than the weighted grain-size parameter (Dm ˜ D64) advocated by Meyer-Peter

44
and Müller and re-calculating bedload flux using their formula. The median value of the ratio between calculated and observed bedload flux rises to 1.47 for a shift in grain size of a mere 2 mm, illustrating just how sensitive is the equation to this parameter.
The apparent success of the Meyer-Peter and Müller (1948) formula may arise because the nature of the beds of ephemeral streams such as those on which it has been tested is not so dissimilar to conditions in the flume where the formula was calibrated. In the absence ofother field tests and given the comparatively poor performance of other formulae, the Meyer-Peter and Müller equation might be that which is used to predict bedload flux. Bed-loaddischarge, ib , in weight per unit time and per unit channel width is given by:
in which g is acceleration due to gravity; k is bed roughness; k' is particle roughness; τ is shear stress; ρ is the density of the fluid; ρs is the density of the sediment; Dm is acharacteristic surface particle size; fi is the proportion of ith size fraction in the surface grain size distribution; Di is the mean particle size of the ith fraction; u is flow velocity; Y is flow depth; S is water-surface slope; Dx is the xth percentile of the surface grain size distribution.
4.4 SEDIMENT CONTROL
The reduction of erosion on catchment hillslopes should be the primary step in attempting to correct most sediment problems (ASCE, 1977). Controlling sediment production involvesthe prevention of erosion or the reduction of sediment movement. Catchment basin soilerosion can be controlled by agricultural or mechanical methods. Agricultural methods keepthe land covered and disturb the soil as little as possible, utilising conservation tillagepractices. Mechanical protection reduces the runoff velocity, prevents eroded soil from
ib =1g
(k'/k)3/2 τ - 0.047(ρs-ρ)gDm
0.25ρ1/3
3/2
(4.4)
where
Dm = ∑i=1
nfi Di (4.5)
k =Y2/3S1/2
u (4.6)
k' =D1/6
9026 (4.7)

45
entering the main channel system and encouraging water to infiltrate into the soil or alluvium (Hunt and Gilbertson, 1998). These usually involve permanent structures of earth or masonry or both, which are designed to reduce both the effective length of slope and the gradient of the land (Leopold 1992). Mechanical protection methods also include diversion- and gully-control structures.
Terraces appear to be best practice in arid regions where agricultural conservation methods are often difficult, if not impossible, to apply because of low biomass production. Terraces are artificial earth embankment or a combination of channels and embankments constructed across sloping land at fixed intervals down the slope (Ternan et al., 1996). Terraces convert sloping land into a series of flat or nearly flat steps, usually called bench terraces. Design of such structures depends on soil type, depth, climate and slope of the land.
In situations where erosion and sediment transport are not controlled effectively, the upshot is rapid loss of reservoir capacity behind impoundment structures (Ackers and Thompson,1987, Reid et al., 1998b). Grenon and Batisse (1989) estimated that all the reservoirs inAlgeria were suffering from loss of capacity at a rate of about 2-3% per year. Zachar (1982) reported that several Algerian structures, each having approximate capacities of 700 Mm3,had been filled with sediment within 20 years. This is unacceptable, especially where gross national product cannot sustain re-investment and where the number of available sites fordam construction is limited. This makes sedimentation one of the major problems of dryland water management.

46
Figure 4.1. Grain-size distributions of the Il Kimere, an ephemeral sand-bed river of northern Kenya. (A) Surface wash transported by overland flow and residual soils andtalluvium on the catchment slopes (indicating the range in calibre of surface materialavailable for transportation). (B) Suspended sediment carried by flash floods andchannel-bed sediments, which can be seen to contain no silt and clay particles.

47
Figure 4.2. Suspended sediment concentration as a function of instantaneous water discharge in the River Eshtemoa which drains part of the Hebron Hills of Palestine.

48
Figure 4.3. Individual integrated flood suspended and bedload sediment yields as a functionof event runoff in the River Eshtemoa which drains part of the Hebron Hills,Palestine. (A) Yield in mass (B) Yield in settled volume, assuming a deposit bulk density of 1.8 Mg/m3. (N.B. because of the logarithmic scale, zero yields of bedload are arbitrarily placed along the 0.01 ordinate).

49
Figure 4.4. Observed concentration of suspended sediment by grain-size class carried byflash floods in the Il Kimere, northern Kenya, plotted against values calculated usingLaursen's (1958) sediment load equation. N.B. that silt and clay material is washload (see Figure 6.1) and has not been plotted.

50
Figure 4.5. Bedload flux per unit width of channel as a function of contemporarychannel-average shear stress derived as a depth-slope product for two un-armoured ephemeral gravel-bed channels of the northern Negev - (B) the Yatir and (C) the Eshtemoa. A similar plot is given for an armouredperennial gravel-bed channel (A) Turkey Brook in order to highlight thecomparative simplicity of the ephemeral channel response. (N.B. because of the logarithmic scale, zero values of bedload flux are arbitrarily placed along the 0.01 ordinate in the case of Eshtemoa and 0.0001 in the case of Turkey Brook).

51
4.5 REFERENCES
Abrahams, A.D. and Parsons, A.J. 1991. Resistance to overland flow on desert pavement and its implications for sediment transport modeling. Water Resources Research 27,1827-36.
Ackers, P. and Thompson, G. 1987. Reservoir sedimentation and influence of flushing. In: Thorne, C.R., Bathurst, J.C. and Hey, R.D. (eds) Sediment transport in gravel-bedrivers. John Wiley & Sons, Chichester, 845-68.
ASCE. 1977. Sedimentation engineering. Manuals and Reports on Engineering Practice 54, American Society of Civil Engineers, New York.
Anderson, N.J., Wheater, H.S., Timmis, A.J.H. and Gaongalelwe, D. 1998. Sustainabledevelopment of alluvial groundwater in sand rivers of Botswana. In: Wheater, H.S. and Kirby, C. (eds.) Hydrology in a changing environment. Volume II. J.Wiley and Sons, Chichester, 367-376.
Bagnold, R. A. 1980. An empirical correlation of bedload transport rates in flumes andnatural rivers. Proceedings of the Royal Society, London Series A, 372, 453-473.
Bonell, M. and Williams, J. 1986. The generation and redistribution of overland flow on a massive oxic soil in a eucalypt woodland within the semi-arid Tropics of northAustralia. Hydrological Processes 1, 31-46.
Bowyer-Bower, T.A.S. 1993. Effects of rainfall intensity and antecedent moisture on thesteady-state infiltration rate in a semi-arid region. Soil Use and Management 9, 69-76.
Casili, J., Lopez, J.J. and Giraldez, J.V. 1999. Ephemeral gully erosion in southern Navarra (Spain). Catena 36, 65-84.
Chang, H.H. 1994. Selection of gravel-transport formula for stream modeling. Journal ofHydraulic Engineering, American Society of Civil Engineers 120,
Church, M. and Hassan, M.A. 1992. Size and distance of travel of unconstrained clasts on a streambed. Water Resources Research 28, 299-303.
Church, M.A., McLean, D.G. and Wolcott, J.F. 1987. River bed gravels: sampling andanalysis. In: Thorne, C.R., Bathurst, J.C. and Hey, R.D. (eds.) Sediment transport in gravel-bed rivers. J.Wiley and Sons, Chichester, 43-79.
52
Dietrich, W.E., Kirchner, J.W., Ikeda, H. and Iseya, F. 1989. Sediment supply and the development of the coarse surface layer in gravel-bedded rivers. Nature 340, 215-217.
De Ploey, J. 1974. Mechanical properties of hillslopes and their relation to gullying in central semi-arid Tunisia. Zeitschrift fur Geomorphologie 21, 177-190.
Frostick, L.E. and Reid, I. 1982. Talluvial processes, mass wasting and slope evolution inarid environments. Zeitschrift fur Geomorphologie N.F. Supplement-Band 44, 53-67.
Frostick, L.E., Reid, I. and Layman, J.T. 1983. Changing size distribution of suspended sediment in arid-zone flash floods. Special Publication International AssociationSedimentologists 6, 97-106.
Gomez, B. and Church, M. 1989. An assessment of bed load sediment transport formulae for gravel bed rivers. Water Resourses Research 25, 1161-1186.
Grenon, M. and Batisse, M. 1989. Futures for the Mediterranean basin: The Blue Plan.Oxford University Press, Oxford.
Heusch, B. et Milliès-Lacroix, A. 1971. Une méthode pour estimer l'ecoulement et l'erosiondans un bassin. Application au Maghreb. Mines et Geologie (Rabat) Publication 33, 21-39.
Hunt, C.O. and Gilbertson, D.D. 1998. Context and impacts of ancient catchmentmanagement in Mediterranean countries: implications for sustainable resource use.In: Wheater, H. and Kirby, C. (eds.) Hydrology in a Changing Environment Volume II. J.Wiley and Sons Ltd., Chichester, 473-483.
Inbar, M. 1992. Rates of fluvial erosion in basins with a Mediterranean type climate. Catena 19, 393-409.
Kellerhals, R. and Bray, D.I. 1971. Sampling procedures for coarse fluvial sediments.Journal of the Hydraulics Division, American Society of Civil Engineers 98, 1165-1180, 1971.
Langbein, W. B. & Schumm, S. A. 1958. Yield of sediment in relation to mean annualprecipitation. American Geophysical Union Transactions 20, 637-641.
Laronne, J.B. and Reid, I. 1993. Very high bedload sediment transport in desert ephemeralrivers. Nature 366, 148-150.

53
Laronne, J.B., Reid, I., Yitshak, Y. and Frostick, L.E. 1994. The non-layering of gravelstreambeds under ephemeral flow regimes. Journal of Hydrology 159, 353-363.
Laursen, E.M. 1958. The total sediment load of streams. Journal of the Hydraulics Division, American Society of Civil Engineers 84, 1530-36.
Lekach, J. and Schick, A.P. 1982. Suspended sediment in desert floods in small catchments.Israel Journal of Earth Sciences 31, 144-56.
Leopold, L.B. 1992. Base level rise: gradient of deposition. Israel Journal of Earth Sciences 41, 57-64.
Melton, M.A. 1958. Correlation structure of morphometric properties of drainage systems and their controlling agents. Journal of Geology 66, 442-460.
Meyer-Peter, E. and Müller, R. 1948. Formulas for bed-load transport. ProceedingsInternational Association for Hydraulic Structures Research, Stockholm, 39-64.
Negev, M. 1969. Analysis of data on suspended sediment discharge in several streams inIsrael. Israel Hydrological Service, Hydrological Paper no. 12.
Pacheco-Ceballos, R. Watershed erosion. Proceeding of Hydraulic Engineering Conference, Vol. 1, American Society of Civil Engineers, San Francisco, California, July 25-30,1993.
Parker, G. 1979. Hydraulic geometry of active gravel rivers. Journal of the HydraulicsDivision, American Society of Civil Engineers 105, 1185-1201.
Poesen, J., Torri, D. and Bunte, K. 1994. Effects of rock fragments on soil erosion by water at different spatial scales: a review. Catena 23, 141-166.
Powell, D.M., Reid, I., Laronne, J.B. and Frostick, L.E. 1996. Bed load as a component ofsediment yield from a semiarid watershed of the northern Negev. In: Walling, D.E. and Webb. B. (eds.) Erosion and sediment yield: global and regional perspectives.Proceedings of the Exeter Symposium, July 1996. International Association ofHydrologists Publication 236, 389-397.
Reid, I. and Frostick, L.E. 1986. Slope process, sediment derivation and landform evolution in a rift valley basin, northern Kenya. In Frostick, L.E., Renaut, R.R., Reid, I. and Tiercelin, J-J. (eds), Sedimentation in the African rifts. Geological Society of London Special Publication 25, Blackwell Scientific, Oxford, 99-111.

54
Reid, I. and Frostick, L.E. 1987. Flow dynamics and suspended sediment properties in arid zone flash floods. Hydrological Processes 1, 239-53.
Reid, I., Laronne, J.B., Powell, D.M. and Garcia, C. 1994. Flash floods in desert rivers:studying the unexpected. EOS, Transactions American Geophysical Union 75, 452.
Reid, I., Laronne, J.B. and Powell, D.M. 1998a. Flashflood and bedload dynamics of desertgravel-bed streams. Hydrological Processes 12, 543-557.
Reid, I., Powell, D.M. and Laronne, J.B. 1996. Prediction of bedload transport by desert flash-floods. Journal of Hydraulic Engineering, American Society of Civil Engineers122, 170-173.
Reid, I., Powell, D.M. and Laronne, J.B. 1998b. Flood flows, sediment fluxes and reservoir sedimentation in upland desert rivers. In: Wheater, H. and Kirby, C. (eds.) Hydrology in a Changing Environment Volume II. J.Wiley and Sons Ltd., Chichester, 377-386.
Renard, K.G. and Keppel, R.V. 1966. Hydrographs of ephemeral streams in the Southwest.Proceedings of the American Society of Civil Engineers, Journal of HydraulicsDivision 92, 33-52.
Renard, K.G. and Laursen, E.M. 1975. Dynamic behaviour model of ephemeral streams.Proceedings of the American Society Civil Engineers, Journal of Hydraulics Division101, 511-528.
Roose, E. 1977. Use of the universal soil loss equation to predict erosion in West Africa. In: Soil conservation: prediction and control. Proceedings of the National Conference on Soil Erosion. Soil Conservation Society of America, Iowa.
Schick, A. P. and Lekach, J. 1993. An evaluation of two ten-year sediment budgets, Nahal Yael, Israel. Physical Geography 14, 225-238.
Sharon, D. 1972. The spottiness of rainfall in a desert area. Journal of Hydrology 17, 161-75.
Ternan, J.L., Williams, A.G., Elmes, A. and Fitzjohn, C. 1996. The effectiveness of bench-terracing and afforestation for erosion control on Raña sediments in central Spain.Land Degradation and Development 7, 337-351.
Thornes, J.T. 1985. The ecology of erosion. Geography 70, 222-235.

55
Tolouie, E., West, J.R. and Billam, J. 1993. Sedimentation and desiltation in the Sefid-Rudreservoir, Iran. In: McManus, J. and Duck, R.W. (eds.) Geomorphology andsedimentology of lakes and reservoirs. J. Wiley and Sons, Chichester, 125-138.
Vandekerckhove, L., Poesen, J., Oostwoud Wijdenes, D. and de Figueiredo, T. 1998.Topographical thresholds for ephemeral gully initiation in intensively cultivated areasof the Mediterranean. Catena 33, 271-292.
Walling, D. E. & Kleo, A. H. A. 1979. Sediment yields of rivers in areas of lowprecipitation: a global view. International Association of Hydrologists Publication128, 479-493.
Wheater, H.S., Butler, A.P., Stewart, E.J. and Hamilton, G.S. 1991. A multivariate spatial-temporal model of rainfall in southwest Saudi Arabia. I. Spatial rainfall characteristics and model formulation. Journal of Hydrology 125, 175-199.
Wischmeier, W. and Smith, D. 1978. Predicting rainfall erosion loss. A guide toconservation planning. Agricultural Handbook 537, U.S. Department of Agriculture.
Wolman, M.G. 1954. A method of sampling coarse river-bed material. AmericanGeophysical Union Transactions 35, 951-956.
Yair, A., Sharon, D. and Lavee, H. 1978. An instrumented watershed for the study of partial area contribution of runoff in the arid zone. Zeitschrift für GeomorphologieSupplement Band 29, 71-82.
Zachar, D. 1982. Soil erosion. Developments in Soil Science, Elsevier, Amsterdam.
57
CHAPTER FIVE
DATA ACQUISITION
Jean KhouriDirector , Water Resources Division, The Arab Center, For the Studies Of Arid Zones And Dry Lands, Regional Co-ordintor of Wadi Hydrology Network
5.1 DATA ACQUISITION
A hydrological data acquisition system and associated data processing system need to bedeveloped for basins of both perennial streams and ephemeral wadis. Data are required for various planning and management purposes, including floods, water resources andenvironmental protection. For example, "Accurate information on the condition and trends of a country’s water resources- surface and groundwater, quality and quantity- is required as a basis for economic and social development and for maintenance of environmental qualitythrough a proper perception of the physical processes controlling the hydrological cycle intime and space" (WMO/UNESCO, 1991). Information is produced by processing time and space series of data. Data collected from observation networks are often referred to as “raw data”: They are defined as “numerical expression” of measurements of some dimension of a natural or man-made object or phenomenon (WMO-UNESCO, 1997).
Although planners and water managers recognize the value of water resources data andinformation as a basis for sustainable developments, reduction in the budgets allocated tomost agencies charged with the responsibility of data collection, has resulted in inadequatedata systems and sometimes lead to a deterioration of existing data collection networks. Aserious concern in several countries in the Arab region is the ability of water resourcesagencies to meet the growing need for water resources data and information. The need seems to be greatest in areas where data is difficult and expensive to acquire, such as the rugged and inaccessible upper catchments of wadis in Yemen, mountains, the Oman mountains and the Lebanon anti-Lebanon mountain ranges. Hydrologists must therefore collect hydrologic data in a cost-effective manner, ensuring
5.2 TYPE OF DATA
The diversity of possible uses of hydrologic data and water resources information implies that there is a wide range of types of data which should be collected, processed and disseminated. Important applications in wadi systems include:
- Assessment of water resources and evaluation of the potential for future development.- Planning, design and implementation of water projects- Providing security for people and properties including agricultural lands, against water-
related hazards, particularly flash floods and droughts.- Rainwater and floodwater harvesting.- Water and land resources management and environmental protection.
58
Many classifications have been proposed for the uses of hydrological information. For basic water resources assessment purposes the major elements of the hydrological systems areclassified as inflows , storages and outflows . Several factors determine the level ofinformation required, the sensitivity of the natural environment to human and natural impacts,the nature of the physical environment, climate, topography, level of socio-economicdevelopment and national priorities regarding long-term development strategies all influenceand determine the type of data required.
During earlier phases of socio-economic development the focus has been on water resources development and data needs were related mainly to statistics of spatial and temporalvariations of water resources. In later phases, data and information were required not only on the status of water resources but also on uses and impacts on the resource base and the environment.
The classification proposed by UNESCO/WMO regarding data needs for the assessment ofavailability of water resources is considered an appropriate approach to wadi data collectionprogrammes, provided additional data is collected for water resources development andmanagement in accordance with wadi development plans.
Data networks are usually developed for three main purposes which represent different stages of water resources development, starting from the basic assessment of the resource andprogressing towards more intensive data acquisition for water supply projects. In later stages, impacts of water development are assessed and emphasis is placed on data needs foroperation, management and protection of the resource.
The three stages proposed by UNESCO/WMO (1997) include:
(a) Basic water resources assessment; development of the basic networks.(b) Water resources development; expansion of the network to meet the requirements of
development.(c) Integrated water resources management; requires comprehensive evaluation of social and
economic factors; to meet data requirements of supply and demand.
Data requirements of basic water resources assessment include three major types of data (Fig. 5.1):
1. Water cycle data2. Water use data3. Physiographic data
Water cycle data include data on the variation in time and space of water cycle elements and physical, chemical and biological characteristics of water in the elements of the water cycle (Precipitation, evaporation, runoff, groundwater….). Data on water resources uses comprise data on large, medium and small surface and groundwater projects, storages, abstractions,diversions and returns. Physiographic data include data on topography, geology, soils, and land cover. The required level of detail (scale) of the data depends on the purpose for which it is intended.

59
Figure 5.1 Components of Basic Water Resources Assessment Programme

60
Data collection on water cycle elements comprise normally three major groups; historicaldata, real-time data and special surveys. Historical data are collected to obtain the space-timeseries of data on water cycle elements for long-term characterization of these elements(WMO-UNESCO, 1997). Real-time data are transmitted to data collection centres bytelemetering.
The hydrologic characteristics of arid areas should be taken into consideration to define the data collection programme and for the design or development of the network: Rainfall in arid and semi-arid zones is commonly characterized by extremely high spatial and temporalvariability. The temporal variability of point rainfall is well known, but information on thespatial characteristics is much more limited. Rain-gauge densities of about one per Km2 intwo wadi basins (150 Km2, 174 Km2) in southwest USA has shown highly localized rainfall occurrence with spatial correlation of storm rainfall of 0.8 at 2 Km separation, but almost zero for 15-20 Km spacing (Wheater, 1996). The spatial rainfall distribution in Saudi Arabia (arid conditions) has been described by Wheater (1996). The extreme spottiness of rainfallwas illustrated for wadi Yiba and wadi Lith in Southwest Saudi Arabia, inter-gauge spacings were 9-10 Km: on 51% of rainy days only two raingages out of 20 experienced rainfall. Thefrequency distribution of rainstorm duration shows a typical occurrence of one or two hour duration point rainfalls, thus rainfall occurs at few gauges and dies out to be succeeded byrainfall in other locations (Wheater, 1996). Wheater concluded that the basic requirements of arid zone hydrology are for high quality data of rainfall, wadi flows and groundwaterresponse. Such data are needed to investigate processes such as spatial rainfall, infiltrationand groundwater recharge.
Acquisition, processing and dissemination of hydrologic data entails the implementation of a series of functions by hydrological services as illustrated in Figure 5. 2.
These functions can be grouped into three categories;(1) data acquisition, (2) data processing, and (3) dissemination of data
Emphasis must be placed on communication with users to define their needs and ensure that data are accessible to them. Most wadi gauging networks in arid areas have been established in the last few decades; several countries situated in arid environments have expanded their networks 2-3 times in the past 15-20 years (Fig. 5.3). Experience in Oman has shown that network management in ephemeral wadi courses is different in several ways frommanagement of perennial streams in temperate countries. Due to the complex nature ofphysical, hydrological and demographic conditions, emphasis must be placed on checking ofthe data collection procedures by several staff groups to ensure reliability and quality of data (Fig. 5.4). The first group is regional field staff that collect data and make observations. The second group “Network Section” check the field data and input data into the computersystem. The third group “Data Processing Section” is responsible for re-checking updatingrating curves, estimating flows and dissemination of data and information.
5.3 CONSTRAINTS AND NEEDS
Regional evaluations of data collection networks have revealed that from a global perspective a serious concern is the ability of hydrological agencies to meet the

61
Figure 5.2 Activities of a Hydrological Service
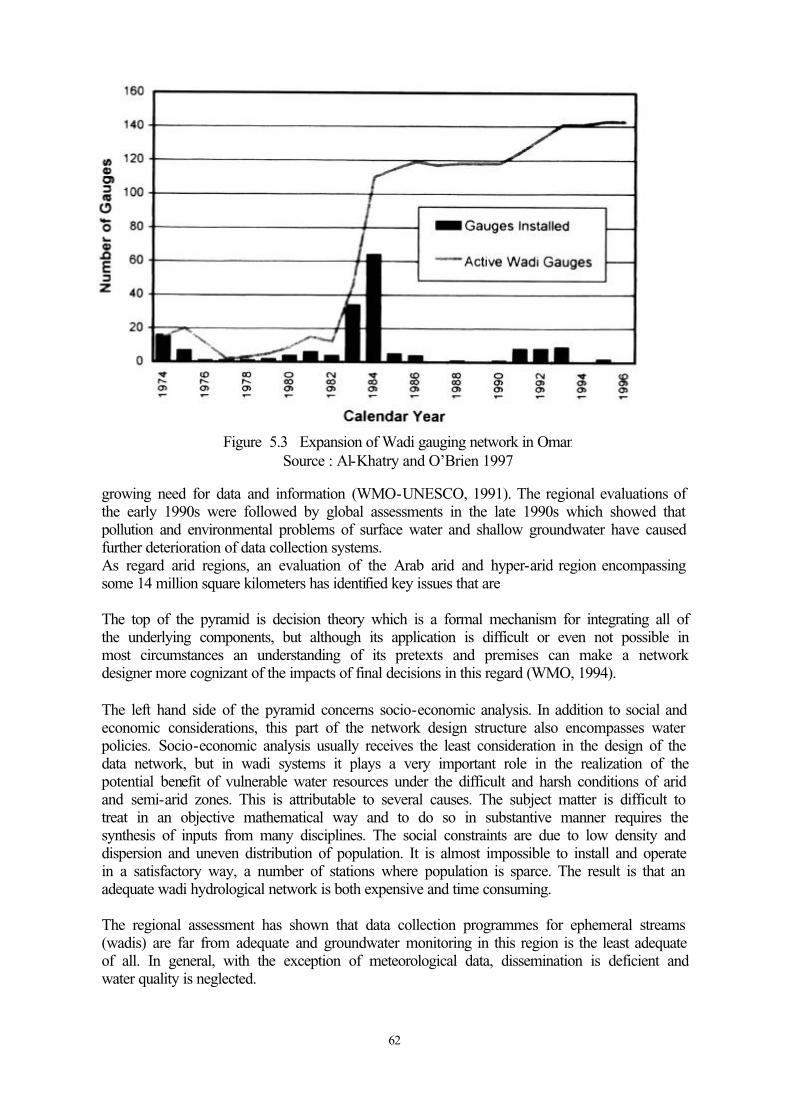
62
growing need for data and information (WMO-UNESCO, 1991). The regional evaluations of the early 1990s were followed by global assessments in the late 1990s which showed that pollution and environmental problems of surface water and shallow groundwater have caused further deterioration of data collection systems.As regard arid regions, an evaluation of the Arab arid and hyper-arid region encompassing some 14 million square kilometers has identified key issues that are
The top of the pyramid is decision theory which is a formal mechanism for integrating all ofthe underlying components, but although its application is difficult or even not possible inmost circumstances an understanding of its pretexts and premises can make a networkdesigner more cognizant of the impacts of final decisions in this regard (WMO, 1994).
The left hand side of the pyramid concerns socio-economic analysis. In addition to social and economic considerations, this part of the network design structure also encompasses water policies. Socio-economic analysis usually receives the least consideration in the design of the data network, but in wadi systems it plays a very important role in the realization of thepotential benefit of vulnerable water resources under the difficult and harsh conditions of arid and semi-arid zones. This is attributable to several causes. The subject matter is difficult to treat in an objective mathematical way and to do so in substantive manner requires thesynthesis of inputs from many disciplines. The social constraints are due to low density and dispersion and uneven distribution of population. It is almost impossible to install and operate in a satisfactory way, a number of stations where population is sparce. The result is that an adequate wadi hydrological network is both expensive and time consuming.
The regional assessment has shown that data collection programmes for ephemeral streams (wadis) are far from adequate and groundwater monitoring in this region is the least adequate of all. In general, with the exception of meteorological data, dissemination is deficient andwater quality is neglected.
Figure 5.3 Expansion of Wadi gauging network in OmanSource : Al-Khatry and O’Brien 1997

63
Figure 5.4 Activities of surface water data in Oman
In order to meet pollution and environmental problems of surface and groundwater,substantial improvements are required in hydrological networks. These improvements mustencompass networks and densities and also the processing and dissemination of data.

64
Major areas of need in the arid and semi-arid area of the Arab Region include improved measurement techniques for wadis, groundwater levels and rainfall characteristics withemphasis on remote sensing technology. Particular effort is needed to improve data basemanagement systems, and systems for data dissemination and exchange, particularly inshared basins (WMO-UNESCO, 1991).
5.4 DEVELOPMENT OF HYDROLOGICAL NETWORKS
5.4.1 Network Design
The design of hydrological networks requires definition of (WMO, 1994);
(a) Hydrological variables to be observed(b) Locations of observation stations and sites(c) Frequency and timing of readings (d) Duration of observation programme(e) Accuracy of observations
To deal with these items network design is conceptualized as a pyramid (WMO, 1994). As shown in figure 5.5 the base of the pyramid is the science of hydrology. This implies athorough assessment of the hydrological setting. As mentioned earlier, the specialcharacteristics of arid and semi-arid zones, in general, and wadi systems, in particular, need to be understood and taken into consideration for designing the wadi network.
The right side of the pyramid deals with quantitative methods for coping with hydrologicaluncertainly. Probability theory provides the understanding that is necessary for appropriateuse of tools of statistics. Statistical tools are represented by sampling theory and bycorrelation and regression analysis (Fig. 5.5), commonly used in network design approaches. Optimization theory is often used in network design. Often however, the choice between two or more network designs must be made on the basis of judgement becauseappropriate optimization tools either do not exist or are too consuming of computerresources to be efficient (WMO, 1994).
5.4.2 Network Density
The concept of network density is intended to serve a general guideline, when specificguidance is leading. In wadis the design densities must be adjusted to reflect actual socio-economic and physio-climatic conditions. Computer based mathematical analysis techniquesshould be applied when data is available to optimize density required to satisfy specificneeds.

65
Figure 5.5 The Basic Building Blocks of Network DesignSource WMO, 1994

66
Table ( 5.1 ) Recommended minimum densities of Hydrological stations
1. Precipitation stationsMinimum densities per station(carea in Km2 per station
PHYSIOGRAPHICUnit
Non-recording 1st. RecordingCoastal 900 9 000Mountainous 250 2 500Interior plains 575 5 750Hilly/undulating 575 5 750Small islands 25 250Urban areas 10 20Polar/arid 10 000 100 000
2. Evaporation stations
Physiographic unitMinimum density per station
(area in km2 per station)Coastal 50 000Mountainous 50 000Interior plains 50 000 Hilly/undulating 50 000Small islands 50 000Polar/arid 100 000
3. Streamflow stations
Physiographic unitMinimum density per station
(area in km2 per station)Coastal 2 750Mountainous 1 000Interior plains 1 875Hilly/undulating 1 875Small islands 300Polar/arid 20 000
4. Sediment stations
Physiographic unitMinimum density per station
(area in km2 per station)Coastal 18 300Mountainous 6 700Interior plains 12 500Hilly/undulating 12 500Small islands 2 000Polar/arid 200 000
5. Water quality stations
Physiographic unit Minimum density per station(area in km2 per station)
Coastal 55 000Mountainous 20 000Interior plains 37 000 Hilly/undulating 47 000Small islands 6 000Polar/arid 200 000Source : WMO Guide to Hydrological Practices : 1994

67
Table (5.2) Minimum Network density in Australia - streamflow gauge stations(sq km per station)
Initial suggestion for AustraliaClimatic Zone
Mountains & Ranges * Flat TerrainMediterranean Zone
(Winter Rain)300 TO 1000 1000 TO 2500
Temperate Zone(Uniform Rain)
300 TO 1000 1000 TO 2500
Tropical Zone (Summer Rain)
300 TO 1000 1000 TO 2500
Transition Zone (Semi Arid)
600 TO 1000 2000 TO 5000
Arid Zone 3000 TO 7000 7000 TO 20000Source : Stewart 1991
Minimum densities for various types of hydrological stations, recommended by WMO in1981, were revised in the new edition of the Guide (1994) on the basis of the WMO Basic Network Assessment Project BNAP (WMO, 1994). Six types of physiographic region have been defined for the minimum network (Table 5.1). These minimum densities are meant to provide guidelines for the initial development of a data collection programme. They do not, however, provide an appropriate guide for some regions as they make no allowance for the special characteristic of the region. In arid zones, for instance, wadi flows are random innature and vary greatly both in space and time. The magnitude of these spatial and temporal variations is important in designing the network. The network is designed to provide aqualitative understanding of temporal, spatial and scale variability. This could be achieved byhaving a mix of primary stations that operate for a very long time and additionalcomplementary stations that operate for a finite period to sample spatial viability.
In Australia, a transition zone between the humid climatic zones and arid zones wasproposed. A higher density of stations in the mountainous regions of the arid zone proper was also proposed (WMO, 1994). Runoff occurring in mountain ranges of the arid zones proper, although highly variable, provide significant resources out of all proportion to theirmagnitude. Since it is important that such resources are monitored and evaluated, provision should be made for a mountainous terrain category in the arid zone, with an appropriatestation density to be considered during network design (WMO, 1994). The density valueappropriate for initial guidance in the Australian Environment are presented in (Table 5.2). The Australian climatic environment and the Mediterranean and Arabian Peninsulaenvironment are similar in certain aspects, but the proposed values should not be used out of context and do not replace design densities based on an understanding of the physio-climaticand socio economic conditions.
The WMO (1996) Basic Network Assessment Project (BNAP) evaluated global networks.The results of the evaluation can be summarized in the following table (Table 5.3).
Adequacy was assessed in two ways (Perks et al., 1996). Firstly application of WMO density criteria and secondly comparison of data against needed densities as perceived by eachcountry. Evaluation of “needed” densities as reported by individual countries (based onsubjective assessment, objective assessment (e.g. modeling) suggested that with the exception of groundwater and water quality networks all hydrologic variable and physigraphic classes (mountains, interior plains hilly/undulating, small islands, coastal and polar/arid/ areinadequate.
68
From the perspective of physiography, small basins such as wadi basins are deemedinadequate for water management needs. These results also differ from those obtained bycomparison with WMO Criteria (WMO, 1994) but are inadequate when using the needed densities. The implication is that WMO criteria for arid, hilly coastal and mountain regionsneed to be reconsidered.
5.5 DESIGN OF SURFACE WATER NETWORKS
The density and distribution of stations within a network and the length of records, depend upon the areal and time variability of hydrological and meteorological elements, which inturn can only be defined as a set of stations at which hydrological and climatologicalobservations are made as a function of time. The aim of a network is to provide a density and distribution of stations in a region so that, by interpolation between data sets at differentstations, it will be possible to determine with sufficient accuracy for practical purposes, the characteristics of the basic hydrological and meteorological elements anywhere in the region(Table 5.4). In this sense, characteristics mean all quantitative data, averages and extremes that define the statistical distribution of the element studied.Because of the growing interest in water management and water planning, the subjects ofmonitoring networks for both quantitative and qualitative data become more and more infocus. The resulting strong increase in the monitoring effort, however, has been attended byrestrictions of financial means and changing views with respect to monitoring objectives. As a consequence, there is a growing need for practically feasible techniques to design andoptimize monitoring networks. Therefore, a general approach is needed to design andoptimize monitoring networks, which explicitly takes into account the important part of theobjectives in the optimization process.
Within the framework of this approach, the following aspects should be considered;
(a) the design and optimization of the network lay-out:including the choice of
• sampling variables (what is to be measured) • sampling locations (where it is to be measured)• sampling frequencies (how often is to be measured)• sampling duration (how long is to be measured)The data recorder at stations in a network will usually be applied to some form ofhydrological model to yield the necessary information for decision making. Thus,mathematical models will usually be developed, either for development or management toestimate data for hydrological elements at an ungauged location from data at gaugedlocations (data transfer), to predict hydrological events on the basis of current information(forecasting) or to transfer information from one type of network to another, (e.g. runoff from rainfall) thus permitting economic trade-offs in configurations of the various networks.Models provide a tool for extracting information from observed data to enhance problem–solving capabilities and are therefore useful adjuncts to hydrological networks. The design ofnetworks can advantageously take this additional capability into account.

69
Table 5.3 Adequacy of basic station densities based on physiographyPercentage of Inadequate Basins (Number of Basins Analysed)
ParameterPhysiographic Non-recording Recording Water Evaporation Discharge Sediment Water Groundwater
Averageregion precipitation precipitation temperature Quality
Polar/arid 100 (5) 67 (3) 100 (5) 71 (7) 60 (10) 33 (3) 0 (4) 75 (4) 66Coastal 72 (43) 61 (44) 72 (29) 57 (35) 49 (37) 60 (10) 3 (15) 18 (11) 57Hilly 32 (41) 43 (42) 45 (20) 36 (25) 55 (64) 35 (17) 7 (15) 17 (12) 40Interior 46 (50) 48 (52) 59 (29) 66 (29) 64 (75) 68 (25) 0 (24) 16 (19) 50Mountain 74 (54) 52 (65) 65 (48) 65 (40) 65 (72) 58 (31) 8 (25) 44 (9) 59Small Island 85 (13) 8 (12) 70 (10) 73 (11) 33 (3) 100 (1) 9 (3) 0 (2) 69
Source: Perks et al., 1996

70
Table ( 5.4 ) ACCURACY LEVELS CONCERNING USE OF WATER RESOURCES DATA FOR PROJECTS
Precipitation River water levels River flow Channel chart Groundwater
Storms Snow Quality Max. Min. Max. Min Quality Plan Levels Yield Qualit
2nd. Water-resourceWatercharacteristicsResource project element Time
Series
Eva-pora-tion Time
SeriesTime
SeriesCross
sectionVelodistr.
Sedi-ment
Hydr.char.
Modifiers of water balance 30 10 40 40 5 15 15 5 10 20
Redistributors of water in space 50 5 10 5 5 10 10 20 5 5 5 20 5 10 20 25
Redistributors of water in time 25 10 40 25 30 10 15 10 5 15 10 20 20 10 20 20 25
Hydropower generation Extractors or suppliers of water energy 25 5 10 5 5 15 10 25 5 5 20 10 20 15 25
Water confiners 25 5 10 5 5 10 25 5 5 5 30 30
Water relievers 25 5 10 5 5 10 25 5 5 5 20 30
Quality improvers at source 35 15 40 20 15 20 5 5 5 20 10 10 20 30
Quality improvers at use points 5 15 10 20 5 5 5 20 10 10 20 20Water related legislation and standards 40 20 50 30 40 10 15 10 10 15 15 25 20 20 20 30 20 20 30 30
Zoning 40 20 50 30 40 10 15 10 10 15 15 25 5 5 5 30 20 20 30 30
Insurance 25 10 10 5 5 10 10 20 10 20 20Flow and water quality forecasting
25 10 40 20 30 5 10 5 5 10 10 20 10 10 10 10 20 20Accuracy levels given as tolerance limits in percent, except for water levels where the limit is given in cm.
Source : WMO – UNESCO 1997 .

71
(b) the installation of measuring equipment, including:• the choice of measuring methods• the design, calibration and installation of equipment• the choice and installation of data transmission systems
(c) the implementation of a data processing system, including the choice of • a suitable data base structure• preprocessing methods• postprocessing methods• analysis and retrieval methods• suitable handware configuration
(d) the organization of a measurement service
5.5.1 Surface Water Data :
In order to determine the desirable density for the minimum network, both the kinds of data to be collected and the reasons for collecting them must be considered. The major uses for hydrometeorological data are for assessment, planning, management and research. Planningusually requires extensive data with a “long” time base, to determine the natural variability of the phenomena. Management, on the other hand, may require less data, but what is doesrequire may be near real time for daily management or for future forecasting. To cope with the objectives of water planning and management, the hydrometeorological data usually are obtained from rather broad routine monitoring networks, which have a very long lifetime.
The emphasis to be placed on any kind of data will vary from country to country, orsometimes, within the same country, depending upon the problems likely to be encountered in water-resources development.
The following basic data are particularly important :- Precipitation and snow cover- Stage and discharge of wadis and stage of reservoirs- Evaporation and evapotranspiration- Sediment transport and deposition- Chemical quality of water- Soil moisture
The main emphasis will be on records of precipitation and wadi discharge as these twoelements usually constitute the major parts of national hydrological and climatologicalnetworks.
5.5.2 Network Development:
The implementation of hydrological networks is an evolutionary process and, for this reason, it is important to recognize that the purposes of data collection and the levels of information requirement change as the level of development of a region changes. Early in the economic development of a region, hydrological networks will have as their primary objective themaking of an assessment of the water resources in the region, and so provide essential

72
information for general resource planning and for evaluating future development proposals.This stage of development may be rapidly superceded by the development of the waterresources to serve the needs of the people and to stimulate the country’s economic growth. The networks must, therefore, be augmented to take into account additional data requirements for the formulation of detailed development plans for design and construction purposes.
It is usually found that there are some stations in operation before a network is formallyorganized. If such stations have been operated for a long period of time and have produced reliable records, the stations should be continued. In fact, the data from existing stationsprovide information essential to the development of a formal network.
In the early stages of development of a hydrological network, the first step should be theestablishment of a minimum or basic network. Such a network should be composed of the minimum number of stations necessary for the basic assessment of water resources of aregion or country.
It is emphasized that a minimum network will not be adequate for the formulation of detailed development plans and will not meet the numerous requirements of a developed region for the operation of projects and the management of water resources.
5.5.3 Expansion of the Basic Network:
Once the basic network is operating, regionalized hydrological relationships or models should be formulated through which all pertinent available data can be used for estimating generalhydrological characteristics defining the statistical distribution of rainfall and runoff at anylocation in a region. The network of observing stations should be adjusted and expanded over time until regional relationships can be demonstrated which will permit estimates of thehydrological characteristics of ungauged areas to a level of accuracy appropriate to thepurpose to be served.
Since economics as well as technical considerations are involved in the design anddevelopment of networks, the number of stations requiring observation over an indefinitelylong period cannot be excessive. Consequently a sampling procedure should be adopted to enable, with the aid of hydrological models, the determination, to an accuracy sufficient for the purpose to be served, of the statistical characteristics of basic hydrological and related meteorological elements anywhere in a region. This approach requires that the hydrometricstations in a network be divided into two categories: (a) principal or base stations, (b)secondary stations.
These stations, also called permanent stations, furnish the basis for statistical studies and thus should be observed continuously and indefinitely. In this context, observations over a period of 40 years are needed to obtain reliable estimates of average water flow in areas with wet climate, whereas more than 70 years of observation would be needed in arid and semi-aridareas (Perks et al., 1996).
The basic network of hydrometric stations will consist of observation points on water courses with a natural regime, as well as with a regime modified by management activities. The basic networks provide data for evaluation of temporal trends and the relation of such trends to various causes. They also provide the data for control of statistical characteristics of
73
generalized information developed for gauged or ungauged sites through the use ofhydrological models.
The secondary stations sometimes referred to as satellite stations, furnish the basis forinterpolating the spatial variability of hydrological elements. They should function for alimited number of years or long enough to establish a good correlation between them and the base stations or with characteristics of the terrain.
5.5.4 Experimental Wadi Basins
An experimental wadi basin is a fundamental need in arid and semi-arid zones, wherehydrological problems are particularly difficult. In their simplest form they permit study ofsimultaneous precipitation and runoff, thus helping to make up for deficiencies in shortperiods of observation and the low density of a minimum network in most wadi basins.
Certain types of experimental basin are used to obtain simultaneously climatological andhydrological data. The networks in such basins may be operated for long or short periods, depending upon the requirements. The requirements of specific process studies should be met in representative wadi basins, including sediment transport, surface water/groundwaterinteraction in wadi channel, and the fundamental issue of groundwater recharge (Wheater,1996).
5.5.5 Co-ordination of Networks:
It is important to establish various networks on a co-ordinated basis, particularly theprecipitation, streamflow, water quality and groundwater networks. In some cases thesenetworks are operated by the same office but often each network is managed independently. Good co-operation is then required for operating and developing such networks. For example, by designing precipitation and water flow networks jointly, there can be an increase in the net output of information on both with a resulting improvement in the economy of the networks.
5.6 DESIGN OF GROUNDWATER NETWORKS
One of the most important hydrological characteristics of wadi systems is the surfacewater/groundwater interactions in the active wadi channel. Wadi alluvium is normally highlytransmissive. The relationship between wadi flow transmission and groundwater rechargedepend on the hydrogeological setting. Air entrapment and heavy sediment load could restrict infiltration rates (Wheater, 1996), but once infiltration has taken place the course alluvium inunderlying the wadi bed minimize evaporation loss.
Adequate groundwater data are essential for water resources assessment and integrateddevelopment and management of renewable water resources in wadi basins. Groundwater is also a resource well suited to arid regions. The recharge of alluvial aquifer systems by wadiflows can provide an important resource. This has been widely recognized by traditionaldevelopments such as Aflaj system in Oman and spate irrigation in Yemen and Saudi Arabia.
Basic requirements to define the available resources are high quality data of rainfall, surface water flows and groundwater response. Long records are essential for the understanding of wadi hydrology which is a pre-requisite for effective management.
74
The required groundwater data include:* spatial and temporal variations of piezometric heads, resulting from natural and human
impacts* hydraulic parameters of aquifers* rates of natural recharge* rates of abstractions* groundwater quality
5.6.1 Methods of Network Design
Network design is based on a set of criteria and constraints which provide a framework for decisions to be made in the process of designing the network. These decisions pertain to the mathematical model of the design problem, the method and procedure of solution, the data to be used, etc..
A policy of network design is characterized by the role it assigns to the benefits from the observations provided by the network, the cost of the network and the errors in the data obtained from the observations.
Three types of networks emerge from policy alternatives:
(a) The optimal network, which is governed by both benefits and costs, while the error level, is a design parameter.
(b) Suboptimal networks which ignore the benefit from the observations and eitherminimize the cost or the network subject to a prescribed error level or minimize the error level subject to a budgetary constraint .
(c) The basic minimum network which is governed by prescribed requirements andguidelines concerning the spatial and temporal pattern of the observations and their levelof accuracy. Budget may also be a common constraint. A distinct feature of the basicnetwork is its reliance on accuracy. The design of the network often depends onaccumulated professional experience rather than on formal methods.
While the minimum densities for groundwater networks have not been developed, guidance on locations and spacing of observations may be provided. The basic or minimumgroundwater network should allow the monitoring of all aquifers, the definitions of which is based on the hydrogeological setting.
5.6.2 Groundwater Observations in Experimental Basins:
A groundwater network in an experimental basin underlain by alluvial aquifer has thefollowing elements (Rofail, 1986).
- Observation wells installed along short lines normal to the main wadi channel tomonitor groundwater level changes in relation to wadi flows. (Fig. 5.6)
- Lines of observation wells (for determining the infiltration of precipitation) positionedalong the main direction of groundwater flow

75
- Single observations wells installed in various areas to provide data for preparationpotentionetric surface of the upper aquifer
- Groups of wells screened to monitor various points in the flow system and variousaquifer in a multi-layered aquifer system. These wells are installed to determine theinterrelations between different hydrogeological units.
When one-dimensional flow is monitored, parameters are measured along a flow line - not more than three wells located along the flow line are needed to constitute the line of
Figure 5.6 Location of observation well in an experimental river basin

76
observation points. To monitor two-dimensional movement, it is necessary to add anadditional well on each side of the line to form a calculation group of five observation wells.
5.6.3 Design of Observations Wells
In consolidated rock formations, observation wells may be drilled and completed withoutcasings. Figure 5.7 shows a completed well in a rock formation. The drilled hole should be cleaned of fine particles and as much of the drilling mud as possible. The cleaning should be done by pumping or bailing water from the well until the water clears (WMO, 1994).
Casing is installed in wells in unconsolidated deposits. The main features of such aninstallation are shown in Figure 5.8. Where groundwater is a few metres to 15 meters deep, hand boring may be a practical method for installing an observation well.
In the areas underlain by a multi-layered aquifer, an observation well is installed as follows: (Figure 5.9) (WMO, 1994).(a) A large diameter well is drilled, until the lowest aquifer is penetrated;(b) A small-diameter observation pipe with a proper screen is installed in the lowest
aquifer;(c) The outer casing is lifted to reach the bottom of the impervious layer above this
aquifer. The top of the lower aquifer is then sealed by cement or other suitable grout;(d) A small-diameter observation pipe with a screen is then lowered to the next highest
aquifer which is again sealed off by grouting from the aquifer lying above it; and(e) Steps (c) and (d) are repeated for each additional aquifer that was penetrated.
The sealing of each of the aquifers should be done very carefully to prevent damage to thewater-bearing formation either by the interchange of water with different chemical properties or by loss of artesian pressure. If the geology of the area is well-known and the depth to each of the aquifers can be predicted, it may be advisable to drill and construct a separate well in each aquifer. Such boreholes are spaced only a few metres apart. This procedure may prove to be more economical and prevents the possibility of interconnection between aquifer units which is always present in multiple completions.
5.6.4 Selection of Observation Sites:
The selection of observation sites is usually based on the following considerations:- Geostratigraphic Zoning : If several aquifers are present in the area with differing
piezometric heads and/or different chemical composition or differing concentrations,separate observation wells must be installed in each aquifer.

77
Figure 5.7 Observation well in a rock formationSource : WMO 1994

78
Figure 5.8 Observation well in a sand formation.Source : WMO 1994

79
Figure 5.9 Schematic vertical cross-section of an observation well in Amultiple aquifer system, source: WMO 1994

80
- Coverage of Spatial Heterogeneity : Each aquifer should be subdivided into zones ofrelatively common major characteristics that influence the hydrodynamic andhydrochemical balance and regime of the groundwater.
At least one observation well should be placed in each zone, the zoning may be bothhorizontal and vertical.
- Hydrogeologic Continuity: The spatial density of the network is supposed to bedetermined in the preliminary design phase. If this has not been done in the formalmethods, the size of the area, the hydrogeology, the objectives of the network andfinancial limitations are taken into account.
- Coverage of Boundary Conditions: Pairs of wells should be placed on short lines normal to the boundaries for the sake of computing the slope of the piezometric head. At asurface water boundary both wells will be located on the same side of the boundary. It the latter is penetrating the aquifer partially, the well closest to the boundary should beinstalled at a distance of 1.5-2 times the saturated thickness away from the boundary. This will eliminate errors, which result from neglecting the vertical flow component near the boundary.
5.6.5 Utilization of Existing Wells:
Groundwater level observations are made in small diameter wells which are specially drilled and constructed for this purpose. It is usually not recommended to use large pits orproduction wells as water level observation wells in as much as the piezometric headmeasured in them may differ from the one in the adjacent aquifer due to local head losses in the pumping well and/or due to the storage of large diameter wells or pits. However, under certain conditions, such as limitations of budget and/or high spatial density of productionwells, it may be possible and even useful to incorporate carefully selected production wells in the groundwater level observation network.
Wells that have been drilled for various purposes in the past and abandoned (e.g. exploration for oil or gas, geophysical surveys) may also be considered as potential observation sites.
Thus the selection of observation sites should be preceded by a thorough survey of existingwells. A prerequisite for incorporating an existing well in the network is a reliableidentification of the aquifer to which the well belongs.
5.6.6 Observation Programme 5.6.6.1 Objectives
Observations of groundwater levels and the measurement of discharge of wells and springsare concerned with investigating:(a) Patterns of annual and long-term change, i.e. maxima and minima and the seasons in
which they appear; the nature of these changes annually and over long periods;(b) Dependence of water-level fluctuations and the discharge of flowing wells and springs on
meteorological factors, on the stage of surface follow, and on resource developmentinduced factors;
81
(c) Dependence of chemical composition and temperature of groundwater on changes in the natural flow pattern;
(d) Directions of groundwater movement;(e) Aquifer hydraulic characteristics;(f) Areas of recharge and discharge
Fluctuations in groundwater levels are a measure of changes in groundwater storage whichmay take place under the influence of both natural and artificial factors (infiltration ofprecipitation, transpiration, evaporation, irrigation or pumping for water supply, etc.). Therate and magnitude of changes in groundwater levels are dependent upon both the extent and magnitude of the external influence, on the groundwater regime and on the permeability ofthe rocks in the aquifer and the zone of aeration. Therefore observations of groundwaterlevels and discharge not only give direct information on the extent and rates of recharge to or discharge from the groundwater system but also permit determination of the hydrologicparameters of the water-bearing materials.
Deep groundwater systems respond rather slowly to external influences; thus there is nogeneral need to register groundwater levels and discharge continuously. However water table rises in wadi alluvial aquifers can be extremely rapid.
5.6.6.2 Frequency of Observations:
Water levelsTo establish a rational frequency of groundwater level measurements at the phase of detailed design it is recommended to ascertain the temporal pattern of groundwater replenishment and discharge, both under natural and disturbed conditions taking into account the influence ofnatural and artificial factors and the variable hydrogeological conditions in each of theobservational subregions.
Water-level extremes (maxima and minima), which are needed in calculating thegroundwater balance, can be derived from daily observations. For similar reasons waterlevels in cavernous limestones should be measured daily, or even sub-daily, during periods ofpossible groundwater recharge from precipitation. The pronounced water-level fluctuationscharacteristic of aquifers in karst areas are best documented by equipping the observationwells with continuos recorders (ACSAD –WMO 1986).
It is recommended that at the beginning of the observations, when details of the groundwater system are not yet known, water levels at key observation sites (e.g. at boundaries, recharge and discharge sites) be observed with continuous recorders or at regular short time intervals.Then graphs of water level fluctuations are constructed for several frequencies ofmeasurement and compared. The graphs will aid in defining the natural observations and indetecting those periods of the year in which are accuracy of the observation is sensitive to their frequency. The number of observations for artesian conditions in the common network is usually only 1 per month and for deep-seated water table conditions only 3 per month. (ACSAD –WMO 1986).
Permanent continuous records may be useful at key points along boundaries and atoperationally strategic sites (e.g. areas of concentrated recharge or pumpage, areas of shallow groundwater). Short term continuous records are useful in investigations related to the

82
identification of the groundwater system (pumping tests, correlation between surface andgroundwater levels, etc.).
Water QualityRegular observation of chemical composition and total mineralization of groundwater inaquifers and of surface waters associated with aquifers are carried out by sampling a grid of key wells seasonally or once or twice a year. In unconfined groundwater, samples should be taken at several depths, at intervals of not more than 2 to 3 m a depth of 10 m below the water table and then at 4 to 5m intervals to depths of the order of 20 to 30 m depending on the extent to which the lithology and hydrochemical properties change with depth. Frequency ofsampling may also be reduced with depth. For the first 10 meters quarterly observations are advisable, and below this depth, twice a year (ACSAD–WMO 1986).
The points where observations of chemical composition of groundwater are made shouldcoincide with the points of water level observations.
The degree of encroachment of brackish or contaminated water from nearby contaminationsources or from the sea or an adjacent aquifer is followed by lines of observation wells along sections normal to the boundary of the respective water body. The wells may have to be drilled in groups with individual screens placed at selected depth intervals so that the fullrange of conditions can be suitably sampled.
Groundwater Temperature
Groundwater temperature is one of the parameters offering means for observing changes inthe state of the groundwater regime in time and space. These relate to conditions for recharge as well as the influence of various natural and man-induced factors on the regime. Because groundwater saturates much of the rock materials in the upper layers of the earth’s crust the water temperature reflects in part the temperature of the water-bearing rocks. The mobilityand thermal capacity of groundwaters, however, serves to redistribute some of the heat within the stratosphere and to influence the development of the geothermal regime within thissphere. Thus the groundwater temperature regime cannot be considered isolated from thetemperature regime of the rocks comprising both aquifers and the adjoining imperviousformations.
Observations of the temperature regime in a section penetrated by wells afford not only a view of groundwater temperature changes in time and space but also contribute to thesolution of a number of theoretical and practical problems.
5.7 WEATHER RADAR AND SATELLITE DATA
Data on the water cycle is mostly collected through conventional networks: Recentdevelopments in this regard include the collection of data through remote sensing: two kinds of technique are are commonly used active and passive.
The active methods are based on the emission of artificial radiation beam towards the target and analysing the target response (WMO-UNESCO, 1997). Radiation may be high frequency electromagnetic (radar) or acoustic (ultrasonic). The apparatus is installed on the ground

83
(radar ultrasonic), on airplanes or on satellites (radar). Active remote sensing is usuallyimplemented on areal basis.
The passive methods are based on the analysis of the natural radiation of an object. The radiation is electromagnetic (from infrared to ultraviolet). Most current applications utilizethe multi-spectral scanner which may be airborne but is usually carried on satellites.
Radars are used for rainfall intensity measurements. They are extensively used inprecipitation monitoring, for example, throughout the UK and USA, but have had very little application as yet in the Arab Region. Remote sensing may be used for measuring areas covered by water bodies and the extent of flood inundation. It has been successfully used for delineating sub-marine springs and shallow alluvial aquifer, particularly buried channels.
5.8 EVALUATION OF OBSERVATION NETWORKS:
An approach for the evaluation data collection networks is based on activity and reference levels relating to the conditions observed in countries (WMO - UNESCO, 1997).
Activity levels are absolute or relative numerical characteristics of the water resourcesassessment programme components reflecting the current status of development of thevarious water resources elements of the area under consideration.
Reference levels are defined as absolute or relative numerical values indicating the minimum requirements of the evaluation elements with which a basic water resources assessmentprogramme in a region should comply to be considered adequate. Most absolute reference levels are, however based on WMO recommendations (Table 5.5).
Reference levels used to evaluate adequacy of data collection systems cover both theinfrastructure and superstructure. Collection of hydrologic data requires a capableinfrastructure. This comprises stations, transmission and measurement equipment, repair
and maintenance facilities, laboratories, satellite recovering stations and corresponding staff:observers, technicians and engineers. The infrastructure personnel consists of the staffrequired to plan and supervise the operation of the infrastructure, to adapt and developtechniques of measurement, quality control and to develop techniques for data storage and processing (WMO, 1997). Reference levels for basic water resources data are obtained inpractice by comparing conditions where monitoring and assessment methodologies andresults are considered satisfactory with conditions where they are assessed. Reference levels for arid and semi-arid zones may need further development.
In general water resources data for actual water use are adequate when the cost of increasing further the collection or accuracy of such data would exceed the economic benefits resultingfrom an increased amount of data or their increased accuracy. However when increasedaccuracy of data may result in the saving of human life other criteria should be applied.

84
Table ( 5.5 ) REFERENCE LEVELS FOR COLLECTION OF BASIC DATAREFERENCE LEVELS
TEMPERATE TROPICALARID HUMID ARID HUMID
EVALUATION ELEMENTS
SED. N.SED. SED. N.SED. SED. N.SED. SED. N.SED.PRECIPITATION STATIONS; NON-RECORDING
(Number per 104 Km2)6 6 20 40 6 6 20 40
PRECIPITATION STATIONS; RECORDING
(Number per 104 Km2)1.5 1 2 2 1.5 1 2 2
EVAPORATION STATIONS; NON-RECORDING
(Number per 105 Km2)3 3 2 2 3 3 3 2
Evaporation stations; recording
(Number per 106 Km2)1 1 0 0 1 1 0 0
Snow courses; conventional
(Number per 104 Km2)3 3 2 2
Stations measuring water quality of liquid and solid precipitation (Number per 100 precipitation and snow courses)
25 25 10 10 25 25 10 10
Surface water level station; non-recording
(Number per 104 Km2)0.6 1.2 12 24 1.2 2.4 12 24
Surface water level stations; recording
(Number per 104 Km2)0.3 0.3 1 1 0.6 1 1 1
River discharge stations: (a)
(Number per 104 Km2)0.5 1 10 20 1 2 10 20
Sediment discharge stations
(Number per 104 Km2)0.3 0.2 3 2 0.7 0.4 5 3
Surface water temperature stations
(Number per 104 Km2)0.3 0.2 3 2 0.7 0.4 5 3
Water quality of surface water
(Number per 104 Km2)0.3 0.2 3 2 0.7 0.4 5 3
GROUNDWATER LEVEL STATIONS; NON-RECORDING
(Number per 104 Km2)5 2 2 0.5 5 2 2 0.5
Groundwater level stations; recording
(Number per 105 Km2)2 1 2 1 2 1 2 1
Groundwater stations measuring hydraulic characteristics
(Number per 104 Km2)5 2 2 0.5 5 2 2 0.5
Groundwater quality stations
(Number per 104 Km2)5 3 5 3 5 3 5 3
Source :WMO – UNESCO 1997

It is difficult to develop a general formula leading to the definition of a single index of anoverall evaluation of all activities concerned. The reasons for such difficulties are related to the evolving socio-economic, environmental and development factors in each basin or region. Other factors are related to the variability of hydrological and hydrogeological data in space and time.
The evaluation process therefore requires judgement and extensive experience. Thecomparison with reference levels should not be regarded as an exclusive basis for design(WMO-UNESCO, 1997). A comprehensive analysis of the situation and local conditionswould make it possible to uncover the major causes of inadequacy.
After evaluation and analysis of current status, an overall approach should be undertaken, aiming if possible to provide guidance for an action plan for improving, if needed, the present situation.
Most of water data acquisition programmes have progressively evolved during severaldecades. They were normally developed for general monitoring purposes rather than for a specific objective, therefore many data collection systems were not developed in accordance with a special design because of continuous changes in data needs.
The quality of the collected data should be emphasized in an adequate water resource data acquisition progromme. Control of quality is the overall system of activities that provideeconomic and satisfactory quality. The general quality of hydrologic data is controlled bymethodology, equipment and the operator during the field, laboratory and computationalphases. All measurements and samples taken in surface and groundwater networks containsome uncertainties, inaccuracies and errors. Certain methods need to the applied or developed to flag ar code the data to categorically quantify, qualify or disqualify them according toaccuracy (ESCWA 1999).
By decreasing the random error, systematic error and therefore the total error theaccuracy and precision of the data are increased and therefore the reliability of information is increased. Much of the uncertainty associated with the acquisition of hydrologic data can le minimized by the use of standard recommended methods (WMO 1994).
Precision of a measurement process depends on the tool or method utilized, whereas, the relative error indicates the accuracy of the method. The relative error is the differencebetween the mean of a series of measurements and the true values expressed as a percentage of the true value (ESCWA 1999).
It is recommended to split data validation tasks between field centres and the central data processing unit. Computerized quality control of primary data is objective and uniform. The computer allows the use of complex checking algorithms impossible to implement by manualtechniques (WMO 1994). It should be recognized, however, that data validation techniques can never he made fully automatic.
Validation output should clearly indicate, normally by the use of flags or codes, both thevalues queried and reason for the queries. For most time series variables, the computer should only be used to accept or to query data but not to reject it; the computer must refer the suspect values to analysis by experienced human judgement.

86
5.9 REFERENCES
ACSAD-WMO 1985. Design of surface water networks, (Jean Claude RASSAM, ShauhiIbrahim ASAAD), UNDP/RAB/007/84, ACSAD/HD/P76 , (121 p) (In Arabic).
ACSAD-WMO 1986. Design of groundwater networks, (Nabil ROFAIL)UNDP/RAB/007/124, ACSAD/HD/P77. Damascus, 177P.
ACSAD-WMO 1988. Drought and low flows in the Arab states ( Jean Claude RASSAM). UNDP/RAB/007/84, ACSAD/HD/P10 , Damascus .
Al-KHATRY, A. and O’Brien, W. 1997. Stream flow records for the wadis of Oman. The Third Gulf Water Conferences, Muscat 8-13 March, P.283-294 .
ESCWA 1999. Quality Control Concepts for Hydrological data E/ESCWA/ ENR/1999/WG1/6 Beirut , ESCWA, 23P.
IAH/IHP, 1994. Guidebook on mapping groundwater vulnerability, IAH, Hannover, 31 p.
IAH/IHP, 1995. Hydrogeological maps, a guide and a standard legend, IAH , Hannover, 17p.
Khouri ,J., and Miller, J.C., 1994. Groundwater vulnerability in areas of climatic extremes, IAH, International Contributions to Hydrology, Hannover, P 49 – 56.
Khouri, J., 1990. Water resources assessment activities in the Arab Region 62P. WMO,unpublished report, 62 P.
Rofail, N., 1986. Design of groundwater networks. UNEDP/RAB/007/86.ACSAD/H.D./P.77, Damascus, Syria, 177p.
Perks, A., Winkler, T. and Stewart, B., 1996. The adequacy of hydrological networks: a global assessment. WMO/TW - No 740, Geneva, 56pp.
Wheater, H.S., 1996, Wadi Hydrology: Process response and management implications, IHP-V. Technical Documents in Hydrology, No.1 , P 1-13.
WMO, 1988. Technical regulations, V. L. III, Hydrology, WMO-No.49, Geneva.
WMO, 1994. Guide to hydrological practices, WMO-No. 168, Fifth edition, Geneva, 735 P.
WMO/UNESCO, 1991. Report on water resources assessment, progress in theimplementation of the Marl del Plata Action Plan and a Strategy for the 1990, 64P.
WMO-UNESCO, 1997. Water resources assessment, handbook for evaluation of nationalcapabilities, 153 P.

87
CHAPTER SIX
RAINFALL-RUNOFF ANALYSIS AND MODELING IN WADI SYSTEMS
Dr. Radwan A. Al-Weshah, Assocaite Professor of Hydrlogy and Water Resources, Department of Civil Engineering, University of Jordan, Amman, Jordan. E-mail: [email protected]
6.1 INTRODUCTION
Rainfall-runoff relationships play a fundamental role in many aspects of catchmentmanagement, for example determining the availability and sustainability of water resources, design of flood protection works, and operational aspects of flood and water resourcesmanagement. Hence analysis and modelling of rainfall-runoff relationships is an importantaspect of hydrological practice. However, the characteristics of arid and semi-arid areas are often significantly different from those of more humid climates, and yet the methodsdeveloped and commonly applied generally reflect humid zone experience. In this chapter we summarize current practice and point to the need for much future work to provide appropriate methods for arid and semi-arid areas.
Rainfall is the main driving force in the hydrology of wadi systems. Wadi systems in arid and semi arid regions are commonly subjected to sporadic storms that vary greatly in timeand space. Direct runoff, or stormflow, is that portion of rainfall which enters the wadichannel systems after infiltration, detention storage and other abstractions are satisfied. Due to high rainfall intensities and sparse vegetation, surface runoff is often the dominant runoffprocess and flows first as a thin layer of sheet flow called overland flow. When this overland flow reaches a channel or Wadi, the flow is concentrated and becomes channel flow.Commonly in arid and semi-arid areas, flood flows lose water by infiltration into the channel bed. These losses are known as transmission losses, and the channel flow may as a result decrease with increasing distance downstream. A well-known characteristic of arid and semi-arid areas that results from this and the spatially-localised rainfall is that the runoff/unit area decreases as catchment area increases.
For a rainfall storm event, the resulting flood hydrograph, which is a time series of volume flow rate during the flood event, is a function of the rainfall storm and watershedcharacteristics. Commonly flows are ephemeral, that is flow only occurs for relativelylimited periods in the year during, and immediately following, storm events.
A range of different types of model is available to represent rainfall-runoff relationships (see, e.g. Wheater et al., 1993). However, a limitation of most rainfall-runoff analysis models is that hydrologic parameters used to describe the rainfall-runoff process in wadi systems must be calibrated and verified based on historical measured rainfall and flood events. The simpler methods, such as the unit hydrograph, can however be generalised for application toungauged catchments, as explained below.

88
6.2 FACTORS AFFECTING RAINFALL-RUNOFF RELATIONSHIPS
The factors that affect the rainfall-runoff relationship in a specific catchment can be divided into two main categories or characteristics, namely those related to the rainfall and thoserelated to the watershed. The history of rainfall prior to an event will determine antecedent conditions and may have a strong influence on runoff production.
6.2.1 Rainfall (Storm) Factors
The storm factors that influence the shape of the flood hydrograph, peakflow and the volume of runoff include: rainfall intensity, duration, spatial distribution over the basin, direction ofstorm movement, and type of storm. These factors can be summarized as follows:
1. Rainfall intensity affects the amount of runoff and the peak flow rate. For a givenrainfall duration, an increase in intensity will increase the peak discharge and therunoff volume, provided the infiltration capacity of the soil is exceeded.
2. Rainfall duration affects the amounts of runoff, the peak flow rate and the duration of surface runoff. For a rainfall of given intensity, the rainfall duration determines, inpart, the amount and timing of the peak flow.
3. The spatial distribution of rainfall can cause variations in hydrograph shape. If thecenter of the storm is close to the basin outlet, a rapid rise, sharp peak and rapid recession of the hydrograph is observed. If a larger amount of rainfall occurs in the upper reaches of a basin, the hydrograph exhibits a lower and delayed peak.
4. The direction of storm movement with respect to orientation of the basin can affect both the magnitude of the peak flow and the duration of surface runoff. Stormdirection has the greatest effect on elongated basins. On these basins, storms thatmove upstream tend to produce lower peaks of a longer duration than storms that move downstream.
5. The type of storm is important in that thunderstorms produce peak flows on smallbasins, whereas large cyclonic or frontal-type storms are generally dominant inproducing major floods in larger basins.
If areal variability is small, the variation in the storm intensity over its duration is bestpresented by a rainfall hyetograph, as commonly applied in design practice. However, theassumption of areally uniform rainfall is likely to be highly questionable where localisedthunderstorm rainfall predominates.
For design purposes, a design storm hyetograph is usually developed based on historical or synthetic data of past storm events. Examples of these hyetograph distributions are the SCS method distributions (Chow et.al, 1988). Figure 6.2.1 shows the SCS type II dimensionlessstorm hyetograph. More recently, however, rainfall models have been developed which canbe used to simulate more realistic time series, either for individual storms, or continuousrainfall sequences (e.g. Onof et al., 1996, 2000).
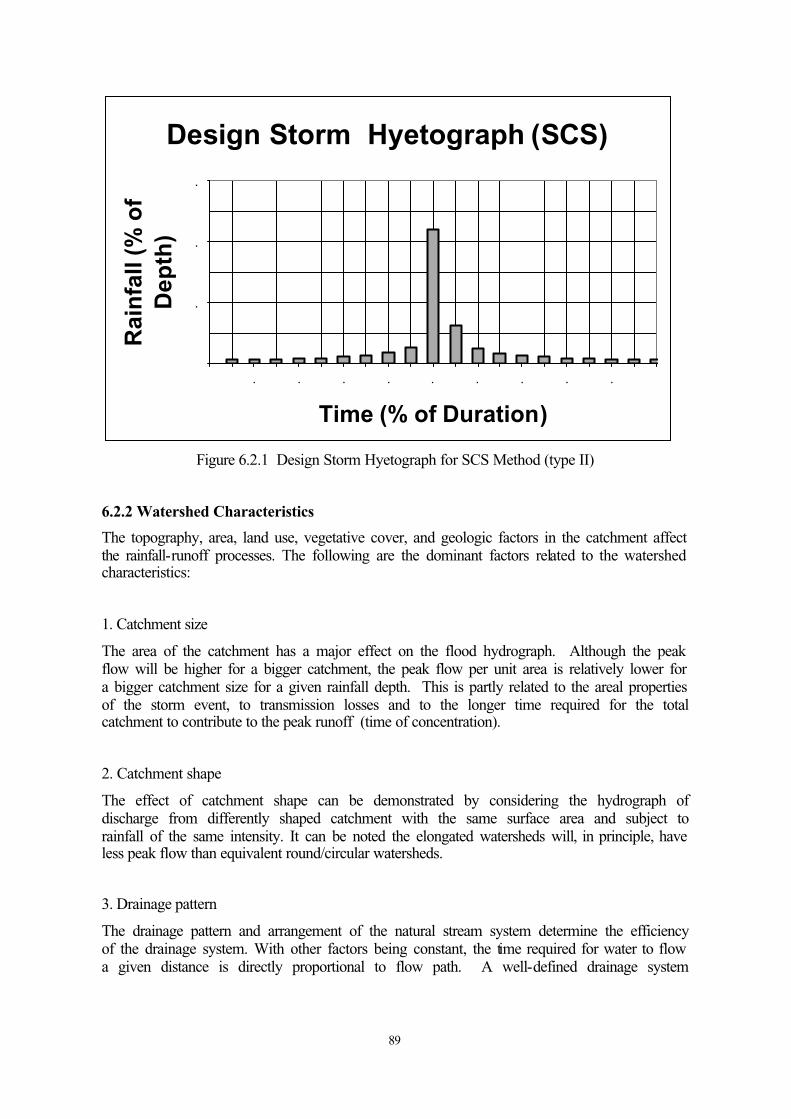
89
Design Storm Hyetograph (SCS)
.
.
.
. . . . . . . . .
Time (% of Duration)
Rai
nfa
ll(%
of
Dep
th)
Figure 6.2.1 Design Storm Hyetograph for SCS Method (type II)
6.2.2 Watershed Characteristics
The topography, area, land use, vegetative cover, and geologic factors in the catchment affect the rainfall-runoff processes. The following are the dominant factors related to the watershed characteristics:
1. Catchment size
The area of the catchment has a major effect on the flood hydrograph. Although the peak flow will be higher for a bigger catchment, the peak flow per unit area is relatively lower for a bigger catchment size for a given rainfall depth. This is partly related to the areal properties of the storm event, to transmission losses and to the longer time required for the totalcatchment to contribute to the peak runoff (time of concentration).
2. Catchment shape
The effect of catchment shape can be demonstrated by considering the hydrograph ofdischarge from differently shaped catchment with the same surface area and subject torainfall of the same intensity. It can be noted the elongated watersheds will, in principle, have less peak flow than equivalent round/circular watersheds.
3. Drainage pattern
The drainage pattern and arrangement of the natural stream system determine the efficiencyof the drainage system. With other factors being constant, the time required for water to flow a given distance is directly proportional to flow path. A well-defined drainage system

90
reduces the flow distance, thus reducing the travel time, and the resulting outflow hydrograph will usually have a shorter time to peak.
4. Slope of the catchment
The steeper the slope of the catchment, the more rapidly surface runoff will travel.Therefore the time to peak will be shorter and the peak will be higher. Infiltration capacitytends to be lower as slopes get steeper.
5. Storage in the catchment
Antecedent conditions will affect soil moisture and groundwater storage, and in general, the wetter the catchment, the greater will be the volume of storm runoff. In addition, artificialstorages, such as reservoirs or detention ponds, must first be filled before any runoff occurs, which usually delays the time to peak and attenuates the peakflow.
6. Soils and geology of the catchment
Soils and geology of the catchment primarily influence the groundwater component and the “subsurface losses”. Hydrologic soil groups are classified based on the soil drainagepotential. High infiltration rates reduce the surface runoff; high permeability combined withhigh transmissivities substantially enhances the base flow component. According to SCS,soils are grouped into four hydrologic soil groups based on their water drainage potential as A, B, C and D:
A.Soils having high infiltration rates even when thoroughly wetted and consisting mainlyof deep, well to excessively drained sands or gravels. These soils have a high rate of-water transmission.
B. Soils having moderate infiltration rates when thoroughly wetted and consisting ofmoderately deep to deep, moderately well to well drained soils with moderately fine to moderately coarse textures. These soils have a moderate rate of water transmission.
C.Soils having slow infiltration rates when thoroughly wetted and consisting chiefly ofsoils with a layer that impedes the downward movement of water or soils with no-fineto fine texture. These soils have a slow rate of water transmission.
D.Soils having very slow infiltration rates when thoroughly wetted and consisting chieflyof clay soils with a high swelling potential, soils with a permanent high water table, soils with a clay layer at or near the surface, and shallow soils over nearly impervious material. These soils have a very slow rate of water transmission.
7. Land use/vegetative cover complex
Land use and vegetative cover complexes strongly affect rainfall-runoff characteristics.Urbanization may dramatically increase flood peaks unless appropriate design measures, such as detention reservoirs, are constructed. Characteristics of vegetative cover, land treatmentand cropping have a significant effect on runoff characteristics and flood hydrograph. Event-based calculation methods usually take the land-use/vegetative cover complex intoconsideration in the form of a runoff coefficient, or the SCS curve number (CN).

91
6.2.3 Time of Concentration
This is a time parameter that is related to other watershed characteristics such as slope, length and area. The time of concentration (Tc) is defined as the time needed for a drop of water to travel from the most distant point in the watershed to the design point downstream. Itincludes both time for overland flow and time for channel flow. Many empirical equations are available to calculate Tc. Attention should be paid to the system of units and to thelimitations of each method. The Kirpich equation (1940) and its modified forms arecommonly used for rural areas to estimate Tc directly as
Tc = 0.01947 L0.77 S-0.38 (2.1)
where
Tc = time of concentration in minutes
L = length of the longest path of water in meters.
S = the average slope of the basin m/m
This method is recommended for small mountain areas, and it has been useful for many wadi systems.
6.3 MEASUREMENTS OF RUNOFF
Runoff is generally measured using water level recorders. These recorders are either manualor automatic ones provided with a mechanism to measure the flow stage over time. The stage discharge relation curve, called a rating curve, is established for each flood gauging site. The rating curve, established at the gauging station, has to be updated regularly because scour and sedimentation of the wadi bed and banks may change the stage discharge relation,particularly after a flood event.
The rating curve can be adequately presented by an equation of the form
Q = a (H –Ho)b (3.1)
Where Q is the discharge in m3/sec, H is the water level in the wadi in m, Ho is the water level at zero flow, and the factors a and b are constants. The value of Ho is determined by trial and error. The values of a and b are found by linear regression on log-transformed data. The form of Equation (3.1) above is compatible with the Manning formula where the cross-sectional area A, and the hydraulic radius R are functions of (H –Ho)
6.4 RUNOFF DATA ANALYSIS
The study of surface water hydrology and in particular the flood hydrograph is of primaryimportance to wadi hydrology. Most hydrologic and hydraulic design requires an estimate of the flood flows or flood volume. We focus here on classical methods for the analysis and modelling of individual storm events.

92
6.4.1 Runoff Hydrograph
A flood hydrograph is the graphical representation of the instantaneous discharge of a stream versus time during a flood event. It includes the integrated contributions from surface runoff, groundwater seepage, soil drainage and channel precipitation. The shape of hydrograph of a single storm occurring over the drainage area follows a general pattern. This pattern shows a period of rise that culminates in a peak, followed by a period of decreasing discharge (called recession) which may, or may not, decrease to zero discharge depending on the amount ofbase flow.
Runoff processes are complex, but for purposes of analysis the hydrograph can beapproximated as consisting of two main components, namely baseflow, contributed fromslow response processes such as soil and groundwater drainage, and direct surface runoffwhich is produced by rapid runoff processes, including overland flow. When the rainfallexceeds the catchment abstractions and other losses, the rains begin to contribute tostreamflow. That proportion of rainfall that finds its way rapidly to the wadi (to becomedirect surface runoff, or stormflow) is known as effective or excess rainfall. As the stormproceeds, the proportion of effective rainfall increases and the lost rainfall decreases,resulting in a strongly rising limb.
The peak of the hydrograph is reached after the effective rainfall has reached its maximum. The time difference between the centroid of the effective rainfall and the maximum runoff is commonly called the time lag (although alternative definitions of time lag are also used)which is a useful parameter to summarise the dynamic response of the flood hydrograph.
The boundary between surface runoff and base flow is difficult to define operationally andseparation methods have no clear physical basis. It depends strongly on the hydrogeologicalconditions of the catchment. The base flow component usually finishes at a higher level at the end of the storm than at the rise of the hydrograph, and thus there is an increase in the wadi runoff from slow runoff components such as groundwater seepage. Groundwater and soilwater drainage provide the total recession flow until the next period of rainfall.
The recession curve, being solely the effect of soil drainage and groundwater seepage, maybe described by Eq. (4.1), derived previously as :
Q = Q(to) * e-K(t-to) (4.1)
The equation produces a straight line when plotted on semi-logarithmic paper, which allows the determination of k and hence the base flow recession.
The surface flow hydrograph is obtained from the total storm hydrograph by separating thedirect runoff flow from the slow base flow component of the total runoff hydrograph. There are several methods of base flow separation that are commonly used, details of which can be found in other references (e.g. Chow et al., 1988, Maidment, 1993). However, for arid areas, the fact that water may flow from the wadi into the groundwater affects the separation line between surface water and groundwater, and for ephemeral flows there may be zerobaseflow, in which case no separation is needed..

93
Both the direct runoff hydrograph and effective rainfall hydrograph represent the samephysical quantity but in different units. Since the effective rainfall hyetograph is usually indepth rate units, the excess rainfall depth rate has to be multiplied by the catchment area to give the total volume rate of direct runoff. This volume is equivalent to that of the directrunoff hydrograph (DRH). The initial loss and infiltration losses are estimated based on the available data of the catchment.
6.5 METHODS OF RUNOFF ESTIMATION
The hydrologic system may be viewed as a black box model in which inputs are rainfall and watershed characteristics and the output is a runoff hydrograph, which is needed for hydraulic analysis and design. Different methods and procedures are available to estimate runoff from rainfall for individual storm events. The following factors should be considered beforeselecting the most suitable runoff calculation methods:
1. The desired objective of analysis: what do we actually need; a runoff volume, peakflow, or a runoff hydrograph.
2. Available data: long-term records of hydrologic data permit the application of statisticalprocedures (for example,frequency analysis) and/or the analysis of catchment response(for example, derivation of a unit hydrograph). The effectiveness of the analysistechniques is limited by the adequacy of available data series. Where data are limited or non-existent, methods based on regional analysis may be available.
3. The area and characteristics of the watershed: these factors affect the runoff process and generally govern the way in which runoff and peak flow occurs.
4. The importance of the project and the resources and time available for analysis: theresources and time available for the analysis govern mainly the depth and sophisticationof the analysis.
The recommended practices for estimating peak flows may be grouped on the basis of watershed area as a guideline shown in Table 6.5.1.
A brief description of commonly used methods is given below, in a sequence of increasingcomplexity. An important distinction is between methods based on rainfall, and methods based on flow data only.

94
Table 6.5.1 Watershed Area vs. Methods Used for Peak-Flow Analysis
Watershed
Area (Sq. km)
Methods Commonly Used
< 2.5 Infiltration approach, rational method
< 250 Some empirical methods (e.g., Talbot); unithydrograph; flood frequency analysis; flood peaks versus drainage area and catchment characteristics.
250 – 500 Unit hydrograph; flood frequency analysis; flood peak versus drainage area and catchment characteristics.
> 500 Distributed modelling including flood routing; flood frequency analysis; flood peaks versus drainage area and catchment characteristics.
6.5.1 Simple Correlation Method
The relationship between rainfall and the resulting peak runoff is quite complex and isinfluenced by the catchment and climate conditions. With adequate records of data, a simple correlation for the estimation of runoff can be investigated. One of the most commonmethods is to plot runoff (R) against rainfall (P) values. In humid areas, no simplerelationship may emerge, due to effects of antecedent conditions, seasonality of vegetation,etc. However, for arid areas, such effects may be less important. A common simple method is to fit a linear regression line between R and P and to accept the result if the correlationcoefficient (r) is close to unity. The equation for straight-line regression between runoff Rand rainfall P is
R = aP + b ………………. (6.5.1)
and the values of the coefficient a and b are given by the slope and intercept of the straight line equation, respectively. The coefficient of correlation r represents the goodness of fit; the value of r lies between 0 and +1 as runoff can have only positive correlation withprecipitation. A value of 0.8 or more indicates good correlation. However, the data should always be plotted for visual inspection, for example a non-linear relationship might give a better fit as discussed below (It should be noted that localised rainfall and the effect oftransmission losses can complicate this simple plot. Wheater and Brown (1989) found for a small wadi in S.W.Saudi Arabia that the largest observed flow came from the smallestobserved rainfall - an artefact of incomplete measurement of spatial rainfall and transmission losses).
For large catchments, it is common to have an exponential relationship such as :
R = c P m ……………….(6.5.2)
where c and m are constants; in fact equation 5.2 can be reduced to a linear form bylogarithm transformation.
Many improvements of the above basic rainfall – runoff regression by considering additional parameters such as soil moisture or antecedent rainfall have been attempted. As noted above,

95
antecedent rainfall influences the initial soil moisture and can have a strong effect on runoffgeneration.
6.5.2 Regional Analysis - Methods based on Area
For situations where data are limited or non-existent, regional analysis must be used. The discharge of a given frequency can be expressed as a function of the drainage area and other catchment characteristics based on relationships for catchments which have similar climaticand hydrologic characteristics. Design flood formulae are generally based on a function ofdrainage area and possibly other parameters. Where area is the dominant explanatoryvariable, a general expression is used, of the form :
QT = C. Am ………………… (6.5.3)
where
QT = design flood discharge of return period T years
A = area of a drainage basin
m = an exponent ranging from 0.4 to 0.7
C = a constant, which depends upon many factors such as topographic, climaticand other characteristics of a drainage basin, which affect the run-off.
The use of empirical formulae involves the determination of the area that contributes to the flow at the drainage structure site. The drainage area, expressed in square kilometers orhectares, is determined from survey or topographic maps. The value of 'C' depends on many factors pertaining to a particular drainage area such as shape, size, slope, type of soil, surfaceinfiltration, storage and land use. The factor C can be determined based on adequatehistorical data of flood events over different areas with similar characteristics. The value of C will be valid only for the region or drainage basin for which to has been determined. Actual flood records of most of the wadis in the Arab world are not available, therefore the use of empirical formulae mostly depends upon the experience and sound judgment of thehydrologist.
The following analysis was performed on data from selected wadis in central and north parts of Lebanon. As shown in Figure 5.1 the best fit power regression model has the form
Q100 = 16.122 A0.5479 (6.5.4)
where
Q100 = flood magnitude for the 100-year frequency, m3/s
A = drainage area, km2
The coefficient of determination for such a regression model R2 is found to be 97.72%. This simple type of equation relates peak flows to the watershed area only.

96
Power Regression for -Year Flood Vs. Area
Q = . A.
R = .
Area (sq. km)
Peak
flow
(m/s
)
Real Data Power (Real Data)
Figure 6.5.1 Power Regional Regression Model For the 100-Year Flood Event in Selected Wadis in Lebanon
6.5.3 The Talbot and Modified Talbot Formula
In Saudi Arabia, the Ministry of Communications (MOC) has developed a modified form of Talbot formula, which is a particular case of the area-based methods. The general form of the Modified Talbot formula, being used by MOC is:
Q25 = C. An (6.5.5)
Where
Q25 = the 25-year return period flood flow.
A = drainage area in hectares
n = an exponent (see Table 6.5.2 below).
C = total or (composite) coefficient for runoff = C1 + C2 + C3
Table 6.5.2 Modified Form of Talbot Formula Used by MOC
Drainage Area (Hectares) 25-Year Frequency Flood Flow
0 to 400 (small catchment area) Qbasic x S. F.
400 to 1258 0.837 x C x A3/4
1258 to 35944 4.985 C A1/2
Over 35944 14.232 C A2/5
Accordingly, the 50-year and 100-year flood events, which may be used for design ofhydraulic structures, the following equations are adopted.

97
Q50= 1.2 Q25 (6.5.6)
Q100= 1.4 Q25 (6.5.7)
where terms in Table 6.5.2 are
Qbasic = basis peak flow derived from MOC curves based on catchment area;
A = drainage area in hectares;
S.F. = slope factor for drainage area given in MOC manual; and
C = total coefficient of runoff which is the sum of C1 + C2 + C3.
Values of C1, C2 and C3 are derived from the guidelines given by MOC and based on the watershed characteristics. Usually values of C should fall between 0.3 and 1.0.
Although this method has been widely used for design of most hydraulic structures in Saudi Arabia, it has been criticized by many hydrologists for its wide range of values of themodification factor which ranges between 0.1 and 2.0 without any clear criteria. Suchmethods ideally require careful evaluation using local data.
6.5.4 The Regional Regression Method
More generally, regional flood regression equations can be developed which includeindependent variables like area, precipitation intensity, catchment slope, soil and land useparameters. The general form of this equation for peak flow of return period T is given by
QT = a1 Aa2 E a3 PTa4 Sa5 Ma6 (6.5.8)
where QT is the peak flow of return period T, A is the catchment area, E is the catchment elevation above datum, P is the storm precipitation (daily or annual), S is the catchment slope, M is a factor for soil and vegetative cover, and the coefficients a1 through a6 are regression coefficients derived from regional regression analysis. Such relationships havebeen developed for the arid and desert regions of the southwest part of the United States, by the USGS (e.g. Blakemore et al., 1995), where area, mean elevation, mean annualprecipitation, mean annual evaporation, and latitude and longitude were used as theexplanatory variables.
Alternative approaches to regionalisation of flood frequency evaluate the ratio of QT to an index such as the mean annual flood QBAR (the growth curve). A useful analysis of aridregion data is given by Farquharson et al., 1992. An advantage of this approach is that where just a few years of site-specific data are available, they can be used to estimate QBAR, and the regional data can be used to provide the growth curve.
6.5.5 The Rational Formula
This method is based on the assumption that a steady uniform rainfall rate in time and space will produce maximum runoff when all parts of the watershed are contributing to outflow.This condition is met when the storm duration exceeds the time of concentration. It is used to calculate the surface runoff discharges generated from a design storm with a specific return period and a duration time equal to the time of concentration of the catchment. The method translates the rainfall to runoff using the following formula.

98
QC
= I A
3 6 0 (6.5.9)
where
Q = peakflow rate (maximum runoff), m3/s
A = catchment area, hectares.
I = rainfall intensity, millimeters per hour.
C = runoff coefficient
Values of runoff coefficient C are given in most hydrology textbooks.
Due to assumptions regarding homogeneity of rainfall and equilibrium conditions at the time of peak flow, the rational method should not be used on areas larger than about 250 hectares without subdividing the overall watershed into sub-basins and including the effect of routingthrough any drainage channels. Practically, it can applied to the catchments with an area up to 500 hectares for comparison purposes and validation of other methods.
6.5.6 Soil Conservation Services, SCS (now Natural Resources Conservation Service, NRCS) Method
The SCS or Curve Number method calculates the volume of runoff given the input rainfalldepth and the curve number (CN). This is a widely used method where data for site-specificanalysis are not available. The relations are given by
10CN
1000
and
0.2meana with 0.4,0
)inunits(all])1([
)(2
−=
=<<
−+−=
S
inchesSP
SPQ
λλ
λλ
(6.5.10)
where
Q = direct runoff depth (inches)P = rainfall depth (in)
S = potential retentionCN= the curve number, a value depends on hydrologic soil group and land use-land cover complex). The hydrologic soil groups, as defined by SCS soil scientists, are A, B, C, and D described earlier.
Antecedent moisture conditions are another parameter to affect the choice of the CN value.Three AMC conditions were developed by the SCS method, these are AMC I, AMC II, and AMC III. AMC I represents dry soil conditions; it yields the lowest runoff potential. AMC II represents average (normal) soil conditions; it yields the average (normal) runoff potential.AMC III represents wet soil conditions; it yields highest runoff potential.

99
According to the US Soil Conservation Service (SCS), the curve number for dry AMCdenoted by CN(I)is related to the curve number of the normal average CN(II) as (Chow et. al, 1988).
CN I( ) =4. 2 CN(II)
10 - 0. 058 CN( II)(6.5.11)
where CN (II) is the curve number for the normal AMC given in most hydrology textbooks and shown in Table 6.5.3 (Chow et al. 1988). Similarly, for wet conditions of antecedent moisture the curve number CN(III) is related to the average normal CN (II) as
CN III( ) =+23CN( II)
10 0.13CN( II)(6.5.12)
Peak Flood Calculations by the SCS Method
The shape of the SCS flood Hydrograph is standard and depends on the watershed area and the lag time of the basin. The lag time is about 0.6 times the time of concentration. The peak flow for one unit of rainfall excess is given by
TQ
Rpeak
A2.08= (6.5.13)
where
Qpeak = the peak discharge in (m3/s);
A = the drainage area in (km2); and
TR = the time of rise of the flood hydrograph which equals the lag time plus on-half of the storm duration in (hours).
The SCS flood hydrograph calculations are performed by many available computer software and package described in Appendix 6.A. While the method is simple and flexible, it isimportant that it is evaluated using data from the region; there is as yet little critical analysis of its performance in the region.

100
TABLE 6.5.3Runoff Curve Numbers for Selected Agricultural, Suburban, and Urban Land Uses (Antecedent
Moisture Condition II, Ia = 0.2S)
Land Use Description Hydrologic Soil Group
A B C D
Cultivated Land1: without conservation treatment with conservation treatment
7262
8171
8878
9181
Pasture or range land : poor condition good condition
6839
7961
8674
8980
Meadow : good condition 30 58 71 78Wood or forest land : thin stand, poor cover, no mulch good cover2
4525
6655
7770
8377
Open Spaces, lawns, parks, golf courses, cemeteries, etc.Good condition : grass cover on 75% or more of the areaFair condition : grass cover on 50% to 75% of the area
3949
6169
7479
8084
Commercial and business areas (85% impervious) 89 92 94 95Industrial districts (72% impervious) 81 88 91 93Residential3 :
Average lot size Average % impervious4
1/8 acre or less 651/4 acre 381/3 acre 301/2 acre 251 acre 20
7761575451
8575727068
9083818079
9287868584
Paved parking lots, roofs, driveways, etc.5 98 98 98 98
Streets and roads :Paved with curbs and storm sewers5
GravelDirt
987672
988582
988987
989189
Source: Chow et. al, 19881 For a more detailed description of agricultural land use curve numbers, refer to
Soil Conservation Service, 1972, Chap. 9.2 Good cover is protected from grazing and litter and brush cover soil.3 Curve numbers are computed assuming the runoff from the house and driveway
is directed towards the street with a minimum of roof water directed to lawns where additional infiltration could occur.
4 The remaining pervious areas (lawn) are considered to be good condition for these curve numbers.
5 In some warmer climates of the country a curve number of 95 may be used.
101
6.5.7 Unit Hydrograph Method
First proposed by Sherman in 1932, the unit hydrograph (UH) of a watershed is defined as a surface runoff hydrograph (SRH) resulting from a unit depth of excess rainfall (1 in or 1 cm) generated uniformly over the drainage area at a constant rate for the effective rainfallduration. The duration of the excess rainfall designate the duration of the UH, thus a 3h-UHis a SRH resulting from a one cm excess rainfall storm of 3h duration.
The UH is derived from the direct runoff hydrograph. In general, when analysing a recorded flood hydrograph, the baseflow contribution should be subtracted from the total flow before deriving the UH. Likewise, when using the UH method to compute a design flow, a baseflow should be added to obtain the total design discharge.
However, in arid areas with ephemeral flows, baseflow may be non-existent.
The following basic assumptions are used in developing the UH concept:
1. The excess rainfall has a constant intensity within the unit duration.
2. The excess rainfall is uniformly distributed throughout the whole drainage area.
3. The base time of the SRH (the duration of surface runoff) resulting from an excess rainfall of a given duration is constant.
4. The ordinates of the SRH of a common base time are directly proportional to the total amount of surface runoff represented by each hydrograph.
5. For a given watershed, the hydrograph of surface runoff resulting from a given excess rainfall reflects the unchanging characteristics of the watershed.
Assumption 4 implies that if the ordinates of the UH represent one inch of runoff, then a hydrograph representing two inches of runoff is obtained by simply multiplying each ordinate of the UH by 2.
Where data on rainfall and runoff are available, site-specific unit hydrographs should bederived. Various methods are available, ranging from sophisticated time-series analysismethods to simple methods such as trial and error. A convenient code for a relatively simple matrix inversion method is given by Bruen and Dooge (1984). Where data are not available, regional methods must be used.
If all unit hydrographs conform to a constant shape, that is, a constant amount of volumeunder the rising limb of the UH, then both the time and discharge ordinates can benormalized to produce a dimensionless UH.
SCS has examined many hydrographs nationwide and computed a standard dimensionlessUH which has 37.5 percent of the volume under the rising limb. This volume has been known to vary, according to SCS, in the range of 23 to 45 per cent. This method involves

102
determining the peak rate of runoff Qp expressed in m3 per cm of runoff from a givendrainage area. This factor is primarily a function of the time it takes for runoff to travelthrough the basin to the design point.
Once this rate of runoff is determined, it can be multiplied by the amount of excess rainfall to produce a discharge. The versatility of this method is that it can account for changes inwatershed travel time, and subsequently Qp, which are caused by alterations in the hydraulic capacity of the stream, such as channel maintenance operations, flood control structures, etc.The volume of runoff from a given amount of rainfall can also be adjusted to reflect changing land use within a watershed. This method is also suitable for ungaged watersheds. The advantage of this method is that it is straightforward to apply and the physical parameters are easily determined. This method should also be limited to watersheds with a drainage area of approximately 20 mi2 (about 50 sq. km.) or less. The reason for this limit is that UH theory assumes uniform runoff from the entire basin. This assumption is less reliable if the drainage area becomes too large, and is a particular problem for arid areas experiencing convective rainfall, which can be extremely localised.. If a large watershed is being analyzed, it should be divided into sub-basins and the flows from the individual sub-areas routed to the design location. The physical description of the watershed includes drainage area, soil types, land uses, and time of concentration.
In general, a dimensionless unit hydrograph is developed for use in catchment areas, where therequired data for unit hydrograph derivation are not available. The dimensionless data for the unit hydrograph is constructed from the available physiographical characteristics of the basin. Thesynthetic UH is widely used for most hydrologic analysis of wadi systems in the Arab World, but again it should be noted that there is an urgent need in the region to test such methods rigorouslyagainst local data.
6.5.8 Frequency Analysis
The objective of frequency analysis is to relate the magnitude of extreme hydrologic events to their frequency of occurrence using probability distributions that can be fitted to the historical hydrologic series. The series can be either an annual maximum series or annual exceedance series.
From a given series of records, the probability of occurrence or return period T years can be simply computed using different plotting position formulae which have a general form (Chow et al.,1988):
where:
M= event ranking, N= total number of events in the series, and b is a constant which equals zero for the Weibull plotting formula and 0.5 for Hazen’s formula.
For design purposes, the flood frequency method is used to derive design flows of events with various return periods and based on many probability distributions using actual data
)14.5.6(21 bN
bMT
−+−=
103
series. The frequency factor (KT) analysis is applicable to many probability distributions, it is a function of the return period and coefficient of skewness if applicable and the type ofprobability distribution used.
The general form of the frequency analysis is
XT = X + KT s (6.5.15)
where XT = the magnitude of the hydrologic event required of T-year return periodKT = the frequency factor for the T-year return periodX = mean of the hydrologic data seriess = standard deviation of the hydrologic data series
For log-transformed distributions such as the Log-Normal or Log-Pearson Type III it isnecessary to log-transform the data and calculate the means and standard deviation of the log-transformed series. The value of XT shall be transformed back to real data using the anti-logtransformation. Different probability distributions shall be tried to see which one does the best fitting of the data series
The goodness of fitting is proportional to the size of the data series; a number of 30 data points is viewed to be the minimum recommended size. Data need to be screened from low or high outliers which have to be removed first before performing the frequency analysis. A fuller account ofmethodologies can be found in Cunnane (1990).
6.6 RAINFALL-RUNOFF MODELS
With the vast development in computer applications, many hydrologic processes can besimulated using computers. Extensive and tedious calculations can be achieved easily usingavailable computer applications. This concept facilitates the development of spatiallydistributed hydrological models that can simulate the hydrologic cycle of a basin over fine spatial and temporal resolutions.
Many rainfall-runoff simulation (usually known as watershed runoff) models have beendeveloped in the past decades and are commercially available in the market. These may be lumped or distributed, and may represent individual flood events or simulate continuoussequences. A review of the issues related to model development and application is given by Wheater et al.(1993), and a recent text book is Beven (2000). A brief description of some commonly used models is given in Appendix A. It should be noted that these models cannot improve the quality of the original data (although modelling may allow us to refine the data set in some cases). In other words, the quality of the output results is governed by the quality of input data.
One of the most commonly-used flood event models which has been enhanced and used as a basis for other commercial models is the HEC-1 flood hydrograph model which is thebackbone of the watershed modeling system (WMS) program. WMS is developed by the Engineering Computer Lab of the Brigham Young University in cooperation with the U.S

104
Army Corps of Engineers Waterways Experiment Station. A brief description of the HEC-1model is described below.
6.6.1 HEC-1 Model:
The HEC-1 model is designed to simulate the surface runoff resulting from precipitation byrepresenting the basin as an interconnected system of components (HEC-1, 1990). Eachcomponent represents an aspect of the rainfall-runoff process within a subbasin. Thesecomponents include surface runoff, stream channel, and reservoirs. The characteristics ofeach component are described by a set of parameters that describe its physical process.
The result of the modeling process is the computation of direct runoff hydrograph for the subbasins and also stream flow hydrographs at desired locations in the watershed as well as the flood volumes (Chow, et al., 1988).
6.6.1.1 Components of HEC-1 Model
Land Surface Runoff Component
This component represents the movement of water over the land surface and into streamchannels. The input to this component is a rainfall hyetograph. Rainfall and infiltration areassumed to be uniformly distributed over the subbasin. Unit hydrograph options includingSnyder’s unit hydrograph and SCS dimensionless unit hydrograph. The excess rainfall isapplied to the unit hydrograph to derive the subbasin outlet hydrograph.
Stream Routing Component
This component represents the flood wave movement in a channel reach. The input is theupstream hydrograph. Then using channel characteristics, the upstream hydrograph is routed to a downstream point. Runoff routing can be done by one of the available techniquesincluding Muskingum method, level-pool routing and the kinematic wave method (seesection 6.7 below).
Combination of Sub-basin Runoff and Routed Stream Flow
This component represents the connectivity of land surface runoff to the routed stream flow. Flows are combined at confluence and then the combined flow is routed downstream.
Reservoir Component
This component represents the storage-outflow characteristics of a reservoir or any otherflood-retarding structure. The input is the upstream inflow, which is routed through areservoir using storage routing methods. The outflow doses not depend on the downstream controls, since it is a function of storage (water surface elevation) in the reservoir.
Diversion and Pump Components
This component represent channel diversions and pumping action to transfer water from or to the stream (Chow, et al., 1988).

105
A full description of selected and commonly used rainfall-runoff models is presented inAppendix 6.A.
6.6.2 Modelling issues for arid and semi-arid areas
The particular hydrological characteristics of arid and semi-arid areas are described inChapter 2. A major issue for rainfall-runoff modelling is the spatially-localised nature ofconvective rainfall, which is difficult to capture with conventional raingauge networks, and a second issue is the effect of transmission losses in river channels, which often results in the flood volume decreasing with distance downstream. Relatively little work has been done to address these issues in rainfall-runoff modelling. However, Wheater et al (1995) developed a distributed continuous simulation model for water resource assessment (applied to recharge dam design), which used a stochastic model to represent spatially-distributed rainfall inputs and a simple distributed rainfall-runoff model based on the SCS method plus a transmission loss component. A more physically-based model, KINEROS, has been developed by theUSDA (Woolhiser et al. 1990) for application to arid areas, and an application in Oman is reported by Wheater and Bell (1983). However, recent work with this model on the Walnut Gulch experimental basin in Arizona (Michaud and Sorooshian, 1994) has come to thedisturbing conclusion that convective thunderstorm rainfall needs to be represented on a 2km resolution grid for reasonable accuracy of peak flow estimation. The WMS model was successfully applied to mitigate floods and model flash floods in Petra, Jordan (Al-Weshahand Khoury, 1999).
6.7 HYDROLOGICAL ROUTING
Flow routing is defined as the determination of stream discharge at a point based onknowledge of the discharge at some upstream location (inflow) and the characteristics of the intervening wadi channel or reservoir. Two flood routing problems are considered toillustrate the effect of storage on outflow hydrograph and the use of a numerical method to solve hydrological problems. The first problem is the routing of a flood through a reservoir. This problem has important applications to flood management and the maintenance of water supplies for public and agricultural use. The second is an empirical approach to the routing of flood waves through a stream channel. River routing is important for flood prediction.
6.7.1 Level Pool (Reservoir) Routing
This is a procedure for calculation of the outflow hydrograph from a reservoir of a level water surface, given the inflow hydrograph and storage outflow characteristics. The principle oflevel pool routing is that the change in storage over time interval equals to the differencebetween the inflow and outflow. The governing equation for this type of analysis can befound in many textbooks (e.g., Chow et al. 1988, Bedient and Huber, 1992).
6.7.2 Channel Routing (The Muskingum Method)
The storage in the channel reach can be viewed as the sum of two components during a flood event, the wedge and prism storage. The total storage in the channel can be expressed as the sum of the two storages. The governing equation for this type of analysis can be found inmany textbooks (e.g., Chow et al. 1988, Bedient and Huber, 1992).

106
6.7.3 Hydraulic-based Methods
The equations of motion for gradually-varied unsteady open channel flow, developed by De Saint Venant in 1871, provide the basis for more complex, physically-based methods ofcomputing flood wave behaviour in channels (see, for example, Fread, 1993). However, bymaking appropriate simplifying assumptions, the complexity of the full equations can bedramatically reduced, with corresponding benefits in terms of computing resource and datarequirements. A commonly-used approximation is the kinematic wave assumption, which isappropriate for steep rivers, and does not represent backwater effects (see 6.1.1 above).
6.8 CONCLUDING REMARKS
This chapter presents a state-of-the art review of current practice in rainfall-runoff analysis and modeling for flood flows. This includes guidelines for commonly used methods todetermine the peakflow, flood hydrograph and volume of flood water. The shape of the flood hydrograph is necessary to design any control or regulating hydraulic structure that may be needed in the site. Similarly, the flood volume quantifies the amount of water that can be utilized for different purposes such as water harvesting and groundwater recharge.
In all hydrologic models, model calibration and verification forms an essential part of theprocess. Such work reinforces the necessity to keep adequate flood recording gauging station in wadi basins in operational condition. The modeling approach is a powerful tool to simulate the surface water process in the rainfall-runoff analysis. However, the model itself cannot improve the quality of the input data, special attention shall be paid to the improvement ofinput data by field observations and measurements. The single most important limitation tothe improvement of methods of flood estimation and management is the lack of reliable data records.
Given the general lack of high quality data, it is perhaps not surprising that commonlymethods developed for other areas are applied routinely in the region with very little testingof their suitability. Clearly, there are important features of the hydrology of the region which require special attention and the development of appropriate methods of analysis andsimulation. This is a major challenge for the region, and a key focus of UNESCO's wadihydrology programme.
6.9 SELECTED BIBLIOGRAPHY
Al-Weshah R. A., and F. Khoury, (1999). "Flood Analysis and Mitigation for Petra Area in Jordan," ASCE J. Water Resources Planning and Management, Volume 125, No. 2pp170-177.
Bedient, P. B., Huber, W.C. (1992). Hydrology and Floodplain Analysis, Addison Wesley,New York.
Beven, K.J. (2000). Rainfall-runoff modelling: the primer, Wiley, Chichester, UK

107
Blakemore, E.T., Hjalmarson, H.W. and Waltemeyer, S.D. (1995) "Methods for EstimatingMagnitude and Frequency of Floods in the Southwestern United States" USGS Water-Supply Paper 2433, U.S.Geological Survey, Denver, U.S.A.
Bruen, M. and Dooge, J.C.I. (1984) "An Efficient and Robust Method for Estimating Unit Hydrograph Ordinates," Journal of Hydrology, 70, 1-24
Chow, V. T. Maidment, D. R. and Mays, L. W. (1988). Applied Hydrology, McGraw-Hill,New York, U.S.A.
Cunnane, C. "Statistical distributions for flood frequency analysis" (1990). OperationalHydrology Report N. 32, WMO, Geneva, Switzerland.
Farquharson, F.A.K., Meigh, J.R. and Sutcliffe, J.V. (1992). "Regional Flood FrequencyAnalysis in Arid and Semi-Arid Areas," Journal of Hydrology, 138, 487-501
Fread, D.L. (1993). "Flow Routing," in Handbook of Hydrology, Ed. Maidment, D.R.,McGraw-Hill.
HEC-1 (1990). HEC-1 User Manual, US Army Corps of Engineers, California.
Hornberger, G., Raffensperger, J., Wiberg, P., and Eshleman, K. (1998). Elements of Physical Hydrology, John Hopkins, Baltimore, U.S.A.
Maidment, D.R. (editor), (1993). Handbook of Hydrology, McGraw Hill, New York.
Michaud, J.D and Sorooshian, S (1994). Effect of rainfall-sampling errors on simulations of desert flash floods. Water Resour.Res., 30, 10, pp. 2765-2775.
Onof, C., Faulkner, D. and Wheater, H.S. (1996). A Design rainfall modelling in theThames catchment@. Hydr. Sci. Jnl. 41 (5), 715-733.
Onof, C., Chandler, R.E., Kakou, A., Northrop, P., Wheater, H.S. and Isham, V. (2000). Rainfall modelling using Poisson-cluster processes: a review of developments.Stochastic Environmental Research and Risk Assessment 14, 384-411, Springer-Verlag.

108
Soil Conservation Service, (1972). National Engineering Handbook Section 4, Hydrology,U.S. Department Of Agriculture, Washington, D.C., U.S.A.
Wanielista, M., Kersten, R., and Eaglin, R. (1997). Hydrology: Water Quantity and Quality Control. Wiley, New York, Second Edition.
Wheater, H.S. & Bell, N.C. (1983). "Northern Oman flood study". Proc. Instn. Civ. Engrs., 75 (Part 2), 453-473.
Wheater, H.S. & Brown, R.P.C. (1989). "Limitations of design hydrographs in arid areas - an illustration from south-west Saudi Arabia. Proc. 2nd Natl. BHS Symp., 3.49-3.56.
Wheater, H.S., Jakeman, A.J. and Beven, K.J. (1993). "Progress and directions in rainfall-runoff modelling". In: Modelling Change in Environmental Systems, Ed. A.J.Jakeman, M.B. Beck and M.J. McAleer, Wiley, 101-132.
Wheater, H.S., Jolley, T.J. and Peach, D. (1995). AA Water Resources Simulation Model for Groundwater Recharge Studies: An Application to Wadi Ghulaji, Sultanate ofOman@. Proc. Intnl. Conf. on Water Resources Management in Arid Countries,Muscat, 502-510.
Woolhiser, D.A., Smith, R.E. and Goodrich, D.C. (1990) "KINEROS-A kinematic runoff and erosion model: Documentation and User Manual," Report ARS 77, Agric. Res. Serv., U.S. Dep. Of Agric., Washington, D.C., U.S.A.
WMS: Watershed Modelling System (1998). User Reference Manual, ECGL, BrighamYoung University, Provo, Utah, U.S.A.

109
APPENDIX 6.A
BRIEF DECRIPTION OF SELECTED AVAILABLE RAINFALL RUNOFF MODELS
PROGRAM NAME: WATERSHED MODELING SYSTEM (WMS)
WMS is a comprehensive environment for hydrologic analysis. It was developed by the Engineering Computer Graphics Laboratory of Brigham Young University in cooperationwith the U.S. Army Corps of Engineers Waterways Experiment Station. WMS can bsed to create terrain models from Triangulated Irregular Networks (TINs). The TIN can then be used to automatically delineate watersheds, streams and sub basins.
Once boundaries have been created geometric attributes such as area and slope can becomputed automatically. A topological tree representation of the watershed is created along with the TIN, and all data necessary to define an HEC-1 model can be entered by selecting basins and outlet points from the TIN or the topological tree. Many display options areprovided to aid in modeling and understanding the drainage characteristics of terrain surfaces.
WMS was designed as a comprehensive hydrologic modeling system. As part of an ongoing effort, other spatially distributed models will be supported in future versions.
PROGRAM NAME: SMADA (Stormwater Management and Design Aid)
VERSION/DATE: Ver. 6.4, 1998
OPERATING SYSTEM: Windows (DOS version also available)
DISTRIBUTOR: Dr. Ron Eaglin, University of Central Florida.
DOCUMENTATION:
The methods used in SMADA are outlined in Hydrology and Water Quality Control byMartin P. Wanielista printed by John Wiley and Sons, 1997. A detailed descriptions of these methods should also be available in most Hydrology textbooks.
PROGRAM OVERVIEW/OUTLINE
NOTE: The following information is a partial listing of the SMADA HELP files. Some ofthe text, figures and equations have been omitted. Please refer to the SMADA ON-LINEHELP for complete information.
SECTIONS AND CAPABILITIES:
i. Watersheds ii. Rainfall iii. Hydrographs iv. Ponds

110
v. Utility programs a. Matrix calculator b. Time of concentration calculator c. Pollutant analysis d. Statistical regression analysis e. Statistical distribution analysis
f. Storm sewer design
vi. Additional programs installed with smada (not part of smada menu)a. Loops (simplified hardy cross calculator)b. Circular pipe calculator
PROGRAM NAME: TR-20, Computer Program For Project Formulation Hydrology
The TR-20 computer program assists the engineer in hydrologic evaluation of flood events for use in analysis of water resource projects. The program is a physically based eventmodel, which computes direct runoff resulting from any synthetic or natural rainstorm. There is no provision for recovery of initial abstraction or infiltration during periods of no rainfallwithin an event.
The program develops flood hydrographs from runoff and routes the flow through streamchannels and reservoirs. Routed hydrographs are combined with those from tributaries.Procedures for hydrograph separation by branching or diversion of flow and for addingbaseflow are provided.
The program uses procedures described in the SCS National Engineering Handbook, Section 4, Hydrology (NEH-4) except for the reach flood routing procedure. The reach routing is described in Hydrology Note 2.
Peak discharges, their times of occurrence, water surface elevations and duration of flows can be computed at any desired cross section or structure. Complete discharge hydrographs, as well as discharge hydrograph elevations, can be obtained if requested. The program provides for the analysis of up to nine different rainstorm distributions over a watershed under various combinations of land treatment, floodwater retarding structures, diversions, and channelmodifications. Such analysis can be performed on as many as 200 sub-watersheds or reaches and 99 structures in any one continuous run.
The program was originally developed by the Hydrology Branch of the Soil ConservationService (SCS) in cooperation with the Hydrology Laboratory, Agricultural Research Service (ARS), through a contract with C-E-I-R, Inc. Numerous modifications and additions have been made sinceby the SCS. Software providers and developers include Haestad Methods, Dodson, Army Corps of Engineers, USGS, etc.
PROGRAM NAME: Technical Release 55 (TR-55): Urban Hydrology for SmallWatersheds
Technical Release 55 (TR-55) presents simplified procedures for estimating runoff and peak

111
discharges in small watersheds. In selecting the appropriate procedure, consider the scope and complexity of the problem, the available data, and the acceptable level of error. While this TR gives special emphasis to urban and urbanizing watersheds, the procedures apply to any small watershed in which certain limitations are met.
The conversion of rural land to urban land usually increases erosion and the discharge and volume of storm runoff in a watershed. It also causes other problems that affect soil and water. As part of programs established to alleviate these problems, engineers increasinglymust assess the probable effects of urban development, as well as design and implementmeasures that will minimize its adverse effects.
Table 6.A.1 List of Selected Commercial Software Using Rainfall-Runoff Analysis (Haestad Method Programs, 1999)
Program DescriptionBREACH Dam Breach Erosion ModelCAPS Sanitary Sewer Network AnalysisCulvertMaster Culvert Design and AnalysisDAMBRK Dam Breach Flood ForecastingDAMS2 Structure Site AnalysisDWOPER/Network Dynamic Wave ModelFlowMaster PE (Windows) Open Channel Flow and Pressure PipesHEC-1 Flood Hydrograph PackageHEC-2 Water Surface ProfilesHEC-3 Reservoir System AnalysisHEC-4 Monthly Streamflow SimulationHEC-6 Scour and DepositionHEC-PLOT Plotting for HEC ProgramsHEC-RAS Water Surface ProfilesHECWRC Flood Flow FrequencyHMR52 Probable Maximum StormHY-4 Hydraulics of Bridge WaterwaysHY-8 Culvert Design and AnalysisLISLE SCS WSP-2 Lisle RevisionPond Pack Site Drainage Hydrology Pond Design and Analysis Quick HEC-12 Drop Inlet DesignSEDIMOT-II Hydrology and SedimentologySTORM Storage, Treatment, Overflow, Runoff ModelStormCAD Storm Sewer Design & AnalysisSWMM Storm Water Management ModelTHYSYS Culverts and Storm SewerTR-20 Project Formulation HydrologyWSP-2 SCS Water Surface ProfilesWSPRO (HY-7) Bridge Waterways Analysis Model
113
CHAPTER SEVEN
INTEGRATED DEVELOPMENT OF WADI SYSTEMS
Majid BENBIBA
Head of Water Resources Division,General Directorate of Hydraulics, Rabat, Morocco
7.1 NOTIONS OF INTEGRATED DEVELOPMENT
In recent decades, the integrated development of water resources has become a major concern of the international authorities. Thus, many international meetings and conferences havebeen held in different regions of the World. Important meetings which defined theinternational strategy in terms of water resources development include:
(a) The United Nations conference on water held in MAR DEL PLATA, Argentina, in March 1977.
During this conference, it was agreed that accelerated development and the rationalmanagement of water resources are the key factors for improving the economic and socialsituation of mankind, mainly in developing countries. The relevant recommendations knownby “Action Plan of Mar Del Plata” which come out from this conference concern thefollowing aspects:
- water resources assessment;
- water use and efficiency;
- environment, health and fight against pollution;
- water resources policy, planning and management;
- natural disasters;
- communication, education, training and research;
- regional and international cooperation.
(b) The international conference on water and environment, concerned with the development of a 21st century perspective, held in January 1992 in Dublin-Ireland.
The Dublin declaration on water within the framework of a sustainable developmentperspective, issued from this conference and addressed to leaders worldwide, appeals to adopt the assessment, development and management of water resources in a radically newperspective which engages all political levels, from high state authorities to smallcommunities, and relies on important investments, awareness campaigns, institutional andlegislative changes and the reinforcement of relevant skills.

114
The recommendations which were formulated during this conference deal with all aspects ofthe sustainable development of water resources on the basis of four main principles:
- water, which is a fragile and non renewable resource, is essential for life,development and environment;
- management and development of water resources must involve users, planners and decision makers at all levels;
- financial resources have an essential role in the supply, management andprotection of water resources;
- water has an economic value and must be treated as an economic good.
(c) The United Nations conference on environment and development, held in June 1992 inRIO DE JANEIRO in Brazil under the title “Earth summit “, has dealt with all aspects related to the environment.
The Agenda 21 adopted by the conference attaches a priority to freshwater problems under the theme “protection of water resources and their quality”. The proposed actions regardingwater are based on the implementation of integrated approaches for developing, managingand using water resources.
The integrated development of water resources mentioned in the recommendations of these international conferences, can be defined as a set of coherent and coordinated actions and measures to be taken in order to ensure a rational use and monitoring of water resources.
An integrated water resources development policy has to take into account a number of inter-related physical, economical and social phenomena such as:
- quantitative and qualitative physical interactions among different kind of waterresources: conventional and non conventional water, surface and ground waterconjunctive management;
- complicated interactions between land and aquatic ecosystems;
- existing interactions between human activities and the environment;
- the relationship between the water sector and other sectors;
- the political, governmental and institutional context within which water resourcesdevelopment fits. This context includes several objectives, means, users anddecision makers.
7.2 CONSTRAINTS OF WATER RESOURCES DEVELOPMENT IN THE WADI HYDROLOGIC SYSTEM
7.2.1 Constraints related to water resources
7.2.1.1 Spatial and temporal disparities
Besides their scarcity, water resources in wadi hydrologic systems are characterized byimportant spatial and temporal disparities. About 67% of the area of Arab countries receives

115
precipitation of less than 100 mm/year, while only 18% receive more than 300 mm/year.These disparities lead to either drought periods which last for several years, or heavy rainfalls which cause floods with human and material damage. The development of water resources in this region may require the construction of costly hydraulic structures.
7.2.1.2 Vulnerability to pollution
Water quality degradation is becoming a serious problem in many countries, particularly inArab countries. The main sources of pollution are:
- domestic and industrial waste water, which are most often discharged without any pre-treatment;
- domestic and industrial solid waste discharged without any pre-treatment;
- eutrophication of reservoirs;
- sea water intrusion in the nearby aquifers;
- clogging and salinity of soil in large irrigated zones.
Water quality degradation has an impact on both human health and water resourcesdevelopment. The regeneration of contaminated water is difficult, costly and in some cases impossible to realize, particularly for groundwater.
7.2.1.3 Erosion and siltation of dam reservoirs
Soil erosion is one factor, among others, which hinders water resource development. Its direct impact results in the decrease of reservoir storage capacities and the efficiency of watertransfer canals . The main factors which govern this phenomena are climate, mainly rain and wind, topography, soil media, land use and human activities.
In Wadi hydrologic systems, characterized by an arid and semi-arid climate, the soil nature and the land use density considerably increase the erosion process and limit water resources development. The silting up of reservoirs in Morocco is estimated at 70 Million m3/year,about the loss of one medium-sized dam per year.
7.2.1.4 Shared water resources
Shared water resources represent an important portion of the water resources potential in arid countries. 52% of the water resources of the region are shared with neighboring non Arab countries ( 51.6% of surface water and 0.4% of groundwater).
These water resources are exposed, in the upstream zones of the watersheds, to a number of pressures, which depend on the hydraulic infrastructure of each country. The political,economical and social problems, which some countries suffer from, constitute a barrier forthe implementation of a bilateral or multilateral development, and consequently lead to anunfair sharing out of the available water resources of the region.

116
7.2.2 Constraints related to water use
During recent decades, the developing countries, including Arab countries, have seenimportant socioeconomic development with an increase in water demand. To satisfy thedifferent expressed needs, the majority of these countries have had recourse to the increased mobilization of their water resources. However, the efforts deployed for water demandmanagement are still limited in these countries.
The mobilization rate of water resources in Arab countries has already reached 69%. This rate exceeds 100% in some countries in the Gulf and in the Arab peninsula, and in order to meet the expected socioeconomic development, and to ensure food security, these countries have had recourse to non conventional waters despite the cost required for their treatment.
Population growth is expected to increase in Arab countries during the years to come. By2025, most Arab countries will go beyond the critical water scarcity threshold set to 500m3/inhabitant/year by the international community.
7.2.3 Over-exploitation of aquifers
Groundwater constitutes an important portion of the water resources of those countrieslocated in arid and semi-arid zones. For some, it is the only available resource. In the Arab world, this resource represents 21% of the renewable water. Compared to surface water, groundwater has many advantages due to its spatial distribution, its easy access and itsaffordable mobilization cost and good quality. Due to these advantages, groundwaterresources are exposed to risks that may degrade their quantity and quality in many countries.
The main reasons which lead to the overexploitation and degradation of groundwaterresources are:
- the lack of a rational management strategy of groundwater resources;
- the lack or misuse of legislative instruments governing the exploitation of thisresource;
- a multiplicity of users;
- inadequate assessment of this resource;
- pollution which results from human activities and sea water intrusion;
7.2.4 Bad management of water distribution network
In many countries of the region, water losses in the hydraulic structures and drinking water and irrigation distribution networks are important. The rate of losses exceeds 60%, in some cities and irrigated areas. The state of distribution networks, the lack of structured
117
maintenance and rehabilitation, and the irrigation techniques practiced are the major factorsthat lead to water losses. Such conditions have negative effects on water balance evaluationand new water resources mobilization investment schedule.
7.3 INTEGRATED DEVELOPMENT ACTIONS FOR WATER RESOURCES
An integrated development policy for water resources must take into account technical,organizational, legislative and institutional aspects with a focus on the reinforcement ofhuman resources and the development of scientific research.
7.3.1 Technical aspects
7.3.1.1 Water resources assessment
Assessment is the key factor of any integrated development strategy for water resources.Without a correct and detailed assessment, it is almost impossible to plan, design, realize and manage any water resources development project. The results of the assessment are the basis for any decision making process, since they can lead to large investments and seriousconsequences on the environment. However, in many countries, notably developingcountries, water resources data are not always available which has negative effects on thedevelopment process.
Water resources assessment consists of determining their quantity, quality and availability for sustainable development and rational management. The assessment must be conceivedaccording to the countries' needs.
In general, the assessment of water resources must take into account the following measures:
- the implementation of an organizational, institutional, legislative and financialframework in order to ensure the reliability, accuracy and continuation of theassessment;
- the monitoring of all parameters which affect water cycle and water balance at the national level;
- the implementation of the required equipment and human resources for collecting, storing and processing the data;
- the elaboration of water resources databases at the national, regional and locallevels.
- the elaboration of synthesis studies to update the assessment of water resourcespotential of the country;
- the establishment of research development programs in the water resourcesdomain;

118
- the use of new techniques for water resources assessment and hydrologicforecasting.
7.3.1.2 Water resources planning
Planning can be defined as a set of policies, programs and projects which contribute to the realization of national objectives. Planning allows optimal use of the available waterresources and to achieve the expected socioeconomic development. It must be considered as a permanent activity closely related to water resources management.
The major principles of water resources planning are:
- setting goals and objectives: Goals define the general policy, while objectives define the expected outcomes to achieve. The Goals and objectives must come within the framework of the national expectations in terms of water resourcesdevelopment.
- water resources planning horizons: the long term planning of water resources is generally 20 to 30 years. In developing countries, it is more cautious to shorten this period ( 5 to 10 years) due to the uncertainty of the economic, social and political evolution. This short term planning has to be accompanied with a longterm development perspective.
- flexible and dynamic conception: in some countries, particularly developingcountries, it is difficult to anticipate socioeconomic and political circumstances.To overcome problems related to water demand prediction and water balanceassessment, a water resources development plan has to present some flexibility in case it is required to introduce changes to the original assumptions.
- exhaustiveness, impartiality and realism: all current and future water demands, conventional and non conventional water resources, must be integrated in theplanning process. A development plan has to allow equitable use and preservation of the quality of the available water resources. Allocation priorities of waterresources to different users has to be done on an equitable basis. Any proposed project within the framework of the action plan has to consider the economic and financial needs of the country. Ambitious projects might be difficult to realize.
- Participation of all water users: the planning process must involve all parties dealing with water sector and all its outcomes have to be unanimously agreedupon in order to facilitate its implementation.
7.3.1.3 Water resources mobilization
Water resources mobilization is an important phase in the development process since it may require large investments. It must be carried out according to the master plan. Besides technical studies, the conceived projects have to take into account economic and environmental issues. The action plan has to consider the mobilization of all water resources in order to satisfy the expressed needs, forexample:-
- mobilization of spring water by the realization of the required structures to ensure

119
the protection of water quality and quantity aspects;
- mobilization of groundwater using wells, boreholes, traditional systems such askhettaras and fogaras, and subsurface dams;
- mobilization of surface water using dams, dykes and water transfer structures;
- mobilization of non conventional resources, e.g. waste water, brackish water and sea water.
7.3.1.4 Water resources management
Water resources management can be defined as a set of actions to be realized in the medium and long term. These actions have to consider all recommendations and measures resultingfrom the planning process. Water resources management is a daily task which has to becarried out with the participation of all parties related to the water sector. It must take into account quantitative and qualitative aspects:
- equitable distribution of water according to the allocation plan;
- rational and efficient use of water;
- protection of water quality and aquatic ecosystems;
- management of exceptional phenomena: drought, floods etc…
A rational management system of water resources has to be based on the followinginstruments:
- technical instruments to allow a thorough knowledge of water resourcesavailability and demand;
- legislative instruments to allow the control of water use;
- economic instruments for the optimal use of water ( taxes, fees, subsidiaries,grants)
- information instruments for public awareness ( water economy, water qualityprotection, etc …)
7.3.1.5 Water demand management:
In many countries, particularly in the Arab region, the satisfaction of the expressed needs is achieved by mobilizing more water resources. The recourse to water demand management is limited. However, effective management of water demand can have positive impacts on both the schedule of investment repayments for mobilizing new water resources and theirexploitation.
Water demand management can take many forms, from direct regulation measures regardingwater use to indirect measures regarding the voluntary behavior of users. Among thesemeasures we find:
- improvement of drinking water and irrigation networks’ efficiency;

120
- choice of crops with low water consumption and high yield;
- choice of high efficiency irrigation techniques (e.g. drip irrigation systems);
- public awareness regarding water use;
- use of water recycling techniques in industrial sector;
- treatment and reuse of waste water;
- use of water tariffs that take into account social issues and optimize water use.
7.3.1.6 Protection against natural disasters
The hydrologic regime of rivers is characterized by important irregularities, which generateeither important floods or severe drought periods. These natural phenomena can causewidespread human and material damage.
The integrated water resources development process must take into account these naturalphenomena by implementing the required means to alleviate their consequences. Among the measures and actions to be taken we find:
• for the protection against floods:
- inventory of high risk flood sites;
- study of hydrologic regime and elaboration of hydrologic forecasting models;
- implementation of flood warning systems;
- construction of flood protection structures (dams, dykes, etc …) in upstreamlocations of watersheds and at vulnerable sites;
- organization of land use and human activities in vulnerable zones.
- implementation of an emergency plan in case of inundations;
• for alleviating drought effects:
- to monitor the hydrologic regime of different basins of the country and to assess the water balance;
- to consider drought phenomenon in the planning process and management ofwater resources,
- to realize inter-annual regulating structures and water transfer canals;
- to implement an emergency plan in order to face drought periods.
7.3.2 Legislative and technical aspects
In a hydrologic regime characterized by water scarcity and irregularities, like that of theWadi, legislative and institutional instruments are mandatory in order to ensure an adequate use and allocation of water resources, to define and maintain users’ rights and to avoid over-
121
pumping and water quality degradation. The rigorous implementation of an action plandepends on the nature of legislative and institutional instruments.
In all Arab countries, we find traditional laws and rules, which may have existed for manydecades or even centuries, that govern the relationship between users and water. Some ofthese laws, which were useful in the past, have to be updated in order to take into account the evolution regarding water withdrawals and use.
A legislative and institutional system has to allow:
- a clear definition of legislative, financial and professional responsibilities ofdifferent water sector users ;
- the creation of a committee to be in charge of applying government water policy;
- the allocation of water to regions, water sectors and different users with thepossibility of bringing some allocation adjustments during drought periods
- the establishment of a progressive tariff system on water consumption;
- settlement of differences between private individuals or private individuals and the state;
- the punishment of those who illicitly use water.
7.3.3 Reinforcement of human resources and development of scientific research
The implementation of the water resources development process requires qualified andskilled personnel. Also, scientific research allows the hydrologic systems to be understoodand efficient means for solving problems encountered to be identified.
Within the framework of national development plans, countries have to prioritize this actionand to consider the following recommendations:
- to implement training programs for technicians;
- to ensure continuing education for the personnel;
- to implement means of improved motivation for the personnel;
- to ensure strong coordination and cooperation between state departments andresearch and training centers;
- to implement scientific research programs for solving the specific problems of the country.
123
CHAPTER EIGHT
HYDROLOGIE DES OUEDS
DEVELOPPEMNT INTEGRE DE L’HYDROLOGIE DES OUEDS
(IN FRENCH)
Mohamed Ridha KALLEL
Tunisia
8.1 INTRODUCTION : LES CARACTERISTIQUES GENERALES DESSYSTEMES DES OUEDS
Le terme « Oued ou Wadi » est essentiellement utilisé, dans les zones arides et semi-arides,pour désigner un cours d’eau intermittent où peuvent se produire des crues. Près de 95% des pays arabes sont situés à l’intérieur de telles zones (14,2 millions de km²) ; une grande partie des oueds constituant le réseau hydrographique de ces pays, sont le plus souvent à sec entre deux crues successives. Quelques cours d’eau présentent des écoulements permanents ou saisonniers avec des débits de base généralement très faibles en comparaison avec lesdébits de pointe des crues. La structure des réseaux d’écoulement est dégradée. Elle comporte de nombreux bassins fermés ou reliés seulement dans des cas exceptionnels. Dans certaines régions désertiques, la notion classique même de bassin versant perd parfois toutesignification.
Dans certains bassins de montagne les oueds présentent souvent de très fortes pentes et dans les parties hautes des bassins ils tracent leurs lits profondément dans les formations rocheuses consolidées, donnant ainsi lieu à des vallées bien encaissées. Ces vallées étroites seremplissent d’alluvions qui forment des aquifères de largeurs et de profondeurs limitées mais qui peuvent s’étendre sur plusieurs kilomètres. Ces aquifères sont alimentés par les crues et constituent ainsi une source d’eau facilement exploitable. Dans certaines localités présentant des transmissivités relativement basses, les nappes se déversent dans le lit de l’oued donnant naissance aux écoulements de base. L’oued peut être aussi connecté hydrogéologiquement à d’autres unités rocheuses de son voisinage immédiat, dans quel cas des sources et des zones de suintement apparaissent dans le lit de l’oued. Dans les autres cas les eaux peuvents’infiltrer et percoler à travers les diverses formations souterraines.
* Les systèmes des oueds : D’une façon générale, les systèmes des oueds dans les pays arabes peuvent être répartis en deux catégories :
- les oueds côtiers
- les oueds intérieurs des plateaux et des régions désertiques

124
Les Oueds côtiers : Certains oueds prennent leur source dans les chaînes montagneuses quilongent le littoral de l’Océan Atlantique, de la mer Méditerranée, de la mer Rouge et du golfe d’Oman. Ils occupent environ 12 000 km du littoral. La longueur moyenne de leurs cours n’excède pas 100 km depuis la source jusqu’à la mer. Les lits de ces oueds présentent une pente moyenne variant entre 1 et 5%. Ils traversent des cônes d’alluvions composésd’alluvions grossières (rochers, graviers, et sables) plus ou moins consolidées et finissentdans des formations fines (sable fin et limon) vers les régions côtières. Les superficies des bassins versants individuels des différents oueds varient de 50 à 1000 km². Dans certaines régions les superficies atteignent plusieurs dizaines de milliers de km².
Les crues des oueds côtiers sont rapides et soudaines avec des débits de pointe de 200 à 3000 m3/s et une durée moyenne de 6 à 12 heures selon les épisodes pluvieux. Les crues peuvent se produire en hiver, au printemps et en automne selon la localisation géographique.Certaines crues surviennent aussi en été à la suite d’orages violents fréquents dans certaines régions. Les oueds côtiers présentent les meilleures potentialités en eau par rapport aux autres catégories d’oueds et on estime ces potentialités entre 15 et 25 millions de m 3.
Les Oueds des plateaux et des zones désertiques: Ce sont les oueds qui prennent leurs sources sur l’autre versant des chaînes des montagnes de l’Atlas, de la Mer Méditerranée, de la Mer rouge et du Golfe de Oman. Ils se dirigent vers les plateaux intérieurs et les plaines alluvionnaires et aboutissent aux bordures des déserts. D’autres Oueds descendent desmassifs montagneux intérieurs isolés. Certains oueds rejoignent les grands fleuves tels que le Nil et l’Euphrate tandis que d’autres se déversent dans des lagunes intérieures fermées telles que les Chotts, les Sebkhas et les Gaaraets.
La longueur des cours de ces oueds est d'environ 200 à 500 km avec des pentes des lits variant de 4% dans les parties hautes du bassin à 0,5 - 1% dans les plaines. La superficie globale des bassins versants de cette catégorie d'oueds est grossièrement estimée à 5 millions de km². Le modèle des crues est similaire à celui des oueds côtiers mais les potentialités en eau sont plus faibles et généralement concentrées dans les parties amont.
L’oued est une caractéristique des zones sèches c’est à dire les zones qui présentent unclimat semi à hyper aride. Ainsi, sur le plan de l'importance, les systèmes des oueds doivent être considérés pour les régions arides comme l’équivalent des systèmes des rivières dans les zones humides. Toutefois des différences significatives existent entre les caractéristiqueshydrologiques et hydrogéologiques des oueds et celles des rivières. Les aspectshydrologiques spécifiques aux zones sèches sont:
- de grands déficits pluvieux
- une très forte variabilité des précipitations dans le temps et dans l’espace
- une évaporation très prédominante dans le cycle hydrologique
- seulement une faible partie des précipitations qui intéressent les régions arides se transforme en ruissellement
125
- la rareté des écoulements permanents, le ruissellement est intermittent et tend àdisparaître avant d’atteindre la mer
- une grande amplitude des variations entre les basses eaux et les pointes de crues
- la faiblesse et l’extrême irrégularité des apports
- l’affaiblissement des lames écoulées et des coefficients de ruissellement enfonction de l’étendue des bassins versants
- l’occurrence soudaine et l’extrême violence des crues dites d’intensité de certains oueds : les crues des oueds sont en effet brusques et dévastatrices, les niveaux d’eau augmentent rapidement suite aux précipitations qui surviennent sur lesdifférents bassins versants et atteignent des valeurs parfois très élevées etentraînent des débits de pointe catastrophiques.
- les flux eaux de surface-eaux souterraines sont relativement faibles.
- l’importance des transports solides
Les oueds constituent un secteur important des ressources en eau dans les pays arabes. Le bassin versant global couvre environ six millions de km². Certains bassins versants trèslocalisés ont été examinés pour évaluer leurs potentialités en eau. Les ressources potentielles de l’ensemble des oueds sont d'environ 25 000 à 40 000 millions de m3. Ces ressources sont très partiellement exploitées par différents ouvrages implantés en travers des lits des oueds : petits réservoirs de stockage, ouvrages d’épandage des crues, ouvrages de rétention des eaux pluviales et systèmes de recharge des nappes.
Le développement optimal et la gestion rationnelle des ressources des systèmes des oueds pourraient être réalisés et atteints à travers la formulation de planification intégrée desressources en eau. Ces plans doivent être basés sur une évaluation précise des ressources naturelles, sur des enquêtes techniques et économiques et l’adoption d’une approche réaliste pour leur mise en œuvre. Cependant la plupart des oueds ne sont pas bien couverts par des études de reconnaissance. Les réseaux de mesures hydrologiques sont souvent limités etaccessoirement implantés.
* Les réseaux de mesures hydrologiques: Non seulement ils sont souvent inadéquats, les réseaux hydrologiques sont en plus assez récents et sont, pour diverses raisons, limités àquelques bassins importants. En effet, la collecte de données sûres pendant de longues durées rencontre dans les régions arides des difficultés résultant de la faible densité habituelle de la population souvent irrégulièrement distribuée. L’organisation des observations doit être enplus fondée sur un réseau de stations suffisamment dense dépendant d’un centre quicoordonne le travail des observateurs, synthétise les données et effectue des travaux derecherches.
Bien qu’il existe souvent de tels centres dans plusieurs pays arabes, les mauvaises conditions climatologiques et d’autres difficultés d’ordre matériel rendent difficile l’établissement d’unréseau efficace même dans les régions assez peuplées. Sur ce point, il y a naturellement de grandes différences entre les divers pays arabes. Toutefois il est reconnu que l’observationmétéorologique et hydrologique reste toujours plus ardue dans les régions aride que nulle part

126
ailleurs. En effet, en plus des problèmes rencontrés dans le choix des sites appropriés et assez représentatifs des régions à contrôler, des problèmes résultant essentiellement des mauvaises conditions d’accès aux différentes régions d’un pays et des difficultés de trouver desobservateurs disponibles avec une formation suffisante pour effectuer sérieusement lesobservations, on doit également signaler certains problèmes posés par la mauvaise adaptation de certains équipements de mesures aux conditions des climats arides.
Les difficultés dues aux choix des sites se répercutent parfois sur la densité des stations de mesures qui demeure toujours assez faible dans plusieurs régions et nettement en deçà des normes souhaitées. Il est vrai que la situation s’améliore d’une année à l’autre suite audéveloppement des régions désertiques, cependant les problèmes de l’observation ne seront résolus d’une manière satisfaisante qu’avec la décision d’établir un réseau d’observationshomogène et adéquat convenablement réparti. Par ailleurs le développement de la télémesure hydrologique pourrait apporter des solutions appropriées aux différentes difficultésmentionnées ci-dessus. Certains pays développent ce type d’observations avec succès sur des bassins assez isolés et d’accès difficiles et obtiennent de bons résultats avec une précisionsuffisante permettant de mieux apprécier les phénomènes hydrologiques sur ces bassins. Ilpeut être recommandé de généraliser ce type de nouvelles technologies sur les bassins pilotes choisis dans le cadre du projet de « Wadi Hydrology ».
TECHNIQUES SPECIALES AUX ZONES DESERTIQUES: DIFFICULTES DU PROBLEME
Le comportement tout à fait particulier de l’écoulement dans les régions désertiques ou subdésertiques, ainsi que les difficultés matérielles propres à ces pays, exigent une adaptation spéciale des méthodes utilisées dans les zones relativement plus favorisées. Les principales caractéristiques relatives aux études hydrologiques sont :
- La rareté des pluies et les écoulements fugitifs surtout sur les petits oueds ;
- La violence des crues ;
- Les difficultés d’accès et de déplacement ;
- La faible densité de la population.
La première de ces caractéristiques rend difficile l’établissement de stations permanentes telles qu’on les envisage dans les régions tempérées. L’immobilisation d’agents chargés de relever les échelles ou de changer les feuilles de limnigraphes est économiquement impossible. Généralement il n’est guère possible d’exploiter chaque année un réseau suffisamment dense de stations : des observateurs valables sont difficiles à recruter dans des pays peu peuplés où, de plus, la grande majorité de la population est illettrée ; il est encore plus difficile d’obtenir d’un autochtone sachant lire et écrire de résider durant de longues périodes trois mois à proximité de la station dans des conditions très difficiles.
La violence et la rapidité des crues rendent peu aisé l’étalonnage des stations. Seules des installations importantes pourraient venir à bout des forts débits, mais elles seraient inutilisées la plupart du temps et leur prix de revient serait, de ce fait, prohibitif. On ne peut guère non plus, utiliser un matériel bien adapté au cours d’eau, c’est à dire finalement assez lourd, et transportable, car l’hydrologue, qui aurait la chance au cours de ses tournées de tomber sur une crue importante, n’aurait pas souvent la possibilité d’installer son appareillage durant la crue. D’autre part, les difficultés de déplacement incitent à réduire le matériel au strict
127
minimum.
En effet, les déplacements en saison des pluies dans les régions désertiques ne sont pas aisés. A part quelques endroits privilégiés où des pistes bien aménagées sont utilisables à tout moment, sauf au passage des oueds lors des crues, la circulation dans les plaines n’est possible après une pluie qu’après un délai pouvant atteindre plusieurs jours. Dans les régions montagneuses, à part quelques rares pistes quand elles existent, les seuls passages possibles sont précisément les lits des oueds, donc impraticables dès qu’il y a de l’écoulement. En outre, les accès à la région du travail sont généralement eux-mêmes malaisés ; il y a de longues distances à parcourir dans de mauvaises conditions, le matériel roulant souffre beaucoup et finalement cela coûte très cher.
Marcel Roche « Hydrologie de Surface »
8.2 DEVELOPPEMENT DE L’HYDROLOGIE DES OUEDS
Les pays arabes sont de plus en plus conscients de l’importance des ressources en eau commeélément fondamental et primordial pour toute activité humaine. L’eau joue en effet un rôlecompréhensible et critique dans l’économie nationale. Durant les trois dernières décennies, il est paru d’une manière claire que les ressources disponibles ne répondent plus aux besoins de plus en plus accrus de la demande des différents secteurs. C'est pourquoi de grandsinvestissements ont été prévus et planifiés pour développer à la fois l’approvisionnement eneau de surface et en eau souterraine.
Vu la place qu’occupe le système des oueds dans la structure hydrographique générale des pays arabes et les ressources potentielles de ce système, une attention particulière est à porter à la connaissance des particularités hydrologiques de ces oueds, particularités étroitementliées à leurs conditions géomorphologiques telles que rappelées ci-dessus, et aux conditions climatologiques. L’hydrologie des zones arides et semi-arides est particulièrement complexe et nécessite des conditions d’observations, d’analyse et d’étude généralement différentes de ce que propose les manuels hydrologiques classiques. Certains pays arabes ont depuisplusieurs décennies adopté leurs propres méthodes d’approche et des programmesd’observation, d’analyse et de recherche qui leur ont permis d’appréhender d’une manière plus ou moins satisfaisante les aspects particuliers de l’hydrologie de leurs oueds. Lesrésultats de telles démarches ont aussi facilité le développement de la gestion des ressources, le contrôle et la sauvegarde des systèmes hydriques de ces pays. D’autres pays par contre se sont limités à des expérimentations très limitées dans l’espace et dans le temps et leurintervention sur le réseau des oueds se fait par à coup et selon les besoins immédiatsd’investigation programmée sur certains oueds. Les études pour l’appréhension descaractéristiques hydrologiques sont alors, généralement confiées à des institutions privées quiutilisent souvent des approches non adaptées aux régimes arides et semi-arides du faitqu’elles sont propres à d’autres régimes. Alors la question qui se pose à tous est la suivante: Quelles moyens faut-il mettre en œuvre pour assurer le développement de l’hydrologie des systèmes des oueds?
Pour assurer le meilleur développement de l’hydrologie des oueds dans les pays arabesdiverses actions doivent être programmées et entreprises pour répondre aux objectifssuivants :

128
- le développement des services hydrologiques et la précision de leur rôle
- l’instauration de systèmes adéquats et efficaces pour l’inventaire hydrologique
- la mise au point de structures techniques à l’échelle centrale et régionale pour les travaux de collecte de données et d’analyse
- le développement de l’outil informatique pour l’analyse de l’informationhydrologique et le développement des banques de données spécialisées etfacilement accessibles
- l’utilisation de l’information hydrologique recueillie pour l’amélioration de laconnaissance des principaux paramètres climatologiques et hydrologiques desdifférents systèmes (précipitations, ruissellement, évaporation, sédimentation ettransport solide)
- l’établissement de bilans hydrologiques réguliers et révisés périodiquement
- le développement des prévisions hydrologiques
- l’établissement de plans et projets de mobilisation des ressources
- la formation des agents techniciens et ingénieurs
8.2.1 DÉVELOPPEMENT DES SERVICES HYDROLOGIQUES
Aucune activité visant le développement de l’hydrologie des oueds ne peut être envisagée sans l’existence d’une institution spéciale chargée des activités hydrologiques. La situation dans les pays arabes en matière de service hydrologique est très variée. L’organisation des services hydrologiques et météorologiques varie d’un pays à l’autre. A l’heure actuelle on peut distinguer globalement trois types d’organisation:
a) une organisation telle que le services hydrologique et météorologique constituent unorganisme national homogène ;
b) une organisation telle que les services hydrologique et météorologique sont desorganismes nationaux distincts, dont les activités sont plus ou moins coordonnées ;
c) une organisation telle que le service météorologique est un organisme national et distinct tandis que les services hydrologiques sont assurés par divers autres organismes ;
Dans la plupart des pays, les données météorologiques, notamment celles concernant lesprécipitations et l’évaporation, sont archivées par le service météorologique national, tandis quedonnées hydrologiques relèvent du service hydrologique ou parfois d’autres administrations. Uneenquête menée par l’OMM à la fin des années 70 a fait ressortir une évolution dans le nombre de pays dans le monde qui détenaient un fichier central de toutes les données hydrologiques. Lepourcentage des pays est passé de 20% en 1957 à 48% en 1975. Depuis, ce pourcentage n’acertainement pas cessé d’augmenter avec le développement des programmes hydrologiques à l’échelle internationale tels que le PHI et le PHO. La situation s’est nettement améliorée dans plusieurs pays arabes au cours des deux dernières décennies et bon nombre de pays disposent actuellement de service hydrologique plus ou moins développé. Le programme de l’hydrologie des oueds est une opportunité pour les pays non nantis de tels services de commencer à réfléchir sur ce problème et aux autres pays de développer leurs services hydrologiques pour qu’ils s’acquittent convenablement des tâches qui leur incombent et pour qu’ils assurent pleinement leur rôle à savoir:

129
- la mesure des éléments hydrologiques de base par des réseaux de stationsclimatologiques et hydrologiques :rassemblement, transmission, traitement, archivage, restitution et publication des données hydrologiques de base;
- la prévision hydrologique ;
- la mise au point et le perfectionnement des méthodes, des procédures et des techniques pertinentes concernant
• la programmation et la planification des réseaux
• les spécification et l’adaptation des équipements
• la normalisation des méthodes d’observation
• la transmission et le traitement des données
• la préparation et la publication des données aux fins de planification
• la prévision hydrologique
8.2.2 L’INVENTAIRE HYDROLOGIQUE
8.2.2.1 EVALUATION DES CARACTÉRISTIQUES PHYSIOGRAPHIQUES
Quoique l’écoulement d’un bassin quelconque soit essentiellement déterminé par le climat, iln’en demeure pas moins que les caractéristiques physiques des oueds et celles des bassins jouent un rôle déterminant dans les caractéristiques hydrologiques. Aussi, la qualité desrecherches et des estimations hydrologiques est grandement influencée par l’informationdisponible sur les caractéristiques morphologiques et physio-géographiques des oueds et de leurs bassins et qui sont communément appelées caractéristiques physiographiques. Celles-cidoivent donc être décrites de façon quantitative.
Les caractéristiques physiographiques utilisées de façon courante dans les analyses hydrologiques sont :
- la superficie et la forme du bassin versant,
- la densité de drainage (densité du réseau hydrographique),
- la longueur et le profil de l’oued,
- les altitudes maximale, moyenne et minimale
- la pente du bassin et du lit de l’oued
Les autres facteurs principaux qui peuvent avoir une signification particulière dans un bassin donné sont:
- la géologie et la pédologie,
- le couvert végétal,
- l’utilisation du sol

130
Il est de règle de déterminer les caractéristiques physiographiques à partir des cartestopographiques à grande échelle (1/10 000 ou 1/50 000) et à partir de cartes thématiques à échelles variées au moyen de techniques cartographiques spéciales et d’analysesgéographiques
Ainsi donc, et dans l’objectif du développement de l’hydrologie de ses oueds, chaque pays est appelé tout d’abord à procéder à un inventaire exhaustif de ses différents oueds etd’établir des fichiers complets de leurs principales caractéristiques topographiques. Les autres facteurs peuvent être précisés à l’occasion d’études spécifiques à chaque oued. Cette activité de base conditionne toutes les autres activités hydrologiques.
8.2.2.2CHOIX DES SITES ET ÉQUIPEMENTS DE BASE DES STATIONSHYDROMÉTRIQUES-CAMPAGNES DE MESURES
Vu les difficultés d’accès aux différentes parties du réseau hydrographique dans les régions arides et semi-arides et a fortiori dans les régions désertiques, il n’est pas souvent aisé de doter chaque pays d’un système d’observation complet couvrant l’ensemble des régions, aussi faut-il procéder au préalable, à une étude de base pour le choix des oueds représentatifs de chaque étage climatique et pour dégager les conditions optimales pour l’emplacement des stations hydrométriques. Les normes de densité minimale de réseaux pour les pays à régime aride et publiés dans les manuels de l’O.M.M et l’UNESCO peuvent servir de référence pour l’établissement des réseaux hydrométriques dans les pays arabes. Toutefois il ne faut pas perdre de vue le caractère purement indicatif de ces normes et que chaque région a ses propres exigences en matière de suivi hydrologique, d’où l’importance de l’étude de base pour le choix du réseau.
Dans un premier temps de l’aménagement d’un réseau hydrologique, une première étape doit consister à établir un réseau de base, comportant le nombre minimal de stations quel’expérience collective des services hydrologiques de plusieurs pays aura jugé nécessairepour la mise en œuvre de la planification de la mise en valeur économique des ressources en eau d’un pays ou d’une région. Le réseau de base doit être aménagé aussi rapidement que possible en incorporant les stations existantes. Ce réseau minimal fournira le cadre de base pour un développement futur répondant à des objectifs spécifiques.
Par ailleurs il faut établir un ordre de priorité dans l’équipement des oueds par des systèmes d’observation et de mesure; ainsi les bassins de grandes taille et qui présentent despotentialités importantes peuvent être équipés en premier lieu, suivis des oueds à bassinsversants moyens et en dernier lieu les bassins à faible superficie.
En plus des réseaux de base constitués de grandes stations complètes, des stations secondaires peuvent être temporairement envisagées pour suivre au cours de périodes limitées lesphénomènes hydrologiques de certains bassins susceptibles de faire l’objet de projetsd’aménagements dans des délais courts. Il est bien entendu que la fréquence de mesures et d’observations sur ces réseaux temporaires doit répondre aux besoins urgents en informationset dépasser ainsi la fréquence habituelle des mesures sur le réseau de base.

131
De même, et afin de suivre quelques écoulements de base qui peuvent exister dans certains oueds, quelques points de mesures peuvent être choisis tout au long de l’Oued pour yeffectuer régulièrement (deux fois par mois par exemple) des jaugeages pour l’évaluation des débits de base et des prélèvements d’échantillons d’eau pour les analyses chimiques.
Dans certaines régions qui présentent des conditions climatiques et morphologiques trèsdifficiles, on peut recourir à des moyens simples pour effectuer des observations, ainsi, les petits ouvrages de rétention des eaux d’écoulement qui sont parfois aménagés par certainsutilisateurs peuvent être équipés d’échelles de lecture de niveau ou d’un simple limnigraphe pour le suivi des apports d’eau même d’une façon globale. Des travaux de levéstopographiques permettent de mieux préciser ces apports. Des pluviomètres totalisateurspeuvent être installés aussi dans les zones d’accès difficile pour disposer des totauxpluviométriques enregistrés sur ces régions. De telles informations même rudimentairespermettent de se faire une idée sur le ruissellement du bassin observé. Dans certains cas on peut envisager des campagnes de mesures de grande envergure telles que celles menées dans certaines régions du Maghreb (voir encadré).
En ce qui concerne les équipements des stations complètes, ils doivent répondre aux besoins suivants:
- suivi de la pluviométrie et accessoirement de l’évaporation
- suivi des hauteurs d’eau dans le lit de l’oued
- exploration du champ des vitesses de l’eau à travers la section de l’oued
- mesure des transports solides
- suivi de la qualité chimique des eaux
- suivi des niveaux maxima des oueds pendant les crues
Au cours d’assez nombreuses campagnes dans des régions désertiques d’Afrique, les hydrologues de l’Orstom ont peu à peu mis au point des méthodes de travail et d’organisation permettant d’obtenir avec le minimum de frais le maximum de renseignements hydrologiques sur une région désertique ou subdésertique données. Ces méthodes ont été parfois utilisées également dans les régions plus arrosées.
A la date fixée pour le début de la campagne, on commence à installer un réseau de pluviomètres totalisateurs répartis sur l’ensemble de la région à étudier, de 5 000 à 20 000 km² environ, parfois plus. On procède ensuite à l’installation d’un bassin-échantillon choisi avec soin lors d’une prospection préliminaire et que l’on suppose représentatif des conditions moyennes d’écoulement pour la partie de la région sur laquelle est plus spécialement centrée l’intérêt de la campagne. Il peut se faire également que le choix de ce bassin soit guidé par telle considération d’un plan d’aménagement (alimentation en eau, aménagement hydro-agricole, etc.). Une équipe dite fixe est attachée au bassin : elle n’en bougera pas de toute la durée de la campagne. Le bassin échantillon est équipé comme tous les autres secteurs d’étude du même type et les résultats obtenus sont traités par la méthode de l’hydrogramme unitaire. Une station météorologique lui est généralement adjointe avec, éventuellement, un bac évaporatoire ; parfois le bac est installé ailleurs, dans un centre ou village permanent, afin que les observations puissent être poursuivies toutes l’années.

132
Tandis que l’équipe fixe prend ses quartiers, une autre équipe dite volante ou mobile commence ses propres installations, s’il y a lieu. En certains points, des limnigraphes à longue durée de rotation sont quelques fois installés. Ailleurs, ce sont des échelles à maximum; il s’agit de dispositifs plus ou moins ingénieux conservant la trace des plus hautes eaux atteintes durant la campagne. On peut aussi utiliser les délaissés, souvent très nets en zone désertique. Ces opérations menées simultanément avec l’installation du réseau de totalisateurs sont l’occasion, pour l’équipe volante, d ‘une première prise de contact avec le terrain, ou, s’il s’agit d’une seconde campagne, d’une remise dans le bain. C’est pendant cette tournée que le personnel local engagé est éprouvé, que les détails matériels du déplacement sont définitivement réglés. Une des principales préoccupations durant la mise en place des appareils, est d’assurer leur protection contre les nomades ce qui donne lieu, en particulier pour les pluviomètres totalisateurs à de véritables opérations de camouflage.
Dés la première pluie, l’activité réelle de l’équipe commence, les déplacements sont pratiquement ininterrompus, toutes les pluies reçues sont enregistrées, les changementS de temps observés, différentes mesures climatiques faites à toutes heures du jour, les débits rencontrés dans les différents oueds jaugés dans toute la mesure du possible ; éventuellement, un nivellement barométrique est continuellement effectué, avec pour base un second altimètre déposé au camp fixe et suivi par l’équipe non itinérante. L’hydrologue ne doit pas non plus négliger toutes les observations susceptibles d fournir quelques renseignements sur la percolation et les écoulement souterrains ; il relève en particulier les hauteurs d’eau dans les puits s’il s’en trouve sur son passage. Chaque fois qu’il passe à proximité d’un pluviomètre totalisateur, il en relève le contenu. Une fois les pluies terminées, l’équipe volante, parfois aidée par l’équipe fixe qui commence à se replier, fait une dernière tournée générale au cours de laquelle tous les pluviomètres totalisateurs sont relevés et récupérés. Aux points intéressants du réseau, on fait les derniers relevés de délaissées de crues, des profils en travers et des profils en long. Ces résultats fourniront, en s’appuyant sur les quelques jaugeages effectués, les débits maximaux des crues.
Il se peut qu’au cours de ses tournées, le chef de l’équipe volante juge intéressant de s’arrêter en un point particulier du réseau pour effectuer des observations d’une certains durée et notamment enregistrer quelques crues dans leur totalité. Ces opérations peuvent parfois compléter les résultats acquis sur le bassin-échantillon et donner des valeurs complémentaires sur les coefficients d’écoulements.
Lors du dépouillement des observations faites pendant la campagne et de leur interprétation il est fait largement appel aux données pluviométriques recueillies aux stations officielles durant des périodes plus ou moins longues
La réalisation pratique d’une campagne est grandement facilitée si elle est lancée à partir d’un centre d’études bien équipé situé à proximité, c’est–à-dire à moins de 1 000 km de la zone prospectée. Bien avant la saison des pluies, la plus grande partie du matériel est acheminée et stockée en lieu sûr : en particulier, des dépôts d’essence assez largement calculés sont constitués à des emplacements judicieusement choisis. Dans la mesure du possible, un agent est alors chargé de l’établissement du camp de base situé au lieu d’action de l’équipe fixe.
L’ensemble des opérations est confié à un ingénieur hydrologue expérimenté qui prend également la direction de l’équipe volante. Il est secondé par un adjoint technique bien rodé chargé de l’équipe fixe.
Le matériel roulant comporte un véhicule tous terrains semi-lourd qui reste en général au camp de base lorsque la campagne bat son plein, et d’un véhicule tous terrains léger affecté à l’équipe volante. Il est préférable, si c’est possible, que les deux véhicules soient équipés d’un treuil. De plus l’équipe fixe dispose en permanence de quelques chameaux (3 ou 4) à titre de sécurité et pour assurer les liaisons. L’équipe volante loue dix à quinze chameaux pour effectuer ses tournées lorsque la voiture n’est pas utilisable.
Pour le matériel nécessaire aux observations et aux travaux des deux équipes, il doit comporter les équipements nécessaires aux mesures climatologiques, topographiques et hydrologiques (limnimétrie et jaugeages), soit, pour les besoins de l’équipe fixe : Thermomètre au 1/10° C, thermomètre à maximums,

133
thermomètre à minimums, pluviomètres totalisateurs (nombre suivant le besoin), pluviographe à main,éprouvette, moulinet ordinaire, micromoulinet monté sur perche ronde et avec accessoires, chronomètres, quelques éléments d’échelles, un ou deux limnigraphes à mouvement longue durée éventuellement, double décamètre en ruban d’acier, niveau avec mire, boussole topographique, altimètre , et pour les besoins de l’équipe mobile : tous les éléments normaux d’une station climatologique : Pluviomètres (nombres suivant les besoins) avec abri, pluviographes (nombre suivant les besoins), 1 ensemble de jaugeage sur canot pneumatique avec perche et avec saumon, ou 1 transporteur aérien et 1 ensemble léger sur perche, 1 ou 2 limnigraphes journaliers, niveau, double décamètre, altimètre etc.
Il faut ajouter à cela les câbles et les cordages, l’outillage, le matériel de campement, etc. Notons enfin que le chef de mission doit disposer de toutes les cartes et photographies aériennes disponibles concernant la région étudiée.
Marcel Roche « Hydrologie de Surface »
8.2.2.3 DÉVELOPPEMENT DES RÉSEAUX DE MESURE
Les réseaux pluviométriques et hydrométriques sont les pièces maîtresses de toutes lesévaluations hydrologiques. Les données sur les ressources en eau des oueds, en particulier les données pluviométriques, hydrologiques et hydrogéologiques, sont essentielles à laplanification, à la conception et à l’exécution des projets relatifs à l’eau. Dans la plupart des pays arabes et d’une façon générale les pays en développement, des servicesgouvernementaux spécialisés sont chargés du rassemblement (mesure), de la transmission, dutraitement (calcul des valeurs moyennes, des minima, des maxima, des fréquences desphénomènes d’inondation et de sécheresse, etc.) et de la publication des données.
Pour bien planifier et préparer un projet, on a de plus en plus besoin de données détaillées qui permettent d’évaluer tous les aspects susceptibles d’influer sur ces projets et tous les effets possibles qu’ils peuvent avoir sur l’environnement. Malheureusement, ces données sontsouvent insuffisantes ou inexistantes dans la mesure où dans la majorité des pays arabes, la capacité des organismes chargés des questions hydrologiques est souvent limitée par unmanque de moyens financiers, par des équipements périmés et parfois inadaptés auxconditions hydrologiques du pays, par des salaires bas et parfois dérisoires et par le faible niveau de qualification du personnel. Cette situation assez précaire influe évidemment surl’activité hydrologique, les données sont alors mal enregistrées, la transmission des données entre les stations de mesures et les services centraux n’est pas toujours fiable, le traitement des données et la recherche d’anomalies et d’erreur ne sont pas toujours bien entrepris et la publication des données accuse souvent de grands retards.
L’affinement de ces évaluations est en mesure d’améliorer la connaissance descaractéristiques hydrologiques régionales, aussi faut-il mener des actions visant lerenforcement et l’optimisation des réseaux des mesure en vue d’assurer une meilleurecouverture du plus grand nombre possible de bassins hydrographiques et notamment lesbassins des régions éloignées qui d’une façon générale ne sont que très partiellement suivis.
L’extension des réseaux de mesure aux bassins de moyennes et faibles superficies permettra d’explorer les apports de ces bassins et d’améliorer leur connaissance. Des programmesd’extension planifiés et bien étudiés doivent être mis au point et réalisés en fonction despriorités.

134
De même des actions de modernisation des réseaux s’imposent et ce par l’adaptation denouvelles technologies de collecte et de transmission des données (télédétection, télémesure, images par satellites, balises terrestres…). La modernisation de l’hydrologie peut en effetaider à pallier toutes les défaillances des réseaux existants: les appareils de mesureautomatiques devraient permettre un enregistrement plus fiable et continu des données, latransmission par radio ou par satellite permet d ‘accéder directement et immédiatement auxdonnées et de télécommander le fonctionnement des stations, tandis que l’utilisation desordinateurs et de logiciels appropriés facilite le traitement des données et le contrôle de leur qualité. L’emploi de stations automatiques devrait également permettre de réduire leurnombre. L’information et les images par satellite de la couverture nuageuse, de latempérature, de l’humidité et de la réaction de la végétation aux précipitations, peuvent servir dans ces cas-là à combler les « vides » entre les stations.
La mise en place et l’exploitation d’un réseau d’observation et de mesure représentent la majeure partie des activités en hydrologie. La valeur technique et économique des mesures et des observations dépend en partie de la fiabilité et de la précision des appareils utilisés. Il en résulte que l’appareil le plus approprié à la réalisation d’un objectif, à l’aide d’une mesure donnée, devrait être choisi sur la base de caractéristiques ayant fait leur preuve pour atteindre ce but. Compte tenu de la diversité des appareils de mesure et de leur origine, il faut donc procéder à des tests sur le terrain dans les conditions d’exploitation où les disparités declimats, et de conditions physiologiques peuvent montrer les avantages et les inconvénientsde l’utilisation des divers appareils. Il y a lieu aussi de procéder dans certains cas à apportedes modifications sur les appareils pour les adapter aux conditions spécifiques à chaquerégion. Dans ce contexte, des ateliers techniques pourraient être programmés dans le cadre du projet de l’hydrologie des oueds pour discuter du problème des équipements hydrologiques et les meilleurs moyens pour leur utilisation dans les pays arabes.
De toutes les façons, les critères suivants peuvent servir de base de comparaison entre les divers appareils existants pour procéder à une mesure donnée: précision, sensibilité, fiabilité, longévité, durée de service, coût initial, conditions et frais d’installation, besoins et fraisd’entretien et compatibilité avec d’autres équipements en service et avec les installationsinformatiques. Les tests comparatifs offrent l’occasion d’évaluer les paramètres techniques et économiques des divers appareils et de sélectionner les types d’appareils appropriés auxconditions hydrologiques.
8.2.3 MISE AU POINT DES STRUCTURES TECHNIQUES POUR LES TRAVAUXDE COLLECTE DE DONNÉES ET D’ANALYSE
L’activité sur le réseau de mesures nécessite la mise en place à l’intérieur des organismeschargés de leur gestion, de services techniques spécialisés qui peuvent se répartir de lamanière suivante:
- un service réseau chargé de veiller à toutes les opérations relatives à la collecte des données pluviométriques et hydrologiques. Il planifie au début de chaque année

135
les différentes interventions de développement, de maintenance et d’améliorationdes stations de mesures sur les différents bassins du pays. Il veille à la réalisation de toutes les activités planifiées suivant un calendrier préétabli et tenant comptedes priorités. Il programme et contrôle toutes les interventions d’observation et de mesures régulières et circonstancielles. Il assure une surveillance continue pourl’annonce des crues et l’alerte des phénomènes hydrologiques exceptionnels. Des noyaux régionaux du service réseau assurent la coordination avec le servicecentral et veille à l’exécution effective des travaux et interventions planifiées.
- Un service fichier et un annuaire chargé du traitement et de l’analyse des données collectées sur les différents réseaux de mesures, du contrôle de leur validité et de la mise à jour d’une banque de données à l’échelle centrale. Il assure en outre la publication régulière d’annuaires pluviométriques et hydrologiques. Il peut êtrechargé de développer et/ou d’adapter les moyens informatiques qui peuvent servir à ses besoins de traitement des données (adaptation de logiciels, mise au points de chaînes de programmes informatiques, utilisation de système GIS, archivageélectroniques des bulletins et diagrammes des observations…)
- Un service étude qui pourra être essentiellement chargé d’interpréter les résultats des traitements des données, d’établir les relations entre les différents paramètres mesurés et de fournir une bonne évaluation des caractéristiques hydrologiques des bassins contrôlés. Il veille à la publication régulière d’études de synthèse pourchaque oued traité. Une section de recherches pourrait s’occuper de travaux de synthèse générale et de mise au point de formules régionales permettant dedéterminer les différentes caractéristiques pluviométriques et hydrologiques dansles bassins non observés.
8.2.4 DÉVELOPPEMENT DES MÉTHODES D’ANALYSE ET D’ÉVALUATION
Pour obtenir des prévisions utiles à la gestion des eaux, la collecte et la diffusion del’information sur les niveaux des oueds, la pluie, la température, doivent être effectuées àl’aide des moyens de transmission rapide. La mise au point des méthodes de prévision et la préparation des plans d’ouvrages hydrauliques demandent que ces mêmes données soientdisponibles sur de longues périodes. Pour faire face à ces besoins il importe de traiter et de publier ces données régulièrement.
Les relevés concernant le débit, les précipitations, la qualité de l’eau, ainsi que d’autresfacteurs hydrologiques ou météorologiques doivent être nécessairement résumés etinterprétés de manière à pouvoir les utiliser pour l’évaluation des ressources disponibles, ou des risques de crues ou de sécheresse. Une fois publiés, les résultats ainsi obtenus constituent une base pour l’étude des ressources en eau et pour la planification de leur mise en valeur. Le développement des méthodes d’analyse des données et des techniques d’établissement des bilans contribuera au développement de l’hydrologie des oueds et de là, à l’amélioration de la connaissance de leurs potentialités en eaux.
Le traitement des données en vue de la publication exige souvent une analyse comparativedes données hydrologiques et climatologiques. L’évaluation des débits pendant les périodes
136
au cours desquelles il n’existe pas de relevés de hauteur d’eau repose souvent sur les relevés des hauteurs de pluie et des données météorologiques connexes.
L’évaluation de ces ressources peut être affinée par une meilleure appréhension des différents facteurs du cycle hydrologique et de leur interaction. Il y a lieu donc de renforcer les études des caractéristiques statistiques des deux paramètres fondamentaux: la pluviométrie etl’écoulement et de développer des actions permettant une connaissance plus fiable desressources.
Ces études nécessitent le développement de la recherche sur les bassins représentatifs et leur expérimentation pour la détermination quantitative et qualitative des divers éléments du bilanhydrique et l’étude de leur interaction notamment la transformation Pluie-Débit (simulationde pluie). Il est souhaitable d’aménager un bassin représentatif de chaque région naturellemais plus particulièrement les régions qui posent les problèmes hydrologiques les plus ardus. Sous leur forme la plus simple, ils permettent l’étude simultanée des précipitations et desdébits; ils peuvent ainsi suppléer, dans une certaine mesure, à la trop courte durée desobservations et à la faible densité d’un réseau minimal.
Pour les pays arabes qui ne disposent pas de tels bassins, et dans une première étape, les bassins pilotes choisis dans les différents pays dans le cadre du projet Hydrologie des Oueds peuvent servir comme bassins expérimentaux et équipés d’une manière exhaustive pour lesuivi des principaux éléments du cycle hydrique.
8.2.5 DÉVELOPPEMENT DE L’OUTIL INFORMATIQUE POUR L’ANALYSE DEL’INFORMATION HYDROLOGIQUE ET LE DÉVELOPPEMENT DES BANQUES DE DONNÉES
L’apport de l’informatique à l’hydrologie prend de plus en plus d’importance à la fin de ce siècle. Plusieurs pays arabes ont depuis plusieurs années, adopté les moyens de l’informatique pour traiter les données hydrologiques recueillies sur les différents réseaux de mesures. Ils ont en outre mis au point ou adapté à leurs besoins des chaînes de programmes informatiques pour l’organisation de cesdonnées, la constitution de divers fichiers et le stockage des données dans des banques de données appropriées.
Cette activité est plus ou moins généralisée à l’ensemble des pays arabes mais ne couvre pasl’ensemble des systèmes hydrographiques. Aussi et dans le cadre du développement de l’hydrologie des oueds il est opportun de programmer et mener les actions suivantes :
- Veiller à ce que l’informatisation touche progressivement l’ensemble des bassins versants observés. Plusieurs organismes internationaux mettent à la disposition des pays un grand répertoire de programmes, logiciels et autres méthodologies de traitement automatiquedes données et qui sont généralement faciles à adapter et à utiliser dans les différents cas.
- Activer la mise au point d’une banque de données spéciale aux oueds
- Alimenter régulièrement cette banque avec des données pluviométriques, hydrologiques
137
et autres.
- Procéder à l’élaboration et/ou l’adaptation de modèles hydrologiques à partir des processus hydrologiques dans les différents bassins de la région.
- Etablir un système de suivi du type SIG (système d(information Géographiques)qui permet de gérer convenablement l’ensemble des données concernant les eauxde surface (données de terrain, cartes de bassins versants, cartes thématiquesdiverses…) de les traiter statistiquement , de les superposer et de les restituer sous une forme plus perceptible pour l’aménageur et l’ingénieur. L’utilisation du SIGpeut valoriser ces données en les transformant en information aidant à la prise de décision et en élaborant des cartes d’aménagements dans le but d’une optimisation de la gestion des ressources en eau.
- Coordonner avec les autres pays pour la mise au point d’une banque de données arabes intégrant toutes les données recueillies sur les différents réseaux. Le noyau de cette banque peut être constitué dans une première phase des données émanant de l’observation des bassins pilotes du projet « Wadi Hydrology »
8.2.6 AMÉLIORATION DE LA CONNAISSANCE DES CARACTÉRISTIQUESHYDROLOGIQUES DES OUEDS
Le développement de l’outil informatique dans les divers pays va permettre aux services hydrologiques de disposer d’une masse importante d’informations traitées et bienorganisées et qui peuvent être aisément utilisées dans la phase d’analyse etd’interprétation et dans l’élaboration des études d’évaluation des caractéristiqueshydrologiques des oueds notamment l’évaluation du ruissellement, l’évaporation et les transports solides.
Il est recommandé, pour faciliter l’interprétation des phénomènes observés, de présenter les données sous formes de valeurs statistiques, telles que moyennes, valeurs maximales et minimales, écart types, distribution de fréquence (tableau ou courbes), etc. Les fréquences calculées à partir de données rassemblées sur des périodes relativement courtes devraient être comparées aux fréquences calculées sur de longues périodes (30 an ou plus). De cette manière, il est possible de considérer le caractère d’une période donnée par rapport aux conditions moyennes observées durant une longue période. Certaines des données obtenues seront publiées dans des annuaires hydrologiques. Pour chaquestation, un tel résumé statistique devrait contenir des renseignements complets sur toutes les stations, à savoir: nom, coordonnées, altitude, surface du bassin, phénomène observés, heures d’observation, période sur laquelle portent les relevés, etc.
Les données hydrologiques observées et traitées donneront un bon aperçu des conditionshydrologiques dans la zone considérée. Elles permettront d’établir des bilans hydriques annuels àl’échelle des différents bassins et d’extrapoler ces bilans par des techniques appropriées à l’échelle de l’ensemble d’une région ou d’un pays. Elles seront aussi utiles pour améliorer ou établir unprogramme de prévision à des fins hydrologiques.
Les principales composantes de tels bilans sont les précipitations, le ruissellement, l’évaporation et la sédimentation.
138
8.2.6.1 LES PRECIPITATIONS ET LE RUISSELLEMENT
Dans les régions arides, comme partout ailleurs, la mesure des précipitations revêt, en hydrologie, une grande importance. On doit s’attacher tout particulièrement au choix de l’emplacement, à la forme et à l’exposition des pluviomètres et prendre des mesures préventives pour empêcher les pertes dues notamment à l’évaporation et au vent. L’eau recueillie dans un pluviomètre devrait représenter les précipitations tombées dans la zone environnante. Aussi, faut-il choisir l’emplacement qui convient le mieux. Le choix des stations implique donc une bonne connaissance de la géographie des bassins versants et du degré de représentativité des sites choisis.
Par ailleurs, il faut assurer une observation fiable et continue, une transmission régulière del’information pluviométrique recueillie sur l’ensemble du réseau pluviométrique. Le traitement etl’analyse des résultats doivent être abordés et exécutés avec grand soin après une étude critique des résultats envoyés par l’observateur. Les résultats finaux sont alors stockés sous formes de fichiers et sont facilement accessibles pour toute étude de synthèse.
L’objectif fondamental de toute étude pluviométrique est la connaissance de la répartitionpluviométrique sur un bassin versant lors d’un épisode pluvieux et sa relation avec les écoulements qui en résultent. La détermination des débits moyens et leur attachement aux précipitations se fait à partir des résultats des observations des pluviomètres et des stations de jaugeages. Mais si on peut disposer d’un bon réseau de pluviomètres on ne peut pas construire des stations de jaugeagesextrêmement nombreuses. On recourt alors à des petits bassins type que l’on étudie avec soin et pour lesquels on essaie d’établir des formules de débit en fonction des précipitations, formules que l’on cherche à extrapoler aux bassins voisins. Cette extrapolation n’est pas souvent aisée, elle suppose des corrections toujours arbitraires en fonction des caractéristiques du bassin et qui nécessitent destravaux et calculs compliqués et la plupart du temps incertains. L’extension des bassins est cependant d’un grand apport dans l’établissement des équations de transferts pluie débit et au développement des modes d’extrapolation et de transposition des résultats.
L’étude des débits extrêmes : les étiages fréquemment nuls en pays arides et semi-arides, et surtout les crues qui souvent, conditionnent les aménagements possibles. La liaison souhaitable entrel’importance des crues et les précipitations pose le problème des pluies instantanées torrentielles qui ne peut être résolu que par une bonne connaissance des intensités et de leur récurrence. Ceci implique une bonne couverture des mesures pluviographiques. Toutefois étant donné le caractère régional de la variabilité des intensités les extrapolations à partir des observations faites dans des bassins versants représentatifs peuvent être étendues à des bassins voisins beaucoup plus importants.
L’étude de l’intensité des pluies constitue donc un élément essentiel dans l’étude des crues et les débits qu’elles engendrent. La connaissance des intensités régionales en fonction des durées des averses et de leurs différentes récurrences permet entre autres, d’estimer, pour différentes récurrences, les débits caractéristiques des crues qui risquent de se produire sur un bassin versant donné. De telles informations sont nécessaires pour la prévision des crues et aussi pour le dimensionnement des ouvrages hydrauliques éventuels.
L’estimation des débits peut se faire aussi à partir des formules établies sur des résultats d’études statistiques des débits observés sur des oueds d’une même région, là encore devra intervenir unecorrection tenant compte des caractéristiques physiques du bassin et du couvert végétal.

139
Dans plusieurs pays des régions arides, l’urgence des projets hydroagricoles et de génie civile d’une part et l’insuffisance des données hydrologiques d’autre part ont conduit à l’établissement de formules régionales à partir des données disponibles pour l’estimation des principales variables hydrologiques. Le développement de telles formules peut permettre de pallier les manques d’observations d’une part et aux étendues limitées des séries d’observations disponibles d’autre part; aussi une attentionparticulière doit être portée à ce type d’évaluation d’autant plus que les moyens informatiques actuels sont facilement accessibles et peuvent aider à mener de telles recherches et études.
8.2.6.2 L’ÉVAPORATION ET LA SEDIMENTATION:
Parmi les autres paramètres hydrologiques importants des oueds il y a les deux phénomènesd’évaporation et de sédimentation, paramètres qui présentent un impact défavorable sur leruissellement et de là sur les potentialités en eau des oueds. L’étude de ces paramètres n’est généralement pas aisée et elle est assez négligée par les hydrologues des différents pays. Or ces deux paramètres jouent un rôle déterminant dans le comportement hydrologique des cours d’eau en régime aride et semi-aride et doivent être pris en compte dans l’étude hydrologique. des oueds. L’hydrologie des Oueds ne peut pas se développer sans la connaissance de ces deux paramètres.
• L’ÉVAPORATION ET L’ÉVAPOTRANSPIRATION :
L’évaporation est le phénomène hydrologique qui caractérise la zone aride, elle y joue le rôle le plus important dans la déperdition d’eau, cette déperdition est d’autant plus importante que lesdisponibilités en eau sont faibles et les températures sont élevées. L’évaluation des pertes parévaporation est importante pour la conception des réservoirs, particulièrement dans les régions arides et semi-arides.
En zone aride les précipitations mensuelles restent toujours inférieures à l’évapotranspirationpotentielle et, dans ces conditions le bilan hydrique n’est jamais satisfait, l’évapotranspiration réelle est limitée par l’insuffisance des réserves du sol, et n’atteint jamais la valeur de l’évapotranspiration potentielle. Il en résulte que toute variation de la pluviométrie annuelle, autour de sa valeur moyenne se répartit entre une variation de l’évapotranspiration (donc du déficit de l’écoulement) et unevariation du ruissellement.
Cela se traduit en année sèche par une diminution très sensible du ruissellement. En année pluvieuse, on observe un accroissement des ruissellements, mais une part importante de l’excès desprécipitations par rapport à la moyenne est prélevée au bénéfice de l’évapotranspiration.
Si la pluviométrie excédentaire est due à quelques averses de forte intensité, tombées au moment où les sols du bassin sont déjà saturés, la plus grande partie est prise par le ruissellement, mais si elle est entraînée par une prolongation de la période des pluies constituées par des averses d’intensitémoyenne, ou par une augmentation du nombre de jours de pluies de l’année, c’est alorsprincipalement l’évapotranspiration qui en prélève une bonne partie.
En résumé, on constate, en zone aride, que le déficit d’écoulement est aussi variable que leruissellement et qu’il n’y a aucun intérêt, comme on peut le faire en zones tempérées, de passer par son étude en vue de résoudre les problèmes d’hydrologie. C’est pourquoi il est nécessaire d’aborder dans ces régions directement l’étude du ruissellement.

140
Les estimations relatives à l’évaporation des nappes d’eau libre et du sol, ainsi que la transpiration des végétaux, revêtent ainsi une grande importance dans les études hydrologiques. A titre d’exemple, l’évaluation de l’évaporation peut jouer un rôle déterminant dans l’étude de la rentabilité d’un site de réservoir, de même qu’elle est nécessaire pour élaborer les règles d’exploitation de ce réservoir. Des estimations de l’évapotranspiration moyenne des bassins sont indispensables pour établir et appliquer des modèles hydrologiques conceptuels.
Les moyens techniques actuels ne permettent pas encore de mesurer directement l’évaporation et l’évapotranspiration sur de très grandes surface. On a cependant mis au point plusieurs méthodes d’évaluation indirecte qui fournissent des résultats acceptables. En réseau, on utilise des bacs d’évaporation et des lysimètres. En ce qui concerne les réservoirs existants, les parcelles et les bassins versants de petite dimension, les évaluations peuvent être faites à partir du bilan hydrique et du bilan.
Pour déterminer l’évaporation au–dessus des lacs et des réservoirs, on utilise fréquemment lesdonnées fournies par les bacs d’évaporation. Il en existe de nombreux modèles. Le bac américain a été recommandé par l’O.M.M et l’AISH comme instrument de référence. Ses performances ont pu être étudiées dans les conditions climatiques très diverses. Ils fonctionnent bien et se caractérisent par une relation extrêmement stable avec les facteurs météorologiques qui conditionnent l’évaporation. Aussi, les pays arabes peuvent adopter ce type d’appareils pour l’estimation de l’évaporation moyenne.
L’évapotranspiration peut être évaluée au moyen d’évaporomètres et de lysimètres, par la méthode du bilan hydrique et énergétique et par diverses formules empiriques basées sur les donnéesd’observation météorologique. L’emploi des évaporomètres et de lysimètres permet une mesuredirecte de l’évapotranspiration à partir de différents types de sols en culture et de l’évaporation du sol entre les plantes cultivées. Ces appareils paraissent suffisamment simples et précis dans la mesure où les normes d’installation et les protocoles d’observation sont respectés. Plusieurs typesd’évaporomètres et de lysimètres de diverses dimensions sont utilisés. Il n’y a pas d’instrument universel type pour mesurer l’évapotranspiration .
Dans les pays arabes, beaucoup de mesures d’évaporation sont faites à partir des bacs d’évaporation ou des évaporomètres du type Piche. Ces mesures donnent de médiocres indications sur l’évaporation dans les régions arides. L’emploi des lysimètres semble par contre donner d’assez bon résultats en ce qui concerne l’évaporation potentielle.
Par suite des difficultés que présentent les observations directes de l’évaporation, de nombreuxauteurs ont cherché à établir des formules reliant le pouvoir évaporant de l’air aux différents facteurs qui interviennent dans l’évaporation. Les formules proposées portent soit sur le transfert de vapeur dans l’air, soit sur le mécanisme énergétique de l’évaporation. L’inconvénient de ces formules, même si elles semblent donner des résultats fiables, c’est qu’elles font intervenir des facteurs qu’on nepossède pas toujours avec une précision suffisante. L’application de ces formules a permis néanmoins d’évaluer l’évapotranspiration dans un nombre de pays des régions arides. Toutefois il importe de ne pas perdre de vue que les formules empiriques établies dans une région particulière ne s’appliquent pas toujours à d’autres régions.
Dans le cadre du développement de l’hydrologie des oueds, nous proposons une action de grande envergure à l’échelle des bassins pilotes pour tester plusieurs types de mesures et surtout pour étudier l’évaporation sous diverses conditions, évaporation au soleil, évaporation à l’ombre, évaporation sur sol nu, évaporation sous couvert végétal, évaporation sous plusieurs altitudes etc. Un inventaire

141
exhaustif des méthodologies utilisées dans les pays arabes pour l’évaluation de l’évaporation pourrait donner lieu à l’élaboration d’un guide pratique qui aidera les hydrologues arabes à mieux appréhender ce phénomène. Toutes ces actions peuvent s’intégrer dans un sous projet «étude de l’impact de l’évaporation sur l’hydrologie » pourrait aider à mieux comprendre ce phénomène hydro-climatiqueimportant.
• LA SEDIMENTATION ET LE TRANSPORT SOLIDE :
L’érosion du sol est un problème sérieux dans la plupart des régions arides. L’entraînement des sols facilement érodables par les crues a pour conséquence un apport de sédiments par les ouedsprovoquant généralement un alluvionnement des régions basses et des modifications dans les lits des oueds ainsi que le comblement progressif des retenues de barrages. L’érosion est liée au volumeécoulé.
Le transport de matériaux par les écoulements se fait de différentes façons. Selon les caractéristiques physiques (taille et forme des particules, poids spécifiques, etc.), la composition granulométrique des sédiments, et les conditions d’écoulement (vitesse, profondeur, pente de la surface, etc.), les matériaux peuvent se mouvoir par saltation, roulage ou glissement sur ou prΠs du fond, ou bien ils peuvent être soulevés et maintenus en suspension. En général, ces différentes formes de transports de matériaux se produisent simultanément dans les oueds et il n y a pas de délimitation nette entre elles. Dans les études hydrologiques, on distingue deux catégories de transports solides: les matériaux en suspension et les charriages de fond.
Les matériaux en suspension se déplacent en général à la même vitesse que le courant, tandis que le charriage de fond est plus lent.
La concentration des matériaux en suspension est mesurée généralement à l’aide d’échantillonsprélevés dans l’écoulement ou par des équipements spécifiques immergés dans le courant. Enmultipliant la concentration ainsi mesurée par le débit, on obtient le débit des matériaux ensuspension. Par ailleurs le charriage de fond doit être mesuré en général directement et corrélé avec le débit liquide ou autres paramètres hydrauliques. Les matériaux transportés au cours des crues sont généralement assez riches en matières organiques et se déposent en grande partie sur les piémonts et les plaines.
Vu l’importance des transports solides dans les écoulements des oueds, une attention particulière doit être portée aux moyens d’estimation de ce facteur. On doit utiliser pour le choix des sites de mesure du transport solide les mêmes critères que pour le choix d’une station de jaugeages.
On peut dans ce contexte utiliser les stations principales du réseau hydrométrique de base pour effectuer d’une façon régulière, pendant toute la durée des crues des mesures des transports solides. Pour cela on peut se limiter dans nos régions à faire des prélèvements instantanés d’échantillons d’eau de crue avec des moyens simples qu’on peut concevoir localement par exemple un cylindrehorizontal, équipé à ses deux extrémités de clapets dont la fermeture très rapide permet de retenir un échantillon à n’importe quelle profondeur. Parfois on peut se contenter de prélèvements à la bouteille, mais ce type de prélèvement n’est pas vraiment instantané. Les méthodes de calcul et d’estimation des débits solides, de l’établissement des turbidigrammes sont bien connues et peuvent être utilisées dans le cadre des oueds.

142
La mesure du charriage de fond est difficile du fait du caractère aléatoire du mouvement de ces matériaux. Aucun appareil n’a prouvé sa capacité à attraper avec la même efficacité les plus gros et les plus petits des éléments transportés en gardant une position stable et orientée dans le sens du courant sur le fond, sans perturber pour autant l’écoulement naturel et le mouvement des matériaux. L’opération est d’autant plus difficile que dans les régions arides les crues sont très brusques, avec des vitesses élevées et des ondes de crues souvent très turbulentes. Les mesures de charriage de fond peuvent être limitées dans nos zones à quelques bassins expérimentaux de faible tailles sur lesquels sont aménagés sur le cours de l’oued des pièges à sédiments qui peuvent vidés et mesurés après chaque crue. On peut alors avoir une estimation globale approximatives du volume des éléments charriés. Là aussi des recherches peuvent être développées dans le cadre des bassins pilotes du projet Hydrologie des Oueds.
8.2.7 DÉVELOPPEMENT DES PRÉVISIONS HYDROLOGIQUES:
La prévision hydrologique a de nombreuses utilisations en fournissant une meilleure base pour des décisions à prendre dans le cadre de l’exploitation. La prévision d’une inondation grave pourradéclencher une série de mesures: évacuation des régions inondées, déplacement des biens meubles vers des régions plus élevées, renforcement des digues par des sacs de sable, fermeture des vannes d’inondation, utilisation des barrages pour la lutte contre les inondations etc.
Les prévisions à court terme des niveaux des lacs, barrages et des oueds, ainsi que des débits sont évidemment les plus importantes dans le domaine hydrologique. Etant donné l’importance accordée de plus en plus à la mise en valeur régionale des ressources en eau, le besoin en prévisionshydrologiques s’affirme de plus en plus et un système de prévisions sûr devient une nécessité.
Pour préparer des prévisions hydrologique il importe de disposer d’observations et de prévisions météorologiques ainsi que de rapports sur la situation hydrologique. Le service hydrologique doit nécessairement disposer d’un système de communications réparti sur l’ensemble du pays, pour lerassemblement des données. Par ailleurs il faut établir une bonne coordination entre les différents services concernés par les prévisions hydrologiques tels que le service de la météorologie, le service des aménagements hydraulique, et le service de la planification. L’agent qui établit les prévisions hydrologiques doit en effet avoir accès facilement aux prévisions météorologiques qui doivent être en rapport étroit avec la situation hydrologique de la région particulière qui l’intéresse. Il convient par ailleurs de rappeler que les organes de gestion des ressources en eau sont les principaux utilisateurs de données et de prévisions hydrologiques, et qu’une étroite coordination est également indispensable dans ce domaine. Dans certains pays, des commissions nationales peuvent être instaurées pour les problèmes de prévisions hydrologiques.
Dans les pays qui ne disposent pas à ce jour de programme de prévision hydrologique peuvent dans un premier temps constituer un service d'annonce de crues pour suivre en temps réel l’évolution la propagation des crues sur leurs principaux oueds. Ce réseau est constitué de stations choisies parmiles stations de base du réseau hydrométrique. Ces stations sont reliées au service central par des moyens de communications simples téléphone ou radio émetteur récepteur pour ou disposentd’équipements automatiques télémétrés qui envoient directement leurs informations au servicecentral. De même, le radar offre de larges possibilités, tant pour les prévisions météorologiques que pour les prévisions hydrologiques.

143
Dans le cadre du projet «hydrologie des oueds », il serait profitable à tous les pays concernés de mener une action régionale sur le thème «la prévision hydrologique » qui vise tout d’abord à faire le point de la situation dans ce domaine et de mettre au point des programmes d’études et de conception de tels services dans les pays arabes.
8.3 CONCLUSION ET RECOMMANDATIONS
Le développement de l’hydrologie des systèmes des oueds dans les pays arabes, nécessite lerenforcement des travaux d’inventaire et des méthodes d’exploration des ressources sur l’ensemble bassins hydrographiques de chaque pays quelles que soient leurs tailles et ce en vue d’asseoirl’évaluation de leurs potentialités en eau sur des données naturelles, suffisantes, homogènes et fiables.Parallèlement à cette action primordiale, il y a lieu aussi de programmer et de développer des actions d’études et de recherches en vue d’affiner les évaluations déjà faites et de mettre en évidence de nouvelles ressources. Pour atteindre ces objectifs nous formulons les recommandations suivantes:
A/ au niveau de l’amélioration des connaissances :
1- Développer les réseaux de mesures pour une couverture régionale plus homogène et plus dense ;
2- assurer une observation planifiée et régulière des réseaux de mesures :
3- Réfléchir sur les moyens à mettre en œuvre pour adapter de nouvelles technologiesmodernes d’explorations, d’acquisition et de transmissions des données : télémétrie,télédétection, satellites …
4- développer les recherches au niveau des bassins pilotes du projet «Wadi Hydrology »(ou autres bassins expérimentaux et représentatifs) pour une meilleure approche des paramètres hydro-climatologiques et des fonctions de production et de transfert à travers les différents systèmes hydrologiques de chaque pays
5- mieux comprendre le comportement des petites entités hydrologiques par l’intégration des petits ouvrages de mobilisation existants dans le réseau de surveillance et de mesures hydrologiques
6- développer, tant au niveau universitaire que dans les centres de recherches nationaux ou régionaux, des actions visant l’amélioration de la connaissance des divers processus hydrologiques en milieu aride et semi-aride :
• connaissance des principaux facteurs du cycle hydrologique, de leurs interactions, notamment l’étude de l’interface atmosphère-terre-eau ;
• étude des facteurs affectant les disponibilités des eaux de surface notamment les phénomènes d’érosion, de déformation de lit des cours d’eau et de mouvement des sédiments dans les bassins hydrographiques
• adaptation et/ou développement et d’outils scientifiques plus performants (modèles mathématiques, logiciels de dépouillement et d’interprétation des données, systèmes d’informations géographiques…) pour une évaluation plus fiable des caractéristiques hydrologiques des systèmes des oueds
7- Développer la cartographie hydrologique: cartes thématiques (pluviométrie, écoulement,

144
qualité de l’eau, érosion et transport solide…)
8- réfléchir sur les moyens techniques et scientifiques susceptibles de développer lesprévisions hydrologiques en milieu aride
9- établir (ou renforcer) les réseaux d’alerte et d’annonce de crues dans les différents pays
10- développer les recherches dans le domaine des phénomènes extrêmes (sécheresse ou crues exceptionnelles) de leur occurrence et de leurs probabilités ainsi que de leur impact sur la mobilisation et l’utilisation des eaux
B/ Au niveau de la formation et de l’information
1- développer la banque de donnée des données hydrologiques à l’échelle des pays
2- Développer la banque de donnée des données hydrologiques propre au projet « WadiHydrology » qui rassemblera tous les résultats des actions menées par les différents partis dans le cadre de ce projet.
3- développer des guides et autres moyens de formation pour la gestion des réseauxhydrométriques
4- programmer à l’échelle régionale des ateliers de travail sur les différents aspects del’hydrologie des oueds
5- Instaurer dans chaque pays des programmes d’enseignement des sciences hydrologiques au niveau universitaire (pour ingénieurs et techniciens supérieurs) et à l’échelle dusecondaire (pour techniciens et opérateurs), ainsi que des cours de perfectionnement et de recyclage pour les cadres et les techniciens intervenant dans le domaine de l’évaluation des ressources en eau.
8.4 REFERENCES
- Guide of Hydrological Practices W.M.O. N°168 4th edition 1981
- Hydrologie deszzones arides M.R. KALLEL . Tunisie 1983
- UNESCO : Review of Research on arid zone hydrology 1953
- UNESCO : les problèmes de la zone aride 1962
- Hand book of applied Hydrology : SHOW V.T.
- Hydrologie de Surface M. ROCHE ( Orstom)
- Réflexion sur le développement des ressources en eau de surface M. R. KALLELTunisie 1992

145
CHAPTER NINE
SUSTAINABLE MANAGEMENT OF WADI SYSTEMS
Abdin M. A. Salih1 and Ashraf H. M. Ghanem2
1 Deputy Secretary of IHP, UNESCO, Paris, e-mail: [email protected] Assistant Professor, Irrigation and Hydraulics Department, Cairo University, Cairo, Egypt
9.1 INTRODUCTIONMaintaining sustainable natural systems is complicated by the conflicts and interactionsamong the different resource utilizations. It is now widely accepted that sustainability of anynatural entity requires an integrated approach for its management. Using this approach toplanning allows the capturing of beneficial complementary effects and the achievement oftradeoffs among the conflicting uses (Rogers, 1993). This is particularly true for wadisystems, due to the many factors that have been described in the previous chapters. In this chapter, an attempt is made to summarize the challenges facing sustainable development ofwadi systems and to propose some solutions towards achieving that goal.
9.2 SUSTAINABLE DEVELOPMENTSustainable development may be defined as the ability to meet the needs of the here and now without compromising the ability of future generations to meet their own needs (WorldCommission on Environment and Development, 1987). The projection of this principle to the case of wadi development can be done from different perspectives. While one mightvisualize sustainability as a physical concept for preservation of a single resource (e.g. water), another might consider a larger, but still purely physical scope, of conservation of a group of resources or an ecosystem (e.g. within a wadi watershed or basin). A third could apply the concept through a wider vision encompassing physical-social-economic-ecological aspects(Dixon and Fallon, 1989).
Clearly, the first definition of sustainability with regard to a single resource, no matter howimportant that resource, is too narrow. The interrelationships between the different forms of water, from rain to surface and groundwater, and the complex processes involved of rainfall, runoff, erosion, deposition, seepage … etc. will logically introduce other aspects such assurface and underground geology, morphology, biology, … etc. Further, it is not merely the quantity of freshwater that is relevant, but also its quality and distribution in time and space in relation to other elements of the ecosystem as defined, for example, by a watershed.However, even this second definition of sustainability as a physical concept for an ecosystemis too narrow. That is because we are not interested only in the preservation of the physical entities of the ecosystem, but also in the sustainability of potential services provided by the

146
ecosystem’s resources, and the impact of human activities and behavior on the system. This leads to the adoption of the third global view, encompassing all physical, social, economicand ecological aspects of wadi development. Thus, sustainable management of wadi systems should satisfy present objectives of society, without compromising the ability of the system to satisfy the objectives of future generations (Hufschmidt and Tejwani, 1993). Servicesprovided by the system to society include support to activities such as domestic, agricultural, industrial, and recreational uses, as well as the maintenance of the ecosystem. The value to society, in the form of economic productivity, human health, biodiversity and social equityneeds to be maintained.
Due to the existence of a multitude of interacting and interdependent systems in wadis, a truly integrated wadi management approach is essential, which blends the incorporatingsubsystems into a larger encompassing system.
9.3 CHALLENGES FACING SUSTAINABLE MANAGEMENT OF WADI SYSTEMS
Several challenges face the achievement of sustainable management of wadi systems. Mainchallenges are outlined below. Practical solutions to some of these problems are presented later in section 4.
9.3.1 Technical Aspects
Several problems have occurred in the past due to a fragmented view of a wadi system. This is mainly because decision-makers and planners did not consider or were not aware of the nature of such systems. Many projects are planned and executed, with complete disregard to the boundaries of the catchment and its physical features. It is of utmost importance tomaintain the integrity of the hydrologic whole or continuum of the wadi system in anymanagement plan to secure sustainability (Leopold, 1990). A key prerequisite to this is a sound scientific understanding of the system. Physical phenomena of precipitation, runoff,evapotranspiration, streamflow, seepage, sediment transport and deposition, and floodingshould be carefully observed, measured and analyzed.
Unfortunately, our scientific understanding of these phenomena in wadis is still inadequate.Several difficulties underlie wadi exploration, including climatic conditions, difficulty toconduct measurements, and complexity and interdependency of the different processes.Further, there has been a noticeable lack of coordination of data collection activities anddissemination of information and techniques.
Floods are amongst the most damaging and high-ranking natural disasters that occur almost every year in various parts of the arid and semi-arid regions, including the Arab World. It is ironic that, in countries that usually suffer from severe water shortage, floods are responsible for appreciable loss of life and property. The amount of water generated in these floods can, however, be considerable. Floods in Upper Egypt during the period of 12-17 November 1996, for example, contributed 154.5 million m3 to the Nile River. This amount is equivalent to the average daily water release from the High Aswan Dam to satisfy Egypt’s daily water needs (Abu Zeid, 1997).

147
Conventional flood design practices often include costly structures, such as flood mitigationreservoirs, retarding dams, levees, floodwalls and floodways. Due to lack of technical know-how and codes of practice for the construction of such protection works, engineers andconstructors either perform the works in an ad-hoc manner, or at best import experience gained from similar works in irrigation projects, which are not compatible to the severesituations in wadis. Flash floods with excessive flow velocities and carrying huge amounts of sediments and debris of considerable size, often damage protection works completely,leading to excessive loss of property, and often also to loss of lives. Further, the aim of such measures of protection is merely to divert the floodwater, often to the sea, thus wasting a large amount of valuable freshwater, which is a vital resource for these usually dry regions.
9.3.2 Socio-Economic Aspects
Sound water resources management should be based upon the social and economiccircumstances existing within the boundaries of any water project. Although the importanceof this statement is stressed in many reports, few specific cases can be found where the socio-economic dimension has been given its proper share during the planning, design,implementation and management of such projects. The FAO (1994), in the expert meeting on water harvesting in Cairo 1993, noted that “during the planning phase of water harvestingproject, often insufficient attention is given to social and economic aspects, such as landtenure, unemployment and involvement of beneficiaries. This has turned out to be a majorconstraint in water harvesting projects”. Other development-related problems might be the expected urbanization with its related problems of need for dependable supplies of potable water and severe sanitation problems, including pollution of reservoirs and aquifers fromdomestic and industrial wastes.
9.3.3 Environmental Aspects
There is no success for any managerial plan in wadis if the environmental aspects are not given their proper role. The importance of the environmental dimension has now been wellrecognized as of great influence on all elements of the hydrological cycle. In turn, terms like environmental hydrology, ecohydrology and/or comparative hydrology are increasinglyreceiving global recognition. The effects of quality aspects -chemical, biological andphysical- of the components of the hydrological cycle, can not at all be neglected. Realexamples are the problems of acid rain and its effects on the soil and water resources inindustrialized countries. Among the major undesirable environmental consequences asrelated to wadi development are the creation of favorable habitats for parasitic and water-borne diseases by construction of poorly conceived reservoirs and irrigation systems, adverse impacts on ecological systems, caused by erosion, pollution, and changes in natural regimes, as well as reservoir sedimentation, soil salinization and water logging (Hufschmidt andTejwani, 1993).
9.3.4 Institutional and Legal Issues
The institutional and legal aspects represent an important component of any sustainablemanagement plan for wadis. Institutional framework and ownership issues are complex and diverse issues throughout the Arab Region and need to be addressed accordingly in theplanning phase of any project. Historically, legal aspects concerning the use of water in wadis

148
have received great attention and the management of wadis’ water resources has been wellaccepted ever since and even before the introduction of Islamic law which institutionalizedregulations such as the rights of upstream owners to use a given amount of water for their needs, leaving sufficient water for the next user along the course of a wadi. Currentlegislation in the Arab countries, however, mainly addresses the legal aspects of perennialrivers, as was clearly stated during a meeting on the legal aspects of water organized byESCWA in Jordan (1996). It was felt in the conclusions of this meeting that there is a need for a regional initiative to develop a legal framework that addresses the specific problems of wadis and groundwater.
Abdulrazzak (1998) presented the status of water legislation in the ESCWA region.Although the paper does not address legislation as related to wadis in particular, the ESCWA region represents one of the major wadi regions in the world. The author reviewed historical water laws and regulations and addressed weaknesses in institutional arrangements leading to inadequate implementation and representing a major constraint in achieving sustainabledevelopment and management of water resources in the region. Among these weaknesses is the fragmentation of authority in the water sector due to the large number of ministries thatare involved in water resources, as well as the lack of cooperation and coordination amongthese different authorities. Further, the water institutions lack the power needed to enforce laws and regulations. The latter weakness can be attributed to the lack or absence of effective judicial water systems, organized inspection routines, legislative enforcement bodies, as wellas human and financial resources.
9.4 TOWARDS SUSTAINABLE MANAGEMENT OF WADI SYSTEMS
In this section, some solutions to the problems outlined in the previous section are suggested.Although different aspects are addressed in separate subsections, it must be stressed that allthe below should be considered in a global integrated sense.
9.4.1 Technical aspects
The state of the physical resources (water – land – biota) is of key importance for maintaining or increasing the social value of the wadi system. For the management of the system, we must be concerned with the rates of rainfall and its distribution in time and space, amounts of erosion and sedimentation, natural stream flows and recharge phenomena, surface and ground water interactions, as well as impact of different land and water uses on the ecological state of the resources.
A key first step is achieving understanding of the natural wadi system by expanding anddeepening the physical information base. The complete wadi basin should be used as the domain for data collection and analysis, with appropriate subdivisions based on geology,climate, soil type, land and water use, and land cover. Aquifers and estuaries have to be included where appropriate. All components of the hydrologic cycle and accompanyingphysical processes should be measured and analyzed. Quantitative assessments of waterresources should use a complete water budget approach, which accounts for all water stocks,

149
flows, and withdrawals, with emphasis on interactions between surface and groundwater, and water quantity and quality (Hufschmidt and Tejwani, 1993).
Achieving an adequate scientific understanding of wadi systems in arid and semi-arid regions is a challenging task. Coordination of meteorological and hydrologic data collection andinterpretation activities, which are often scattered throughout many government agencies, isessential. Further, common standards for natural resources assessment and unified datacollection and measurement systems need to be established (WMO and UNESCO, 1997).
Conventional flood design practices often include costly structures, such as flood mitigationreservoirs, retarding dams, levees, floodwalls and floodways. The aim of these structures is mainly re-routing of the precious water source and, hence, wasting the floodwater. However, a better approach to floods is to try to mitigate the effects of the flood while at the same time aiming to maximize the benefits from the valuable floodwater. Various techniques areavailable; floodwater spreading, an easy and economical method of flood damage mitigation, in which floodwater is treated as a scarce resource, is one of them. That floodwater spreading systems can mitigate the damage of floods is shown in the case study of the Gareh Bygone plain in Iran (Kowsar, 1997). During an exceptional event, between 2 - 7 December 1986, some localities in Southern and Central Iran received nearly 3 times their mean annualprecipitation, causing 424 deaths and major financial losses. However, in the study areawhere floodwater spreading was practiced, 1.5 times the mean annual precipitation inflicted damages upon the floodwater spreading systems amounting to only 2.5% of the losses that would have occurred had it not been mitigated by the systems. Although floodwaterspreading systems are usually designed for a return period of 15 years, the damage to the systems in this event with a recurrence interval of more than 100 years, was surprisingly low.
Floodwater harvesting and spreading has a long tradition in the Arab world, as has beendescribed in Khouri et al. (1995). Traditional methods of floodwater use for agriculturalpurposes, in micro-catchment systems, macro-catchment systems and spate irrigation, untiltoday, play an important role in the water resources management in the Arab Region and a growing interest in further development and reviving of harvesting and spreading methodsexists. One of the techniques that has been receiving a lot of attention is artificial recharge to groundwater, through the construction of retaining dams in wadis, capturing especially theflash floods. The utilization of this technique is more obvious in the Gulf countries where many dams have been constructed for the purpose of artificial recharge and flood control.
Further, several measures can be useful for reducing natural disasters due to floods anddroughts. Among these measures are delineation of flood prone lands using appropriatesimulation techniques, and controlling human occupancy of such lands, developingtechniques and codes of practice for the construction of flood-proof structures, and adopting warning systems and evacuation and restoration plans. Further, it is important to plan for human adjustments to droughts, which would be based on specific rules for reducing water withdrawals to achieve efficient and equitable sharing of limited water resources throughpooling of available supplies and allocation to the uses of greatest social value, withappropriate compensation policies.

150
9.4.2 Socio-Economic Aspects
Wadi development projects should be planned, designed and implemented by a multi-disciplinary team of experts in order to ensure that technical, social, economic andenvironmental aspects are adequately covered. An integrated approach is essential right from the planning phases, through the implementation and operation phases, and includingevaluation and monitoring. The stakeholders, and the community at large, should be actively involved in all levels of the project from the planning to the operation of the completeproject. Of special importance is the evaluation of the social and economic effects andimpacts on water resources projects; this is essential for examining what the projects can do for the population and development of an area, and to continuously learn from theseexperiences (Loucks and Gladwell, 1999). A good example can be shown from the beneficial effects of a water-spreading project in Iran and its effect on emigration. It has been described by Movahed (1997) that in the Gareh Bygone area in Iran, where water is scarce, theintroduction of floodwater spreading has clearly changed the future perspective of thecommunity to the extent that mobility and migration to urban area has decreased.
9.4.3 Environmental Aspects
It is increasingly and globally demanded to conduct Environmental Impact Assessment (EIA) Studies as part and parcel of all processes related to the planning, implementation andoperation of water projects. This is especially important under arid conditions and inenvironments where its absence could lead to quick deterioration of the quality of surface and groundwater. It is unfortunate, even now, that many examples of untreatable contaminationof critically important alluvial aquifers have been reported in many wadis in the Arab Region.These catastrophes would not have occurred if the EIA concept was considered at theplanning and implementation stages of these utilizations.
As most pollution is caused by the people, increasing environmental awareness of the public is vital. Habits of environmentally safe practices have to be introduced. As it is virtuallyimpossible to monitor all activities of the people, and on the other hand it is quite easy and often comfortable to produce pollution, it might also be effective to make the public aware about the religious calls for clean practices and safeguarding natural resources. For example, the Islamic religion has a wide array of laws and decrees to this effect.
Industrial practices that are known for producing high rates of pollutants have to be replaced by modern, less hazardous techniques. Factories have to adopt on site treatment of wastes and removal of hazardous materials. Incentives for upgrading of factories or adoption of a polluter pays policy might be appropriate.
Environmental consequences of wadi developments, in the form of their impacts on thenatural whole, must be carefully examined at the assessment and planning stages. Ideally, environmental values should be combined with economic criteria and technical standards inwadi planning. Environmental consequences can be assessed in a multiple-objectiveplanning approach, which represents a true synthesis of environmental, social, and economic values (Hufschmidt and Tejwani, 1993; Loucks and Gladwell, 1999).

151
9.4.4 Institutional and Legal Issues
Institutional reform is definitely a key factor towards sustainable development andmanagement of wadi systems. Legislative efforts are needed to enact laws and regulations, and to address the integration of all interrelated aspects of wadi management, including land resource use, water resources management, environmental protection and communitydevelopment. Attention must be given to recent trends in updating water legislation, whichare designed to abolish ownership rights that are not compatible with effective management of surface and ground water, as well as placing ownership of all water resources within the fold of State’s public property (Burchi, 1991).
As most countries containing wadi systems have established ministries and authorities, ofwhich many deal with different wadi related aspects, emphasis should be placed onenhancing coordination and cooperation and resolve possible conflict. The law, or separate legal instrument, should specify obligatory coordination and implementation mechanismsamong the different concerned legal bodies. The coordinating legislation should address this problem at all levels and clearly define power and responsibility of each involved authority(Abdulrazzak, 1998).
The establishment of a single Wadi Authority appears as an attractive solution for achievingcomprehensive wadi development with respect to natural resources investigation,development, management, monitoring and protection. Legislation is required to define type, legal power and jurisdiction of such an authority. The authority could have the power togrant permits, limit existing rights, impose limits on water withdrawal or diversion, andprohibit certain uses. Issues related to enforcement mechanisms need to be addressed.
One solution to the coordination problem could be the establishment of a Wadi Council, the members of which would be ministers and heads of authorities and agencies with sectoralresponsibility in wadi-related issues, as well as members from the private sector. The council may be given the authority to set objectives, allocate funds, approve plans and implementpolicies, including pollution control and environmental protection (Caponera, 1992). Inaddition to the Wadi Council, it might be suitable to establish a National Wadi Commission, which addresses wadi-related issues of technical and economic nature. The commission maybe either an advisory body, or an executing agency with some decision-making capacity.Further, at the regional level, a Wadi Management Authority may be appropriate, with the power to execute projects, set priorities regarding research and development, and help in the dissemination of information and technology. At the basin level, Wadi Users’ Associations, with a similar framework to water users’ associations, may be very effective (Abdulrazzak, 1998; Salman, 1997). However, as traditional water users’ associations are established to address agricultural irrigation issues, with members being farmers of the considered district,Wadi Users’ Associations could encompass a much broader spectrum of members, including, in addition to farmers, representatives of municipal water companies, as well as investors inthe fields of industry, tourism and land reclamation. Such associations would be particularlyuseful in the areas of administration of water rights, collection of water charges, as well as operation and maintenance.
152
Another feasible institutional framework could be the establishment of two distinctive typesof agencies, one regulatory and the other of executive nature. While the regulatory institution would act as a policy making body responsible for coordinating all wadi-related activities, the executive agency would be responsible for the actual implementation of policies and plans.A legal enactment would be needed to establish the link between the two bodies(Abdulrazzak, 1998).
9.5 CASE STUDY
There are many worthwhile experiences in most Arab Countries for better management ofwater resources in wadis, however, only one example will be demonstrated here. This case study is taken from Saudi Arabia, not simply due to the personal experiences of this paper’s authors with this example, but also because of its treatment of the wadi as a naturalenvironmental set-up that must be managed in a comprehensive, sustainable manner.
9.5.1 Wadis in Saudi Arabia
Throughout history, through to the present day, wadis in the Arabian Peninsula haverepresented an essential source of renewable water, necessary for food production anddomestic use, as well as sometimes being a source of natural hazards through catastrophic floods which result in the heavy loss of properties and lives. Therefore, efforts for rationalmanagement of these wadis have dated back thousands of years; including for example the famous Maarab dam in Yemen and Sesud dam of Al-Tayif in Saudi Arabia (Salih and Al-Fara, 1983).
The importance of these wadis has been well recognized and dealt with in modern SaudiArabia, starting with the comprehensive surveys commissioned by the Ministry ofAgriculture and Water in the sixties of this century, and followed by the representative basin study completed by Saudi Arabian Dames and Moore in the eighties for five wadis in South Western Saudi Arabia (Saudi Arabian Dames and Moore, 1988). Various studies wereinitiated by ARAMCO as early as 1936, and continued in the second half of this century, by various consulting agencies, universities and research centers (Sorman and Abdulrazzak et al, 1995; Sendil and Salih, 1984; Salih and Sendil, 1983; Abdulrazzak et al, 1995; and others).
As indicated in Table 9.1, the estimated volume of renewable surface water resources inSaudi Arabia, which is mainly wadi flow, varies in the literature between 2.0 to 3.2 billionmeter cube per year -representing 30-50% of the available renewable and non-conventionalwater of the country. The variation in the numerical figures is typical in this region, a matter that calls for urgent regional initiative on the assessment of this precious resource. Yet,whichever value is looked at in the table, undoubtedly wadi flows do represent an essentialsource of water in the Kingdom of Saudi Arabia.
For this reason, the Government of Saudi Arabia has directed special attention for rationalmanagement of this vital resource. Climatic and hydrologic characteristics of these wadis are regularly monitored through a network comprising 13 full automatic climatic stations, 65standard stations, 300 rainfall gauges, and 52 runoff stations (Al-Braythin, 1997).Furthermore, over 185 dams have been built across many wadis in the Kingdom for rational

153
management of these resources and with the specific objectives of storage, artificiallyrecharging groundwater, and/or flood control.
Table 9.1 - Renewable and Non-Conventional Water Resource in Saudi Arabia (million m3/year), From Mourits and Salih, 1997
Renewable Water Resources
NonConventional
Water Total % of Surface Water to Total
SurfaceWater
Ground
water
Overlap
Total Desalination and Re-
use
Reference
2000 - - - 1120 - - Al-Braythin (1997)
3210 2340 - 5550 895 6445 50 ACSAD (1997)
2200 2200 2000 2200 - - - Sarraf (1997)
2230 3550 - 6080 1012 7092 31 Roger and Lydon (1994)
9.5.2 Wadi Hanifah
Wadi Hanifah is certainly not the most attractive wadi in Saudi Arabia if viewed from the quantity of annual discharge or potential hazards from its floods, yet, it is one of the most known wadis in the Arabian Peninsula (Fig. 9.1). It is very difficult to say whether itsnotoriety comes from its connection with Riyadh, the capital of Saudi Arabia, or that Riyadh owes its development and importance to its physical presence within the vicinity of WadiHanifah’s catchment. The boundary of the catchment of Wadi-Hanifah, however, extendswell beyond Riyadh - starting from Sidus city in the North to Al-Hair city 115 km to the south - with an overall total area of about 4400 km2. Therefore, the city represents only a small portion of the wadi.
The city started to grow from a small urban settlement in the eastern side of the main wadicourse in 1930, continuing its growth through the years. Nowadays, it covers an appreciable portion of the central eastern side of the wadi, crossing its magnitude to the western side of the wadi, and extending eastward to cover a considerable portion of the neighboringcatchment of Wadi-Sulay. This vast urban development has resulted in severe impacts within the central and southern parts of the wadi, and led ultimately to timely and rationalmanagerial intervention from the High Commission of Riyadh - a semi governmentalauthority with great independence and strive for high quality results.
9.5.2.1 Climatic and hydrological characteristic of Wadi Hanifah
The climatic and hydrological characteristics of Wadi Hanifah have been studied by manysources in the related literature. Noteworthy amongst these are the contributions by Salih and Sendil (1984), Sendil and Salih (1984) and the unpublished reports of the High Commission

154
of Riyadh (1987-1999). The results from these studies were based on 14 climatic stations located within or close to the boundaries of Wadi Hanifah catchment area, with some of these stations dating back as far as 1965.
Figure 9.1 Location map of Wadi Hanifa
From these studies, the amount of rainfall over Wadi Hanifah catchment area was found to be very irregular both on a yearly and monthly basis. On average there are 6 to 8 rainfall events per year that are significant enough to produce runoff, concentrated during the five months from December to April. The mean annual rainfall for 25 years of record (1965-1989) was found to be 84.5 mm with a standard deviation exceeding 40 mm, a very large deviationindeed. The rainfall intensities are relatively high and for short duration. For example, it isestimated that in Riyadh, a 50-year storm of 10-minute duration will yield a rainfall intensity of 100 mm/hr, whereas a storm of the same frequency with 2-hour duration will yield only 15 mm/hr.
Mean air temperature ranges from a minimum of 6.4°C in winter to a maximum of 42.9°C in summer, based on 23 years of record; while monthly averages range from 14.1°C for January to 33.6°C for July. The annual average temperature is 24.6°C.

155
The dry climate of Riyadh leads to high evaporation losses. The total mean annualevaporation is estimated about 3429 mm, with a monthly average of 286 mm.Evapotranspiration estimates have been made by various researchers using differenttechniques and the results indicate a range of values between 3.5 mm/day in December and January, and 14.8 mm/day in July (High Commission, 1990).
Finding a relationship between rainfall and runoff in Wadi Hanifah has been a difficult task, tackled by many sources in the specific literature without having reached an acceptablemodel (SOGREAH, 1968; Salih and Sendil, 1983; High Commission of Arriyadh, 1987-1997). In the absence of regular and dependable historical measurement of runoff, most ofthese studies have relied on rainfall data and a few scattered stream flow measurements. The integrity of any data on surface flow has also been complicated by the heavy humanintervention in the Wadi, together with the building of about 8 dams across the main wadi course and its tributaries within the last thirty years. Further complications have marred this picture by forcing their presence since 1985 through the perennial surface flow resulting from the rising groundwater problem of Riyadh City. This perennial flow is derived from urbangroundwater augmented by discharges from storm drainage systems and de-wateringprojects. Downstream of the Northern Diversion Channel outfall, the wadi now carries anartificial base flow, varying in discharge between 50 to 500 thousand m3/day over a distance of about a hundred kilometers.
The relationship between flow in Wadi Hanifah and the rising water table in Riyadh City has been well studied by the High Commission of Riyadh. The wadi has, historically, been amajor source of recharge for the shallow aquifers that underlie Riyadh, particularly upstreamof the city. Since urbanization has progressed rapidly in the last few decades, the impact ofnatural flows in the wadi on groundwater levels in the city has been insignificant incomparison with other new man-made recharge components. The picture is now verycomplicated; while in the upper part of Wadi Hanifah (North of Riyadh) the wadi runoffcould still recharge neighboring aquifers within and beyond its channel, the picture withinRiyadh is quite the opposite. Groundwater and surface flows from the city boundary arenaturally or artificially diverted to the well-saturated alluvial bed of the wadi, creating theperennial flow mentioned above. To the south of the city, the aquifers within and beyond the wadi bed are greatly influenced by the quantity and level of perennial flow within that range.
9.5.2.2 Wadi Hanifah Management Plan
As mentioned previously, the High Commission of the Development of Arriyadh is anindependent governmental authority entrusted with planning and development of Riyadh Cityin a rational manner. Among the excellent tasks performed by this authority is its currentinvolvement with the preparation of a comprehensive and sustainable developmental plan for wadi Hanifah with great focus on environmental protection of the natural resources,ecosystems and cultural heritage of the wadi. This initiative has divided its involvement into two distinct tasks: the first one has included a crash programme with immediate actions to remove or halt environmental deterioration in the wadi, while the second task concentrated on elements related to the realization of the comprehensive plan. The crash programmecomprised an establishment of an effective sustainable monitoring system, cleaning of thewadi from piles of rubbish and illegal land use as well as treatment of cases of

156
environmentally harmful industrial activities. The comprehensive plan has been started withfew comprehensive studies on: water resources, land use, farming activities, land ownership, soil types, cultural and natural heritage sites and transportation and traffic systems in thewadi. These studies, together with the socio-economic aspects, have been integrated in a comprehensive sustainable developmental plan for the management of the wadi.
9.6 CONCLUSIONS
With limited resources and rapidly increasing demands, sustainability is becoming anincreasingly important, yet difficult goal to achieve in wadis. Integrated wadi resourcesmanagement, leading to better use of the resources to meet current and future demands, is seen as the answer to this challenge. A thorough understanding of the natural resourcesystem and detailed knowledge of its interactions with human activities, are vitalprerequisites, badly needed to make the management system work. Although management issues differ with different contexts, the underlying challenges remain the same – how toachieve sustainability in providing needed services to the expanding populations andeconomies that depend on wadi systems.
9.7 REFERENCES
Abdulrazzak, M., 1998. “Status of Water Legislation in the ESCWA Region:Implementation and Enforcement – A Regional Case Study”. Water LegislationEnforcement in Mediterranean Countries. Report of the Policy Dialogue held inGeneva. International Academy of the Environment, Geneva. MED-Branch Activity Reports and Publication Series, R4.
Abdulrazzak, M., A. Sorman, H. Onder and A. Al-Sari (1995), “Flood estimation and impact: Southwestern Region of Saudi Arabia”, Final report of KACSA project AR-10-51,King Abdulaziz City for Science and Technology, Riyadh, Saudi Arabia.
Abu Zeid, K. 1997. “Floods and Watershed Analysis”, in: CEDARE Chronicle March/April1997.
ACSAD 1997. “Water Resources and their utilization in the Arab Region”, in: SecondSymposium on Water resources and their utilization in the Arab Region,AFESD/ACSAD, 8-10 March 1997, Kuwait, (in Arabic).
Al-Braythin, M. 1997. “Water Resources in the Kingdom of Saudi Arabia”, in: SecondSymposium on Water resources and their utilization in the Arab Region,AFESD/ACSAD, 8-10 March 1997, Kuwait, (in Arabic).
Burchi, S., 1991. “Current Development Trends in the Law and Administration of WaterResources – A Comparative State of the Art Appraisal”. J. of Environmental Law, No. 3.

157
Caponera, D., 1992. “Principles of Water Law and Administration”. Book published by A. Balkema, Rotterdam, Netherlands.
Dixon, J. and L. Fallon, 1989. “The Concept of Sustainability – Origins, Extensions, and Usefulness for Policy”. Society and Natural Resources, 2(2).
FAO, 1994. “Water Harvesting for improved Agricultural Production”, Proceedings of theFAO Expert Consultation, Cairo, Egypt. 21-25 November 1993, Water Reports 3, Rome.
Hufschmidt, M. and K. Tejwani, 1993. “Integrated Water Resource Management-Meetingthe Sustainability Challenge”. Water Related Issues and Problems of the HumidTropics and Other Warm Humid Regions. IHP Humid Tropics Programme Series No. 5.
Hufschmidt, M., 1993. “Water Policies for Sustainable Development”. In A. Biswas, M. Jelali and G. Stout (ed.) Water for Sustainable Development in the 21st Century,Oxford University Press, Oxford, UK.
Khouri, J., 1995, “Water Resources Assessment in the Arab Region”, proceedings of the sixth
regional meeting of the IHP committees of the Arab Region, under publication,Amman, Jordan, 3 - 6 Dec., 1995.
Kowsar, A., 1997. Assessment of damages sustained by the Gareh Bygone Plain - Flood water spreading systems in the deluge of 1986, in: Proceedings of the 8th International Conference on Rainwater Catchment Systems, April 25 -29, 1997, Tehran, I.R. Iran, pages 113 - 117.
Leopold, L. B., 1990. “Ethos, Equity and Water Resources”. Environment 32 (2).
Loucks, D. P. and Gladwell J. S., 1999. Sustainability Criteria for Water Resource Systems.International Hydrology Series, UNESCO IHP, Cambridge University Press,Cambridge, UK.
Mourits, L. and A. Salih, 1997. “Wadi Hydrology and Water Resources Management”, in:Rain Water Management and Drought Mitigation in the Arab World, Rabat 9-13 June, Workshop Organized by ICARDA and ACSAD.

158
Movahed, K., 1997. “The effects of floodwater spreading project on population mobility in the Gareh Bygone Plain”, in: Proceedings of the 8th International Conference onRainwater Catchment Systems, April 25 -29, 1997, Tehran, I.R. Iran, pages 144 - 151.
Rogers, P., 1993. “Integrated Urban Water Resources Management”, Natural ResourcesForum, 16 (1).
Rogers P. and L. Lydon, 1994. “Water in the Arab World - Perspective and Prognoses”, Harvard University Press, Harvard, USA.
Salih, A., 1988. Arid Lands: “Evapotranspiration Under Extremely Arid Climates”, in: Water Resources Environmental, Civil Engineering Practice, Chapter 10, pp 305 - 324.
Salih, A. and T. Al-Fara, 1983. “Old systems of Irrigation in the Kingdom of Saudi Arabia”, in: International Conference of the History of Arab Sciences (Irrigation, Botany and Agriculture), Kuwait, December 1983.
Salih, A. and U. Sendil, 1984. “Evapotranspiration under Extremely Arid Climates”, in:Journal of Irrigation and Drainage Engineering, Vol. 110, No. 3, September 1984, pp. 289-303.
Salih, A., and A. Ali, 1992, “Water Scarcity and Sustainable Development”, Nature andResources, Vol. 28, No. 1, 44-48.
Salman, S., 1997. “The Legal Framework for Water Users’ Associations – A Comparative Study”. World Bank Technical Paper No. 360. The World Bank, Washington D.C.
Sarraf, S., 1997. “Water Resources in the Arab Countries: a Review”, in: SecondSymposium on Water resources and their utilization in the Arab Region,AFESD/ACSAD, 8-10 March 1997, Kuwait.
Saudi Arabian Dames and Moore, 1988. “Representative Basins Study”, Final Report toMinistry of Agriculture and Water, Riyadh, 84 Vols.
Sendil, U. and A. Salih, 1984. “Hydrology of an Arid Watershed in Saudi Arabia”, in:Proceedings of the fourth Congress of APD-IAHR, 11-13 September 1984, Thailand.
Serageldin, I., 1995, “Toward Sustainable Management of Water Resources”, The WorldBank, Washington D.C.

159
Wheater, H., A. Butler, E. Stewart and G. Hamilton, 1991. “A multivariate spatial-temporalmodel of rainfall in SW Saudi Arabia. I. Data characteristics and model formulation”, Journal of Hydrology, 125, pp. 175-199.
Wheater, H., 1997. “Wadi Hydrology: Process Response and Management Implications”, in: Proceedings of the UNESCO / NWRC / ACSAD Workshops on ‘Wadi Hydrology’ and ‘Groundwater Protection’, Cairo, Egypt 3-6 June 1996, IHP – V, TechnicalDocuments in Hydrology, No. 1, UNESCO Cairo Office, pages 1 - 13.
WMO and UNESCO, 1997. “Water Resources Assessment – Handbook for Review ofNational Capabilities”.
World Commission on Environment and Development, 1987. “Our Common Future”.Oxford University Press, Oxford, UK.
161
ABOUT EDITORS
PROFESSOR HOWARD S. WHEATER
Howard Wheater obtained a first class degree in Engineering Science from theUniversity of Cambridge and worked for Rolls-Royce as a fluid mechanics specialist before undertaking a PhD in Hydrology at Bristol University and joining the staff of Imperial College in 1978.
He holds the appointment of Professor of Hydrology at Imperial College and is Head of the Environmental and Water Resource Engineering Section of the Civil andEnvironmental Department and Director of the Hydrology postgraduate programme.He is the immediate past-President of the British Hydrological Society, a Fellow ofthe Institution of Civil Engineers, and was recently appointed to life membership ofthe International Water Academy (Oslo).
His research interests are in hydrological processes and modelling; wide-rangingapplications include surface and groundwater hydrology, water resources, waterquality and waste management. He has published extensively and academic awardsinclude prizes from the UK Institution of Civil Engineers, the British HydrologicalSociety and Queens’ College, Cambridge.
He has a wide international experience of flood, water resource and water qualitystudies, including the Middle East, Far East, Africa and South America, and recentlyacted as Counsel and Advocate for Hungary at the International Court of Justice,concerning the environmental impact of the GNBS Danube Dams. He has a particular interest in the Hydrology of Arid areas, and has worked in Oman, Saudi Arabia,Yemen, Jordan, Syria and Egypt, as well as Arizona. This has led to a large number of research publications and several key-note addresses at international meetings. He has contributed to the formation and implementation of UNESCO’s wadi hydrologyprogramme.
In the UK he is an advisor to the Government on Flood R and D and chairs the Natural Environment Research Council Review Group on Land and Water Resources Research. He recently initiated a £10 million UK research programme into Lowland Catchment Research (LOCAR), focussing on surface water-groundwater interactions. Current research includes spatial rainfall simulation, rainfall-runoff and surface water quality modelling, and flow and transport processes in the subsurface.

162
DR. RADWAN AL-WESHAH
Dr. Radwan A. Al-Weshah holds a B.S. in Civil Engineering from the University of Jordan in 1981 (Scholastic Evaluation: Excellent), and a M.S. in Water Resources and Irrigation in 1989 (Scholastic Evaluation: Excellent). He obtained a PhD from the University of Illinois in Urbana-Champaign, USA in 1993 (GPA 5.00 out 5.00).
Dr. Al-Weshah is an associate professor of hydrology and water resources at the Department of Civil Engineering, University of Jordan in Amman (on leave). Hewas an assistant director at the Water and Environment Research and Study Centre (WERSC), the University of Jordan. Dr. Al-Weshah served as a technical advisor to some governmental agencies, research institutions, and a technical consultant to localand international consulting firms in Jordan and abroad in the area of water resources, hydraulics and hydrology. His work and research covers areas of water management, surface hydrology, hydrologic modelling, flood and drought studies, design of waternetworks and conveyance system, design of hydraulic structures, wadi hydrology,artificial groundwater recharge and water harvesting projects.
Dr. Al-Weshah gained a wide international experience in the area of water resources in the Middle East. He was the co-chairman of the International Symposium onWater Resources in the Middle East held at the University of Illinois at Urbana-Champaign in 1993. Dr. Al-Weshah was elected and appointed by the NationalResearch Council of the U.S. Academy of Sciences as a member of the committee on "Sustainable Water Supply in the Middle East". He is a co-author of the international book Water for Future published by the United State National Academy Press in1999. He is also a co-editor and a contributor to the UNESCO-IHP technicaldocument on Wadi Hydrology. Dr. Al-Weshah is a reviewer for the of the WaterInternational Journal of the International Water Resources Association (IWRA),Water Resources Bulletin of American Water Resources Association (AWRA) and Journal of the Hydraulics Division of American Society of Civil Engineers (ASCE) and many other specialized journals in the Middle East region. He is an advisoryboard member of the Rosenberg Water Forum on Water Policy. Dr Al-Weshah also worked as a senior hydrologist in USA. He gained a valuable experience in the area of hydrology, hydraulics, water resources, and environmental impact assessment. He was a visiting researcher at the Illinois State Water Survey and the University ofIllinois before he joins the University of Jordan.
Mr. Al-Weshah joined UNESCO as a regional hydrologist and a program specialist in Cairo Office, Egypt in June 2000. He is responsible in planning, executing andimplementing the IHP in the Arab Region. He duties include planning projects,writing proposals for external funding, preparing work plans, reviewing the executionand implementation of IHP activities, and coordinating the IHP activities with local,regional and international parties. IHP activities cover training, workshops andconferences, studies and research in the area of water resources, surface waterhydrology, groundwater hydrology, sediment transport, and water and ecosystem.