Embed Size (px)
Citation preview

June 30, 2014
INTERIM FINANCIAL REPORT
CONSOLIDATED FINANCIAL STATEMENTS

2 CAPGEMINI JUNE 30, 2014
CONTENTS
Financial highlights ..................................................................................................................................................................3
Statutory auditors’ reports on the interim financial information .............................................................................................4
Interim financial review ...........................................................................................................................................................5
Condensed interim consolidated financial statements for the half-year ended June 30, 2014 ............................................... 10
Declaration by the person responsible for the interim financial report .................................................................................. 23
CAPGEMINI JUNE 30, 2014 3
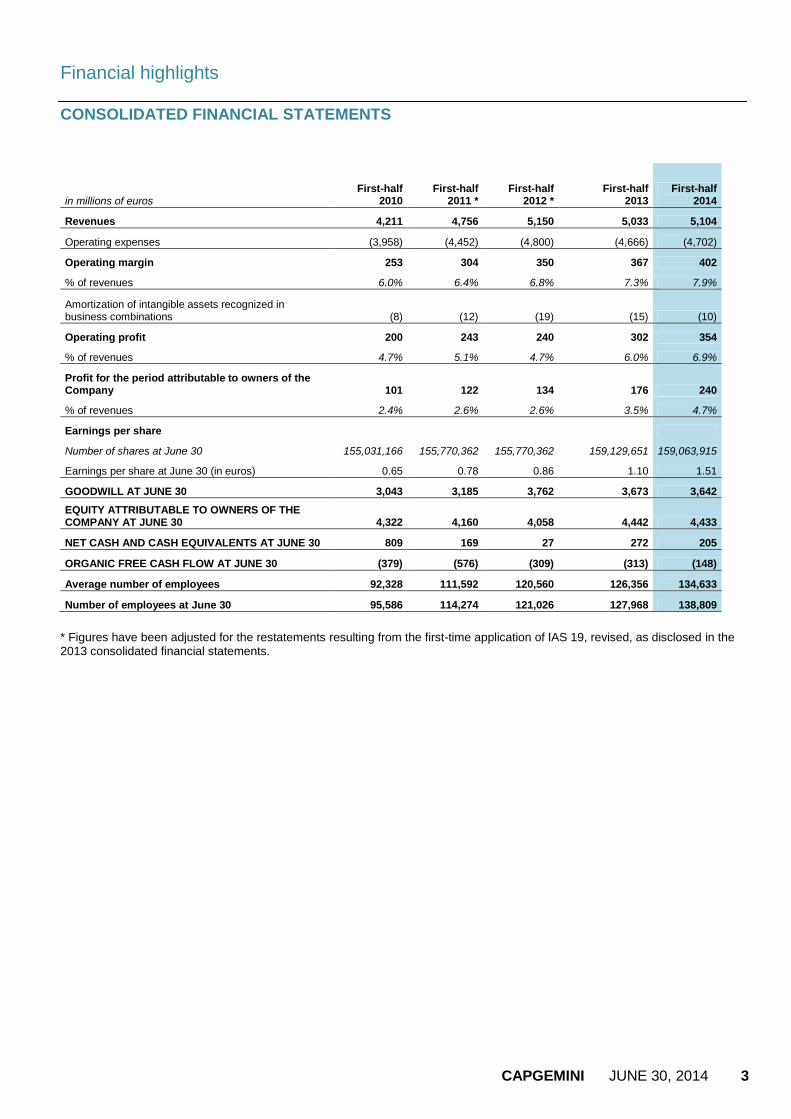
Financial highlights
CONSOLIDATED FINANCIAL STATEMENTS
in millions of euros First-half
2010 First-half
2011 * First-half
2012 * First-half
2013 First-half
2014
Revenues 4,211 4,756 5,150 5,033 5,104
Operating expenses (3,958) (4,452) (4,800) (4,666) (4,702)
Operating margin 253 304 350 367 402
% of revenues 6.0% 6.4% 6.8% 7.3% 7.9%
Amortization of intangible assets recognized in business combinations (8) (12) (19) (15) (10)
Operating profit 200 243 240 302 354
% of revenues 4.7% 5.1% 4.7% 6.0% 6.9%
Profit for the period attributable to owners of the Company 101 122 134 176 240
% of revenues 2.4% 2.6% 2.6% 3.5% 4.7%
Earnings per share
Number of shares at June 30 155,031,166 155,770,362 155,770,362 159,129,651 159,063,915
Earnings per share at June 30 (in euros) 0.65 0.78 0.86 1.10 1.51
GOODWILL AT JUNE 30 3,043 3,185 3,762 3,673 3,642
EQUITY ATTRIBUTABLE TO OWNERS OF THE COMPANY AT JUNE 30 4,322 4,160 4,058 4,442 4,433
NET CASH AND CASH EQUIVALENTS AT JUNE 30 809 169 27 272 205
ORGANIC FREE CASH FLOW AT JUNE 30 (379) (576) (309) (313) (148)
Average number of employees 92,328 111,592 120,560 126,356 134,633
Number of employees at June 30 95,586 114,274 121,026 127,968 138,809
* Figures have been adjusted for the restatements resulting from the first-time application of IAS 19, revised, as disclosed in the 2013 consolidated financial statements.
4 CAPGEMINI JUNE 30, 2014
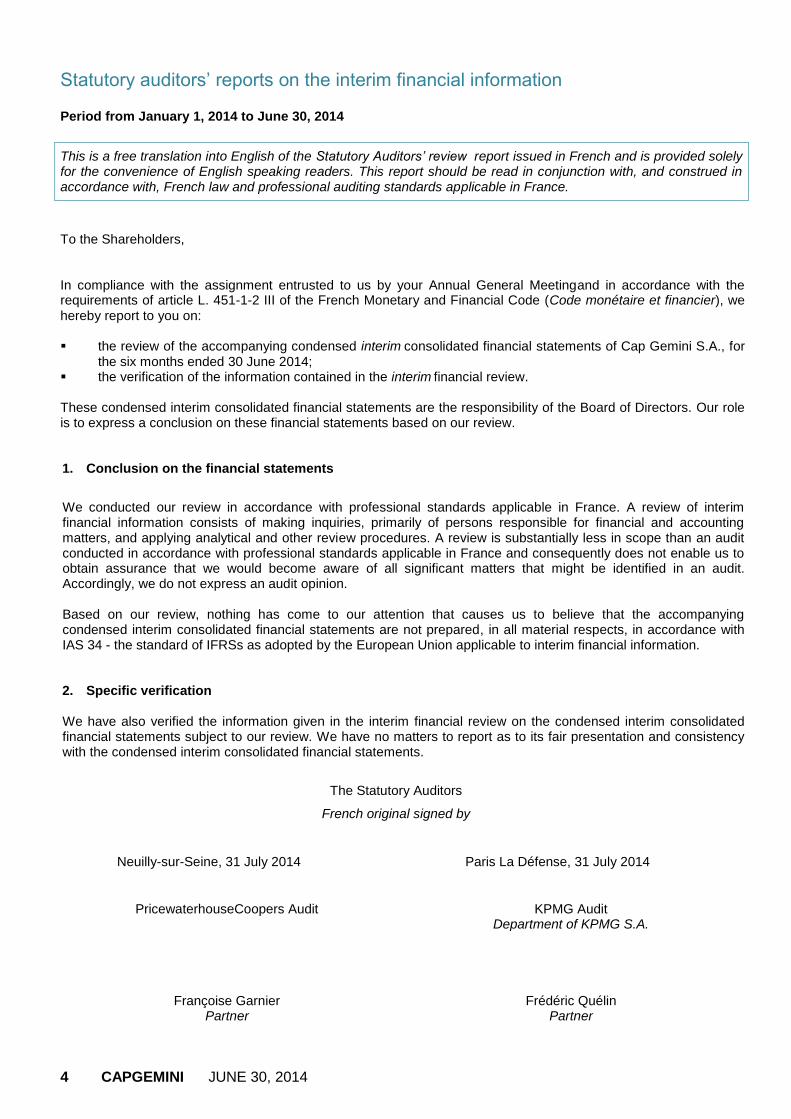
Statutory auditors’ reports on the interim financial information Period from January 1, 2014 to June 30, 2014
This is a free translation into English of the Statutory Auditors’ review report issued in French and is provided solely for the convenience of English speaking readers. This report should be read in conjunction with, and construed in accordance with, French law and professional auditing standards applicable in France.
To the Shareholders, In compliance with the assignment entrusted to us by your Annual General Meetingand in accordance with the requirements of article L. 451-1-2 III of the French Monetary and Financial Code (Code monétaire et financier), we hereby report to you on: the review of the accompanying condensed interim
consolidated financial statements of Cap Gemini S.A., for
the six months ended 30 June 2014; the verification of the information contained in the interim
financial review.
These condensed interim consolidated financial statements are the responsibility of the Board of Directors. Our role is to express a conclusion on these financial statements based on our review. 1. Conclusion on the financial statements
We conducted our review in accordance with professional standards applicable in France. A review of interim financial information consists of making inquiries, primarily of persons responsible for financial and accounting matters, and applying analytical and other review procedures. A review is substantially less in scope than an audit conducted in accordance with professional standards applicable in France and consequently does not enable us to obtain assurance that we would become aware of all significant matters that might be identified in an audit. Accordingly, we do not express an audit opinion. Based on our review, nothing has come to our attention that causes us to believe that the accompanying condensed interim consolidated financial statements are not prepared, in all material respects, in accordance with IAS 34 - the standard of IFRSs as adopted by the European Union applicable to interim financial information. 2. Specific verification We have also verified the information given in the interim financial review on the condensed interim consolidated financial statements subject to our review. We have no matters to report as to its fair presentation and consistency with the condensed interim consolidated financial statements.
The Statutory Auditors
French original signed by
Neuilly-sur-Seine, 31 July 2014 Paris La Défense, 31 July 2014
PricewaterhouseCoopers Audit KPMG Audit
Department of KPMG S.A.
Françoise Garnier Frédéric Quélin Partner Partner

CAPGEMINI JUNE 30, 2014 5
Interim financial review
FIRST-HALF 2014 HIGHLIGHTS
In an economic context marked by only slightly positive activity growth in continental Europe, the Group successfully continued to improve its operating profitability. Revenues for the first-half 2014 totaled €5,104 million, up 1.4% (and 2.6% like-for-like) on the first-half 2013. Foreign exchange impacts were unfavorable over the period and weighed 1.9 points on half-year growth, primarily due to the depreciation against the euro of the US, Australian and Canadian dollars and the Brazilian real, partially offset by the appreciation of the British pound. The integration of Euriware had a favorable impact of 0.7 points on reported growth for the first-half. Like-for-like growth remained strong in the Asia-Pacific and Latin America area (+9.1%) and North America (+6.1%), but is only slightly positive across Europe as a whole (+1.1%). The second quarter nonetheless enjoyed an upturn in trends, with Group revenues rising 3% like-for-like. An analysis of new orders confirms the overall improvement in demand: bookings totaled €5,653 million in the first-half 2014, up
20% on the same period in 2013. The Group operating margin for the first-half 2014 is €402 million or 7.9% of revenues (representing an increase of 0.6 points
on the first-half 2013). This result supports the forecast increase for 2014 announced at the beginning of the year of between 0.3 and 0.5 points. Restructuring costs recorded a further decrease to €19 million compared with €31 million in the first-half 2013, already an all-time low. On this basis, operating profit for the half-year reached €354 million, up 17% on the same period last year. After a net financial expense of €34 million and an income tax expense of €91 million, profit for the half-year is €229 million compared with €169 million for the first-half 2013 and profit for the period attributable to owners of the Company is €240 million compared with €176 million for the first-half 2013, an increase of over 36%. Since January 1, the Group has announced several contracts, the launch of new services and partnerships, bearing witness to the growing success of the implementation of Capgemini’s strategy:
► Launch of a new global service line “Digital Customer Experience”, to help organizations make the most of digital opportunities in their customer relationship;
► Signature of a partnership with VMWare to develop new cloud orchestration solutions;
► Signature of a contract for more than €40 million with Lloyd's Register, the oldest British maritime classification company, for the performance of new infrastructure and application management services;
► Signature with AREVA of an IT services agreement worth €1 billion over 10 years;
► Signature of a BPO contract with Honeywell to transform its accounting and finance function;
► Extension of the partnership with Cloudera to help organizations implement their Big Data initiatives;
► Signature of an application services agreement with Office Dépot.
Following a dividend payment of €1.10 per share (€174 million) and in spite of the seasonal increase in working capital requirements, net cash and cash equivalents remains positive at €205 million at the end of June 2014. Group organic free cash
flow is -€148 million in the first-half 2014, compared with -€313 million in the first-half 2013. Organic free cash flow is generally negative in the first-half of the year due to the seasonality of certain payments (primarily bonuses). The improvement noted this year is due to the increase in profitability and the reduction in interest payments, as well as ongoing working capital requirement management efforts. The Group headcount totals 138,809 at June 30, 2014, up on June 30, 2013 (127,968) and December 31, 2013 (131,430).
The attrition rate of 16.3% observed during the first half is unchanged on the first-half 2013. 45% of employees are now located off-shore.

6 CAPGEMINI JUNE 30, 2014
OPERATIONS BY GEOGRAPHIC AREA
North America revenues (20.3% of Group revenues) remained practically stable due to the impact of the depreciation of the US
and Canadian dollars. Like-for-like growth was 6.1%. The first-half 2014 therefore confirmed the return to growth in this area which commenced in the second-half 2013. The operating margin rate is 11.9% and remains close to the highly satisfactory level attained in 2013, bearing witness to the success of the offshore strategy of the Group, which adapted its production model in response to client demand in this market where it is now a major player. The United Kingdom and Ireland area (21.2% of Group revenues) reported a 7% increase in revenues and a like-for-like
increase of 3.3% for the half-year. This upturn was achieved in a context of renewed investment in the commercial sector, while the public sector, which still accounts for 60% of business in this area, contracted slightly. The operating margin rate increased 1.8 points on the first-half 2013 to 9.9%. France (22.4% of Group revenues) reported an increase of 4.7% in revenues. Adjusted for the impact of the Euriware transaction
on the consolidation scope, like-for-like growth is 1.5%. Given the difficult nature of the French market, this increase once again bears witness to the improved competitive position of the Group in France. The operating margin rate fell 0.5 points on the first-half 2013 to 6.7%. Benelux (10.3% of Group revenues) reported a slight 2.1% decrease in activity. The contraction was limited to 1.2% in the
second quarter. The economic context was particularly unfavorable in this area in the first-half 2014. The operating margin rate is 8.9% (8.2% in the first-half 2013), confirming the return to profitability of this area following the measures taken at the end of 2012. The Rest of Europe (18.1% of Group revenues) contracted 2.1% and only 0.1% like-for-like. The near stability of revenues
reflects differences in economic momentum between the markets of Northern and Southern Europe. The operating margin rate increased 1.7 points in one year to 7.9%, with the Group demonstrating in this area the effectiveness of offshore activities in increasing profitability despite a weak market context. Activity in the Asia-Pacific and Latin America area (7.7% of Group revenues) fell 5.7% due to the weakness of the main
currencies in this area and particularly the Brazilian real. Revenues rose 9.1% like-for-like. Latin America continued to benefit from the ramp-up of a major contract signed in 2012. The operating margin rate remains limited at 2.7%, an improvement of 0.1 points on the first-half 2013. The seasonality of the operating margin is more marked in this area and the Group expects a higher margin rate in the second-half.
% of revenues H1 2014
Growth on H1 2013 Operating margin rate
Published figures
Like-for-like H1 2013 H1 2014
North America 20.3% 0.3% 6.1% 12.3% 11.9%
United Kingdom and Ireland 21.2% 7.0% 3.3% 8.1% 9.9%
France 22.4% 4.7% 1.5% 7.2% 6.7%
Benelux 10.3% -2.1% -2.1% 8.2% 8.9%
Rest of Europe 18.1% -2.1% -0.1% 6.2% 7.9%
Asia-Pacific and Latin America 7.7% -5.7% 9.1% 2.6% 2.7%
TOTAL 100.0% 1.4% 2.6% 7.3% 7.9%

CAPGEMINI JUNE 30, 2014 7
OPERATIONS BY BUSINESS SEGMENT
Growing demand from clients to group application development and maintenance services in a single contract led the Group to review the presentation of its segment reporting by business. The distinction between technology services, which include application development and outsourcing services, which include the maintenance activity, has therefore become artificial. Accordingly, with effect from January 1, 2014, segment reporting by business is presented as follows:
► Consulting Services, which help to enhance the performance of organizations based on in-depth knowledge of client industries and processes,
► Local Professional Services, which provide assistance and support to internal IT teams within client companies,
► Application Services, which devise, develop, implement and maintain IT applications covering the Group’s system integration and application maintenance activities.
► Other Managed Services, which integrate, manage and/or develop either fully or partially, client’s IT Infrastructure systems (or that of a group of clients), transaction services, on demand services and/or business activities (Business Process Outsourcing, BPO).
% of revenues H1 2014
Growth on H1 2013*
Operating margin rate
H1 2013 H1 2014
CONSULTING SERVICES 4.4% -4.7% 7.7% 7.0%
LOCAL PROFESSIONAL SERVICES 15.2% 0.6% 9.1% 8.2%
APPLICATION SERVICES 56.4% 2.2% 8.4% 9.3%
OTHER MANAGED SERVICES 24.0% 6.5% 6.0% 7.3%
* like-for-like Consulting Services (4.4% of Group revenues) remains the Group business most affected by the economic environment in the
first-half 2014 (4.7% contraction in activities, like-for-like). Growth in Germany and France, which enjoyed an upturn following the contraction reported in 2013, proved insufficient to offset the fall in other geographic areas. The utilization rate was 65% in the first quarter and 69% in the second quarter. The operating margin rate fell 0.7 points on the first-half 2013 to 7%. Local Professional Services (Sogeti, 15.2% of Group revenues) reported a limited 0.6% increase in revenues, like-for-like. This
overall stability was the result of growth in North America and the United Kingdom, offset by a downturn in France and Benelux. The operating margin rate slipped 0.9 points on the first-half 2013 to 8.2%. Application Services (56.4% of Group revenues) reported 2.2% growth in revenues, like-for-like. The position is, however, more
contrasted across geographic areas: the Asia-Pacific and Latin America area remained extremely dynamic, while North America, the United Kingdom and Ireland grew and Continental Europe as a whole contracted. The operating margin rate increased 0.9 points on the first-half 2013 to 9.3%. Other Managed Services (24% of Group revenues) reported like-for-like activity growth of 6.5% on the first-half 2013. All
geographic areas, with the exception of Germany and Central Europe contributed to this growth. The operating margin rate increased significantly by 1.3 points on the first-half 2013 to 7.3%, boosted by the improved profitability of the infrastructure services business.

8 CAPGEMINI JUNE 30, 2014
ANALYSIS OF THE CONDENSED INTERIM CONSOLIDATED FINANCIAL STATEMENTS FOR THE HALF-YEAR ENDED JUNE 30, 2014
Consolidated Income Statement Revenues for first-half 2014 totaled €5,104 million, compared with €5,033 million for first-half 2013, up 1.4% (2.6% like-for-like). The operating margin for the first six months of 2014 was €402 million, compared with €367 million for the same period in 2013,
representing a margin rate of 7.9% compared with 7.3%. Other operating income and expenses represented a net expense of €38 million in the first-half 2014, with the improvement on
the first-half 2013 (€50 million) mainly due to further significant reductions in restructuring costs from €31 million to €19 million. Operating profit is therefore €354 million for the half-year ended June 30, 2014 (6.9% of revenues) compared with €302 million
for the first-half 2013 (6.0% of revenues), representing a further 0.9 point improvement in operating profitability. The net financial expense totaled €34 million in the first-half 2014, compared to €53 million on the same period in 2013. This
decrease on the first-half 2013 was mainly due to the fall in interest on borrowings following the repurchase, conversion and redemption of the “OCEANE 2009” bond issue convertible/exchangeable into new or existing Cap Gemini shares in the second-half 2013. The income tax expense for the first-half 2014 is €91 million, compared with €80 million for the first-half 2013 and the effective
tax rate for the first-half 2014 is 28.6% (32.1% in the first-half 2013). Profit for the period attributable to owners of the Company is therefore €240 million for the half-year ended June 30, 2014, a
surge of 36.6% on the profit of €176 million for the first-half 2013. Earnings per share is therefore €1.51 based on 159,063,915 shares outstanding at June 30, 2014, compared with €1.10 based on 159,129,651 shares outstanding at June 30, 2013.
Consolidated Statement of Financial Position Consolidated equity attributable to owners of the Company totaled €4,433 million at June 30, 2014, down €25 million
compared with December 31, 2013. This decrease was mainly due to:
► the payment of dividends to shareholders (€174 million);
► a share capital reduction following the cancellation of treasury shares (€65 million);
► the cancellation of treasury shares (€38 million);
partially offset by the recognition of profit for the period of €240 million. Non-current assets totaled €5,502 million at June 30, 2014. This increase of €65 million on December 31, 2013 mainly reflects:
► a €41 million net increase in goodwill, primarily due to positive foreign currency translation adjustments of €37 million on goodwill denominated in foreign currencies;
► a €18 million increase in other non-current assets primarily due to the fair value remeasurement of cash flow hedging derivative instruments contracted pursuant to the central management of foreign exchange risk, recognized through equity (at December 31, 2013, the fair value of these instruments was recorded in “Other non-current liabilities”).
Non-current liabilities excluding long-term borrowings amounted to €1,494 million at June 30, 2014. This €89 million increase
on December 31, 2013 is mainly attributable to the following movements:
► a €103 million increase in provisions for pensions and other post-employment benefits chiefly due to a net actuarial loss resulting from the decrease in discount rates in Canada and the United Kingdom between December 31, 2013 and June 30, 2014;
► a €28 million decrease in other non-current liabilities primarily due to the fair value remeasurement of cash flow hedging derivative instruments contracted pursuant to the central management of foreign exchange risk, recognized through equity (these instruments are recognized in “Other non-current assets” at June 30, 2014).
Operating receivables, comprising accounts and notes receivable, totaled €2,811 million at June 30, 2014 compared with
€2,694 million at June 30, 2013 and €2,587 million at December 31, 2013. Accounts receivable net of advances from clients and amounts billed in advance totaled €2,049 million at June 30, 2014, compared with €1,993 million one year earlier and €1,800 million at December 31, 2013. Accounts and notes payable, consisting mainly of accounts payable and related accounts, amounts due to employees and
accrued taxes other than on income, totaled €2,189 million at June 30, 2014, compared with €2,078 million at June 30, 2013 and €2,293 million at December 31, 2013.
CAPGEMINI JUNE 30, 2014 9
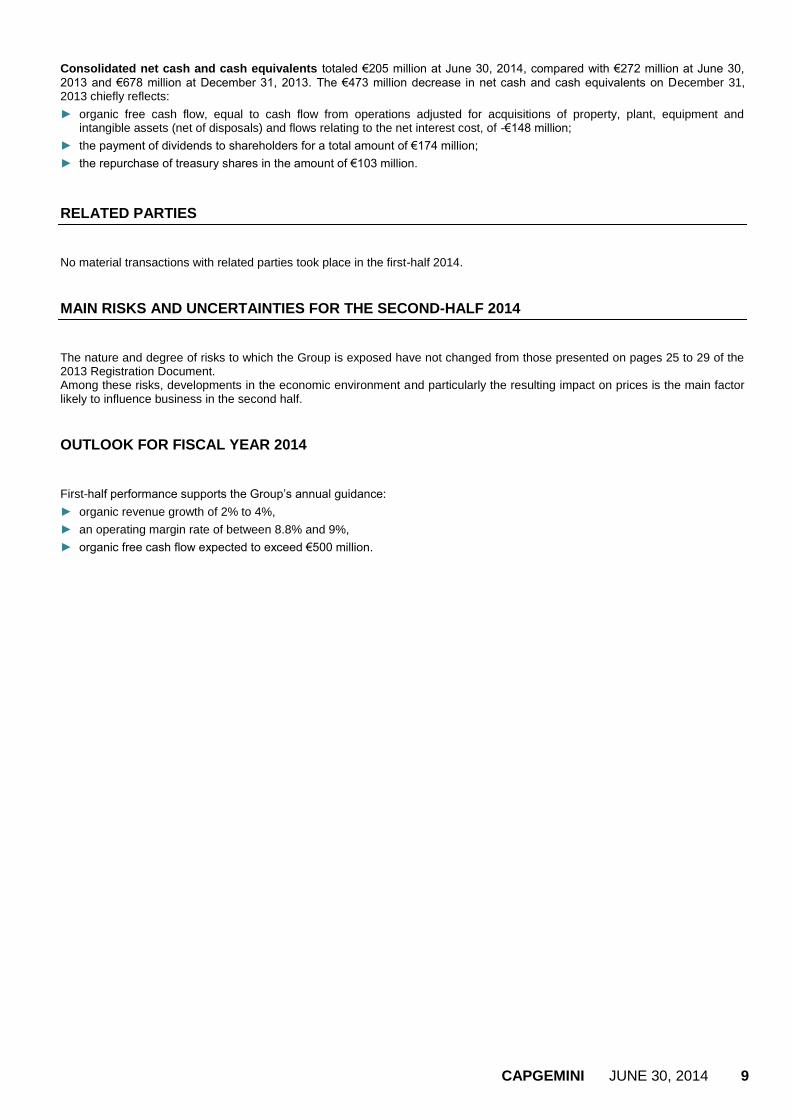
Consolidated net cash and cash equivalents totaled €205 million at June 30, 2014, compared with €272 million at June 30,
2013 and €678 million at December 31, 2013. The €473 million decrease in net cash and cash equivalents on December 31, 2013 chiefly reflects:
► organic free cash flow, equal to cash flow from operations adjusted for acquisitions of property, plant, equipment and intangible assets (net of disposals) and flows relating to the net interest cost, of -€148 million;
► the payment of dividends to shareholders for a total amount of €174 million;
► the repurchase of treasury shares in the amount of €103 million.
RELATED PARTIES
No material transactions with related parties took place in the first-half 2014.
MAIN RISKS AND UNCERTAINTIES FOR THE SECOND-HALF 2014
The nature and degree of risks to which the Group is exposed have not changed from those presented on pages 25 to 29 of the 2013 Registration Document. Among these risks, developments in the economic environment and particularly the resulting impact on prices is the main factor likely to influence business in the second half.
OUTLOOK FOR FISCAL YEAR 2014
First-half performance supports the Group’s annual guidance:
► organic revenue growth of 2% to 4%,
► an operating margin rate of between 8.8% and 9%,
► organic free cash flow expected to exceed €500 million.

10 CAPGEMINI JUNE 30, 2014
Condensed interim consolidated financial statements for the half-year ended June 30, 2014
CONSOLIDATED INCOME STATEMENT
2013 First-half 2013 First-half 2014
in millions of euros Notes Amount % Amount % Amount %
Revenues 3 10,092 100 5,033 100 5,104 100
Cost of services rendered 4 (7,636) (75.7) (3,868) (76.8) (3,868) (75.8)
Selling expenses 4 (807) (8.0) (410) (8.2) (436) (8.5)
General and administrative expenses 4 (792) (7.9) (388) (7.7) (398) (7.8)
Operating margin 857 8.5 367 7.3 402 7.9
Amortization of intangible assets recognized in business combinations (30) (0.3) (15) (0.3) (10) (0.2)
Other operating income and expense 5 (107) (1.1) (50) (1.0) (38) (0.7)
Operating profit 720 7.1 302 6.0 354 6.9
Net finance costs 6 (47) (0.5) (25) (0.5) (8) (0.2)
Other financial income and expense 6 (55) (0.6) (28) (0.6) (26) (0.5)
Net financial expense (102) (1.0) (53) (1.1) (34) (0.7)
Income tax expense
(182) (1.8) (80) (1.6) (91) (1.8)
Share of profit of associates
(1) (0.0) - - - -
PROFIT FOR THE PERIOD
435 4.3 169 3.4 229 4.5
Attributable to:
Owners of the Company 442 4.4 176 3.5 240 4.7
Non-controlling interests (7) (0.1) (7) (0.1) (11) (0.2)
EARNINGS PER SHARE
Average number of shares outstanding during the period
158,147,868 158,229,410 158,477,956
Basic earnings per share (in euros)
2.80 1.11 1.51
Number of shares outstanding at the period end
160,317,818 159,129,651 159,063,915
Earnings per share at the period end (in euros)
2.76 1.10 1.51
Diluted average number of shares outstanding
179,596,733 178,103,162 170,236,818
Diluted earnings per share (in euros)
2.59 1.05 1.43

CAPGEMINI JUNE 30, 2014 11
STATEMENT OF INCOME AND EXPENSE RECOGNIZED IN EQUITY
in millions of euros 2013 First-half
2013 First-half
2014
Actuarial losses and gains on defined benefit pension plans, net of tax (98) 70 (50)
Items that will not be reclassified to profit or loss (98) 70 (50)
Remeasurement of hedging derivatives, net of tax 2 (14) 25
Translation adjustments (162) (40) 30
Items to be reclassified to profit or loss (160) (54) 55
TOTAL INCOME AND EXPENSE RECOGNIZED IN EQUITY (258) 16 5
Profit for the period (reminder) 435 169 229
If this income and expense recognized in equity had been recognized in profit or loss, profit for the period would have been as follows: 177 185 234
Attributable to:
Owners of the Company 191 195 244
Non-controlling interests (14) (10) (10)

12 CAPGEMINI JUNE 30, 2014
CONSOLIDATED STATEMENT OF FINANCIAL POSITION
in millions of euros Notes June 30, 2013 December 31, 2013 June 30, 2014
Goodwill
3,673 3,601 3,642
Intangible assets 177 166 164
Property, plant and equipment 512 494 499
Deferred taxes 1,027 1,023 1,026
Other non-current assets
89 153 171
Total non-current assets 5,478 5,437 5,502
Accounts and notes receivable 8 2,694 2,587 2,811
Current tax assets 75 69 104
Other current receivables 399 368 473
Cash management assets 9 77 77 79
Cash and cash equivalents 9 1,425 1,638 1,254
Total current assets
4,670 4,739 4,721
TOTAL ASSETS
10,148 10,176 10,223
in millions of euros Notes June 30, 2013 December 31, 2013 June 30, 2014
Share capital
1,273 1,283 1,273
Additional paid-in capital 2,900 2,930 2,875
Retained earnings and other reserves 93 (197) 45
Profit for the period
176 442 240
Equity (attributable to owners of the Company) 4,442 4,458 4,433
Non-controlling interests
37 33 23
Total equity 4,479 4,491 4,456
Long-term borrowings 9 569 906 909
Deferred taxes 154 158 165
Provisions for pensions and other post-employment benefits 10 1,053 962 1,065
Non-current provisions 23 16 23
Other non-current liabilities 11 227 269 241
Total non-current liabilities 2,026 2,311 2,403
Short-term borrowings and bank overdrafts 9 664 133 219
Accounts and notes payable 2,078 2,293 2,189
Advances from customers and billed in advance 8 595 684 655
Current provisions 54 42 51
Current tax liabilities 79 58 71
Other current payables 11 173 164 179
Total current liabilities 3,643 3,374 3,364
TOTAL EQUITY AND LIABILITIES
10,148 10,176 10,223

CAPGEMINI JUNE 30, 2014 13
CONSOLIDATED STATEMENT OF CASH FLOWS
in millions of euros Notes 2013 First-half
2013 First-half
2014
Profit for the period attributable to owners of the Company 442 176 240
Non-controlling interests (7) (7) (11)
Depreciation, amortization and impairment of fixed assets 208 106 99
Change in provisions * (284) (11) 8
Losses on disposals of assets 6 1 4
Expenses relating to share grants 20 8 12
Net finance costs 6 47 25 8
Income tax expense
182 80 91
Unrealized losses on changes in fair value and other 21 2 -
Cash flows from operations before net finance costs and income tax (A) 635 380 451
Income tax paid (B) (124) (68) (48)
Change in accounts and notes receivable and advances from customers and amounts billed in advance (58) (210) (161)
Change in capitalized costs on projects 1 - 1
Change in accounts and notes payable 39 (41) (55)
Change in other receivables/payables (103) (298) (286)
Change in operating working capital (C) (121) (549) (501)
NET CASH USED lN (FROM) OPERATING ACTIVITIES (D=A+B+C) 390 (237) (98)
Acquisitions of property, plant and equipment and intangible assets (143) (65) (64)
Proceeds from disposals of property, plant and equipment and intangible assets 3 1 3
(140) (64) (61)
Cash inflows/outflows on business combinations net of cash and cash equivalents acquired (11) (4) 3
Other cash outflows (net) (1) (3) (2)
(12) (7) 1
NET CASH USED IN INVESTING ACTIVITIES (E) (152) (71) (60)
Proceeds from issues of share capital subscribed by non-controlling interests 19 20 -
Dividends paid (157) (157) (174)
Net proceeds/payments relating to transactions on Cap Gemini shares (28) (70) (103)
Proceeds from borrowings 406 7 73
Repayments of borrowings (747) (30) (33)
Interest paid 6 (56) (24) (4)
Interest received 6 26 12 14
NET CASH USED IN FINANCING ACTIVITIES (F) (537) (242) (227)
NET DECREASE lN CASH AND CASH EQUIVALENTS (G=D+E+F) (299) (550) (385)
Effect of exchange rate movements on cash and cash equivalents (H) (88) (45) 7
CASH AND CASH EQUIVALENTS AT BEGINNING OF PERIOD (I) 9 2,016 2,016 1,629
CASH AND CASH EQUIVALENTS AT END OF PERIOD (G+H+I) 9 1,629 1,421 1,251
* Including the €235 million exceptional contribution for the accelerated financing of the funding shortfall on a pension plan in the United Kingdom.

14 CAPGEMINI JUNE 30, 2014
CONSOLIDATED STATEMENT OF CHANGES IN EQUITY
in millions of euros
Number of shares
Share capital
Additional paid-in capital
Treasury shares
Consolidated retained
earnings and other
reserves
Total income and expense recognized in equity
Equity (attributable to owners
of the Company)
Non-controlling interests*
Total equity
Translation adjustments
Other
At January 1, 2013 161,770,362 1,294 2,976 (92) 1,041 (106) (631) 4,482 36 4,518
Dividends paid out for 2012 - - - - (157) - - (157) - (157)
Incentive instruments and employee share ownership 285,000 2 - - 8 - - 10 - 10
Adjustments to the put option granted to minority shareholders and changes in percentage interest - - - - (13) - - (13) 11 (2)
Elimination of treasury shares - - - (70) - - - (70) - (70) Share capital reduction by cancellation of treasury shares (2,925,711) (23) (77) 100 - - - - - -
Transactions with shareholders (2,640,711) (21) (77) 30 (162) - - (230) 11 (219)
Income and expense recognized in equity
- - - - - (37) 56 19 (3) 16
Profit for the period - - - - 176 - - 176 (7) 169
Other - - - - (5) - - (5) - (5)
At June 30, 2013 159,129,651 1,273 2,899 (62) 1,050 (143) (575) 4,442 37 4,479
Incentive instruments and employee share ownership - - - - 9 - - 9 - 9
Adjustments to the put option granted to minority shareholders and changes in percentage interest - - - - (4) - - (4) - (4)
Repurchase and conversion of
“OCEANE 2009” bonds 1,188,167 10 31 50 (118) - - (27) - (27)
Derivative instruments on Cap Gemini shares, net of tax - - - - 34 - - 34 - 34
Elimination of treasury shares - - - 3 - - - 3 - 3
Transactions with shareholders 1,188,167 10 31 53 (79) - - 15 - 15
Income and expense recognized in equity
- - - - - (118) (152) (270) (4) (274)
Profit for the period - - - - 266 - - 266 - 266
Other - - - - 5 - - 5 - 5
At December 31, 2013 160,317,818 1,283 2,930 (9) 1,242 (261) (727) 4,458 33 4,491
Dividends paid out for 2013 - - - - (174) - - (174) - (174)
Incentive instruments and employee share ownership - - - - 11 - - 11 - 11
Adjustments to the put option granted to minority shareholders and changes in percentage interest
- - - - (1) - - (1) - (1)
Tax on derivative instruments on Cap Gemini shares - - - - (2) - - (2) - (2)
Elimination of treasury shares - - - (103) - - - (103) - (103)
Share capital reduction by cancellation of treasury shares (1,253,903) (10) (55) 65 - - - - - -
Transactions with shareholders (1,253,903) (10) (55) (38) (166) - - (269) - (269)
Income and expense recognized in equity
- - - - - 29 (25) 4 1 5
Profit for the period - - - - 240 - - 240 (11) 229
At June 30, 2014 159,063,915 1,273 2,875 (47) 1,316 (232) (752) 4,433 23 4,456
* Non-controlling interests in CPM Braxis acquired on October 6, 2010.

CAPGEMINI JUNE 30, 2014 15
NOTES TO THE INTERIM CONSOLIDATED FINANCIAL STATEMENTS FOR THE HALF-YEAR ENDED JUNE 30, 2014
Note 1 Accounting policies The condensed interim consolidated financial statements and related notes for the half-year ended June 30, 2014 were drawn up under the responsibility of the Board of Directors and approved by the Board of Directors’ meeting of July 30, 2014.
ACCOUNTING BASIS
A) IFRS standards-base
The condensed interim consolidated financial statements for the half-year ended June 30, 2014 have been prepared in accordance with lAS 34, Interim Financial Reporting, as issued by the International Accounting Standards Board (IASB), and
endorsed by the European Union. The Group also takes account of the positions adopted by Syntec Numérique – an organization representing major consulting and computer services companies in France - regarding the application of certain IFRS. These condensed interim consolidated financial statements for the half-year ended June 30, 2014 should be read in conjunction with the 2013 consolidated financial statements.
B) New standards and interpretations applicable in 2014
The accounting policies applied by the Capgemini group are unchanged on those applied for the preparation of the 2013 consolidated financial statements. The standards, interpretations and amendments of mandatory application from January 1, 2014 did not have a material impact for the Group. The Group did not elect to adopt early the standards, amendments, and interpretations published by the IASB but not yet endorsed by the European Union at June 30, 2014 or in effect at January 1, 2014.
Changes in the presentation of segment reporting decided by the Group
Growing demand from clients to group application development and maintenance services in a single contract led the Group to review the presentation of its segment reporting by business. The distinction between technology services, which include application development and outsourcing services, which include the maintenance activity, has therefore become artificial. Accordingly, with effect from January 1, 2014, segment reporting by business is presented as follows:
► Consulting Services, which help to enhance the performance of organizations based on in-depth knowledge of client industries and processes,
► Local Professional Services, which provide assistance and support to internal IT teams within client companies,
► Application Services, which devise, develop, implement and maintain IT applications covering the Group’s system integration and application maintenance activities,
► Other Managed Services, which integrate, manage and/or develop either fully or partially, client’s IT Infrastructure systems (or that of a group of clients), transaction services, on demand services and/or business activities (Business Process Outsourcing, BPO).
Note 2 Changes in Group structure During the first-half 2014, the Group finalized the acquisition of Euriware and its subsidiaries, previously owned by Areva and acquired Strategic Systems & Products Corp. in the United States.
16 CAPGEMINI JUNE 30, 2014
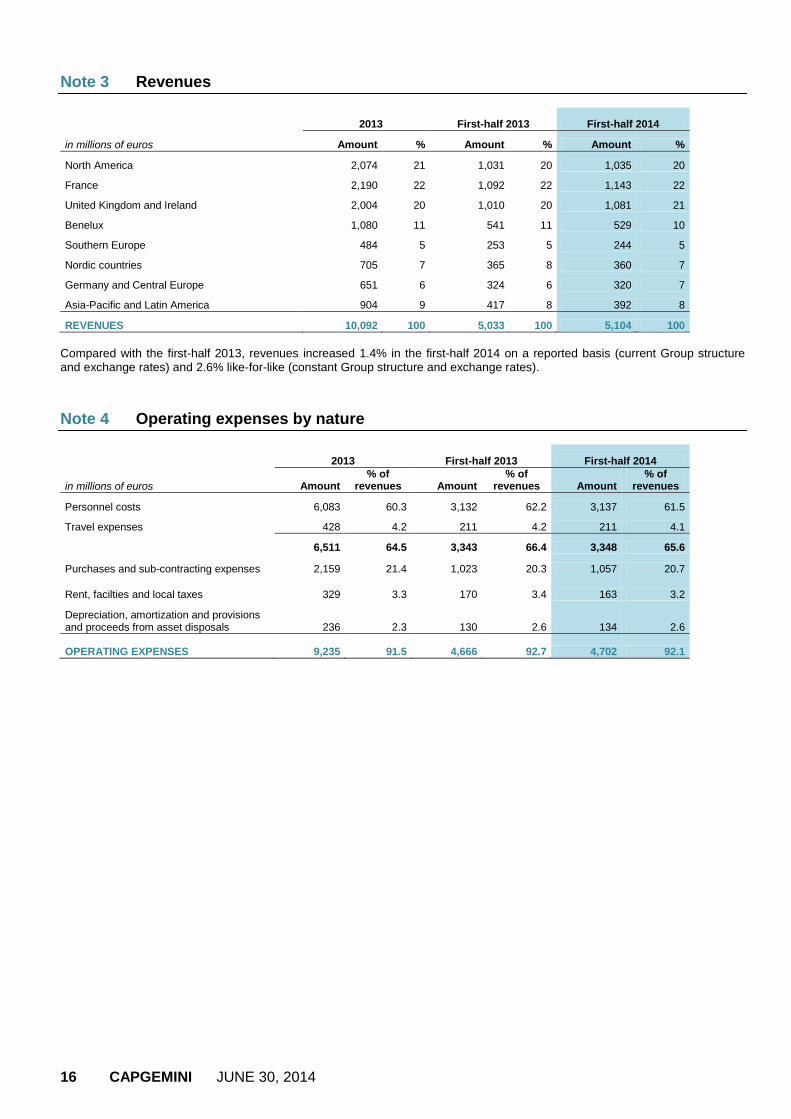
Note 3 Revenues
in millions of euros
2013 First-half 2013 First-half 2014
Amount % Amount % Amount %
North America 2,074 21 1,031 20 1,035 20
France 2,190 22 1,092 22 1,143 22
United Kingdom and Ireland 2,004 20 1,010 20 1,081 21
Benelux 1,080 11 541 11 529 10
Southern Europe 484 5 253 5 244 5
Nordic countries 705 7 365 8 360 7
Germany and Central Europe 651 6 324 6 320 7
Asia-Pacific and Latin America 904 9 417 8 392 8
REVENUES 10,092 100 5,033 100 5,104 100
Compared with the first-half 2013, revenues increased 1.4% in the first-half 2014 on a reported basis (current Group structure and exchange rates) and 2.6% like-for-like (constant Group structure and exchange rates).
Note 4 Operating expenses by nature
2013 First-half 2013 First-half 2014
in millions of euros Amount % of
revenues Amount % of
revenues Amount % of
revenues
Personnel costs 6,083 60.3 3,132 62.2 3,137 61.5
Travel expenses 428 4.2 211 4.2 211 4.1
6,511 64.5 3,343 66.4 3,348 65.6
Purchases and sub-contracting expenses 2,159 21.4 1,023 20.3 1,057 20.7
Rent, facilties and local taxes 329 3.3 170 3.4 163 3.2
Depreciation, amortization and provisions and proceeds from asset disposals 236 2.3 130 2.6 134 2.6
OPERATING EXPENSES 9,235 91.5 4,666 92.7 4,702 92.1

CAPGEMINI JUNE 30, 2014 17
Note 5 Other operating income and expense
in millions of euros 2013 First-half
2013 First-half
2014
Restructuring costs (68) (31) (19)
o/w Workforce reduction
(44) (19) (9)
o/w Real estate assets streamlining
(23) (11) (10)
o/w Rightshoring
(1) (1) -
Acquisition-related costs
(2) (1) (1)
Expenses relating to share grants (23) (10) (12)
Other operating expenses
(16) (8) (6)
Total operating expenses (109) (50) (38)
Other operating income
2 - -
Total operating income 2 - -
OTHER OPERATING INCOME AND EXPENSE (107) (50) (38)
Note 6 Net financial expense
in millions of euros 2013 First-half
2013 First-half
2014
Income from cash, cash equivalents and cash management assets 25 12 14
Interest on borrowings (55) (28) (17)
Net finance costs at the nominal interest rate (30) (16) (3)
Impact of amortized cost on borrowings (17) (9) (5)
Net finance costs at the effective interest rate (47) (25) (8)
Net interest cost on defined benefit pension plans (42) (24) (20)
Exchange Iosses (gains) on financial transactions (5) 2 1
Losses (gains) on derivative instruments (1) (2) (3)
Other (7) (4) (4)
Other financial income and expense (55) (28) (26)
o/w financial income 52 14 18
o/w financial expenses (107) (42) (44)
NET FINANCIAL EXPENSE (102) (53) (34)
The decrease in net finance costs is mainly due to the repurchase, conversion and redemption of the OCEANE bonds convertible/exchangeable into new or existing Cap Gemini shares (OCEANE 2009) at the end of 2013 (see Note 17, Net Cash and Cash Equivalents, to the consolidated financial statements for the year ended December 31, 2013).
18 CAPGEMINI JUNE 30, 2014
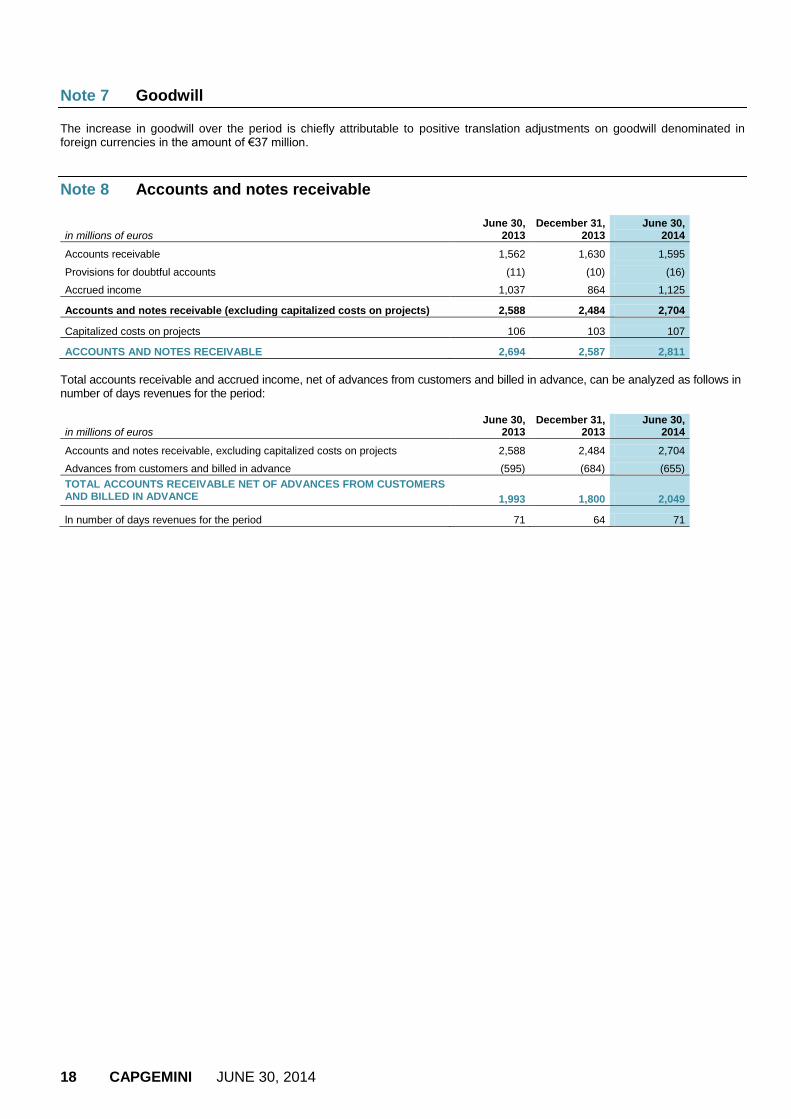
Note 7 Goodwill
The increase in goodwill over the period is chiefly attributable to positive translation adjustments on goodwill denominated in foreign currencies in the amount of €37 million.
Note 8 Accounts and notes receivable
in millions of euros June 30,
2013 December 31,
2013 June 30,
2014
Accounts receivable 1,562 1,630 1,595
Provisions for doubtful accounts (11) (10) (16)
Accrued income 1,037 864 1,125
Accounts and notes receivable (excluding capitalized costs on projects) 2,588 2,484 2,704
Capitalized costs on projects 106 103 107
ACCOUNTS AND NOTES RECEIVABLE 2,694 2,587 2,811
Total accounts receivable and accrued income, net of advances from customers and billed in advance, can be analyzed as follows in number of days revenues for the period:
in millions of euros June 30,
2013 December 31,
2013 June 30,
2014
Accounts and notes receivable, excluding capitalized costs on projects 2,588 2,484 2,704
Advances from customers and billed in advance (595) (684) (655)
TOTAL ACCOUNTS RECEIVABLE NET OF ADVANCES FROM CUSTOMERS AND BILLED IN ADVANCE 1,993 1,800 2,049
ln number of days revenues for the period 71 64 71

CAPGEMINI JUNE 30, 2014 19
Note 9 Net cash and cash equivalents
in millions of euros June 30, 2013 December 31,
2013 June 30,
2014
Cash management assets 77 77 79
Short-term investments 1,062 1,177 925
Cash at bank 363 461 329
Bank overdrafts (liability) (4) (9) (3)
Cash and cash equivalents 1,421 1,629 1,251
Bonds (497) (848) (853)
Obligations under finance leases (70) (57) (55)
Draw-downs on bank and similar facilities and other borrowings (2) (1) (1)
Long-term borrowings (569) (906) (909)
Bonds (591) (2) (15)
Obligations under finance leases (47) (50) (48)
Draw-downs on bank and similar facilities and other borrowings (22) (72) (153)
Short-term borrowings (660) (124) (216)
Borrowings (1,229) (1,030) (1,125)
Derivative instruments * 3 2 -
NET CASH AND CASH EQUIVALENTS 272 678 205
* Including the fair value at December 31, 2013 and June 30, 2014 of the conversion option embedded in the “ORNANE 2013” bonds and the call option on own shares purchased by Cap Gemini on October 18, 2013.
The increase in short-term borrowings on December 31, 2013 mainly reflects the increase in short-term financing (€81 million), particularly in the parent company and certain of its subsidiaries in Brazil, China and Australia, as well as the accrued coupon not yet due on the 2011 bond issue (€13 million). The €473 million decrease in net cash and cash equivalents during the first six months of 2014 on December 31, 2013 chiefly reflects:
organic free cash flow, equal to cash flow from operations adjusted for acquisitions of property, plant, equipment and intangible assets (net of disposals) and flows relating to the net interest cost, of (€148) million;
the payment of dividends to shareholders for a total amount of €174 million;
the repurchase of treasury shares in the amount of €103 million.
Note 10 Provisions for pensions and other post-employment benefits
in millions of euros
First-half 2013 2013
First-half 2014
Net obligation at beginning of period 1,202 1,202 962
Translation adjustments (44) (36) 26
Service cost 30 63 29
Net interest cost 24 42 20
Benefits and contributions (79) (388) (47)
Change in actuarial losses and gains recognized in equity (82) 77 65
Other movements 2 2 10
Net obligation at end of period 1,053 962 1,065
The change in the net obligation in the first-half 2014 is chiefly due to the net actuarial loss resulting from the decrease in discount rates in Canada and the United Kingdom between December 31, 2013 and June 30, 2014.
Note 11 Other non-current and current liabilities At June 30, 2014, other non-current and current liabilities include primarily liabilities related to acquisitions of consolidated companies of €222 million (comprising €126 million in other non-current liabilities and €96 million in other current liabilities).

20 CAPGEMINI JUNE 30, 2014
Note 12 Operating segments
Segment information is provided for the geographic areas presented below (Segment reporting by geographic area) and complemented by information on revenues and operating margin for each of the Group’s four businesses (Segment reporting by business).
SEGMENT REPORTING BY GEOGRAPHIC AREA
The Income Statement breaks down by geographic area as follows:
Half-year ended June 30, 2014 in millions of euros
North America
France
United Kingdom
and Ireland
Benelux Southern Europe
Nordic countries
Germany and
Central Europe
Asia-Pacific
and Latin America
Head-quarter
expenses
Elimina- tions
Total
Revenues
- external 1,035 1,143 1,081 529 244 360 320 392 - - 5,104
- inter-geographic area 50 90 72 31 10 10 76 322 - (661) -
TOTAL REVENUES 1,085 1,233 1,153 560 254 370 396 714 - (661) 5,104
OPERATING MARGIN 123 76 107 47 6 40 26 11 (34) - 402
% of revenues 11.9 6.7 9.9 8.9 2.6 11.1 8.1 2.7 - - 7.9
Amortization of intangible assets recognized in business combinations
(1) (4) - - (1) - (1) (3) - - (10)
OPERATING PROFIT 120 60 99 43 2 38 23 3 (34) - 354
Net finance costs (34)
Income tax expense (91)
PROFIT FOR THE PERIOD 229
Non-controlling interests (11)
PROFIT ATTRIBUTABLE TO OWNERS OF THE COMPANY 240
Half-year ended June 30, 2013 in millions of euros
North America
France
United Kingdom
and Ireland
Benelux Southern Europe
Nordic countries
Germany and
Central Europe
Asia-Pacific
and Latin America
Head-quarter
expenses
Elimina- tions
Total
REVENUES
- external 1,031 1,092 1,010 541 253 365 324 417 - - 5,033
- inter-geographic area 45 92 57 23 9 11 73 344 - (654) -
TOTAL REVENUES 1,076 1,184 1,067 564 262 376 397 761 - (654) 5,033
OPERATING MARGIN 127 78 82 44 7 26 25 11 (33) - 367
% of revenues 12.3 7.2 8.1 8.2 2.8 7.2 7.8 2.6 - - 7.3
Amortization of intangible assets recognized in business combinations (4) (4) - (2) (1) (1) - (3) - - (15)
OPERATING PROFIT 122 59 75 33 (2) 24 21 3 (33) - 302
Net finance costs (53)
Income tax expense (80)
PROFIT FOR THE PERIOD 169
Non-controlling interests (7)
PROFIT ATTRIBUTABLE TO OWNERS OF THE COMPANY 176

CAPGEMINI JUNE 30, 2014 21
Year ended December 31, 2013 in millions of euros
North America
France
United Kingdom
and Ireland
Benelux Southern Europe
Nordic countries
Germany and
Central Europe
Asia-Pacific
and Latin America
Head-quarter
expenses
Elimina- tions
Total
REVENUES
- external 2,074 2,190 2,004 1,080 484 705 651 904 - - 10,092
- inter-geographic area 98 178 111 54 19 23 154 670 - (1,307) -
TOTAL REVENUES 2,172 2,368 2,115 1,134 503 728 805 1,574 - (1,307) 10,092
OPERATING MARGIN 255 204 175 105 21 64 57 44 (68) - 857
% of revenues 12.3 9.3 8.7 9.8 4.2 9.1 8.8 4.9 - - 8.5
Amortization of intangible assets recognized in business combinations (9) (8) - (3) (2) (1) (1) (6) - - (30)
OPERATING PROFIT 243 164 159 83 10 61 46 22 (68) - 720
Net finance costs (102)
Income tax expense (182)
Share of profit of associates (1)
PROFIT FOR THE YEAR 435
Non-controlling interests (7)
PROFIT ATTRIBUTABLE TO OWNERS OF THE COMPANY 442
SEGMENT REPORTING BY BUSINESS
From January 1, 2014, the presentation of segment reporting by business is analyzed as follows:
► Consulting Services, which help to enhance the performance of organizations based on in-depth knowledge of client industries and processes,
► Local Professional Services, which provide assistance and support to internal IT teams within client companies,
► Application Services, which devise, develop, implement and maintain IT applications covering the Group’s system integration and application maintenance activities,
► Other Managed Services, which integrate, manage and/or develop either fully or partially, client’s IT Infrastructure systems (or that of a group of clients), transaction services, on demand services and/or business activities (Business Process Outsourcing, BPO).
Revenues by business
2013 First-half 2013 First-half 2014
in millions of euros Amount % Amount % Amount %
Consulting Services 456 4 237 5 226 5
Local Professional Services 1,498 15 755 15 775 15
Application Services 5,825 58 2,923 58 2,879 56
Other Managed Services 2,313 23 1,118 22 1,224 24
REVENUES 10,092 100 5,033 100 5,104 100
Operating margin by business
2013 First-half 2013 First-half 2014
in millions of euros Amount % Amount % Amount %
Consulting Services 35 7.8 18 7.7 16 7.0
Local Professional Services 159 10.6 69 9.1 63 8.2
Application Services 566 9.7 246 8.4 267 9.3
Other Managed Services 165 7.1 67 6.0 90 7.3
Not allocated * (68) - (33) - (34)
OPERATING MARGIN 857 8.5 367 7.3 402 7.9
* Items that have not been allocated correspond to headquarter expenses.
22 CAPGEMINI JUNE 30, 2014
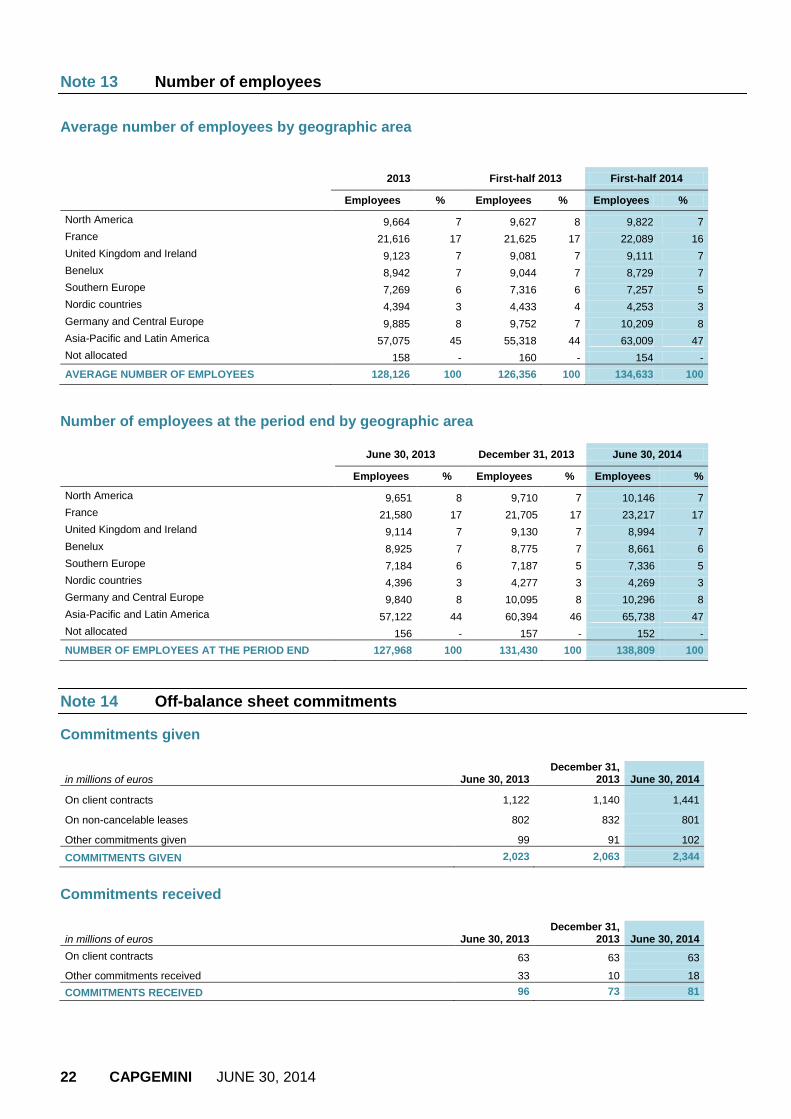
Note 13 Number of employees
Average number of employees by geographic area
2013 First-half 2013 First-half 2014
Employees % Employees % Employees %
North America 9,664 7 9,627 8 9,822 7
France 21,616 17 21,625 17 22,089 16
United Kingdom and Ireland 9,123 7 9,081 7 9,111 7
Benelux 8,942 7 9,044 7 8,729 7
Southern Europe 7,269 6 7,316 6 7,257 5
Nordic countries 4,394 3 4,433 4 4,253 3
Germany and Central Europe 9,885 8 9,752 7 10,209 8
Asia-Pacific and Latin America 57,075 45 55,318 44 63,009 47
Not allocated 158 - 160 - 154 -
AVERAGE NUMBER OF EMPLOYEES 128,126 100 126,356 100 134,633 100
Number of employees at the period end by geographic area
June 30, 2013 December 31, 2013 June 30, 2014
Employees % Employees % Employees %
North America 9,651 8 9,710 7 10,146 7
France 21,580 17 21,705 17 23,217 17
United Kingdom and Ireland 9,114 7 9,130 7 8,994 7
Benelux 8,925 7 8,775 7 8,661 6
Southern Europe 7,184 6 7,187 5 7,336 5
Nordic countries 4,396 3 4,277 3 4,269 3
Germany and Central Europe 9,840 8 10,095 8 10,296 8
Asia-Pacific and Latin America 57,122 44 60,394 46 65,738 47
Not allocated 156 - 157 - 152 -
NUMBER OF EMPLOYEES AT THE PERIOD END 127,968 100 131,430 100 138,809 100
Note 14 Off-balance sheet commitments
Commitments given
in millions of euros June 30, 2013 December 31,
2013 June 30, 2014
On client contracts 1,122 1,140 1,441
On non-cancelable leases 802 832 801
Other commitments given 99 91 102
COMMITMENTS GIVEN 2,023 2,063 2,344
Commitments received
in millions of euros June 30, 2013 December 31,
2013 June 30, 2014
On client contracts 63 63 63
Other commitments received 33 10 18
COMMITMENTS RECEIVED 96 73 81

CAPGEMINI JUNE 30, 2014 23
Declaration by the person responsible for the interim financial report
"I hereby declare that, to the best of my knowledge, the condensed interim consolidated financial statements for the half-year ended June 30, 2014 have been prepared in accordance with the applicable accounting standards and give a true and fair view of the assets, liabilities, financial position and results of the Company and all the other companies included in the scope of consolidation and that the interim financial review gives a fair description of the material events that occurred in the first six months of the financial year and their impact on the financial statements, the main related party transactions, as well as a description of the main risks and uncertainties for the remaining six months of the year." Paul Hermelin Chairman and Chief Executive Officer