Embed Size (px)
Citation preview

Intergenerational Nutritional Effects
& Fetal Growth and Chronic Disease
2010


Intergenerational Effects
• Cohort studies – maternal birthweight and fetal grown– Dutch famine studies
• Experimental Study– Supplementation in Guatemala

Godfrey KM, Barker DJP, Robinson S, Osmond C. Mother's birthweight and diet in pregnancy in relation to the baby's thinness at birth. Br J Obstet Gynaecol 1997;104:663–7

Illinois StudyCoutinho et al. Am J Epi, 1997 146:804-809
• N=15,287 Black and 117,708 white matched pairs of infants and mothers.
• Mothers were born between 1956-75, infants between 1989-1991
Black White
Mean infant birthweight
3139 g 3434
Mean parental birthweight
3133 3377
% low birthweight infants
12% 5%
% lbw born to women with lbw
18% 9%
% lbw born to women not lbw
11% 5%

Results
• Father’s birthweight had effect on infant birthweight but not as strong as mothers.
• In multiple linear regression for infants who weighed more than 2500 g, parental birthweight accounted for 5% of variance among black infants and 4% among white infants.– adjusted for parental age, years of schooling, marital
status and adequacy of prenatal care
• Each 100 g increase in maternal birthweight was associated with 24-27 g increase in infant birthweight

Copyright ©2009 The American Society for Nutrition
Bouchard, C. Am J Clin Nutr 2009;89:1494S-1501S
FIGURE 3 Mean offspring birth weight (g) for categories of paternal birth weight in selected strata of maternal birth weight

Dutch Famine StudiesSusser and Stein, Nutrition Reviews, 1994
• Dutch famine winter lasted 6 months, from November 1944- when nazis imposed transport embargo on west Holland until-
• May 7, 1945 when Holland was liberated from the occupation
• Strong evidence for critical stages of development in several physiological systems

Dutch Hunger Winter: Calories

Affects of Famine
• Fertility decreased
• Maternal weight fell during pregnancy with famine exposure
• Third trimester famine exposure had strong effect on birthweight
• Third trimester famine exposure was associated with infant mortality at 30-90 days

Birth Cohorts

Obesity in Young Men after Famine Exposure in Utero and early Infancy(Ravelli et al NEJM, 1976)
• N=300, 000 Dutch military inductees at age 19
• Famine exposure in first 2 trimesters lead to 80% higher prevalence of overweight (p<0.0005)
• Famine exposure in last trimester or famine exposure in first 5 months of life associated with 40% lower prevalence of overweight (p<0.005)

Adult Obesity

Interpretation?
• Cohort B1– Conceived and gestated at time of moderate
caloric restriction– Born into time of famine– Low rates of adult obesity
• Cohort D1– Conceived and gestated at a time of famine– Born into food sufficiency– High rates of adult obesity

Other Results for Infants Exposed to Famine
• Excess central nervous system disorders (such as NTD)
• Famine exposure associated with twofold risk of schizophrenia in 50 year old women.

Prenatal exposure to famine and brain morphology in schizophrenia
Hulshoff Pol HE; Hoek HW; Susser E; Brown AS; Dingemans A; Schnack HG; van Haren NE; Pereira Ramos LM; Gispen-de Wied CC; Kahn RS; American Journal of Psychiatry , Jul 2000;

Methods
• Nine schizophrenic patients and nine healthy comparison subjects exposed during the first trimester of gestation to the Dutch Hunger Winter were evaluated with magnetic resonance brain imaging, as were nine schizophrenic patients and nine healthy subjects who were not prenatally exposed to the famine.

RESULTS:
• Prenatal famine exposure in patients with schizophrenia was associated with decreased intracranial volume.
• Prenatal Hunger Winter exposure alone was related to an increase in brain abnormalities, predominantly white matter hyperintensities.

Further evidence of relation between prenatal famine and
major affective disorder.
Alan S Brown; Jim van Os; Corine Driessens; Hans W Hoek;
et al; The American Journal of Psychiatry; Washington; Feb
2000;

Methods
• Compared the risk of major affective disorder requiring hospitalization in birth cohorts who were and were not exposed, in each trimester of gestation, to famine during the Dutch Hunger Winter of 1944-1945.

Results
• The risk of developing major affective disorder requiring hospitalization was increased for subjects with exposure to famine in the second trimester and was increased significantly for subjects with exposure in the third trimester, relative to unexposed subjects.

Intergenerational Impact of Dutch Famine
A mother's exposure to famine prior to conception of her offspring was associated with lower self-reported measures of mental health and quality of life in her adult offspring.
Stein et al. Epidemiology. 2009 Nov;20(6):909-15
The expected increase in offspring birth weights with increasing birth order was not seen after maternal intrauterine exposure in the first trimester of pregnancy
Lumey and Stein. Am J Epidemiol. 1997 Nov 15;146(10):810-9

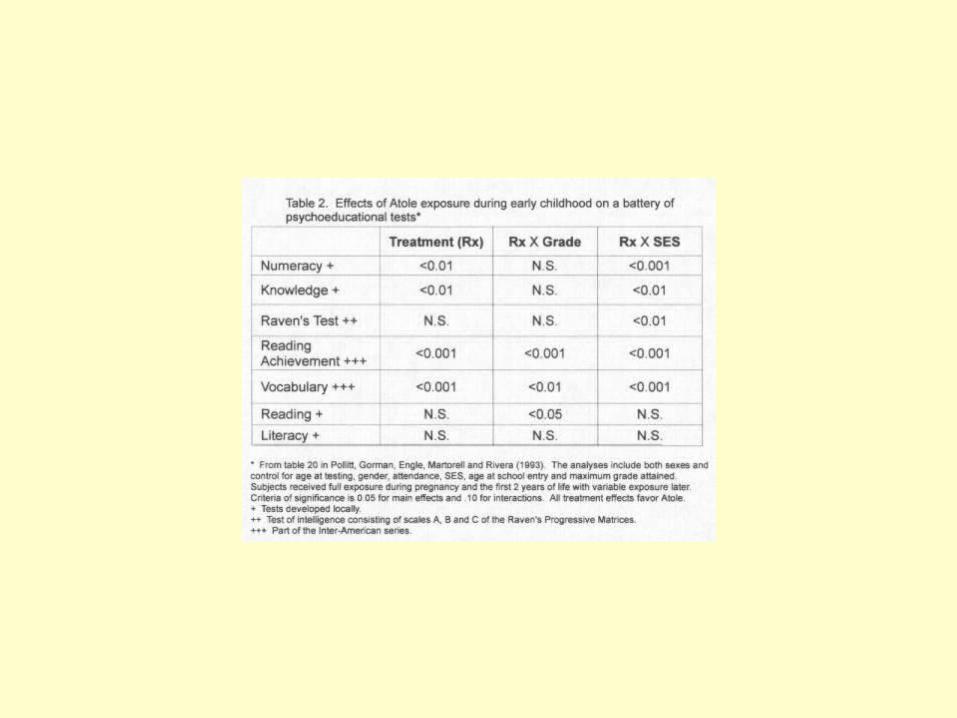
Reproductive performance and nutrition during childhood
Nutrition Reviews; Washington; Apr 1996; Martorell, Reynaldo; Ramakrishnan, Usha; Schroeder, Dirk G; Ruel, Marie;

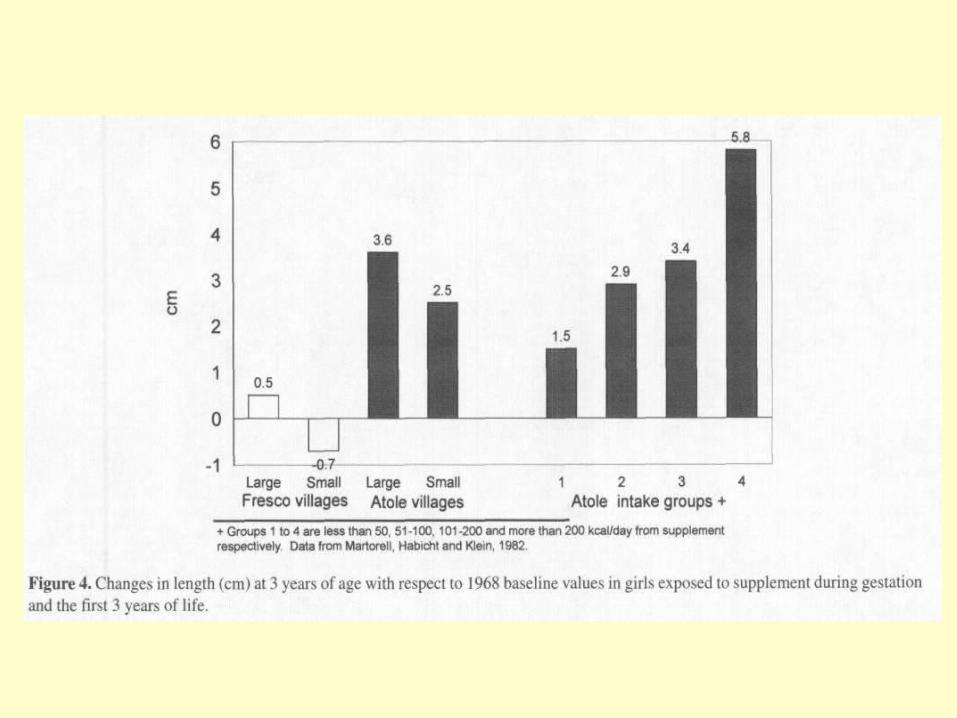
Longitudinal Supplementation Trial (1969-1977)
• Guatemala, 4 Villages, one pair of villages had about 900 people each and the other about 500 each.
• 2 each randomized to:• Atole (Incaparina, a vegetable protein mix
developed by INCAP*, dry skim milk, sugar, and flavoring, 163 kcal/cup, 11/5 g protein)
• Fresco (flavored drink with sugar, vitamins and minerals, 59 kcal/cup)
*Institute of Nutrition of Central America and Panama

• Feeding center was open daily for over 7 years, from 1969 to 1977.
• Anyone in the village could attend, but careful recording of consumption, including of additional servings as well as of leftovers, was done only for women who were pregnant or breastfeeding and for children 7 years or younger.
• Supplements were available twice daily, in midmorning and midafternoon, so as not to interfere with meal times.
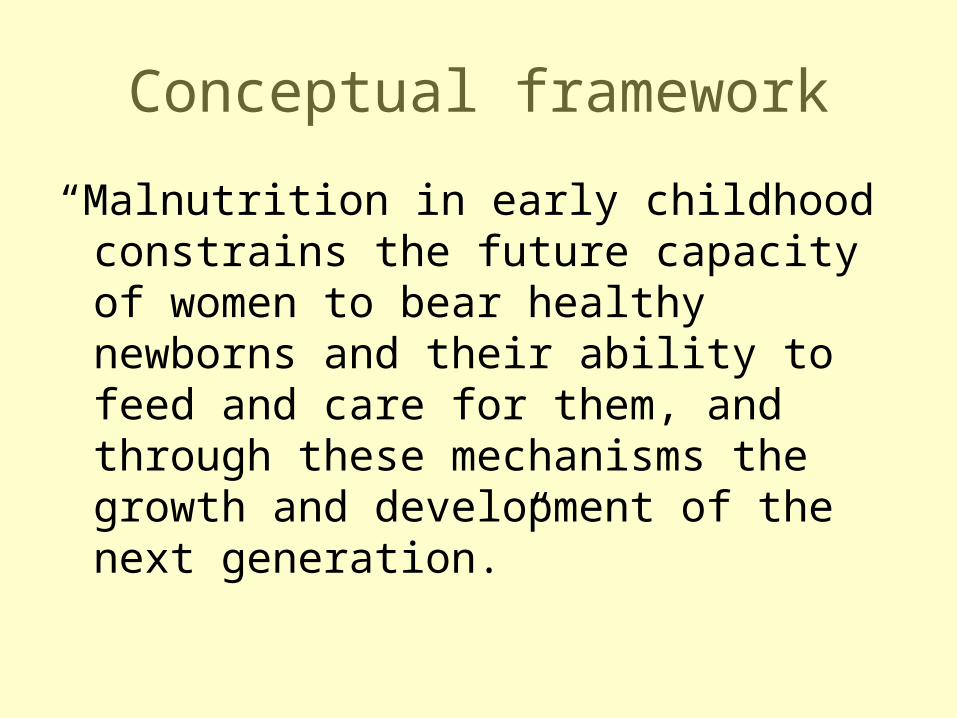
Conceptual framework
“Malnutrition in early childhood constrains the future capacity of women to bear healthy newborns and their ability to feed and care for them, and through these mechanisms the growth and development of the next generation.”


Follow-Up data - 1990s
• The prevalence of low birthweight is currently 12% in Atole villages (n = 65) and 28% in Fresco villages (n = 58) among women exposed to the supplements during the intrauterine period and the first 3 years of life.
• Mean birthweights are 2.90 kg in Atole villages and 2.73 in Fresco villages.
Role of intergenerational effects on linear growth
U Ramakrishnan; R Martorell; D G
Schroeder; R Flores; The Journal of Nutrition; Bethesda; Feb 1999;

Methods
• The sample was restricted to singleton, term (>37 wk of gestation) births that occurred in the four study villages between 1991 and 1996, to women who were born during the original longitudinal study (1969-1977)
• Complete data were available for 215 mother-child pairs, and 60% of the mothers (n = 140)

Results
• For every 100 g increase in maternal birth weight, her infant's birth weight increased by 29 g after adjusting for the effects of maternal age, gestational age and sex of the infant. This relationship was highly significant (P < 0.001)
• For every centimeter increase in maternal birth length, her child's birth weight increased by 53 g.

Metabolic “Programming” in an Age of Plenty

Recent Studies on Impact of GWG on Offspring Obesity
Zilko et al. Am J Obset Gynecol, 2010
In NLSY: GWG associated with child overweight
Mamun et al. Circulation, 2009
In Australian cohort : Greater GWG associated with greater offspring BMI in early adulthood
Von Kries et al.
Int J Pediatr Obes, 2010
Large German cross-sectional study: higher than average GWG accounts for moderate increase in offspring overweight at ages 3-17

Copyright ©2010 American Physiological Society
Heerwagen, M. J. R. et al. Am J Physiol Regul Integr Comp Physiol 299: R711-R722 2010;
Fig. 1. Obesity and pregnancy are associated with insulin resistance and inflammatory changes that exacerbate in combination, increasing lipid transfer earlier
in gestation
Fig. 1. Obesity and pregnancy are associated with insulin resistance and inflammatory changes that exacerbate in combination, increasing lipid transfer earlier in gestation.
Obesity is associated with adipose tissue inflammation and systemic insulin resistance, resulting in increased adipose tissue lipolysis and hepatic very-low-density lipoprotein
(VLDL) secretion. When combined with pregnancy, this leads to an increase in maternal circulating lipids with advancing gestation. Subsequent hydrolysis of maternal triglycerides (TGs) by placental lipoprotein lipase (LPL) and increased free fatty acid (FFA) uptake and
transport by the placenta results in excess lipid transfer to the developing fetus. This increase in fetal lipid exposure may impact the liver, skeletal muscle, adipose tissue, brain,
and pancreas to increase the risk for metabolic disease in childhood. MCP-1, monocyte chemotractant protein-1; CM, chylomicron; NAFLD, nonalcoholic liver disease.

Fetal Nutrition and Chronic Diseases of Adulthood
Developmental Origins of Health & Disease

UN Standing Committee on Nutrition, 2006
While undernutrition kills in early life, it also leads to a high risk of disease and death later in life. This double burden of malnutrition has common causes, inadequate foetal and infant and young child nutrition followed by exposure (including through marketing practices) to unhealthy energy dense nutrient poor foods and lack of physical activity.
The window of opportunity lies from pre-pregnancy to around 24 months of a child’s age.

Barker’s Fetal Origins Theory
• Coronary heart disease, stroke, type 2 diabetes, hypertension and osteoporosis, originate through developmental plasticity, in response to malnutrition during fetal life and infancy. Certain cancers, including breast cancer, also originate in fetal life.
Fetal Origins ConceptsBarker et al
• Nutrition in early life has permanent effects
• Undernutrition has different effects at different times of life.
• Rapidly growing fetuses and neonates are vulnerable to undernutrition
• Undernutrition results from inadequate maternal intake, transport, or transfer of nutrients.
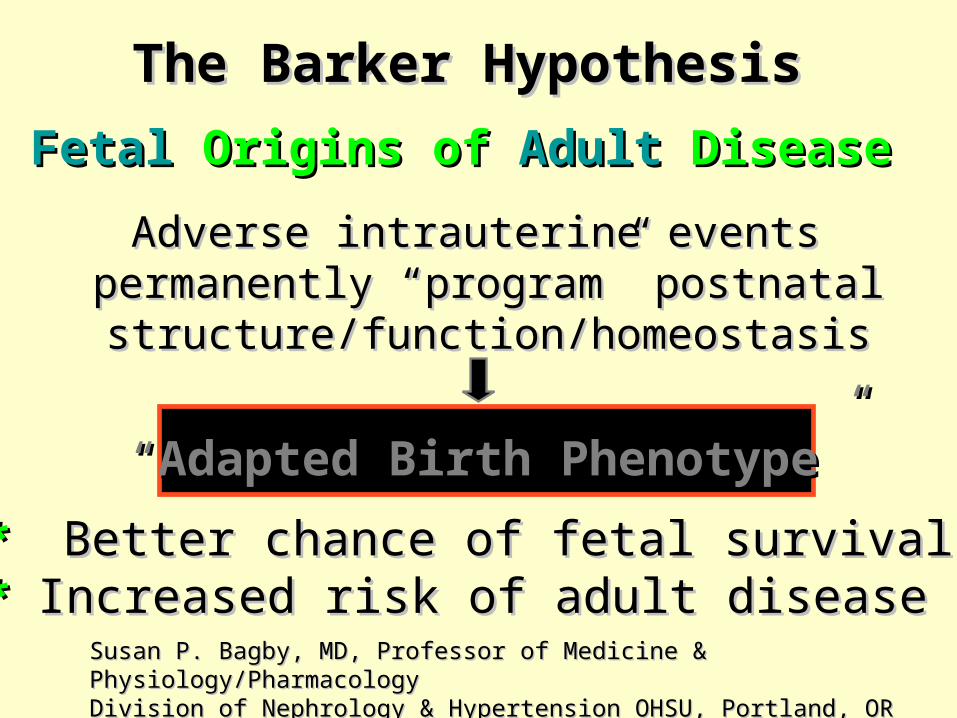
The Barker HypothesisThe Barker Hypothesis
Adverse intrauterine events Adverse intrauterine events permanently “program” postnatalpermanently “program” postnatal
structure/function/homeostasisstructure/function/homeostasis
FetalFetal Origins of Origins of AdultAdult Disease Disease
** Better chance of fetal survivalBetter chance of fetal survival** Increased risk of adult diseaseIncreased risk of adult disease
““Adapted Birth PhenotypeAdapted Birth Phenotype””
Susan P. Bagby, MD, Professor of Medicine & Physiology/PharmacologySusan P. Bagby, MD, Professor of Medicine & Physiology/PharmacologyDivision of Nephrology & Hypertension OHSU, Portland, ORDivision of Nephrology & Hypertension OHSU, Portland, OR

FETAL ORIGINS OF ADULT CVASC DISEASEFETAL ORIGINS OF ADULT CVASC DISEASE
MODIFIERS
COFACTORS
Low Birthweight/IUGR
Adverse Intrauterine Events
Adult “Metabolic Syndrome”
Abd’l Obesity HTN
CADDiabetes
TG/ HDLRenal Failure
In UteroIn Utero
BirthBirth
ChildhoodChildhood
AdulthoodAdulthood

Coronary heart disease death rates, expressed as standardized mortality ratios, in 10,141 men and 5585 women born in Hertfordshire, United Kingdom, from 1911 to 1930, according to birth weight.
(Osmond C, Barker DJP, Winter PD, Fall CHD, Simmonds SJ. Early growth and death from cardiovascular disease in women. BMJ 1993;307:1519–24)


Age-adjusted Relative Risk of Non- fatal Age-adjusted Relative Risk of Non- fatal Coronary Heart Disease and StrokeCoronary Heart Disease and Stroke
121,700 American Nurses, self report study121,700 American Nurses, self report study BMJ 315:396,1997BMJ 315:396,1997
5.0 7.5 10.00.50
0.75
1.00
1.25
1.50
Birthweight
Rel
ativ
e R
isk
Mean ± 95% CL

Catch-up growth in childhood and death from coronary heart disease: longitudinal
study (Eriksson et al, BMJ, 1999)
• Subjects: 3641 men born in Helsinki between 1924-1933
• Followed with school data for weight and height
• Deaths from coronary heart disease from 1971-95 (standardized mortality ratios) were endpoints.

Catch-up growth in childhood and death from coronary heart disease: longitudinalstudy (Eriksson et al, BMJ, 1999
• Men who had low birth weight or were thin at birth have high death rates from coronary heart disease
• Death rates are even higher if weight "catches up" in early childhood
• Death from coronary heart disease may be a consequence of prenatal undernutrition followed by improved postnatal nutrition
• Programs to reduce obesity among boys may need to focus on those who had low birth weight or who were thin at birth

David J.P. Barker, F.R.S., Clive Osmond, Ph.D., Tom J. Forsén, M.D.,Eero Kajantie, M.D., and Johan G. Eriksson, M.D. Trajectories of Growth among Children Who Have Coronary Events as Adults. N Engl J Med 2005;353:1802-9.

Diabetes in Low-Birth-Weight MenDiabetes in Low-Birth-Weight Men
Hales et al. BMJ 303: 1019, 1991Hales et al. BMJ 303: 1019, 1991
Birth Weight (lbs)
% I
mp
aire
d G
luc
To
l o
r D
M
<5.5 6.5 7.5 8.5 9.5 >9.5
40
30
20
10
0
370 menAge 64 yrs
Od
ds R
atio/A
dj fo
r BM
I
8
6
4
2
0
Gestat’l DM

Fetal Milieu Affects Obesity RiskFetal Milieu Affects Obesity Risk
<2.52.5-3.0
3.0-3.53.5-4.0
>4.03-D Column 1
0
0.5
1
1.5
2
2.5
3-DColumn 1
Birth Weight (kg)
Odds RatioFor
Obesity
Eriksson J et al Internatl J Obesity 2001Eriksson J et al Internatl J Obesity 2001
Trouble at Both Ends of the Birth Weight SpectrumTrouble at Both Ends of the Birth Weight Spectrum
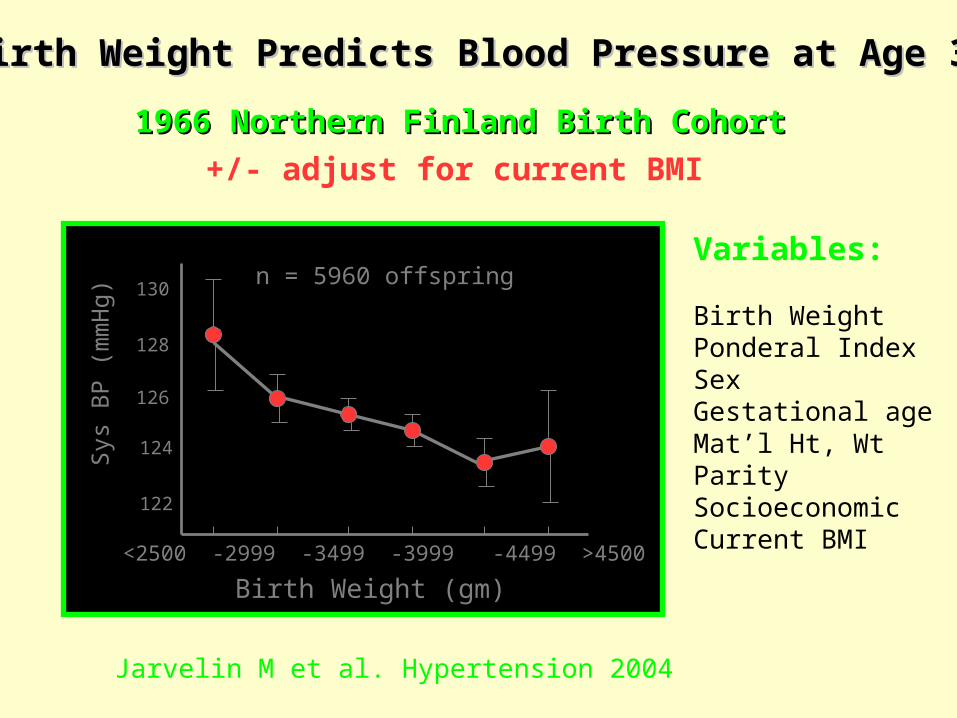
Birth Weight (gm)<2500 -2999 -3499 -3999 -4499 >4500
130
128
126
124
122
Sys
BP (
mm
Hg)
Birth Weight Predicts Blood Pressure at Age 31Birth Weight Predicts Blood Pressure at Age 31
1966 Northern Finland Birth Cohort1966 Northern Finland Birth Cohort
+/- adjust for current BMI
Jarvelin M et al. Hypertension 2004
Variables:
Birth WeightPonderal IndexSexGestational ageMat’l Ht, WtParitySocioeconomicCurrent BMI
n = 5960 offspring

Birthweight and Adult HTN in US WomenBirthweight and Adult HTN in US Women
Nurses Health Study INurses Health Study I
Birthweight Category (lbs)
< 5.0 5.0-5.5 5.6-7.0 7.1-8.5 8.6-10.0< 5.0 5.0-5.5 5.6-7.0 7.1-8.5 8.6-10.0
HT
N P
reva
len
ce (
%) 4040
3030
1515
10 10
Age 46-71
8.4%
AgeAge 30-5530-55
3.1%

Early Growth Patterns Predict Adult HTNEarly Growth Patterns Predict Adult HTN
Barker et al. J HTN 20:1951, 2002.Barker et al. J HTN 20:1951, 2002.
Growth Patterns in 1404 Childrenwho later developed Hypertension
0 2 4 6 8 10 12 14-0.2
-0.1
0.0
0.1
0.2
BMIWeightHeight
_______________________________
Age (Yrs)
Z S
core
CohortAverage(n=8760)
}
Animal Models (Waterland and Garza)
“Overall the data from animal models of metabolic imprinting support the observed epidemiological associations.”

Effect of Gestational Type 2 Diabetes on Body Weight in Adult Offspring

Framework for understanding the maternal regulation of fetal development and programming
Godfrey & Barker. Fetal nutrition and adult disease. Am J Clin Nutr 2000 71: 1344-1352.


Asymmetric Growth RestrictionAsymmetric Growth Restriction
Adverse Intrauterine Events
* Low Birth Weight for Gestational Age
* Low Wt: Height Ratio (thinness)
* Relative sparing of heart, brain, adrenal
* Disproportionate reduction of kidney, liver, pancreas, skeletal muscle
mass
* Reduced abdominal girth

Fetal Origins of Adult Fetal Origins of Adult DiseaseDisease
Asymmetric Growth RestrictionAsymmetric Growth Restriction
From Barker, 1998
““More powerful predictor than other risk factorsMore powerful predictor than other risk factors””
* ThinThin
* Small abdominalSmall abdominal girth ( liver size)girth ( liver size)
* Low arm cir-Low arm cir- cumference cumference ( muscle mass)( muscle mass)
* Preserved central fat masscentral fat mass

? % Growth-Restricted Phenotype in Lower ? % Growth-Restricted Phenotype in Lower Birth Weight CategoriesBirth Weight Categories
<5 5.0-5.5 5.5-6.0 6.0-6.5 6.5-7.0 7.0-7.5 >7.50
5
10
15
20
25
30
35% Term Births
BirthWeight Category (lbs)
% o
f T
erm
Bir
ths
Growth-Restricted Phenotype
Conceptual Graph
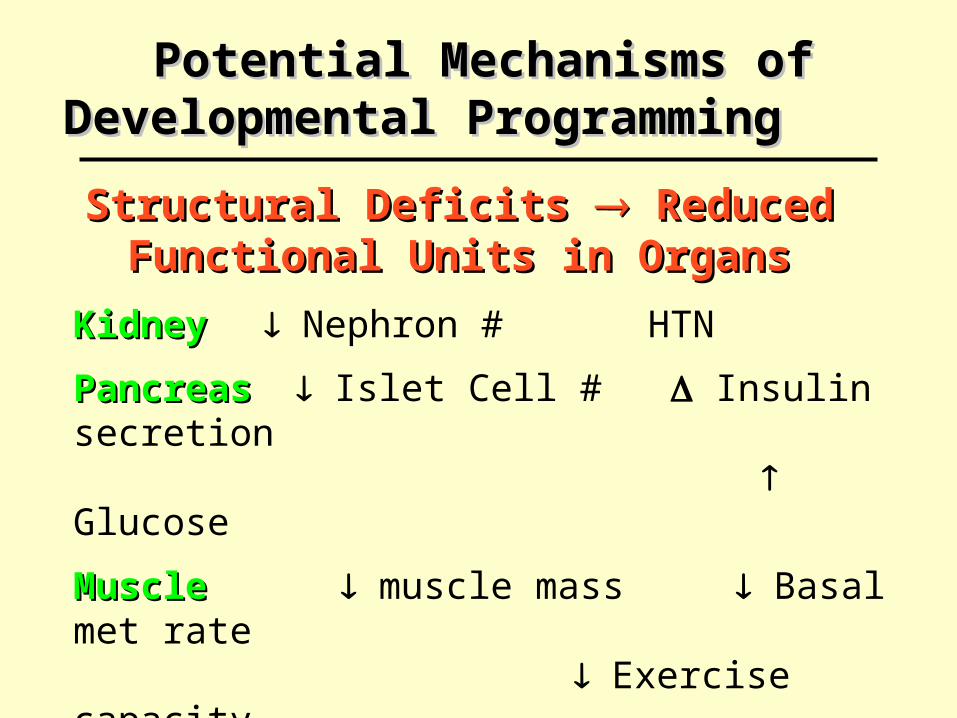
Potential Mechanisms ofPotential Mechanisms ofDevelopmental ProgrammingDevelopmental Programming
KidneyKidney Nephron # HTN
Pancreas Pancreas Islet Cell # Insulin secretion Glucose
Muscle Muscle muscle mass Basal met rate Exercise capacity
Heart myocyte # Risk CHF
Liver cells # ? lipid metabolism
Structural Deficits Structural Deficits Reduced ReducedFunctional Units in OrgansFunctional Units in Organs

Low Birth Wt, Low Nephron Number and HTN
Brenner et al. 1988,1994Brenner et al. 1988,1994
What Conveys Risk of HTN inWhat Conveys Risk of HTN inLower Birth-weight Offspring ?Lower Birth-weight Offspring ?
“… “… retardation of renal development as occursretardation of renal development as occursin individuals of low birth weight gives rise to in individuals of low birth weight gives rise to increased postnatal risks for systemic and increased postnatal risks for systemic and glomerular hypertension as well as enhanced risk glomerular hypertension as well as enhanced risk of expression of renal disease.”of expression of renal disease.”22
11Am J HTN 1988 1:335-47; Am J HTN 1988 1:335-47; 22Am J Kid Dis 1994 23: 171 Am J Kid Dis 1994 23: 171

Branching Morphogenesis Nephrogenesis
New Nephrons Form in Concentric Layers New Nephrons Form in Concentric Layers during Gestationduring Gestation
Condensing MesenchymeComma Shaped Bodies
Outer Nephrogenic Layer
Glomeruli

Birth WeightBirth WeightPredicts Predicts
Nephron NumberNephron Number
230,000 nephrons230,000 nephronsper kg increaseper kg increasein birth weightin birth weight
In Term Births:Ages 1-17 yrs
All Ages
Hughson et al,Hughson et al,Kid Internat (2003) 63, 2113 Kid Internat (2003) 63, 2113
Also: Merlet-Benichou et al, 1999 Manalich et al, 2000

FOOD
CATCH-UP GROWTH
BPBP
Asymmetric Growth Restriction in Utero
Maternal Protein Deficiency
Impaired Kidney Development
# Nephrons(permanent)
“The Thrifty Phenotype”
BODY MASS
# Nephrons
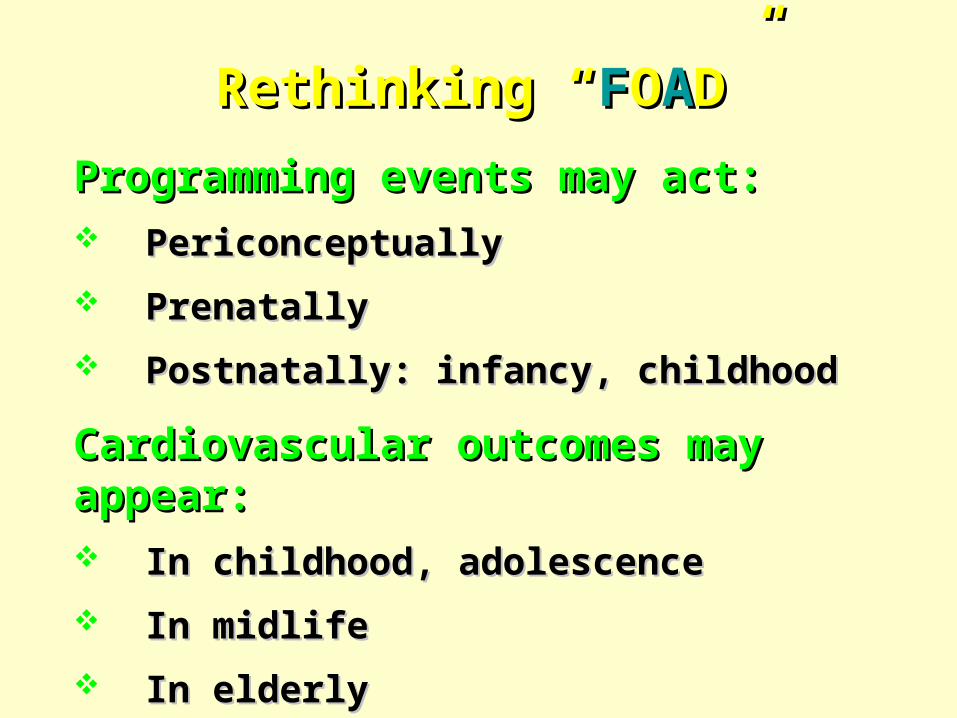
Rethinking “Rethinking “FFOOAAD”D”
Programming events may act:Programming events may act: PericonceptuallyPericonceptually
PrenatallyPrenatally
Postnatally: infancy, childhoodPostnatally: infancy, childhood
Cardiovascular outcomes may appear:Cardiovascular outcomes may appear: In childhood, adolescenceIn childhood, adolescence
In midlifeIn midlife
In elderlyIn elderly

Rapid Infant Growth Rapid Infant Growth and Risk of Childhood Adiposityand Risk of Childhood Adiposity
Stettler et al, Ped. 109, 2002.
Birthweight
Rate of Wt GainIn first 4 mo
Prevalence of Overweight
at Age 7 Yrs

Infant Growth Rate and Coronary DiseaseInfant Growth Rate and Coronary Disease
BMI
Weight
Height
Cohort
0 2 4 6 8 10 12 Age in Years
Sta
nd
ard
Devia
tion
(Z
) S
core 0.05
0
- 0.05
- 0.10
- 0.15
- 0.20
- 0.25
4630 Helsinki boys357 developed CHD
Barker DJ. TRENDS Endo Metab 13; Nov 2002Barker DJ. TRENDS Endo Metab 13; Nov 2002

DEVELOPMENTAL ORIGINS OF DEVELOPMENTAL ORIGINS OF HEALTH & DISEASEHEALTH & DISEASE
In UteroIn Utero
BirthBirth
ChildhoodChildhood
AdulthoodAdulthood
Low Birthweight/IUGR
FetalUndernutrition
“Metabolic Syndrome”
Abd’l Obesity HTN
CAD Diabetes
TG/ HDLRenal Failure
AcceleratedAccelerated GrowthGrowth++
Infant Undernutrition 0-1 yr
Food: Access Palatability
Inte
r-Gen
era
tion
al
Tra
nsm
issio
n

Epigenetics
• Epigenetics = the study of stable alterations in gene expression that arise during development and cell proliferation Epigenetic phenomena do NOT change the actual, primary genetic sequence
• Epigenetic phenomena are important because, together with promotor sequences and transcription factors, they modulate when and at what level genes are expressed
• The protein context of a cell can be understood as an epigenetic phenomena.
• Examples include: DNA methylation, histone hypo-acetylation, chromatin modifications, X-inactivation, and imprinting.
http://cnx.rice.edu/content/m11532/latest/

Epigenetic mechanisms for nutrition determinants of later health outcomes.
(Zeisel, Am J Clin Nutr, 2009)• “epigenetic code is a series of marks added
to DNA or to proteins (histones) around which DNA is wrapped.”
• Methylation, covalent modifications of histones and chromatin and RNA
• Some “marks” can be inherited
• Examples of the impact of this inheritance:• Grandmother’s smoking in pregnancy & risk of asthma
in grandchildren• Brains from suicide victims, methylation of 5’ regulatory
region of genes encoding ribosomal RNA associated with early childhood abuse & neglect

Copyright ©2009 The American Society for Nutrition
Zeisel, S. H Am J Clin Nutr 2009;89:1488S-1493S
FIGURE 1 Epigenetic marks alter gene expression

Copyright ©2010 American Physiological Society
Heerwagen, M. J. R. et al. Am J Physiol Regul Integr Comp Physiol 299: R711-R722 2010;
Fig. 2. General example of epigenetic regulation of gene transcription
General example of epigenetic regulation of gene transcription. Epigenetic regulation of gene expression is characterized by stable changes to DNA and chromatin structure that alter gene expression independent of gene sequence. The primary forms of epigenetic control involve DNA methylation by DNA methyl-transferase (DNMTs), and histone tail
modifications, such as acetylation/deacetylation, by histone acetyl-transferase (HAT) and histone deacetylase (HDAC) activities, respectively. Additionally, microRNAs have recently
been shown to regulate DNA methylation as well. Histone tail acetylation promotes an open-chromatin conformation, and is associated with regions of active gene expression,
while histone tail deacetylation promotes a closed-chromatin conformation and is associated with gene silencing. DNA methylation of cytosine guanine (CpG) dinucleotides
in the 5' promoter region of genes generally induces transcriptional silencing, both by blocking transcription factor binding and by promoting the recruitment of transcriptional corepressors or histone-modifying complexes. MeBP, methyl-CpG binding protein; TF,
transcription factor; Pol II, DNA polymerase II.

DNA methylation differences after exposure to prenatal famine are common and timing- and sex-
specific. Tobi et al, Hum Mol Genet. 2009 Nov 1;18(21):4046-53 • Methylation of INSIGF was lower among
individuals who were periconceptionally exposed to the famine (n = 60) compared with their unexposed same-sex siblings
• Methylation of IL10, LEP, ABCA1, GNASAS and MEG3 was higher
• “persistent changes in DNA methylation may be a common consequence of prenatal famine”

Are Nutrition-Induced Epigenetic Changes the Link Between Socioeconomic Pathology and Cardiovascular
Diseases? Lopez-Jaramillo et al. Am J Ther. 2008 Jul-Aug;15(4):362-72.

Are Nutrition-Induced Epigenetic Changes the Link Between Socioeconomic Pathology and Cardiovascular
Diseases? Lopez-Jaramillo et al. Am J Ther. 2008 Jul-Aug;15(4):362-72.

Early Risk Determinants and Later Health Outcomes: Research Priorities
(Field, Am J Clin Nutr, 2009)
• ID biological mechanisms responsible for lasting and later health effects
• ID genes; research on genomics, metabolomics and epigenetics
• Understand imbalanced nutrition; focus on overnutrition during critical periods
• Understand social/environmental factors that influence critical windows
• ID how and when to intervene to prevent later disease


![Index [assets.cambridge.org]assets.cambridge.org/97805218/88592/index/9780521888592_index.pdfasphyxia, fetal responses to asphyxia asphyxiated premature infant, nutritional support](https://img.dokumen.tips/doc/110x75/5ec8c6c7fa5f903eb574a157/index-asphyxia-fetal-responses-to-asphyxia-asphyxiated-premature-infant-nutritional.jpg)