Embed Size (px)
Citation preview

UPTEC X 06 021 ISSN 1401-2138
MAY 2006
GUSTAV KARLBERG
Interaction studybetweencMyBP-C and FHL1
Master’s degree project
2
UPTEC X 06 021 Date of issue 2006-05
Author
Gustav Karlberg
Title (English)
Interaction study between cMyBP-C and FHL1
Title (Swedish)AbstractHypertrophic Cardiomyopathy (HCM) is a disease that affects the structure of the sarcomerein muscles. It has been related to mutations in the cardiac Myosin Binding Protein-C(cMyBP-C). The Four and a Half LIM domain 1 protein (FHL1) has several different tasks inthe cell. Recent studies have shown that these proteins interact with each other indicatingtheir importance in the development of the heart. Overexpression of FHL1 in transgenic micehave shown the formation of myosacs, while in the mice where the gene was inactivatedusing RNAi, there were long and thin sarcomeres. The cells lack the ability to developmyosin thick filaments. This study aimed to further characterize the interaction betweencMyBP-C and FHL1. Optimisation of overexpression in E. coli cells was performed for bothcMyBP-C and FHL1. Further proof of the interaction was found by co-expression of the twoproteins. A truncated version of FHL1 was purified and characterized for protein size andfolding. First attempts in finding the minimal binding domain was performed using yeast twohybrid screening.
KeywordscMyBP-C, FHL, protein interaction, overexpression optimisation
Supervisors
Jacqui MatthewsUniversity of Sydney
Scientific reviewerGunnar Johansson
Uppsala university
Project name Sponsors
LanguageEnglish
Security
ISSN 1401-2138Classification
Supplementary bibliographical information Pages43
Biology Education Centre Biomedical Center Husargatan 3 UppsalaBox 592 S-75124 Uppsala Tel +46 (0)18 4710000 Fax +46 (0)18 555217
Molecular Biotechnology Programme
Uppsala University School of Engineering
3
Interaction study between cMyBP-C and FHL1
Gustav Karlberg
Sammanfattning
Hyperotropisk cardiomyopati (HCM) är en sjukdom som uppstår på grund avmutationer i de strukturella proteinerna i hjärtmuskeln. En mutation i ”cardiacMyosin Binding Protein C” (cMyBP-C) är den vanligaste orsaken till HCM. ”Fourand a half LIM domain protein 1” (FHL1) har olika funktioner i cellen. Proteinetdeltar bland annat i genreglering och styr på så vis utvecklingen. Studier har visat attdessa två proteiner, FHL1 och cMyBP-C, kommunicerar med varandra och dennakommunikationen kan ha en viktig roll i utvecklingen av hjärtat.
Överuttryck av FHL1 i mus har visat att myosin utvecklingen störs och istället för attbilda tjocka filament, bildas säck-liknande strukturer av myosin i musklerna. Försökhar även gjorts där uttrycket av FHL1 förhindras med RNAi, korta RNA bitar. Näruttrycket förhindras bildas långa sarcomerer då bildandet av tjocka myosin filamentförhindras och långa smala filament bildas.
I den här studien karaktäriseras interaktionen mellan cMyBP-C och FHL1. Målet varatt åstakommma högt uttryck av FHL1 och cMyBP-C i E. coli. Bevis för attproteinerna interagerar med varandra var att proteinernas löslighet höjdes när de bådauttrycktes i samma cell. En kortare version av FHL1 analyserades med avseende påstorlek och veckning. Interaktionen eftersöktes även i levande celler genom uttryck ijästceller och en metod som heter jäst två hybrid.
Uppsala Universitet maj 2006
20p examensarbete i Molekylär bioteknik.

4
Index:
1. Introduction..........................................................................................................6
1.1 Hypertrophic cardiomyopathy ..........................................................................6
1.1.1 Hypertrophic cardiomyopathy (HCM) background ....................................6
1.1.2 Muscle proteins .........................................................................................6
1.1.3 Myosin binding protein-C (MyBP-C).........................................................71.2 Protein interactions in gene expression .............................................................8
1.2.1 Protein-protein interactions ........................................................................9
1.2.2 The LIM domain........................................................................................9
1.2.3 Four and a half LIM domain protein (FHL)..............................................10
1.2.4 FHL1 .......................................................................................................12
1.3 The interaction between cMyBP-C and FHL1 ................................................12
1.4 Aims for the project........................................................................................13
2. Materials and Methods ......................................................................................14
2.1 Chemicals and reagents ..................................................................................14
2.1.1 Plasmids and vectors................................................................................14
2.1.2 Cell strains and cultures ...........................................................................14
2.2 Preparation of cMyBP and FHL constructs .....................................................15
2.2.1 Bacterial transformation...........................................................................16
2.2.2 DNA extraction and restriction enzyme digestion ....................................16
2.2.3 Ligation ...................................................................................................16
2.2.4 Direct-ligation and transformation of linker constructs in pGEM! vector .16
2.3 Overexpression and purification of recombinant proteins................................17
2.3.1 Overexpression trials ...............................................................................17
2.3.2 Solubility trials ........................................................................................17
2.3.3 Protein purification by Ni-NTA agarose affinity chromatography ............18
2.3.4 Protein purification by GST affinity chromatography...............................18
2.3.5 Affinity chromatography purification of protein complex ........................18
2.3.6 SDS-PAGE analysis ................................................................................18
2.3.7 Ion exchange and gel filtration .................................................................18
2.4 Characterization of proteins ............................................................................19
2.4.1 Determination of protein concentration ....................................................19
2.4.2 Multiple Angle Laser Light Scattering (MALLS).....................................19
2.4.3 Far UV Circular Dichroism Spectropolarimetry (CD) ..............................19
2.5 Yeast two Hybrid............................................................................................19
2.5.1 Making competent yeast cells ..................................................................20
2.5.2 Transformation of yeast cells ...................................................................20
2.5.3 Y2H Spot-test ..........................................................................................20
3. Optimisation of overexpression .........................................................................21
3.1 FHL1 1/2 LIM 1+2.........................................................................................21
3.2 FHL 1.............................................................................................................21
3.4 Co-expression FHL 2 1/2 pAC28 and 7-10 cMyBP-C pGex ...........................25
3.5 Linker constructs with FHL1, FHL 2 1/2 and 7-10 cMyBP-C .........................26
3.6 Optimised overexpression protocols ...............................................................27
4. Purification and characterization of FHL 2 1/2 ................................................28
4.1 Multiple Angle Laser Light Scattering (MALLS) ...........................................29
4.2 Far-UV Circular Dichroism Spectropolarimetry (CD).....................................30
4.3 Conclusions for purifying and characterization of FHL 2 1/2 ..........................31
5. Interaction between FHL 2 1/2 and 7-10 cMyBP-C ..........................................32

5
5.1 Interaction between FHL 2 1/2 and 7-10 cMyBP-C in vitro ............................32
5.2 Interaction between FHL 2 1/2 and cMyBP-C in vivo. ....................................33
5.3 Conclusions from interaction studies ..............................................................36
6. Final Summary and Discussion .........................................................................37
6.1 Overexpression...............................................................................................37
6.2 Characterization of FHL 2 1/2 ........................................................................37
6.3 Interaction between cMyBP-C and FHL 1 ......................................................38
6.4 Future studies .................................................................................................38
Acknowledgements: ...............................................................................................40

6
1. Introduction
1.1 Hypertrophic cardiomyopathy
1.1.1 Hypertrophic cardiomyopathy (HCM) background
Cardiomyopathy is a condition where the heart muscle is abnormal. There arefour different types of cardiomyopathy; Hypertrophic (HCM), Dilated (DCM),Restrictive (RCM) and Arrhythmogenic right ventricular (ARVC). The HCM refers toa condition where the heart muscle shows an excessive thickening that is related to themisalignment of the sarcomere. This thickening is located in the left ventricle of theheart and has major impact on the function of the heart, making the cavity in the leftventricle smaller. This means that the heart will pump less blood in each stroke. Anextensive increase in the size of the muscle can also interfere with the shutting of themitral valve making blood leak back to the left atrium or even disrupt blood flow bysticking to the septum. Patients with HCM have different symptoms such as shortnessof breath, chest pains, palpitation (awareness of heartbeat) or light-headedness andblackouts. They suffer an increased risk of sudden premature death. HCM has beenassociated with mutations in the structural proteins of the sarcomere, but the cause ofthe condition is not completely known.
1.1.2 Muscle proteins
The sarcomere is the functional part of a muscle between two Z-lines (Figure1). The sarcomere consists of two different filaments. Thick filaments are built up bymyosin proteins and are found in the A-band of the muscle. The thin filaments arebuilt up by actin protein found in the I-band. The actin filaments extends in to the Aband creating dark areas in the A-band called the C-zone (Figure 1). The contractionand relaxation of cardiac muscle are mediated by the sliding of thick and thinfilaments within the sarcomeres. When a muscle contracts the head of the myosinfilament phosphorylates and pulls the actin band towards the middle, shortening thesarcomere and contracting the muscle.
Titin is a protein that has been characterized and found to organize thestructure of the sarcomere. It exists as one of the largest polypeptides found in natureto date; the gene coding for titin contains 363 exons and 114,114 base pairs
Figure 1. The sarcomere is the smallest contractive part of the muscle. Actin is connected to the Z-line and extends through the I-band to the crossover with myosin. This area is called the C-zone.The M-line is the middle of the myosin filament. The figure is reprinted from L.Kravitz.(www.unm.edu/~lkrawitz)

7
(Tskhovrebova and Trinick, 2004). The titin molecule spans one half of the sarcomerewith the end of the molecule in the Z-line and the M-line. Titin binds to the Z-line andto the thick filaments in the C-zone of the A-band, creating a structural spring for themuscle (Granzier et al., 2005). Titin can bind several other proteins in the sarcomerethrough its immunoglobulin (IgI) and fibronectin-type 3 (Fn3) domains. Thesestructural components are very common in the intracellular proteins involved inmuscle contraction (Tskhovrebova and Trinick, 2004). Complexes created by bindingto titin mediate several different functions in the sarcomere (Granzier et al., 2005).
1.1.3 Myosin binding protein-C (MyBP-C)
Myosin binding protein-C is a protein localized to the C-zone of striatedmuscle sarcomeres (Craig and Offer, 1976). Mutations in this protein are one of themost common causes for HCM. MyBP-C was found to create stripes across the C-zone of the A-band using labelling with antiserum, suggesting that parts of MyBP-Care located on the thick filament surface. Based on transverse sections of stainedmuscle it was suggested that MyBP-C wraps around the thick filament (Craig andOffer, 1976). The structure of MyBP-C has been characterized and three isoforms areknown to exist in adult muscle: slow type skeletal (stMyBP-C); fast type skeletal(ftMyBP-C); and, cardiac (cMyBP-C). Separate genes encode the three differentisoforms. stMyBP-C is found on chromosome 19q13.33, ftMyBP-C on 12q23.3 andcMyBP-C on 11p11.2 (Flashman et al., 2004). All three isoforms consists of similarstructures. They contain 10 globular domains named C1-C10. C1-5,8,10 are allimmunoglobulin I-like (IgI-like) domains, while C6-7,9 are Fn3 domains. Thestructure is conserved mainly in the cysteine residues and have been indicated tomediate interactions between proteins. The Fn3 domain in titin has been shown tobind myosin, and an interaction between MyBP-C and titin is also localized to the Fn3domain (Muhle-Goll et al., 2001). The cardiac isoform cMyBP-C differs from the twoskeletal ones by the addition of another IgI domain, labelled C0. It also contains anine-amino acid insert (LAGGGRRIS) in the region between C1 and C2, called theMyBP-C motif, and a 28-amino acid loop in the C5 domain (Figure 2). The skeletalisoforms differ by an extension of the N-terminus of slow skeletal MyBP-C(Flashman et al., 2004).

8
Cardiac MyBP-C (cMyBP-C) has been shown to be expressed early in themammalian cardiac development together with myosin and titin (Gautel et al., 1998).This suggests a role in the development of the heart and the organization of thesarcomere. The localization of MyBP-C to the C-zone enables MyBP-C to bind bothmyosin and titin. The binding of light meromyosin (LMM), the rod region of myosin,to the C-terminal domain C10 of MyBP-C has also been characterized (Miyamoto et
al., 1999). This binding has been shown to be essential in the ability to polymerisemyosin (Sebillon et al., 2001). MyBP-C also binds myosin in the N-terminal C1-C2domains connecting the junction between the myosin head and the thick filamentbackbone. Suggestions have been made that this works as a dynamic network toregulate both myosin flexibility and the interaction with actin (Gruen and Gautel,1999). The role for MyBP-C in striated muscle is still under debate. However,indications of a requirement for MyBP-C in the formation and stabilization of myosinthick filaments have been found. In particular, the C10 domain of MyBP-C isessential for the formation of long, uniform and compact thick myosin filaments(McGrath et al., 2006).
1.2 Protein interactions in gene expression
To control the development of a eukaryote each cell needs to be able toactivate and repress the expression of different specific genes at different times. Thisprocess is called gene regulation. The proteins involved in gene regulation can bedivided in two groups, basal transcription factors and specific transcription factors.The basal transcription factors are needed for expression of most genes. Theyrecognize the common DNA motif TATA-box situated ~25bp upstream of the codonstart site. Several transcription factors are also required interact to position the RNA IIpolymerase on the DNA and start transcription. The specific transcription factors areexpressed in different cell types at distinct stages of development. In general they bindspecific regions on the DNA, typically upstream from the transcription start sequence.
Figure 2. Schematic representation of the domains in MyBP-C, skeletal isoforms on top, cardiacbelow. IgI-like domains are in blue, Fn3 domains in yellow. cMyBP-C contains theLAGGGRRIS insert in the MyBP-C motif, an extra IgI-like domain C0 and a 28-amino acid loopin C5. Picture adopted from Flashman and co-workers 2004.

9
However, binding has also been shown to occur on downstream sites in the DNA(Wardrop and Brown, 2005). When bound to the DNA the specific transcriptionfactor can interact with the basal transcription factors to initiate transcription of thegene (Muller and Tora, 2004). Alternatively, transcription factors can negativelyregulate the expression of a gene by binding DNA and physically blocking theinitiation of transcription (Moehren et al., 2004). A third way of controlling theexpression of the gene is by controlling the availability of the DNA to the basaltranscription machinery through modification of chromatin. By recruiting histonemodifying enzymes transcription factors can alter the state of the DNA making thecoiling round the histone tighter or looser (Koipally et al., 1999).
One example of specific transcription regulators is the GATA protein familyof proteins. Members of this family bind the HGATAR motif in the DNA and theninteract with basal transcription factors (Ferreira et al., 2005).
1.2.1 Protein-protein interactions
Protein-protein interactions between specific transcription factors representanother level of regulation for controlling gene expression. For example multipleproteins can compete for binding to the same partner. By regulating the geneexpression for the different proteins involved, the cell can control the proteinabundance levels and thus their activities and the resulting development of the cell.Proteins that are involved in gene regulation without directly binding DNA are termedcofactors. Interactions between proteins can often take place at defined motifs in theprotein. A core determinant is recognized, along with flanking or non-contiguousresidues for extra contact sites that provide an element of selectivity of the interactiondomain for its target (Pawson and Nash, 2003). Some of the modes for targetrecognition used by protein binding modules have been well-characterized e.g. Srchomology3 (SH3) domains bind the PxxP motif (Ghose et al., 2001), and PDZdomains recognize a short C-terminal peptide (Nourry et al., 2003). Notably,additional studies have shown that PDZ also can interact with other motifs throughPDZ:PDZ interactions, thus widening the variety of potential interacting partners forthis domain (Nourry et al., 2003). One common motif for protein interactions ineukaryotes is the LIM domain.
1.2.2 The LIM domain
The LIM domain is a 50-60 amino acid motif that is rich in both histidine (H)and cysteine (C). It is found in a many eukaryotic proteins that have a wide range ofdifferent functions—from transcriptional regulation to signal transduction to roles inthe cytoskeleton. The name LIM was derived from the three proteins where thestructure was first found. In 1988 Way & Chalfie characterized the gene that encodedCaenorhabtidis elegans MEC-3. They noted that the protein contained ahomeodomain as well as a sequence that up to that time was unknown (Way andChalfie, 1988). The sequence was later found in the C. elegans protein LIN-11 (Freydet al., 1990) and in the rat protein Isl-1 (Karlsson et al., 1990). Analysis of thesequences indicated that these domains might be able to bind metal ions, andsubsequent experiments showed that each LIM domain binds two zinc(II) ions(Michelsen et al., 1993).
The solution structures (figure 3) for several different LIM domains have beensolved by multidimensional Nuclear Magnetic Resonance (NMR) spectroscopy,including the cysteine-rich protein CRP (Perez-Alvarado et al., 1994), the cysteine-rich intestinal protein CRIP (Perez-Alvarado et al., 1996) and the cysteine-rich

10
protein CRP2 (Konrat et al., 1998). In later years crystal structures of the LIM domainhave been achieved eg. LIM-only protein and LMO4 (Deane et al., 2004)
Each zinc-binding module in the LIM domain consists of two orthogonallypacked antiparallel "-hairpins and terminates in a short #-helix, although the #-helixat the end of the first zinc-binding module is often very small (Deane et al., 2004).This fold is an example ofa Treble clef Zinc-finger (Matthews and Sunde, 2002). The
structure of each zinc-binding module of the LIM domain very strongly resemblesthat of the transcription factor GATA1. Thus, it was long thought that the LIMdomain would have bind DNA (Sanchez-Garcia and Rabbitts, 1994) but to date, noexperimental evidence has demonstrated that LIM domains can bind DNA.
However, several studies have shown that LIM domains have the ability tomediate protein:protein interactions. The ability of CRP to homodimerize was foundto be coordinated by a LIM domain (Feuerstein et al., 1994) and a fairly recent reviewprovides additional information regarding known LIM domain interactions (Bach,2000).
1.2.3 Four and a half LIM domain protein (FHL)
The FHL proteins are a family of LIM domain proteins. Five different types ofFHL proteins are known to date, FHL 1-4 and Activator of CREM in testis (ACT).The FHL proteins consist of four whole LIM domains and an N-terminal single zincfinger domain similar to the C-terminal part of the LIM domain, hence the name “fourand a half LIM domain”. The different members of the FHL family show highsequence identity and similarity see Table 1 (Morgan and Whawell, 2000). Thesequence is also highly conserved between different species, hFHL1 have a 94.3%identity with mFHL1 (Morgan and Whawell, 2000).
Figure 3. A&B are adopted from Kadermas & Beckerle (Kadrmas and Beckerle, 2004).A. The amino acid sequence of LIM domains. The cysteine residues are highly conserved through the sequence.B. Numbers 1-8 represent the zinc binding cysteine marked 1-8 in A. Black residues are semi-conservedaliphatic residues.C. Shows the 3D structure of one LIM domain. This is a LIM domain from CRP2 (Kontaxis et al., 1998)

11
Table 1. Sequence identity (bottom part) and similarity (upper part) in % betweenproteins in the FHL family. Altered from Morgan M.J. & Whawell S.A, 2000. Allproteins are human except for FHL4, which is from mouse (m).
FHL1 FHL2 FHL3 mFHL4 ACT
FHL1 -- 61.1 51.2 78.6 53.7
FHL2 47.9 -- 65.7 61.4 73.2
FHL3 41.6 51.8 -- 51.6 60.6
mFHL4 71.1 48.2 40.9 -- 54.4
ACT 42.1 58.5 46.5 43.9 --
Studies have shown a vast variety of different tasks involving the FHLproteins. Members of this family are differentially expressed in a variety of tissuesand cell types in the body. FHL proteins were first discovered in skeletal muscle andtherefore they formerly went under the name SLIM (for skeletal LIM domainproteins)(Morgan and Madgwick, 1996).
The best-characterized members of the FHL family are FHL2 and FHL3. TheFHL2 protein is most abundantly expressed in the heart, but can also be found inseveral other organs and tissues eg. bladder, kidney, prostate (Scholl et al., 2000). AllFHL proteins show expression in a variety of tissue except FHL4, which is believedto be expressed only in the testis (Morgan and Madgwick, 1999). Studies have shownthat FHL2 is found in both the cytoplasm and the nucleus of the cell, but it does notcontain an obvious nuclear localization signal or export signal. The molecular mass ofFHL2 (32kDa) lies below the 50kDa upper limit for nuclear pore diffusion and lowerlimit for active transport. Thus it is believed that FHL2 can passively shuttle betweenthe nucleus and the cytoplasm (Johannessen et al., 2006). Both FHL1 and FHL3 haveshown a similar distribution in the cell (Brown et al., 1999b, Li et al., 2001). Theability of these and similar proteins to reside both in and outside the nucleus has beenpostulated as a signalling mechanism between the nucleus and the cytoplasm (Brownet al., 1999b) (Morlon and Sassone-Corsi, 2003, Muller et al., 2002). The distributionof FHL proteins in the cell is altered by exposure of the cell to different stimulus(Ibid.). All FHL proteins are implicated as transcriptional cofactos, and they appear tobind several different proteins using different LIM domains. In combination, theseproperties strongly imply that a primary function of FHL proteins is to act as signaltransducers between the nucleus and the cytoplasm.
FHL2 has several different functions in the body (reviewed thoroughly byJohannessen et.al.. 2005.). In particular, it is thought to be an important part of thedevelopment of the cardiac septa and circulatory system. FHL2 is highly expressed inembryonic hearts compared to other organs, and the levels of protein were highest inthe ventricular septum and areas round the atrio-ventricular ring (Chu et al., 2000).FHL2 also has an important role in the formation of bone. FHL2 expression levelsincreased threefold when bone marrow cells differentiated into osteoblasts (Amaar et
al., 2002). The role of FHL2 in skeletal muscle has not yet been characterized, butmany indications of a role in the function of this tissue have been found. FHL2interacts with Titin, which has an important role in organising the sarcomere,indicating a helper function of energy provision during muscle contraction (Lange et
al., 2002).

12
1.2.4 FHL1
FHL1 is the least characterized protein in the FHL family. FHL1 is expressedin skeletal muscle (SLIM1) (Morgan and Madgwick, 1996) and in heart muscle(Brown et al., 1999a). Trials have shown that, like FHL2, FHL1 can be present indifferent parts of the cell and may mediate signalling between the cytoplasm and thenucleus (Brown et al., 1999b). The same study found a novel isoform of FHL,SLIMMER. This isoform is identical to FHL1 except for the C-terminus, whichcontains a 96 amino acid extension with a potential nuclear localization signal. Theisoform was found in the nucleus of myoblasts, but following differentiation tomyotubes was located only in the cytoplasm (Brown et al., 1999b). The same groupalso found proof of FHL1 regulating the adhesion, spreading and migration ofmyoblasts. This study showed that FHL1 moves from the nucleus to cytoplasmdependent on the signals of integrins, indicating again that FHL1 functions assignalling molecule between the cytoplasm and the nucleus, and as for FHL2, thesignalling can be controlled by different external stimuli (Robinson et al., 2003). Forexample, FHL1 is upregulated by cAMP, a signal molecule that interacts with proteinkinase A (PKA) and which can interact and phosphorylate the cAMP responseelement binding protein (CREB). CREB interacts with several cofactors to control theexpression of responsive genes (Boissel et al., 2004). The study demonstrated thatFHL1 and FHL3 can interact with CREB in the absence of PKA, meaning that theycan control the expression of CREB specific genes (Boissel et al., 2004).
It has also been shown that FHL1 is expressed in a restricted area ofdeveloping and mature hearts. The expression was localized to the outflow tract of thedeveloping heart indicating an important role in the developmental regulation of theheart (Brown et al., 1999a).
This thesis will examine the properties of FHL1 and its interaction withcardiac myosin binding protein C (cMyBP-C).
1.3 The interaction between cMyBP-C and FHL1
Studies have provided evidence that FHL, acting together with other proteins,have an important role in development and functions of different tissues. The mostrecent study by McGrath and co-workers (McGrath et al., 2006) demonstrated aninteraction between cMyBP-C and FHL1. MyBP-C was identified as a bindingpartner of FHL1 through a yeast two hybrid (Y2H) screen. The study used a truncatedversion of FHL1 consisting of the first two and a half LIM domains FHL1 (1/2 LIM1+2) (FHL 2 1/2). It was shown that C10 stMyBP-C is required for binding to FHL 21/2. This result suggests that FHL1 might be competing with myosin for binding ofthe C10 domain. The study also showed that FHL1 is likely to compete for thebinding of C6-C10 domains with myosin. Additional in vitro and in vivo experimentswere carried out to validate the presence of the interaction. To demonstrate in vitro
binding GST-pull down assays were carried out using a construct of GST-cMyBP-C(C6-C10). FHL1 bound to the construct but not to the GST-only control. Further co-immunoprecipitation experiments using endogenous proteins confirmed the presenceof an interaction in vivo.
The same group was able to determine the localization of FHL1 in matureskeletal muscle in mouse, by staining with antibodies. The immunostaining evidenceindicated that FHL1 is found in the I-bands, Z-line, the sarcolemma, and occasionallyin the M-line. Further, a partial co-localization between MyBP-C and FHL1 wasfound in the sarcolemma of the muscle. Trials in isolated skeletal myofibrils indicate

13
that the FHL1 in the M-line extends in to the C-zone, where MyBP-C is found in themuscle.
To investigate the consequences of complex formation between FHL1 andMyBP-C both overexpression of FHL1 and knockouts using RNAi were performed intransgenic mice. When FHL1 was overexpressed in differentiating C2C12 skeletalmyoblast, the formation of myosacs was found. Myosac is a term used to describe aphenotype of enlarged, sac-like myotubes and indicates impaired sarcomereformation. When the expression of FHL1 was knocked out with RNAi, myotubeswere observed to become long and thin, and showed a linear arrangement of nucleiand a striated pattern. This indicates that the Z-line was correctly assembled and thephenotype was rescued. The knockout of FHL1 also resulted in the inability of thecell to create myosin thick filaments. This result is associated with reducedincorporation of MyBP-C to the sarcomere (McGrath et al., 2006).
1.4 Aims for the project
An interaction between FHL1 and cMyBP-C has been demonstrated, butfurther understanding of the interaction is needed in order to determine the role ofFHL1 as a cofactor for cMyBP-C in myosin thick filament development. This mayalso give important insights into the prominent role of mutated cMyBP-C inhypertrophic cardiomyopathy.
The aim of this project was to further characterize the interaction betweenFHL1 and cMyBP-C in order to gain a better understanding of their interaction.Aim 1: Define the minimum interacting domains of cMyBP-C and FHL1.
Attempts were made to define the smallest binding domain of each proteinusing yeast two hybrid assays with truncated versions of cMyBP-C and FHL1.Aim 2: To characterize FHL1 (1/2 LIM 1+2).
The two proteins involved in the interaction, and in particular FHL1, arecurrently not well characterized. The project also aimed at characterizing thetruncated FHL1 (1/2 LIM 1+2). Expression trials were carried out to establish anexpression protocol. This protein was also purified characterized in terms of its massand folded state.Aim 3: Characterizing the complex at a molecular level.
To characterize the complex at a molecular level, milligram quantities of bothproteins are required, necessitating the overexpression of these proteins and theprotein complex in E. coli. A variety of different expression protocols were tested inorder to optimise levels of expression, establish a purification protocol and to confirmthe presence of the interaction between these recombinant forms of the proteins.

14
2. Materials and Methods
2.1 Chemicals and reagents
All chemicals were of analytical reagent (AR) grade unless otherwisespecified. Standard laboratory chemicals were obtained from Sigma (Castle Hill,NSW).
Bacteria culture casein peptone pancreatic digest type M, yeast extract andagar came from Amyl Media (Dandenong, VIC). Peptone, yeast extract and yeastnitrogen base without amino acids for yeast culture were obtained from Difco (DetroitMI, USA).
Type II restriction endonucleases: Bam HI, Bgl II and Eco RI, New EnglandBiolabs (Beverly, MA), T4 DNA ligase, Progen (Darra, QLD).The following chemicals were purchased as indicated:100bp DNA ladder Genesearch (Arundel, QLD)
Agarose (DNA grade) Promega Corporation (Annandale, NSW)
Ampicillin (AMP) Sigma (Castle Hill, NSW)
"-mercaptoethanol Sigma (Castle Hill, NSW)
Chloramphenicol (CAM) Sigma (Castle Hill, NSW)
d6-methyl sulfoxide (DMSO) Aldrich Chemical Co. (Milwaukee, WI)
Deoxynucleotide triphosphates (dNTP’s) Boeheringer Mannheim (Castle Hill,
NSW)
Ethidium bromide Boeheringer Mannheim (Castle Hill,
NSW)
Glutathione-Sepharose$ 4B GE Healthcare (Castle Hill, NSW)
Isopropyl "-D-
thiogalactopyranoside(IPTG)
Astral (Gymea, NSW)
Kanamycin (KAN) Sigma (Castle Hill, NSW)
Mark 12% molecular weight protein
standard
Novex (Terry Hills, NSW)
N,N,N,N’-tetramethyletylenediamine
(TEMED)
Sigma (Castle Hill, NSW)
2.1.1 Plasmids and vectors
The pGEX-2T (AMPr; GE Healthcare, Castle Hill, NSW) was used in theoverexpression of constructs. The target protein is expressed in a fusion with C-terminus glutathione S-transferase (GST; 26kDa). The construct can be expressed inE. coli cells after induction by IPTG.
The pRSET3 (AMPr) (Invitrogen, Mount Waverley, VIC) was used to expresstarget protein fused with six histidine residues (HIS6) at the N-terminus. This vector isalso used to overexpress constructs using IPTG to induce expression in E. coli.
For co-expressing two proteins in the same cell the pAC28 vector (KANr; Kholod andMustelin 2001) was used. This vector also contains a HIS6 affinity tag at the N-terminus.
For direct cloning of a PCR product the pGEM-2T (AMPr; Promega, WI,USA) vector was used.
2.1.2 Cell strains and cultures
The DH5# strain (Bethseda Research Laboratories, MD, USA) of E. coli wasused for plasmid DNA preparation and amplification. The E. coli strain BL21 (DE3;Integrated Sciences, Willoughby, NSW), was used for overexpression. E. coli BL21

15
(DE3) Rosetta (Merckbiosciences, Kilsyth, VIC) was also used. This strain containssix tRNA for rare E. coli codons (AUA, AGG, AGA, CUA, CCC, GGA). The finalstrain used was the E. coli Trx strain. This strain co-produces bacterial Thioredoxin toincrease the solubility of the expressed protein (Yasukawa et al., 1995).
All cell cultures were grown in autoclaved Luria-Bertani (LB) broth (1%Casein peptone pancreatic digest, 0.5% yeast extract, 0.5% NaCl) supplemented withthe appropriate antibiotic (AMP, 50 µg/ml; KAN, 50 µl/ml; and/or CAM, 34 µl/ml).
2.2 Preparation of cMyBP and FHL constructs
Single stranded oligonucleotides used for synthesis of constructs wereobtained from Sigma Genosys (Castle Hill, NSW). Full length FHL1 was obtainedfrom Kate Edwards (University of Sydney) and the shorter version FHL1 (1/2 LIM1+2) was synthesised in the lab using polymerase chain reaction PCR. cMyBP-c wasprovided by Professor Christina Mitchell (Monash University, VIC) and all shorterversions were synthesised in the laboratory using PCR.
All PCR reactions were done in 50 µl reaction volume containing 2.5U of oneor two enzymes. The two different enzymes used were Pfu Turbo$
DNA polymeraseand Taq DNA polymerase. Pfu Turbo$
and its provided buffer came from Stratagene(CA, USA), Taq DNA polymerase and buffer were from Boehringer Mannheim(Castle Hill, NSW). Buffers and dNTPz were added to 0.1 M concentrations and 10pmol of each primer was used. 5 µl of DMSO was added to the reaction. The reactionwas run on a PCR Sprint thermal cycler from Hybaid (Middlesex, UK) for 30 cycles,consisting of one minute at 92°C for denaturation, one minute of 55°C for annealingand three minutes of 72°C for extension. Reactions were stored at 4°C whencompleted.
All PCR products contained an Eco RI and Bam HI restriction site in each end.Linker constructs were synthesised with a Bam HI and a Bgl II restriction sites.
Table 2. Primers used for PCR synthesising of constructs.Lab
ref.
Nr
Type Restriction
site
Sequence 5’-3’
1563 FHL
forward
Bam HI cgggatccatgtcggagaagttcgac
1558 7-10
cMyBP
forward
Bam HI cgggatccatgcctatcggtccccc
1810 7-10
cMyBP
linker
reverse
None cagacccaccggagccaccctgaggcactcgcacc
1811 FHL1
linker
reverse
None cagacccaccggagccacccagctttttggcacagtc
1812 FHL1
2.5
LIM
reverse
None cagacccaccggagccaccatgtttggcgaacttggtc
1813 Linker Bgl II gaagatctagagccaccgctcccgccctggaagtacaggtttcagacccaccggagcc

16
Construction of both proteins linked with a flexible glycine rich linker wasconducted using two rounds of PCR with Taq polymerase and conditions as above.The first reaction was done using the vector construct as template. The secondreaction used the first reaction product as template to get the overlapping linkerprimer to work.
2.2.1 Bacterial transformation
Competent E. coli cells were used to transform inserts and vectors foramplification and for expression. 50 µl of cells were mixed with 50 µl of KCM (100mM KCl, 30 mM CaCl2, 50 mM MgCl2) and 2 µl of plasmid DNA. Tubes wereinverted gently five times to mix. Cells were then incubated for 20 min on ice. Tubeswere then heat-shocked at 42°C for 90 s, followed by two more minutes on ice. 200 µlof LB broth was added and cells were incubated at 37°C for an additional hour. 50 µlof transformed cells were spread on a LB agar plate with suitable antibiotics to selectfor the transformed vector. Plates were incubated at 37°C for 16h. From the plate onebacteria culture was selected and used to inoculate 10 ml of LB broth. The culture wasallowed to grow at 37°C O/N.
2.2.2 DNA extraction and restriction enzyme digestion
The plasmids were extracted from a 10 ml overnight culture (DH5# cells)using QIAprep Spin Miniprep kit (QIAGEN). Plasmids were eluted in a minimalamount of elution buffer (30 µl).For restriction enzyme digestion 22µl of vector DNA was mixed with 1µl of eachrequired restriction enzyme, 3µl of the recommended buffer and 0.1 mg/ml of bovineserum albumin. The different enzymes used were Eco RI, Bam HI and Bgl II. Themixture was incubated at 37°C for one hour. If the vector was being used, 1µl ofAlkaline Phosphate (AP) was added to dephosphorylate the vector and the solutionwas incubated for another 30 min at 37°C. The DNA was purified using 1% agarosegel electrophoresis; the band was cut out from the gel and the DNA extracted usingQIAquick Gel Extraction Kit (QIAGEN). Inserts were purified using 2% agarose gel.DNA was eluted using minimal amount of elution buffer (30µl).The inserts synthesised using PCR were cut and purified in the same way, excludingthe dephosphorylation step.
2.2.3 Ligation
To ligate the insert with the right vector 5µl of insert was mixed with 1µl ofvector, 1µl T4 DNA Ligase and 1µl of T4 Ligase buffer. Mixture was left at roomtemperature for at least 2 hours. The T4 DNA ligase was inactivated by heating to65°C for 20 min prior to transformation to competent DH5#-cells as the ligase has aninhibitory effect on the transformation.
2.2.4 Direct-ligation and transformation of linker constructs in pGEM! vector
The protocol provided by Promega Corporation (WI, USA) was used forligation set up and Promega provided all solutions and enzymes. PCR products wereproduced with Taq polymerase to enable direct ligation of ends. For ligation threedifferent tubes were set up, the ligation tube, a positive control and a backgroundcontrol. Reactions were set up according to table 3.

17
Table 3. Ligation reaction set up for direct ligation of PCR products using the pGEM!
vector. All solutions and enzymes were provided by Promega. Sterile water was usedto make the volume of each reaction 10 µl.
Ligation Positive control Background control
2X Rapid Ligation Buffer 5 µl 5 µl 5 µl
pGEM!-t vector 1 µl 1 µl 1 µl
PCR product 3 µl - -
Control insert - 2 µl -
T4 DNA Ligase 1 µl 1 µl 1 µl
Transformation was done as above (see 2.2.1) using DH5# cells, but selectionfor transformed colonies were carried out on LB agar 0.5mM IPTG and 80µg/ml X-#-gal plates.
2.3 Overexpression and purification of recombinant proteins
2.3.1 Overexpression trials
LB (10 ml) with appropriate antibiotic (AMP, 50 µg/ml; KAN, 50 µl/ml;and/or CAM, 34 µl/ml) was inoculated with cells from a single bacteria colony, andincubated at 37°C overnight with shaking at 180 rpm. 10 ml of LB with appropriateantibiotics were inoculated with the overnight culture to an OD600 of ~0.05. It wasthen incubated 37°C with shaking at 180 rpm until the culture had an OD600 of ~0.6.A 1 ml pre-induction aliquot was removed from the cultures at this stage.Overexpression was then induced using 0.4mM or 0.2mM IPTG. Cultures wereincubated at 20°C, 25°C or 37°C for 3-16 h. 1 ml aliquots were taken out every hourfor the 37°C cultures, and ~ half way through the incubation for longer trials. At theend of trials a 1 ml aliquot was taken. Remainder of the cultures were used forsolubility trials. Cells were harvested by centrifugation (5000 rcf, 4°C, 5 min), andanalysed by SDS-PAGE.
Large-scale protein expression was done the same way as overexpression trials above,but instead of 10 ml LB, 50 ml was inoculated and grown overnight. This overnightculture was then used to inoculate 1 l of LB broth with appropriate antibiotics.Cultures were grown at 37°C until they reached an OD600 of ~0.6. They were theninduced using the appropriate amount of IPTG.
Alternatively cultures were grown for three hours at 37°C or the temperaturewas decreased to 25°C and cultures were grown overnight. Cells were harvested bycentrifugation (5100 rpm, 4°C, 5 min) and stored at -20°C until lysis and purification.Cell pellets were resuspended in 1/10th of culture weight in volume lysis buffer (eitherNi- or GST-lysis buffer) and sonicated on ice 3x 40 s. Soluble and insoluble fractionswere separated by centrifugation (5000 rcf, 4°C, 10 min).
2.3.2 Solubility trials
The remaining cells from overexpression trials were used for solubility trials.Pellets were resuspended in 1 ml of 1x PBS containing 0.1% "-mercaptoethanol.Lysozyme was added to a final concentration of 0.1 mg/ml and samples were put onice for 20 min. Samples were then sonicated on ice (3x 10 s). To separate soluble andinsoluble fractions samples were centrifuged (7500 rcf, 4°C, 10 min). The soluble

18
fraction was removed, and the insoluble fraction resuspended in 1ml of 1x PBScontaining 0.1% "-MeOH. Fractions were then analysed using SDS-PAGE.
2.3.3 Protein purification by Ni-NTA agarose affinity chromatography
For constructs with a HIS6 tag (pRSet and pAC28) a 10 mL column of agarosebeads was washed with 100 ml MQW then equilibrated in 50 ml Ni-NTA lysis buffer(50 mM NaH2PO4, 300 mM NaCl, 10 mM imidazole, pH 8). The soluble fractionsfrom the lysed cells were added to the equilibrated column and allowed to pass overthe column twice. The column was washed with 50ml Ni wash buffer (50 mMNaH2PO4, 300 mM NaCl, 20 mM imidazole, pH 8). Protein was then eluted using Ni-NTA elution buffer (50 mM NaH2PO4, 300 mM NaCl, 250 mM imidazole, pH 8).During elution, the OD280 of samples were measured to indicate when protein hadeluted. Samples were collected at all steps of the purification process and analysed byglycine SDS-PAGE. For samples to be used in ion exchange, 50 mM NaCl instead of300 mM was used in all buffers.
2.3.4 Protein purification by GST affinity chromatography
Constructs containing a GST tag (pGex) were purified using 10 ml ofGlutathione-Sepharose 4B$ (GE Healthcare, Castle Hill, NSW) beads. Beads wereprepared as above but using GST lysis buffer (50 mM Tris pH 8.0, 50 mM NaCl, 1%Triton X-100, 1.4 mM PMSF, 1.4 mM "-mercaptoethanol) and purification wasperformed as above using GST wash buffer (50 mM Tris pH 8.0, 100 mM NaCl, 10%glycerol, 1.4 mM PMSF, 1.4 mM "-mercaptoethanol) and the elution was carried outusing GST elution buffer (GST wash buffer plus 50 mM GSH). Samples werecollected during the whole purification process and analysed by glycine SDS-PAGE.
2.3.5 Affinity chromatography purification of protein complex
Co-expressed proteins were purified using first GSH affinity chromatographyas above, and then using Ni-NTA agarose chromatography. Ni-NTA agarose beadswere prepared as above, but equilibrated using GST elution buffer. The elutionfractions from GSH chromatography were applied to the Ni-NTA agarose beads andallowed to pass through the column twice. The column was then washed with Ni-NTA wash buffer and the protein eluted using Ni-NTA elution buffer. The elution ofthe protein was checked by OD280 nm as above. Samples were collected during thewhole process and all steps were analysed by glycine SDS-PAGE.
2.3.6 SDS-PAGE analysis
Glycine gels (Sambrook et al., 1989) were used for protein analysis. Allsamples were mixed with 5x SDS-PAGE loading buffer (0.3125 M Tris, 10% SDS,50% glycerol, 25% "-mercaptoethanol, 0.5% bomophenol blue, pH 6.8) and heated at95°C for 5 min before loading. SDS-PAGE was carried out using Hoefer SmallMighty Small! apparatus (GE-Healthcare, Castle Hill, NSW).
2.3.7 Ion exchange and gel filtration
Cation exchange was performed on a BioLogic (Bio-Rad, Hercules CA,USA), using filtered MES buffer (20 mM MES, 1 mM DTT, pH 6.5) on an UNO S.1column (Bio-Rad). Na+ was used as counter ion with a gradient going from zero to 1M NaCl. The mobile phase was run at a rate of 2 ml/min. The elute was monitored byabsorbance at 280 nm and peaks were collected and stored at 4°C.
Gel filtration was also performed on a BioLogic using filtered MES buffercontaining 200 mM NaCl, using a Superdex 75! 10/60 column (GE-Healthcare). The
19
mobile phase was ran at 1.5 ml/min and the elute monitored at 280 nm and 215 nm.All fractions corresponding to peaks were collected and stored at 4°C.
2.4 Characterization of proteins
2.4.1 Determination of protein concentration
Proteins were concentrated using Microsep 3K Omega centricon devices (Pall,New York, USA). They were spun at 6500 rpm, giving a flow rate of ~1ml/h.The absorption at 280nm was measured and protein concentrations were determinedusing the molar extinction coefficients according to the Beer-Lambert Law, whichgives the equation:
A=&'c'lWhere & is the molar coextinction factor, c is the concentration, l is the pathlength andA is the absorption at 280 nm.
2.4.2 Multiple Angle Laser Light Scattering (MALLS)
Ion exchange and gel filtration purified samples was used for MALLS. Thesample was loaded onto a Superdex™ 75 10/30 size exclusion column (AmershamBiosciences) operating on an AKTA (Amersham Pharmacia Biotech) HPLC system.The flow-rate was set to 0.5 ml/min using gel filtration buffer (20 mM MES, 1 mMDTT, 200 mM NaCl). The size exclusion column was followed by an in-line mini-DAWN light scattering detector and an interferometric refractometer (WyattTechnologies, CA, USA). Molecular weight calculations were performed usingASTRA software (Wyatt Technologies). The change in refractive index as a functionof protein concentration is approximately constant for proteins and 0.190 ml/g wasused as a set value.
2.4.3 Far UV Circular Dichroism Spectropolarimetry (CD)
CD was used to determine the secondary structure of the protein. Spectra werecollected on a Jasco J-720 spectropolarimeter equipped with a Neslab RTE-111temperature controller. Calibration of the instrument was done using ammonium d-camphor-10-sulfonate (Katayama Chemical, Hyogo, Japan). Spectra were collectedwith a resolution of 0.5 nm and bandwidth of 1 nm over wavelengths ranging from260-200 nm using a 1-mm pathlength cell. Final spectra represented the average fromthree scans at a speed of 20 nm/min with a response time of 1 s. Protein sample was inlow salt MES buffer (10 mM MES, 0.5 mM DTT, 5 mM NaCl).
2.5 Yeast two Hybrid
Yeast two Hybrid (Y2H) experiments were performed in Saccharomyces
cerevisiae AH109 strain (BD Biosciences Clonetech, CA, USA). Cells were grown inYeast Peptone Dextrose (YPD; 20 g/l Difco Bactopeptone, 10 g/l yeast extract), in 2%agar and liquid form, respectively. YPD was adjusted to pH 5.8 before beingautoclaved, when cooled down glucose was added to a final concentration of 2%.All protein tested were made as fusions with the GAL-4 DNA-binding domain (DBD)and GAL-4 activation domain (AD). The DBD is expressed using pGBT9 (LEU2,AMPr) (Clontech) and the AD using pGAD10 (TRP1, AMPr; Clontech). The pGBT9vector enables expression of the DBD as a fusion with your protein of interest whilethe pGAD10 vector allows expression of the AD in fusion with the partner protein.

20
2.5.1 Making competent yeast cells
One colony of AH109 was used to inoculate 50 ml of YPD. The culture wasincubated (30°C, 200 rpm) overnight. The whole culture was transferred into 300 mlof YPD and allowed to grow at 30°C, 200 rpm shaking for 4-5h. Culture was thenspun at 1000 g for 5 min and the supernatant was discarded. Cells were resuspendedin 25 ml of sterile water. Cells were then spun at 1000 g for 5 min, supernatantdiscarded and the cells resuspended in ~1.5 ml of sterile TE/LiAc (10 mM Tris-HClpH 8.0, 0.1 mM EDTA, 100 mM LiAc).
2.5.2 Transformation of yeast cells
Roughly 1 µg of plasmid DNA and 100 µg of salmon sperm DNA were mixedwith 0.1 ml of competent yeast cells (Clonetech Yeast Two-Hybrid ProtocolsHandbook). 0.6 ml of PEG/LiAc (40% PEG-8000, 100 mM LiAc, 10 mM Tris pH8.0, 1 mM EDTA) was added and the tubes were briefly vortexed then incubated for30 min with shaking (30° C, 200 rpm). Dimethyl sulfoxide (70 µl) was added and thetubes were inverted 3-4 times. Cells were heat-shocked at 42°C for 15 min withswirling every 5 min. They were then chilled on ice for 2 min and spun to a pellet(14000 g, 5 s). The supernatant was removed and the cells were resuspended in 300 µlof TE buffer (10 mM Tris-HCl pH 8.0, 1 mM EDTA) and plated on SD agar plateslacking tryptophan (W) and leucine (L) for selection of cotransformants. The plateswere incubated at 30°C for 72 h.
2.5.3 Y2H Spot-test
3 ml of SD –L-W media was inoculated with a co-transformed colony andgrown overnight (30°C, 200 rpm). OD600 was measured and adjusted to OD600 ~0.2.Two serial 10x dilutions were done (OD600 ~0.02 and ~0.002) and 2 µl of all threedilutions were spotted onto SD –L-W-H and SD –L-W-H-A agar plates, H forhistidine and A for adenine to select for interaction. Plates also contained 40 µg/ml X-#-gal for visual indication of reporter gene expression. The plates were incubated at30°C for 72 h.

21
3. Optimisation of overexpression
To be able to further characterize the two proteins and the interaction betweenthem, it is essential to purify larger amounts of proteins. When proteins areoverexpressed in E. coli cells several different parameters influence the expressionlevels. To be able to optimise the expression, trials are done in which the temperature,time and levels of promoter enhancer IPTG were varied (see chapter 2.3.1). The aimwas to get as much soluble protein as possible.
3.1 FHL1 1/2 LIM 1+2
The expression of FHL 2 1/2 was first tried in the pRSET vector, but theexpression levels were not good enough for further characterisation (data not shown).The pAC28 vector was tested after this, and the result showed very good levels ofexpression in both 37°C and 25°C (figure 4).
High levels of soluble protein were present at both temperatures. Thus,optimal levels of soluble FHL 2 1/2 could be obtained by expression at 37°C for 3 husing 0.4 mM of IPTG.
3.2 FHL 1
The expression of FHL 1 was tried using both pRSET and pAC28 vectors. Thefirst trials were done in a regular fashion using BL21(DE3) cells. Neither of the twovectors yielded any expression of the protein (data not shown). The vectors were thentransformed in to BL21 Rosetta cells with six tRNA for rare E. coli codons.Expression was tried as in chapter 2.3.1, but due to the slow growth of the cells only
Figure 4 Expression levels and solubility of FHL2 1/2 in pAC28 vector (~21.5 kDa).A. Shows the expression at 37°C with 0.4 mM IPTG. Lane 1: marker, lane 2: before
induction sample, lane 3: 1 h expression, lane 4: expression 2 h, lane 5: expression 3 h.B. Shows the expression at 25°C. Lane 1: marker, lane2: 25°C 0.2mM IPTG 16h, lane 3:
25°C 0.2mM IPTG 4h, lane 4: 25°C before induction lane 5: 25°C 0.4mM IPTG 16h, lane6: 25°C 0.4mM IPTG 4h, lane 7: 25°C before induction.
C. Shows the solubility. Lane 1: marker, 2: 37°C 0.4mM IPTG soluble, 3: 37°C 0.4mMIPTG insoluble. 4: 25°C 0.4mM IPTG soluble, 5: 25°C 0.4mM IPTG insoluble, 6: 25°C0.2mM IPTG soluble, 7: 25°C 0.2mM IPTG insoluble,

22
overnight expression was tested. The expression levels for the Rosetta strands did notshow any improvement over the non-Rosetta strains (figure 5).
There are possible causes for the lack of protein expression. One is that theprotein is toxic for the cells used for overexpression. In such cases it is possible thatthe plasmid encoding the toxic protein can be modified or eliminated from the cell.The data above showed small amounts of the target protein present before inductionwith IPTG, indicating that the inducible lac promoter was leaky. Adding glucose tothe selection plate and the culture media, which inhibits the binding of transcriptionregulators to the lac promoter, can prevent this leakage. This was tested by addingglucose to the LB agar plate and to the LB media to a final concentration of 2%.Although the preinduction levels of expression were reduced the subsequent levels ofexpression did not increase (data not shown).
Figure 5. FHL 1 pAC28 and FHL 1 pRSET (~39kDa) expression levels in BL21 (DE3) Rosetta.A. Expression of FHL 1 pAC28. Lane 1: marker, 2: 37°C 0.4 mM IPTG 3 h, 3: 37°C 0.4 mM IPTG 2 h, 4:
37°C 0.4 mM IPTG 1 h, 5: before induction, 6: 25°C 0.4 mM IPTG 16 h, 7: 25°C 0.4 mM IPTG 4 h, 8:before induction, 9: 25°C 0.2 mM IPTG 16 h, 10: 25°C 0.2 M IPTG 4 h, 11: before induction
B. Expression of FHL 1 pRSET. . Lane 1: marker, 2: 37°C 0.4 mM IPTG 16 h, 3: 37°C 0.4 mM IPTG 4h, 4:before induction 5: 25°C 0.4 mM IPTG 16 h, 6:25°C 0.4 mM IPTG 4h, 7: before induction, 8: 25°C 0.2 mMIPTG 16 h, 9: 25°C 0.2 mM IPTG 4 h.

23
3.3 7-10 cMyBP-C
The expression of 7-10 cMyBP-C was tested in BL21(DE3) cells for both thepGex and the pRSET vectors at both 37°C and 25°C with 0.4 mM IPTG. Good levelsof expression were obtained for all different parameters tested for the pGex vector,but the protein solubility was very low (Figure 6). The pRSET vector experimentsshowed very low levels of expression (data not shown).
To try and increase the solubility the expression was tried at a lowertemperature, 20°C, and a lower concentration of IPTG (0.2 mM) was also tried. Thisdid not improve the solubility of the protein (figure 7).
Figure 6. 7-10 cMyBP-C domains pGex vector expression and solubility levels in BL21 cells.Estimated protein size ~66.3kDa.
A. Expression of 7-10 cMyBP-C. Lane 1: marker, 2: 37°C 0.4 mM IPTG 3 h, 3: 37°C 0.4mM IPTG 2 h, 4: 37°C 0.4 mM IPTG 1 h, 5: 25°C 0.4 mM IPTG 16 h, 6: 25°C 0.4 mMIPTG 4h, 7: pre-induction.
B. Solubility of 7-10 cMyBP-C. Lane 1: marker, 2: 37°C 0.4 mM IPTG soluble, 3: 37°C 0.4mM IPTG insoluble, 4: 25°C 0.4 mM IPTG soluble, 5: 25°C 0.4 mM IPTG insoluble.

24
In a final attempt to improve the solubility of these proteins was to transformthe pGex vector into BL21(DE3)-Trx cells. These cells improve solubility for someproteins by protecting proteins against oxidation, and providing a chaperone effect.Unfortunately, there was no improvement in the solubility of 7-10 cMyBP-C pGex byexpression in this cell line (figure 8).
The levels of 7-10 cMyBP-C pGex produced in the Trx cells were higher than forstandard BL21(DE3) cells. However, since the solubility of the protein is still verylow, the Trx system is still not suitable for large-scale production of 7-10 cMyBP-CpGex.
Figure 7. 7-10 cMyBP-C pGex and pRSET solubility levels in 20°C.Lane 1: marker, 2: pGex 0.4 mM IPTG soluble, 3: pGex 0.4 mM IPTG insoluble, 4: pRSET 0.4 mM IPTGsoluble, 5: pRSET 0.4 mM IPTG insoluble, 6: pGex 0.2 mM IPTG soluble, 7: pGex 0.2 mM IPTG insoluble
Figure 8. Expression of 7-10 cMyBP-C pGex in Trx cells.A. Expression levels. Lane 1: marker, 2: before induction, 3: 37°C 0.4 mM IPTG 1 h, 4: 37°C 0.4 mM
IPTG 2 h, 5: 37°C 0.4 mM IPTG 3 h, 6: before induction, 7: 25°C 0.4 mM IPTG 4 h, 8: 25°C 0.4 mMIPTG 16 h, 9: before induction, 10: 25°C 0.2 mM IPTG 4 h, 11: 25°C 0.2 mM IPTG 16 h.
B. Solubility levels. Lane 1: marker, 2: 37°C 0.4 mM IPTG soluble, 3: 37°C 0.4 mM IPTG insoluble, 4:25°C 0.4 mM IPTG soluble, 5: 25°C 0.4mM IPTG insoluble, 6: 25°C 0.2 mM IPTG soluble, 7: 25°C0.2 mM IPTG insoluble.

25
3.4 Co-expression FHL 2 1/2 pAC28 and 7-10 cMyBP-C pGex
Given the reasonable expression levels but low solubility of 7-10 cMyBP-CpGex, and the high solubility of FHL 2 1/2, attempts were made to co-express theproteins. That is, to express both proteins in the same cell. The idea is that if theproteins interact, FHL 2 1/2 will increase the solubility of the cMyBP-C 7-10. Theexpression trials showed very promising results for this approach (figure 9), withincreased levels of soluble 7-10 cMyBP-C pGex being produced (figure 10).
Figure 9. Co-expression of FHL 2 1/2 and 7-10 cMyBP-C, estimated sizes ~21.5
and ~66.3 kDa respectively.
Lane 1: marker, 2: 25°C 0.2 mM IPTG 16 h, 3: 25°C 0.2mM IPTG 4 h, 4: 25°C
0.4mM IPTG 16 h, 5: 25°C 0.4 mM IPTG 4 h, 6: 37°C 0.4 mM IPTG 3 h, 7: 37°C
0.4 mM IPTG 2 h, 8: 37°C 0.4 mM IPTG 1 h, 9: pre-induction.
Figure 10. Co-expression solubility trials
Lane 1: marker, 2: 25°C 0.2 mM IPTG soluble, 3: 25°C 0.2 mM IPTG insoluble,
4: 25°C 0.4 mM IPTG soluble, 5: 25°C 0.4 mM IPTG insoluble, 6: 37°C 0.4 mM
IPTG soluble, 7: 37°C 0.4 mM IPTG insoluble.
Figure 9. Co-expression of FHL 2 1/2 and 7-10 cMyBP-C, estimated sizes ~21.5 and ~66.3 kDarespectively. Shows weak expression of 7-10 cMyBP-C, but it is clearly seen in soluble trials below.Lane 1: marker, 2: 25°C 0.2 mM IPTG 16 h, 3: 25°C 0.2mM IPTG 4 h, 4: 25°C 0.4mM IPTG 16 h, 5:25°C 0.4 mM IPTG 4 h, 6: 37°C 0.4 mM IPTG 3 h, 7: 37°C 0.4 mM IPTG 2 h, 8: 37°C 0.4 mM IPTG 1h, 9: pre-induction.
Figure 10. Co-expression solubility trials, 7-10 cMyBP-C is mainly insoluble, but the soluble fractionis increased compared to expression of single 7-10 cMyBP-C.Lane 1: marker, 2: 25°C 0.2 mM IPTG soluble, 3: 25°C 0.2 mM IPTG insoluble, 4: 25°C 0.4 mM IPTGsoluble, 5: 25°C 0.4 mM IPTG insoluble, 6: 37°C 0.4 mM IPTG soluble, 7: 37°C 0.4 mM IPTGinsoluble.

26
3.5 Linker constructs with FHL1, FHL 2 1/2 and 7-10 cMyBP-C
An alternative approach to make soluble, stable complexes between FHL1 andcMyBP-C was carried out at the same time as the co-expression trials. An attempt wasmade to create a construct in which the two interacting proteins were joined by aglycine-rich flexible linker. The constructs were created by Polymerase ChainReaction PCR, as described in chapter 2.2. The first reaction used a protein vectorconstruct as a template and the linker reverse primers (chapter 2.2). The secondreaction uses the product from the first reaction as template and the overlapping likerprimer. The product contains a Bam HI restriction enzyme site at the 5’ end and a Bgl
II site at the 3’end of the linker. The product is then ligated into a vector cut with Bam
HI, that already contains one of the protein partners, such that the PCR amplified
protein and linker are inserted in frame with the first protein partner. Note that Bam
H1 and Bgl II generate compatible overlaps, but that a hybrid Bam H1 and Bgl II sitecannot be recognised by either enzyme. Figure 11 shows an outline of the procedure.
Figure 11. PCR procedure for making the linker constructs.I. The protein beginning with the BamHI site in a vector is used for template with
the linker reverse primer.II. The product is the protein with restriction site and a piece of the linker.III. The second reaction uses the product from the first reaction as a template and
the longer overlapping linker reverse primer.IV. The product is the protein and linker with the BamHI site in the beginning and
the BglII site in the end of the linker.V. The vector with the other protein is opened using BamHI restriction enzyme.VI. The orientation of the ligation will determine the size of the cut product from
the vector.

27
When the construct is ligated with the vector the orientation of the inserted fragmentis very important. To test for the right orientation the construct can be cut with Bam
HI and Eco RI to determine the size on the insert. The site where Bgl II ligates will bedestroyed by the ligation and an insert in the wrong orientation will show the wrongsize.
The PCR steps to produce the construct were successful, but the ligation stepand subsequent transformation steps were not. To increase the efficiency of theligation step, attempts were made to clone the construct into the pGem-Easy vectordirectly from Taq polymerase amplified PCR products (chapter 2.2). Taq polymeraseadds a 3’ deoxyadenosine (A) overhang to the PCR product, which is complementaryto a T-overhang in the linearised pGem-Easy plasmid. The PCR reactions showed agood yield, (figure 12) but the results from the ligation and the transformation toDH5# cells were not successful and the trials were not taken any further because oftime constraints.
3.6 Optimised overexpression protocols
In summary, overexpression of the full length FHL1 could not be performed in E. coli
cells. Optimised overexpression protocols were developed for FHL 2 1/2 and 7-10cMyBP-C (table 4). Although the expression levels of 7-10 cMyBP-C were promisingin Trx cells, the level of soluble protein was relatively low and final yields of purifiedprotein would also be very low. Thus, the coexpression of FHL 2 1/2 and 7-10 MyBP-C, which leads to increased levels of soluble 7-10 MyBP-C is likely to be the optimalway of producing these protein in E. coli.
Table 4. Optimised overexpression protocol for FHL 2 1/2, 7-10 cMyBP-C and co-expression with both proteins.
FHL 2 1/2 7-10 cMyBP-C Co-expression
Cell type E. coli BL21 E. coli Trx E. coli BL21
Temperature 37°C 25°C 25°C
Amount of IPTG 0.4 mM 0.4 mM 0.4 mM
Hours of
expression
3 h 16 h 16 h
Figure 12. PCR products from linker synthesis, far left 100kb ladder, next two FHL 2 1/2 linker, nexttwo FHL 1 linker, next two 7-10 cMyBP-C, far right 1kb ladder.

28
4. Purification and characterization of FHL 2 1/2
To be able to use the FHL 2 1/2 for interaction studies it is important todetermine if the protein is properly folded and has the right mass. To purify FHL 21/2, Ni-NTA agarose beads was used (chapter 2.3.3). The eluted purified protein wasthen subjected to cation exchange chromatography for further purification. Theresulting peak was very broad and was analyzed with SDS-PAGE (figure 13).
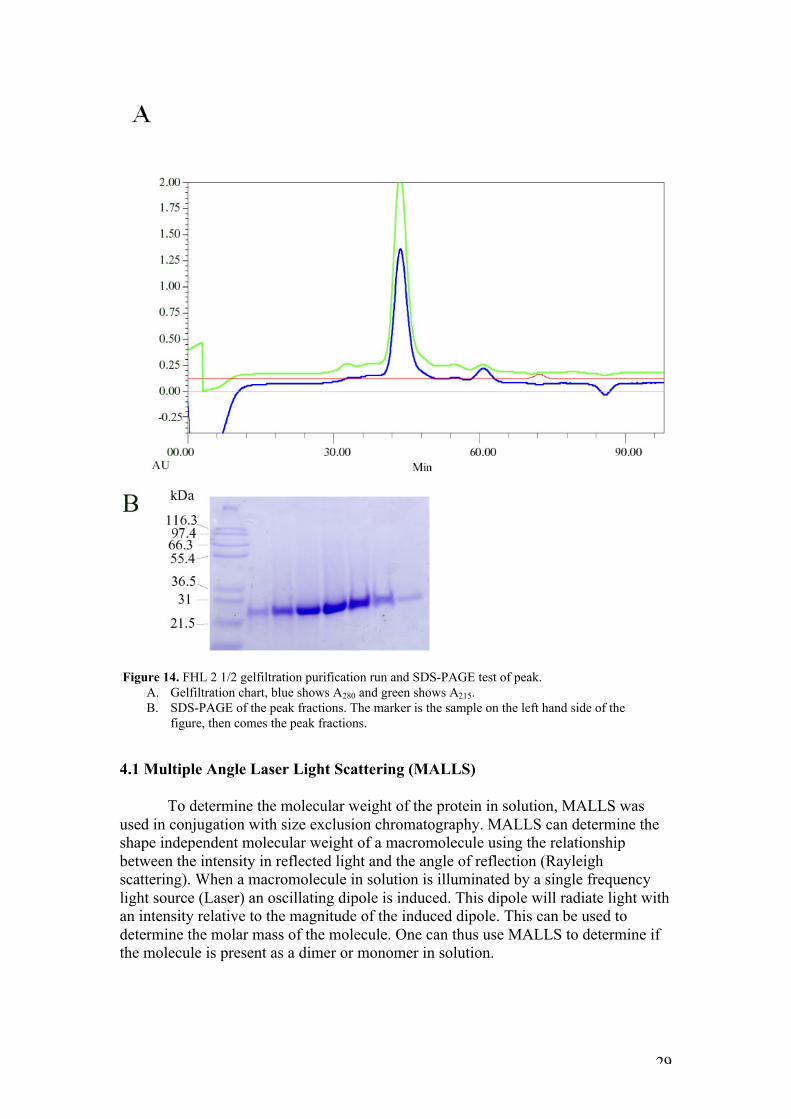
This analysis showed that the samples still contain many impurities, and thatthe peak is also broad, which results in a large final volume. Thus, the sample neededto be concentrated before any further methods could be assessed. Size exclusionchromatography (figure 14) appears to be a better purification step, with the proteineluting in a single defined peak, with no other contaminants visible by SDS-PAGE.Fractions containing the eluted peak were concentrated to 80 µM and used in thecharacterization of FHL 2 1/2.
Figure 13. FHL 2 1/2 ion exchange analysis and test of peaks on SDS-PAGE.A. Red line shows the salt concentration, first peak is from the salt in the buffer. Blue line is A280,
shows two peaks.B. SDS-PAGE of the two peaks from ion exchange. Marker in left with first A280 peak in next
lane, and samples from across the broad peak in the other lanes.
29
4.1 Multiple Angle Laser Light Scattering (MALLS)
To determine the molecular weight of the protein in solution, MALLS wasused in conjugation with size exclusion chromatography. MALLS can determine theshape independent molecular weight of a macromolecule using the relationshipbetween the intensity in reflected light and the angle of reflection (Rayleighscattering). When a macromolecule in solution is illuminated by a single frequencylight source (Laser) an oscillating dipole is induced. This dipole will radiate light withan intensity relative to the magnitude of the induced dipole. This can be used todetermine the molar mass of the molecule. One can thus use MALLS to determine ifthe molecule is present as a dimer or monomer in solution.
Figure 14. FHL 2 1/2 gelfiltration purification run and SDS-PAGE test of peak.A. Gelfiltration chart, blue shows A280 and green shows A215.B. SDS-PAGE of the peak fractions. The marker is the sample on the left hand side of the
figure, then comes the peak fractions.

30
This analysis showed a molecular weight for FHL 2 1/2 of ~ 24.5 kDacompared to the theoretical mass of ~21 kDa (protein and affinity tag) indicating thatthe protein is monomeric (figure 15).
4.2 Far-UV Circular Dichroism Spectropolarimetry (CD)
CD is used to estimate the levels of secondary structure in the protein. CDmeasures the differences in absorption between right-handed polarized light and left-handed polarized light that arise due to asymmetry in the structured. A symmetricstructure, such as a #-helix or "-sheet, gives a defined absorption. In the far UVregion the CD signal for proteins and peptides originates mainly from amide bonds.CD spectra are usually compared to spectra of already known structures (Johnson,1990). The spectrum for FHL 2 1/2 has not previously been recorded, but thecomponent domains of the protein are putative LIM domains, which do have known
-16
-14
-12
-10
-8
-6
-4
-2
0
2
200 210 220 230 240 250 260
Series1
Figure 16. CD spectrum from FHL 2 1/2.Shows typical characteristics of a LIM domain protein with minima at 215 and at 205 nm. Thisindicates that the protein is folded according to the typical characteristics of the LIM domain.
1,00E-04
1,20E-04
1,40E-04
1,60E-04
1,80E-04
2,00E-04
2,20E-04
11,6
11,6
11,6
11,7
11,7
11,8
11,8
11,8
11,9
11,9
11,9 12
12
12,1
12,1
12,1
12,2
12,2
12,2
12,3
Volume
1,00E+04
1,50E+04
2,00E+04
2,50E+04
3,00E+04
3,50E+04
4,00E+04
Concentration
MW
Figure 15. Results from MALLS for FHL 2 1/2.The data indicate an average molecular weight of 24.5kDa.

31
CD spectra and thus can be used for comparison.The result from the CD analysis showed that FHL 2 1/2 was folded with the
typical characteristics of a LIM domain (figure 16).
4.3 Conclusions for purifying and characterization of FHL 2 1/2
The purification of overexpressed FHL 2 1/2 was achieved using Ni-NTAchromatography followed by size exclusion chromatography. In the work presentedhere, an intermediate cation exchange step was performed. However, this was not avery successful step and should probably be removed from the purification protocol.
Characterization of the soluble protein by MALLS showed that the protein hasthe correct molecular mass and that it exists as a monomer in solution. Further it far-UV CD was used to show that the truncated protein was folded and is thereforesuitable to use for further interaction studies.

32
5. Interaction between FHL 2 1/2 and 7-10 cMyBP-C
5.1 Interaction between FHL 2 1/2 and 7-10 cMyBP-C in vitro
Confirmation of an interaction between FHL 2 1/2 and 7-10 cMyBP-C in vitro
was sought by co-purifying the proteins using two different affinity purificationprotocols. When the proteins were co-expressed (Section 3.4) FHL 2 1/2 wasproduced with a HIS6 tag from the pAC28 vector, whereas 7-10 cMyBP-C wasproduced with a GST tag from apGex vector. Thus, each protein contained a differentaffinity tag.
First, attempts were made to co-purify the proteins with either Ni-NTA beadsor GST beads. The soluble phase was applied to one of the affinity matrices, and afterelution from this matrix was then applied to the second type of affinity matrix. Bothproteins were co-purified by this method, making it very likely that there is aninteraction between them (figure 17).
Figure 17. Interaction trials from co-expression between FHL 2 1/2 and 7-10 cMyBP-C.A. Lane 1: marker, 2: Ni-NTA wash, 3: Ni-NTA flow through, 4: Ni-NTA beads, 5: GST wash, 6:
GST flow through, 7: GST beads, 8: co-expression soluble phase.
B. Lane 1: marker, 2: GST elut Ni-NTA wash, 3: GST elut Ni-NTA flowthrough, 4: GST elut Ni-NTA beads, 5: GST elution, 6: Ni-NTA elut GST wash, 7: Ni-NTA elut GST flow through, 8:Ni-NTA elut GST beads, 9: Ni-NTA elution.

33
As these trials were very promising, a larger scale co-expression and co-purification of the two proteins was carried out using 5 l of bacterial. In this protocol,GSH beads were used as the first purification step, with the the elution fraction beingsubsequently applied to Ni-NTA beads. The results were once again very promising(figure 18).
5.2 Interaction between FHL 2 1/2 and cMyBP-C in vivo.
In order to try and confirm the presence of an in vivo interaction between FHL2 1/2 and cMyBP-C, yeast two hybrid assays were set up for both 6-10 and 7-10cMyBP-C. Yeast two hybrid uses the Gal-4 transcription factor, containing two parts.The DNA binding domain is fused with one of the proteins and the polymeraseactivator is linked to the other protein. Constructs are made where the Gal-4 promotercontrols synthesisation of an essential amino acid. Yeast is then grown on plateslacking this amino acid, showing that the proteins interact if the yeast can grow on theselection plates. Negative controls are also set up, missing one of the proteins, inorder to eliminate unspecific activation of the synthesising genes.
Figure 18. Purification trials of the co-expression between FHL 2 1/2 and 7-10 cMyBP-C using GST-beads first and then Ni-NTA beads. The interaction is believed to be one to one, meaning that excessiveFHL1 will be washed out of the trial.Lane 1: marker, 2: GST elution, 3: GST elution, 4: wash, 5: flow through, 6: GST beads before elution.

34
Unfortunately, in this experiment, the growth of yeast on control plates was
too high to make the results of the assay reliable (figure 19).
Figure 19. Y2H trials for the interaction between 6-10 cMyBP-C as activator and FHL 2 1/2 as bait.The background on the control lanes are to high to make the results of the assay reliable.
A. Growth plate containing SD –L –W. Highest concentration (0.2 OD600) on top and thendecreasing 10 fold for each row. Lane 1: FHL 2 1/2 pGAD10 6-10 cMyBP-C pgbt9, 2: FHL 21/2 pGAD10 pgbt9, 3: pGAD10 6-10 cMyBP-C pgbt9.
B. Selection plate containing SD –L –W –H. Set up as above.C. Selection plate containing SD –L –W –H –A. Set up as above.

35
In order to try and resolve this problem of growth of controls, interaction trialswere also set up for the 6-10 and 7-10 cMyBP-C interaction with FHL 2 1/2 in alldifferent permutations of bait and activator (Figure 20). However the results remainambiguous, as the growth of controls under low stringency conditions was still too
high to reliably indicate an interaction between the two proteins (figure 20B). Underhigh stringency selection conditions (SD –L –W –H –A, figure 20C) no growth of anyco-transformants was seen. Thus, it may be possible to adjust the conditions of theexperiment to eliminate background growth but see an interaction between the twoproteins. This could be done by using SD –L –W –H plates supplemented withdifferent concentrations of 3-aminotriazole, which can reduce leaky expression of theHIS promoter. However, due to time constraints I was not able to carry out theseexperiments.
Figure 20. Y2H trials for all conformations with 6-10 cMyBP-C and 7-10 cMyBP-Cinteracting with FHL 2 1/2. The interaction is very weak in this trial, and the backgroundlevels of activation is to high to draw any reliable conclusions of the interaction.
A. Growth plate SD –L –W. OD600 0.2 on top and then decreasing 10 fold per row. Lane1: FHL 2 1/2 pGAD10 6-10 cMyBP-C pgbt9, 2: FHL 2 1/2 pGAD10 pgbt9, 3:pGAD10 6-10 cMyBP-C pgbt9, 4: 6-10 cMyBP-C pGAD10 FHL 2 1/2 pgbt9, 5: 6-10cMyBP-C pGAD10 pgbt9, 6: pGAD10 FHL 2 1/2 pgbt9, 7: FHL 2 1/2 pGAD10 7-10cMyBP-C pgbt9, 8: FHL 2 1/2 pGAD10 pgbt9, 9: GAD10 7-10 cMyBP-C pgbt9, 10:7-10 cMyBP-C pGAD10 FHL 2 1/2 pgbt9, 11: 7-10 cMyBP-C pGAD10 pgbt9, 12:pGAD10 FHL 2 1/2 pgbt9,
B. Selection plate SD –L –W –H. Set up as above.C. Selection plate SD –L –W –H –A. Set up as above.

36
5.3 Conclusions from interaction studies
The co-expression and co-purification studies showed clear indications of adirect interaction between FHL 2 1/2 and 7-10 cMyBP-C. However, moreexperiments need to be carried out in order to characterize the interaction.

37
6. Final Summary and Discussion
6.1 Overexpression
One aim for the project was to establish an optimised overexpression protocolfor the proteins of interest, FHL1 and cMyBP-C. This was accomplished by a seriesof overexpression trials in which the temperature, amount of IPTG and the time ofexpression were altered.
For 7-10 cMyBP-C the expression levels were high, but the fraction of theprotein that was soluble was very low. Despite a number of different approaches thatwere made to increase the stability of this protein, including lowered temperatures,and the use of Trx cells, (which increase the solubility by co-producing bacterialThioredoxin, (Yasukawa et al., 1995)), no increased solubility was achieved.
Full length FHL1 showed very low levels of expression. In an attempt toincrease expression levels, BL21 Rosetta cell line, which contains six rare E. coli
tRNA, was used. This can sometimes help with levels of overexpression if the genethat encodes the protein contains many of these rare codons. Unfortunately, the switchto Rosetta cells did not result in an increase of expression levels. It was alsoconsidered whether FHL1 might be toxic to the cells. Attempts were made to lowerpotential leaky expression of the lac promoter. To lower the initial expression levelsof FHL1 glucose was added to the LB plates to a final concentration of 2%. Although,this did lower the initial levels of expression, it did not help in increasing final levelsof overexpressed protein. This might indicate that the protein is toxic to E. coli, it isalso possible that the low levels of protein reflect protein instability. That is, that theprotein is being expressed at reasonable levels, but it is also being degraded over thetime course of the expression.
Protocols that enabled good levels of overexpressed FHL 2 1/2, and the co-expression of FHL 2 1/2 and 7-10 cMyBP-C were established. The success of the co-expression strategy supports the theory of a direct physical interaction between thetwo proteins. The amount of soluble 7-10 cMyBP-C increased when co-expressedindicating that soluble FHL 2 1/2 stabilizes the less soluble 7-10 cMyBP-C.
6.2 Characterization of FHL 2 1/2
Another aim was to purify and characterize FHL 2 1/2. It was thought thatcation exchange chromatography would be a good purification step. However, whenthis was attempted on partially purified protein (from Ni-NTA chromatography), theprotein eluted as a very broad peak. This was surprising, as the pH for the purificationwas kept at 6.5, which should be far enough away from the theoretical pI of 8.72 forthe protein to be effectively purified by this method. If the pH of the buffer was tooclose to the pI, the protein would not have any net charge and would not bind thecolumn. On the other hand, if the pH is too far away from the pI the ability for the Naions to compete for binding to the column would decrease and the protein would notbe eluted. Neither phenomenon was observed, and the reason for the broad nature ofthe peak is not known. Size exclusion chromatography, however, showed verypromising results. A single large peak was observed that appeared pure by SDS-PAGE. It is not yet clear if the ion exchange step contributed to the purification, or ifit should be omitted, but it may have removed some proteins that are round the samesize as FHL 2 1/2, which would be unlikely to be purified with the size exclusionchromatography.

38
MALLS was used to determine the solution molecular weight of the protein. Itdemonstrated that FHL 2 1/2 is a monomer of the expected size, in solution. This is ofinterest because some FHL proteins are known to dimerize (Turner et al., 2003). CDwas used to determine whether FHL 2 1/2 was properly folded in solution. Thetechnique gives information about secondary structure content in proteins. Theresulting spectrum of FHL 2 1/2 was clearly folded, with minima at ~215 nm and 205nm. Spectra of folded proteins usually also contain a positive signal ~190 nm.Unfortunately this was not observed for FHL 2 1/2, because levels of salt in thesample obscure the CD signal below ~200 nm. The spectrum resembled that of otherknown LIM-containing proteins (Deane et al., 2001), suggesting that FHL 2 1/2contains the typical alpha/beta structure of these domains and that this recombinantform of the protein is properly folded.
6.3 Interaction between cMyBP-C and FHL 1
The study also aimed at characterizing the interaction between cMyBP-C andFHL 1. This goal was hard to reach within the timeframe of this project because thesolubility of the 7-10 cMyBP-C protein was very low. The presence of unstable,truncated versions of cMyBP-C has also been reported from another study (McGrathet al., 2006). In order to get around this problem, a protocol for co-expression of bothproteins in the same cell was developed and the first co-purification of these proteinswas carried out. These studies using two different affinity matrices, indicates that adirect interaction between the two proteins exists. The two proteins can be co-purifiedby either GST-chromatography (which binds 7-10 cMyBP-C GST) or Ni-NTAchromatography (which binds the His6-tagged FHL protein). One could argue thatnon-specific binding to the beads matrix might interfere with the results, but it ishighly unlikely that both proteins would show unspecific binding to the two differentmatrices.
Yeast-two hybrid assays were also set up to detect an interaction between thetwo proteins. Unfortunately in the experiments described in this thesis report, highlevels of background growth obscured the detection of any real interaction by thismethod. However, given that the interaction between the two proteins was originallydiscovered by a Yeast two-hybrid screen, it should be possible to optimise theselection conditions to get a clear indication of interaction. When this has beenachieved, it should then be possible to use the Yeast-two hybrid assay, in combinationwith a series of constructs of FHL1 and cMyBP-C, to define the minimum bindingdomains of each protein. That is, the smallest region of each protein that is bothnecessary and sufficient to mediate an interaction between FHL1 and cMyBP-C.binding domain for the interaction. This could be very helpful in shining more lighton the interaction between cMyBP-C and FHL 1, by reducing the size of the domainsbeing expressed, and by possibly increasing the levels of soluble proteins for bindingand structural studies.
6.4 Future studies
The interaction between cMyBP-C and FHL1 is still not well characterized.The smallest binding domains of both proteins should be defined and interactionstudies performed. A structural study of the complex should be performed tocharacterize the three-dimensional structure of the complex, and mutational analysesof both domains should indicate which parts of the proteins are key binding domains.

39
Finally, it has been suggested that cMyBP-C is highly involved in theformation of the sarcomere. Indications have also been made that FHL1 mightcompete with myosin for the binding of cMyBP-C, it would be interesting to see ifmutations in cMyBP-C change the affinity for binding to FHL1 and if this wouldexplain the misaligned sarcomere or if the mutations inhibit the binding to myosin.

40
Acknowledgements:
First I would like to thank my supervisor Jacqui Matthews for my time in thelab. With incredible patients and superb knowledge she has guided me through thisproject.
A thank you also goes out to all the members of the McKay & Matthews lab,which all have contributed in some way to my project and most of all to my feeling ofwellbeing while in the lab.
I also want to send a special thank you to my two lunch mates Jason andRoland. Thanks for all the great Thai encounters and all the lively discussions abouteverything between social security systems to biotechnology to the latest game inAustralian open.

41
Reference list:
AMAAR, Y. G., THOMPSON, G. R., LINKHART, T. A., CHEN, S. T., BAYLINK,
D. J. & MOHAN, S. (2002) Insulin-like growth factor-binding protein 5
(IGFBP-5) interacts with a four and a half LIM protein 2 (FHL2). J Biol
Chem, 277, 12053-60.
BACH, I. (2000) The LIM domain: regulation by association. Mech Dev, 91, 5-17.
BOISSEL, J. P., BROS, M., SCHROCK, A., GODTEL-ARMBRUST, U. &
FORSTERMANN, U. (2004) Cyclic AMP-mediated upregulation of the
expression of neuronal NO synthase in human A673 neuroepithelioma cells
results in a decrease in the level of bioactive NO production: analysis of the
signaling mechanisms that are involved. Biochemistry, 43, 7197-206.
BROWN, S., BIBEN, C., OOMS, L. M., MAIMONE, M., MCGRATH, M. J.,
GURUNG, R., HARVEY, R. P. & MITCHELL, C. A. (1999a) The cardiac
expression of striated muscle LIM protein 1 (SLIM1) is restricted to the
outflow tract of the developing heart. J Mol Cell Cardiol, 31, 837-43.
BROWN, S., MCGRATH, M. J., OOMS, L. M., GURUNG, R., MAIMONE, M. M.
& MITCHELL, C. A. (1999b) Characterization of two isoforms of the skeletal
muscle LIM protein 1, SLIM1. Localization of SLIM1 at focal adhesions and
the isoform slimmer in the nucleus of myoblasts and cytoplasm of myotubes
suggests distinct roles in the cytoskeleton and in nuclear-cytoplasmic
communication. J Biol Chem, 274, 27083-91.
CHU, P. H., RUIZ-LOZANO, P., ZHOU, Q., CAI, C. & CHEN, J. (2000) Expression
patterns of FHL/SLIM family members suggest important functional roles in
skeletal muscle and cardiovascular system. Mech Dev, 95, 259-65.
CRAIG, R. & OFFER, G. (1976) The location of C-protein in rabbit skeletal muscle.
Proc R Soc Lond B Biol Sci, 192, 451-61.
DEANE, J. E., RYAN, D. P., SUNDE, M., MAHER, M. J., GUSS, J. M.,
VISVADER, J. E. & MATTHEWS, J. M. (2004) Tandem LIM domains
provide synergistic binding in the LMO4:Ldb1 complex. Embo J, 23, 3589-98.
FERREIRA, R., OHNEDA, K., YAMAMOTO, M. & PHILIPSEN, S. (2005)
GATA1 function, a paradigm for transcription factors in hematopoiesis. Mol
Cell Biol, 25, 1215-27.
FEUERSTEIN, R., WANG, X., SONG, D., COOKE, N. E. & LIEBHABER, S. A.
(1994) The LIM/double zinc-finger motif functions as a protein dimerization
domain. Proc Natl Acad Sci U S A, 91, 10655-9.
FLASHMAN, E., REDWOOD, C., MOOLMAN-SMOOK, J. & WATKINS, H.
(2004) Cardiac myosin binding protein C: its role in physiology and disease.
Circ Res, 94, 1279-89.
FREYD, G., KIM, S. K. & HORVITZ, H. R. (1990) Novel cysteine-rich motif and
homeodomain in the product of the Caenorhabditis elegans cell lineage gene
lin-11. Nature, 344, 876-9.
GAUTEL, M., FURST, D. O., COCCO, A. & SCHIAFFINO, S. (1998) Isoform
transitions of the myosin binding protein C family in developing human and
mouse muscles: lack of isoform transcomplementation in cardiac muscle. Circ
Res, 82, 124-9.
GHOSE, R., SHEKHTMAN, A., GOGER, M. J., JI, H. & COWBURN, D. (2001) A
novel, specific interaction involving the Csk SH3 domain and its natural
ligand. Nat Struct Biol, 8, 998-1004.

42
GRANZIER, H., WU, Y., SIEGFRIED, L. & LEWINTER, M. (2005) Titin:
physiological function and role in cardiomyopathy and failure. Heart Fail Rev,
10, 211-23.
GRUEN, M. & GAUTEL, M. (1999) Mutations in beta-myosin S2 that cause familial
hypertrophic cardiomyopathy (FHC) abolish the interaction with the
regulatory domain of myosin-binding protein-C. J Mol Biol, 286, 933-49.
JOHANNESSEN, M., MOLLER, S., HANSEN, T., MOENS, U. & GHELUE, M. V.
(2006) The multifunctional roles of the four-and-a-half-LIM only protein
FHL2. Cell Mol Life Sci.
JOHNSON, W. C., JR. (1990) Protein secondary structure and circular dichroism: a
practical guide. Proteins, 7, 205-14.
KADRMAS, J. L. & BECKERLE, M. C. (2004) The LIM domain: from the
cytoskeleton to the nucleus. Nat Rev Mol Cell Biol, 5, 920-31.
KARLSSON, O., THOR, S., NORBERG, T., OHLSSON, H. & EDLUND, T. (1990)
Insulin gene enhancer binding protein Isl-1 is a member of a novel class of
proteins containing both a homeo- and a Cys-His domain. Nature, 344, 879-
82.
KOIPALLY, J., RENOLD, A., KIM, J. & GEORGOPOULOS, K. (1999) Repression
by Ikaros and Aiolos is mediated through histone deacetylase complexes.
Embo J, 18, 3090-100.
KONRAT, R., KRAUTLER, B., WEISKIRCHEN, R. & BISTER, K. (1998)
Structure of cysteine- and glycine-rich protein CRP2. Backbone dynamics
reveal motional freedom and independent spatial orientation of the lim
domains. J Biol Chem, 273, 23233-40.
KONTAXIS, G., KONRAT, R., KRAUTLER, B., WEISKIRCHEN, R. & BISTER,
K. (1998) Structure and intramodular dynamics of the amino-terminal LIM
domain from quail cysteine- and glycine-rich protein CRP2. Biochemistry, 37,
7127-34.
LANGE, S., AUERBACH, D., MCLOUGHLIN, P., PERRIARD, E., SCHAFER, B.
W., PERRIARD, J. C. & EHLER, E. (2002) Subcellular targeting of metabolic
enzymes to titin in heart muscle may be mediated by DRAL/FHL-2. J Cell
Sci, 115, 4925-36.
LI, H. Y., NG, E. K., LEE, S. M., KOTAKA, M., TSUI, S. K., LEE, C. Y., FUNG, K.
P. & WAYE, M. M. (2001) Protein-protein interaction of FHL3 with FHL2
and visualization of their interaction by green fluorescent proteins (GFP) two-
fusion fluorescence resonance energy transfer (FRET). J Cell Biochem, 80,
293-303.
MATTHEWS, J. M. & SUNDE, M. (2002) Zinc fingers--folds for many occasions.
IUBMB Life, 54, 351-5.
MCGRATH, M. J., COTTLE, D. L., NGUYEN, M. A., COGHILL, I. D.,
ROBINSON, P. A., HOLDSWORTH, M., COWLING, B. S., HARDEMAN,
E. C., MITCHELL, C. A. & BROWN, S. (2006) Four and a half LIM protein
1 binds myosin binding protein C and regulates myosin filament formation
and sarcomere assembly. J Biol Chem.
MICHELSEN, J. W., SCHMEICHEL, K. L., BECKERLE, M. C. & WINGE, D. R.
(1993) The LIM motif defines a specific zinc-binding protein domain. Proc
Natl Acad Sci U S A, 90, 4404-8.
MIYAMOTO, C. A., FISCHMAN, D. A. & REINACH, F. C. (1999) The interface
between MyBP-C and myosin: site-directed mutagenesis of the CX myosin-
binding domain of MyBP-C. J Muscle Res Cell Motil, 20, 703-15.

43
MOEHREN, U., DRESSEL, U., REEB, C. A., VAISANEN, S., DUNLOP, T. W.,
CARLBERG, C. & BANIAHMAD, A. (2004) The highly conserved region of
the co-repressor Sin3A functionally interacts with the co-repressor Alien.
Nucleic Acids Res, 32, 2995-3004.
MORGAN, M. J. & MADGWICK, A. J. (1996) Slim defines a novel family of LIM-
proteins expressed in skeletal muscle. Biochem Biophys Res Commun, 225,
632-8.
MORGAN, M. J. & MADGWICK, A. J. (1999) The fourth member of the FHL
family of LIM proteins is expressed exclusively in the testis. Biochem Biophys
Res Commun, 255, 251-5.
MORGAN, M. J. & WHAWELL, S. A. (2000) The structure of the human LIM
protein ACT gene and its expression in tumor cell lines. Biochem Biophys Res
Commun, 273, 776-83.
MORLON, A. & SASSONE-CORSI, P. (2003) The LIM-only protein FHL2 is a
serum-inducible transcriptional coactivator of AP-1. Proc Natl Acad Sci U S
A, 100, 3977-82.
MUHLE-GOLL, C., HABECK, M., CAZORLA, O., NILGES, M., LABEIT, S. &
GRANZIER, H. (2001) Structural and functional studies of titin's fn3 modules
reveal conserved surface patterns and binding to myosin S1--a possible role in
the Frank-Starling mechanism of the heart. J Mol Biol, 313, 431-47.
MULLER, F. & TORA, L. (2004) The multicoloured world of promoter recognition
complexes. Embo J, 23, 2-8.
MULLER, J. M., METZGER, E., GRESCHIK, H., BOSSERHOFF, A. K., MERCEP,
L., BUETTNER, R. & SCHULE, R. (2002) The transcriptional coactivator
FHL2 transmits Rho signals from the cell membrane into the nucleus. Embo J,
21, 736-48.
NOURRY, C., GRANT, S. G. & BORG, J. P. (2003) PDZ domain proteins: plug and
play! Sci STKE, 2003, RE7.
PAWSON, T. & NASH, P. (2003) Assembly of cell regulatory systems through
protein interaction domains. Science, 300, 445-52.
PEREZ-ALVARADO, G. C., KOSA, J. L., LOUIS, H. A., BECKERLE, M. C.,
WINGE, D. R. & SUMMERS, M. F. (1996) Structure of the cysteine-rich
intestinal protein, CRIP. J Mol Biol, 257, 153-74.
PEREZ-ALVARADO, G. C., MILES, C., MICHELSEN, J. W., LOUIS, H. A.,
WINGE, D. R., BECKERLE, M. C. & SUMMERS, M. F. (1994) Structure of
the carboxy-terminal LIM domain from the cysteine rich protein CRP. Nat
Struct Biol, 1, 388-98.
ROBINSON, P. A., BROWN, S., MCGRATH, M. J., COGHILL, I. D., GURUNG, R.
& MITCHELL, C. A. (2003) Skeletal muscle LIM protein 1 regulates
integrin-mediated myoblast adhesion, spreading, and migration. Am J Physiol
Cell Physiol, 284, C681-95.
SANCHEZ-GARCIA, I. & RABBITTS, T. H. (1994) The LIM domain: a new
structural motif found in zinc-finger-like proteins. Trends Genet, 10, 315-20.
SCHOLL, F. A., MCLOUGHLIN, P., EHLER, E., DE GIOVANNI, C. & SCHAFER,
B. W. (2000) DRAL is a p53-responsive gene whose four and a half LIM
domain protein product induces apoptosis. J Cell Biol, 151, 495-506.
SEBILLON, P., BONNE, G., FLAVIGNY, J., VENIN, S., ROUCHE, A., FISZMAN,
M., VIKSTROM, K., LEINWAND, L., CARRIER, L. & SCHWARTZ, K.
(2001) COOH-terminal truncated human cardiac MyBP-C alters myosin
filament organization. C R Acad Sci III, 324, 251-60.

44
TSKHOVREBOVA, L. & TRINICK, J. (2004) Properties of titin immunoglobulin
and fibronectin-3 domains. J Biol Chem, 279, 46351-4.
TURNER, J., NICHOLAS, H., BISHOP, D., MATTHEWS, J. M. & CROSSLEY, M.
(2003) The LIM protein FHL3 binds basic Kruppel-like factor/Kruppel-like
factor 3 and its co-repressor C-terminal-binding protein 2. J Biol Chem, 278,
12786-95.
WARDROP, S. L. & BROWN, M. A. (2005) Identification of two evolutionarily
conserved and functional regulatory elements in intron 2 of the human
BRCA1 gene. Genomics, 86, 316-28.
WAY, J. C. & CHALFIE, M. (1988) mec-3, a homeobox-containing gene that
specifies differentiation of the touch receptor neurons in C. elegans. Cell, 54,
5-16.
YASUKAWA, T., KANEI-ISHII, C., MAEKAWA, T., FUJIMOTO, J.,
YAMAMOTO, T. & ISHII, S. (1995) Increase of solubility of foreign proteins
in Escherichia coli by coproduction of the bacterial thioredoxin. J Biol Chem,
270, 25328-31.