Embed Size (px)
Citation preview
UPTEC X 10 010
Examensarbete 30 hpJuni 2010
Purification and characterization of IgY antibodies from chicken egg yolk against the changing influenza A-virus
John Juter
Molecular Biotechnology Programme
Uppsala University School of Engineering
UPTEC X 10 010 Date of issue 2010-06
Author
John Juter
Title (English)
Purification and characterization of IgY antibodies from chicken egg yolk against the changing influenza A-virus
Title (Swedish)
Abstract
Pandemic influenza is a constant threat to the public health and economy. The pandemic
H1N1 outbreak of 2009 highlights the need for new forms of immunotherapy. Avian
antibodies (IgY) represent a cheap and effective form of passive immunotherapy. In this study
we have developed a cheap and high-yield purification protocol that could be applied to a
large scale production of IgY. We also showed that the extracted IgY has a good ability to
neutralize virus in vitro. An automated fluorochrome based immune assay has also been
developed on a Gyrolab instrument for quantification of IgY.
Keywords
IgY, Influenza, H5N1, Gyrolab, Immunoassay, Precipitation
Supervisors
Kjell-Olov Grönvik Statens veterinärmedicinska anstalt
Scientific reviewer
Birgitta Heyman Uppsala universitet, Institutionen för medicinsk biokemi och mikrobiologi
Project name
Sponsors
Language
English
Security
ISSN 1401-2138
Classification
Pages
24
Biology Education Centre Biomedical Center Husargatan 3 Uppsala
Box 592 S-75124 Uppsala Tel +46 (0)18 4710000 Fax +46 (0)18 471 4687
Purification and characterization of IgY antibodies from chicken
egg yolk against the changing influenza A-virus
John Juter
Populärvetenskaplig sammanfattning
Pandemisk influensa är ett konstant hot mot den globala folkhälsan och ekonomin. Detta beror på
influensavirusets förmåga att ändra sitt utseende för att undvika vårt immunförsvar. Den mycket dödliga
fågelinfluensan H5N1 har en dödlighet på 60 %, som tur är så smittar den än så länge inte människor
emellan. Dock finns oron att H5N1 kan mutera och bli lika smittsam som säsongsinfluensan.
En alarmerande erfarenhet från utbrottet av ”svininfluensan”, H1N1, var att det är svårt att få fram
effektiva och säkra vaccin snabbt nog till hela befolkningen. Virus som är resistenta mot de tillgängliga
antivirala drogerna dök också snabbt upp. Detta leder till ett behov av nya former av immunoterapi för
att kontrollera ett utbrott av influensa. Antikroppar från ägg (IgY) lagda av hönor som blivit
immuniserade med influensa erbjuder ett billigt och effektivt sätt att producera stora volymer
terapeutiska och profylaktiska antikroppar.
I detta examensarbete har en billig och enkel reningsmetod med högt utbyte utvecklats för utvinning av
IgY från äggula. Vi har även visat att dessa framrenade IgY antikroppar har god förmåga att neutralisera
influensa virus. En detektionsmetod för IgY har även utvecklats på ett Gyrolab instrument, som är en
fluorescensbaserad immunologisk detektionsmetod.
Examensarbete 30 hp Civilingenjörsprogrammet Molekylär bioteknik
Uppsala universitet juni 2010
Table of Contents Abbreviations used ...................................................................................................................... 2
Introduction ................................................................................................................................. 3
Chicken IgY and its purification ............................................................................................... 3
The influenza virus .................................................................................................................... 4
Aim of the project ..................................................................................................................... 5
Materials and Methods ............................................................................................................... 6
Purifying methods ..................................................................................................................... 6
Determination of IgY concentration ......................................................................................... 6
Dialysis ...................................................................................................................................... 6
Concentrating IgY samples ....................................................................................................... 6
An automated fluorochrome based immunoassay for quantification of IgY ............................ 6
Preparation of Ab to use in the assay .................................................................................... 7
Biotinylation .......................................................................................................................... 7
Alexa labeling ....................................................................................................................... 7
IgY standard .......................................................................................................................... 8
Functionality test for purified IgY ............................................................................................ 8
Results and discussion ................................................................................................................. 9
Gyrolab –assay development .................................................................................................... 9
Identification of suitable Ab pair to detect IgY on a Gyrolab assay ..................................... 9
Analyzing the individual responses with Gyrolab viewer ................................................... 11
The intra assay variation ..................................................................................................... 11
Dynamic range .................................................................................................................... 11
Gyrolab compared to ELISA ............................................................................................... 12
Development of a purification protocol for H5N1 specific IgY from chicken egg yolk ........ 13
Negative Effect of Sodium Chloride ................................................................................... 13
Determining optimal ammonium sulfate concentration to precipitate IgY ......................... 14
Precipitation with solid salt optimizes IgY yield ................................................................ 14
Removal of lipids proves crucial ......................................................................................... 15
Aggregation time proves crucial when precipitating with ammonium sulphate ................. 15
High functionality of purified IgY ...................................................................................... 15
Loss of IgY during purification ........................................................................................... 16
The method of choice for the purification of IgY from chicken egg yolk .......................... 17
Concluding remarks .................................................................................................................. 19
Future developments ................................................................................................................. 20
Acknowledgments ..................................................................................................................... 21
References .................................................................................................................................. 22
2
Abbreviations used
Ab – Antibody
AS – Ammonium Sulphate
CV – Coefficient of variance
IgY – Egg yolk immunoglobulin
PBS – Phosphate buffered saline
PEG - Polyethylene glycol
3
Introduction
Antibodies (Ab) produced in chickens offer several advantages over Ab produced by mammals
like rabbit or mouse. Collecting eggs is an appealing alternative from the invasive procedure of
animal bleeding. An immunized chicken provides, on average, a daily source of polyclonal Ab
in the amount of 8 –20 mg/ml egg yolk, comparable to an average bleed of a rabbit (Jensenius &
Koch, 1993). The problematic purification of the chicken egg yolk immunoglobulin Y (IgY)
from the complex egg yolk matrix is what has been limiting the use of IgY. Our aim was to
develop a simple, efficient, high yielding and cost effective method that also can be scaled into
large scale production. The method used is an extraction procedure based on a water dilution
method to remove lipids and lipoproteins, followed by precipitation with ammonium sulfate
(AS) and polyethylene glycol (PEG). A new automated fluorochrome based immunoassay was
also developed to quantify and study functionality of small volumes with low IgY
concentrations.
Chicken IgY and its purification
The yolk of eggs laid by immunized chickens is an excellent source of polyclonal Ab, called
IgY, which is an 180 kDa analogue to IgG. An egg laying hen produces approximately one egg
per day and a single egg contains approximately 100 mg IgY. Hence a single hen can produce as
much as 18 times more IgY, in one month, than corresponding IgG production in rabbit
(Gassmann, 1990). The yolk consists of two main parts: the granules and the plasma, where the
granules are suspended in the plasma. Granule proteins contain high density lipoproteins, low
density lipoproteins, lipids and phosvitine. The plasma proteins contains the IgY (γ-livetin),
chicken serum albumin (α-livetin) and α2-glycoprotein (β-livetin) (De Meulenaer &
Huyghbaert, 2001). The use and potential of IgY is promising both as a cheap way to
manufacture polyclonal Ab for immunoassays and for use as an oral prophylactic treatment.
Oral administration of specific IgY prevents e.g. Pseudomonas aeruginosa (Larsson,
Nilsson, & Olesen, 2008), Escherichia coli (Yokoyama, 1992) and Salmonella enteriditis
(Peralta, 1994) infection. IgY also has the advantage of not reacting with mammalian Fc
receptors, complement or rhemathoid factors as mammalian Ab do (Ko & Ahn, 2007), which is
beneficial in human treatment as well as for use in immunoassays. In addition conserved
mammalian proteins tend to be more immunogenic in hens than in other mammals due to the
phylogenetic distance of birds. However IgY does not bind protein A and G derived from
Staphylococcus thus making large scale purification more difficult and expensive (De
Meulenaer & Huyghbaert, 2001).
The main problem is the removal of lipids and lipoproteins, which is present in high
concentrations. The method of choice is depending of which criteria is set on the method. Due
to need for large amounts of polyclonal Ab it is desired to have a simple, efficient, high yielding
and cost effective method that also can be applied to a large scale production. Organic solvents,
salts, ultracentrifugation and different chromatography techniques have been used. The
extraction procedure using water dilution coupled to a precipitation step has proven both high
yielding and cost effective (Akita & Nakai, 1993). One good thing with using the water dilution
method as a first step is that it does not contaminate the rest products, hence opening up the
possibility of using them for industrial or pharmaceutical purposes. The lipid concentration can
be further decreased from 1 % in the supernatant to 0.08 % (Ko & Ahn, 2007), by adjusting the
4
pH from around pH 6 (natural pH in egg yolk suspended in water) to pH 5. Added NaCl
increases the solubility of proteins in egg yolk, but the IgY content does not increase, it rather
decreases with rising concentration of NaCl (Ko & Ahn, 2007). Ammoniumsulphate
precipitation has been shown to be superior to chromatography both in yield and in the
possibility for large scale purification of IgY (Ko & Ahn, 2007).
The influenza virus
The influenza virus is notoriously known to history. In the 1918 pandemic it is estimated that 50
million or more people died (Taubenberger & Morens, 2006). During the second and more
severe wave of human disease in 1918 were also reports of respiratory diseases in herds of
swine (Sullivan & Jacobson, 2010). Even though 50 million people died in the 1918 influenza it
had only a mortality rate of 2.5%. As of December 2009 the highly pathogenic avian influenza
strain, H5N1, had infected 447 people with a mortality rate of 60 % (WHO, 2009). The
seriousness of the situation if a new pandemic influenza as infectious as the 1918 and as lethal
as the H5N1 influenza would emerge cannot be stressed enough.
Viruses are usually highly species specific and rarely cross over to infect another species. This
is unfortunately not the case with influenza. The influenza is an RNA-virus and therefore is
highly prone to mutate. The result is the need of new vaccines against the seasonal influenza
that reappears every year. There are three different kinds of influenza, A, B and C, where type A
can cause disease in several mammals as well as in birds. Influenza virus B is only known to
infect humans, seals and ferrets (Osterhaus & Rimmelzwaan, 2000) (Jakeman, 1994) and has a
much slower mutation rate than type A. Therefore is the type B is not considered a threat for a
pandemic influenza, but is responsible for several local epidemics. Type C was thought to be
specific to humans but it has recently been shown to infect pigs and dogs (Crescenzo-Chaigne &
van der Werf, 2007). The C virus tends to give a mild symptom and is therefore, like B virus,
unlikely to result in a pandemic. Influenza A virus is of great concern for humans. It is
characterized by two different surface proteins: hemagglutinin and neuraminidase. There are 16
different forms of hemagglutinin and 9 different forms of neuraminidase known today (Sullivan
& Jacobson, 2010), giving rise to 144 possible combinations. All known subclasses are known
to infect waterfowl. The majority of these viruses cause no harm to the birds, but they create an
extensive reservoir of influenza virus constantly circulating in the bird population. In this
genetic reservoir the virus can mutate and be subjected to antigenic shift, which could lead to
viruses acquiring genes to infect a new species (WHO, 2006). E.g. the new pandemic swine flu
is a strain of H1N1 that has properties from birds, pigs and humans.
Vaccines are in need of constant updates due to these mutations and antigenic shifts of the virus.
To fight the influenza infections we use pharmaceuticals that target and interfere with virus
reproduction as well as vaccinations and isolation of humans and animals. Problems with
viruses becoming resistant towards pharmaceuticals, the difficulty in rapid production of large
amounts of effective vaccines, not to mention the problem with isolation and quarantine of
people in today’s global society, calls for improvements in our defense against influenza
infections.
5
Aim of the project
The overall aim of the project is to develop new forms of intranasal-oral immunotherapy by
using IgY Ab to control seasonal and pandemic influenza A-virus.
My part of the project was:
1) To develop a purification protocol for IgY from chicken egg yolk of laying hens.
2) To study the functionality of the purified H5N1 specific IgY.
3) To develop a fluorochrome based immunoassay in a Gyrolab instrument for
quantification of H5N1 specific IgY.
6
Materials and Methods
Purifying methods
IgY from egg yolk was first extracted by using a water dilution method, first suggested by Akita
& Nakai (1992) and was then purified in a series of precipitation steps using AS and PEG,
suggested by Rajic & Stehmann (2009). The later protocol was further improved and evaluated
in the present study.
Determination of IgY concentration
IgY chicken ELISA kit (Hycult biotechnology b. v., Uden, Netherlands) was used according to
manufacturer’s instruction to determine the concentration of extracted IgY from the egg yolk. In
short, samples were prepared and a serial dilution of a standard was performed. 100 µl in
triplicate of each standard and duplicate of each sample was added to a microtiter plate
(provided with the IgY chicken ELISA kit), then incubated for 1 hour at room temperature. The
plates were washed four times with 200 µl wash buffer before 100 µl of diluted tracer was
transferred to each well and incubated for 1 h at room temperature. Plates were washed four
times with 200 µl wash buffer prior the addition of 100 µl streptavidin peroxidase and incubated
for 1 h at room temperature. Plates were then washed four times with 200 µl wash buffer before
100 µl tetramethylbenzidine substrate was added and incubated in the dark for 10 to 20 minutes.
The reaction was then stopped by adding 100 µl stop solution. The absorbance was measured at
450 nm. Samples were compared to a standard curve created using four parameter fit by
softmax pro (Molecular Devices, USA, California).
Dialysis
Dialysis was performed in phosphate buffered saline (PBS) pH 7.2 to remove AS and PEG
remnants and to give a more physiological environment and ensure functionality.
Molecularporous membrane tubing (Spectrum Laboratories Inc, Houston, Texas, USA) with
molecular cut off weight at 6-8 kDa was used. 1.6 ml of IgY was dialyzed at 4 C in 1.8 l of
PBS for 8 h, then changed to 1.8 l of new PBS and left over night before ending the dialysis. No
loss of IgY was detected during dialysis, confirmed with IgY chicken ELISA kit.
Concentrating IgY samples
To concentrate extractions of IgY with a concentrations less than 4 mg/ml in PBS, a Macrosep
centrifugal device (PALL Life Sciences, Michigan, USA) was used according to manufacturer’s
instruction. Briefly, 15 ml of IgY was added to the device and centrifuged for a total of 45
minutes at 4 000 x g at 4 °C to get a sample volume of 1.5 ml. This is equivalent with
concentrating the sample 10 times. The filter in the device had a molecular cut of weight at 50
kDa. The procedure was monitored before and after centrifugation with IgY chicken ELISA kit
to ensure that proper concentration was achieved.
An automated fluorochrome based immunoassay for quantification of IgY
A sandwich immunoassay for IgY detection in Gyrolab (Gyros AB, Uppsala, Sweden) was
developed. The Gyrolab system consists of a processing unit performing all liquid transfers
from a microtiter plate into a CD micro laboratory. An integrated detector for laser induced
7
fluorescence detects the emitted fluorescence. The CD micro laboratory contains 112 identical
microstructures to which liquids are introduced through capillary forces. Further movements of
the liquids are facilitated by spinning the CD, creating a centrifugal force acting on all samples
at the same time. The fluorescent signal is detected by moving the laser induced fluorescence
detector in the radial direction while rotating the CD. The response is compared with a standard
curve created in parallel with all samples. The concentration is calculated by using Gyrolab
Evaluator software, where the response value from the samples is compared to the standard
curve.
Preparation of Ab to use in the assay Two polyclonal goat anti IgY Ab (AA129 that recognizes the Fc region of IgY and 610001
recognizing the H/L chain on IgY, AbD Serotec, Oxford, England) were biotinylated and
labeled with Alexa to be tested for the optimal combination to use as capture and detection in
the assay.
The sodium azide used as a preservative had to be removed prior to biotinylation and labeling
with Alexa by using a Nanosep 30 K membrane device. The membrane was placed in a sample
reservoir and prerinsed two times by filtering 500 μl deionized water through the membrane by
spinning at 11 000 x g for 6 minutes. 100 µl of Ab was then added to the sample reservoir and
400 µl of 0.1 M Sodium bicarbonate buffer was then added on top of the Ab. The Ab solution
was spun for 5 minutes at 11 000 x g and then washed 3 times with 400 μl 0.1 M sodium
bicarbonate buffer and spun each time at 11 000 x g for 5 minutes. In the last washing step the
Ab solution was allowed to spin dry in the device and the Ab was easily recovered by pipetting
several times with 100 μl 0.1 M sodium bicarbonate buffer.
Biotinylation The two goat anti IgY antisera were labeled with biotin (Pierce, Rockford, USA) to be tested as
capture Ab. In short, the biotinylation reagent was mixed by gentle vortexing in a 12 molar
excess compared to the capture Ab. The solution was left to incubate while gently shaking for
one hour at room temperature. To remove unbound biotin a protein desalting spin column
(Pierce, Rockford, USA) was prepared by adding 400 µl PBS and then centrifuging at 1500 x g
for 1 minute. This preparation step was repeated three times before the biotinylation reagent was
added. The device was placed in a new collection tube and centrifuged at 1 500 x g for 2
minutes. The biotinylated Ab was stored at 4 °C.
Alexa labeling The two goat anti IgY antisera were also labeled with Alexa to be tested as detection Ab.
Briefly, 100 µl of the Ab was transferred to a vial containing the Alexa Fluor 647 (Invitrogen
AB, Paisley, UK) and mixed by gentle vortexing. Care was taken to protect the vial from light
by wrapping it in aluminum foil. The solution was left to incubate for one hour at room
temperature while shaking the vial gently. To remove unbound Alexa, the column filter,
supplied with the Alexa labeling kit, was moistened with 1 ml PBS prior to addition of the
purification resin. Compressed air was used to elute the PBS and additional purification resin
was added until the bed volume reached approximately 1.5 ml. The column buffer was allowed
to drain from the column by gravity, before placed in the provided collection tube and was
centrifuged at 1 100 x g for 3 minutes. 100 μl of the labeled Ab was then added onto the
purification column and centrifuged at 1 100 x g for 5 minutes. The labeled reagent was then
transferred to a dark vial and stored at 4 °C.
8
IgY standard Purified IgY (PAP001 )(AbD Serotec, Oxford, England) was used as standard. Binding of the
standard was detected with the polyclonal goat anti IgY Ab. Results were evaluated using
GyroLab viewer (Gyros AB, Uppsala, Sweden) and compared with results from the IgY chicken
ELISA kit.
Functionality test for purified IgY
An in vitro serum neutralization test (SN test) with H5N1 (A/Vietnam/1194/04) specific IgY
extracted from egg yolk was performed as previously described (Hoffmann, Lipatov, Webby, &
Govorkova, 2005). In short, IgY from different extraction protocols were diluted in PBS pH 7.2
to a concentration of 1 mg/ml, from which serial two fold dilutions were performed in a
microtiter plate. Then 100 units 50% tissue culture infective dose of highly pathogenic avian
influenza H5N1 virus was added and plates were incubated for 1 h at room temperature. The
Madin Darby Canine Kidney (MDCK) cell suspension in Eagle's minimal essential medium
(EMEM) containing 10% fetal bovine serum was then added to the wells and incubated at 37°C
± 1°C in 5% CO2 for 3-5 days. Positive (water extracted H5N1 specific IgY) and negative
(H3N2 specific IgY) controls were used and compared with the purified IgY. Neutralization
occurs when a virus lost infectivity through reaction with specific antibody and therefore
prevents any one of the steps leading to the release of the viral genome into the host cells. The
presence of unneutralized virus is read visually. The titer is expressed as the reciprocal of the
highest dilutions which gives 50% neutralization of the virus.
9
Results and discussion
Gyrolab –assay development
The first step in the development of the new fluorochrome based immunoassay on Gyrolab was
to establish a standard curve for IgY. Commercial IgY was diluted in a similar range as the
commercial IgY ELISA kit and used to determine which of the four combinations of capture
and detection that was the best choice.
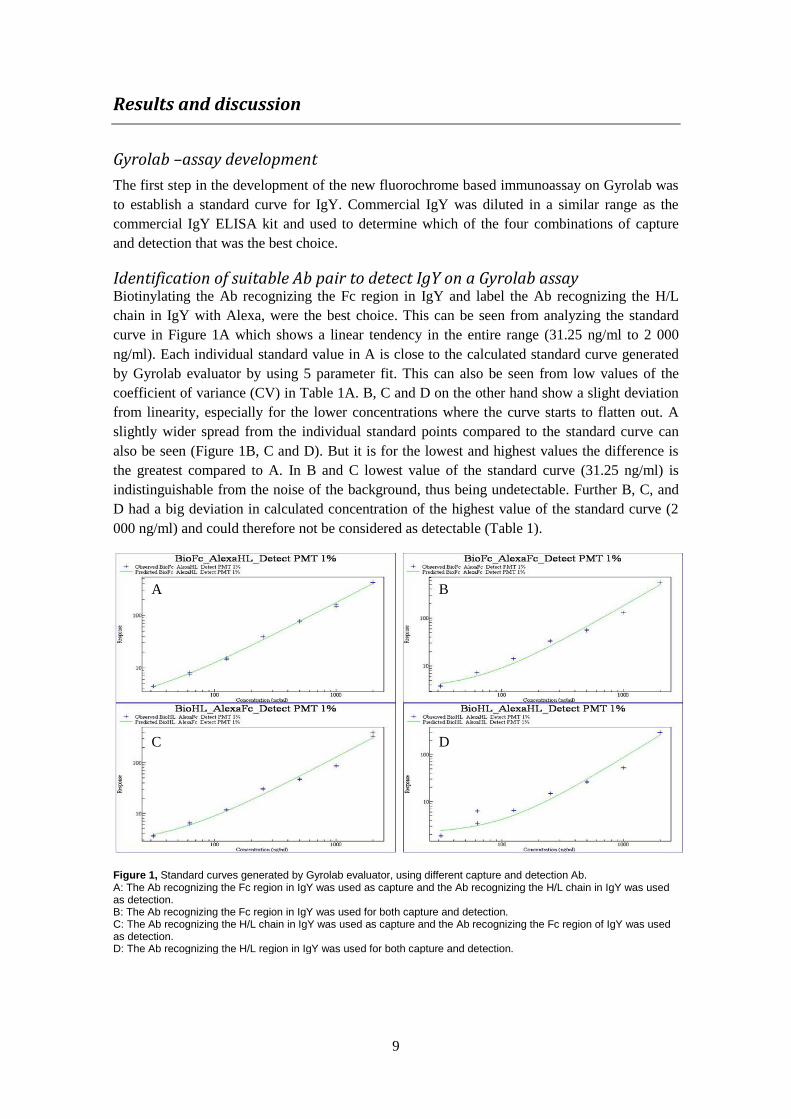
Identification of suitable Ab pair to detect IgY on a Gyrolab assay Biotinylating the Ab recognizing the Fc region in IgY and label the Ab recognizing the H/L
chain in IgY with Alexa, were the best choice. This can be seen from analyzing the standard
curve in Figure 1A which shows a linear tendency in the entire range (31.25 ng/ml to 2 000
ng/ml). Each individual standard value in A is close to the calculated standard curve generated
by Gyrolab evaluator by using 5 parameter fit. This can also be seen from low values of the
coefficient of variance (CV) in Table 1A. B, C and D on the other hand show a slight deviation
from linearity, especially for the lower concentrations where the curve starts to flatten out. A
slightly wider spread from the individual standard points compared to the standard curve can
also be seen (Figure 1B, C and D). But it is for the lowest and highest values the difference is
the greatest compared to A. In B and C lowest value of the standard curve (31.25 ng/ml) is
indistinguishable from the noise of the background, thus being undetectable. Further B, C, and
D had a big deviation in calculated concentration of the highest value of the standard curve (2
000 ng/ml) and could therefore not be considered as detectable (Table 1).
Figure 1, Standard curves generated by Gyrolab evaluator, using different capture and detection Ab. A: The Ab recognizing the Fc region in IgY was used as capture and the Ab recognizing the H/L chain in IgY was used as detection. B: The Ab recognizing the Fc region in IgY was used for both capture and detection. C: The Ab recognizing the H/L chain in IgY was used as capture and the Ab recognizing the Fc region of IgY was used as detection. D: The Ab recognizing the H/L region in IgY was used for both capture and detection.
A B
C D
10
Standard concentration
[ng/ml]
CV of concentration [%]
S:N BioFc and AlexaH/L
A B C D
BioFc and AlexaH/L
BioFc and AlexaFc
BioH/L and AlexaFc
BioH/L and AlexaH/L
31,25 1,6 -a
4,5 -a
36
62,5 5,7 1 6,1 48 65
125 3 0,92 2,2 0,9 125
250 0,25 1,4 1,8 0,46 325
500 1,9 2,1 0,96 0,62 642
1000 5,3 0,44 1,7 0,78 1333
2000 1 -b
-b
-b
3500
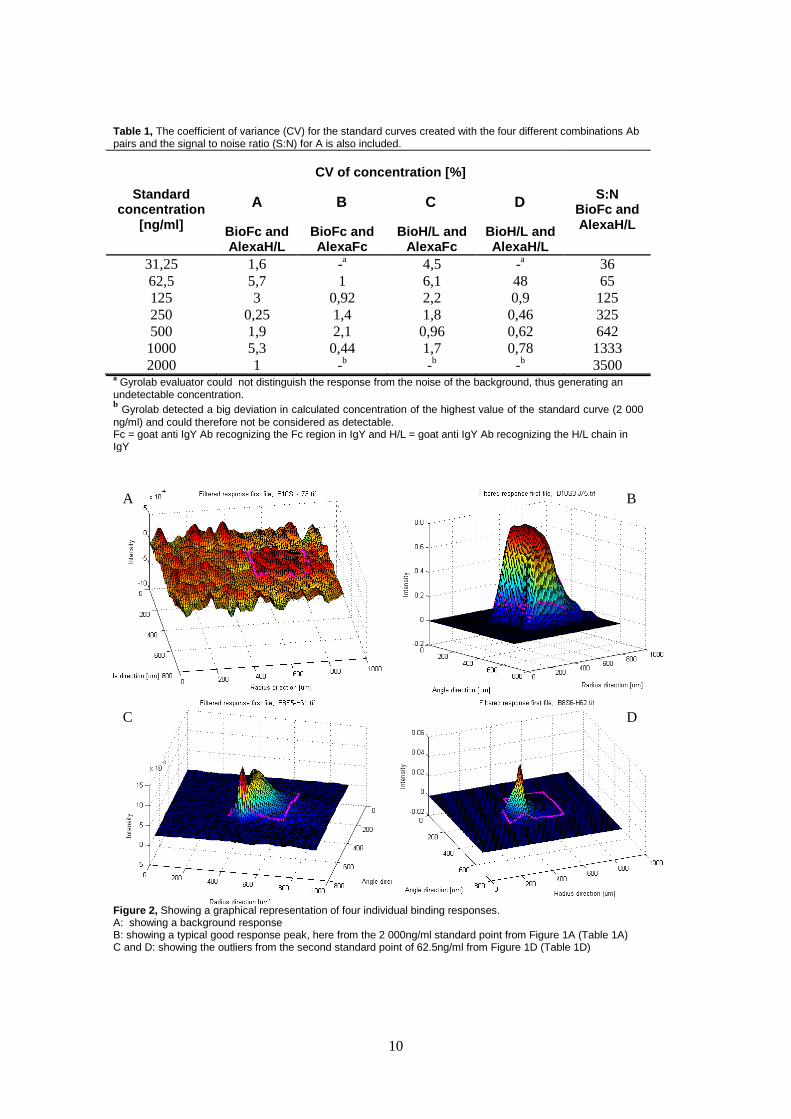
Table 1, The coefficient of variance (CV) for the standard curves created with the four different combinations Ab pairs and the signal to noise ratio (S:N) for A is also included.
a Gyrolab evaluator could not distinguish the response from the noise of the background, thus generating an
undetectable concentration. b Gyrolab detected a big deviation in calculated concentration of the highest value of the standard curve (2 000
ng/ml) and could therefore not be considered as detectable. Fc = goat anti IgY Ab recognizing the Fc region in IgY and H/L = goat anti IgY Ab recognizing the H/L chain in IgY
Figure 2, Showing a graphical representation of four individual binding responses. A: showing a background response B: showing a typical good response peak, here from the 2 000ng/ml standard point from Figure 1A (Table 1A) C and D: showing the outliers from the second standard point of 62.5ng/ml from Figure 1D (Table 1D)
A B
C D
11
Analyzing the individual responses with Gyrolab viewer The software tool Gyrolab viewer was used to visualize outliers and the affinity of Ab in this
assay (Figure 2). The viewer function creates a graphical representation of each individual
binding response and the fluorescence profiles reflect the total amount of protein bound to each
column. This is done when liquid flows in the column from left to right. Hence the fluorescent
signal has its highest intensity where the protein concentration is highest. The purple square
indicates the area where the capture column is located, i.e. where the response should be.
This analysis was performed on all values of the standard curve in Figure 1A and compared to
the standard curves in Figure 1B, C and D (data not shown) and is here illustrated with one
example: from a good standard point (2 000 ng/ml) (Figure 2B) from the standard curve in
Figure 1A and a bad standard point (62.5 ng/ml) (Figure 2C and 2D) from the standard curve in
Figure 1D.
Figure 2A is shown to illustrate the background noise. The response needs to be distinguishable
from this in order to be a detectable value.
The intra assay variation The intra assay variation can be analyzed from the CV value of each point on the standard
curve. It is desired to have a CV percentage value less than 20 %, when developing an assay like
this. In the assay I developed here on Gyrolab all values of the standard curve had a CV value
strictly less than 15 %, which indicates low intra assay variation (Table 2).
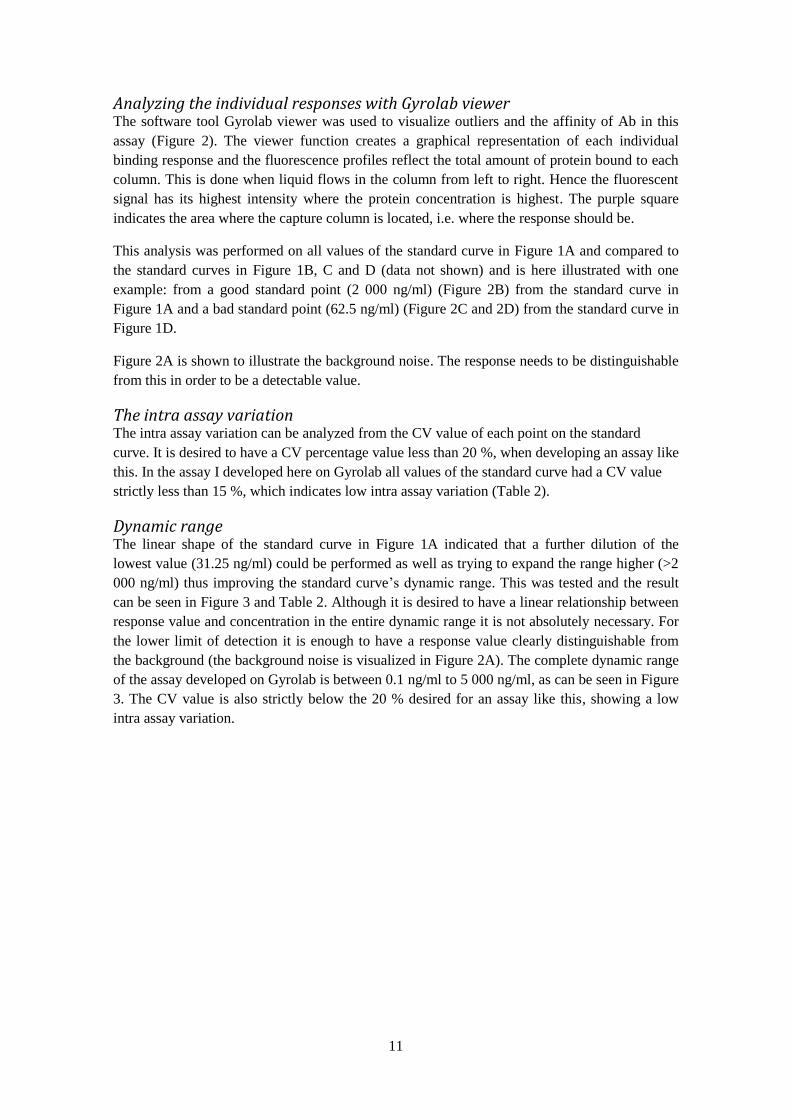
Dynamic range The linear shape of the standard curve in Figure 1A indicated that a further dilution of the
lowest value (31.25 ng/ml) could be performed as well as trying to expand the range higher (>2
000 ng/ml) thus improving the standard curve’s dynamic range. This was tested and the result
can be seen in Figure 3 and Table 2. Although it is desired to have a linear relationship between
response value and concentration in the entire dynamic range it is not absolutely necessary. For
the lower limit of detection it is enough to have a response value clearly distinguishable from
the background (the background noise is visualized in Figure 2A). The complete dynamic range
of the assay developed on Gyrolab is between 0.1 ng/ml to 5 000 ng/ml, as can be seen in Figure
3. The CV value is also strictly below the 20 % desired for an assay like this, showing a low
intra assay variation.
12
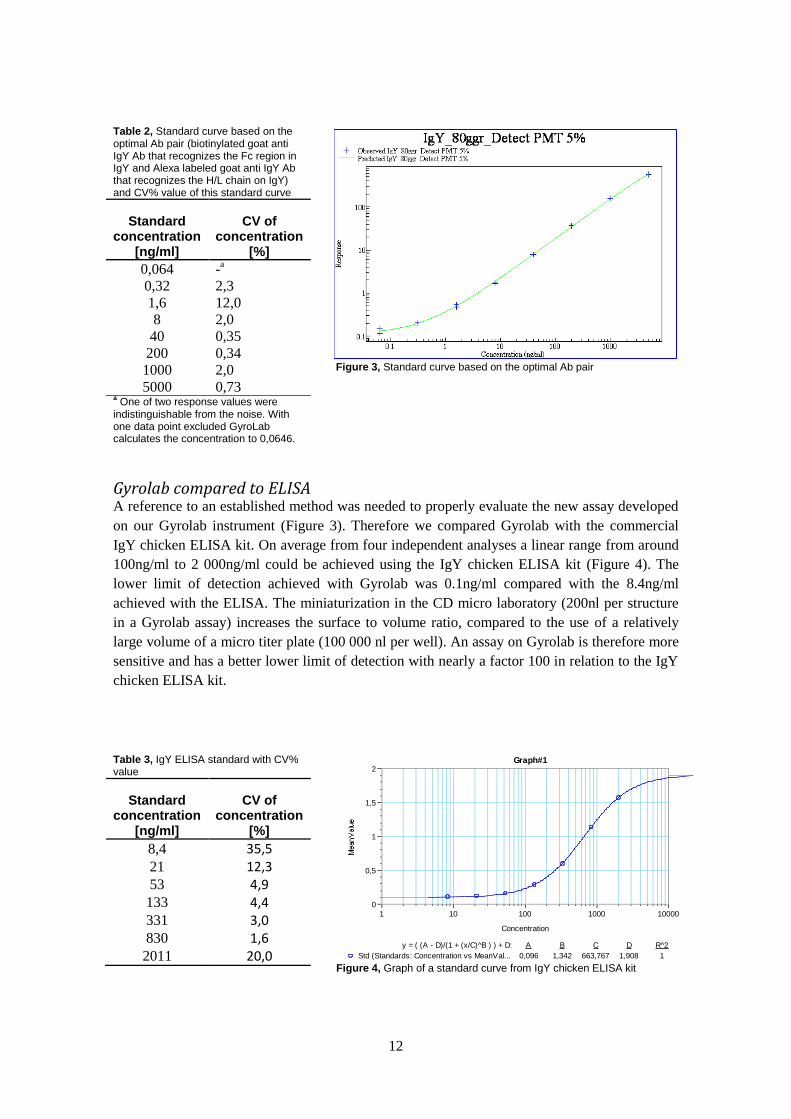
Gyrolab compared to ELISA A reference to an established method was needed to properly evaluate the new assay developed
on our Gyrolab instrument (Figure 3). Therefore we compared Gyrolab with the commercial
IgY chicken ELISA kit. On average from four independent analyses a linear range from around
100ng/ml to 2 000ng/ml could be achieved using the IgY chicken ELISA kit (Figure 4). The
lower limit of detection achieved with Gyrolab was 0.1ng/ml compared with the 8.4ng/ml
achieved with the ELISA. The miniaturization in the CD micro laboratory (200nl per structure
in a Gyrolab assay) increases the surface to volume ratio, compared to the use of a relatively
large volume of a micro titer plate (100 000 nl per well). An assay on Gyrolab is therefore more
sensitive and has a better lower limit of detection with nearly a factor 100 in relation to the IgY
chicken ELISA kit.
Table 2, Standard curve based on the optimal Ab pair (biotinylated goat anti IgY Ab that recognizes the Fc region in IgY and Alexa labeled goat anti IgY Ab that recognizes the H/L chain on IgY) and CV% value of this standard curve
Standard concentration
[ng/ml]
CV of concentration
[%]
0,064 -a
0,32 2,3
1,6 12,0
8 2,0
40 0,35
200 0,34
1000 2,0
5000 0,73 a One of two response values were
indistinguishable from the noise. With one data point excluded GyroLab calculates the concentration to 0,0646.
Table 3, IgY ELISA standard with CV% value
Standard concentration
[ng/ml]
CV of concentration
[%]
8,4 35,5 21 12,3 53 4,9
133 4,4 331 3,0 830 1,6 2011 20,0
Figure 3, Standard curve based on the optimal Ab pair
Concentration
1 10 100 1000 10000
0
0,5
1
1,5
2Graph#1
y = ( (A - D)/(1 + (x/C)^B ) ) + D: A B C D R^2
Std (Standards: Concentration vs MeanVal... 0,096 1,342 663,767 1,908 1
Figure 4, Graph of a standard curve from IgY chicken ELISA kit
13
More intra assay variability, measured in CV of the concentration was discovered in the ELISA
assays than in the GyroLab assays (Table 2 and 3). This could be explained by Gyrolab being an
automated instrument with accurate pipetting and that it uses a centrifugal force to move liquids
acting on all samples at once. The result saves time and decreases the variability.
Another advantage in using Gyrolab is the small volumes of samples (2.5 µl of sample to allow
for the automatic pipetting and an addition of 0.5 µl per sample replicate) and reagents
necessary to complete a run compared to an ELISA assay (100 µl per sample replicate). This is
particularly useful when performing multiple analyses on serum samples, e.g. mouse serum
where a non terminal bleed could yield 0.2 ml to 0.3 ml and several substances need to be tested
for.
Development of a purification protocol for H5N1 specific IgY from chicken egg yolk
Commercially available IgY were used in the assay development on Gyrolab (Figure 1-4; Table
1-3). From now on I will describe how a new purification protocol was developed by improving
the purification protocol suggested by (Rajic & Stehmann, 2009). The first step used is the
water dilution method first suggested by Akita & Nakai (1992) to precipitate most of the lipids.
This extraction was performed before I entered the project. In short, the yolk was separated
from the white and rinsed with super Q water to remove as much albumin as possible. The egg
yolk was poured into a small beaker, by holding the yolk sack and carefully cutting a hole in it.
The egg yolk was then suspended in approximately nine volumes of super Q water and the
suspension was left to settle over night at 4 °C. The supernatant was then stored at -20 °C
Negative Effect of Sodium Chloride It was suggested that performing the water dilution step in a solution of 3 mM HCl and with the
pH adjusted to pH 5.5 with 10 % (v/v) acetic acid (Rajic & Stehmann, 2009) would be
advantageous compared to the use of super Q water in removing lipids and lipoproteins. The
egg yolk solution used here was suspended in super Q water to a 1:10 solution. In an attempt to
recreate the 3 mM HCL, 1 M HCl was carefully added during stirring, but was aborted when the
pH value dropped to pH 4 long before a final concentration of 3 mM HCl was reached. NaOH 1
M was added during stirring to get the desired pH 5.5. The effect was compared to a batch with
pH adjusted directly to 5.5 through careful titration with 1 M HCl, without NaOH added, and
the result was monitored with IgY chicken ELISA. As can be seen in Table 4 there were seven
times higher IgY yield in the sample not treated with NaOH, with 14.4 % IgY yield versus 1.9
%. This is in agreement with findings by Akita & Nakai (1992) and clearly indicates the
importance of keeping a low ionic strength for efficient aggregation of egg yolk granules. It
could be argued that the low pH of around 4 could affect the Ab in a negative way, hence the
reason of low yield. This has also been tested by Akita & Nakai (1992) and they reported a 20
% lower yield at pH 4.3 compared to an optimum of around 5 to 5.2. Clearly, this is not enough
to explain the sevenfold loss of IgY yield.
14
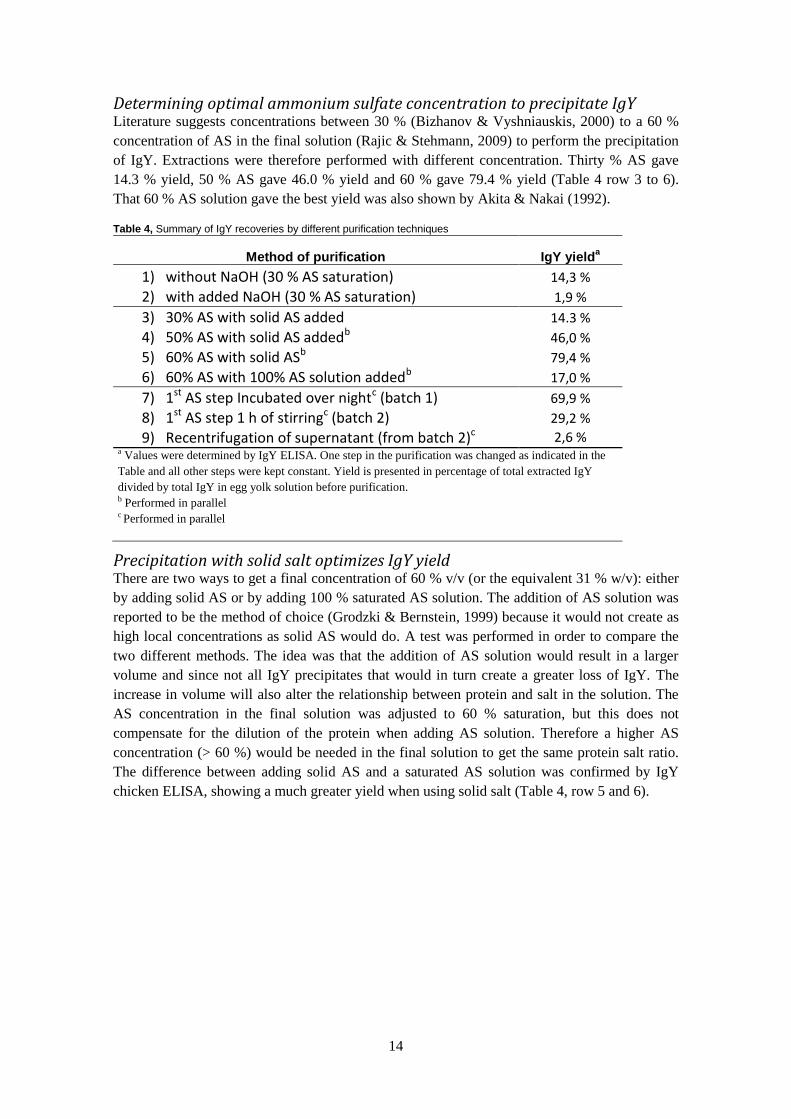
Determining optimal ammonium sulfate concentration to precipitate IgY Literature suggests concentrations between 30 % (Bizhanov & Vyshniauskis, 2000) to a 60 %
concentration of AS in the final solution (Rajic & Stehmann, 2009) to perform the precipitation
of IgY. Extractions were therefore performed with different concentration. Thirty % AS gave
14.3 % yield, 50 % AS gave 46.0 % yield and 60 % gave 79.4 % yield (Table 4 row 3 to 6).
That 60 % AS solution gave the best yield was also shown by Akita & Nakai (1992).
Method of purification IgY yielda
1) without NaOH (30 % AS saturation) 14,3 %
2) with added NaOH (30 % AS saturation) 1,9 %
3) 30% AS with solid AS added 14.3 %
4) 50% AS with solid AS addedb 46,0 %
5) 60% AS with solid ASb 79,4 %
6) 60% AS with 100% AS solution addedb 17,0 %
7) 1st AS step Incubated over nightc (batch 1) 69,9 %
8) 1st AS step 1 h of stirringc (batch 2) 29,2 %
9) Recentrifugation of supernatant (from batch 2)c 2,6 % a Values were determined by IgY ELISA. One step in the purification was changed as indicated in the
Table and all other steps were kept constant. Yield is presented in percentage of total extracted IgY
divided by total IgY in egg yolk solution before purification. b Performed in parallel c Performed in parallel
Precipitation with solid salt optimizes IgY yield There are two ways to get a final concentration of 60 % v/v (or the equivalent 31 % w/v): either
by adding solid AS or by adding 100 % saturated AS solution. The addition of AS solution was
reported to be the method of choice (Grodzki & Bernstein, 1999) because it would not create as
high local concentrations as solid AS would do. A test was performed in order to compare the
two different methods. The idea was that the addition of AS solution would result in a larger
volume and since not all IgY precipitates that would in turn create a greater loss of IgY. The
increase in volume will also alter the relationship between protein and salt in the solution. The
AS concentration in the final solution was adjusted to 60 % saturation, but this does not
compensate for the dilution of the protein when adding AS solution. Therefore a higher AS
concentration (> 60 %) would be needed in the final solution to get the same protein salt ratio.
The difference between adding solid AS and a saturated AS solution was confirmed by IgY
chicken ELISA, showing a much greater yield when using solid salt (Table 4, row 5 and 6).
Table 4, Summary of IgY recoveries by different purification techniques
15
Removal of lipids proves crucial The effect of letting the crude egg yolk solution stir over night, as suggested by Rajic &
Stehmann (2009), was compared with leaving the solution to settle in the water dilution step
(Figure 5). One batch was stirred over night at 4 °C after the pH adjustment and then
centrifuged. The pellet formed in the following AS precipitation step was too small to proceed
with, hence giving no result. The other batch was left to settle in centrifugation tubes for at least
6 h at 4 °C. The yellow fatty layer, that formed on top of the solution was then removed prior
centrifugation. In the latter batch an obvious pellet was formed. My idea is that the top layer
contained lipids and lipoproteins and that they granulate better when left to settle compared to
stirring. By removing them a better precipitation could be performed in later purification steps.
This is in agreement with findings from Burgess (2009).
Aggregation time proves crucial when precipitating with ammonium sulphate Leaving the crude egg yolk solution to aggregate over night lead to the idea that a similar
procedure could be performed in the first AS precipitation step. Some literature claims that
complete precipitation occurs after 3 to 8h (Grodzki & Bernstein, 1999), while others (Rajic &
Stehmann, 2009) claim that 1h of stirring at 4 °C is enough.
Three batches were prepared from the water diluted egg yolk solution by adjusting the pH to
5.05. The upper yellow layer was removed after settling for 1 h at 4 °C. Solid AS was then
added to a final concentration of 60 % saturation. Thereafter batch 1) was left to settle over
night in 50ml centrifugation tubes prior centrifugation, batch 2) was centrifuged after 1 h of
gentle mixing (Table 4 row 7 and 8) and batch 3) was gently stirred over night before
centrifugation (the pellet formed in batch 3 was too small to proceed with). A light yellow fatty
layer formed on top of the supernatant in batch 1, with a kind of veil underneath. The yellow top
layer was carefully removed before centrifugation. The thin veil is rich in IgY and should not be
removed. Batch 1 turned out with more than twice the yield with 69.9 % compared to batch 2
with 29.2 % (Table 4).
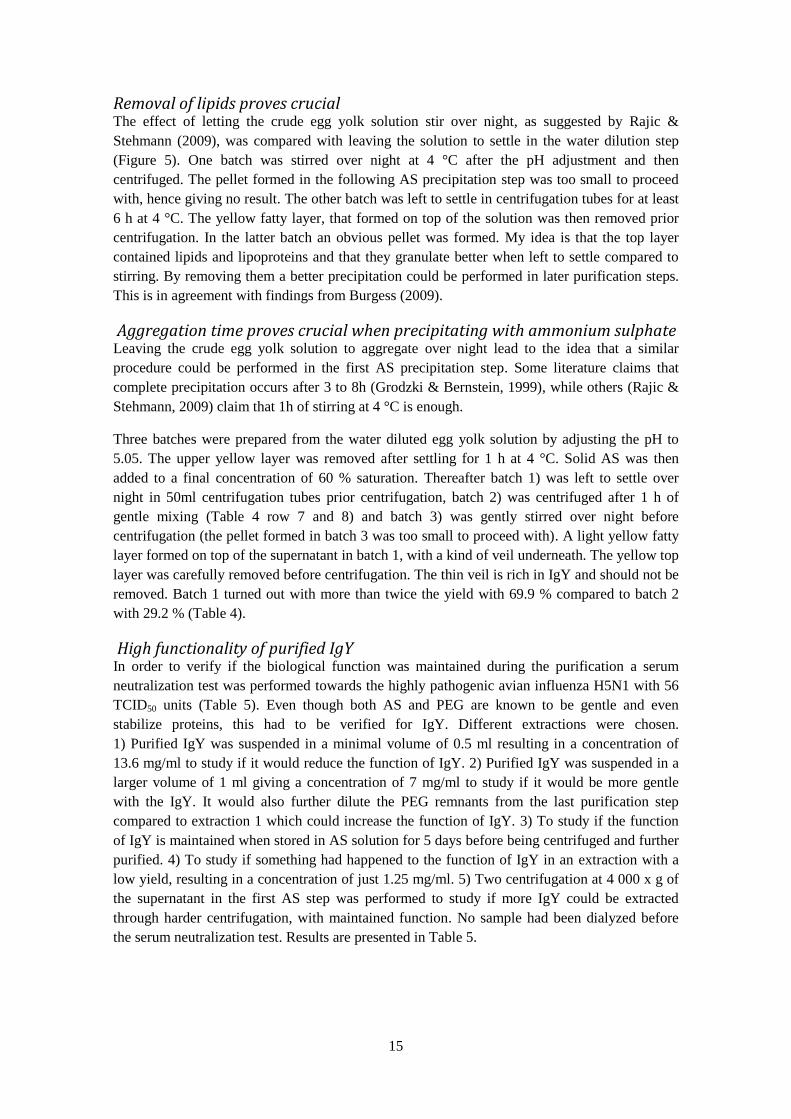
High functionality of purified IgY In order to verify if the biological function was maintained during the purification a serum
neutralization test was performed towards the highly pathogenic avian influenza H5N1 with 56
TCID50 units (Table 5). Even though both AS and PEG are known to be gentle and even
stabilize proteins, this had to be verified for IgY. Different extractions were chosen.
1) Purified IgY was suspended in a minimal volume of 0.5 ml resulting in a concentration of
13.6 mg/ml to study if it would reduce the function of IgY. 2) Purified IgY was suspended in a
larger volume of 1 ml giving a concentration of 7 mg/ml to study if it would be more gentle
with the IgY. It would also further dilute the PEG remnants from the last purification step
compared to extraction 1 which could increase the function of IgY. 3) To study if the function
of IgY is maintained when stored in AS solution for 5 days before being centrifuged and further
purified. 4) To study if something had happened to the function of IgY in an extraction with a
low yield, resulting in a concentration of just 1.25 mg/ml. 5) Two centrifugation at 4 000 x g of
the supernatant in the first AS step was performed to study if more IgY could be extracted
through harder centrifugation, with maintained function. No sample had been dialyzed before
the serum neutralization test. Results are presented in Table 5.
16
Sample 1 shows a lower (titer of 1:128) than sample 2 (a titer greater then 1:256). This could
indicate that resuspention of IgY in a minimal volume might have a negative effect on IgY.
Sample 3 shows that IgY is stable when stored in a 60 % AS solution for several days (titer
greater than 1:256). Sample 5 shows that it is possible to extract more IgY of the supernatant of
a low yield precipitation, by performing harder centrifugations than the 4 000 x g for 30 min
used here in order to precipitate the IgY further. Sample 4 showed a toxic effect on the cells for
titers up to 1:8 but this effect disappeared when the sample was further diluted. This indicates
that the biological function is maintained in high concentrations of AS and PEG since this
yielded titers greater than 1:256. The toxicity demonstrated the importance of dialysis of the
extractions. Sample 1 could potentially benefit from a dialysis too, which could remove PEG
and AS remnants that might interfere with the biological function.
Table 5, Serum Neutralization test from different purification tests and concentrations
Method of purification Concentration
[mg/ml] Titer
1) Suspended in a minimal volume of 0.5 ml 13,6 1:128
2) Suspended in a volume of 1 ml 7 > 1:256a
3) IgY stored in AS solution at 4°C 10,1 > 1:256a
4) Purification with extremely low yield 1,25 > 1:256b
5) Recentrifugation of supernatant 1st AS step 7,1 1:128
Negative control (IgY from hens immunized with H3N2) < 1:4
Positive control (Water extracted IgY against H5N1) >1:256 a The 2 fold dilution ended at 256. b This sample showed toxicity up to 1:8
Loss of IgY during purification It is unavoidable to lose some IgY during the purification process. The first part of this study
was performed on egg yolk diluted 1:10 in super Q water and filtered. That batch had an IgY
concentration of approximately 0.3 mg/ml, which is significantly lower than, the concentrations
of 1 – 2 mg/ml reported by others (Akita & Nakai, 1992) (Ko & Ahn, 2007) (Rajic & Stehmann,
2009) using a similar dilution step.
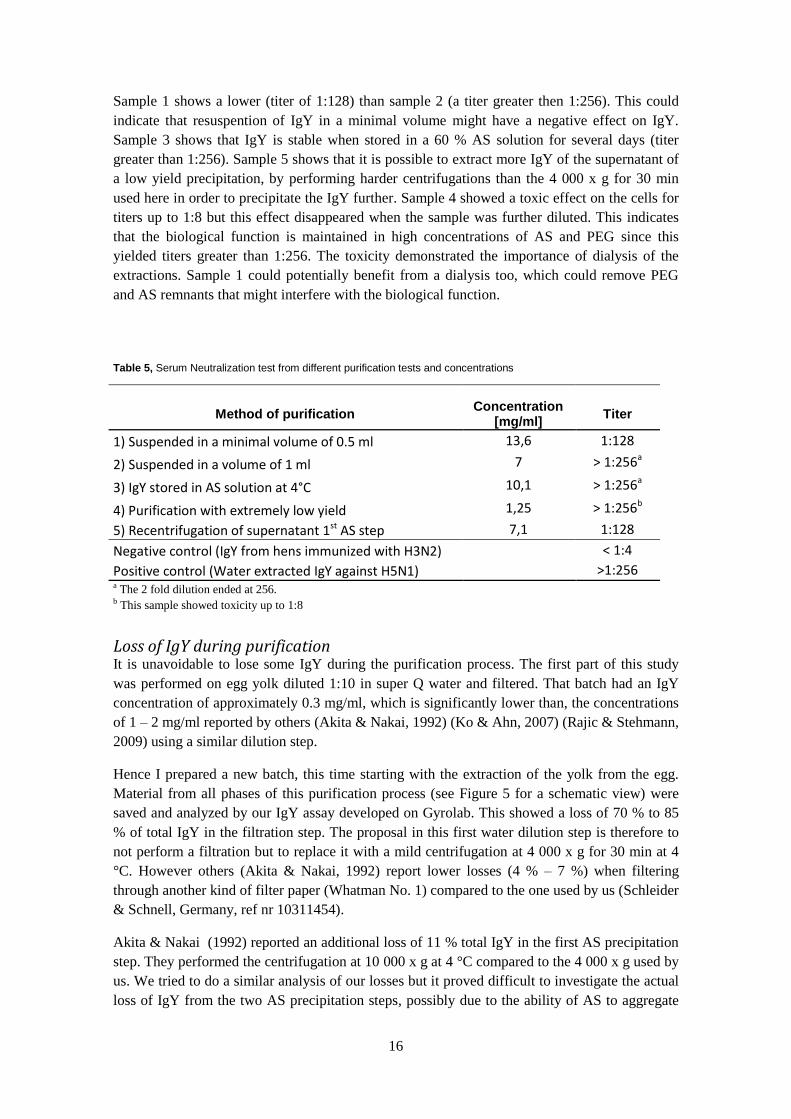
Hence I prepared a new batch, this time starting with the extraction of the yolk from the egg.
Material from all phases of this purification process (see Figure 5 for a schematic view) were
saved and analyzed by our IgY assay developed on Gyrolab. This showed a loss of 70 % to 85
% of total IgY in the filtration step. The proposal in this first water dilution step is therefore to
not perform a filtration but to replace it with a mild centrifugation at 4 000 x g for 30 min at 4
°C. However others (Akita & Nakai, 1992) report lower losses (4 % – 7 %) when filtering
through another kind of filter paper (Whatman No. 1) compared to the one used by us (Schleider
& Schnell, Germany, ref nr 10311454).
Akita & Nakai (1992) reported an additional loss of 11 % total IgY in the first AS precipitation
step. They performed the centrifugation at 10 000 x g at 4 °C compared to the 4 000 x g used by
us. We tried to do a similar analysis of our losses but it proved difficult to investigate the actual
loss of IgY from the two AS precipitation steps, possibly due to the ability of AS to aggregate
17
IgY which creates high local concentrations of IgY. This could occur both when incubating the
samples in the IgY chicken ELISA or when the sample plate was centrifuged to remove air
bubbles in the preparation of the Gyrolab assay. The IgY extraction procedure developed here
using 1) a water dilution methods to precipitate the lipids, 2) two AS precipitaion steps to
concentrate the IgY and removing contaminating proteins and 3) a PEG precipitation step to
further purify the IgY shows now a yield of 75 % ±5 %, from three independent IgY
purifications. The purity of the extracted IgY has not been analyzed in this project, but others
report purity greater then 95 % using a similar procedure (Rajic & Stehmann, 2009).
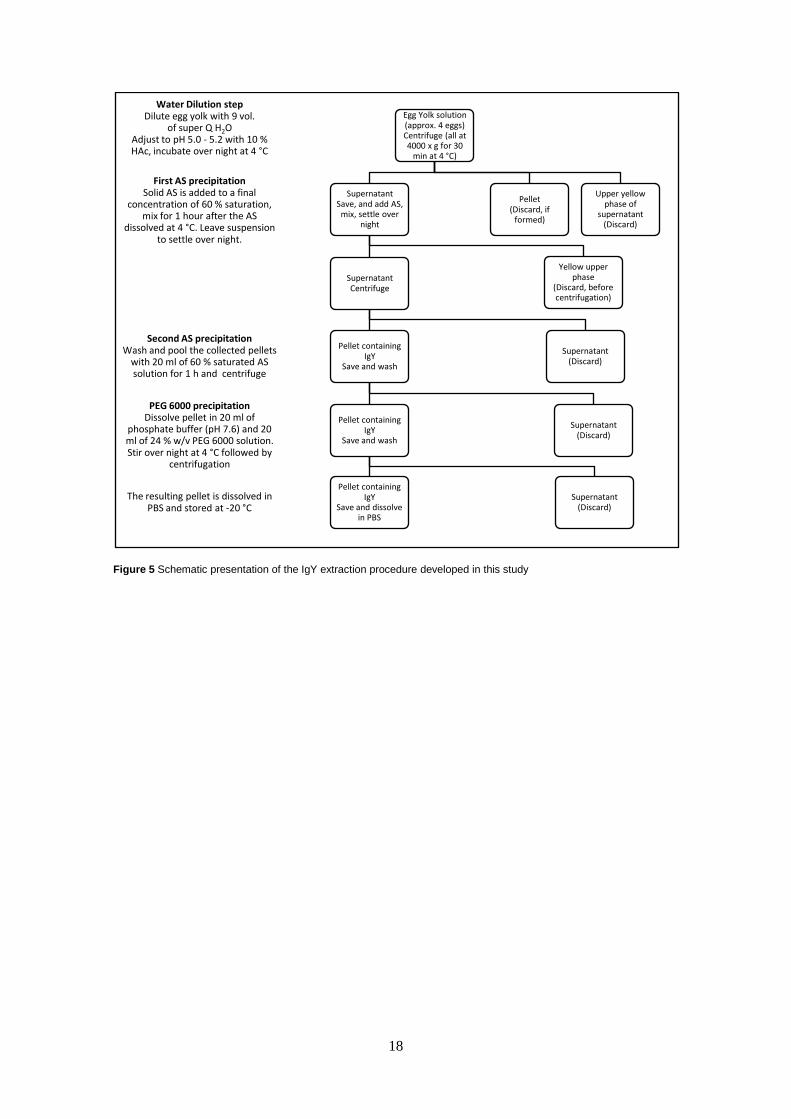
The method of choice for the purification of IgY from chicken egg yolk This is the method I developed and tested to purify IgY from chicken egg yolk. The yolk sacks
from four eggs were separated from the white and rinsed with distilled water to remove as much
egg white as possible. The egg yolk was poured into a small beaker, by holding the yolk sack
and carefully cutting a hole in it. The egg yolk was then suspended in approximately nine
volumes of super Q water and the pH was adjusted to pH 5.0 to pH 5.2, using 10 % acetic acid.
The suspension was then left to settle over night (at least 6 h) at 4 °C, the supernatant was then
added in to centrifugation tubes and left to settle for at least 1 h at 4 °C. The upper yellow layer
was removed prior to centrifugation for 30 min at 4 000 x g at 4 °C (Heraeus Multifuge, swing
bucket rotor) and the clear supernatant was saved.
Solid AS (Merck, Germany) was then added slowly during 15 minutes to reach a final
concentration of 60 % saturated solution (approximately 31 % w/v). The solution was stirred for
a minimum of 1 h at 4 °C after the AS has completely dissolved. The suspension was thereafter
left to settle in centrifugation tubes over night.
The yellow top layer was carefully removed without removal of the thin white veil prior
centrifugation for 30 min at 4 000 x g. The precipitate pellet was collected and washed with 20
ml of 60 % saturated AS solution (at 4 °C, dissolved in super Q water, adjusted to pH 7.4 with 1
M Tris) for a minimum of 1 h at 4 °C, then centrifuged for 30 min at 4 000 x g at 4 °C.
The resulting pellet was dissolved in 20 ml of 20 mM sodium phosphate buffer (pH 7.6) and 20
ml of 24% PEG 6 000 (Fluka, USA) solution (solid PEG 6 000 suspended in 20 mM sodium
phosphate buffer pH 7.6 to 24% w/v) was added. The suspension was stirred over night at 4 °C
followed by centrifugation for 30 min at 4 000 x g at 4 °C.
The IgY containing pellet was re-suspended in 10 ml of phosphate buffered saline (PBS)(pH
7.2). Total IgY content was initially monitored by Chicken IgY ELISA kit for quality control
and later with our immunoassay developed on Gyrolab.
The purified IgY was stored at -20 °C.
18
The resulting pellet is dissolved in PBS and stored at -20 °C
PEG 6000 precipitationDissolve pellet in 20 ml of
phosphate buffer (pH 7.6) and 20 ml of 24 % w/v PEG 6000 solution. Stir over night at 4 °C followed by
centrifugation
Second AS precipitationWash and pool the collected pellets
with 20 ml of 60 % saturated AS solution for 1 h and centrifuge
First AS precipitationSolid AS is added to a final
concentration of 60 % saturation, mix for 1 hour after the AS
dissolved at 4 °C. Leave suspension to settle over night.
Water Dilution stepDilute egg yolk with 9 vol.
of super Q H2OAdjust to pH 5.0 - 5.2 with 10 % HAc, incubate over night at 4 °C
Egg Yolk solution(approx. 4 eggs)Centrifuge (all at 4000 x g for 30
min at 4 °C)
Pellet(Discard, if
formed)
Upper yellow phase of
supernatant(Discard)
SupernatantSave, and add AS, mix, settle over
night
Yellow upper phase
(Discard, before centrifugation)
SupernatantCentrifuge
Pellet containing IgY
Save and wash
Pellet containing IgY
Save and wash
Pellet containing IgY
Save and dissolve in PBS
Supernatant (Discard)
Supernatant(Discard)
Supernatant(Discard)
Figure 5 Schematic presentation of the IgY extraction procedure developed in this study
19
Concluding remarks
Our extracted IgY has proven to give an immunotherapeutic effect in mice trials against the
H5N1 influenza. This could be a powerful alternative to conventional protection against
pandemic influenzas. Using IgY from chicken egg yolk proves to be both an economically and
an ethically appealing method to obtain large volumes of polyclonal antibodies.
Extracting IgY from egg yolk using a water dilution method followed by precipitation using AS
and polyethylene glycol gives a high yield of 75 % ± 5 % with purity greater than 95% (Rajic &
Stehmann, 2009).
The assay developed on Gyrolab to quantify IgY proves advantageous compared to using a
commercially available IgY chicken ELISA kit. The validation shows that the assay on Gyrolab
is accurate, sensitive and has a great dynamic range from 0.1 ng/ml to 5 000 ng/ml.
20
Future developments
IgY from egg laying hens immunized with the pandemic H1N1 influenza has now been
extracted and awaits functionality tests and mice trials. They will also be tested for cross
reaction against the H5N1 influenza.
An assay to detect virus particles on Gyrolab as well as a method to perform functionality tests
is under development. An in house ELISA assay is also being developed against whole virus
particles using our extracted polyclonal IgY.
21
Acknowledgments
I would like to thank my supervisor Kjell-olov Grönvik for the support of my work and careful
reading of my report.
Also a great thank to Lisa Lindqvist and Eva Blomkvist for all the help in the lab.
Finally I would like to thank Eva Emmoth for the help with the serum neutralization tests.
22
References
Akita, E. M., & Nakai, S. (1992). Immunoglobulins from Egg Yolk: Isolation and Purification.
Journal of food Science , 57, 629-634.
Akita, E., & Nakai, S. (1993). Comparison of four purification methods for production of
immunoglobulins from eggs laid by hens immunized with an enterotoxigenic E. coli strain.
Journal of Immunological Methods , 160, 207-214.
Bizhanov, G., & Vyshniauskis, G. (2000). A Comparison of Three Methods for Extracting IgY
from the Egg Yolk of Hens Immunized with Sendai Virus. Veterinary Research
Communications, 24 , pp. 103-113.
Burgess, R. R. (2009). Guide to Protein Purification (Methods in Enzymology). Academic
Press; 2 edition (1 Jan 2010).
Crescenzo-Chaigne, B., & van der Werf, S. (2007). Rescue of Influenza C Virus from
Recombinant DNA. journal of virology , 11282-11289.
De Meulenaer, B., & Huyghbaert, A. (2001). Isolation and Purification of Chicken Egg Yolk
Immunoglogulins: A review. Food and Agricultural Immunology , 275-288.
Gassmann, M. (1990). Efficient production of chicken egg yolk antibodies against a conserved
mammalian protein. Journal of the Federation of American Societies for Experimental Biology ,
2528-2532.
Grodzki, A. C., & Bernstein, E. (1999). Immunocytochemical Methods and Protocols (3rd
editon ed., Vol. 588). Human Press, Springer Science.
Hoffmann, E., Lipatov, A., Webby, R., & Govorkova, E. (2005). Role of specific hemagglutinin
amino acids in the immunogenicity and protection of H5N1 influenza virus vaccines. (Vol. 122).
USA: Proc. Natl. Acad. Sci.
Jakeman, K. J. (1994). Efficacy of 2'-Deoxy-2'-Fluororibosides against Influenza A and B.
Antimicrobial agents and chemotherapy , 1864-1867.
Jensenius, J. C., & Koch, C. (1993). On the purification of IgG from egg yolk. Journal of
Immunological Methods , 141-142.
Ko, K. Y., & Ahn, D. U. (2007). Preperation of Immunoglobulin Y from Egg Yolk Using
Ammonium Sulfate Precipitation and Ion Exchange Chromatography. Poultry Science , 86,
400-4007.
Larsson, A., Nilsson, E., & Olesen, H. (2008). Good effect of IgY against Pseudomonas
aeruginosa infections in cystic fibrosis patients. Pediatric Pulmonol , p. 892 899.
Osterhaus, A., & Rimmelzwaan, G. (2000). Influenza B virus in seals. Science , 1051-1053.
Peralta, R. C. (1994). Passive immunisation against experimental salmonellosis. Journal of
medical microbiology , 29-35.
23
Rajic, A., & Stehmann, C. (2009). Protein Depletion Using IgY from Chickens Immunised with
Human Protein Cocktails. Preperative Biochemistry & Biotechnology , 39, 221-247.
Sullivan, S. J., & Jacobson, R. M. (2010, January). 2009 H1N1 Influenza. Mayo Clinical
Proceedings , pp. 64-76.
Taubenberger, J. K., & Morens, D. M. (2006). 1918 Influenza: the Mother. Emerging Infectious
Diseases , 12 (1).
WHO. (2006, February). www.who.int. Retrieved oktober 02, 2009, from World Health
Organization: http://www.who.int/mediacentre/factsheets/avian_influenza/en/
WHO. (2009, December 21). www.who.int. Retrieved february 1, 2010, from World Health
organization:
http://www.who.int/csr/disease/avian_influenza/country/cases_table_2009_12_21/en/index.html
Yokoyama, H. (1992). Passive protective effect of chicken egg yolk immunoglobulins against
experimental enterotoxigenic Escherichia coli infection in neonatal piglets. Infection and
Immunology , 998-1007.


![IgY JoVE Protocol 3084[1]](https://img.dokumen.tips/doc/110x75/577d242a1a28ab4e1e9bc162/igy-jove-protocol-30841.jpg)