Embed Size (px)
Citation preview

824 Biochemistry 1987, 26, 824-832
Curtis, B. M., & Catterall, W. A. (1984) Biochemistry 23,
Edman, P., & Begg, G. (1967) Eur. J. Biochem. 1, 80-91. Ferry, D. R., Rombusch, M., Goll, A., & Glossman, H. (1984)
FEBS Left. 169, 112-1 18. Fraker, P. J. & Speck, J. C. ( 1 978) Biochem. Biophys. Res.
Commun. 80, 849-857. Glossmann, H., Ferry, D. R., & Boschek, C. B. (1983)
Naunyn-Schmiedeberg's Arch. Pharmacol. 323, 1-1 1. Gray, W. R., Luque, A. F., Olivera, B. M., Barrett, J., & Cruz,
L. J. (1981) J . Biol. Chem. 256, 4734-4740. Gray, W. R., Luque, F. A., Galyean, R., Atherton, E.,
Sheppard, R. C., Stone, B. L., Reyes, A., Alford, J., McIntosh, M., Olivera, B. M., Cruz, L. J . , & Rivier, J. (1984) Biochemistry 23, 2796-2802.
Hagiwara, S . , & Byerly, L. (1981) Annu. Rec. Neurosci. 4 ,
Hille, B. (1 984) Ionic Channels of Excitable Membranes, pp
Janis, R. A., & Triggle, D. J. (1983) J. Med. Chem. 26,
Kerr, L. M., & Yoshikami, D. (1984) Nature (London) 308,
Laemmli, U. K. (1970) Nature (London) 227, 680-685.
21 18-2122.
69-125.
76-98, Sinauer Associates, Inc., Sunderland, MA.
77 5-7 8 5.
282-284.
McCleskey, E. W., Fox, A. P., Feldman, D., Cruz, L. J., Olivera, B. M., Tsien, R. W., & Yoshikami, D. (1987) (unpublished results).
Miller, R. J. (1986) Recept. Biochem. Methodol. (in press). Nowycky, M. C., Fox, A. P., & Tsien, R. W. (1985) Nature
(London) 31 6 , 440-443. Olivera, B. M., McIntosh, J . M., Cruz, L. J., Luque, F. A.,
& Gray, W. R. (1984) Biochemistry 23, 5087-5090. Olivera, B. M., McIntosh, J. M., Zeikus, R., Gray, W. R.,
Vargo, J., Rivier, J . , de Santos, V., & Cruz, L. J. (1985) Science (Washington, D.C.) 230, 1338-1 343.
Peterson, G. L. (1977) Anal. Biochem. 83, 346-356. Pilch, P. F., & Czech, M. P. (1980) J. Biol. Chem. 255,
Sarmiento, J. G., Epstein, P. M., Smilowitz, H., Chester, D. W., Wehinger, E., & Janis, R. A. (1985) Fed. Proc., Fed. Am. Soc. Exp. Biol. 44, 1640.
Triggle, D. J. (1982) in Calcium Blockers: Mechanisms and Clinical Application (Flain, S. F., & Zelis, R., Eds.) pp 121-1 34, Urban & Schwarzenberg, Baltimore, MD.
Tsien, R. W. (1983) Annu. Rer. Physiol. 45, 341-358. Ventner, J. C., Fraser, J. C., Schaber, J . S., Juang, C. Y.,
Bolger, G., & Triggle, D. J. (1983) J . Biol. Chem. 258,
1 722-1 73 1.
9 344-9348.
Interaction of Cholera Toxin with Ganglioside G M l Receptors in Supported Lipid Monolayerst
Robert A. Reed, Jairajh Mattai, and G. Graham Shipley* Biophysics Institute, Housman Medical Research Center, Departments of Medicine and Biochemistry, Boston University School
of Medicine, Boston, Massachusetts 021 18 Received August 1 1 , 1986; Rerjised Manuscript Received October 16, 1986
ABSTRACT: Lipid monolayers formed a t the air-water interface containing the ganglioside G M l in egg yolk phosphatidylcholine have been transferred according to the Langmuir-Blodgett technique to (a) glass cover slips coated with octadecyl- or hexadecyltrichlorosilane and (b) carbon-coated electron microscope grids. Monolayer transfer has been demonstrated with fluorescence microscopy, by the transfer of a fluorescent phospholipid analogue, N-(7-nitro-2,1,3-benzoxadiazol-4-yl)phosphatidylethanolamine or Lucifer yellow labeled GM, (LY-GMl) , incorporated into the lipid monolayer. Incubation of supported monolayers with solutions of fluorescein-labeled cholera toxin (FITC cholera toxin) resulted in specific binding of the toxin to monolayers containing G M l r as revealed by fluorescence microscopy. Lateral diffusion coefficients were measured for both the receptor (LY-GM1) [(3.9 f 2.1) X cm2/s] and the receptor-ligand complex (GMl-FITC cholera toxin) [(8.9 f 3.2) X cm2/s] according to the technique of fluorescence recovery after photobleaching. In separate studies, GMl-containing monolayers transferred to electron microscope grids were incubated with solutions containing unlabeled cholera toxin, followed by negative staining with uranyl acetate. Electron microscopy revealed patches of stained cholera toxin molecules (diameter -. 70 A) in crystalline, two-dimensional hexagonal arrays. Optical diffraction and image reconstruction showed the arrangement of the cholera toxin molecules in a planar hexagonal cell, a = 81 A. These initial re- constructions give structural information to a resolution of - 30 %, and indicate a doughnut-shaped molecule with a central aqueous channel.
C h o l e r a toxin is produced by the Gram-negative bacterium Vibrio cholerae. The toxin molecule ( M , -84000) is con- sidered to be an assembly of five identical B subunits (protomer
M I - 1 1 600) and a single A subunit ( M I -27 000). Cell surface binding is associated with the B subunits, and the cell surface receptor is the ganglioside GMl. The biological effect is mediated by penetration of the A subunit [a disulfide-linked A 1 :A2 (Mr -22 000: - 5400) heterodimer] through the host membrane. Following reduction of the disulfide bond, the A1
'This work was supported by Research Grant HL-26335 and Training Grants HL-07291 and HL-07429 from the National Institutes of Health.
0006-2960/87/0426-0824$01.50/0 0 1987 American Chemical Society

G A N G L I O S I D E G M I - C H 0 L E R A T O X I N I N T E R A C T I O N S V O L . 2 6 , N O . 3 , 1 9 8 7 825
peptide catalyzes the NAD+-requiring' ADP-ribosylation and activation of adenylate cyclase. The increased levels of CAMP perturb ion transport processes, and in intestinal cells, for example, acute fluid loss and diarrhea can result. For reviews of cholera toxin chemistry, biological activity, and pathology, see Holmgren (1981), van Heyningen (1983) and Fishman (1982).
In a variety of studies, the cell surface receptor for cholera toxin has been shown conclusively to be the sialic acid con- taining glycosphingolipid ganglioside GMI (Hollenberg et al., 1974; van Heyningen et al., 1971; King & van Heyningen, 1973; Cuatrecasas, 1973). The gangliosides reside exclusively in the extracellular monolayer of cell membranes (Fishman & Brady, 1976), and the cholera toxin binding function has been shown to be associated with the oligosaccharide moiety of GMl (Fishman et al., 1978). At present, few details of the structure of cholera toxin or the cholera toxin-GMl complex are known.
Our own interests have focused on the properties and in- teractions of glycosphingolipids, including gangliosides, in model membrane systems (Ruocco et al., 1981; Curatolo et al., 1977). Two recent observations have led us to consider a new approadh to the study of cholera toxin-GMl assemblies. First, studies by McConnell and colleagues have demonstrated that lipid monolayers formed a t the air-water interface can be transferred to solid supports (glass, quartz, etc.) coated with an alkylating agent (von Tscharner & McConnell, 1981) and their properties (e.g., lateral diffusion) monitored (Smith et al., 1979). By incorporation of lipid haptens in the transferred monolayer, innovative studies of antigen-antibody complexes (Hafeman et al., 198 1) and cell-associated recognition pro- cesses (Watts et al., 1984) have been possible. Second, Uzgiris and Kornberg (1983) have used a similar rationale, in this case using carbon-coated electron microscope grids as the support, to form two-dimensional crystals of a lipid hapten-monoclonal antibody complex. The structure of the negatively stained complex was studied by electron microscopy and image re- construction methods, resulting in a 60-A resolution description of the hapten-bound antibody. Subsequent binding of the C l q component of complement allowed a low-resolution structural study of this three-component system, lipid hapten-monoclonal antibody-complement (Uzgiris & Kornberg, 1983).
The key to these studies was the incorporation of a receptor into a lipid monolayer. It occurred to us that since ganglioside GMI is stable in lipid monolayers (Maggio et al., 1978), the interaction of cholera toxin with GMl-containing lipid mono- layers transferred onto either glass supports or electron mi- croscope grids could be studied. Thus, in this paper we report ( 1) the successful transfer of G,,-containing phosphatidyl- choline monolayers to solid supports, (2) the specific binding of cholera toxin to supported monolayers containing GMI, (3) fluorescence photobleaching studies providing lateral diffusion coefficients of the cholera toxin-GMl complexes, and (4) the formation of two-dimensional crystals of the cholera toxin-G,, complex as visualized by electron microscopy/image recon- struction methods.
MATERIALS AND METHODS Isolation of Ganglioside GMl. Bovine brain gangliosides
were extracted according to the procedure of Svennerholm and ~~~ ~ ~~~ ~~~
' Abbreviations: NBD-PE, N-(7-nitro-2,1,3-benzoxadiazol-4-yl)- phosphatidylethanolamine; LY, Lucifer yellow; FITC, fluorescein iso- thiocyanate; FRAP. fluorescence recovery after photobleaching; NAD', oxidized nicotinamide adenine dinucleotide; TLC, thin-layer chroma- tography; Tris, tris(hydroxymethy1)aminomethane; EDTA, ethylenedi- aminetetraacetic acid; EYPC, egg yolk phosphatidylcholine.
Fredman (1980) while the separation of the gangliosides into mono-, di-, and trisialogangliosides (GMl, GDI,, and GTlb) was accomplished by following the procedure of Myers et al. (1984). Briefly, freshly obtained bovine brain (1 50 g) was homogenized in a high-speed blender for 2 min at 4 O C with 450 mL of water. The aqueous mixture was poured into 1620 mL of methanol with constant stirring a t room temperature, and 810 mL of chloroform was then added. Stirring was continued for 0.5 h, and the mixture was centrifuged at 17000g for 10 min. The supernatant was filtered through Celite 545, and the brown residue was reextracted by homogenizing with 300 mL of water and pouring the aqueous mixture into 1200 mL of chloroform/methanol (1:2 v/v), followed by centrifu- gation and filtration. The extracts were combined in a 6-L conical flask, and 780 m L of water was added to produce a final ch1oroform:methanol:water ratio of 1.0:2.0: 1.4 (v/v). The mixture was inverted several times without shaking and left overnight. The upper phase was siphoned off and set aside while 450 mL of methanol was added to the lower phase with vigorous shaking. Then 300 mL of 0.01 M KC1 was slowly added, and the solvents were carefully mixed. After overnight separation of the two phases, the upper phase was again si- phoned off, combined with the previous upper phase, and evaporated to dryness a t 30 OC in the presence of the anti- foaming agent isobutyl alcohol. The residue was dissolved in 150 mL of chloroform/methanol/water (60:30:4.5 v/v), al- lowed to stand a t room temperature overnight, and then centrifuged. The supernatant was decanted and evaporated to dryness a t 30 O C . The residue was dissolved in 60 mL of water and dialyzed against water for 48 h, followed by at least two changes of distilled water over the next 48 h. The mixture of pure gangliosides was then lyophilized for -48 h to give - 1200 mg of an off-white, fluffy residue.
The separation of the mixed gangliosides was achieved by column chromatography on a solvent gradient of chloro- form/methanol/water. Briefly, 220 g of Iatrobeads (8060, Iatron Laboratories, Tokyo, Japan) was packed into a 420 mm X 60 mm column by using a solvent system of chloroform/ methanol/water (65:24:4 v/v). Approximately 2400 mg of mixed ganglioside was dissolved in the minimum amount of the above solvent mixture and placed on the column. The elution was done on a stepwise gradient of chloroform/ methanol/water (65:25:4, 60:30:5, and 60:35:8 v/v), with continuous monitoring of 10-mL fractions of eluant by thin- layer chromatography (TLC) on silica gel using ganglioside standards from Supelco (Bellefonte, PA). Monosialo- ganglioside (GM,) and disialoganglioside (GDla) were obtained with the solvent system chloroform/ methanol / wa ter (60: 3 0: 5 V/V) while trisialoganglioside GTlb was obtained with the solvent system chloroform/methanol/water (60:35:8 v/v). The yield of the pure ganglioside from 2400 mg of mixed gang- lioside was - 100 mg of GM,, -250 mg of GDI,, and - 100
Fluorescent Labeling of Ganglioside GMl and Cholera Toxin. The labeling of GMi with Lucifer yellow CH (Mo- lecular Probes, Eugene, OR) has been previously described (Spiegel, 1985). Briefly, a 100 mM acetate buffer (pH 5.5) containing 150 m M NaCl and 2.0 m M NaIO, was reacted with GM, ( I mg/mL) at 0 O C for 30 min. The oxidation was stopped by adding 0.5 mL of 50% glycerol, and the solution was dialyzed extensively against distilled water and lyophilized. After the oxidation, 70% of the starting ganglioside was re- covered and dissolved in 5.0 mL of phosphate-buffered saline. Lucifer yellow CH was added until 5 mM, and the solution was incubated a t 0 O C for 20 h. To this solution was added
mg Of GTlb.
826 B I O C H E M I S T R Y R E E D E T A L .
NaCNBH, until 10 mM, and the reduction was allowed to proceed for 15 min a t 25 OC, followed by extensive dialysis and lyophilization. The entire labeling process was monitored by TLC on silica gel G uniplates (Analtech, Newark, DE) using a chloroform/methanol/2.5 N ammonium hydroxide (60:40:9 v/v) solvent system and visualized by H2S04 charring. The Lucifer yellow CH labeled ganglioside (LY-GMl) could also be detected under UV light prior to charring.
Cholera toxin was purchased from Calbiochem/Behring Diagnostics (La Jolla, CA); it was shown to be pure by gel filtration on Sephadex G- 150 and by SDS-polyacrylamide gel electrophoresis and was used without further purification. The toxin was supplied as a lyophilized powder and was dissolved in buffer (50 m M Tris-HCI, 200 m M NaCI, 3 m M NaN3, and 1 m M EDTA, p H 7.5) to give 1 mg of protein/mL of solution. A stock solution of 1.0 mg/mL fluorescein isothio- cyanate (FITC) in 0.1 M N a H C 0 , (pH 8.2) was prepared. To a 1.0-mL solution of cholera toxin was added 0.1 mL of 0.1 M NaHCO, buffer and, with constant stirring, 0.1 mL of FITC solution. The mixture was allowed to react a t room temperature for 1 h. The unbound FITC was then separated from the FITC cholera toxin conjugate by passing the mixture over a Sephadex G-150 column. Protein was monitored at 280 nm and fluorescein a t 470 nm. The conjugate elutes in a 50 m M Tris-HCI buffer system as a single peak in the initial column fractions. These fractions were pooled and dialyzed against cold distilled water and lyophilized. Although in separate experiments we have demonstrated FITC labeling of cholera toxin B subunits (data not shown), we cannot say a t this stage whether labeling occurs exclusively on the B subunits.
Preparation of Solid Supports. Two types of hydrophobic solid supports have been used. For fluorescence experiments, alkylated glass cover slips were prepared (Thompson et al., 1984). The cover slips were first boiled for 30 min in Linbro 7X detergent (Flow Labs, Inglewood, CA)/water ( 1 5 v/v), rinsed extensively with deionized water, dried a t 130 “C for 1 h, and placed into a plasma cleaner (Harrick, PDC-3XG) containing a residual of argon gas. After plasma cleaning for 5 min the cover slips were individually alkylated by imme- diately immersing them in an 80% hexadecane, 12% carbon tetrachloride, 8% chloroform, and 0.1% octadecyltrichlorosilane or hexadecyltrichlorosilane solution for 15-30 s. Upon slow removal they should rapidly shed the solution. After being coated, the cover slips were washed with chloroform, allowed to dry in air, and stored until use. For electron microscopy experiments, carbon-coated silver grids were used. Silver grids were used to avoid corrosion problems associated with pro- longed incubations in the salt solutions. The grids were pre- pared by covering one surface with a 0.5% Formvar film and then coating that surface with a thin layer of carbon by use of an evaporator (Varian, Mountain View, CA). The carbon surface remains hydrophobic enough for monolayer transfer for only 12-24 h, so the grids must be used immediately.
Monolayer Preparation and Transfer. Figure 1 illustrates each step in the process of transferring lipid monolayers from the air-water interface to a solid support. Monolayers were prepared a t the air-water interface by applying a lipid-con- taining solution dropwise inside a confining boundary. The boundary was provided by tying a piece of surgical thread into a circle (- 12.5-cm diameter) and coating it with bees wax (benzene/wax solution) so that it floats. The lipid solution contained egg yolk phosphatidylcholine (EYPC) (Lipid Products, Nutfield, England) as a matrix lipid and the ganglioside G M l as a receptor, and in some experiments the
A L K Y L A T E D GLASS C o V E R S L I P ELECTRON MICROSCOPY
OR OR ELECTRON FLUORESCENCE MICROSCOPY
EYPC )GMi NED-PE
SUBPHASE MOUNTING
SPACER FLUORESCENCE MICROSCOPY
GLASS SLIDE-^-^--------^-, FIGURE 1: Schematic diagram outlining the technique of monolayer transfer from the air-water interface to a hydrophobic solid support (glass cover slip or electron microscope grid). The solid support is either (1 ) removed from the subphase and viewed directly by fluorescence microscopy, (2) mounted while still in the subphase to a glass slide with a double-faced adhesive, or (3) removed from the subphase and transferred to a solution of either fluorescent-labeled or unlabeled cholera toxin.
fluorescent probe N-(7-nitro-2,1,3-benzoxadiazol-4-yI)phos- phatidylethanolamine (Avanti Polar Lipids, Birmingham, AL) was also incorporated. The lipids were applied to the surface in a chloroform/methanol(2:1 v/v) solvent, which was allowed to evaporate for 30-60 min. After evaporation, the lipids were compressed into a monolayer by applying a “piston” oil (EYPC) to the region outside of the thread. The piston oil has a spreading pressure (-40 dyn/cm) and forces the lipid molecules within the thread to compress into a constant pressure monolayer [see Gaines (1966) and Green et al. (1 973)]. Either a carbon-coated electron microscope grid or an alkylated glass cover slip was attached to a holder by a piece of double-sided tape, the holder being attached to a motorized Langmuir-Blodgett mechanical dipping system. Several different dipping systems have been used, and the important factor for monolayer transfer seems to be maintaining a constant dipping rate of 1 mm/min or less. After the solid support was passed through the monolayer, the monolayer lipids were transferred with their alkyl chains interacting with the hydrophobic support and their polar head groups facing outward.
The transferred monolayer was kept in the subphase after dipping and the surface swept clean of the remaining mono- layer and the piston oil by using a vacuum and a stream of nitrogen gas. At this point the transferred monolayers may be (1) removed from the subphase into the air and visualized in a dry state by fluorescence microscopy or (2) transferred, while still in the subphase, to a glass slide. The cover slip is attached to the glass slide by placing it on top of two strips of double-faced adhesive tape such that the polar groups of the monolayer are facing down toward the glass slide (see Figure 1) . The adhesive tape provides sufficient elevation such that the monolayer head groups are not in contact with the
G A N G L I O S I D E G M I - C H O L E R A T O X I N I N T E R A C T I O N S V O L . 2 6 , N O . 3 , I987 827
A B FIGURE 2: Fluorescence photomicrograph of a transferred monolayer containing 5.0 mol % GMl in EYPC plus 3.0 mol % NBD-PE (A) and a control where the fluorescent probe NBD-PE was omitted (B).
glass slide, and upon removal of the slide from the subphase, the surface tension retains the water between the cover slip and the glass slide, assuring constant hydration of the mon- olayer. Fluorescent-labeled cholera toxin solutions may be injected into this space and then washed after the desired incubation time. In some experiments it was necessary to retransfer the cover slip to a clean glass slide after incubation with the fluorescent-labeled cholera toxin due to nonspecific binding of the toxin to the glass slide. An alternative method (3), involves removing the deposited monolayers from the subphase and incubating with a solution of either fluores- cent-labeled or unlabeled cholera toxin. All three methods were used successfully.
Fluorescence Microscopy. Fluorescence microscopy was performed on a Zeiss (Oberkochen, FRG) photomicroscope equipped with a fluorescence illumination and detector system. The illumination was provided by a 100-W mercury lamp, and the detection of fluorescence was through an exciter-barrier filter and reflector combination objective for FITC fluorescence (Zeiss, Oberkochen, FRG). The fluorescence was photo- graphed with a Nikon camera (FX-35A) and semiquantitated with a transmitted light photomicrographic attachment (Ni- kon, Microflex UFX).
Fluorescence Recovery after Photobleaching (FRAP). The experimental system and method of data analysis have been described in detail elsewhere (Smith & McConnell, 1978; Hafeman et al., 1984). An argon ion laser (Spectra Physics, Model 164-05, Mountain View, CA) provided bleaching through a Ronchi ruling system and low-intensity observational radiation. The fluorescence was observed through a Zeiss (Oberkochen, FRG) Photomicroscope 111 and measured with a photomultiplier tube (RCA 34103A). The entire system was interfaced to an Archives microcomputer that stored and analyzed the data. The data were analyzed by a least-squares fit to a single exponential, and the efficiency of fluorescence bleaching and the percent fluorescence recovery in the bleached areas were determined. The time constant for recovery of fluorescence was recorded. When necessary, statistical methods involving multiexponential fits of the data were em- ployed. The experiments were performed by using 5 W W - m s bleach times, 100-450-ms chop periods, a 40X dry objective, and 50 and 133 line/in. Ronchi rulings. The temperature of the microscope stage was held constant (+0.1 "C) with a heating/wling bath. All samples were maintained in a fully
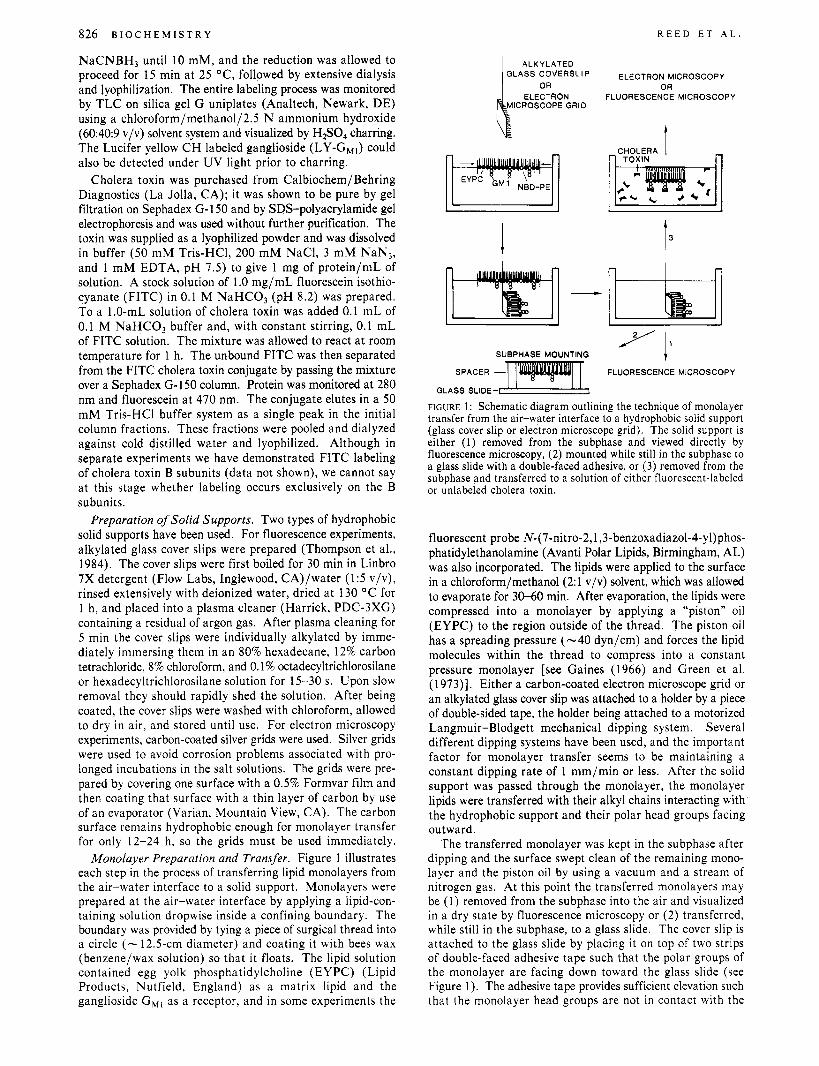
A B FIGURE 3: Fluorescence photomicrograph of a transferred monolayer containing 5.0 mol % G,, in EYPC incubated with a 0.1 mg/mL FITC-labeled cholera toxin (A) and a control monolayer containing EYPC only, incubated with a 0.1 mg/mL FITC-labeled cholera toxin (B). Both monolayen were incubated with the FlTC-labeled cholera toxin for 1 h, followed by washing with distilled water.
D = 3.SE-08cma/ilec
W
W 10 20 30 40 50 60 70 80 0 z
r'0 20 30 i o <O <O
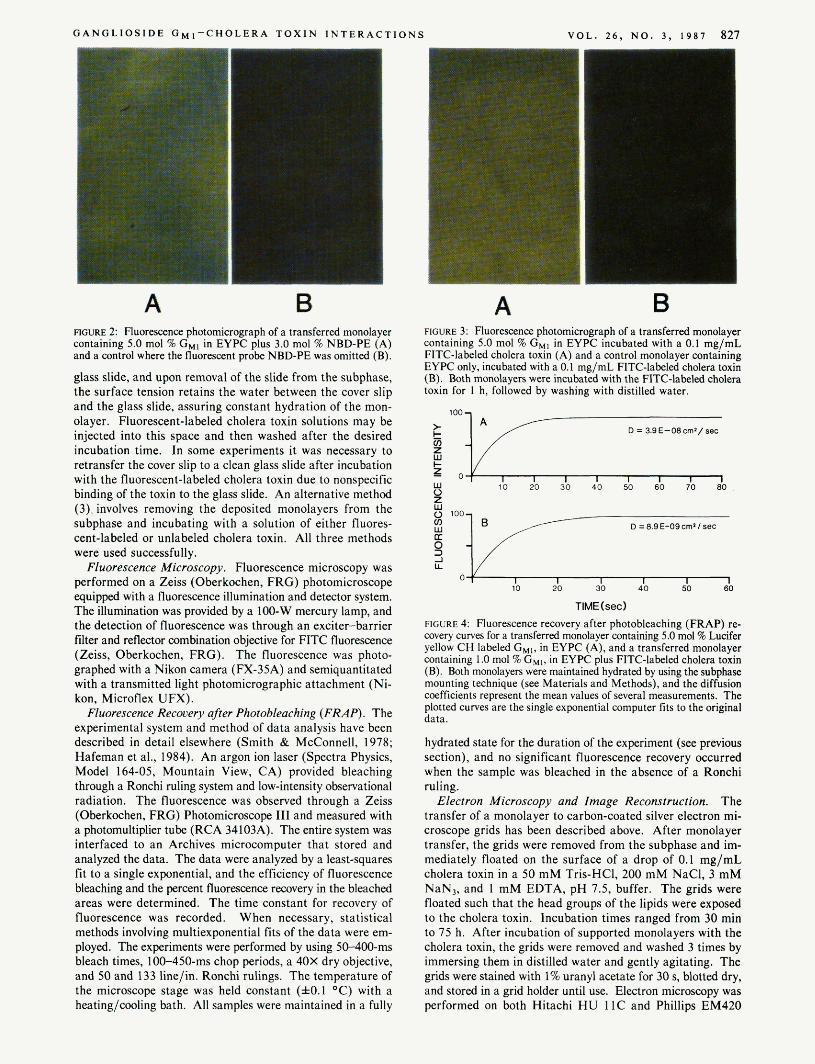
TIME(sec1 FIGURE 4 Fluorescence recovery after photobleaching (FRAP) re- covery curves for a transferred monolayer containing 5.0 mol % Lucifer yellow CH labeled GMl. in EYPC (A), and a transferred monolayer containing 1.0 mol % G,,, in EYPC plus FITC-labeled cholera toxin (B). Both monolayers were maintained hydrated by using the subphase mounting technique (see Materials and Methods), and the diffusion coefficients represent the mean values of several measurements. The plotted CUNW are the single expanential computer fits to the original data.
hydrated state for the duration of the experiment (see previous section), and no significant fluorescence recovery occurred when the sample was bleached in the absence of a Ronchi ruling.
The transfer of a monolayer to carbon-coated silver electron mi- croscope grids has been described above. After monolayer transfer, the grids were removed from the subphase and im- mediately floated on the surface of a drop of 0.1 mg/mL cholera toxin in a 50 mM Tris-HCI, 200 mM NaCI, 3 mM NaN3, and 1 mM EDTA, pH 7.5, buffer. The grids were floated such that the head groups of the lipids were exposed to the cholera toxin. Incubation times ranged from 30 min to 75 h. After incubation of supported monolayers with the cholera toxin, the grids were removed and washed 3 times by immersing them in distilled water and gently agitating. The grids were stained with 1% uranyl acetate for 30 s, blotted dry, and stored in a grid holder until use. Electron microscopy was nerformed on both Hitachi H U I1C and Phillips EM420
Electron Microscopy and Image Reconstruciion.
828 B I O C H E M I S T R Y R E E D E T A L .

G A N G L I O S I D E G H I - C H O L E R A T O X I N I N T E R A C T I O N S V O L . 2 6 , N O . 3 , 1 9 8 7 829
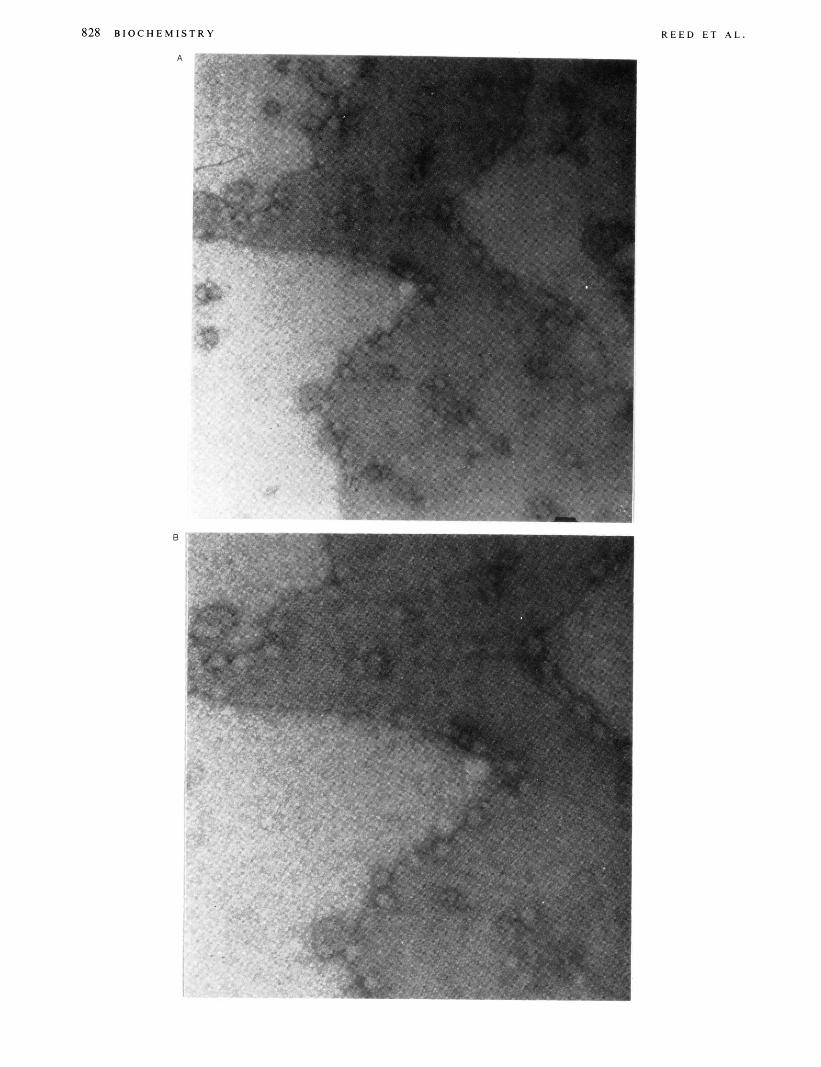
FIGURE 5: Electron micrographs of negatively stained cholera taxinG,, ordered domains at different magnifications: (A) 84240X. (B) 12857Ox. and (C) 181805X.
microscopes under minimal dose procedures. Optical dif- fraction was carried out with a surveying optical diffractometer (Salmon & De Rosier, 1981) on regions of the electron mi- crograph negatives corresponding to the most crystalline do- mains. For image reconstruction, the most ordered regions were digitized with an Optronics PI000 Photoscan micro- densitometer and displayed on a Grinnel graphics screen (512 X 512 pixels). The displayed images were Fourier-transformed and analyzed with a VAX 11/780 minicomputer using standard Fourier imaging programs.
RESULTS Transfer of Monolayers lo Solid Supports. The ability to
transfer a monolayer containing the receptor for cholera toxin (the ganglioside CHI) to solid supports is critical in the evo- lution of our experiments. Since G,, contains a negatively charged sialic acid in its head group, it could act as a detergent at high enough concentrations. Figure 2A is a fluorescence micrograph of an EYPC monolayer containing 5 mol 9% G,, and 3 mol %of the fluorescent probe NBD-PE transferred to an alkylated glass slide. Figure 2B is a fluorescence micro- graph of an identical monolayer but with the fluorescent NBD-PE probe omitted. The green fluorescence in Figure 2A is characteristic of NBD-PE, and its presence is indicative of a successful transfer of the monolayer. In addition, successful transfer of monolayers has been demonstrated with LY-G,, (data not shown). Experiments monitoring the loss of surface lipid from the air-water interface maintained a t constant pressure confirm that the Langmuir-Blodgett procedure quantitatively transfers a single monolayer to the solid support [see, for example, Weis et al. (1982)]. These transfer ex-
periments have been repeated with carbon-coated silver electron microscope (EM) grids acting as the solid support. Again, transfer of fluorescent NBD-PE to the grid is observed (data not shown).
Interacrion of Cholera Toxin with G,,-Containing Sup- ported Monolayers. Although Figure 2 demonstrates that it is possible to transfer monolayers in the presence of G,,. it does not determine whether the GMI has indeed been incor- porated into the monolayer or if i t is in the proper orientation to bind cholera toxin. To establish the presence and binding activity of G,, in our system, an assay utilizing a fluorescein isothiocyanate (FITC) conjugated cholera toxin was developed (see Materials and Methods). The conjugate elutes from the Sephadex (3-150 column at a position corresponding to an 85000-Da species, the molecular weight of AB, cholera toxin (data not shown). The absorption of the later fractions cor- responds to unbound FITC ( A = 470 nm). Fractions corre- sponding to FITC-labeled cholera toxin were pooled and used without further purification.
The binding assay used to detect the presence of the cholera toxin receptor in supported monolayers involved incubating the transferred monolayers with solutions of FITC cholera toxin (see Figure I , method 3) for various times. washing, and assaying for binding with fluorescence microscopy. The lipid monolayers contained between 1.0 and 5.0 mol % GMl in EYPC, transferred to alkylated glass cover slips. The fluorescence micrograph in Figure 3A is of a monolayer containing 5.0 mol % G,, in EYPC incubated with a 0.1 mg/mL solution of FITC cholera toxin for 1 h. An identical monolayer not containing the ganglioside GMl does not bind FITC cholera toxin (Figure 3B). The specific fluorescence
830 B I O C H E M I S T R Y R E E D E T A L .
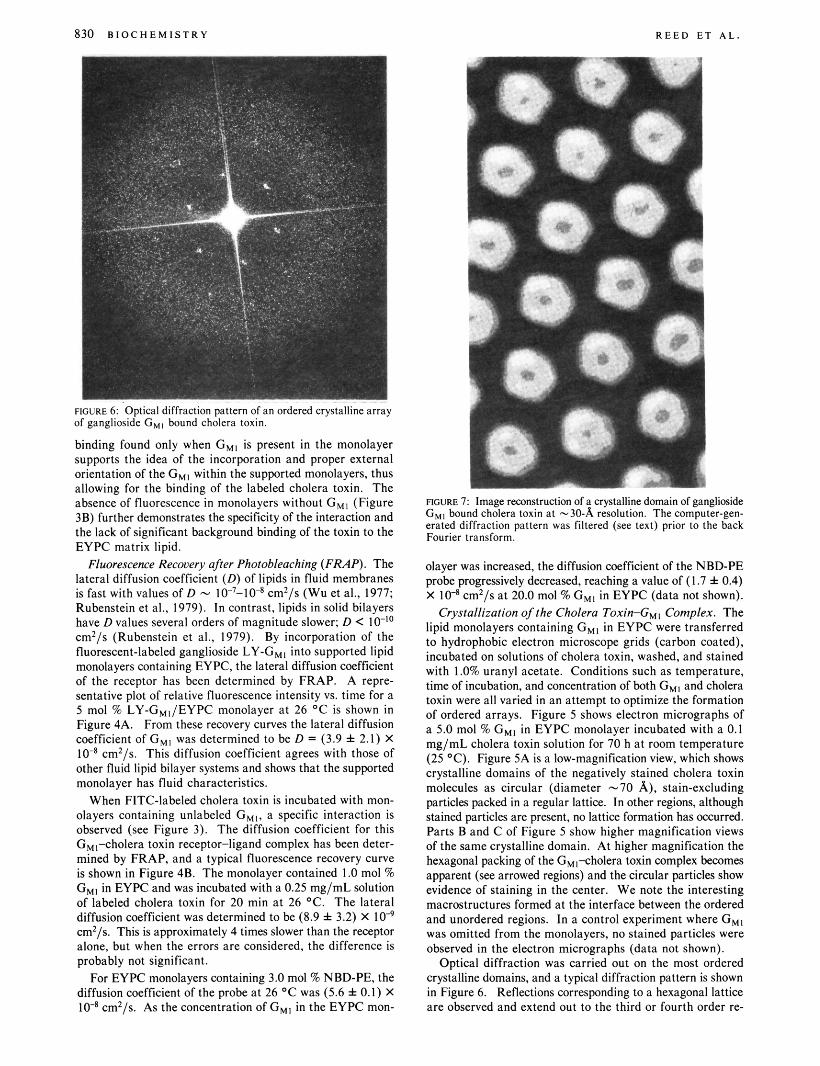
FIGURE 6: Optical diffraction pattern of an ordered crystalline array of ganglioside C,, bound cholera toxin.
binding found only when G,, is present in the monolayer supports the idea of the incorporation and proper external orientation of the G,, within the supported monolayers, thus allowing for the binding of the labeled cholera toxin. The absence of fluorescence in monolayers without G M l (Figure 3B) further demonstrates the specificity of the interaction and the lack of significant background binding of the toxin to the EYPC matrix lipid.
Fluorescence Recovery after Photobleaching (FRAP). The lateral diffusion coefficient (D) of lipids in fluid membranes is fast with values of D - 10-'-10-8 cm2/s (Wu et al., 1977: Rubenstein et al., 1979). In contrast, lipids in solid bilayers have D values several orders of magnitude slower: D < IO-'" cm2/s (Rubenstein et al., 1979). By incorporation of the fluorescent-labeled ganglioside LY-GMI into supported lipid monolayers containing EYPC, the lateral diffusion coefficient of the receptor has been determined by FRAP. A repre- sentative plot of relative fluorescence intensity vs. time for a 5 mol Yo LY-GMI/EYPC monolayer a t 26 "C is shown in Figure 4A. From these recovery curves the lateral diffusion coefficient of G,, was determined to be D = (3.9 f 2.1) X
cm2/s. This diffusion coefficient agrees with those of other fluid lipid bilayer systems and shows that the supported monolayer has fluid characteristics.
When FITC-labeled cholera toxin is incubated with mon- olayers containing unlabeled G,,. a specific interaction is observed (see Figure 3). The diffusion coefficient for this G,,-cholera toxin receptor-ligand complex has been deter- mined by FRAP, and a typical fluorescence recovery curve is shown in Figure 4B. The monolayer contained 1.0 mol % GMI in EYPC and was incubated with a 0.25 mg/mL solution of labeled cholera toxin for 20 min at 26 "C. The lateral diffusion coefficient was determined to be (8.9 + 3.2) X IO4 cm2/s. This is approximately 4 times slower than the receptor alone, but when the errors are considered, the difference is probably not significant.
For EYPC monolayers containing 3.0 mol Yo NBD-PE, the diffusion coefficient of the probe at 26 OC was (5.6 i 0.1) X
cm2/s. As the concentration of G,, in the EYPC mon-
I
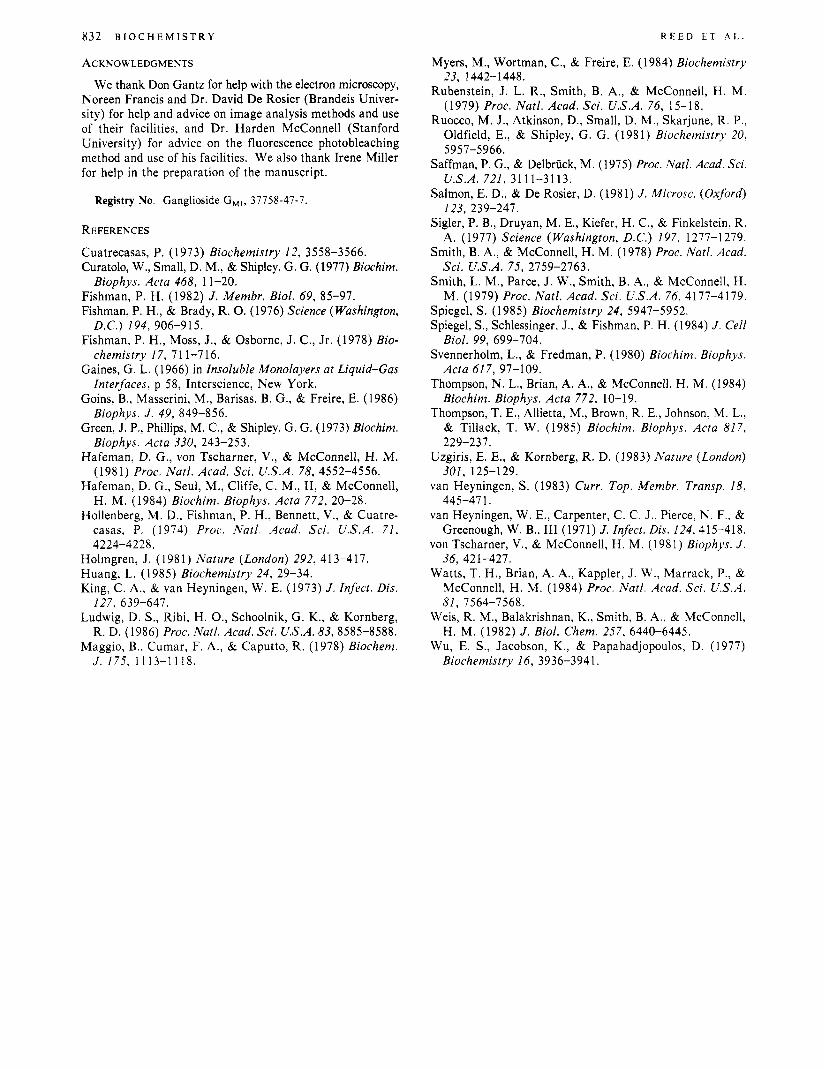
I FIGURE 7: Image reconstruction of a crystalline domain of ganglioside G,, bound cholera toxin at -30-8, resolution. The computer-gen- erated diffraction pattern was filtered (see text) prior to the back Fourier transform.
olayer was increased, the diffusion coefficient of the NBD-PE probe progressively decreased, reaching a value of (1.7 f 0.4) X IO4 cm2/s at 20.0 mol % GMI in EYPC (data not shown).
Crystallization of the Cholera Toxin-G,, Complex. The lipid monolayers containing G,, in EYPC were transferred to hydrophobic electron microscope grids (carbon coated), incubated on solutions of cholera toxin, washed, and stained with 1.0% uranyl acetate. Conditions such as temperature, time of incubation, and concentration of both GMl and cholera toxin were all varied in an attempt to optimize the formation of ordered arrays. Figure 5 shows electron micrographs of a 5.0 mol Yo GMl in EYPC monolayer incubated with a 0.1 mg/mL cholera toxin solution for 70 h at room temperature (25 "C). Figure 5A is a low-magnification view, which shows crystalline domains of the negatively stained cholera toxin molecules as circular (diameter -70 A), stain-excluding particles packed in a regular lattice. In other regions, although stained particles are present, no lattice formation has occurred. Parts B and C of Figure 5 show higher magnification views of the same crystalline domain. At higher magnification the hexagonal packing of the GM,%holera toxin complex becomes apparent (see arrowed regions) and the circular particles show evidence of staining in the center. We note the interesting macrostructures formed at the interface between the ordered and unordered regions. In a control experiment where G,, was omitted from the monolayers, no stained particles were observed in the electron micrographs (data not shown).
Optical diffraction was carried out on the most ordered crystalline domains, and a typical diffraction pattern is shown in Figure 6. Reflections corresponding to a hexagonal lattice are Observed and extend out to the third or fourth order re-

G A N G L 10s I D E G M I - C H O L E R A TOXIN I N T E R A C T I O N S V O L . 2 6 , N O . 3 , 1 9 8 7 831
flections. This lattice corresponds to a hexagonal unit cell in real space, a = 81 A. The image on the electron micrograph was digitized and displayed on a graphics device. By boxing off different regions of the digitized image, the optimal crystalline domains could be identified and the Fourier transform calculated. These transforms (corresponding to the optical diffraction patterns described above) were high and low frequency filtered to remove noise, and a hexagonal mask corresponding to the unit cell parameters was applied to the transform before the second (back) transform was calculated. An image-reconstructed view, a t - 30-A resolution, of the cholera toxin-GM1 complex is shown in Figure 7. At this resolution the cholera toxin molecule can be seen to pack into a hexagonal lattice with each individual cholera toxin molecule (diameter -70 A) surrounded by six neighbors. The cholera toxin molecule appears to be doughnut shaped with a hole in the center (diameter -20 A), and there is a suggestion that the molecule exhibits pseudo-fivefold symmetry.
DISCUSSION Supported lipid monolayers represent an excellent system
for studying the structure and dynamics of membrane recep- tor-ligand interactions. The ability to transfer the monolayers from the air-water interface to solid supports and to assess the interaction between the receptor and ligand is easily monitored by using fluorescent lipids and fluorescence mi- croscopy. In systems where the receptor is a lipid (e.g., ganglioside), the formation of monolayers containing these receptors is easily accomplished due to the miscibility of the receptor in neutral lipid (e.g., PC) monolayers. However, if the receptor is a cytoplasmic or membrane protein, then in- corporation into a monolayer system obviously poses problems. Methods of circumventing these problems have been developed; these include derivatizing fatty acids to the protein (Thompson et al., 1984; Huang, 1985) for better insertion into the lipid hydrocarbon environments or incorporating the proteins into unilamellar liposomes and then fusing these to a solid support such that supported planar bilayer membranes are formed (Watts et al., 1984). After utilization of these procedures, the lateral mobility of supported cytoplasmic proteins has been determined (Huang, 1985), as well as the two-dimensional crystallization of a fatty acid derivatized enzyme-effector complex (H. 0. Ribi and R. D. Kornberg, personal commu- nication).
The parameters investigated in this study of the ganglioside G,,-cholera toxin system were lateral diffusion and two-di- mensional crystallization. With the fluorescence recovery after photobleaching technique, diffusion coefficients of 3.9 X cm2/s and 8.9 x cm2/s were determined for the GM1 and the GM,-cholera toxin complex, respectively, in supported EYPC monolayers. The diffusion coefficient of GMI measured here in supported lipid monolayers is in close agreement with measurements made on human fibroblasts with incorporated rhodamine- and fluorescein-labeled GM1 ( - cm2/s) (Spiegel et al., 1984) and eosin-labeled GM1 incorporated into liposomal bilayers (4.7 X cm2/s) (Goins et al., 1986). A diffusion coefficient of 1 0-8 cm2/s is typical of fluid membrane conditions and is similar to values obtained for phospholipids in bilayers. Thus, it appears that, at concentrations of 5.0 mol % GMi in EYPC, the GM1 molecules are freely diffusing and have not patched into GMI-containing networks. However, in studies utilizing the fluorescent probe NBD-PE to monitor the surface properties, reduced lateral motion was observed a t concentrations of between 1.0 and 20.0 mol % G M l ; however, the lateral diffusion coefficient of NBD-PE was reduced by a factor of only 3-4 (data not shown). For monolayers con-
taining higher mole percent GMl, a double exponential gave a better fit to the recovery curve and corresponded to two populations with lateral diffusion coefficients of - cm2/s and - cm2/s, respectively. The slower diffusing species might represent regions in which GMl molecules have patched (Thompson et al., 1985).
When cholera toxin is bound to GMI, the lateral diffusion coefficient of the complex is very similar to the unbound GMI receptor, consistent with the theory of planar diffusion de- veloped by Saffman and Delbriick (1975). With their model, it can be shown that the lateral diffusion of a molecule within a lipid membrane of the hydrodynamic model is essentially independent of the molecular weight of the diffusing species.
Clearly, the ability of the G,,-cholera toxin complex to diffuse rapidly in the plane of the supported monolayer permits intermolecular collision processes to occur, these presumably leading to nucleation of two-dimensional crystals. Following short incubation times, stained electron micrographs show small crystalline domains containing small numbers (100-1000) of cholera toxin molecules (data not shown): longer incubation times allow crystal growth to occur and very large two-dimensional crystals form (see Figure 5, for example). While the quality of the crystals provides for only a low-res- olution description of the GMl-cholera toxin complex, already several interesting features are apparent. The GMl-bound cholera toxin molecules pack in a hexagonal lattice parallel to the monolayer surface, dimension a = 8 1 A, clearly visible in the original electron micrograph (see Figure 5) and con- firmed by the optical transform (Figure 6). At present, the resolution provided by the two-dimensional crystals is - 30 A and thus detailed interpretation of the reconstructed image is not justified. However, two structural features are worth pointing out. First, both the original electron micrograph (Figure 6) and the filtered reconstructed image (Figure 7) show evidence of stain penetration a t the center of the 70 A diameter particle, indicating that the cholera toxin molecule has a doughnut shape with a solvent-accessible channel a t its center. Second, and most interesting, individual cholera toxin molecules in the reconstructions (Figure 7) provide initial evidence for the subunit organization of cholera toxin bound to a membrane surface with some indication of a pentameric arrangement of subunits. Although it would be tempting to associate this picture with the organization of the five B subunits of each cholera toxin, caution should be exercised at this stage of the analysis. In this respect we make note of the issue of packing objects with perfect fivefold symmetry in hexagonal lattices. We should also point out that other two-dimensional rectangular crystals of GMl-bound cholera toxin have been observed, as well as crystals of GM,-cholera toxin B subunits (R. A. Reed, J. Mattai, and G. G . Shipley, unpublished observations).
Currently, we are trying to grow better two-dimensional crystals of cholera toxin with the objective of providing a higher resolution description of the subunit organization of recep- tor-bound cholera toxin. These studies will clearly benefit from a tilt series electron microscopy study. In the long term, three-dimensional crystals (Sigler et al., 1977) will be required to provide details of the subunit structure and intersubunit interactions.
ADDED IN PROOF
Rectangular and hexagonal two-dimensional crystals of GMl-bound cholera toxin 0 subunits have recently been re- ported (Ludwig et al., 1986). At 17-A resolution, a pentameric doughnut-shaped organization of the /3 subunits is again in- dicated.
832 B I O C H E M I S T R Y R E E D E T AL.
ACKNOWLEDGMENTS
We thank Don Gantz for help with the electron microscopy, Noreen Francis and Dr. David De Rosier (Brandeis Univer- sity) for help and advice on image analysis methods and use of their facilities, and Dr. Harden McConnell (Stanford University) for advice on the fluorescence photobleaching method and use of his facilities. We also thank Irene Miller for help in the preparation of the manuscript.
Registry No. Ganglioside GMl, 37758-47-7.
REFERENCES
Cuatrecasas, P. (1973) Biochemistry 12, 3558-3566. Curatolo, W., Small, D. M., & Shipley, G. G. (1977) Biochim.
Fishman, P. H. (1982) J . Membr. Biol. 69, 85-97. Fishman, P. H., & Brady, R. 0. (1976) Science (Washington,
Fishman, P. H. , Moss, J., & Osborne, J . C., Jr. (1978) Bio- chemistry 17, 711-716.
Gaines, G. L. (1966) in Insoluble Monolayers at Liquid-Gas Interfaces, p 5 8 , Interscience, New York.
Goins, B., Masserini, M., Barisas, B. G., & Freire, E. (1986) Bioph,ys. J . 49, 849-856.
Green, J. P., Phillips, M. C., & Shipley, G. G. (1973) Biochim. Biophys. Acta 330, 243-253.
Hafeman, D. G., von Tscharner, V., & McConnell, H. M. (1981) Proc. Natl. Acad. Sci. U.S.A. 78, 4552-4556.
Hafeman, D. G., Seui, M., Cliffe, C. M., 11, & McConnell, H. M. (1984) Biochim. Biophys. Acta 772, 20-28.
Hollenberg, M. D., Fishman, P. H., Bennett, V., & Cuatre- casas, P. (1974) Proc. Natl Acad. Sci. U.S.A. 71,
Biophys. Acta 468, 11-20.
D.C.) 194, 906-915.
4224-4228. Holmgren, J . (1981) Nature (London) 292, 413-417. Huang, L. (1985) Biochemistry 24, 29-34. King, C. A., & van Heyningen, W. E. (1973) J . Infect. Dis.
Ludwig, D. S., Ribi, H . O., Schoolnik, G. K., & Kornberg, R. D. (1986) Proc. Natl. Acad. Sci. U.S.A. 83, 8585-8588.
Maggio, B., Curnar, F. A., & Caputto, R. (1978) Biochem.
127. 639-647.
J . 175, 1 1 13-1 118.
Myers, M., Wortman, C., & Freire, E. (1984) Biochemistry
Rubenstein, J. L. R., Smith, B. A., & McConnell, H. M. (1979) Proc. Natl. Acad. Sci. U.S.A. 76, 15-18.
Ruocco, M. J., Atkinson, D., Small, D. M., Skarjune, R. P.. Oldfield, E., & Shipley, G. G. (1981) Biochemistry 20,
Saffman, P. G., & Delbruck, M. (1975) Proc. Natl. Acad. Sci.
Salmon, E. D., & De Rosier, D. ( I 98 1) J . Microsc. (Oxford)
Sigler, P. B., Druyan, M. E., Kiefer, H. C., & Finkelstein, R. A. (1977) Science (Washington, D.C.) 197, 1277-1279.
Smith, B. A., & McConnell, H. M. (1 978) Proc. Natl. Acad. Sci. U.S.A. 75, 2759-2763.
Smith, L. M., Parce, J. W., Smith, B. A,, & McConnell, H. M. (1979) Proc. Natl. Acad. Sci. U.S.A. 76, 4177-4179.
Spiegel, S. ( I 985) Biochemistry 24, 5947-5952. Spiegel, S., Schlessinger, J., & Fishman, P. H. (1984) J . Cell
Biol. 99, 699-704. Svennerholm, L., & Fredman, P. (1980) Biochim. Biophys.
Acta 617, 97-109. Thompson, N. L., Brian, A. A., & McConnell, H. M. (1984)
Biochim. Biophys. Acta 772, 10-19. Thompson, T. E., Allietta, M., Brown, R. E., Johnson, M. I.,.,
& Tillack, T. W. (1985) Biochim. Biophys. Acta 817, 229-237.
Uzgiris, E. E., & Kornberg, R. D. (1 983) Nature (London) 301, 125-129.
van Heyningen, S. (1983) Curr. Top. Membr. Transp. 18, 445-47 I .
van Heyningen, W. E., Carpenter, C. C. J., Pierce, N. F., & Greenough, W. B., I11 (1971) J . Infect. Dis. 124, 415-418.
von Tscharner, V., & McConnell, H. M. (1981) Biophys. J .
Watts, T. H., Brian, A. A,, Kappler, J. W., Marrack, P., & McConnell, H. M. (1984) Proc. Natl. .4cad. Sei. U.S.A.
Weis, R. M., Balakrishnan, K., Smith, B. A., & McConnell,
Wu, E. S., Jacobson, K., & Papahadjopoulos, D. (1977)
23, 1442-1448.
5957-5966.
U.S.A. 721, 3111-3113.
123, 239-247.
36, 421-427.
81, 7564-7568.
H. M. (1982) J . Biol. Chem. 257, 6440-6445.
Biochemistry 16, 3936-3941.