Embed Size (px)
Citation preview

Inter-American Drug Abuse Control Commission (CICAD)
Secretariat for Multi-Dimensional Security (SMS) Organization of American States

A Report on Students’ Drug Use in 13 Caribbean Countries 2016
Page |2
OAS Cataloging-in-Publication Data Inter-American Drug Abuse Control Commission.
A report on students’ drug use in 13 Caribbean Countries : Antigua and Barbuda, The Bahamas , Barbados, Belize, Dominica, Grenada, Guyana, Haiti, Jamaica, St. Kitts and Nevis, St. Lucia, St. Vincent and the Grenadines, Trinidad and Tobago. v.; cm. (OAS. Official records; OEA/Ser.L/XIV.6.46). ISBN 978-0-8270-6574-1
1. Drug abuse--Caribbean Area. 2. Teenagers--Drug use--Caribbean Area. 3. Students--Drug use--Caribbean Area. I. Title. II. Douglas, Ken-Garfield. III. Organization of American States. Secretariat for Multidimensional Security. IV. Inter-American Uniform Drug Use Data System. V. Inter-American Observatory on Drugs. VI. Series. OEA/Ser.L/XIV.6.46

A Report on Students’ Drug Use in 13 Caribbean Countries 2016
Page |3
Acknowledgements This report was authored by Dr. Ken-Garfield Douglas, drug abuse epidemiologist and CICAD Consultant. The Inter-American Observatory on Drugs (OID) Section of CICAD oversaw the implementation of the 11 country studies that contributed the data necessary for a report of this nature. Dr. Francisco Cumsille led the OID team and oversaw the organization and processing of the data. Mr. Pernell Clarke served as project manager for this project and provided overall coordination, training, technical support, data management, and editing. Ms. Daniela Westphal and Ms. Tiffany Barry served consecutively as project assistant and also provided editorial and administrative support. Alejandro Retamoso was the consultant statistician who prepared the data analysis for the 11 countries where surveys took place in 2013 and 2014. Country-Specific Contributions
• Antigua & Barbuda: Dr. John Swift, Consultant, and Ms. Norma Jeffrey Dorsett,
Substance Abuse Prevention Officer.
• The Bahamas : Terrence Fountain, National Anti-Drug Secretariat
• Barbados: Jonathan Yearwood and Laura Lee Seale, Research Department, National
Council on Substance Abuse (NCSA).
• Belize: Amelio Matura, National Drug Abuse Control Council, and Ion Cacho, Consultant
• Dominica: Martha Jarvis, National Drug Prevention Unit.
• Grenada: Dr. Cecilia Younger, Consultant, and Elizabeth Japal, Drug Control Secretariat
• Guyana: Clement Henry, Ministry of Home Affairs, and Tiffany Barry, Consultant.
• Haiti: Jean Alain Bernadel and Joseph Gabeaud, Haitian Drug Observatory.
• Jamaica: Michael Tucker and Uki Atkinson, National Council on Drug Abuse, and
Patrice Whitehorne-Smith, Consultant. • St. Kitts and Nevis: Karimu Byron, National Council on Drug Abuse Prevention, and
Gaile Gray Phillip, Consultant.
• St. Lucia: Cyprian Yarde, Substance Abuse Advisory Council Secretariat.
• St. Vincent and the Grenadines: Patsy Wyllie, Ministry of Health, and Selwyn Allen,
Consultant.
• Trinidad & Tobago: Arlene Emmanuel, National Alcohol and Drug Abuse Prevention
Programme Secretariat, and Dr. Brader Brathwaite, Consultant.
A Report on Students’ Drug Use in 13 Caribbean Countries 2016
Page |4
Table of Contents
Acknowledgements ...................................................................................................................... 3
Executive Summary................................................................................................................... 13
Methodology ............................................................................................................... 13
Data Collection ............................................................................................................ 14
Analysis Objectives ..................................................................................................... 14
Findings....................................................................................................................... 14
Conclusions ................................................................................................................. 16
CHAPTER 1 .............................................................................................................................. 18
Methodology ............................................................................................................... 18
Population ........................................................................................................................... 18
Sampling............................................................................................................................. 18
Data Collection ................................................................................................................... 19
Data Entry and Analysis ...................................................................................................... 20
Definitions of Terms ........................................................................................................... 20
Statistical Data Analysis ...................................................................................................... 20
CHAPTER 2 .............................................................................................................................. 21
Results ........................................................................................................................................ 21
Description of Sample ................................................................................................. 21
Alcohol ........................................................................................................................ 24
Prevalence .......................................................................................................................... 24
Alcohol Prevalence by Gender ............................................................................................ 25
Alcohol Prevalence by Age Group ...................................................................................... 26
Alcohol Prevalence and Grade Level ................................................................................... 27
Age of First Use of Alcohol ................................................................................................ 29
Alcohol and Behavioral Problems ....................................................................................... 30
Binge Drinking ................................................................................................................... 31
Perception of Harm ............................................................................................................. 33
TREND ANALYSIS - ALCOHOL ........................................................................... 33
Cigarettes .................................................................................................................... 36
Cigarette Prevalence............................................................................................................ 36
Cigarette Use and Gender .................................................................................................... 37
Cigarette Use and Age......................................................................................................... 38
Incidence ............................................................................................................................ 40
Age of First Use of Cigarettes ............................................................................................. 41

A Report on Students’ Drug Use in 13 Caribbean Countries 2016
Page |5
Perception of Harm – Cigarette ........................................................................................... 42
TREND ANALYSIS - CIGARETTES......................................................................... 43
Use of Prescription Medications without a prescription (Tranquilizers and Stimulants) 45
Tranquilizers ....................................................................................................................... 45
Stimulants ........................................................................................................................... 46
TREND ANALYSIS - NON-MEDICAL USE OF PRESCRIPTION MEDICATIONS 47
Inhalants ...................................................................................................................... 48
Prevalence of Inhalant Use .................................................................................................. 48
Inhalant Use and Gender ..................................................................................................... 49
Inhalant Use and Age .......................................................................................................... 50
Inhalant Use and Grade ....................................................................................................... 51
Incidence ............................................................................................................................ 52
Age of First Use .................................................................................................................. 53
Inhalant Use and Behavioral Problems at School ................................................................. 54
Perception of Harm ............................................................................................................. 55
TREND ANALYSIS - INHALANTS .......................................................................... 56
Marijuana - Ganja ........................................................................................................ 59
Marijuana Prevalence .......................................................................................................... 59
Marijuana Use and Gender .................................................................................................. 60
Marijuana Use and Age ....................................................................................................... 61
Use among the Age Cohorts ................................................................................................ 62
Marijuana Use and Grade Level .......................................................................................... 64
Incidence ............................................................................................................................ 65
Age of First Use .................................................................................................................. 66
Marijuana Use and Behavioral Problems at School .............................................................. 67
Marijuana Use and Number of School Years Repeated ........................................................ 68
Access to Marijuana ............................................................................................................ 69
Perception of Harm ............................................................................................................. 72
TREND ANALYSIS – MARIJUANA ......................................................................... 72
Cannabis Abuse Screening Test (CAST) ...................................................................... 75
Any Illegal Drug .......................................................................................................... 76
Any Illegal Drug Use and Gender........................................................................................ 76
Any Illegal Drug Use and Age ............................................................................................ 77
Incidence ............................................................................................................................ 78
Any Illegal Drug Use and Behavioral Problems at School ................................................... 79

A Report on Students’ Drug Use in 13 Caribbean Countries 2016
Page |6
Any Illegal Drug Use and Number of School Years Repeated.............................................. 80
Other Illegal Drugs (Cocaine, Crack, and Ecstasy) ....................................................... 82
Cocaine ............................................................................................................................... 82
Crack Cocaine ..................................................................................................................... 83
Ecstasy................................................................................................................................ 85
Availability of Other Drugs (Cocaine, Ecstasy and Crack Cocaine) ............................. 87
Cigarette Use versus Marijuana Use ............................................................................ 88
Perception of Harmfulness ........................................................................................... 89
Overall Perceptions ............................................................................................................. 89
Perception that Substance Use is ‘Not Harmful.................................................................... 90
TREND ANALYSIS – PERCEPTION OF HARM ...................................................... 92
USE RELATED RISK................................................................................................. 93
Country Specific Use-Related Risks .................................................................................... 93
Overall Use-Related Risks ................................................................................................ 99
CHAPTER 3 ............................................................................................................................ 104
Discussion ................................................................................................................................ 104
APPENDICES ......................................................................................................................... 108
ALCOHOL ................................................................................................................ 108
CIGARETTES........................................................................................................... 110
INHALANTS ............................................................................................................ 112
MARIJUANA ........................................................................................................... 115
ANY ILLEGAL DRUGS .......................................................................................... 120
Other Illegal Drugs (Cocaine, Crack, and Ecstasy) ..................................................... 123
Cigarettes Use versus Marijuana Use ......................................................................... 123
Students Perception of Harmfulness – Country Estimates .......................................... 124

A Report on Students’ Drug Use in 13 Caribbean Countries 2016
Page |7
List of Tables
TABLE 1: SAMPLE SIZES AND DISTRIBUTION OF STUDENTS BY GENDER ___________________ 21
TABLE 2: DISTRIBUTION OF SAMPLE BY AGE GROUP. _________________________________ 22
TABLE 3: PREVALENCE OF ALCOHOL USE __________________________________________ 24
TABLE 7: PAST YEAR ALCOHOL INCIDENCE _________________________________________ 28
TABLE 10: PREVALENCE OF BINGE DRINKING BY COUNTRY _____________________________ 32
TABLE 11: COMPARISON OF PAST MONTH ALCOHOL PREVALENCE _______________________ 34
TABLE 12A: PREVALENCE OF CIGARETTE USE _______________________________________ 36
TABLE 14: PAST YEAR AND PAST MONTH CIGARETTE PREVALENCE BY GRADE LEVELS ______ 39
TABLE 15: PAST YEAR INCIDENCE OF CIGARETTE USE_________________________________ 40
TABLE 17: COMPARISON OF PAST MONTH PREVALENCE OF CIGARETTE USE _______________ 44
TABLE 19: LIFETIME, PAST YEAR AND PAST MONTH PREVALENCE OF STIMULANTS AND
TRANQUILIZERS ___________________________________________________________ 45
TABLE 20: PREVALENCE OF INHALANTS USE ________________________________________ 48
TABLE 27: PREVALENCE OF INHALANTS USE – SNIFFING INHALANTS IN ORDER TO GET HIGH __ 58
TABLE 29: PREVALENCE OF MARIJUANA USE _______________________________________ 60
TABLE 35: PAST YEAR AND PAST MONTH PREVALENCE OF MARIJUANA USE BY BEHAVIORAL
PROBLEMS ________________________________________________________________ 68
TABLE 39: COMPARISON OF PAST YEAR MARIJUANA INCIDENCE ________________________ 74
TABLE 48: PERCEPTION OF AVAILABILITY OF COCAINE ________________________________ 83
TABLE 49: PERCEPTION OF AVAILABILITY OF CRACK COCAINE __________________________ 84
TABLE 50: PERCEPTION OF AVAILABILITY OF ECSTASY ________________________________ 86
TABLE 51: PERCEPTION OF AVAILABILITY OF CRACK COCAINE __________________________ 87
TABLE 52: STUDENTS PERCEPTION OF HARMFULNESS – VERY HARMFUL ___________________ 90
TABLE 53: PERCEPTION OF HARMFULNESS – USE NOT HARMFUL _________________________ 91
TABLE 54A: USE-RELATED RISKS – ANTIGUA AND BARBUDA ____________________________ 94
TABLE 54B: USE-RELATED RISKS – BARBADOS _______________________________________ 94
TABLE 54C: USE-RELATED RISKS – BELIZE __________________________________________ 94
TABLE 54D: USE-RELATED RISKS – GRENADA ________________________________________ 95
TABLE 54E: USE-RELATED RISKS – GUYANA _________________________________________ 95
TABLE 54F: USE-RELATED RISKS – HAITI ____________________________________________ 96
TABLE 54G: USE-RELATED RISKS – JAMAICA _________________________________________ 96
TABLE 54H: USE-RELATED RISKS – ST. KITTS AND NEVIS _______________________________ 97

A Report on Students’ Drug Use in 13 Caribbean Countries 2016
Page |8
TABLE 54I: USE-RELATED RISKS – ST. LUCIA_________________________________________ 97
TABLE 54J: USE-RELATED RISKS – ST. VINCENT AND THE GRENADINES ____________________ 98
TABLE 54K: USE-RELATED RISKS – TRINIDAD AND TOBAGO _____________________________ 98
TABLE 4: ALCOHOL PREVALENCE BY GENDER ______________________________________ 108
TABLE 5: PAST YEAR AND PAST MONTH ALCOHOL PREVALENCE BY AGE GROUP __________ 108
TABLE 6: PAST YEAR AND PAST MONTH ALCOHOL PREVALENCE BY GRADE LEVELS _______ 109
TABLE 8: AVERAGE AGE OF FIRST USE OF ALCOHOL BY GENDER ______________________ 109
TABLE 9: PAST YEAR AND PAST MONTH PREVALENCE OF ALCOHOL USE BY BEHAVIORAL
PROBLEMS _______________________________________________________________ 110
TABLE 12B: CIGARETTE PREVALENCE BY GENDER ___________________________________ 110
TABLE 13: PAST YEAR AND PAST MONTH CIGARETTE PREVALENCE BY AGE GROUP ________ 111
TABLE 16: AVERAGE AGE OF FIRST USE OF CIGARETTES BY GENDER ___________________ 111
TABLE 18: PAST YEAR AND PAST MONTH PREVALENCE OF CIGARETTE USE BY BEHAVIORAL
PROBLEMS _______________________________________________________________ 112
TABLE 21: INHALANTS PREVALENCE BY GENDER ___________________________________ 112
TABLE 22: PAST YEAR AND PAST MONTH INHALANT PREVALENCE BY AGE GROUP_________ 113
TABLE 23: PAST YEAR AND PAST MONTH INHALANT PREVALENCE BY GRADE LEVELS ______ 113
TABLE 24: PAST YEAR INHALANT INCIDENCE BY GENDER _____________________________ 114
TABLE 25: AVERAGE AGE OF FIRST USE OF INHALANTS BY GENDER ____________________ 114
TABLE 26: PAST YEAR AND PAST MONTH PREVALENCE OF INHALANT USE BY BEHAVIORAL
PROBLEMS _______________________________________________________________ 114
TABLE 30: MARIJUANA PREVALENCE BY GENDER ___________________________________ 115
TABLE 31: PAST YEAR AND PAST MONTH MARIJUANA PREVALENCE BY AGE GROUP _______ 116
TABLE 32: PAST YEAR AND PAST MONTH MARIJUANA PREVALENCE BY GRADE LEVELS ____ 116
TABLE 33: PAST YEAR MARIJUANA INCIDENCE _____________________________________ 117
TABLE 34: AVERAGE AGE OF FIRST USE OF MARIJUANA BY GENDER ____________________ 117
TABLE 36: MARIJUANA PREVALENCE BY NUMBER OF REPEATED SCHOOL YEARS __________ 118
TABLE 37: ACCESS TO MARIJUANA ______________________________________________ 118
TABLE 38: PAST YEAR PREVALENCE OF MARIJUANA USE AND EASE OF ACCESS ___________ 119
TABLE 40: CANNABIS ABUSE SCREENING TEST _____________________________________ 119
TABLE 41: PREVALENCE OF ANY ILLEGAL DRUG USE ________________________________ 120
TABLE 42: PREVALENCE OF ANY ILLEGAL DRUG BY GENDER __________________________ 120
A Report on Students’ Drug Use in 13 Caribbean Countries 2016
Page |9
TABLE 43: PAST YEAR AND PAST MONTH PREVALENCE OF ANY ILLEGAL DRUG BY AGE GROUP
________________________________________________________________________ 121
TABLE 44: PAST YEAR AND PAST MONTH INCIDENCE OF ANY ILLEGAL DRUG _____________ 121
TABLE 45: PAST YEAR AND PAST MONTH PREVALENCE OF ANY ILLEGAL DRUG USE BY
BEHAVIORAL PROBLEMS ___________________________________________________ 122
TABLE 46: ANY ILLEGAL DRUG USE PREVALENCE BY NUMBER OF REPEATED SCHOOL YEARS 122
TABLE 47: PREVALENCE OF OTHER ILLEGAL DRUG __________________________________ 123
TABLE 52: CIGARETTE USE VERSUS MARIJUANA USE ________________________________ 123
TABLE 55A: STUDENTS OVERALL PERCEPTION OF HARMFULNESS- ANTIGUA AND BARBUDA _ 124
TABLE 55B: STUDENTS OVERALL PERCEPTION OF HARMFULNESS- THE BAHAMAS _________ 124
TABLE 55C: STUDENTS OVERALL PERCEPTION OF HARMFULNESS- BARBADOS ____________ 125
TABLE 55D: STUDENTS OVERALL PERCEPTION OF HARMFULNESS- BELIZE _______________ 125
TABLE 55E: STUDENTS OVERALL PERCEPTION OF HARMFULNESS- DOMINICA _____________ 126
TABLE 55F: STUDENTS OVERALL PERCEPTION OF HARMFULNESS- GRENADA _____________ 126
TABLE 55G: STUDENTS OVERALL PERCEPTION OF HARMFULNESS- GUYANA ______________ 127
TABLE 55H: STUDENTS OVERALL PERCEPTION OF HARMFULNESS -HAITI ________________ 127
TABLE 55I: STUDENTS OVERALL PERCEPTION OF HARMFULNESS - JAMAICA ______________ 128
TABLE 55J: STUDENTS OVERALL PERCEPTION OF HARMFULNESS - ST. KITTS AND NEVIS ____ 128
TABLE 55K: STUDENTS OVERALL PERCEPTION OF HARMFULNESS -ST. LUCIA _____________ 129
TABLE 55L: STUDENTS OVERALL PERCEPTION OF HARMFULNESS - ST. VINCENT AND THE
GRENADINES _____________________________________________________________ 129
TABLE 55M: STUDENTS OVERALL PERCEPTION OF HARMFULNESS- TRINIDAD AND TOBAGO _ 130

A Report on Students’ Drug Use in 13 Caribbean Countries 2016
Page |10
List of Figures
FIGURE 1: DISTRIBUTION OF SAMPLE BY GENDER ..................................................................... 22
FIGURE 2: DISTRIBUTION OF SAMPLE BY AGE GROUPING ........................................................ 23
FIGURE 3: LIFETIME, PAST YEAR AND PAST MONTH PREVALENCE OF ALCOHOL USE ....... 25
FIGURE 4: PAST MONTH ALCOHOL PREVALENCE BY GENDER ................................................ 26
FIGURE 5: PAST MONTH ALCOHOL PREVALENCE BY AGE GROUP .......................................... 27
FIGURE 6: PAST MONTH ALCOHOL PREVALENCE BY GRADE LEVELS ................................... 27
FIGURE 7: PAST YEAR ALCOHOL INCIDENCE BY GENDER ........................................................ 29
FIGURE 8: AGE OF FIRST USE OF ALCOHOL .................................................................................. 30
FIGURE 9: PAST MONTH ALCOHOL USE AND BEHAVIOURAL PROBLEMS .............................. 31
FIGURE 10: BINGE DRINKING AND HEAVY BINGE DRINKING ................................................... 32
FIGURE 11: PERCEPTION OF HARM – GETTING DRUNK .............................................................. 33
FIGURE 12: COMPARISON OF ALCOHOL USE - OVERALL PREVALENCE ................................. 34
FIGURE 13: COMPARISON OF HEAVY BINGE DRINKING AMONG COUNTRIES ....................... 35
FIGURE 14: PREVALENCE OF TOBACCO (CIGARETTE) USE ....................................................... 37
FIGURE 15: PAST MONTH PREVALENCE OF CIGARETTES BY GENDER ................................... 38
FIGURE 16: PAST MONTH CIGARETTE PREVALENCE BY AGE GROUP ..................................... 39
FIGURE 17: PAST YEAR CIGARETTE INCIDENCE BY GENDER ................................................... 41
FIGURE 18: AGE OF FIRST USE OF CIGARETTES ........................................................................... 42
FIGURE19: PERCEPTION OF HARM – SMOKING CIGARETTES .................................................... 43
FIGURE 20: COMPARISON OF CIGARETTE USE - OVERALL AVERAGE PREVALENCE ........... 43
FIGURE 21: TRANQUILIZER PREVALENCE .................................................................................... 46
FIGURE 22: STIMULANT PREVALENCE .......................................................................................... 47
FIGURE 23: PREVALENCE OF INHALANT USE .............................................................................. 49
FIGURE 24: PAST YEAR PREVALENCE BY GENDER ..................................................................... 50
FIGURE 25: PAST YEAR INHALANT PREVALENCE BY AGE GROUP .......................................... 51
FIGURE 26: PAST YEAR INHALANT PREVALENCE BY GRADE LEVEL ...................................... 52
FIGURE 27: PAST YEAR INCIDENCE OF INHALANT USE ............................................................. 53
FIGURE 28: AGE OF FIRST USE FOR INHALANTS BY GENDER ................................................... 54
FIGURE 29: PAST YEAR INHALANT USE BY NUMBER OF BEHAVIOURAL PROBLEMS .......... 55
FIGURE 30: PERCEPTION OF HARM – INHALING SOLVENTS ...................................................... 56
FIGURE 31: COMPARISON OF INHALANT USE - PAST YEAR PREVALENCE ............................. 57

A Report on Students’ Drug Use in 13 Caribbean Countries 2016
Page |11
FIGURE 32: MARIJUANA PREVALENCE ......................................................................................... 60
FIGURE 33: PAST YEAR MARIJUANA USE BY GENDER ............................................................... 61
FIGURE 34: PAST YEAR MARIJUANA PREVALENCE BY AGE GROUP ....................................... 62
FIGURE 35: PAST YEAR MARIJUANA PREVALENCE FOR STUDENTS 14 YEARS OR
YOUNGER……………………………………………………………………………….63
FIGURE 36: PAST YEAR MARIJUANA PREVALENCE FOR STUDENTS 17 YEARS AND OLDER ............................... 64
FIGURE 37: PAST YEAR MARIJUANA PREVALENCE .................................................................... 65
FIGURE 38: PAST YEAR INCIDENCE OF MARIJUANA USE .......................................................... 66
FIGURE 39: AVERAGE AGE OF FIRST USE FOR MARIJUANA BY GENDER ................................ 67
FIGURE 40: PAST YEAR PREVALENCE OF MARIJUANA USE BY NUMBER OF REPEAT SCHOOL YEARS ............. 69
FIGURE 41: EASE OF OBTAINING MARIJUANA ............................................................................. 70
FIGURE 42: PAST YEAR MARIJUANA USE BY EASE OF OBTAINING IT ..................................... 71
FIGURE 43: EASY ACCESS VERSUS PAST YEAR PREVALENCE .................................................. 71
FIGURE 44: PERCEPTION OF HARM – SMOKING MARIJUANA .................................................... 72
FIGURE 45: COMPARISON OF MARIJUANA USE - OVERALL AVERAGE PREVALENCE .......... 73
FIGURE 46: COMPARISON OF MARIJUANA USE AMONG GENDER - OVERALL AVERAGE PREVALENCE ........... 73
FIGURE 47: CANNABIS ABUSE SCREENING TEST ........................................................................ 75
FIGURE 48: PAST YEAR PREVALENCE OF ANY ILLEGAL DRUG ................................................ 76
FIGURE 49: PAST YEAR PREVALENCE OF ANY ILLEGAL DRUG BY GENDER .......................... 77
FIGURE 50: PAST YEAR PREVALENCE OF ANY ILLEGAL DRUG USE BY AGE GROUP............ 78
FIGURE 51: PAST YEAR INCIDENCE OF ANY ILLEGAL DRUG USE ............................................ 79
FIGURE 52: PAST YEAR ANY ILLEGAL DRUG USE AND BEHAVIORAL PROBLEMS AT SCHOOL .......................... 80
FIGURE 53: PAST YEAR PREVALENCE OF ANY ILLEGAL DRUG USE AND NUMBER OF REPEAT GRADES ......... 81
FIGURE 54: LIFETIME AND PAST YEAR PREVALENCE OF COCAINE USE................................. 82
FIGURE 55: LIFETIME AND PAST YEAR PREVALENCE OF CRACK COCAINE USE ................... 84
FIGURE 56: LIFETIME PREVALENCE OF ECSTASY ....................................................................... 85
FIGURE 57: PAST YEAR CIGARETTE COMPARED TO MARIJUANA ............................................ 88
FIGURE 58: PERCEPTION NO HARM (SMOKING CIGARETTES) .................................................. 91
FIGURE 59: PERCEPTION NO HARM (SMOKING MARIJUANA) ................................................... 91
FIGURE 60A: GETTING A LOW GRADE ........................................................................................... 99
FIGURE 60B: TROUBLE WITH THE POLICE .................................................................................... 99
FIGURE 60C: GETTING INTO ANGRY ARGUMENTS OR FIGHTS ............................................... 100
FIGURE 60D: MEMORY LOSS ......................................................................................................... 100

A Report on Students’ Drug Use in 13 Caribbean Countries 2016
Page |12
FIGURE 60E: PROBLEM WITH FAMILY ......................................................................................... 101
FIGURE 60F: HAVING SOMEONE TAKE SEXUAL ADVANTAGE OF YOU ................................. 101
FIGURE 60G: TAKING SEXUAL ADVANTAGE OF SOMEONE .................................................... 102
FIGURE 60H: TRYING WITHOUT SUCCESS TO STOP USING ...................................................... 102
FIGURE 60I: INFLECTING SELF-HARM ......................................................................................... 103
FIGURE 60J: SERIOUSLY THINKING ABOUT COMMITTING SUICIDE ...................................... 103

A Report on Students’ Drug Use in 13 Caribbean Countries 2016
Page |13
Executive Summary
Methodology The Inter-American Uniform Drug Use Data System (SIDUC) survey of secondary school
students applies a uniform methodology that was created by CICAD and developed
through consensus by survey experts and practitioners in the hemisphere. The main
objective of the uniformity of the approach is to allow the direct comparison of data
between surveys that have been undertaken in different countries (i.e. cross-sectional
comparison between geographic locations) and at different times (i.e. temporal
comparison). As a result, the sampling procedures, data collection, and data entry methods
are all the same, or comparably similar, in each of the countries included in this
comparative study.
Sampling
The sample frame for this survey includes all students enrolled in 2nd, 4th and 6th forms in
all secondary schools in a particular geographic location such as a city, urban locale, rural
locale, or the entire country. In this report, the samples represent national level data for all
participating countries. The final sampling unit is the classroom and a number of these
classrooms are randomly selected. All of the students in the selected classrooms are
included in the sample. The information collected on the sample frame allows the results of
the surveys to be expanded to the general student population in the selected grades by
using an appropriate expansion factor.
The samples of students taken in the individual countries yielded an overall 25,917
students, and all of these are included in this comparative analysis. The largest individual
sample was taken in Trinidad and Tobago (4,176 students) while the smallest was taken in
St. Kitts and Nevis (613).

A Report on Students’ Drug Use in 13 Caribbean Countries 2016
Page |14
Data Collection Data is collected from the students by applying a pre-coded self-administered
questionnaire that is standardized to ensure the comparability discussed earlier. To ensure
the quality as well as the anonymity of responses, SIDUC insists that data collection occurs
in surroundings familiar to the students (e.g. their classroom) and with minimal or no
involvement of teachers in the administering of the questionnaire. The questionnaire
consists of a standard set of questions that are arranged as follows:
• Basic socio-demographic information
• Beliefs about future academic performance
• Discipline and academic problems
• Perceptions of harm associated with the consumption of drugs
• Prevalence of substance use and patterns of consumption
• Incidence of substance use
• Frequency of use
Analysis Objectives
The primary outcome measures were lifetime, past year and past month substance use
using the SIDUC secondary school instrument. Questions were directed to determine
prevalence of consumption of licit and illicit drugs (15 drugs of abuse), past year and past
month incidence and age of initiation of substance use. Secondary outcome measures
included perception of harmfulness—questions that ask about perceived harm from
substance use, and use-related risk; cannabis abuse risk; perceptions of the
availability/access to drugs; and relationship between consumption and problem behavior.
Findings The trend analysis showed a slight decline in overall past year prevalence for alcohol; the
younger age cohort continues to use relatively high proportions of alcohol; binge drinking
was equally high in this survey compared to the 2010 report. For cigarettes, the 2013
A Report on Students’ Drug Use in 13 Caribbean Countries 2016
Page |15
survey showed a slight decline in overall past year prevalence; some decreases in past year
use was noted among age cohorts; incidence (both past year and past month) were similar
for both periods. In terms of inhalants, this survey showed a slight increase in overall past
year prevalence over the last survey; females continue to report higher prevalence than
males; and there was no marked difference in age of first use.
Marijuana continues to be the most widely used illegal substance reported by students, The
2013 survey showed a marked increase in overall average lifetime, past year and past
month prevalence over the 2010 report. Students overall perception of harmfulness in
relation to the use of substances did not change much, but in some cases a lower proportion
of students were indicating that for example, smoking marijuana frequently was very
harmful (71.4% in 2010 report vs. 63% in 2013).
Compared to Haiti’s and Dominica’s lifetime prevalence of tranquilizers (11.2% and
10.4% respectively), all other countries reported prevalence rates of tranquilizer use that
were relatively very low (in particular past year and past month prevalence). No other
country besides Haiti and Dominica reported a past year prevalence rate greater that 5%.
Stimulant use was also relatively high in Haiti (lifetime prevalence 7.6%) with past year
and past month prevalence rates of 3.4% and 1.5% respectively. All other countries report
lifetime prevalence rates of less than 5% and even lower past year and past month rates in
the range of 1-3.5%.
Similar to what was reported in the 2010 report, there was a consistent positive
relationship, between past year prevalence and behavioral problems. This relationship is
such that the higher the number of behavioral problems the higher is the prevalence of
alcohol use. This pattern was also observed for cigarettes, inhalants and marijuana. This
pattern was also observed among students who reported that they repeated at least two
grades in school.

A Report on Students’ Drug Use in 13 Caribbean Countries 2016
Page |16
The Cannabis Abuse Screening Test (CAST) was used to determine the level of risk for
abuse for marijuana users. The overall proportions of students that were identified through
the CAST as being at some risk for cannabis abuse were 64% (37.3% at low risk and
26.6% at high risk).
Use-related risk among students surveyed was notable in the categories of getting a low
grade, problems with family, getting into arguments or fights, memory loss, and trying
without success to stop using substances. It is important to note that a small but notable
proportion of students were at risk with respect to seriously thinking about suicide and
inflicting self-harm.
Conclusions
• By far the most widely consumed substance is alcohol and this is followed by marijuana.
• Prevalence is relatively high but there is plenty of variability from country to country.
• Marijuana is the most widely used illegal substance and in most cases, its use is even more prevalent than tobacco.
• A very important finding relates to students perception of how easy it is to access drugs.
• Perception of availability of marijuana was very high-- four to five of every ten students indicated that they could access marijuana easily in most of the countries.
• Additionally, the perception of harm associated with marijuana appears to be declining among secondary school students.
• Many students do not know the dangers of:
– frequent misuse of prescription drugs
– occasional or frequent use of inhalants
– occasional or frequent use of ecstasy
• The most important finding about marijuana was that in most countries there was an increase in prevalence when compared to the 2010 report and at the same time there was a decline in the harm associated with marijuana use.

A Report on Students’ Drug Use in 13 Caribbean Countries 2016
Page |17
The eight (8) principal policy issues that this analysis highlights are as follows:
1. It supports the formulation of policies and strategies that are appropriate to the local
conditions in each geographic locale—country specific data must be used to
formulate policies and provide for prevention initiatives.
2. It serves as a sound information base for policy development and provides the
supporting evidence for the implementation of drug control strategies.
3. It makes a direct contribution to improving information on drug consumption and
drug trends throughout the Caribbean region.
4. It serves as the building blocks for developing governmental strategic drug control
plans. Inherent in the results are opportunities for cross fertilization of ideas in that
countries can learn best practices for each other for implementation.
5. It acts as an early warning and validation tool for drug trends.
6. It provides a data-driven context for lobbying for the reduced availability of and
access to illegal drugs in each geographic region.
7. It provides drug prevention education specialists with local information for local
action within the education systems and for public health promotion opportunities
as well.
8. The issue of harmfulness of substances still needs to be addressed in all countries.
The findings provide evidence to address these three main policy implications:
a. There are serious prevention education implications for the findings related to
perception of harm related to substance use.
b. In relation to other regions, the prevalence of use of some of these substances
particularly marijuana and inhalants, is relatively high.
c. The age of first use estimates are fairly consistent across countries so the specific
point in time where prevention programs intervene can also be fairly uniform. The
primary school secondary school transition is a critical time for intervention.

A Report on Students’ Drug Use in 13 Caribbean Countries 2016
Page |18
CHAPTER 1
Methodology The SIDUC survey of secondary school students utilizes a standardized methodology that was created by CICAD and developed through consensus by survey experts and practitioners in the hemisphere. The main objective of the uniformity of the approach is to allow the direct comparison of cross-sectional data from surveys that were implemented in different countries and at different times. As a result, the sampling procedures, data collection, the questionnaire, and data management methods are all the same (or comparably similar) in each of the countries included in this comparative study.
Population
The population targeted for this survey includes students in secondary level (or high) schools in forms 2, 4 and 6 (this is similar to grades 8, 10 and 12 in the USA school system). Generally, it would be expected that the corresponding ages would be 13, 15 and 17, but this rule can be adapted to suit the realities of the particular country. For instance, countries with very low levels of students at the 6th form level would have included students at the 5th form level.
Sampling
The sample frame for this survey contains all students enrolled in 2nd, 4th and 6th forms in all secondary schools in a particular geographic location such as a city, urban locale, rural locale, or the entire nation. The data presented in this report represents national level data for the sample frame for all of the participating countries and the classes included meant that students who are 13, 15, and 17 years of age were included in the sample frame. The last age group however was modified to 16 years of age because in the Caribbean, most of the school systems normally see a dramatic drop in the number of students in the classes corresponding to the 6th form. This does not mean that there are not students above 16 in the sample, but the overall numbers are significantly smaller. In addition, the delineation between age groups by grade is not always reflected in the reality of the classrooms. A final adjustment was made in the database, and analyses were performed on age categories of 14 years old or less, 15 – 16 years old, and 17 years and older.

A Report on Students’ Drug Use in 13 Caribbean Countries 2016
Page |19
The information used to define the sample frames were taken from complete lists of student enrollment for the grades required in all schools in the country. The information includes the actual or average number of students in each of the class rooms in the relevant grades. The final sampling unit is the classroom and a number of these classes are randomly selected. All of the students in the selected classrooms are included in the final sample. Class samples are therefore nationally representative and all relevant students were surveyed. The information collected on the sample frame allows the results of the surveys to be expanded to the general student population in the selected grades by using an expansion factor.
Data Collection
Data is collected from the sample of students by applying a pre-coded, self-administered questionnaire that has a core standard section to ensure the comparability discussed earlier. Survey leaders in individual countries are free to add modules to explore issues of interest to them. To ensure the quality as well as the anonymity of responses, SIDUC recommends that data collection occurs in surroundings familiar to the students—which in all cases was their classrooms—and with minimal or no involvement of teachers in the administration of the questionnaire. This type of fieldwork requires a well-trained team of persons for implementation, particularly since, this group of persons serve as the main point of contact with the student. The team usually consists of a project leader, supervisors, and facilitators—each with a clearly articulated set of responsibilities. The questionnaire consists of a standard set of questions that are arranged as follows:
• Basic socio-demographic information • Beliefs about future academic performance • Discipline and academic problems • Opinion on harms associated with the consumption of drugs • Prevalence of substance use and patterns of consumption • Incidence of substance use • Frequency of use

A Report on Students’ Drug Use in 13 Caribbean Countries 2016
Page |20
Data Entry and Analysis
The data from these studies was transcribed using a customized Microsoft Excel spreadsheet that was formatted to allow double entry for cleaning and verification. This data is then imported into SPSS1 for processing using univariate and bi-variate analysis. Because of differences in the age and gender distribution from country to country, a statistical adjustment was made using a direct standardization method so that the prevalence, incidence and other estimates can be directly compared. As a result of these adjustments, there will be slight differences between the numbers and results reported in individual country reports and those reported in this comparative analysis.
Definitions of Terms
Throughout this report certain terms have been used to describe the prevalence of substance use. These definitions are:
• Never - those who had never used the substance. • Lifetime prevalence - those who had used the substance at least once anytime in the
past. • Last year or past year prevalence - those who had used the substance in the past
year before the survey administration. • Last month prevalence or past month - those who had used the substance in the
previous month (also referred to as current use prevalence).
Statistical Data Analysis
This type of study is aimed at determining the general magnitude of substance use in specific populations and at learning about the variables that are related to this drug use. To this end, the entire series of statistical analyses as described in the revised (2011) SIDUC Protocol for Survey of Secondary School Students are used during the data analysis and reporting of findings.
1 Statistical Package for the Social Sciences

A Report on Students’ Drug Use in 13 Caribbean Countries 2016
Page |21
CHAPTER 2
Results
Description of Sample The samples of students taken in the individual countries yielded an overall total of 25,917 students, all of which are included in this comparative analysis. Weighting resulted in a represented population size of 614,859 nationally represented students across the region. The largest individual sample was taken in Trinidad and Tobago (4,176 students) while the smallest was taken in St. Kitts and Nevis (613). For the most part, all other country sample sizes were close to or above recommended amounts of students based on the standardized methodology. It should be noted that the samples for Dominica and The Bahamas were un-weighted in the analysis.
TABLE 1: SAMPLE SIZES AND DISTRIBUTION OF STUDENTS BY GENDER
Country Sample Size
Weighted Population
Percentage Distribution of Sample by Gender Males Females
Antigua and Barbuda 851 4417 50.4 49.6 Barbados 1339 8538 40.0 56.2 The Bahamas 2730 2730 48.8 51.2 Belize 1943 11053 48.9 51.1 Dominica 2222 2222 53.6 45.1 Grenada 1490 6655 48.2 51.8 Guyana 1222 36196 40.1 59.9 Haiti 3448 332241 47.2 52.8 Jamaica 3365 139701 42.6 57.4 St. Kitts and Nevis 613 2614 48.5 51.5 St. Lucia 1314 8749 46.6 53.4 St. Vincent and the Grenadines 1204 5643 43.3 56.7 Trinidad and Tobago 4176 54100 47.5 52.7 Total 25917 614859 46.6 53.3
The data in table 1 show the sample sizes and the represented population in each of the thirteen countries along with the gender distribution of the sample. It is evident that the gender distribution varied from country to country, and because of this, a statistical adjustment was made to correct this problem in an effort to increase both the accuracy of the calculation of prevalence and other estimates and the comparability of the results. The largest differences with respect to gender were reflected in the data from Barbados, Guyana, Jamaica and St. Vincent and the Grenadines where more than 56% of respondents were females. The distribution is shown below in figure 1.

A Report on Students’ Drug Use in 13 Caribbean Countries 2016
Page |22
Table 2 and figure 2 show the distribution of the sample by age categories. The age categories are used in this way to make the SIDUC survey results comparable with those from other regions such as those in Europe. It is clear that the age distribution is uneven from country to country and from age group to age group. The overall distribution showed that just over a third were 14 years or less (34%), about four of every ten (39.6%) were 15-16 years and about one-fifth (22%) were 17 years and older. Notable differences were seen in Haiti where six of every ten students were 17 years and over, and in Belize where a third were 17 years and over.
TABLE 2: DISTRIBUTION OF SAMPLE BY AGE GROUP
Country Distribution of Sample by Age Group 14 or less 15 – 16 17 or more Antigua and Barbuda 27.1 47.1 19.5 Barbados 43.5 35.5 15.2 The Bahamas 50.7 32.2 17.1 Belize 28.5 38.3 33.0 Dominica 32.6 41.4 22.5 Grenada 29.9 42.1 17.8 Guyana 36.8 47.1 11.5 Haiti 12.6 19.0 60.6 Jamaica 31.7 44.0 20.0 St. Kitts and Nevis 34.6 42.0 14.4 St. Lucia 34.5 46.3 12.2 St. Vincent and the Grenadines 38.9 38.5 22.6 Trinidad and Tobago 34.7 41.0 19.8 Average 33.5 39.6 22.0
0
20
40
60
Figure 1: Distribution of Sample by Gender
males females

A Report on Students’ Drug Use in 13 Caribbean Countries 2016
Page |23
010203040506070
Figure 2: Distribution of Sample by Age Grouping
14 or less 15 – 16 17 or more

A Report on Students’ Drug Use in 13 Caribbean Countries 2016
Page |24
Alcohol
Prevalence
Table 3 and figure 3 show the prevalence of alcohol use in each country. The overall average lifetime prevalence was 67.9% and ranged from a low of 54% in Guyana to 81.1% in Dominica. Prevalence of use in the past year ranges from a low of 32.8% in Guyana to a high of 59.2% in Dominica.
TABLE 3: PREVALENCE OF ALCOHOL USE
Country Lifetime
Prevalence Past Year Prevalence
Past Month Prevalence
Antigua and Barbuda 71.1 56.0 36.2 The Bahamas 67.4 46.0 27.5 Barbados 71.2 56.3 32.8 Belize 65.1 47.6 32.2 Dominica 81.2 59.2 36.3 Grenada 72.0 54.7 35.0 Guyana 54.0 32.8 16.5 Haiti 56.6 35.4 23.0 Jamaica 65.0 45.0 24.1 St. Kitts and Nevis 65.5 44.5 25.9 St. Lucia 74.8 57.2 39.9 St. Vincent and the Grenadines 71.9 58.4 46.9 Trinidad and Tobago 66.9 49.4 27.6 Average 67.9 49.4 31.1
The results for past month prevalence (or current use) mimic the past year prevalence results. Here again, Guyana has the lowest prevalence (16.5%) and St. Vincent and the Grenadines has the highest with 46.9%. Almost half of the countries surveyed (6 of 13) reported past month prevalence well below the average—these include The Bahamas , Guyana, Haiti, Jamaica, St. Kitts and Nevis and Trinidad and Tobago. All other countries past month prevalence was below 40% with the exception of St. Vincent and the Grenadines as previously indicated.

A Report on Students’ Drug Use in 13 Caribbean Countries 2016
Page |25
Alcohol Prevalence by Gender
Table 4 (in appendix) and figure 4 below show that in the majority of countries there appears to be the expected pattern where alcohol prevalence among males is higher than that among females. However, a surprising number of countries have results that show higher past month prevalence rates for females than that of males. Some 4 of 13 countries had higher past month prevalence among females—Antigua and Barbuda, The Bahamas, Dominica, St. Lucia, and Trinidad and Tobago.
0102030405060708090
Figure 3: Lifetime, Past Year and Past Month Prevalence of Alcohol Use
Lifetime Past Year Past Month

A Report on Students’ Drug Use in 13 Caribbean Countries 2016
Page |26
Alcohol Prevalence by Age Group
The results (table 5 in appendix and figure 5 below) show that there is a positive relationship between age and prevalence of alcohol use in all of the countries surveyed. As age increased, the prevalence of alcohol use also increased resulting in higher prevalence among the older students. It is interesting to note that the differences in past year prevalence between the age groups are more pronounced between the youngest cohort (14 or less) and the middle cohort (15–16 years). Dominica and Haiti are the only two countries that do not strictly follow the same pattern as the other countries. For Dominica, the past month prevalence of alcohol use of the 17 years and older cohort is less than the 15-16 years old cohort (32.3% versus 43.9%). For Haiti, the past month prevalence for the 15-16 years old cohort is less than that of the 17 years and older cohort (18.2% vs 24.8%). In the case of Jamaica, the two older cohorts report almost the same past month prevalence (28.5 vs 28.8%). Otherwise, the pattern remains consistent.
0.0
10.0
20.0
30.0
40.0
50.0
60.0
70.0
Figure 4: Past Month Alcohol Prevalence by Gender
Males
Females
A Report on Students’ Drug Use in 13 Caribbean Countries 2016
Page |27
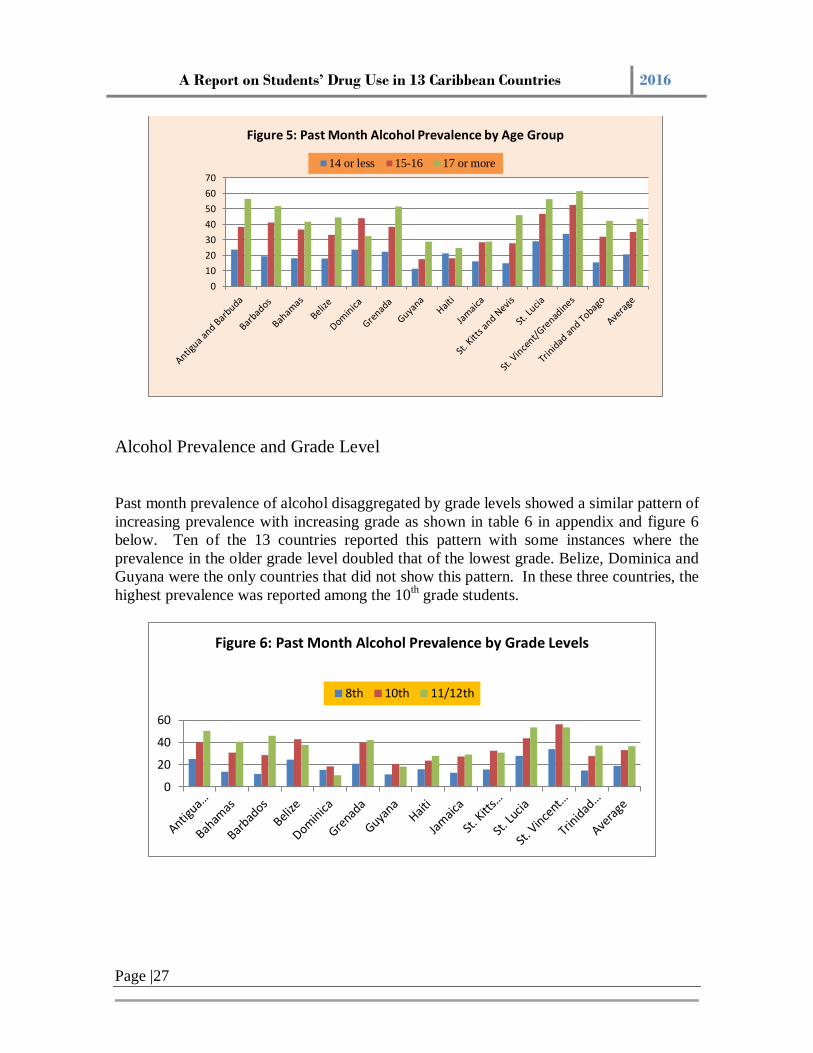
Alcohol Prevalence and Grade Level
Past month prevalence of alcohol disaggregated by grade levels showed a similar pattern of increasing prevalence with increasing grade as shown in table 6 in appendix and figure 6 below. Ten of the 13 countries reported this pattern with some instances where the prevalence in the older grade level doubled that of the lowest grade. Belize, Dominica and Guyana were the only countries that did not show this pattern. In these three countries, the highest prevalence was reported among the 10th grade students.
010203040506070
Figure 5: Past Month Alcohol Prevalence by Age Group
14 or less 15-16 17 or more
0
20
40
60
Figure 6: Past Month Alcohol Prevalence by Grade Levels
8th 10th 11/12th

A Report on Students’ Drug Use in 13 Caribbean Countries 2016
Page |28
Incidence2 Table 7 and figure 7, present the estimated incidence rate for each country and disaggregated by gender. In St. Lucia for example, the probability that a student consumed alcohol for the first time during the one-year period before the survey was estimated to be 55.2%, while in Dominica and St. Vincent and the Grenadines and Grenada the corresponding rates were relatively high at 60.2%, 54.2% and 50.2% respectively. Estimated past year incidence rates for all other countries were below 50% and ranged from 28.3% in Guyana to 47% in Antigua and Barbuda. The average one-year incidence rate for the entire group of countries was 44.8%. It is very interesting to note that the probability that a student in Guyana will initiate the use of alcohol during a one year period (28.3%) was almost half that of a student in St. Lucia (55.2%) or Dominica (60.2%). Incidence rates among females were generally higher and this was the case for 10 of the 13 countries. The overall average among females was 46.1% compared to 43.7% among males.
TABLE 7: PAST YEAR ALCOHOL INCIDENCE
Country Estimate
Males Females
Antigua and Barbuda 47.0 46.2 47.5 The Bahamas 45.7 44.3 51.0 Barbados 43.1 40.8 49.1 Belize 43.3 43.8 42.8 Dominica 60.2 53.0 58.2 Grenada 50.2 46.6 54.2 Guyana 28.3 31.4 26.5 Haiti 32.8 41.0 26.1 Jamaica 40.1 37.7 42.4 St. Kitts and Nevis 41.0 39.0 43.2 St. Lucia 55.2 52.3 58.3 St. Vincent and the Grenadines 54.2 51.3 56.3 Trinidad and Tobago 41.1 40.4 43.3 Average 44.8 43.7 46.1
2 The incidence measure in this report refers to the cumulative incidence, which for our purposes provides an estimate of the probability that a student will consume alcohol for the first time during a typical one year period.

A Report on Students’ Drug Use in 13 Caribbean Countries 2016
Page |29
Age of First Use of Alcohol
As shown in table 8 (in appendix) and figure 8 below, the average age of first use of alcohol ranged from 10.9 years old in Dominica to 13.7 years old in Haiti. Most of the countries’ results indicate an average age of first use of just over 12 years of age (The Bahamas, Barbados, Dominica, and St. Kitts and Nevis being notable exceptions). The mean age of first use of alcohol across the countries surveyed was 12.2 years. For males this was 11.9 years compared to 12.4 years for females. Dominica reported the earliest age of first use among both males and females (10.5 years and 11.3 years respectively. Among females, the latest age of initiation was reported in Haiti (13.9 years and 13.6 years female and male respectively).
0
10
20
30
40
50
60
70
Figure 7: Past Year Alcohol Incidence by Gender
Country Estimate Males Females

A Report on Students’ Drug Use in 13 Caribbean Countries 2016
Page |30
Alcohol and Behavioral Problems
Table 9 (in appendix) and figure 9 below show the relationship between past-year and past month prevalence of alcohol use and behavioral problems. Students were asked about the number of disciplinary or behavioral problems that they have experienced during their school years and the responses were categorized as ‘none’, ‘once’, ‘few times’ and ‘often’. The results indicate that there is a consistent positive relationship between past year prevalence and behavioral problems. This relationship is such that as the number of behavioral problems increase so too does prevalence of alcohol use. The average difference in past year prevalence overall between those who never had a behavioral problem and those who often had behavioral problems was 31.8 percentage points. The difference between these two groups ranged from a low of 15.3 percentage points in Dominica to a high of 49.7 percentage points in Antigua and Barbuda and 46.9 percentage points in Belize. However, all other countries differences ranged between 21 and 39.2 percentage points.
0.0
2.0
4.0
6.0
8.0
10.0
12.0
14.0
Figure 8: Age of First Use of Alcohol
Country Average males females

A Report on Students’ Drug Use in 13 Caribbean Countries 2016
Page |31
For past month use however, there was also a consistent pattern of increased prevalence as the number of behavioral problems increased. Differences in past month prevalence ranged from a low of 11.4 percentage points in Dominica to a high of 60.7 percentage points in Antigua and Barbuda.
Binge Drinking3
The results indicate that binge drinking among current users of alcohol (i.e. those who consumed in the last 30 days) was high. Proportions ranged from a low of 14.2% in The Bahamas to a high of 59.5% in Guyana (see Table 10 and figure 10). Reported levels indicate that Antigua and Barbuda, Belize, Guyana, St. Lucia and St. Vincent and the Grenadines are the countries where more than 40% of current drinkers were binge drinkers. Eight countries reported lower levels of binge drinking all below 36.8% (the overall average)—Trinidad and Tobago, Jamaica, St. Kitts and Nevis, Haiti, Grenada, Dominica, Barbados and The Bahamas.
3 Binge drinking is defined as the consumption of five or more drinks in one sitting at least once in the previous 2 weeks. Heavy binge drinking is defined as four or more binge drinking episodes in 2 weeks.
0
10
20
30
40
50
60
70
80
90
Figure 9: Past Month Alcohol Use and Behavioural Problems
Never Once Few Times Often

A Report on Students’ Drug Use in 13 Caribbean Countries 2016
Page |32
The pattern among countries changed in relation to heavy binge drinking. Guyana (17.1%) and Belize (13.6%) are the countries with the highest prevalence of heavy binge drinking among current drinkers. The Bahamas (3.9%), Haiti (5.7%) and Dominica (6.6%) are the countries with the lowest rates. The Bahamas reported the lowest levels of both binge drinking and heavy binge drinking while at the other extreme, Guyana reported the highest rates for both heavy binge drinking and binge drinking.
TABLE 10: PREVALENCE OF BINGE DRINKING BY COUNTRY
Country Binge Drinking: Percentage of Current Drinkers Consuming 5 or
More Alcoholic Drinks in the Past 2 Weeks Never Once 2- 3
times 4 – 5 times
More than 5 times
Cumulative proportion
of binge Antigua and Barbuda 59.5 17.8 13.2 2.1 7.5 40.6 The Bahamas 84.9 5.7 4.6 2.1 1.8 15.1 Barbados 67.1 14.8 10.8 3.0 4.3 32.9 Belize 48.0 21.9 16.4 6.4 7.2 51.9 Dominica 75.5 8.1 9.8 1.9 4.7 24.5 Grenada 64.0 13.2 13.1 3.6 6.0 35.9 Guyana 40.5 25.4 16.9 6.1 11.0 59.5 Haiti 72.9 13.6 7.8 1.8 3.9 27.1 Jamaica 65.5 14.9 11.7 2.4 5.4 34.4 St. Kitts and Nevis 66.9 17.1 8.0 1.7 6.3 33.1 St. Lucia 58.1 23.1 11.8 1.4 5.6 41.9 St. Vincent and the Grenadines 54.2 23.6 14.5 2.7 4.9 45.8 Trinidad and Tobago 63.5 16.9 11.9 2.5 5.2 36.5 Average 63.1 16.6 11.6 2.9 5.7 36.8
05
1015202530354045505560
Figure 10: Binge Drinking and Heavy Binge Drinking binge heavy binge

A Report on Students’ Drug Use in 13 Caribbean Countries 2016
Page |33
Perception of Harm Getting Drunk – On average, just over half of the students (57.3%) felt that getting drunk was very harmful. Countries reporting moderately low perception that this was very harmful were Antigua and Barbuda, Grenada, Barbados and St. Kitts and Nevis.
Figure 11: Perception of Harm – Getting Drunk
TREND ANALYSIS - ALCOHOL The 2013 survey showed a slight decline in overall past year prevalence over the 2010 report, (49.4% vs. 51%), figure 12. This was also observed for overall past month average prevalence—a decline of 6 points (31% in 2013 compared to 37% in 2010). None of the countries in the 2013 survey were classified as high prevalence (>60% of use) compared to three countries being so classified in 2010.
464850525456586062

A Report on Students’ Drug Use in 13 Caribbean Countries 2016
Page |34
TABLE 11: COMPARISON OF PAST MONTH ALCOHOL PREVALENCE
Country Past Month Prevalence
(2010)
Past Month Prevalence
(2013)
Percentage point change
Antigua and Barbuda 31.3 36.2 + 4.9 Barbados 34.5 32.8 - 1.7 Dominica 51.6 36.3 - 15.3 Grenada 39.6 35.0 - 4.6 Guyana 36.8 16.5 - 20.3 Haiti 18.3 23.0 + 4.7 Jamaica 33.4 24.1 - 9.3 St. Kitts and Nevis 30.0 25.9 - 4.1 St. Lucia 61.9 39.9 - 22.0 St. Vincent and the Grenadines 33.2 46.9 + 13.7 Trinidad and Tobago 48.2 27.6 - 20.6
When past month alcohol prevalence in the 2013 survey was compared to the 2010 report (table 11), only three countries showed an increase in prevalence at the country level—notable among these countries was St. Vincent and the Grenadines with a 13.7 pp increase. In terms of decreased prevalence, notable among countries was St. Lucia (22 pp decrease), Trinidad and Tobago (20.6pp decrease) and Guyana (20.3pp decrease). In 2013, some 9 of 13 countries reported higher lifetime and past year prevalence among females as well as 31% higher past month prevalence. This compares to 33% for lifetime and past year, and 16% past month in 2010. As seen in the 2010 report, differences in past year prevalence between age grouping was more pronounced among the youngest cohort (14 years or less) and the middle cohort (15-16 years). Jamaica was the exception in the 2010 report. However, in 2013, the exceptions were Dominica and Haiti. Overall past year prevalence showed a 7pp decrease
0.0
20.0
40.0
60.0
80.0
lifetime past year past month
Figure 12: Comparison of Alcohol Use - Overall Prevalence
2013 2010

A Report on Students’ Drug Use in 13 Caribbean Countries 2016
Page |35
among those 14 years or less, 3pp for those 15-16 years and 3pp for those 17 year and older. Overall past year incidence was 4pp lower in 2013 compared to 2010 (44.8% vs. 48.8%). However, past month prevalence was marginally higher in 2013 compared to 2010 (28.4% vs. 27.4%). Age of first use of alcohol ranged from 10.9 years to 13.7 years in 2013. This compares to 11 years - 13.3 years in 2010. The overall average age of first use for males was about the same in both periods, but for females there was a slightly higher age of first use in 2013 (12.4 years vs. 11.8 years).
Binge drinking (five or more drinks in a row in the previous 2 weeks) was equally high among students in 2013 (from a low of 14.2% to a high of 59.5% when compared to 2010 (from a low of 25.6% to a high of 51%). On average 36.8% of students among all countries reported binge drinking in 2013, whereas 31.5 percent had reported the practice in 2010. The pattern among countries changed in relation to heavy binge drinking: only one country reported a rate above 10% in 2013, Guyana (17.1%). This compares to four countries in 2010 with rates above 10%—Dominica (14.8%), Barbados (13.1%), Jamaica (10.8%) and St. Vincent and the Grenadines (10.2%). Figure 13 compares heavy binge drinking among countries that had comparable data for both reporting periods. Seven of the nine countries compared reported higher rate of heavy binge drinking in the 2010 report than in this 2013 survey.
02468
1012141618
Antiguaand
Barbuda
Barbados Dominica Guyana Jamaica St. Kittsand Nevis
St. Lucia St. Vincentand the
Grenadines
Trinidadand
Tobago
Figure 13: Comparison of Heavy Binge Drinking Among Countries
2013 survey 2010 report
A Report on Students’ Drug Use in 13 Caribbean Countries 2016
Page |36
Cigarettes
Cigarette Prevalence
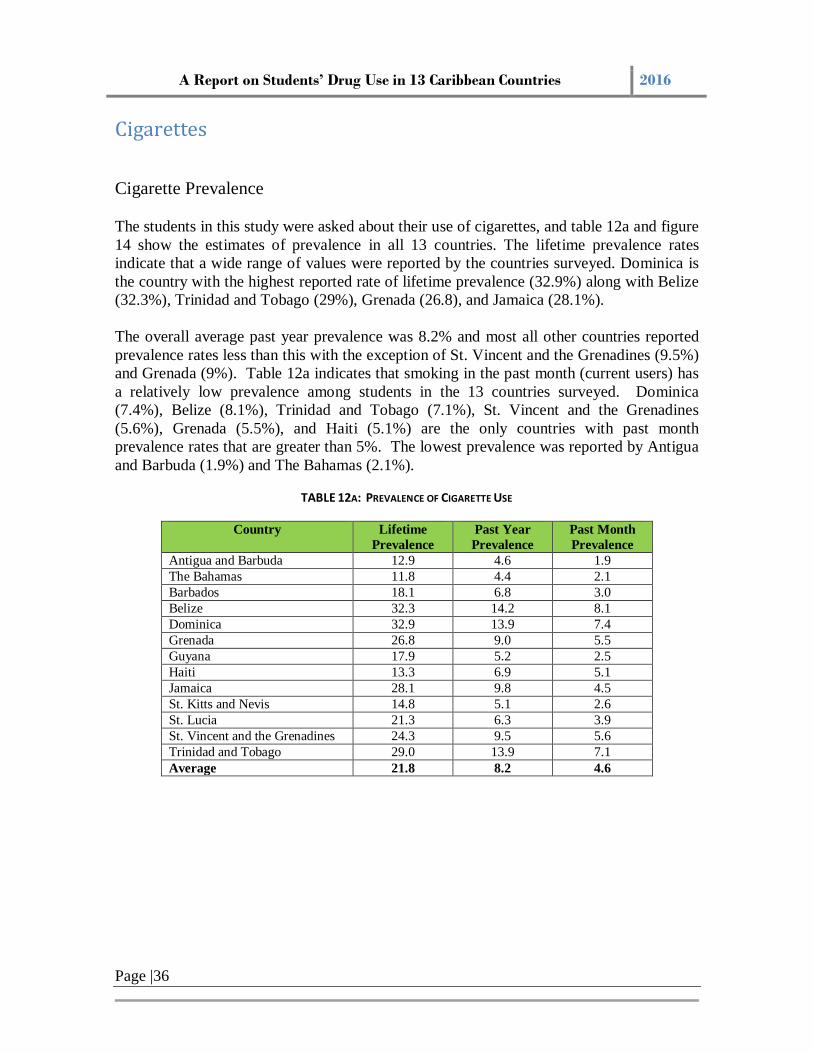
The students in this study were asked about their use of cigarettes, and table 12a and figure 14 show the estimates of prevalence in all 13 countries. The lifetime prevalence rates indicate that a wide range of values were reported by the countries surveyed. Dominica is the country with the highest reported rate of lifetime prevalence (32.9%) along with Belize (32.3%), Trinidad and Tobago (29%), Grenada (26.8), and Jamaica (28.1%). The overall average past year prevalence was 8.2% and most all other countries reported prevalence rates less than this with the exception of St. Vincent and the Grenadines (9.5%) and Grenada (9%). Table 12a indicates that smoking in the past month (current users) has a relatively low prevalence among students in the 13 countries surveyed. Dominica (7.4%), Belize (8.1%), Trinidad and Tobago (7.1%), St. Vincent and the Grenadines (5.6%), Grenada (5.5%), and Haiti (5.1%) are the only countries with past month prevalence rates that are greater than 5%. The lowest prevalence was reported by Antigua and Barbuda (1.9%) and The Bahamas (2.1%).
TABLE 12A: PREVALENCE OF CIGARETTE USE
Country Lifetime
Prevalence Past Year Prevalence
Past Month Prevalence
Antigua and Barbuda 12.9 4.6 1.9 The Bahamas 11.8 4.4 2.1 Barbados 18.1 6.8 3.0 Belize 32.3 14.2 8.1 Dominica 32.9 13.9 7.4 Grenada 26.8 9.0 5.5 Guyana 17.9 5.2 2.5 Haiti 13.3 6.9 5.1 Jamaica 28.1 9.8 4.5 St. Kitts and Nevis 14.8 5.1 2.6 St. Lucia 21.3 6.3 3.9 St. Vincent and the Grenadines 24.3 9.5 5.6 Trinidad and Tobago 29.0 13.9 7.1 Average 21.8 8.2 4.6

A Report on Students’ Drug Use in 13 Caribbean Countries 2016
Page |37
Cigarette Use and Gender
Past year prevalence among males and females showed similar patterns to lifetime prevalence. A notable difference was Antigua and Barbuda, where females reported a marginally higher prevalence than males (4.9% vs 4.3%). Countries where males report low prevalence are Antigua and Barbuda and The Bahamas and those for females are St. Kitts and Nevis, St. Lucia, Guyana and The Bahamas. Females in all these countries reported past year prevalence below 4%. Table 12b (in appendix) and figure 15 show the past month prevalence of cigarette use among males and females. In some of the countries it appears that the overall prevalence rates are largely driven by males. For example, in Guyana, Grenada, Belize, St. Kitts and Nevis, St. Lucia and Trinidad and Tobago the prevalence rates of male students are more than twice that of female students. In all other countries except Antigua and Barbuda, there is also a gender disparity, though less pronounced, that shows more males reporting current use than females. Antigua and Barbuda on the other hand is the only country where there appears to be a higher proportion of female students (2.6%) than male students (1.2%) reporting past month cigarette use. The overall average past month prevalence among countries for males was 6.1% and among females 3.2%.
0
5
10
15
20
25
30
35
Figure 14: Prevalence of Tobacco (Cigarette) Use
lifetime past year past month

A Report on Students’ Drug Use in 13 Caribbean Countries 2016
Page |38
Cigarette Use and Age
Table 13 (in appendix) and figure 16 show that students in the older age groups report higher rates of cigarette use. Eleven of the 13 countries showed this pattern of increasing past month use as age increased. Prevalence rates reported by the students in the 14 or less age group, in most cases, were less than half of the rates of the 17 and over age group. For past month prevalence, students in the 15-16 years age group in Antigua and Barbuda, Barbados and Jamaica reported slightly higher prevalence compared to those in the other two age cohorts.
0
2
4
6
8
10
12
Figure 15: Past Month Prevalence of Cigarettes by Gender
male female
A Report on Students’ Drug Use in 13 Caribbean Countries 2016
Page |39
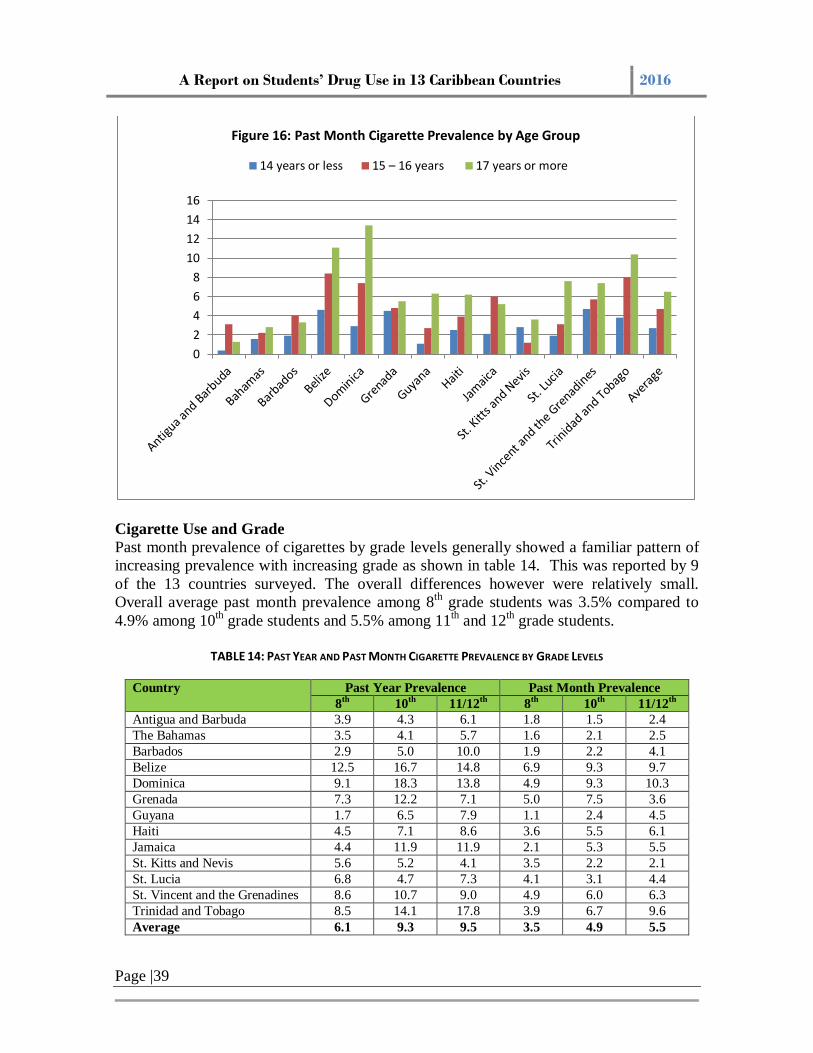
Cigarette Use and Grade Past month prevalence of cigarettes by grade levels generally showed a familiar pattern of increasing prevalence with increasing grade as shown in table 14. This was reported by 9 of the 13 countries surveyed. The overall differences however were relatively small. Overall average past month prevalence among 8th grade students was 3.5% compared to 4.9% among 10th grade students and 5.5% among 11th and 12th grade students.
TABLE 14: PAST YEAR AND PAST MONTH CIGARETTE PREVALENCE BY GRADE LEVELS
Country Past Year Prevalence Past Month Prevalence 8th 10th 11/12th 8th 10th 11/12th
Antigua and Barbuda 3.9 4.3 6.1 1.8 1.5 2.4 The Bahamas 3.5 4.1 5.7 1.6 2.1 2.5 Barbados 2.9 5.0 10.0 1.9 2.2 4.1 Belize 12.5 16.7 14.8 6.9 9.3 9.7 Dominica 9.1 18.3 13.8 4.9 9.3 10.3 Grenada 7.3 12.2 7.1 5.0 7.5 3.6 Guyana 1.7 6.5 7.9 1.1 2.4 4.5 Haiti 4.5 7.1 8.6 3.6 5.5 6.1 Jamaica 4.4 11.9 11.9 2.1 5.3 5.5 St. Kitts and Nevis 5.6 5.2 4.1 3.5 2.2 2.1 St. Lucia 6.8 4.7 7.3 4.1 3.1 4.4 St. Vincent and the Grenadines 8.6 10.7 9.0 4.9 6.0 6.3 Trinidad and Tobago 8.5 14.1 17.8 3.9 6.7 9.6 Average 6.1 9.3 9.5 3.5 4.9 5.5
02468
10121416
Figure 16: Past Month Cigarette Prevalence by Age Group
14 years or less 15 – 16 years 17 years or more
A Report on Students’ Drug Use in 13 Caribbean Countries 2016
Page |40
Incidence
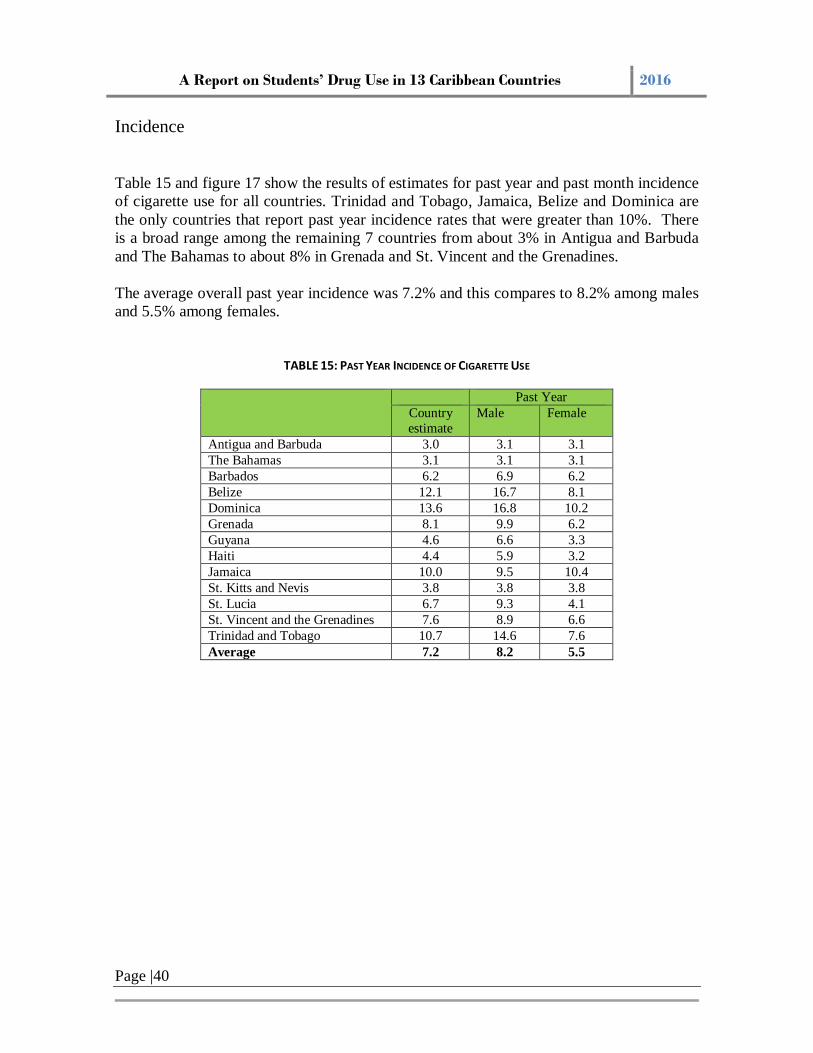
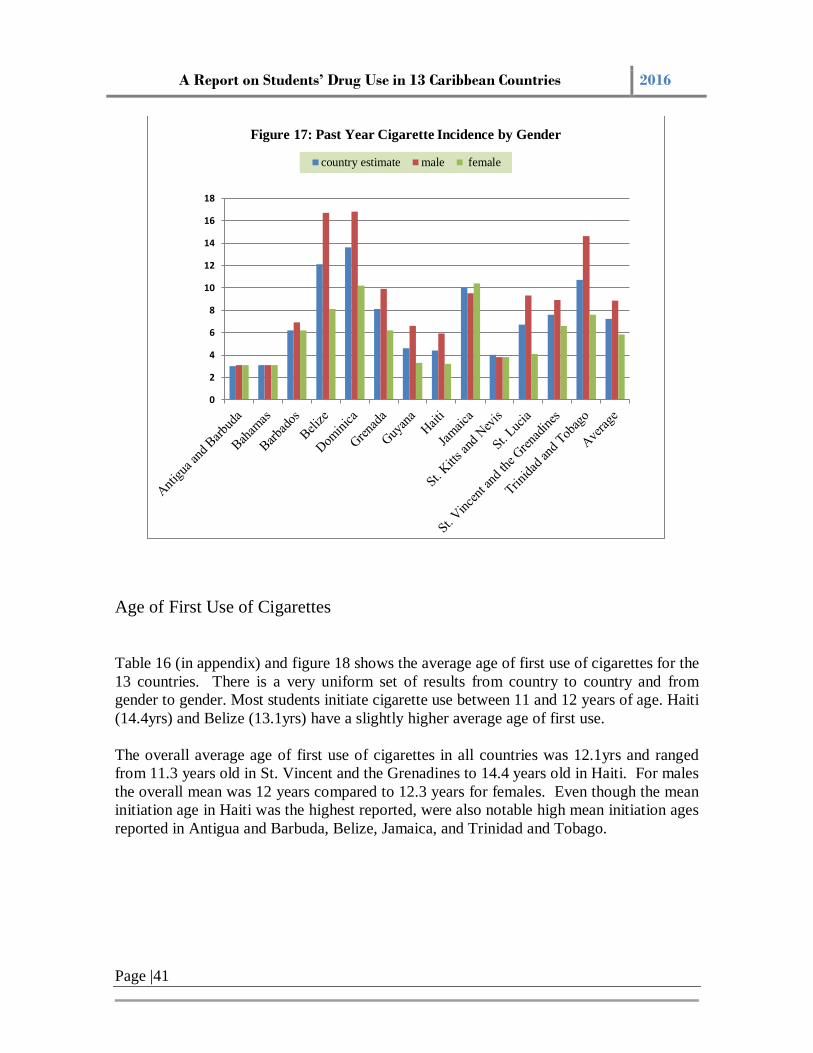
Table 15 and figure 17 show the results of estimates for past year and past month incidence of cigarette use for all countries. Trinidad and Tobago, Jamaica, Belize and Dominica are the only countries that report past year incidence rates that were greater than 10%. There is a broad range among the remaining 7 countries from about 3% in Antigua and Barbuda and The Bahamas to about 8% in Grenada and St. Vincent and the Grenadines. The average overall past year incidence was 7.2% and this compares to 8.2% among males and 5.5% among females.
TABLE 15: PAST YEAR INCIDENCE OF CIGARETTE USE
Past Year Country estimate
Male Female
Antigua and Barbuda 3.0 3.1 3.1 The Bahamas 3.1 3.1 3.1 Barbados 6.2 6.9 6.2 Belize 12.1 16.7 8.1 Dominica 13.6 16.8 10.2 Grenada 8.1 9.9 6.2 Guyana 4.6 6.6 3.3 Haiti 4.4 5.9 3.2 Jamaica 10.0 9.5 10.4 St. Kitts and Nevis 3.8 3.8 3.8 St. Lucia 6.7 9.3 4.1 St. Vincent and the Grenadines 7.6 8.9 6.6 Trinidad and Tobago 10.7 14.6 7.6 Average 7.2 8.2 5.5
A Report on Students’ Drug Use in 13 Caribbean Countries 2016
Page |41
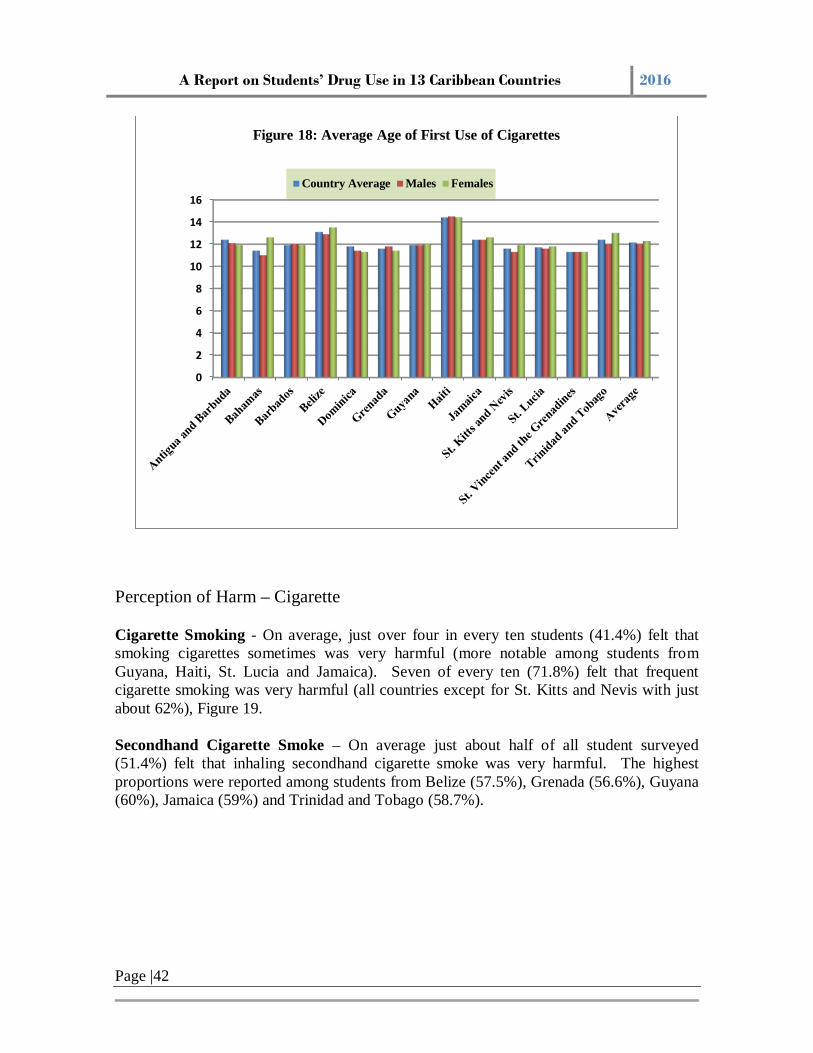
Age of First Use of Cigarettes
Table 16 (in appendix) and figure 18 shows the average age of first use of cigarettes for the 13 countries. There is a very uniform set of results from country to country and from gender to gender. Most students initiate cigarette use between 11 and 12 years of age. Haiti (14.4yrs) and Belize (13.1yrs) have a slightly higher average age of first use. The overall average age of first use of cigarettes in all countries was 12.1yrs and ranged from 11.3 years old in St. Vincent and the Grenadines to 14.4 years old in Haiti. For males the overall mean was 12 years compared to 12.3 years for females. Even though the mean initiation age in Haiti was the highest reported, were also notable high mean initiation ages reported in Antigua and Barbuda, Belize, Jamaica, and Trinidad and Tobago.
0
2
4
6
8
10
12
14
16
18
Figure 17: Past Year Cigarette Incidence by Gender
country estimate male female
A Report on Students’ Drug Use in 13 Caribbean Countries 2016
Page |42
Perception of Harm – Cigarette
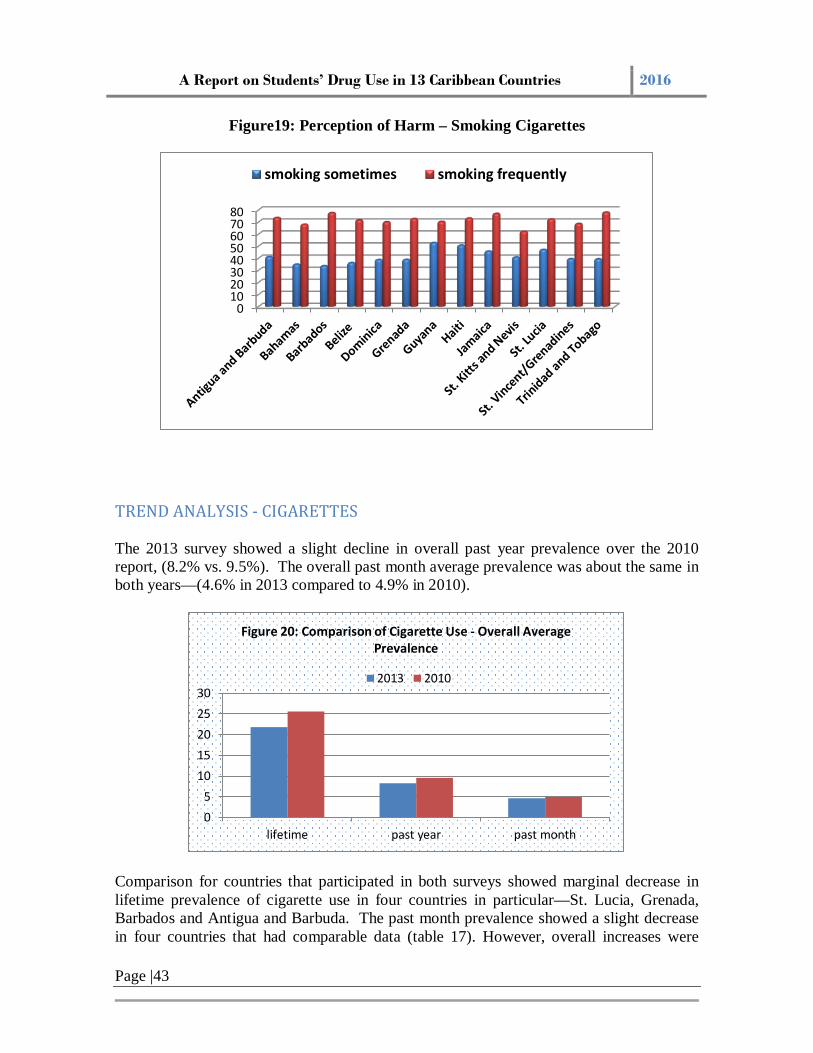
Cigarette Smoking - On average, just over four in every ten students (41.4%) felt that smoking cigarettes sometimes was very harmful (more notable among students from Guyana, Haiti, St. Lucia and Jamaica). Seven of every ten (71.8%) felt that frequent cigarette smoking was very harmful (all countries except for St. Kitts and Nevis with just about 62%), Figure 19.
Secondhand Cigarette Smoke – On average just about half of all student surveyed (51.4%) felt that inhaling secondhand cigarette smoke was very harmful. The highest proportions were reported among students from Belize (57.5%), Grenada (56.6%), Guyana (60%), Jamaica (59%) and Trinidad and Tobago (58.7%).
0
2
4
6
8
10
12
14
16
Figure 18: Average Age of First Use of Cigarettes
Country Average Males Females
A Report on Students’ Drug Use in 13 Caribbean Countries 2016
Page |43
Figure19: Perception of Harm – Smoking Cigarettes
TREND ANALYSIS - CIGARETTES The 2013 survey showed a slight decline in overall past year prevalence over the 2010 report, (8.2% vs. 9.5%). The overall past month average prevalence was about the same in both years—(4.6% in 2013 compared to 4.9% in 2010).
Comparison for countries that participated in both surveys showed marginal decrease in lifetime prevalence of cigarette use in four countries in particular—St. Lucia, Grenada, Barbados and Antigua and Barbuda. The past month prevalence showed a slight decrease in four countries that had comparable data (table 17). However, overall increases were
01020304050607080
smoking sometimes smoking frequently
05
1015202530
lifetime past year past month
Figure 20: Comparison of Cigarette Use - Overall Average Prevalence
2013 2010

A Report on Students’ Drug Use in 13 Caribbean Countries 2016
Page |44
small (from less than one percentage point (Antigua and Barbuda, Jamaica and, St. Kitts and Nevis) to 3.6pp (Haiti).
TABLE 17: COMPARISON OF PAST MONTH PREVALENCE OF CIGARETTE USE
Country Past Month Prevalence (2013)
Past Month Prevalence (2010)
Percentage point change
Antigua and Barbuda 1.9 1.8 + 0.1 Barbados 3.0 3.7 - 0.7 Dominica 7.4 7.8 - 0.4 Grenada 5.5 5.5 0.0 Guyana 2.5 4.1 - 1.6 Haiti 5.1 1.5 + 3.6 Jamaica 4.5 4.4 + 0.1 St. Kitts and Nevis 2.6 1.9 + 0.7 St. Lucia 3.9 5.9 - 2.0 St. Vincent and the Grenadines 5.6 2.7 + 2.9 Trinidad and Tobago 7.1 5.6 + 1.5
In 2013, past year prevalence among females was above 6% (overall average among all countries) for five countries and above 10% for males in six countries. This compares to seven countries with average prevalence above 6% for females and five countries for males in the 2010 report. For the most part, differences in past year prevalence between age grouping was more pronounced among the oldest cohort (17 years and older) except for a few countries (Antigua and Barbuda, Grenada and Jamaica). Antigua and Barbuda and Trinidad and Tobago were the two exceptions in the 2010 report. The overall average past year prevalence in 2013 showed a notable 7pp decrease among those in the 15-16 years cohort but only a marginal 2pp for those 17 year and older. Overall past year incidence were similar for both periods. In addition, five countries report average overall past year incidence above 8% in 2013 as well as in 2010. Interestingly at least three countries featured in these statistics in both periods (Dominica, Jamaica and Trinidad and Tobago). The average age of first use of cigarettes in most countries in 2013 was between the ages 11 and 12 years with Haiti at 14.4yrs being the outlier. This was the same pattern observed in the 2010 report. The overall average age of first use for males was slightly lower in 2010 (11.7yrs vs. 12.1years) but about the same for females (12.1 years in 2010 vs. 12.3 years in 2013).

A Report on Students’ Drug Use in 13 Caribbean Countries 2016
Page |45
Use of Prescription Medications without a prescription (Tranquilizers and Stimulants)
Tranquilizers (also known as sedatives and depressants) are a class of prescription drugs that are used primarily to depress the central nervous system in an effort to reduce anxiety, tension and sleep disorders. These substances can lead to dependency if used over a period of time and their abuse can lead to several negative consequences. Stimulants on the other hand are drugs that temporarily increase alertness, awareness, and physical activity. For the purposes of this study, stimulants are limited to pharmaceuticals that are usually prescribed by doctors such as amphetamines. These substances can be abused by persons who desire the feelings of euphoria that they produce. In the short and long term, the abuse of stimulants can produce heart attacks and seizures. In the longer term, abuse can lead to paranoia and increased hostility.
TABLE 19: LIFETIME, PAST YEAR AND PAST MONTH PREVALENCE OF STIMULANTS AND TRANQUILIZERS USED WITHOUT A PRESCRIPTION
Tranquilizers Stimulants
Lifetime Past Year Past Month
Lifetime Past Year
Past Month
Antigua and Barbuda 4.1 2.0 1.4 3.0 1.8 1.4 The Bahamas 3.3 2.0 0.8 2.3 1.8 1.1 Barbados 3.0 1.9 0.8 3.7 1.9 1.6 Belize 4.6 2.6 1.5 3.2 1.5 1.0 Dominica 10.4 2.7 2.0 5.9 3.7 2.9 Grenada 4.0 3.0 1.9 4.4 2.9 1.8 Guyana 3.3 1.4 1.0 2.9 1.2 1.0 Haiti 11.2 6.5 4.4 7.6 3.4 1.5 Jamaica 3.2 1.7 0.9 3.5 1.8 1.2 St. Kitts and Nevis 3.9 2.6 1.3 4.0 2.2 1.1 St. Lucia 4.9 3.1 2.0 5.1 3.5 2.6 St. Vincent and the Grenadines 2.0 1.1 0.8 3.1 2.1 1.6 Trinidad and Tobago 2.9 1.6 0.9 4.0 1.4 1.0 Average 4.7 2.5 1.5 4.1 2.2 1.5
Tranquilizers
Compared to Haiti’s and Dominica’s lifetime prevalence (11.2% and 10.4% respectively), all countries reported prevalence rates of tranquilizer use that were relatively very low (in particular past year and past month prevalence). No other country besides Haiti and Dominica reported a past year prevalence rate greater that 5%. Results for Haiti and Dominica can be seen as outliers among this group of countries. Almost one in every nine students in Haiti reported lifetime use, prevalence in the past year was 6.5%, and in the past month 4.4%.

A Report on Students’ Drug Use in 13 Caribbean Countries 2016
Page |46
Table 19 shows the lifetime, past year and past month prevalence for tranquilizers and stimulants in all countries while figure 21 following shows the results of the estimates of reported tranquilizer use.
Stimulants
This pattern repeats itself in figure 22 which shows the results of estimates of the prevalence of stimulant use in all of the countries. Haiti has the highest reported lifetime prevalence by far (7.6%) with past year and past month prevalence rates of 3.4% and 1.5% respectively. All other countries except Dominica and St. Lucia report lifetime prevalence rates of less than 5% and even lower past year and past month rates in the range of 1-3.5%.
0
2
4
6
8
10
12
Figure 21: Tranquilizer Prevalence
Lifetime year month

A Report on Students’ Drug Use in 13 Caribbean Countries 2016
Page |47
TREND ANALYSIS - NON-MEDICAL USE OF PRESCRIPTION MEDICATIONS Tranquilizers and Stimulants
Misuse and abuse (or “non-medical use”) of prescription drugs increased slightly as reported in the 2013 survey. Use of tranquilizers increased slightly over 2010 report for lifetime, past year and past month. Lifetime stimulant use also increased in 2003 but remained about the same for past year and past month. Haiti continues to report lifetime prevalence rates for both stimulants and tranquilizers that are significantly higher than all other countries.
012345678
Figure 22: Stimulant Prevalence
Lifetime year month

A Report on Students’ Drug Use in 13 Caribbean Countries 2016
Page |48
Inhalants4
Prevalence of Inhalant Use
Students in this study were asked about their use of inhalants and table 20 and figure 23 show the country by country results for lifetime, past year, and past month use. Lifetime prevalence levels for six countries—Barbados (20.3%), Grenada (16%), St. Lucia (20.6%), St. Vincent and the Grenadines (17.5%) and Trinidad and Tobago (15.5%) and Antigua and Barbuda (14.5%)—are very high when compared to the others (all <14%). The same can be said about past year and past month prevalence of inhalant use. Haiti reported the lowest lifetime prevalence rate overall and the second lowest past year and past month prevalence of all the countries.
TABLE 20: PREVALENCE OF INHALANTS USE
Country Lifetime Prevalence
Past Year Prevalence
Past Month Prevalence
Antigua and Barbuda 14.5 6.2 4.1 The Bahamas 9.5 3.7 1.5 Barbados 20.3 9.7 7.0 Belize 10.2 5.6 3.2 Dominica 9.0 5.2 3.4 Grenada 16.0 9.7 6.2 Guyana 10.8 4.2 2.8 Haiti 6.3 4.4 2.0 Jamaica 13.4 6.6 4.2 St. Kitts and Nevis 13.6 7.4 5.2 St. Lucia 20.6 11.0 6.8 St. Vincent and the Grenadines 17.5 10.6 4.1 Trinidad and Tobago 15.5 6.8 4.3 Average 13.6 7.0 4.2
The other lowest past year prevalence were reported by The Bahamas (3.7%) and Guyana (4.2%). Similarly, the other lowest past month prevalence was reported by The Bahamas (1.5%), Haiti (2.0%), Guyana (2.8%), Dominica (3.4%) and Belize (3.2%). The average past year prevalence overall was 7% and average past month prevalence overall was 4.2%. St. Lucia, St. Vincent and the Grenadines, Barbados and Grenada reported relatively high past year prevalence compared to the other countries (>9%).
4 Inhalants are breathable chemical vapors that users intentionally inhale because of the chemicals' mind-altering effects. The substances inhaled are often common household products that contain volatile solvents, aerosols, or gases.

A Report on Students’ Drug Use in 13 Caribbean Countries 2016
Page |49
Inhalant Use and Gender
The distributions for lifetime, past year and past month prevalence are shown in table 21 (in the appendix). From figure 24 it can be seen that in four countries the past-year prevalence were about even among males and females—St. Lucia, St. Kitts and Nevis, St. Vincent and the Grenadines and Dominica. In an additional five countries, females reported a higher prevalence than males—Jamaica, Trinidad and Tobago, The Bahamas, Barbados, and Antigua and Barbuda. For the remaining countries lifetime prevalence was higher among males. Differences in countries where females reported a higher prevalence ranged from 1-6pp. The past year prevalence followed the same exact pattern as lifetime prevalence with for example, Antigua and Barbuda’s past year prevalence among females showing a difference of 4.7pp and Jamaica, 2.3pp difference.
0
5
10
15
20
25
Figure 23: Prevalence of Inhalant Use
lifetime past year past month

A Report on Students’ Drug Use in 13 Caribbean Countries 2016
Page |50
Inhalant Use and Age
Figure 25 shows the past year prevalence of inhalants use by age group. Table 22 (in the appendix) presents the distribution of both the past month and past year measures by age grouping. There is no consistent pattern that clearly defines this relationship. There was no distinct positive relationship for past year prevalence. However, in six countries—Antigua and Barbuda, The Bahamas, Barbados, Belize, Dominica, and Guyana—there was a clear negative relationship in that prevalence decreased from the youngest age cohort to the oldest. In all others there was a lack of any clear relationship. Past month prevalence showed the exact pattern except in the case of St. Lucia there was a negative relationship observed.
0
2
4
6
8
10
12
Figure 24: Past Year Prevalence by Gender
Past Year Prevalence Males Past Year Prevalence Females

A Report on Students’ Drug Use in 13 Caribbean Countries 2016
Page |51
Inhalant Use and Grade
Table 23 (in the appendix) and figure 26 show the past year inhalants prevalence by grade level. There was no definitive pattern of use identified among students in the countries surveyed. The average past year prevalence among countries was highest among 10th graders (11.3%) followed by those in grade 8 (7.6%).
0
2
4
6
8
10
12
14
Figure 25: Past Year Inhalant Prevalence by Age Group
14 years or less 15 – 16 years 17 years or more

A Report on Students’ Drug Use in 13 Caribbean Countries 2016
Page |52
Incidence
Both past year and past month incidence are shown in table 24 (in the appendix). From figure 27 which shows the past year incidence rates, one notes that the rates also vary widely. In St. Vincent and the Grenadines (9.4%), St. Lucia (11.8%), Grenada (9.0%) and Barbados (10.6%), the past year incidence rates are much higher in relation to the other countries—St. Lucia being the highest among the countries in this group. Past year prevalence among both males and females was highest in St. Lucia and Barbados.
0
2
4
6
8
10
12
14
16
Figure 26: Past Year Inhalant Prevalence by Grade Level
8th 10th 11/12th

A Report on Students’ Drug Use in 13 Caribbean Countries 2016
Page |53
Age of First Use
Students in the majority of the countries surveyed generally initiate their use of inhalants between the ages of 10 and 12 (Figure 28). There does not appear to be any large differences between male and female students with respect to the age of first use. However, Barbados stands out as the country with the lowest initiation age (9.7 years average), and Haiti with the oldest (13.3 years average), table 25 (in the appendix). The mean age of first use of inhalants across the region was 11.0 years. For males the overall mean was 11.1 years compared to 11.0 years for females—very similar average initiation ages.
0.0
2.0
4.0
6.0
8.0
10.0
12.0
14.0
Figure 27: Past Year Incidence of Inhalant Use
Past Year Male Female

A Report on Students’ Drug Use in 13 Caribbean Countries 2016
Page |54
Inhalant Use and Behavioral Problems at School
Table 26 (in the appendix) presents the past year and past month prevalence of inhalant use cross tabulated by reported behavioral problems at school. There appears to be a clear relationship between use and behavioral problems. Figure 29 shows that the results from all countries except St. Kitts and Nevis, to some extent, demonstrate that there is a positive relationship between number of behavioral problems experienced by the students and past year prevalence of inhalant use. However, from country to country the differences in prevalence between the group of students with no behavior problems, those with a few problems, and those with often problems vary significantly for some and moderately for others. So while the results from country to country show a generally consistent relationship, the differences between groups vary widely. Notable high proportions of use (among those with often behavioral problems) are seen in St. Kitts and Nevis, Grenada, Belize, Barbados, and St. Vincent and the Grenadines with proportions in those countries ranging from 18-28.4% among this group of students.
0.0
2.0
4.0
6.0
8.0
10.0
12.0
14.0
Figure 28: Age of First Use for Inhalants by Gender
Country Average Males Females

A Report on Students’ Drug Use in 13 Caribbean Countries 2016
Page |55
Perception of Harm
On average, only 38.7% of students felt that inhaling solvents sometimes was very harmful. The highest proportions were in Guyana, Haiti, Jamaica and Belize. With respect to inhaling frequently, just about 58% felt this was very harmful – most notable in Antigua & Barbuda, Belize, Barbados, Jamaica, St. Lucia, and Trinidad and Tobago as shown in Figure 30.
0
5
10
15
20
25
30
Figure 29: Past Year Inhalant Use by Number of Behavioural Problems
Never Once Few Times Often

A Report on Students’ Drug Use in 13 Caribbean Countries 2016
Page |56
Figure 30: Perception of Harm – Inhaling Solvents
TREND ANALYSIS - INHALANTS The 2013 survey showed a slight increase in overall past year prevalence over the 2010 report, (7% vs. 6.2%). This was also observed for overall past month average prevalence—a marginal increase (4.2% in 2013 compared to 3.9% in 2010). Grenada, St. Lucia and St. Vincent and the Grenadines showed significant increases in past year prevalence in 2013 while Jamaica, Trinidad and Tobago and Guyana showed significant decreases, Figure 31.
0
10
20
30
40
50
60
70
solvent sometimes solvent frequently

A Report on Students’ Drug Use in 13 Caribbean Countries 2016
Page |57
In 2013, females reported a much higher lifetime and past month prevalence than males in at least six countries. This was the same pattern observed in the 2010 report. Also in 2013, the past month prevalence showed a similar pattern with slightly higher prevalence reported by females in approximately half of the countries (7 of 13). Compared to 2010, this pattern was observed in 9 of 12 countries. For the most part in both surveys, the past year prevalence as well as the past month prevalence tended to decrease as age increased. Overall average past year was similar for both survey periods (about 7% past year). Initiation of inhalant use (age of first use) was similar for both survey periods. No marked difference was observed, the mean age of first use across all countries in the 2010 report was 11.9 years and this compares to 11.0 years in 2013. The overall average age of first use for both males and females was slightly lower in 2010 (10.9 years vs. 11.1 years for males and 10.9 years vs. 11.0 years for females).
0.02.04.06.08.0
10.012.014.0
Figure 31: Comparison of Inhalant Use - Past Year Prevalence
2013 2010

A Report on Students’ Drug Use in 13 Caribbean Countries 2016
Page |58
Sniffing Inhalants to Get High
TABLE 27: PREVALENCE OF INHALANTS USE – SNIFFING INHALANTS IN ORDER TO GET HIGH
Country Country Prevalence
Gender Age grouping Male Female 14 years
or less 15 – 16 years
17 years or more
Antigua and Barbuda 6.3 4.5 8.1 6.8 7.9 3.3 Barbados 11.1 10.2 12.3 11.9 13.4 5.9 Belize 5.2 6.0 4.4 6.0 5.8 3.9 Grenada 7.6 9.0 6.1 6.7 9.2 4.1 Guyana 1.8 2.8 1.2 2.1 1.5 1.6 Haiti 3.5 4.1 3.2 4.0 2.3 3.5 Jamaica 5.3 5.2 5.4 5.6 5.0 5.6 St. Kitts and Nevis 7.2 6.8 6.7 7.8 3.6 9.3 St. Lucia 11.6 11.5 11.7 14.4 10.0 9.4 St. Vincent and the Grenadines 5.5 4.6 6.2 6.6 4.7 4.9 Trinidad and Tobago 5.8 5.7 5.9 5.7 6.6 4.6
Given the high level of prevalence of inhalant use that was reported in the 2010 report, it was decided to use the opportunity of the 2013 round of surveys to test the way that the inhalant question was constructed. Using a construct taken from other national and international surveys a second question on inhalants was included in the questionnaire which asked respondents specifically “Have you ever sniffed inhalants such as glue, whiteout, paint, thinners, etc. in order to get high?”

A Report on Students’ Drug Use in 13 Caribbean Countries 2016
Page |59
Marijuana - Ganja
Marijuana Prevalence
The results of this study indicate that in most of the participating countries, marijuana is the most widely used illegal substance. Table 29 and figure 32 show the lifetime, past year, and past month prevalence of marijuana use in all of the countries surveyed. There are large variations in prevalence rates from country to country ranging from the lowest rates in Haiti (3.2%, 2.4% and 1.2% for lifetime, past year and past month respectively) to the highest in Dominica (31.4%, 19.6% and 12.5% for lifetime, past year and past month respectively) and Antigua and Barbuda (31%, 22.4% and 16.7% for lifetime, past year and past month respectively). Past year prevalence was relatively high across all countries, for example almost one-fifth (19.6%) of students in Dominica and St. Vincent and the Grenadines (19.4%) have used marijuana in the past year. Ten of the 13 countries reported past year prevalence above 10%. Notable low proportions were reported by Haiti and Guyana.
TABLE 29: PREVALENCE OF MARIJUANA USE
Country Lifetime
Prevalence Past Year Prevalence
Past Month Prevalence
Antigua and Barbuda 31.0 22.4 16.7 The Bahamas 12.0 8.1 4.3 Barbados 22.0 16.9 11.0 Belize 23.9 15.7 10.5 Dominica 31.4 19.6 12.5 Grenada 19.5 12.9 7.0 Guyana 7.1 4.2 2.4 Haiti 3.2 2.4 1.2 Jamaica 21.1 11.9 6.3 St. Kitts and Nevis 24.2 16.1 11.6 St. Lucia 28.8 17.2 10.7 St. Vincent and the Grenadines 26.4 19.4 14.0 Trinidad and Tobago 16.6 10.7 6.2 Average 20.6 13.7 8.8
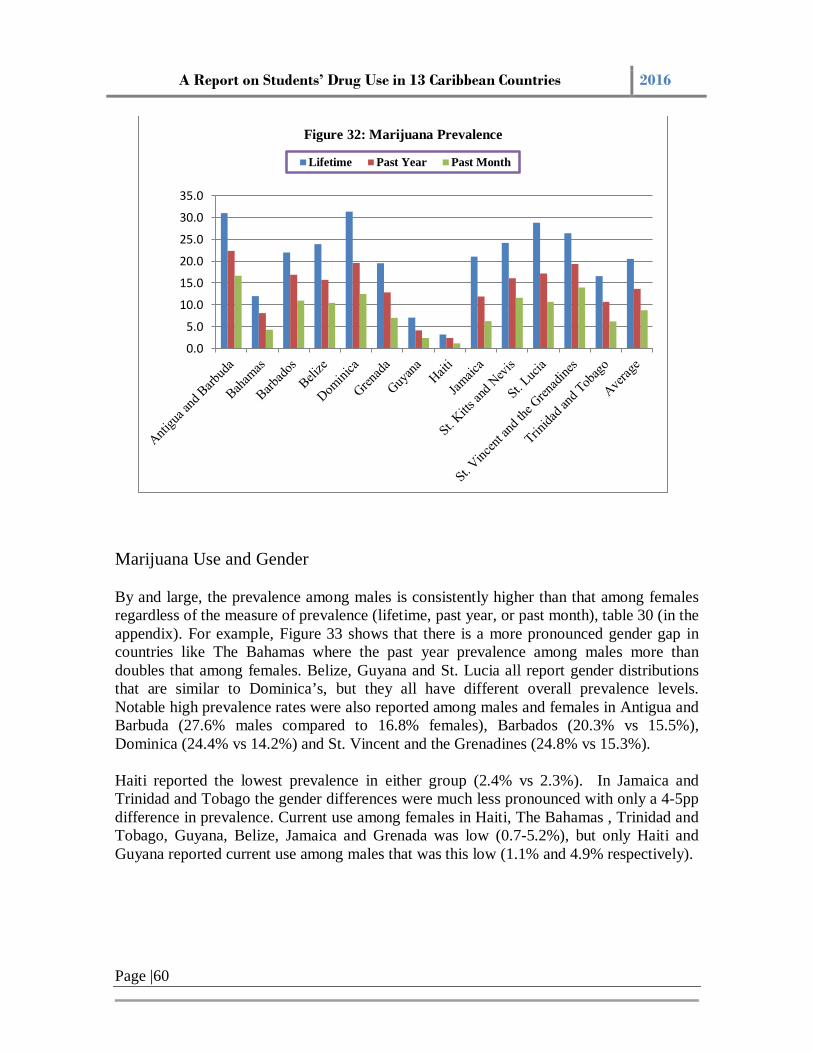
A Report on Students’ Drug Use in 13 Caribbean Countries 2016
Page |60
Marijuana Use and Gender
By and large, the prevalence among males is consistently higher than that among females regardless of the measure of prevalence (lifetime, past year, or past month), table 30 (in the appendix). For example, Figure 33 shows that there is a more pronounced gender gap in countries like The Bahamas where the past year prevalence among males more than doubles that among females. Belize, Guyana and St. Lucia all report gender distributions that are similar to Dominica’s, but they all have different overall prevalence levels. Notable high prevalence rates were also reported among males and females in Antigua and Barbuda (27.6% males compared to 16.8% females), Barbados (20.3% vs 15.5%), Dominica (24.4% vs 14.2%) and St. Vincent and the Grenadines (24.8% vs 15.3%).
Haiti reported the lowest prevalence in either group (2.4% vs 2.3%). In Jamaica and Trinidad and Tobago the gender differences were much less pronounced with only a 4-5pp difference in prevalence. Current use among females in Haiti, The Bahamas , Trinidad and Tobago, Guyana, Belize, Jamaica and Grenada was low (0.7-5.2%), but only Haiti and Guyana reported current use among males that was this low (1.1% and 4.9% respectively).
0.0
5.0
10.0
15.0
20.0
25.0
30.0
35.0
Figure 32: Marijuana Prevalence
Lifetime Past Year Past Month

A Report on Students’ Drug Use in 13 Caribbean Countries 2016
Page |61
Marijuana Use and Age
Table 31 (in the appendix) and figure 34 show marijuana prevalence within the different age categories. In all countries except Jamaica, Trinidad and Tobago and to a lesser extent The Bahamas, the results indicate a pattern of increasing prevalence as age increases. The main distinction however is the size of the difference between the age groups. This varies significantly from country to country and as an example, we see that in Antigua and Barbuda the results show that there is a more than 18 percentage points difference between one age group and the next for past year prevalence. This result shows that the higher overall prevalence of marijuana use in Antigua and Barbuda and four other countries (with a difference of more than 10 percentage points between the two lowest cohorts) is largely driven by increase use among those students in the 15–16 years age grouping. Differences between students in the 17 years and older and those 15-16 years were much less notable with only three of these same countries reporting differences of more than 8 percentage points—Antigua and Barbuda (17.4 points), St. Vincent and the Grenadines (9.6 points) and Guyana (8 points).
0.0
5.0
10.0
15.0
20.0
25.0
30.0
Figure 33: Past Year Marijuana Use by Gender
males females

A Report on Students’ Drug Use in 13 Caribbean Countries 2016
Page |62
Use among the Age Cohorts
Prevalence among the 14 or less age group (figure 35) shows that some groups of countries are very much alike in terms of prevalence. Five countries stand out for having higher levels of past year prevalence more than 10%)—Antigua and Barbuda, Belize, Dominica, St. Lucia and St. Vincent and the Grenadines—while Haiti and Guyana stand out for their relatively low levels (1.7% and 2.9% respectively). The other countries all have very similar prevalence levels.
0.05.0
10.015.020.025.030.035.040.045.0
Figure 34: Past Year Marijuana Prevalence by Age Group
14 or less 15-16 17+
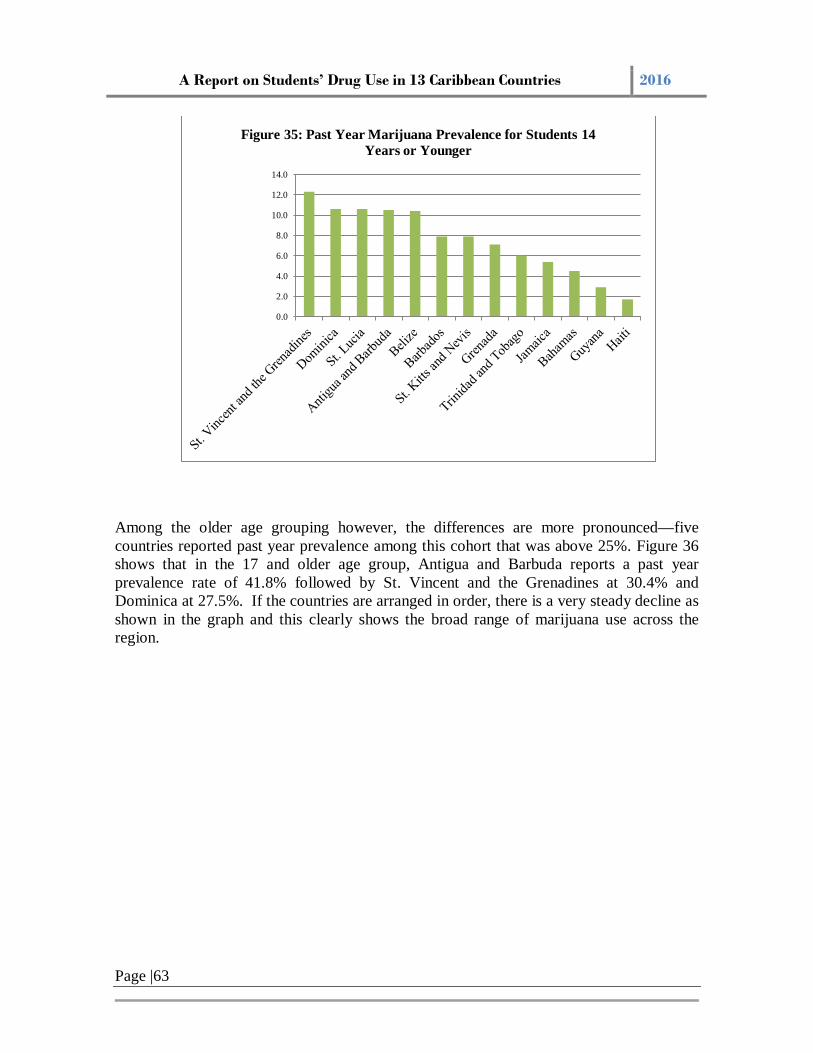
A Report on Students’ Drug Use in 13 Caribbean Countries 2016
Page |63
Among the older age grouping however, the differences are more pronounced—five countries reported past year prevalence among this cohort that was above 25%. Figure 36 shows that in the 17 and older age group, Antigua and Barbuda reports a past year prevalence rate of 41.8% followed by St. Vincent and the Grenadines at 30.4% and Dominica at 27.5%. If the countries are arranged in order, there is a very steady decline as shown in the graph and this clearly shows the broad range of marijuana use across the region.
0.0
2.0
4.0
6.0
8.0
10.0
12.0
14.0
Figure 35: Past Year Marijuana Prevalence for Students 14 Years or Younger
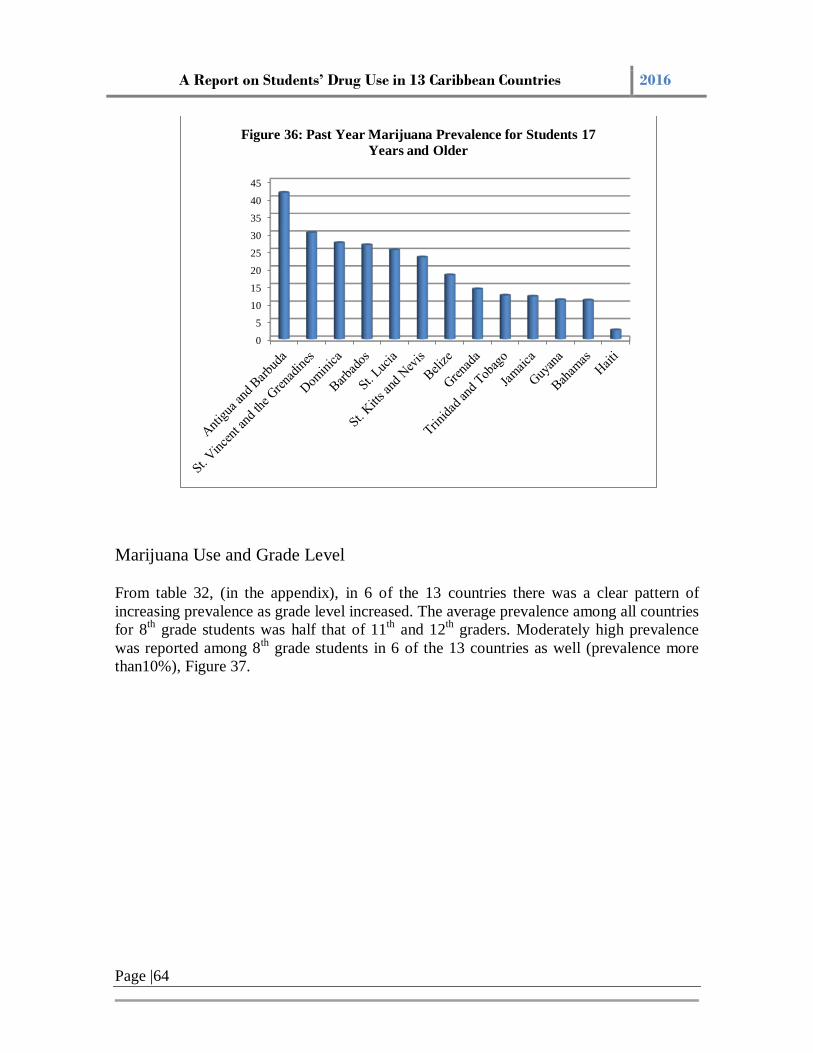
A Report on Students’ Drug Use in 13 Caribbean Countries 2016
Page |64
Marijuana Use and Grade Level
From table 32, (in the appendix), in 6 of the 13 countries there was a clear pattern of increasing prevalence as grade level increased. The average prevalence among all countries for 8th grade students was half that of 11th and 12th graders. Moderately high prevalence was reported among 8th grade students in 6 of the 13 countries as well (prevalence more than10%), Figure 37.
0
5
10
15
20
25
30
35
40
45
Figure 36: Past Year Marijuana Prevalence for Students 17 Years and Older

A Report on Students’ Drug Use in 13 Caribbean Countries 2016
Page |65
Incidence
As shown in table 33 (in the appendix) and figure 38, the past year incidence of use was notably higher among countries such as Antigua and Barbuda, St. Lucia, Belize, St. Vincent and the Grenadines and Dominica —16.2%, 13.8%, 13.8%, 12.9% and 12.7% respectively. Jamaica (9.8%) along with St. Kitts and Nevis (12.3%), Barbados (10.9%) and Grenada (9.9%) also reported notably high incidence. Haiti has the lowest incidence among the group followed by Guyana (3.3%). The past month incidence showed a similar pattern with high incidence reported by Antigua and Barbuda, Dominica, and Belize.
0
5
10
15
20
25
30
35
40
Figure 37: Past Year Marijuana Prevalence
8th 10th 11/12th

A Report on Students’ Drug Use in 13 Caribbean Countries 2016
Page |66
Age of First Use
The average age of first use is shown in table 34 (in the appendix) and figure 39. For all 13 countries it is clear that most students initiate use around the age of 13 years. No country reported a mean age overall over 14 years. However, two countries reported mean first use among females that was above 14 years—Haiti (16.6 years) and Belize (14.6 years).
0
5
10
15
20
25
Figure 38: Past Year Incidence of Marijuana Use
Country Estimate Males Females
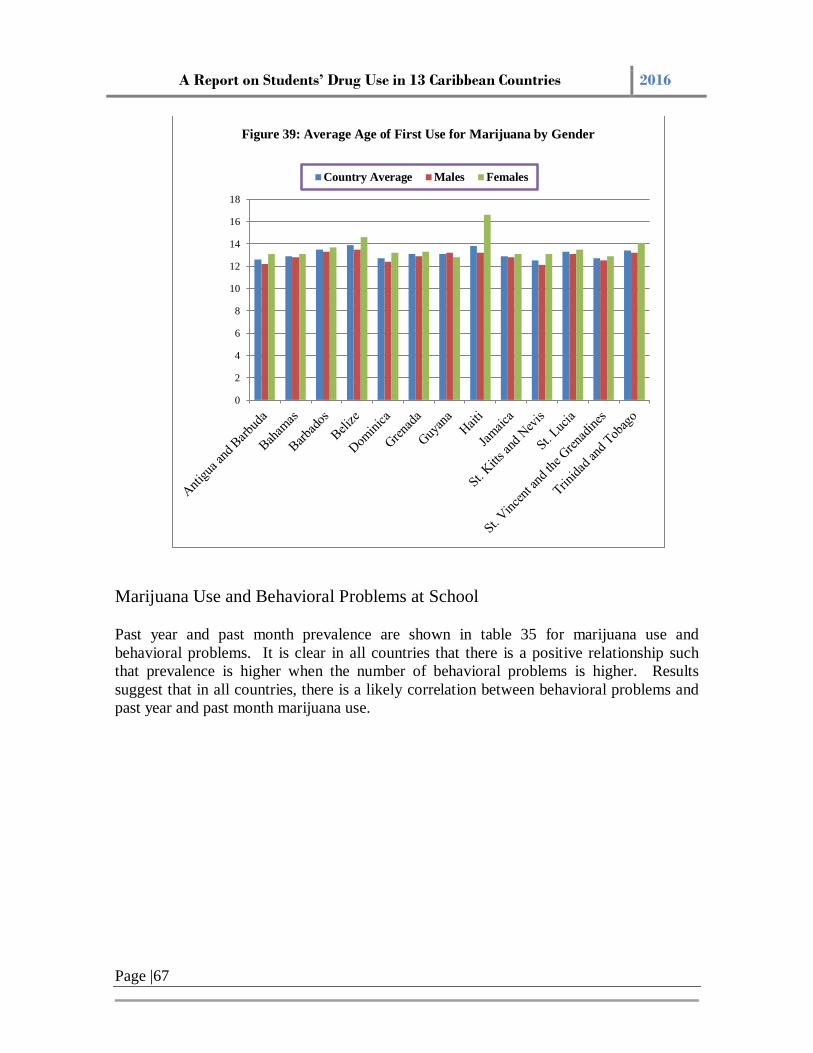
A Report on Students’ Drug Use in 13 Caribbean Countries 2016
Page |67
Marijuana Use and Behavioral Problems at School
Past year and past month prevalence are shown in table 35 for marijuana use and behavioral problems. It is clear in all countries that there is a positive relationship such that prevalence is higher when the number of behavioral problems is higher. Results suggest that in all countries, there is a likely correlation between behavioral problems and past year and past month marijuana use.
0
2
4
6
8
10
12
14
16
18
Figure 39: Average Age of First Use for Marijuana by Gender
Country Average Males Females

A Report on Students’ Drug Use in 13 Caribbean Countries 2016
Page |68
TABLE 35: PAST YEAR AND PAST MONTH PREVALENCE OF MARIJUANA USE BY BEHAVIORAL PROBLEMS
Past Year Prevalence Past Month Prevalence Never Once Few
Times Often Never Once Few
Times Often
Antigua and Barbuda 8.7 13.2 31.5 66.2 5.4 7.6 24.1 59.6 The Bahamas 3.8 4.9 9.8 23.7 2.1 2.1 4.8 15.6 Barbados 9.5 13.1 19.7 36.6 4.8 7.8 13.8 26.0 Belize 6.8 13.1 32.1 57.6 32.7 8.2 23.3 44.1 Dominica 9.7 - 27.1 42.5 5.5 - 16.9 33.3 Grenada 6.6 11.7 17.9 31.5 3.7 5.7 10.1 19.2 Guyana 2.2 3.5 7.6 21.1 1.4 2.2 3.6 12.9 Haiti 1.8 2.9 3.3 - 1.0 1.1 2.0 - Jamaica 5.9 12.3 24.5 51.3 3.0 5.7 13.2 38.6 St. Kitts and Nevis 8.0 10.9 20.8 34.3 6.7 9.2 14.0 25.2 St. Lucia 7.6 12.9 26.2 43.6 3.8 7.0 17.6 30.8 St. Vincent and the Grenadines 8.8 14.5 28.1 51.0 6.4 9.5 20.9 39.3 Trinidad and Tobago 5.1 10.2 16.1 34.8 3.2 5.8 9.2 21.8
Marijuana Use and Number of School Years Repeated
Table 36 (in the appendix) and figure 40 show the reported lifetime, past month and past year prevalence of marijuana use tabulated by number of school years students had repeated. When past year prevalence is compared among those who had no repeats and those with repeats, there is a similar pattern. In Belize, the difference in past year prevalence between students who repeated grades (two or more times) and those who did not, was 23.5 percentages point (13% vs. 36.5%) while in St. Kitts and Nevis, St. Vincent and the Grenadines and Dominica, the students who repeated two or more grades reported prevalence rates that were more than 15 points higher than those students who did not repeat grades.
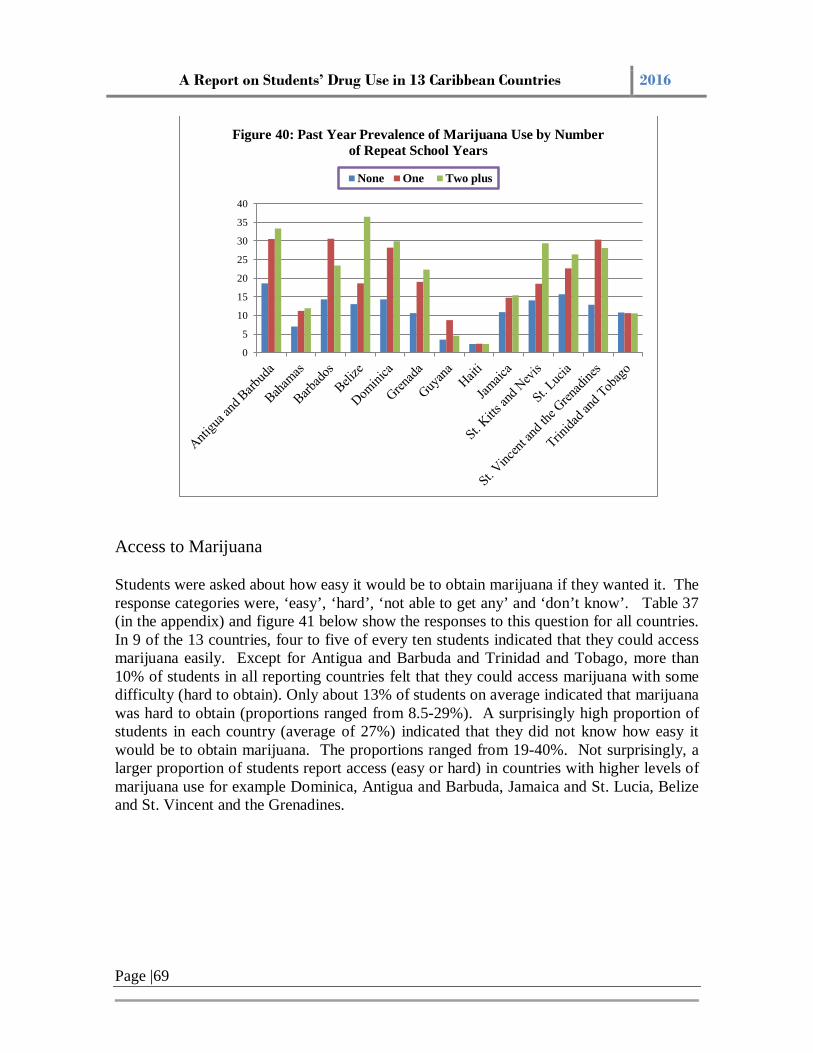
A Report on Students’ Drug Use in 13 Caribbean Countries 2016
Page |69
Access to Marijuana
Students were asked about how easy it would be to obtain marijuana if they wanted it. The response categories were, ‘easy’, ‘hard’, ‘not able to get any’ and ‘don’t know’. Table 37 (in the appendix) and figure 41 below show the responses to this question for all countries. In 9 of the 13 countries, four to five of every ten students indicated that they could access marijuana easily. Except for Antigua and Barbuda and Trinidad and Tobago, more than 10% of students in all reporting countries felt that they could access marijuana with some difficulty (hard to obtain). Only about 13% of students on average indicated that marijuana was hard to obtain (proportions ranged from 8.5-29%). A surprisingly high proportion of students in each country (average of 27%) indicated that they did not know how easy it would be to obtain marijuana. The proportions ranged from 19-40%. Not surprisingly, a larger proportion of students report access (easy or hard) in countries with higher levels of marijuana use for example Dominica, Antigua and Barbuda, Jamaica and St. Lucia, Belize and St. Vincent and the Grenadines.
0
5
10
15
20
25
30
35
40
Figure 40: Past Year Prevalence of Marijuana Use by Number of Repeat School Years
None One Two plus

A Report on Students’ Drug Use in 13 Caribbean Countries 2016
Page |70
Figure 42 and table 38 shows that the past year prevalence rates among the group of students who reported that it is easy to obtain marijuana are many times higher than those groups who said it was hard (difficult), not able to (impossible) or did not know. Rates were from two and a half times higher and up to seven times higher (in the case of Barbados) than those who said it was hard to obtain; three times higher and up to 30 times higher (in the case of St. Lucia) than those who said it was impossible to obtain; and 1.5 times higher and up to 10-11 times higher (in the case of Barbados, Trinidad and Tobago and Guyana) than those who said they did not know.
0%10%20%30%40%50%60%70%80%90%
100%
Figure 41: Ease of Obtaining Marijuana
easy hard unable to don’t know
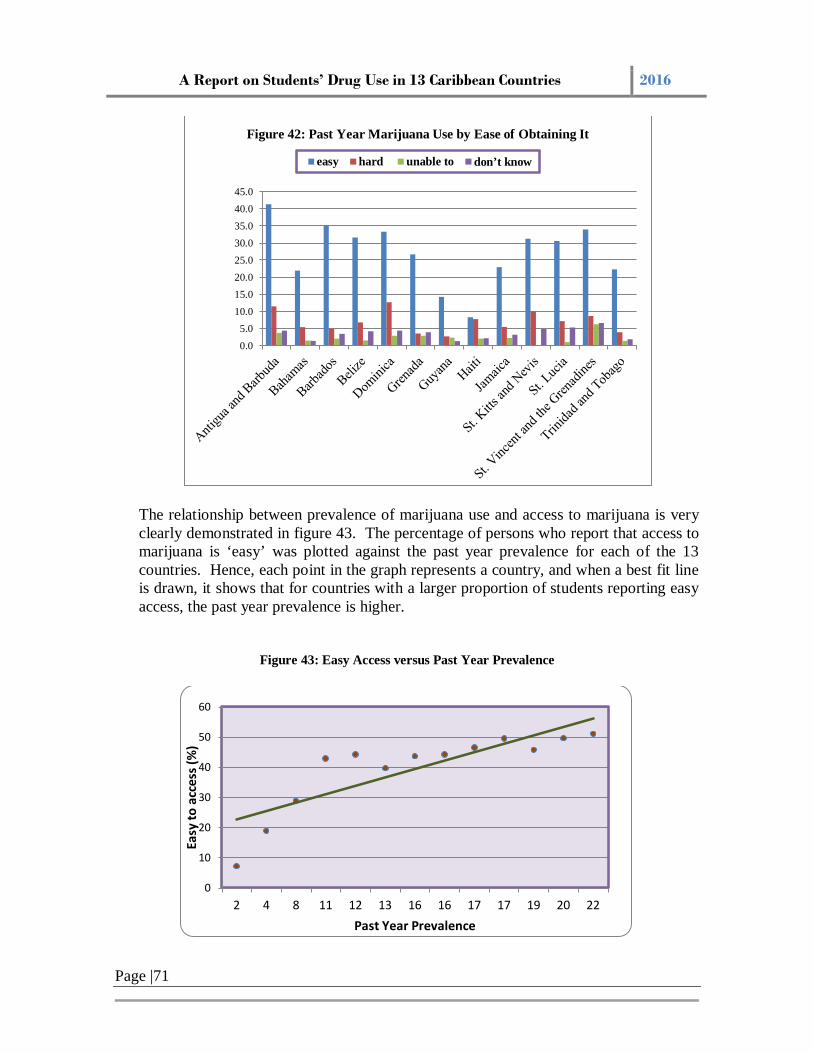
A Report on Students’ Drug Use in 13 Caribbean Countries 2016
Page |71
The relationship between prevalence of marijuana use and access to marijuana is very clearly demonstrated in figure 43. The percentage of persons who report that access to marijuana is ‘easy’ was plotted against the past year prevalence for each of the 13 countries. Hence, each point in the graph represents a country, and when a best fit line is drawn, it shows that for countries with a larger proportion of students reporting easy access, the past year prevalence is higher.
Figure 43: Easy Access versus Past Year Prevalence
0.05.0
10.015.020.025.030.035.040.045.0
Figure 42: Past Year Marijuana Use by Ease of Obtaining It
easy hard unable to don’t know
0
10
20
30
40
50
60
2 4 8 11 12 13 16 16 17 17 19 20 22
Easy
to a
cces
s (%
)
Past Year Prevalence

A Report on Students’ Drug Use in 13 Caribbean Countries 2016
Page |72
Perception of Harm
Smoking Marijuana – On average, less than 40% of all students felt that sometimes smoking marijuana was very harmful. The only two countries where more than 50% of students felt that his was very harmful were Haiti (57%) and Guyana (54%). With respect to harm related to smoking marijuana frequently, on average 63% of students felt that this was very harmful. Notable lows were for Antigua and Barbuda (51%) and St. Kitts and Nevis (50%).
Figure 44: Perception of Harm – Smoking Marijuana
Secondhand Marijuana Smoke – On average just a little more than half of all students surveyed (53.4%) felt that inhaling secondhand marijuana smoke was very harmful. The highest proportions were reported among students from Belize (57.6%), Grenada (56.3%), Guyana (65%), Jamaica (59%), Trinidad and Tobago (56.7%) and The Bahamas (57.7%).
TREND ANALYSIS – MARIJUANA Marijuana continues to be the most widely used illegal substance reported by students. The 2013 survey showed a marked increase in overall average lifetime, past year and past month prevalence over the 2010 report (figure 45). The overall past month average prevalence was 8.8% in 2013 compared to 5.4% in 2010.
01020304050607080
marijuana sometimes marijuana frequently
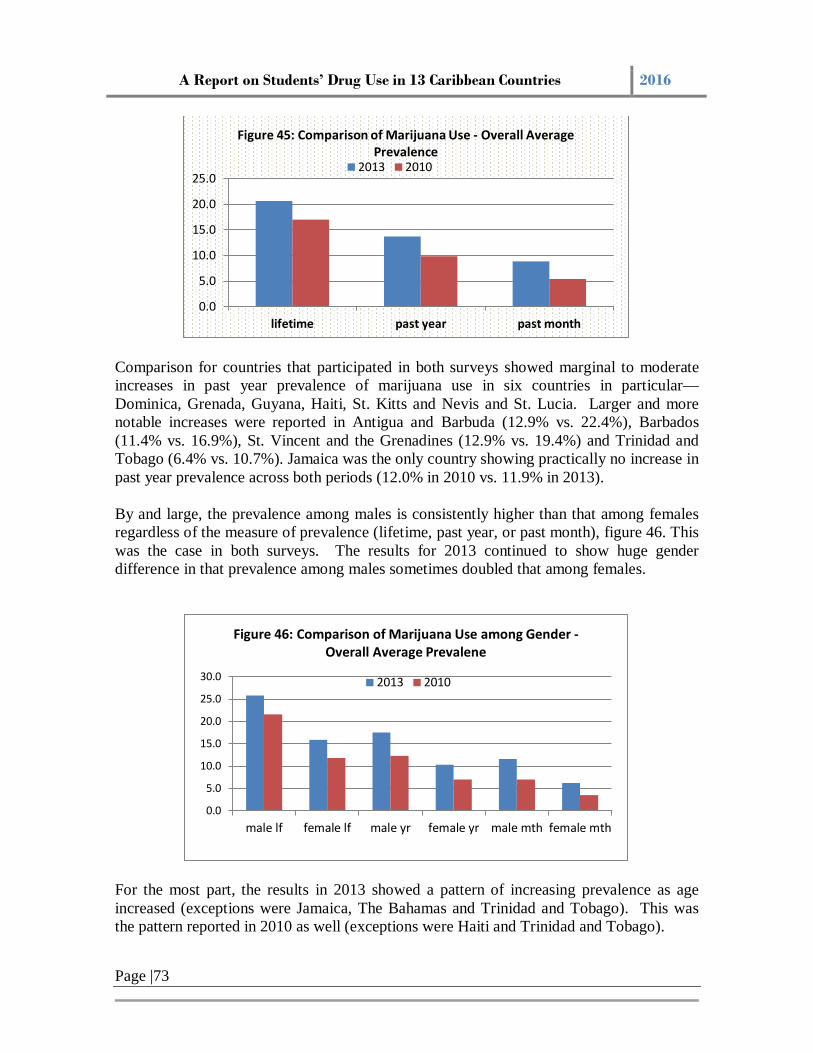
A Report on Students’ Drug Use in 13 Caribbean Countries 2016
Page |73
Comparison for countries that participated in both surveys showed marginal to moderate increases in past year prevalence of marijuana use in six countries in particular—Dominica, Grenada, Guyana, Haiti, St. Kitts and Nevis and St. Lucia. Larger and more notable increases were reported in Antigua and Barbuda (12.9% vs. 22.4%), Barbados (11.4% vs. 16.9%), St. Vincent and the Grenadines (12.9% vs. 19.4%) and Trinidad and Tobago (6.4% vs. 10.7%). Jamaica was the only country showing practically no increase in past year prevalence across both periods (12.0% in 2010 vs. 11.9% in 2013). By and large, the prevalence among males is consistently higher than that among females regardless of the measure of prevalence (lifetime, past year, or past month), figure 46. This was the case in both surveys. The results for 2013 continued to show huge gender difference in that prevalence among males sometimes doubled that among females.
For the most part, the results in 2013 showed a pattern of increasing prevalence as age increased (exceptions were Jamaica, The Bahamas and Trinidad and Tobago). This was the pattern reported in 2010 as well (exceptions were Haiti and Trinidad and Tobago).
0.0
5.0
10.0
15.0
20.0
25.0
lifetime past year past month
Figure 45: Comparison of Marijuana Use - Overall Average Prevalence
2013 2010
0.0
5.0
10.0
15.0
20.0
25.0
30.0
male lf female lf male yr female yr male mth female mth
Figure 46: Comparison of Marijuana Use among Gender - Overall Average Prevalene
2013 2010

A Report on Students’ Drug Use in 13 Caribbean Countries 2016
Page |74
Overall past year and past month incidence showed a marked increase in 2013—past year incidence increased from 7.1% to 10.1% and past month increased from 3.1% to 5.2%. Past year incidence in Antigua and Barbuda more than doubled in 2013 compared to 2010 while Barbados showed a 4.2 percentage point increase. Countries like Dominica, St. Kitts and Nevis, St. Lucia and St. Vincent and the Grenadines continue to report notably high past year incidence (more than 10%), Figure 39.
TABLE 39: COMPARISON OF PAST YEAR MARIJUANA INCIDENCE
Country Estimate
(2013)
Country Estimate (2010)
Percentage point change
Antigua and Barbuda 16.2 7.5 + 8.7 Barbados 10.9 6.7 + 4.2 Dominica 12.7 12.5 + 0.2 Guyana 3.3 4.8 - 1.5 Jamaica 9.8 10.7 - 0.9 St. Kitts and Nevis 12.3 9.5 + 2.8 St. Lucia 13.8 10.9 + 2.9 St. Vincent and the Grenadines 12.9 7.9 + 5.0 Trinidad and Tobago 8.0 4.1 + 3.9
Age of first use of marijuana in most countries in 2013 was around the age of 13 years. This was similar to what was reported in 2010 (the overall average in both periods was similar 13 years). The overall average age of first use for males was marginally lower in 2010 (12.6 years vs. 12.9 years). The difference among females was a little more notable (12.8 years in 2010 vs. 13.6 years in 2013). ACCESS TO MARIJUANA In the 2010 report, seven of the ten countries reported that four to five of every ten students indicated that they could access marijuana easily. In 2013 a similar pattern emerged – in 69% (9/13) of countries four to five of every ten students indicated that they could access marijuana easily. In 2013 only about 13% of students on average indicated that marijuana was difficult to obtain (range from 8.5% - 29%). This compares to 16% in 2010 (range from 11-25%).
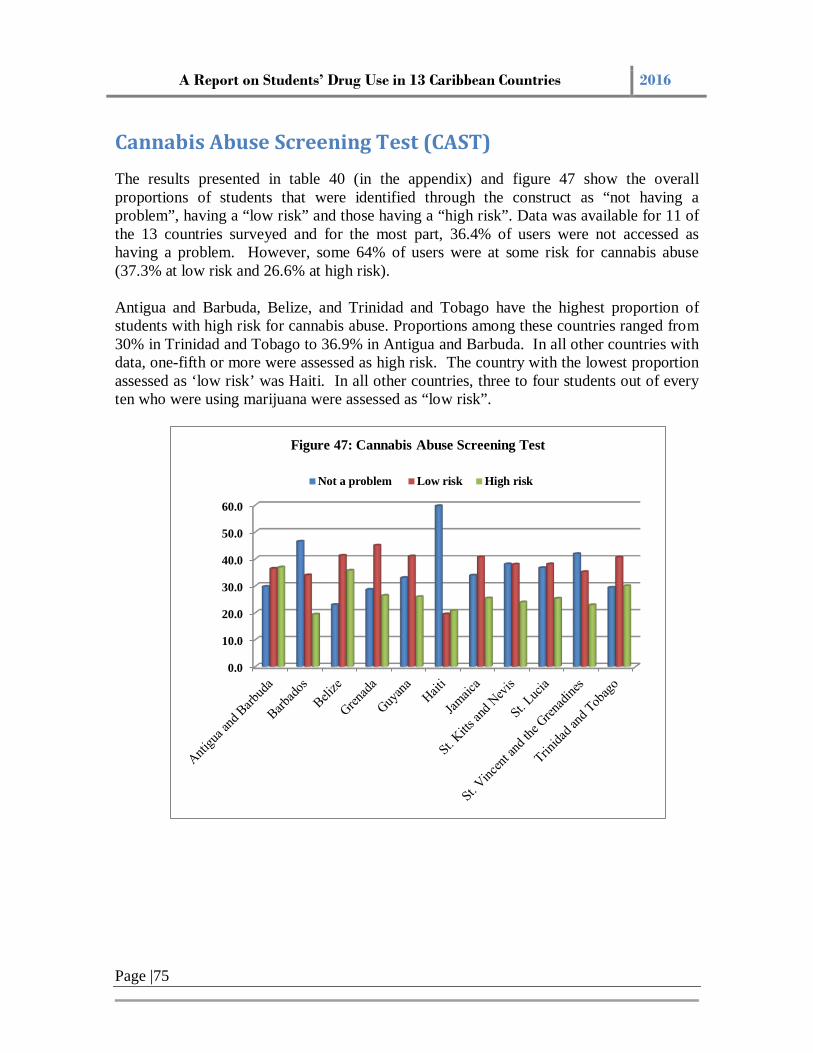
A Report on Students’ Drug Use in 13 Caribbean Countries 2016
Page |75
Cannabis Abuse Screening Test (CAST) The results presented in table 40 (in the appendix) and figure 47 show the overall proportions of students that were identified through the construct as “not having a problem”, having a “low risk” and those having a “high risk”. Data was available for 11 of the 13 countries surveyed and for the most part, 36.4% of users were not accessed as having a problem. However, some 64% of users were at some risk for cannabis abuse (37.3% at low risk and 26.6% at high risk). Antigua and Barbuda, Belize, and Trinidad and Tobago have the highest proportion of students with high risk for cannabis abuse. Proportions among these countries ranged from 30% in Trinidad and Tobago to 36.9% in Antigua and Barbuda. In all other countries with data, one-fifth or more were assessed as high risk. The country with the lowest proportion assessed as ‘low risk’ was Haiti. In all other countries, three to four students out of every ten who were using marijuana were assessed as “low risk”.
0.0
10.0
20.0
30.0
40.0
50.0
60.0
Figure 47: Cannabis Abuse Screening Test
Not a problem Low risk High risk

A Report on Students’ Drug Use in 13 Caribbean Countries 2016
Page |76
Any Illegal Drug5
Table 41 (in the appendix) and figure 48 show the results of estimates of prevalence of the summary measure—any illegal drug—in all the countries (except Dominica). The results show that for lifetime prevalence, the countries with the highest proportions are St. Lucia (42%), Antigua and Barbuda (41.3%) and St. Kitts and Nevis (41.7%). Haiti has a relatively low prevalence (15.4%) and the second lowest after The Bahamas (12.6%). The other countries have values ranging from 19.5% to 39%.
Any Illegal Drug Use and Gender
Table 42 (in the appendix) shows the distribution of estimated prevalence for male and females in relation to lifetime, past year and past month prevalence. Again Haiti reported low prevalence overall for all three measures. Past year prevalence among the countries for females ranged from 5.4% in The Bahamas to 26% in Barbados. For males it ranged from 11.1% in Haiti to 31.5% in Antigua and Barbuda. In general, the prevalence of use by male students outstrips that of female students (Figure 49).
5 ‘Any Illegal Drug’ for this report includes the following substances: Marijuana, cocaine, coca base, heroin, opium, morphine, hallucinogens, hashish, crack, ecstasy, inhalants, and other illegal drugs.
0
5
10
15
20
25
30
Figure 48: Past Year Prevalence of Any Illegal Drug

A Report on Students’ Drug Use in 13 Caribbean Countries 2016
Page |77
Any Illegal Drug Use and Age
Table 43 (in the appendix) shows the distribution of results by age grouping. The results of nine of the 13 countries clearly demonstrate that there is a positive relationship between age and past year prevalence such that as age increases past year prevalence also significantly increases as could be seen in figure 50.
In the three countries where this pattern is not followed (Belize, Grenada, and Jamaica), the highest past year prevalence levels are reported by the 15 to 16 years old group of students. Past month prevalence rates also increased as age increased. The notable exceptions, (similar to past year prevalence countries) were Barbados, Belize, Grenada and Jamaica. In these four countries, there was a slightly higher prevalence among students 15-16 years old.
0
5
10
15
20
25
30
35
Figure 49: Past Year Prevalence of Any Illegal Drug by Gender
males females

A Report on Students’ Drug Use in 13 Caribbean Countries 2016
Page |78
Incidence
Figure 51 below and table 44 (in the appendix) show the results of the estimates of past year incidence for 12 of the countries included in this survey. The results indicate that more than one-fifth of the students surveyed in St. Lucia (22.7%) had tried an illegal drug for the first time in the year before the survey. Students in Antigua and Barbuda reported the next highest incidence level (21.3%) followed by Barbados and St. Vincent and the Grenadines (about 19% each). Grenada, Belize, Jamaica and St. Kitts and Nevis all have results above 16%. Haiti and The Bahamas reported the lowest incidence at 6.3% and 7.3% respectively. The overall past year average incidence for the reporting countries was about one in every six students (15.5%).
05
101520253035404550
Figure 50: Past Year Prevalence of Any Illegal Drug Use by Age Group
14 years or less 15 – 16 years 17 + years

A Report on Students’ Drug Use in 13 Caribbean Countries 2016
Page |79
Any Illegal Drug Use and Behavioral Problems at School
Table 45 (in the appendix) shows the distribution of past year and past month prevalence of any illegal drug use cross-tabulated by behavioral problems during school. Both past year and past month prevalence increased as the number of behavioral problems increased. Notable high prevalence countries—reporting 50% or higher prevalence for students who reported “often” behavioral problems—were Antigua and Barbuda, St. Lucia, St. Kitts and Nevis, St. Vincent and the Grenadines, Belize, Jamaica and Barbados.
The results shown in Figure 52 indicate that there is a positive relationship between the number of behavioral problems experienced by students and past year prevalence. This relationship is noted in all of the countries surveyed with the usual variations in magnitude of the prevalence figures and the differences between groups.
0
5
10
15
20
25
Figure 51: Past Year Incidence of Any Illegal Drug Use

A Report on Students’ Drug Use in 13 Caribbean Countries 2016
Page |80
Any Illegal Drug Use and Number of School Years Repeated
Table 46 (in the appendix) shows the distribution of lifetime, past year and past month prevalence by number of grades repeated. As with behavioral problems, students who reported having to repeat grades were in the majority of countries significantly more likely to report higher prevalence of any illicit drug use (Haiti, Guyana, Jamaica and Trinidad and Tobago were the noted exceptions). Figure 53 shows the relationship between past year prevalence and number of repeated grades. In all countries, the students who repeated one or more school grades reported higher levels of past year prevalence of any illegal drug use compared to those who had not repeated. St. Lucia, St. Kitts and Nevis and Belize more than the other countries show larger differences in prevalence rates between the group of students who repeated grades and those who had not.
0
10
20
30
40
50
60
70
80
Figure 52: Past Year Any Illegal Drug Use and Behavioral Problems at School
Never Once Few Times Often

A Report on Students’ Drug Use in 13 Caribbean Countries 2016
Page |81
0
5
10
15
20
25
30
35
40
Figure 53: Past Year Prevalence of Any Illegal Drug Use and Number of Repeat Grades
none one two plus

A Report on Students’ Drug Use in 13 Caribbean Countries 2016
Page |82
Other Illegal Drugs (Cocaine, Crack, and Ecstasy) Prevalence figures for lifetime and past year measures are presented in table 47 (in the appendix) for cocaine, crack cocaine and ecstasy. The distributions are further illustrated in figures 54 to 56. The results for these three drugs indicate that Antigua and Barbuda, Grenada and St. Kitts and Nevis reported higher levels of use than the other countries. These three countries are by far the ones with the greatest level of use of these substances.
Cocaine
The average of the estimated prevalence among all countries was 2.4%. Seven countries report lifetime rates that were above this average while three were in the range 1-1.5%. Six countries had past year rates that were less than one percent and up to 1.5% (the overall average past month prevalence). Figure 54 reveals that for cocaine, the highest rates of use are found in Grenada (2.2%) and Antigua and Barbuda, St. Kitts and Nevis and St. Lucia with past year prevalence rates of 1.9% each. No other country reported a past year prevalence higher than 1.9%.
0.0
0.5
1.0
1.5
2.0
2.5
3.0
3.5
Figure 54: Lifetime and Past Year Prevalence of Cocaine Use
Lifetime Past Year

A Report on Students’ Drug Use in 13 Caribbean Countries 2016
Page |83
Overall, about four of every ten students (36.6%) in the 13 countries indicated that they did not know how easy it was to obtain cocaine. Some 31% felt it was obtainable (9.8% easy to obtain and 20.3% hard to obtain). About one-third of all students felt it was impossible to obtain. Students in Trinidad and Tobago (15.8%) and Dominica (13.3%), Belize (12.9%), Barbados (12.3%) and Grenada (11.6%) were the countries indicated easiest access. In all other countries, about 10% or less reported that cocaine was easy to access, (table 48).
TABLE 48: PERCEPTION OF AVAILABILITY OF COCAINE
Ease of Obtaining Cocaine Easy Hard Not be able
to Don’t know
Antigua and Barbuda 10.1 17.4 30.5 42.0 The Bahamas 10.4 17.3 20.0 47.7 Barbados 12.3 17.4 28.7 41.6 Belize 12.9 20.2 28.9 38.1 Dominica 13.3 18.9 32.2 31.1 Grenada 11.6 22.5 34.4 31.5 Guyana 6.8 22.9 33.6 36.6 Haiti 3.7 26.4 45.7 24.1 Jamaica 5.5 21.4 34.6 38.4 St. Kitts and Nevis 7.5 16.4 31.0 45.0 St. Lucia 8.9 22.9 38.0 30.2 St. Vincent and the Grenadines 8.3 23.4 33.3 35.0 Trinidad and Tobago 15.8 16.8 32.3 35.1 Average 9.8 20.3 32.6 36.6
Crack Cocaine
For crack cocaine (Figure 55), Antigua and Barbuda, Grenada and St. Kitts and Nevis are once again the countries reporting the highest rates of use. Past year prevalence of crack is in Grenada is 3.3%. St. Kitts and Nevis and Trinidad and Tobago are the only other countries with a past year prevalence rate greater than or equal to 2% (2.1% and 2.2% respectively)—very negligible use was reported by the other countries.

A Report on Students’ Drug Use in 13 Caribbean Countries 2016
Page |84
All countries except Dominica reported on the availability of crack cocaine. More than three in every ten students overall (36%) indicated that they did not know how to access crack cocaine. About 25% felt it was obtainable (7.2% easy to access and 17.6% hard to access). Almost one-third felt it was impossible to obtain crack. Belize (13.1%), Trinidad and Tobago (11.1%), Barbados (10.4%), and The Bahamas (10.1%) reported the highest proportion of students who felt it was easy to obtain crack, (table 49).
TABLE 49: PERCEPTION OF AVAILABILITY OF CRACK COCAINE
Ease of Obtaining Crack Cocaine Easy Hard Not be
able to Don’t know
Antigua and Barbuda 9.1 15.7 33.2 42.0 The Bahamas 10.1 13.4 20.4 51.5 Barbados 10.4 16.0 31.1 42.5 Belize 13.1 17.7 30.2 39.0 Dominica* Grenada 8.3 21.6 36.6 33.5 Guyana 6.3 20.7 34.3 38.7 Haiti 3.8 25.7 45.6 24.9 Jamaica 3.9 19.8 36.7 39.5 St. Kitts and Nevis 6.4 15.8 32.0 45.8 St. Lucia 6.5 22.9 39.1 31.5 St. Vincent and the Grenadines 4.5 22.7 34.9 37.9 Trinidad and Tobago 11.1 16.7 35.1 37.1 Average 7.2 17.6 31.5 35.7
*Indicator not measured
0.00.51.01.52.02.53.03.54.0
Figure 55: Lifetime and Past Year Prevalence of Crack Cocaine Use
Lifetime Past Year

A Report on Students’ Drug Use in 13 Caribbean Countries 2016
Page |85
Ecstasy
Only estimates of lifetime prevalence of ecstasy use are available for this study. Here we see Antigua and Barbuda (3.7%), Dominica (2.6%), Barbados (2.5% and Belize (2.4%) reporting the highest levels of lifetime prevalence. The overall average was 1.8% and all other countries with the exception of Grenada (1.9%) reported prevalence below this average, Figure 56.
Four of every ten students overall (41%) indicated that they did not know how to access ecstasy. About 25.4% felt it was obtainable (7.3% easy to access and 18.1% hard to access). One-third of students felt it was impossible to obtain ecstasy. Barbados reported the highest proportion of students who felt it was easy to access ecstasy (12%) followed by Antigua and Barbuda (11.1%), Belize (9.8%) and Trinidad and Tobago (9.4%). About 5% - 9% of students in the other countries also felt it was easy to access, (table 50).
0.0
0.5
1.0
1.5
2.0
2.5
3.0
3.5
4.0
Figure 56: Lifetime Prevalence of Ecstasy

A Report on Students’ Drug Use in 13 Caribbean Countries 2016
Page |86
TABLE 50: PERCEPTION OF AVAILABILITY OF ECSTASY
Ease of Obtaining Ecstasy
Easy Hard Not be able to
Don’t know
Antigua and Barbuda 11.1 15.5 30.0 43.5 The Bahamas 8.9 13.3 19.6 53.5 Barbados 11.8 15.5 27.8 44.9 Belize 9.8 18.6 30.8 40.8 Dominica 8.0 12.6 31.5 43.3 Grenada 5.7 21.2 36.4 37.6 Guyana 6.7 18.6 33.8 40.8 Haiti 3.5 24.9 45.8 25.8 Jamaica 4.5 19.2 34.8 41.5 St. Kitts and Nevis 4.6 15.9 31.0 48.5 St. Lucia 6.6 21.9 37.4 34.2 St. Vincent and the Grenadines 4.6 21.1 34.1 40.2 Trinidad and Tobago 9.4 16.9 34.9 38.7 Average 7.3 18.1 32.9 41.0

A Report on Students’ Drug Use in 13 Caribbean Countries 2016
Page |87
Availability of Other Drugs (Cocaine, Ecstasy and Crack Cocaine) Other than marijuana, students were also asked to indicate how easy it would be to obtain cocaine, ecstasy and crack cocaine. Table 51 shows the distribution of responses for each country with respect to crack cocaine. All countries except Dominica reported on the availability of crack cocaine. More than three in every ten students overall (36%) indicated that they did not know how to access crack cocaine. About 25% felt it was obtainable (7.2% easy to access and 17.6% hard to access). Almost one-third felt it was impossible to obtain crack. Belize (13.1%), Trinidad and Tobago (11.1%), Barbados (10.4%), and The Bahamas (10.1%) reported the highest proportion of students who felt it was easy to obtain crack, (table 51).
TABLE 51: PERCEPTION OF AVAILABILITY OF CRACK COCAINE
Ease of Obtaining Crack Cocaine Easy Hard Not be
able to Don’t know
Antigua and Barbuda 9.1 15.7 33.2 42.0 The Bahamas 10.1 13.4 20.4 51.5 Barbados 10.4 16.0 31.1 42.5 Belize 13.1 17.7 30.2 39.0 Dominica* Grenada 8.3 21.6 36.6 33.5 Guyana 6.3 20.7 34.3 38.7 Haiti 3.8 25.7 45.6 24.9 Jamaica 3.9 19.8 36.7 39.5 St. Kitts and Nevis 6.4 15.8 32.0 45.8 St. Lucia 6.5 22.9 39.1 31.5 St. Vincent and the Grenadines 4.5 22.7 34.9 37.9 Trinidad and Tobago 11.1 16.7 35.1 37.1 Average 7.2 17.6 31.5 35.7
*Indicator not measured
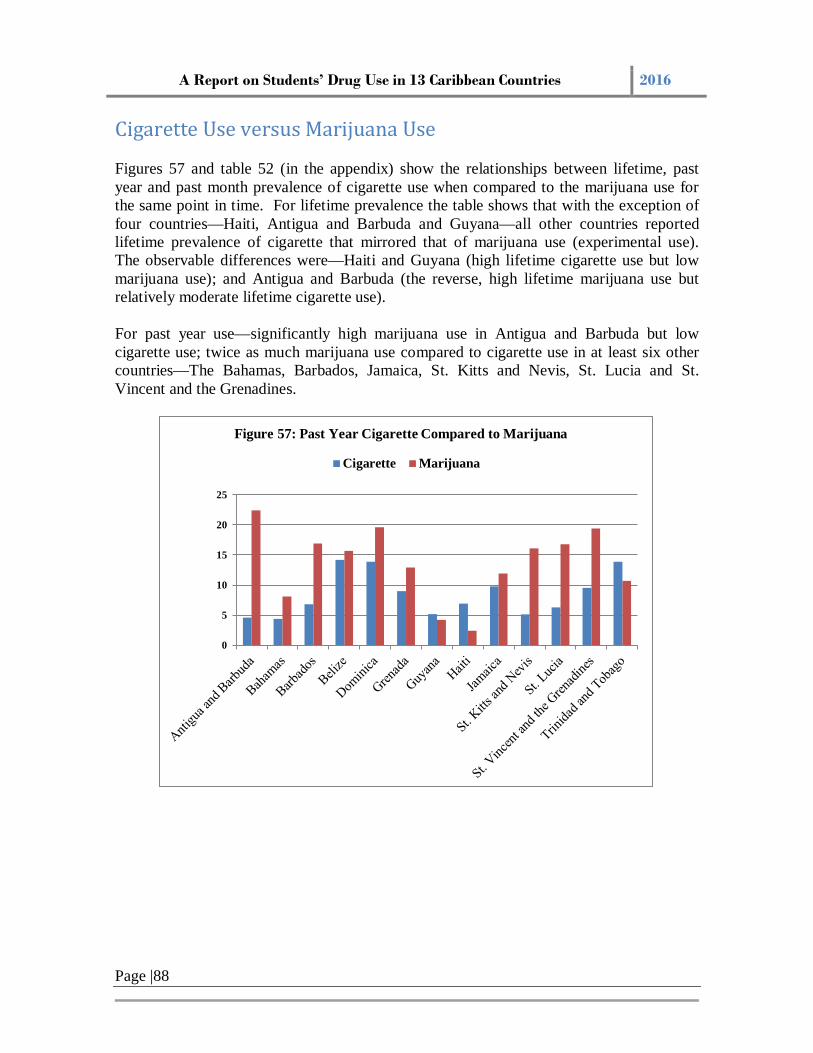
A Report on Students’ Drug Use in 13 Caribbean Countries 2016
Page |88
Cigarette Use versus Marijuana Use
Figures 57 and table 52 (in the appendix) show the relationships between lifetime, past year and past month prevalence of cigarette use when compared to the marijuana use for the same point in time. For lifetime prevalence the table shows that with the exception of four countries—Haiti, Antigua and Barbuda and Guyana—all other countries reported lifetime prevalence of cigarette that mirrored that of marijuana use (experimental use). The observable differences were—Haiti and Guyana (high lifetime cigarette use but low marijuana use); and Antigua and Barbuda (the reverse, high lifetime marijuana use but relatively moderate lifetime cigarette use).
For past year use—significantly high marijuana use in Antigua and Barbuda but low cigarette use; twice as much marijuana use compared to cigarette use in at least six other countries—The Bahamas, Barbados, Jamaica, St. Kitts and Nevis, St. Lucia and St. Vincent and the Grenadines.
0
5
10
15
20
25
Figure 57: Past Year Cigarette Compared to Marijuana
Cigarette Marijuana

A Report on Students’ Drug Use in 13 Caribbean Countries 2016
Page |89
Perception of Harmfulness
Overall Perceptions
Students were asked to indicate their perception of harmfulness related to the use of different substances. The overall responses by county are shown in tables 54a through 54m in the appendix. Table 52 however shows perception of ‘very harmful’ for harm related to the following: sometimes and frequent cigarette smoking, getting drunk, sometimes and frequent inhalant use, sometimes and frequent marijuana smoking, and inhaling secondhand marijuana and cigarette smoke.
TABLE 52: STUDENTS PERCEPTION OF HARMFULNESS – VERY HARMFUL
Countries
Students Perception of Harmfulness – Very Harmful
Smoking sometimes
Smoking frequently
Getting drunk
Inhaling solvent sometimes
Inhaling solvent frequently
Smoking marijuana sometimes
Smoking marijuana frequently
Secondhand cigarette smoke
Secondhand marijuana smoke
Antigua and Barbuda 41.0 73.5 52.4 37.3 61.7 26.5 50.5 45.89 39.6 The Bahamas 34.8 67.9 57.7 37.1 54.7 44 63.4 38.5 57.7 Barbados 33.5 77.5 54.1 35.1 63 31.4 61 52.7 50 Belize 36.1 71.5 59.7 41.8 64 34.8 65 57.5 57.6 Dominica 38.7 69.9 57.3 37.3 54.7 34.4 58.6 51.2 50.1 Grenada 38.8 72.6 53.2 34.9 56.8 36.6 65.5 56.6 56.3 Guyana 52.7 70.2 60.6 41.6 56.8 54.1 73.4 60 64.9 Haiti 50.6 73.0 60.6 42.1 57.1 59.5 72.4 33.9 46.7 Jamaica 45.7 76.9 60.9 49.1 62.6 40.3 67.7 59 58.9 St. Kitts and Nevis 40.7 62.0 52 32.1 47.7 29.4 50.8 48.7 45.5 St. Lucia 47.0 72.3 57.4 40.2 61.2 36.4 59.3 52.9 52 St. Vincent/Grenadines 39.3 68.5 58.8 33.4 53.7 36.5 66.5 52.3 54.9 Trinidad and Tobago 39.2 78.0 60.7 41.4 64.2 41.4 64.7 58.7 56.6 Average 41.4 71.8 57.3 38.7 58.3 38.9 63.0 51.4 53.1

A Report on Students’ Drug Use in 13 Caribbean Countries 2016
Page |90
Perception that Substance Use is ‘Not Harmful
Cigarette and marijuana smoking were evaluated with respect to perception of not being harmful as indicated by students - (smoking cigarettes and secondhand smoke from both cigarettes and marijuana). The highest proportions were indicated for smoking marijuana sometimes (average of 11%), smoking marijuana sometimes (average 6.7%) and smoking cigarettes sometimes (5%). On average, a low proportion felt that inhaling secondhand cigarettes smoke was not harmful (4.5%) as well as inhaling secondhand marijuana smoke (6.2%), table 53. It is important to note that, though small, a notable proportion of students did not know of the dangers of inhaling secondhand smoke.
TABLE 53: PERCEPTION OF HARMFULNESS – USE NOT HARMFUL
Cigarettes Marijuana Some times
Frequently
Second hand
Some times
Frequently
Second hand
Antigua and Barbuda 4.9 2.9 5.5 19.0 13.6 11.8 The Bahamas 4.6 2.6 6.2 7.9 4.9 3.9 Barbados 4.5 1.4 2.5 15.7 9.1 1.0 Belize 5.1 2.8 3.6 9.9 6.3 6.2 Dominica 6.7 3.7 6.5 14.7 8.9 10.0 Grenada 6.3 3.5 5.1 10.3 6.4 6.4 Guyana 3.6 1.3 2.5 2.3 2.0 2.3 Haiti 3.7 1.7 4.8 1.8 1.6 2.9 Jamaica 5.1 2.6 4.0 8.8 5.0 5.4 St. Kitts and Nevis 4.3 3.2 5.2 16.4 9.9 7.6 St. Lucia 5.8 3.6 4.5 13.2 9.8 9.6 St. Vincent and the Grenadines 5.5 1.8 4.3 10.6 2.1 5.3 Trinidad and Tobago 4.8 2.6 3.8 12.9 8.0 7.6 Average 5.0 2.6 4.5 11.0 6.7 6.2

A Report on Students’ Drug Use in 13 Caribbean Countries 2016
Page |91
01234567
Figure 58: Perception No Harm (Smoking Cigarettes)
sometimes frequently secondhand
0
5
10
15
20
Figure 59: Perception No Harm (Smoking Marijuana)
sometimes frequently secondhand

A Report on Students’ Drug Use in 13 Caribbean Countries 2016
Page |92
TREND ANALYSIS – PERCEPTION OF HARM PERCEPTION OF HARMFULNESS In the 2010 report, just over four in every ten students (44.4%) felt that smoking cigarettes sometimes was very harmful. The proportion in 2013 was slightly lower (41.4%). For smoking cigarettes frequently the proportion for very harmful were similar (and (72.7%) in 2010 and 71.8% in 2013). The other substances that were indicated as being very harmful were: smoking marijuana frequently (71.4% in 2010 vs. 63% in 2013); getting drunk (66.3% in 2010 vs. 57.3% in 2013); inhaling solvents sometimes (37.2% in 2010 vs. 38.7 in 2013); and inhaling solvents frequently (57.7% in 2010 vs. 58.3% in 2013). In terms of substances that students felt were not harmful, the highest overall average proportions were indicated for smoking marijuana sometimes (8% in 2010 and increasing to 11% in 2013); drinking alcoholic beverages frequently (7% in 2010 decreasing to 5.7% in 2013), smoking cigarettes sometimes (5.9% in 2010 and decreasing to 5% in 2013); inhaling solvents sometimes (5.7% in 2010 and decreasing to 4% in 2013 ), and consuming ecstasy sometimes (5.6% in 2010 and decreasing to 3.7% in 2013).

A Report on Students’ Drug Use in 13 Caribbean Countries 2016
Page |93
USE RELATED RISK Students were asked to indicate their experience with certain situations because of drinking alcohol or using illicit drugs over the past 12 months (the question was, “Over the PAST 12 MONTHS, how often have you experienced or been in the following situations because of drinking alcohol or using illicit drugs?” There were ten response categories with the following options: never, rarely or seldom, sometimes, often and always. The options of sometimes, often and always were summed and expressed as students’ indications of having had the experience. The cumulative column refers to the total proportion of students that have experienced the indicated risk in the past year. The data is presented in tables 54a through 54k and further illustrated in figures 60a through 60j.
Country Specific Use-Related Risks
TABLE 54A: USE-RELATED RISKS – ANTIGUA AND BARBUDA
Never Rarely /Seldom
Sometimes
Often Almost always
Cum.
Getting a low grade on an important test/ exam or school project
75.8 10.6 11.8 1.0 0.8 24.2
Getting into some kind of trouble with the police
91.4 3.9 3.7 - 0.9 8.5
Getting into any angry argument or fight
73.7 8.5 13.1 2.6 2.1 26.3
Memory loss
82.2 6.2 7.2 2.4 2.1 17.9
Problems with your family/relatives/ households
79.8 5.3 10.9 2.3 1.6 20.1
Having someone taking sexual advantage of you.
92.3 2.8 2.5 0.7 1.7 7.7
Taking sexual advantage of someone.
90.5 3.3 2.8 0.9 2.4 9.4
Trying without success to stop drinking alcohol or taking illicit drugs
86.8 4.2 4.9 1.8 2.3 13.2
Self-harm (such as self-cutting, burning, hitting, etc.)
90.8 3.2 3.2 1.3 1.6 9.3
Seriously thinking about committing suicide 89.4 2.4 4.0 1.0 3.2 10.6 The most prevalent use-related risks reported by students in Antigua and Barbuda related to: Getting into angry argument or fight; problems with family; getting a low grade; and memory loss. More than 17% of students reported these (from a low of 17.9% (memory loss, up to 26.3% getting into an argument or fight)

A Report on Students’ Drug Use in 13 Caribbean Countries 2016
Page |94
TABLE 54B: USE-RELATED RISKS – BARBADOS
Never Rarely /Seldom
Sometimes
Often Almost always
Cum.
Getting a low grade on an important test/ exam or school project
83.0 7.4 7.5 1.1 1.0 17.0
Getting into some kind of trouble with the police
93.5 2.9 2.5 0.7 0.5 6.6
Getting into any angry argument or fight
77.7 8.9 9.8 2.2 1.4 22.3
Memory loss
88.0 4.8 4.2 2.1 0.9 12.0
Problems with your family/relatives/ households
81.2 6.8 6.9 2.8 2.3 18.8
Having someone taking sexual advantage of you.
93.5 2.5 1.9 1.4 0.7 6.5
Taking sexual advantage of someone.
94.4 1.8 2.2 0.9 0.7 5.6
Trying without success to stop drinking alcohol or taking illicit drugs
94.2 1.9 2.1 0.8 0.9 5.7
Self-harm (such as self-cutting, burning, hitting, etc.)
93.0 1.8 2.5 0.9 1.8 7.0
Seriously thinking about committing suicide 89.6 3.7 2.8 1.9 2.0 10.4 The most prevalent use-related risks reported by students in Barbados related to: Getting into angry argument or fight; problems with family; memory loss, getting a low grade; and interestingly, 10.4% reported -seriously thinking about committing suicide.
TABLE 54C: USE-RELATED RISKS – BELIZE Never Rarely
/Seldom Someti
mes Often Almost
always Cum.
Getting a low grade on an important test/ exam or school project
75.6 10.7 11.5 1.1 1.0 24.3
Getting into some kind of trouble with the police
892 5.1 3.5 1.1 1.1 10.8
Getting into any angry argument or fight
73.2 12.0 0.4 2.5 1.9 16.8
Memory loss
82.9 8.4 6.0 1.9 0.8 17.1
Problems with your family/relatives/ households
79.1 8.5 7.8 2.6 2.0 20.9
Having someone taking sexual advantage of you.
94.6 2.0 1.8 0.9 0.8 5.5
Taking sexual advantage of someone.
94.1 2.0 2.0 1.2 0.7 5.9
Trying without success to stop drinking alcohol or taking illicit drugs
86.8 4.2 4.7 2.5 1.9 13.3
Self-harm (such as self-cutting, burning, hitting, etc.)
90.8 2.6 3.5 1.1 2.0 9.2
Seriously thinking about committing suicide 90.9 2.6 3.4 1.3 1.8 9.1 The most prevalent use-related risks reported by students in Belize related to: Getting a low grade; problems with family; memory loss; getting into angry argument and fights, and trying without success to stop drinking alcohol or taking illicit drugs. Some 9% of students also reported ‘seriously thinking about committing suicide’ and ‘self-harm’.
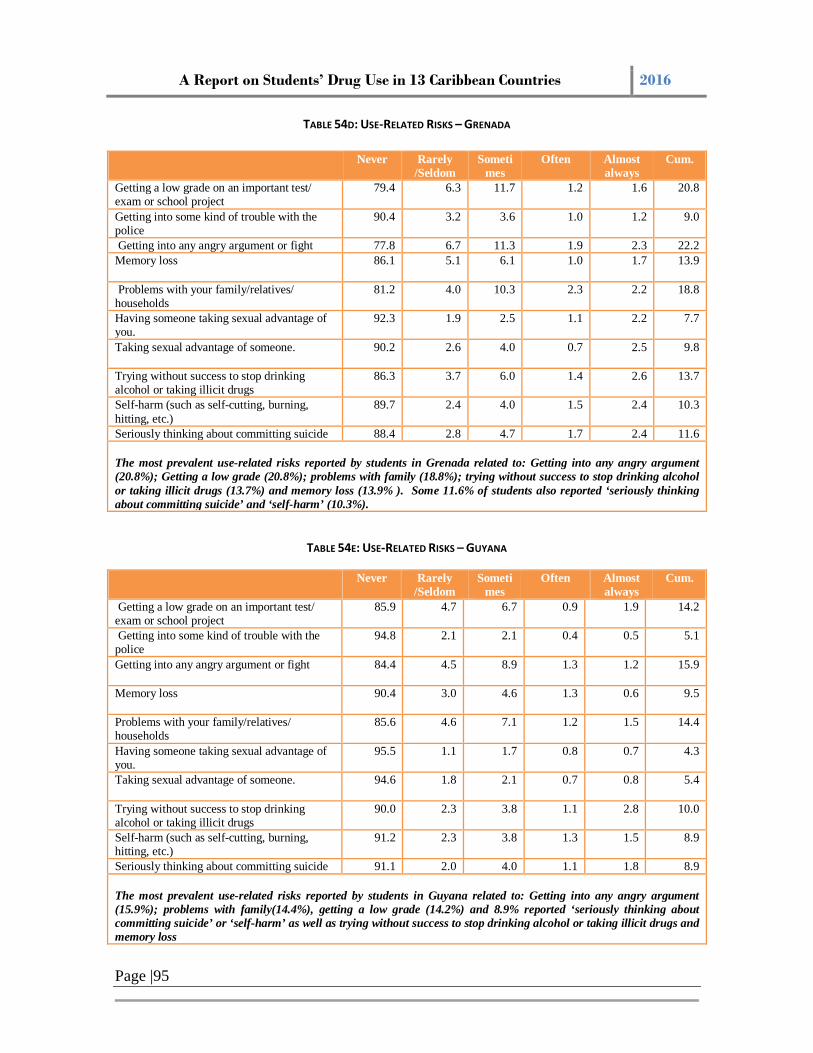
A Report on Students’ Drug Use in 13 Caribbean Countries 2016
Page |95
TABLE 54D: USE-RELATED RISKS – GRENADA Never Rarely
/Seldom Someti
mes Often Almost
always Cum.
Getting a low grade on an important test/ exam or school project
79.4 6.3 11.7 1.2 1.6 20.8
Getting into some kind of trouble with the police
90.4 3.2 3.6 1.0 1.2 9.0
Getting into any angry argument or fight 77.8 6.7 11.3 1.9 2.3 22.2 Memory loss
86.1 5.1 6.1 1.0 1.7 13.9
Problems with your family/relatives/ households
81.2 4.0 10.3 2.3 2.2 18.8
Having someone taking sexual advantage of you.
92.3 1.9 2.5 1.1 2.2 7.7
Taking sexual advantage of someone.
90.2 2.6 4.0 0.7 2.5 9.8
Trying without success to stop drinking alcohol or taking illicit drugs
86.3 3.7 6.0 1.4 2.6 13.7
Self-harm (such as self-cutting, burning, hitting, etc.)
89.7 2.4 4.0 1.5 2.4 10.3
Seriously thinking about committing suicide 88.4 2.8 4.7 1.7 2.4 11.6 The most prevalent use-related risks reported by students in Grenada related to: Getting into any angry argument (20.8%); Getting a low grade (20.8%); problems with family (18.8%); trying without success to stop drinking alcohol or taking illicit drugs (13.7%) and memory loss (13.9% ). Some 11.6% of students also reported ‘seriously thinking about committing suicide’ and ‘self-harm’ (10.3%).
TABLE 54E: USE-RELATED RISKS – GUYANA Never Rarely
/Seldom Someti
mes Often Almost
always Cum.
Getting a low grade on an important test/ exam or school project
85.9 4.7 6.7 0.9 1.9 14.2
Getting into some kind of trouble with the police
94.8 2.1 2.1 0.4 0.5 5.1
Getting into any angry argument or fight
84.4 4.5 8.9 1.3 1.2 15.9
Memory loss
90.4 3.0 4.6 1.3 0.6 9.5
Problems with your family/relatives/ households
85.6 4.6 7.1 1.2 1.5 14.4
Having someone taking sexual advantage of you.
95.5 1.1 1.7 0.8 0.7 4.3
Taking sexual advantage of someone.
94.6 1.8 2.1 0.7 0.8 5.4
Trying without success to stop drinking alcohol or taking illicit drugs
90.0 2.3 3.8 1.1 2.8 10.0
Self-harm (such as self-cutting, burning, hitting, etc.)
91.2 2.3 3.8 1.3 1.5 8.9
Seriously thinking about committing suicide 91.1 2.0 4.0 1.1 1.8 8.9 The most prevalent use-related risks reported by students in Guyana related to: Getting into any angry argument (15.9%); problems with family(14.4%), getting a low grade (14.2%) and 8.9% reported ‘seriously thinking about committing suicide’ or ‘self-harm’ as well as trying without success to stop drinking alcohol or taking illicit drugs and memory loss

A Report on Students’ Drug Use in 13 Caribbean Countries 2016
Page |96
TABLE 54F: USE-RELATED RISKS – HAITI Never Rarely
/Seldom Someti
mes Often Almost
always Cum.
Getting a low grade on an important test/ exam or school project
81.6 7.3 8.8 1.3 1.0 18.4
Getting into some kind of trouble with the police
95.5 1.6 1.6 0.7 0.6 4.5
Getting into any angry argument or fight
89.6 4.1 4.5 1.1 0.8 10.5
Memory loss
92.9 2.3 3.0 1.0 0.8 7.1
Problems with your family/relatives/ households
88.9 4.2 4.4 1.5 0.9 11.0
Having someone taking sexual advantage of you.
93.9 2.2 2.2 0.6 1.0 6.0
Taking sexual advantage of someone.
93.3 2.1 2.7 1.2 0.7 6.7
Trying without success to stop drinking alcohol or taking illicit drugs
94.0 1.7 1.8 1.2 0.3 5.0
Self-harm (such as self-cutting, burning, hitting, etc.)
94.9 2.0 1.9 0.6 0.6 5.1
Seriously thinking about committing suicide 93.3 2.2 2.3 1.2 0.9 6.6 The most prevalent use-related risks reported by students in Haiti related to: Getting a low grade (18.4%; problems with family (11%); and Getting into any angry argument (10.5%). Just about 7% or less reported having experienced the other situations.
TABLE 54G: USE-RELATED RISKS – JAMAICA
Never Rarely
/Seldom Someti
mes Often Almost
always Cum.
Getting a low grade on an important test/ exam or school project
80.0 5.7 12.7 0.8 0.8 20.0
Getting into some kind of trouble with the police
96.4 2.2 2.1 0.3 0.6 5.2
Getting into any angry argument or fight
79.9 7.5 9.8 1.8 1.1 20.2
Memory loss
87.6 5.1 5.2 1.3 0.8 12.4
Problems with your family/relatives/ households
80.7 5.5 9.4 2.9 1.5 19.3
Having someone taking sexual advantage of you.
94.4 1.9 3.4 0.6 0.8 6.7
Taking sexual advantage of someone.
94.1 2.1 2.3 0.7 0.7 5.8
Trying without success to stop drinking alcohol or taking illicit drugs
91.3 2.2 3.5 1.5 1.7 8.9
Self-harm (such as self-cutting, burning, hitting, etc.)
93.4 2.2 2.6 0.8 1.0 6.6
Seriously thinking about committing suicide 90.2 2.6 4.1 1.3 1.8 9.8 The most prevalent use-related risks reported by students in Jamaica related to: Getting into angry argument or fight (20.2%); Getting a low grade (20%); problems with family (19.3%); memory loss (12.4%. Some 9.8% of students also reported ‘seriously thinking about committing suicide’.

A Report on Students’ Drug Use in 13 Caribbean Countries 2016
Page |97
TABLE 54H: USE-RELATED RISKS – ST. KITTS AND NEVIS Never Rarely
/Seldom Sometim
es Often Almost
always Cum.
Getting a low grade on an important test/ exam or school project
79.1 6.5 11.5 1.5 1.5 21.0
Getting into some kind of trouble with the police
92.2 3.7 2.9 0.5 0.7 7.8
Getting into any angry argument or fight 77.3 8.7 10.4 2.4 1.3 22.8 Memory loss
86.9 5.5 6.0 0.2 1.5 13.2
Problems with your family/relatives/ households
82.2 5.5 8.9 2.3 1.1 17.8
Having someone taking sexual advantage of you.
93.1 1.8 2.4 1.7 1.1 7.0
Taking sexual advantage of someone.
91.3 2.4 3.7 1.5 1.1 8.7
Trying without success to stop drinking alcohol or taking illicit drugs
86.8 2.7 6.3 1.3 2.9 13.2
Self-harm (such as self-cutting, burning, hitting, etc.)
91.5 2.9 4.2 0.7 0.7 8.5
Seriously thinking about committing suicide 92.8 2.0 2.5 0.9 1.8 7.2 The most prevalent use-related risks reported by students in St. Kitts and Nevis related to: Getting into angry argument or fight (22.8%); Getting a low grade (21%); problems with family (17.83%); and trying without success to stop drinking alcohol or taking illicit drugs (13.2%); and memory loss (13.2%). Less than 9% of students reported having experienced the other situations.
TABLE 54I: USE-RELATED RISKS – ST. LUCIA Never Rarely
/Seldom Sometim
es Often Almost
always Cum.
Getting a low grade on an important test/ exam or school project
78.8 6.9 10.9 2.7 0.7 21.2
Getting into some kind of trouble with the police
92.8 2.8 3.3 0.4 0.7 7.2
Getting into any angry argument or fight
78.0 8.3 10.2 2.3 1.2 22.0
Memory loss
84.4 5.9 6.3 1.9 1.0 15.1
Problems with your family/relatives/ households
80.7 6.1 8.9 2.1 2.2 19.3
Having someone taking sexual advantage of you.
94.2 2.3 1.8 0.5 1.2 5.8
Taking sexual advantage of someone.
94.1 1.9 2.2 0.8 1.0 5.9
Trying without success to stop drinking alcohol or taking illicit drugs
89.0 3.8 4.4 1.3 1.4 10.9
Self-harm (such as self-cutting, burning, hitting, etc.)
90.2 3.5 3.2 1.8 1.3 9.8
Seriously thinking about committing suicide 90.0 3.2 3.5 1.0 2.3 10.0 The most prevalent use-related risks reported by students in St. Lucia related to: Getting into any angry argument (22% ); Getting a low grade (21.2%);; problems with family (19.3%); memory loss (15.1%) and trying without success to stop drinking alcohol or taking illicit drugs (10.9%). Some 10% of students also reported ‘seriously thinking about committing suicide’.

A Report on Students’ Drug Use in 13 Caribbean Countries 2016
Page |98
TABLE 54J: USE-RELATED RISKS – ST. VINCENT AND THE GRENADINES Never Rarely
/Seldom Sometime
s Often Almost
always Cum.
Getting a low grade on an important test/ exam or school project
80.2 5.4 11.8 1.5 1.1 19.8
Getting into some kind of trouble with the police
93.1 2.7 2.9 0.5 0.5 6.6
Getting into any angry argument or fight 78.8 2.1 10.7 2.0 1.3 16.1 Memory loss
88.4 4.4 4.2 1.5 1.5 11.6
Problems with your family/relatives/ households
82.0 5.4 8.8 2.6 1.3 18.1
Having someone taking sexual advantage of you.
97.3 2.1 1.9 0.8 1.4 6.2
Taking sexual advantage of someone.
93.3 1.6 2.7 0.8 1.6 6.7
Trying without success to stop drinking alcohol or taking illicit drugs
89.1 3.4 3.5 1.2 2.8 10.9
Self-harm (such as self-cutting, burning, hitting, etc.)
92.1 2.1 3.7 0.5 1.6 7.9
Seriously thinking about committing suicide 89.7 2.0 3.9 1.9 2.4 10.2 The most prevalent use-related risks reported by students in St. Vincent and the Grenadines related to: Getting a low grade (19.8%); problems with family (18.1%); getting into angry argument or fight (16.1%); and memory loss (11.6%). Some 10.2% of students also reported ‘seriously thinking about committing suicide’ and 10.9% reported trying without success to stop drinking alcohol or taking illicit drugs.
TABLE 54K: USE-RELATED RISKS – TRINIDAD AND TOBAGO Never Rarely
/Seldom Sometime
s Often Almost
always Cum.
Getting a low grade on an important test/ exam or school project
79.0 9.0 9.6 1.4 1.0 21.0
Getting into some kind of trouble with the police
93.8 2.9 2.0 0.5 0.8 6.2
Getting into any angry argument or fight 81.3 8.0 7.3 2.2 1.2 18.7 Memory loss
84.4 7.3 5.5 1.7 1.1 15.6
Problems with your family/relatives/ households
81.8 1.8 6.2 1.8 2.1 11.9
Having someone taking sexual advantage of you.
94.5 2.1 1.6 0.6 1.2 5.5
Taking sexual advantage of someone.
94.7 2.0 1.0 0.7 1.1 4.8
Trying without success to stop drinking alcohol or taking illicit drugs
90.9 3.0 2.8 1.3 2.0 9.1
Self-harm (such as self-cutting, burning, hitting, etc.)
90.8 3.6 2.9 1.1 1.6 9.2
Seriously thinking about committing suicide 89.4 3.7 3.3 1.5 2.1 10.6 The most prevalent use-related risks reported by students in Trinidad and Tobago related to: Getting a low grade (21%); Getting into angry argument or fight (18.7%); problems with family (11.9%); memory loss (15.6%). Some 10.6% of students also reported ‘seriously thinking about committing suicide’ and 9% ‘self-harm’.

A Report on Students’ Drug Use in 13 Caribbean Countries 2016
Page |99
Overall Use-Related Risks Getting a low grade (figure 60a) The proportion of students who indicated that they have experienced getting a low grade ranged from a high of 24.3% to a low of 14.2%. A proportion above 20% was reported in seven countries. The highest proportions were reported by Belize and Antigua and Barbuda, followed by St. Lucia, St. Kitts and Nevis, Trinidad and Tobago and Grenada. Guyana reported the lowest proportion.
Trouble with the Police (figure 60b) The proportion of students who indicated that they have experienced trouble with the police ranged from a high of 10.8% to a low of 4.5%. A proportion above 8% was reported in three countries. Belize and Grenada reported the highest prevalence followed by Antigua and Barbuda.
Getting into angry arguments or fights (figure 60c) The proportion of students who indicated that they have experienced getting into angry arguments or fights ranged from a high of 26.3% (Antigua and Barbuda) to a low of 10.5% (Haiti). A proportion above 20% was reported in six countries—Antigua and Barbuda with the highest followed by St. Kitts and Nevis, Barbados, Grenada, St. Lucia and Jamaica.
05
1015202530
Figure 60a: Getting a low grade
02468
1012
Figure 60b: Trouble with the police

A Report on Students’ Drug Use in 13 Caribbean Countries 2016
Page |100
Memory Loss (figure 60d) The proportion of students who indicated that they have experienced memory loss ranged from a high of 17.9% (Antigua and Barbuda), to a low of 4.5% (Haiti). A proportion above 10% was reported in ten of twelve countries: Guyana and Haiti being the two countries with proportion below 10%.
Problems with Family (figure 60e) The proportion of students who indicated that they have experienced problems with family ranged from a high of 20.9% (Belize) to a low of 11% (Haiti). A proportion above 15% was reported in eight countries. Highest reported by Belize followed by Antigua and Barbuda, Jamaica, St. Lucia, Barbados, Grenada, St. Vincent and the Grenadines and St. Kitts and Nevis.
05
1015202530
Figure 60c: Getting into angry arguments or fights
02468
101214161820
Figure 60d: Memory loss

A Report on Students’ Drug Use in 13 Caribbean Countries 2016
Page |101
Having Someone Take Sexual Advantage of You (figure 60f) The proportion of students who indicated that they have experienced having someone take sexual advantage of them ranged from a high of 7.7% to a low of 4.3%--the overall prevalence for this category was relatively low. A proportion above 5% was reported in all countries with the exception of Guyana (4.3%).
Taking Sexual Advantage of Someone (figure 60g) The proportion of students who indicated that they have experienced taking sexual advantage of someone ranged from a high of 9.8% (Grenada) to a low of 4.8% (Trinidad and Tobago). A proportion above 6% was reported in five countries. Highest prevalence in Grenada followed by Antigua and Barbuda and St. Kitts and Nevis, Haiti, and St. Vincent and the Grenadines.
0
5
10
15
20
25
Figure 60e: Problem with family
0123456789
Figure 60f: Having someone take sexual advantage of you

A Report on Students’ Drug Use in 13 Caribbean Countries 2016
Page |102
Trying Without Success to Stop Using (figure 60h) The proportion of students who indicated that they have experienced trying without success to stop using ranged from a high of 13.7% (Grenada) to a low of 5% (Haiti). A proportion above 10% was reported in six—Grenada followed by Belize, Antigua and Barbuda, St. Kitts and Nevis, St. Lucia and St. Vincent and the Grenadines.
Inflicting Self-Harm (figure 60i) The proportion of students who indicated that they have experienced inflicting self-harm ranged from a high of 10.3% (Grenada) to a low of 5.1% (Haiti). A proportion above 8% was reported in seven countries. The highest prevalence was reported by Grenada followed by St. Lucia, Antigua and Barbuda, Belize and Trinidad and Tobago.
0
2
4
6
8
10
12
Figure 60g: Taking sexual advantage of someone
02468
10121416
Figure 60h: Trying without success to stop using
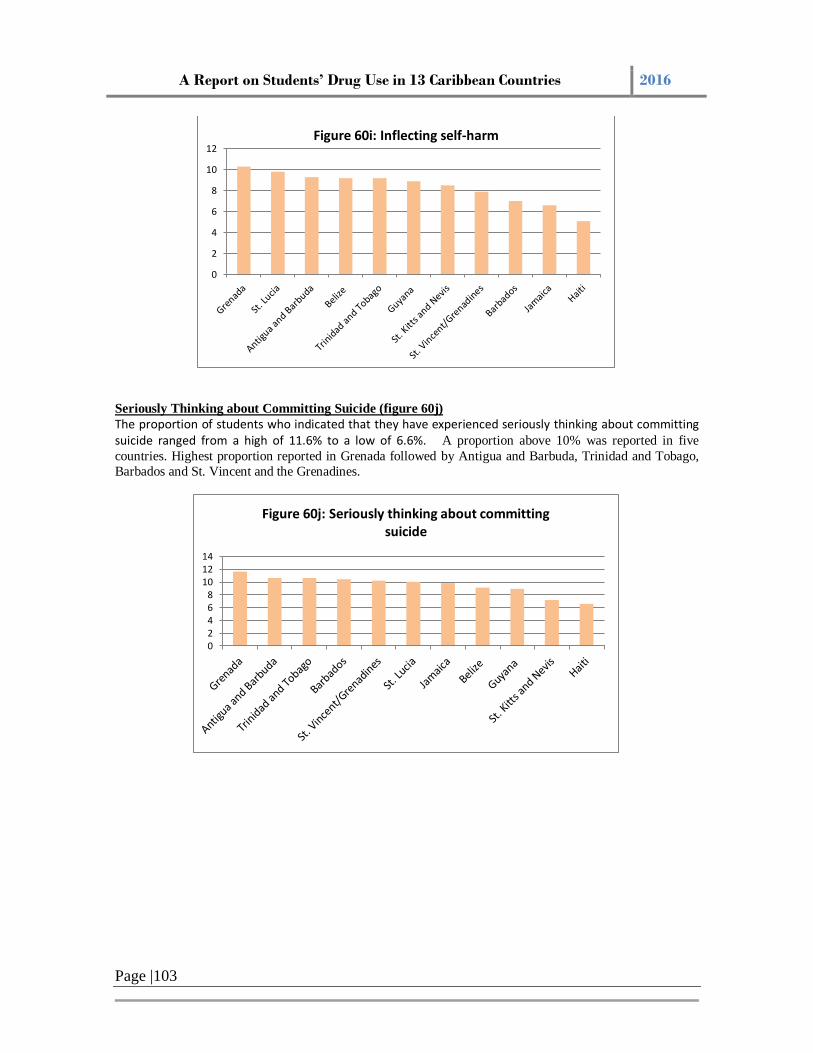
A Report on Students’ Drug Use in 13 Caribbean Countries 2016
Page |103
Seriously Thinking about Committing Suicide (figure 60j) The proportion of students who indicated that they have experienced seriously thinking about committing suicide ranged from a high of 11.6% to a low of 6.6%. A proportion above 10% was reported in five countries. Highest proportion reported in Grenada followed by Antigua and Barbuda, Trinidad and Tobago, Barbados and St. Vincent and the Grenadines.
0
2
4
6
8
10
12Figure 60i: Inflecting self-harm
02468
101214
Figure 60j: Seriously thinking about committing suicide

A Report on Students’ Drug Use in 13 Caribbean Countries 2016
104
CHAPTER 3
Discussion Alcohol and marijuana are the main drugs of use in most countries. Prevalence is relatively
high but there is substantial variability from country to country. Tobacco is also used
throughout the region, but to a lesser extent than alcohol and even marijuana. Prevalence
suggests that cigarette use is mainly for the purpose of experimentation, given that current
use rates are very low. What is interesting is the comparison of use of cigarettes versus
marijuana—past year marijuana prevalence surpassed past year cigarette prevalence in most
of the countries by a factor of two to three times in some instances and past month
prevalence for marijuana was also notably higher than past month cigarette use in most
countries.
Inhalants prevalence presents another very interesting pattern. Past month prevalence show
slightly higher prevalence reported by females compared to males but in some countries the
differences are notably higher among the females where this prevalence is higher. Age of
first use of substances in general was typically around 11-12 years old, with Haiti and
particularly in the case of marijuana, Belize being notable exceptions with a slightly later age
of first use.
Given the high prevalence of inhalant use that was reported in the 2010 report, it was decided
to use the opportunity of the 2013 round of surveys to test the way that the inhalant question
was constructed. The construct – “Have you ever sniffed inhalants such as glue, whiteout,
paint, thinners, etc. in order to get high?”— was used to estimate an adjusted prevalence rate
which likely better reflects the actual prevalence of inhalant use since it targeted only those
who had used inhalants at some point in their lives.
From this analysis it was clear that the adjusted prevalence in all countries was less than half
of the original estimate for lifetime prevalence. In Barbados, for example, the adjusted

A Report on Students’ Drug Use in 13 Caribbean Countries 2016
105
lifetime prevalence was 8.87% as opposed to 20.3% as originally estimated and similarly St.
Lucia the adjusted figure was 8.57% vs the original 20.6%. Although this was used for the
first time, it is instructive to note the huge potential difference in prevalence derived from
this methodology. Needless to say, it should continue to be explored in future surveys.
The relationship between behavioral problems and drug use was also of concern. The results
indicate that there is a consistent positive relationship between past year and past month
prevalence and behavioral problems. This relationship is such that as the numbers of
behavioral problems increase; so too does prevalence of alcohol, tobacco and other drug use.
A very important finding relates to students’ perception of how easy it is to access drugs.
Perception of availability of marijuana was high-- four to five of every ten students indicated
that they could access marijuana easily in 69% of the countries surveyed. The other
noteworthy aspect of the finding is that relatively high proportions of students also felt that
cocaine/crack cocaine was easily available—on average, 10% of students. Of great concern
is the fact that the results indicated some 26.6% of students overall were at high risk for
cannabis abuse with another 37.3% at low risk. This situation needs to be addressed seeing
that the most prevalent illegal drug used was marijuana and that past month and past year
marijuana use surpasses that of cigarettes use. The most important finding about marijuana
was that in most countries there was an increase in prevalence when compared to the 2010
report and at the same time there was a decline in the harm associated with marijuana use.
There are serious prevention education implications for the findings related to perception of
harm related to substance use. It is important to note that a relatively high proportion of
students did not know of the dangers of taking tranquilizers sometimes or frequently;
inhaling solvents sometimes or frequently; and consuming ecstasy sometimes or frequently.
Coupled with this, from 5-11% of students did not relate any harm to the use of marijuana,
alcohol, cigarettes, inhalants.

A Report on Students’ Drug Use in 13 Caribbean Countries 2016
106
The trend analysis showed a slight decline in overall past year prevalence for alcohol; the
younger age cohort continues to use relatively high proportions of alcohol; binge drinking
was equally high in this survey compared to the 2010 report. For cigarettes, the 2013 survey
showed a slight decline in overall past year prevalence; some decreases in past year use was
noted among age cohorts; incidence (both past year and past month) were similar for both
periods.
In terms of inhalants, this survey showed a slight increase in overall past year prevalence
over the last period; females continue to report higher prevalence than males; and there was
no marked difference in age of first use of inhalants. Marijuana continues to be the most
widely used illegal substance reported by students. The 2013 survey showed a marked
increase in overall average lifetime, past year and past month prevalence over the 2010
report. Students overall perception of harmfulness in relation to the use of substances did not
change much—in some cases a lower proportion of students indicated that for example,
smoking marijuana frequently was very harmful (71.4% in 2010 report vs. 63% in 2013).
The principal policy uses that this analysis highlights are as follows:
1. It supports the formulation of policies, strategies and prevention initiatives that are
appropriate to the local conditions in each geographic locale. These policies and
strategies should be evidence-based and also rely on country-specific information.
2. It serves as a sound information base for policy development and provides the
supporting evidence for the implementation of drug control strategies.
3. It makes a direct contribution to improving information on drug consumption and
drug trends throughout the Caribbean region.
4. It serves as the building blocks for developing governmental strategic drug control
plans. Inherent in the results are opportunities for cross fertilization of ideas in that
countries can learn best practices for each other for implementation.
5. It acts as an early warning and validation tool for drug trends.
6. It provides a data-driven context for lobbying for the reduced availability of and
access to illegal drugs in each geographic region.

A Report on Students’ Drug Use in 13 Caribbean Countries 2016
107
7. It provides drug prevention education specialists with local information for local
action within the education systems as well as for public health promotion
opportunities.
8. The issue of harmfulness of substances still needs to be addressed in all countries.
The findings provide evidence to address these three main policy implications:
a. There are serious prevention education implications for the findings related to perception of harm related to substance use.
b. In relation to other regions, the prevalence of use of some of these substances particularly marijuana and inhalants, is relatively high.
c. The age of first use estimates are fairly consistent across countries so the specific point in time where prevention programs intervene can also be fairly uniform. The primary school secondary school transition is a critical time for intervention.

A Report on Students’ Drug Use in 13 Caribbean Countries 2016
108
APPENDICES
ALCOHOL
TABLE 4: ALCOHOL PREVALENCE BY GENDER
Country Lifetime Prevalence Past Year Prevalence Past Month Prevalence
Males Females Males Females Males Females Antigua and Barbuda 71.4 71.2 55.9 56.3 36.0 36.9 The Bahamas 66.4 68.4 44.2 47.6 26.9 28.1 Barbados 72.4 74.7 55.2 60.2 34.1 33.8 Belize 66.2 64.0 49.9 45.3 34.5 30.1 Dominica 81.6 81.6 72 73.5 55.1 57.1 Grenada 68.8 75.2 52.9 56.3 36.1 34.1 Guyana 58.5 51.1 36.8 30.2 20.1 14.2 Haiti 64.3 50.1 44.7 27.5 30.1 16.8 Jamaica 64.4 65.7 45.1 45.0 25.8 22.9 St. Kitts and Nevis 62.0 69.0 42.6 46.1 27.0 26.4 St. Lucia 73.6 76.1 55.4 58.7 39.1 40.9 St. Vincent and the Grenadines 70.1 73.2 59.6 57.5 47.3 46.6 Trinidad and Tobago 65.7 69.4 46.8 53.0 26.9 28.9 Average 68.1 68.4 49.8 49.5 31.8 29.7
TABLE 5: PAST YEAR AND PAST MONTH ALCOHOL PREVALENCE BY AGE GROUP
Country Past Year Prevalence Past Month Prevalence
14 years or less
15 – 16 years
17 years or more
14 years or less
15 – 16 years
17 years or more
Antigua and Barbuda 41.1 59.1 80.5 23.7 38.4 56.6 The Bahamas 34.8 58.3 62.6 18.2 36.8 41.6 Barbados 39.6 69.5 78.2 19.4 41.3 51.8 Belize 33.2 49.3 59.1 18.0 33.2 44.5 Dominica 48.8 63.2 67.5 23.7 43.9 32.3 Grenada 36.7 64.7 66.5 22.2 38.4 51.5 Guyana 20.0 39.3 46.1 11.4 17.5 28.8 Haiti 32.6 32.7 36.5 21.3 18.2 24.8 Jamaica 30.8 51.7 55.8 16.1 28.5 28.8 St. Kitts and Nevis 32.4 50.0 635 14.8 27.8 46.0 St. Lucia 44.4 65.2 74.3 29.1 46.9 56.3 St. Vincent and the Grenadines 44.4 65.4 72.3 33.8 52.6 61.5 Trinidad and Tobago 32.5 38.1 65.8 15.5 31.9 42.2 Average 36.3 54.3 63.7 20.6 35.0 43.6

A Report on Students’ Drug Use in 13 Caribbean Countries 2016
109
TABLE 6: PAST YEAR AND PAST MONTH ALCOHOL PREVALENCE BY GRADE LEVELS
Country Past Year Prevalence Past Month Prevalence 8th 10th 11/12th 8th 10th 11/12th
Antigua and Barbuda 39.5 62.8 76.1 25.2 40.3 50.4 The Bahamas 27.1 51.1 62.7 13.7 30.9 40.6 Barbados 27.3 51.6 73.5 11.6 28.5 45.9 Belize 39.6 58.8 52.1 24.6 42.8 37.7 Dominica 46.5 68.1 71.4 15.5 18.7 10.7 Grenada 35.9 61.0 72.6 20.9 40.1 41.9 Guyana 20.5 39.3 40.5 11.4 20.5 18.3 Haiti 26.0 38.0 41.3 16.0 23.6 28.0 Jamaica 25.9 49.6 54.6 12.9 27.5 29.2 St. Kitts and Nevis 32.5 49.4 55.5 15.8 32.6 30.8 St. Lucia 43.3 61.0 73.3 27.9 43.7 53.4 St. Vincent and the Grenadines 43.6 67.1 69.9 34.1 56.3 53.6 Trinidad and Tobago 29.2 53.1 62.6 15.0 27.8 37.2 Average 33.6 54.7 62.0 18.8 33.3 36.7
TABLE 8: AVERAGE AGE OF FIRST USE OF ALCOHOL BY GENDER
Country Country Average
Average Age of First Use of Alcohol by Gender
Males Females Antigua and Barbuda 12.2 11.8 12.5 The Bahamas 11.6 11.9 11.8 Barbados 11.7 11.5 11.7 Belize 13.4 12.9 13.8 Dominica 10.9 8.6 10.5 Grenada 12.0 11.9 12.2 Guyana 12.6 12.2 13.0 Haiti 13.7 13.6 13.9 Jamaica 12.3 12.0 12.6 St. Kitts and Nevis 11.9 11.7 12.1 St. Lucia 12.2 12.0 12.3 St. Vincent and the Grenadines 12.1 12.2 12.1 Trinidad and Tobago 12.4 11.8 12.8 Average 12.2 11.9 12.4

A Report on Students’ Drug Use in 13 Caribbean Countries 2016
110
TABLE 9: PAST YEAR AND PAST MONTH PREVALENCE OF ALCOHOL USE BY BEHAVIORAL PROBLEMS
Country Past Year Prevalence Past Month Prevalence Never Once Few
Times Often Never Once Few
Times Often
Antigua and Barbuda 37.9 53.6 67.2 87.6 17.0 29.3 47.7 77.7 The Bahamas 34.7 41.0 54.5 61.8 18.9 21.9 32.8 46.2 Barbados 38.8 50.3 67.7 69.2 21.1 30.0 38.9 43.3 Belize 35.8 47.7 70.7 82.7 22.2 32.6 51.9 61.4 Dominica 51.8 - 61.1 67.1 51.4 - 59.4 62.8 Grenada 40.2 54.5 70.7 61.2 23.9 32.6 47.8 49.1 Guyana 22.2 32.2 54.1 51.9 12.8 16.5 22.9 32.3 Haiti 29.5 40.0 45.2 57.7 17.4 27.1 32.3 53.4 Jamaica 36.3 50.4 62.0 62.9 17.2 27.1 37.8 46.9 St. Kitts and Nevis 31.9 40.7 51.4 62.7 17.3 21.9 28.8 56.0 St. Lucia 42.8 55.9 70.5 75.6 31.8 37.3 52.5 58.8 St. Vincent and the Grenadines 44.9 55.6 69.4 84.1 32.0 42.9 58.7 79.6 Trinidad and Tobago 37.8 50.3 66.3 73.2 18.6 26.8 40.3 55.6 Average 37.3 47.7 62.4 69.1 27.8 28.8 42.4 55.6
*For Dominica, the options were ‘never’, ‘few times’ and ‘frequently’.
CIGARETTES
TABLE 12B: CIGARETTE PREVALENCE BY GENDER Country Lifetime Prevalence Past Year Prevalence Past Month Prevalence Males Females Males Females Males Females Antigua and Barbuda 12.8 13.4 4.3 4.9 1.2 2.6 The Bahamas 14.4 9.3 5.4 3.5 3.0 1.1 Barbados 21.8 16.5 9.1 5.6 4.0 2.4 Belize 40.3 24.6 19.5 9.1 12.0 4.2 Dominica 38.4 26.4 16.9 10.9 9.1 5.4 Grenada 29.0 24.7 12.1 6.0 8.2 2.9 Guyana 24.6 13.5 7.4 3.7 4.5 1.2 Haiti 16.6 10.0 8.6 5.0 6.3 3.9 Jamaica 30.1 26.7 10.7 9.1 5.1 4.1 St. Kitts and Nevis 17.0 12.9 7.1 3.2 3.7 1.6 St. Lucia 25.5 16.8 8.9 3.3 5.8 1.9 St. Vincent and the Grenadines 27.6 21.7 11.2 8.2 5.8 5.5 Trinidad and Tobago 35.0 33.6 18.3 10.1 10.0 4.5 Average 25.6 19.2 10.7 6.4 6.1 3.2
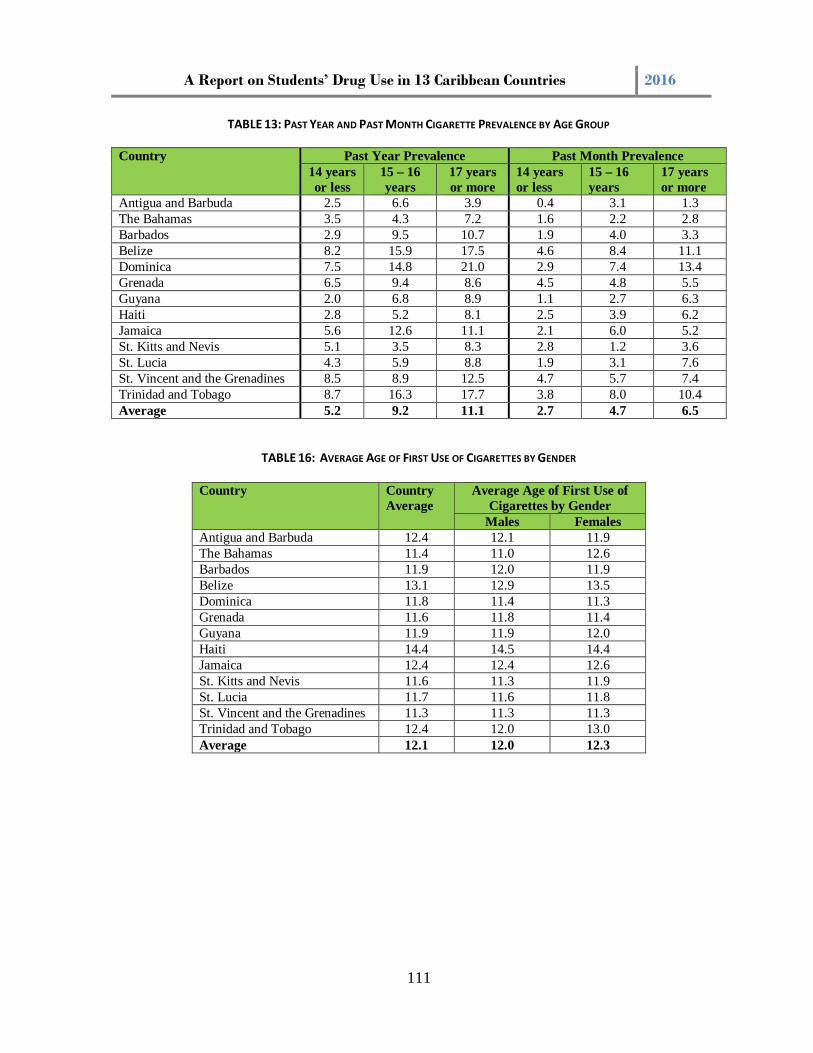
A Report on Students’ Drug Use in 13 Caribbean Countries 2016
111
TABLE 13: PAST YEAR AND PAST MONTH CIGARETTE PREVALENCE BY AGE GROUP Country Past Year Prevalence Past Month Prevalence
14 years or less
15 – 16 years
17 years or more
14 years or less
15 – 16 years
17 years or more
Antigua and Barbuda 2.5 6.6 3.9 0.4 3.1 1.3 The Bahamas 3.5 4.3 7.2 1.6 2.2 2.8 Barbados 2.9 9.5 10.7 1.9 4.0 3.3 Belize 8.2 15.9 17.5 4.6 8.4 11.1 Dominica 7.5 14.8 21.0 2.9 7.4 13.4 Grenada 6.5 9.4 8.6 4.5 4.8 5.5 Guyana 2.0 6.8 8.9 1.1 2.7 6.3 Haiti 2.8 5.2 8.1 2.5 3.9 6.2 Jamaica 5.6 12.6 11.1 2.1 6.0 5.2 St. Kitts and Nevis 5.1 3.5 8.3 2.8 1.2 3.6 St. Lucia 4.3 5.9 8.8 1.9 3.1 7.6 St. Vincent and the Grenadines 8.5 8.9 12.5 4.7 5.7 7.4 Trinidad and Tobago 8.7 16.3 17.7 3.8 8.0 10.4 Average 5.2 9.2 11.1 2.7 4.7 6.5
TABLE 16: AVERAGE AGE OF FIRST USE OF CIGARETTES BY GENDER
Country Country Average
Average Age of First Use of Cigarettes by Gender
Males Females Antigua and Barbuda 12.4 12.1 11.9 The Bahamas 11.4 11.0 12.6 Barbados 11.9 12.0 11.9 Belize 13.1 12.9 13.5 Dominica 11.8 11.4 11.3 Grenada 11.6 11.8 11.4 Guyana 11.9 11.9 12.0 Haiti 14.4 14.5 14.4 Jamaica 12.4 12.4 12.6 St. Kitts and Nevis 11.6 11.3 11.9 St. Lucia 11.7 11.6 11.8 St. Vincent and the Grenadines 11.3 11.3 11.3 Trinidad and Tobago 12.4 12.0 13.0 Average 12.1 12.0 12.3

A Report on Students’ Drug Use in 13 Caribbean Countries 2016
112
TABLE 18: PAST YEAR AND PAST MONTH PREVALENCE OF CIGARETTE USE BY BEHAVIORAL PROBLEMS
Country Past Year Prevalence Past Month Prevalence Never Once Few
Times Often Never Once Few
Times Often
Antigua and Barbuda 1.7 3.7 4.5 19.6 - 1.9 2.0 7.5 The Bahamas 4.5 7.2 12.8 26.3 0.4 0.8 1.3 2.9 Barbados 4.8 5.7 7.1 14.8 1.9 3.3 3.3 9.4 Belize 6.9 12.7 28.0 40.3 4.1 8.0 14.6 25.0 Dominica 6.5 - 18.5 35.8 2.7 - 10.1 22.5 Grenada 4.2 7.6 12.2 29.4 2.7 3.5 7.9 21.1 Guyana 2.5 5.2 9.6 14.4 1.3 2.5 4.4 10.2 Haiti 4.1 7.8 10.5 17.1 3.7 5.9 7.9 17.1 Jamaica 5.4 10.4 19.0 36.1 2.8 4.1 7.9 23.0 St. Kitts and Nevis 3.3 3.1 5.8 15.7 1.9 3.1 2.4 6.0 St. Lucia 3.5 4.6 8.2 19.2 2.4 1.7 5.5 11.7 St. Vincent and the Grenadines 5.8 6.7 13.3 18.4 4.2 4.5 6.8 14.0 Trinidad and Tobago 6.3 12.4 23.7 37.3 3.5 6.6 10.8 23.7 Average 4.6 7.3 13.3 25.0 2.6 3.8 6.5 14.9
INHALANTS
TABLE 21: INHALANTS PREVALENCE BY GENDER
Country Lifetime Prevalence Past Year Prevalence Past Month Prevalence
Males Females Males Females Males Females Antigua and Barbuda 11.6 17.8 4.0 8.7 2.6 5.7 The Bahamas 8.9 10.9 3.3 4.1 0.9 2.0 Barbados 18.6 22.6 7.8 11.9 5.3 8.7 Belize 10.6 9.8 6.4 4.8 3.7 2.8 Dominica 7.5 10.3 5.0 5.4 3.4 3.2 Grenada 17.8 14.4 11.1 8.3 6.5 5.8 Guyana 14.8 8.1 6.2 2.9 3.7 2.2 Haiti 7.2 5.6 5.2 3.8 2.3 1.7 Jamaica 11.8 14.6 5.3 7.6 3.0 5.1 St. Kitts and Nevis 12.5 14.1 7.1 7.0 5.7 4.5 St. Lucia 20.9 20.1 10.6 11.3 6.3 7.0 St. Vincent and the Grenadines 17.7 17.5 10.1 11.0 3.1 4.8 Trinidad and Tobago 14.9 16.0 6.3 7.3 4.1 4.4 Average 13.4 14.0 6.8 7.2 3.9 4.5

A Report on Students’ Drug Use in 13 Caribbean Countries 2016
113
TABLE 22: PAST YEAR AND PAST MONTH INHALANT PREVALENCE BY AGE GROUP
Country Past Year Prevalence Past Month Prevalence 14 years or less
15 – 16 years
17 years or more
14 years or less
15 – 16 years
17 years or more
Antigua and Barbuda 8.6 6.1 3.3 5.3 4.1 2.6 The Bahamas 5.0 2.6 1.8 2.0 1.1 0.7 Barbados 10.8 10.9 6.7 8.2 7.8 4.8 Belize 7.0 6.4 3.7 4.0 3.8 2.1 Dominica 5.4 5.2 5.0 3.2 3.4 4.0 Grenada 8.9 10.3 6.6 5.8 7.8 2.7 Guyana 4.9 4.2 1.8 3.6 2.6 0.7 Haiti 5.5 4.8 6.8 2.3 1.6 1.9 Jamaica 6.5 6.4 6.8 3.6 4.2 5.1 St. Kitts and Nevis 8.8 5.0 7.1 6.9 2.3 5.9 St. Lucia 11.6 10.0 12.7 7.5 6.2 5.7 St. Vincent and the Grenadines 2.1 1.7 2.8 1.5 1.1 2.8 Trinidad and Tobago 6.4 7.1 6.7 3.7 4.7 4.2 Average 7.0 6.2 5.5 4.4 3.9 3.3
TABLE 23: PAST YEAR AND PAST MONTH INHALANT PREVALENCE BY GRADE LEVELS
Country Past Year Prevalence Past Month Prevalence 8th 10th 11/12th 8th 10th 11/12th
Antigua and Barbuda 7.8 4.7 4.9 5.6 3.1 2.4 The Bahamas 3.5 5.5 1.6 1.0 2.7 0.5 Barbados 9.0 11.7 9.0 6.6 8.2 6.6 Belize 5.4 5.1 2.9 3.5 3.2 1.7 Dominica 5.6 5.1 4.0 3.5 3.4 2.7 Grenada 8.2 11.5 9.5 4.8 7.9 6.0 Guyana 4.7 4.5 3.3 3.5 2.4 2.4 Haiti 5.0 3.7 4.3 2.3 1.8 1.8 Jamaica 6.6 6.5 6.7 3.2 4.6 4.5 St. Kitts and Nevis 11.1 4.3 6.8 9.0 3.0 2.7 St. Lucia 12.5 8.6 11.6 8.0 6.0 6.0 St. Vincent and the Grenadines 13.7 9.8 6.6 5.2 3.6 3.1 Trinidad and Tobago 5.7 7.7 7.0 3.5 4.4 4.6 Average 7.6 11.3 6.0 4.6 4.2 3.5
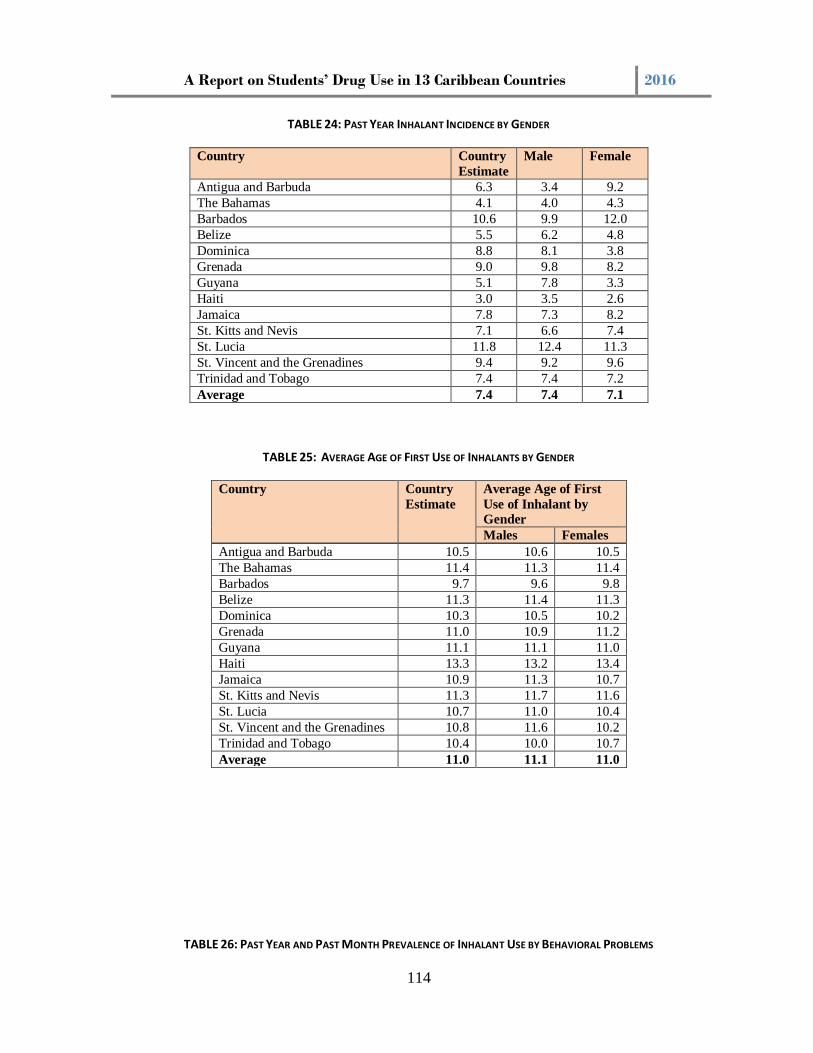
A Report on Students’ Drug Use in 13 Caribbean Countries 2016
114
TABLE 24: PAST YEAR INHALANT INCIDENCE BY GENDER
Country Country Estimate
Male Female
Antigua and Barbuda 6.3 3.4 9.2 The Bahamas 4.1 4.0 4.3 Barbados 10.6 9.9 12.0 Belize 5.5 6.2 4.8 Dominica 8.8 8.1 3.8 Grenada 9.0 9.8 8.2 Guyana 5.1 7.8 3.3 Haiti 3.0 3.5 2.6 Jamaica 7.8 7.3 8.2 St. Kitts and Nevis 7.1 6.6 7.4 St. Lucia 11.8 12.4 11.3 St. Vincent and the Grenadines 9.4 9.2 9.6 Trinidad and Tobago 7.4 7.4 7.2 Average 7.4 7.4 7.1
TABLE 25: AVERAGE AGE OF FIRST USE OF INHALANTS BY GENDER
Country Country Estimate
Average Age of First Use of Inhalant by Gender Males Females
Antigua and Barbuda 10.5 10.6 10.5 The Bahamas 11.4 11.3 11.4 Barbados 9.7 9.6 9.8 Belize 11.3 11.4 11.3 Dominica 10.3 10.5 10.2 Grenada 11.0 10.9 11.2 Guyana 11.1 11.1 11.0 Haiti 13.3 13.2 13.4 Jamaica 10.9 11.3 10.7 St. Kitts and Nevis 11.3 11.7 11.6 St. Lucia 10.7 11.0 10.4 St. Vincent and the Grenadines 10.8 11.6 10.2 Trinidad and Tobago 10.4 10.0 10.7 Average 11.0 11.1 11.0
TABLE 26: PAST YEAR AND PAST MONTH PREVALENCE OF INHALANT USE BY BEHAVIORAL PROBLEMS

A Report on Students’ Drug Use in 13 Caribbean Countries 2016
115
Country Past Year Prevalence Past Month Prevalence
Never Once Few Times
Often Never Once Few Times
Often
Antigua and Barbuda 5.5 7.8 4.6 11.7 2.3 6.7 2.7 7.5 The Bahamas 2.0 3.8 4.7 5.4 0.8 0.9 1.8 3.2 Barbados 6.3 10.8 11.0 19.4 4.6 7.7 7.4 16.6 Belize 3.5 6.1 6.9 19.3 1.9 4.2 4.2 5.8 Dominica 4.3 - 5.7 9.2 3.2 - 3.0 8.3 Grenada 6.8 9.6 10.8 28.0 4.6 6.2 67 17.4 Guyana 2.5 3.8 7.4 15.5 1.7 2.9 4.8 5.3 Haiti 3.7 4.5 5.6 6.6 1.6 1.4 2.9 6.6 Jamaica 5.7 6.2 8.9 16.4 3.6 3.6 5.7 14.4 St. Kitts and Nevis 6.0 5.5 7.1 28.4 3.9 5.5 4.3 18.7 St. Lucia 9.6 10.2 12.9 12.8 5.4 6.3 7.7 9.2 St. Vincent and the Grenadines 8.2 10.0 11.8 18.0 3.2 4.0 4.8 4.4 Trinidad and Tobago 4.7 7.3 9.4 9.6 2.6 4.4 6.2 7.5
MARIJUANA
TABLE 30: MARIJUANA PREVALENCE BY GENDER
Country Lifetime Prevalence Past Year Prevalence Past Month Prevalence
Males Females Males Females Males Females Antigua and Barbuda 36.8 25.4 27.9 16.8 22.0 11.1 The Bahamas 16.1 8.1 10.9 5.5 6.4 2.3 Barbados 27.5 19.6 20.3 15.5 14.6 9.2 Belize 31.7 16.7 22.5 9.2 16.2 5.1 Dominica 39.2 22.4 24.4 14.2 15.5 9.0 Grenada 24.3 15.0 16.0 9.9 9.0 5.0 Guyana 11.1 4.5 6.9 2.4 4.9 0.7 Haiti 3.6 2.8 2.4 2.3 1.1 1.3 Jamaica 25.4 18.0 14.5 10.1 7.6 5.2 St. Kitts and Nevis 28.6 20.1 20.1 12.7 14.7 9.1 St. Lucia 34.7 22.0 22.7 11.8 15.2 6.6 St. Vincent and the Grenadines 35.2 19.7 24.8 15.3 17.6 11.3 Trinidad and Tobago 21.2 12.3 13.8 8.0 5.6 4.1 Average 25.8 15.9 17.5 10.3 11.6 6.2

A Report on Students’ Drug Use in 13 Caribbean Countries 2016
116
TABLE 31: PAST YEAR AND PAST MONTH MARIJUANA PREVALENCE BY AGE GROUP
Country Past Year Prevalence Past Month Prevalence 14 years or less
15 – 16 years
17 years or more
14 years or less
15 – 16 years
17 years or more
Antigua and Barbuda 10.5 24.4 41.8 8.5 16.1 35.1 The Bahamas 4.5 11.5 11.1 2.0 6.7 6.5 Barbados 7.9 23.2 26.9 5.5 15.6 16.3 Belize 10.4 17.6 18.3 6.4 11.4 13.5 Dominica 10.6 21.8 27.5 6.6 12.8 18.8 Grenada 7.1 14.8 14.3 4.2 8.0 8.5 Guyana 2.9 3.2 11.2 1.5 2.2 4.9 Haiti 1.7 2.1 2.6 0.4 0.9 1.4 Jamaica 5.4 16.5 12.2 3.1 9.0 5.5 St. Kitts and Nevis 7.9 20.0 23.4 6.0 12.9 18.8 St. Lucia 10.6 19.9 25.5 6.3 11.6 18.7 St. Vincent and the Grenadines 12.3 20.8 30.4 7.2 16.3 23.0 Trinidad and Tobago 6.0 13.2 12.5 2.9 8.0 7.0 Average 7.5 16.1 19.8 4.7 10.1 13.7
TABLE 32: PAST YEAR AND PAST MONTH MARIJUANA PREVALENCE BY GRADE LEVELS
Country Past Year Prevalence Past Month Prevalence 8th 10th 11/12th 8th 10th 11/12th
Antigua and Barbuda 12.9 27.4 34.4 10.3 19.5 26.3 The Bahamas 2.8 10.2 11.9 1.0 5.9 6.3 Barbados 4.5 16.7 23.4 2.8 11.3 15.1 Belize 13.8 19.1 14.0 9.1 13.7 7.6 Dominica 13.9 25.0 18.8 9.4 14.9 14.3 Grenada 7.1 18.0 14.3 4.5 9.4 7.4 Guyana 3.0 4.4 5.4 1.6 2.8 2.8 Haiti 4.2 2.6 2.3 1.0 1.0 1.4 Jamaica 4.8 15.0 14.5 2.9 7.9 7.3 St. Kitts and Nevis 9.0 20.0 20.5 7.2 14.6 13.7 St. Lucia 12.0 18.1 22.3 7.5 9.2 15.8 St. Vincent and the Grenadines 13.1 24.3 22.1 7.9 18.5 17.3 Trinidad and Tobago 5.9 12.6 12.8 3.5 7.3 7.4 Average 8.2 16.4 16.7 5.3 10.5 11.0

A Report on Students’ Drug Use in 13 Caribbean Countries 2016
117
TABLE 33: PAST YEAR MARIJUANA INCIDENCE
Country Estimate
Males Females
Antigua and Barbuda 16.2 19.3 12.7 The Bahamas 6.3 8.7 4.2 Barbados 10.9 10.6 11.8 Belize 13.8 19.3 9.1 Dominica 12.7 14.7 7.1 Grenada 9.9 11.5 8.3 Guyana 3.3 6.0 1.5 Haiti 1.6 1.8 1.4 Jamaica 9.8 11.8 8.5 St. Kitts and Nevis 12.3 15.1 9.7 St. Lucia 13.8 18.0 10.4 St. Vincent and the Grenadines 12.9 17.8 9.5 Trinidad and Tobago 8.0 10.7 5.7 Average 10.1 12.7 7.7
TABLE 34: AVERAGE AGE OF FIRST USE OF MARIJUANA BY GENDER
Country Country Average
Average Age of First Use of Marijuana by Gender
Males Females Antigua and Barbuda 12.6 12.2 13.1 The Bahamas 12.9 12.8 13.1 Barbados 13.5 13.3 13.7 Belize 13.9 13.5 14.6 Dominica 12.7 12.4 13.2 Grenada 13.1 12.9 13.3 Guyana 13.1 13.2 12.8 Haiti 13.8 13.2 16.6 Jamaica 12.9 12.8 13.1 St. Kitts and Nevis 12.5 12.1 13.1 St. Lucia 13.3 13.1 13.5 St. Vincent and the Grenadines 12.7 12.5 12.9 Trinidad and Tobago 13.4 13.2 14.1 Average 13.1 12.9 13.6

A Report on Students’ Drug Use in 13 Caribbean Countries 2016
118
TABLE 36: MARIJUANA PREVALENCE BY NUMBER OF REPEATED SCHOOL YEARS
Country Lifetime - No. of Repeated School Years
Past Year - No. of Repeated School Years
Past Month - No. of Repeated School Years
None One Two plus
None One Two plus
None One Two plus
Antigua and Barbuda 26.9 40.0 44.0 18.6 30.5 33.3 12.4 24.4 27.5 The Bahamas 10.4 15.5 18.3 7.0 11.2 11.9 3.5 6.0 9.2 Barbados 18.8 41.1 28.0 14.3 30.6 23.4 9.2 19.9 21.2 Belize 19.9 30.5 47.1 13.0 18.6 36.5 8.0 14.3 23.0 Dominica 24.4 42.8 46.0 14.3 28.2 29.9 8.9 18.2 18.4 Grenada 16.8 28.8 27.7 10.6 19.0 22.3 5.8 10.0 12.4 Guyana 5.9 16.7 6.6 3.5 8.7 4.5 2.0 5.2 2.8 Haiti 2.9 3.4 2.7 2.3 2.4 2.3 1.0 1.4 1.4 Jamaica 19.5 26.3 23.4 10.9 14.7 15.4 5.7 7.9 8.4 St. Kitts and Nevis 22.9 24.5 38.5 14.0 18.5 29.4 10.5 10.7 24.7 St. Lucia 27.0 35.9 41.5 15.7 22.6 26.4 9.8 13.6 17.6 St. Vincent and the Grenadines 19.2 39.3 34.7 12.8 30.3 28.1 9.0 22.6 21.1 Trinidad and Tobago 16.1 18.5 20.9 10.8 10.6 10.5 6.2 6.0 7.5
TABLE 37: ACCESS TO MARIJUANA
Country Ease of Obtaining Marijuana Easy Hard Not be
able to Don’t know
Antigua and Barbuda 51.1 8.5 14.5 25.9 The Bahamas 28.9 12.8 15.0 39.7 Barbados 46.6 10.2 16.9 26.6 Belize 43.7 11.1 17.4 27.8 Dominica 49.7 12.0 15.3 19.4 Grenada 39.8 13.8 21.3 25.0 Guyana 18.9 18.0 27.8 35.9 Haiti 7.3 28.6 40.5 23.7 Jamaica 44.3 12.5 16.2 27.0 St. Kitts and Nevis 44.3 10.3 14.8 30.6 St. Lucia 49.6 12.0 15.8 22.5 St. Vincent and the Grenadines 45.8 14.5 16.5 23.2 Trinidad and Tobago 43.0 9.7 20.9 26.4 Average 39.5 13.4 19.5 27.2

A Report on Students’ Drug Use in 13 Caribbean Countries 2016
119
TABLE 38: PAST YEAR PREVALENCE OF MARIJUANA USE AND EASE OF ACCESS
Country One Year Prevalence of Marijuana by Ease of Obtaining it
Easy Hard Not be able to
Don’t know
Antigua and Barbuda 41.3 11.5 3.7 4.4 The Bahamas 21.9 5.4 1.5 1.4 Barbados 35.2 4.9 2.0 3.4 Belize 31.6 6.8 1.5 4.2 Dominica 33.3 12.7 2.9 4.4 Grenada 26.7 3.5 2.9 3.9 Guyana 14.3 2.7 2.3 1.3 Haiti 8.3 7.7 2.0 2.1 Jamaica 22.9 5.5 2.2 3.2 St. Kitts and Nevis 31.2 10.0 - 4.8 St. Lucia 30.6 7.2 1.0 5.3 St. Vincent and the Grenadines 33.9 8.7 6.2 6.6 Trinidad and Tobago 22.3 3.9 1.4 1.9 Average 27.2 7.0 2.3 3.6
TABLE 40: CANNABIS ABUSE SCREENING TEST
Abuse Risk Countries Not a
problem Low risk High risk
Antigua and Barbuda 29.7 36.4 36.9 The Bahamas * * * Barbados 46.5 34.0 19.4 Belize 23.0 41.3 35.7 Dominica * * * Grenada 28.6 45.0 26.4 Guyana 33.0 41.0 25.9 Haiti 59.7 19.5 20.8 Jamaica 33.9 40.7 25.4 St. Kitts and Nevis 38.1 38.0 23.9 St. Lucia 36.7 38.1 25.3 St. Vincent and the Grenadines 41.9 35.2 22.9 Trinidad and Tobago 29.4 40.6 30.0 Average 36.4 37.3 26.6
*Data not collected

A Report on Students’ Drug Use in 13 Caribbean Countries 2016
120
ANY ILLEGAL DRUGS
TABLE 41: PREVALENCE OF ANY ILLEGAL DRUG USE
Country Lifetime Prevalence
Past Year Prevalence
Past Month Prevalence
Antigua and Barbuda 41.3 27.3 20.3 The Bahamas 12.6 8.4 4.5 Barbados 37.4 25.1 17.2 Belize 32.8 19.8 13.1 Grenada 32.8 20.3 12.9 Guyana 19.5 8.2 5.1 Haiti 15.4 9.8 5.4 Jamaica 32.2 17.6 10.1 St. Kitts and Nevis 41.7 22.4 15.4 St. Lucia 42.0 25.0 16.2 St. Vincent and the Grenadines 39.0 26.3 17.4 Trinidad and Tobago 30.5 16.5 9.9 Average 31.4 18.9 12.3
TABLE 42: PREVALENCE OF ANY ILLEGAL DRUG BY GENDER
Country Lifetime Prevalence Past Year Prevalence Past Month Prevalence
Males Females Males Females Males Females Antigua and Barbuda 45.6 37.4 31.5 23.2 25.2 15.1 The Bahamas 16.8 8.4 11.4 5.4 6.7 2.5 Barbados 42.4 36.1 26.1 26.0 18.4 17.5 Belize 40.2 25.8 27.2 12.8 19.4 7.1 Grenada 36.5 29.0 23.1 17.3 15.0 10.6 Guyana 26.3 15.0 12.2 5.5 8.2 3.0 Haiti 17.4 3.5 11.1 8.5 6.2 4.6 Jamaica 35.5 29.7 19.5 16.1 10.7 9.6 St. Kitts and Nevis 41.5 41.0 24.1 20.3 17.4 13.5 St. Lucia 46.6 37.5 29.6 20.6 20.2 12.6 St. Vincent and the Grenadines 45.5 34.1 30.4 23.2 20.1 15.3 Trinidad and Tobago 34.5 27.2 18.8 14.4 12.2 8.0 Average 35.7 27.1 22.1 16.1 15.0 10.0

A Report on Students’ Drug Use in 13 Caribbean Countries 2016
121
TABLE 43: PAST YEAR AND PAST MONTH PREVALENCE OF ANY ILLEGAL DRUG BY AGE GROUP
Country Past Year Prevalence Past Month Prevalence
14 years or less
15 – 16 years
17 + years
14 years or less
15 – 16 years
17 + years
Antigua and Barbuda 18.2 28.9 43.2 12.9 20.1 35.7 The Bahamas 4.7 11.8 11.1 2.3 6.7 6.5 Barbados 17.0 32.1 33.6 12.8 22.6 20.4 Belize 14.6 22.3 21.8 9.2 14.2 15.8 Grenada 13.8 23.4 19.4 10.2 15.5 11.2 Guyana 7.2 7.7 12.9 4.9 5.0 5.5 Haiti 8.8 8.6 10.0 3.8 4.3 5.9 Jamaica 11.5 21.6 18.2 6.5 12.9 9.6 St. Kitts and Nevis 16.7 24.2 28.1 12.0 14.1 22.3 St. Lucia 19.5 26.8 35.0 13.1 16.2 24.3 St. Vincent and the Grenadines 22.6 25.4 35.1 11.9 18.6 35.1 Trinidad and Tobago 11.5 18.8 18.4 5.8 12.0 11.1 Average 13.8 21.0 23.9 8.9 13.5 17.0
TABLE 44: PAST YEAR AND PAST MONTH INCIDENCE OF ANY ILLEGAL DRUG
Country Incidence Past Year Past Month
Antigua and Barbuda 21.3 13.4 The Bahamas 7.3 2.9 Barbados 19.3 9.6 Belize 16.4 8.4 Grenada 16.7 9.6 Guyana 7.5 3.3 Haiti 6.3 4.3 Jamaica 16.5 7.8 St. Kitts and Nevis 18.5 11.3 St. Lucia 22.7 11.1 St. Vincent and the Grenadines 19.6 8.4 Trinidad and Tobago 13.9 7.2 Average 15.5 8.1

A Report on Students’ Drug Use in 13 Caribbean Countries 2016
122
TABLE 45: PAST YEAR AND PAST MONTH PREVALENCE OF ANY ILLEGAL DRUG USE BY BEHAVIORAL PROBLEMS
Country Past Year Prevalence Past Month Prevalence Never Once Few
Times Often Never Once Few
Times Often
Antigua and Barbuda 14.6 20.6 34.6 70.0 8.2 14.4 26.3 61.7 The Bahamas 4.0 5.1 10.1 24.2 2.3 2.3 5.1 16.1 Barbados 13.6 22.2 30.1 51.4 7.4 14.6 21.3 41.4 Belize 10.0 19.3 35.8 59.7 5.4 12.0 26.2 46.1 Grenada 13.1 19.7 25.7 39.7 8.7 12.1 15.8 29.7 Guyana 4.2 6.6 16.1 31.1 2.9 4.6 8.9 19.0 Haiti 8.2 10.0 12.9 14.6 4.3 4.4 8.4 14.6 Jamaica 11.8 17.6 30.2 53.2 6.9 9.2 17.5 42.3 St. Kitts and Nevis 12.7 14.7 28.0 53.0 9.3 13.1 17.4 37.3 St. Lucia 17.6 20.8 34.8 52.8 8.4 13.3 23.6 40.4 St. Vincent and the Grenadines 15.4 20.6 35.6 57.8 9.6 13.1 24.1 41.5 Trinidad and Tobago 9.6 17.2 23.5 41.2 5.5 9.7 14.9 25.7 Average 11.2 16.2 26.5 45.7 6.6 10.2 17.5 34.7
TABLE 46: ANY ILLEGAL DRUG USE PREVALENCE BY NUMBER OF REPEATED SCHOOL YEARS
Country Lifetime - No. of Repeated School Years
Past Year - No. of Repeated School Years
Past Month - No. of Repeated School Years
None One Two plus
None One Two plus
None One Two plus
Antigua and Barbuda 38.6 49.0 48.5 23.4 35.1 35.3 16.2 27.3 28.6 The Bahamas 10.6 16.3 20.2 7.0 11.7 13.8 3.6 6.6 9.2 Barbados 34.8 57.1 44.3 22.7 39.6 37.4 15.6 26.3 30.7 Belize 29.2 39.0 52.9 17.2 22.8 39.4 10.7 16.8 25.0 Grenada 31.5 39.0 34.2 18.4 24.7 26.8 11.5 15.3 18.2 Guyana 18.9 24.3 18.1 7.6 11.3 10.6 4.8 8.0 4.9 Haiti 15.6 15.2 15.7 10.6 9.0 9.8 5.3 4.9 6.5 Jamaica 30.3 39.3 33.4 16.1 22.0 20.3 9.1 13.6 10.8 St. Kitts and Nevis 41.1 40.3 51.9 21.4 22.1 36.0 14.0 14.4 31.6 St. Lucia 41.2 47.5 59.3 24.2 29.0 35.5 15.3 18.9 28.4 St. Vincent and the Grenadines 33.5 48.9 45.0 21.1 34.6 34.0 12.7 25.0 24.5 Trinidad and Tobago 31.0 29.4 33.1 16.7 14.9 19.6 9.7 9.9 13.8 Average 29.7 37.1 38.1 17.2 23.1 26.5 10.7 15.6 19.4
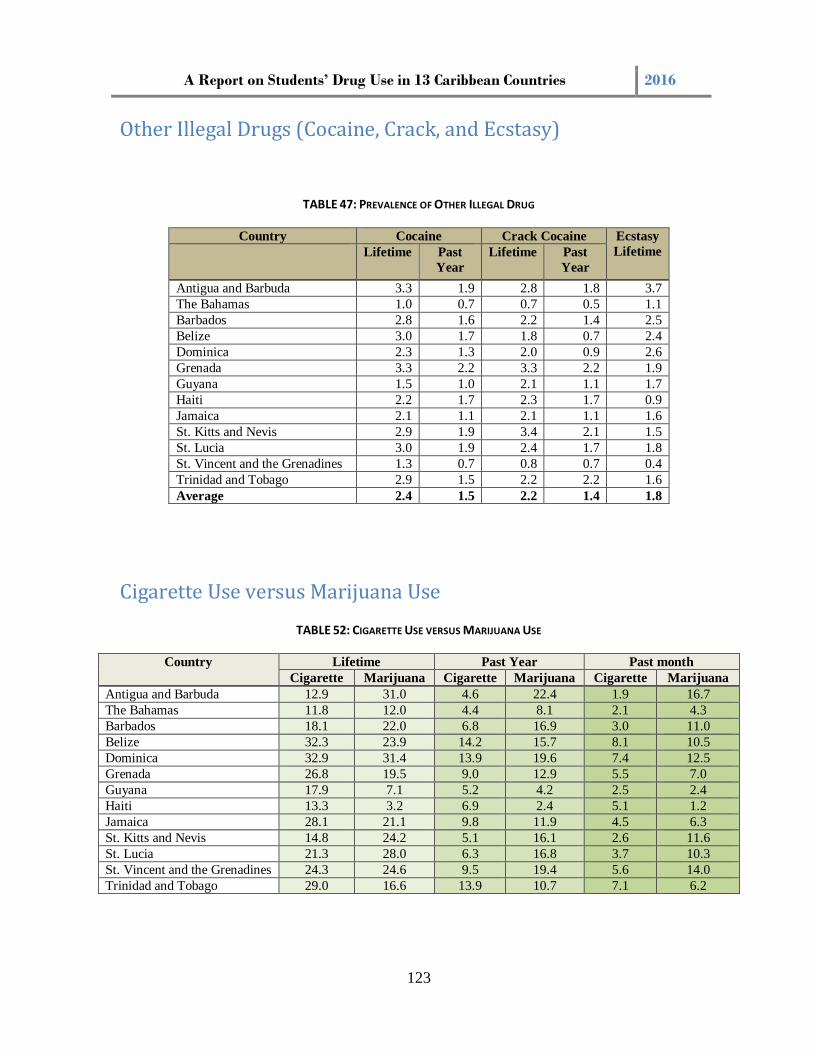
A Report on Students’ Drug Use in 13 Caribbean Countries 2016
123
Other Illegal Drugs (Cocaine, Crack, and Ecstasy)
TABLE 47: PREVALENCE OF OTHER ILLEGAL DRUG
Country Cocaine Crack Cocaine Ecstasy Lifetime Lifetime Past
Year Lifetime Past
Year Antigua and Barbuda 3.3 1.9 2.8 1.8 3.7 The Bahamas 1.0 0.7 0.7 0.5 1.1 Barbados 2.8 1.6 2.2 1.4 2.5 Belize 3.0 1.7 1.8 0.7 2.4 Dominica 2.3 1.3 2.0 0.9 2.6 Grenada 3.3 2.2 3.3 2.2 1.9 Guyana 1.5 1.0 2.1 1.1 1.7 Haiti 2.2 1.7 2.3 1.7 0.9 Jamaica 2.1 1.1 2.1 1.1 1.6 St. Kitts and Nevis 2.9 1.9 3.4 2.1 1.5 St. Lucia 3.0 1.9 2.4 1.7 1.8 St. Vincent and the Grenadines 1.3 0.7 0.8 0.7 0.4 Trinidad and Tobago 2.9 1.5 2.2 2.2 1.6 Average 2.4 1.5 2.2 1.4 1.8
Cigarette Use versus Marijuana Use
TABLE 52: CIGARETTE USE VERSUS MARIJUANA USE
Country Lifetime Past Year Past month Cigarette Marijuana Cigarette Marijuana Cigarette Marijuana
Antigua and Barbuda 12.9 31.0 4.6 22.4 1.9 16.7 The Bahamas 11.8 12.0 4.4 8.1 2.1 4.3 Barbados 18.1 22.0 6.8 16.9 3.0 11.0 Belize 32.3 23.9 14.2 15.7 8.1 10.5 Dominica 32.9 31.4 13.9 19.6 7.4 12.5 Grenada 26.8 19.5 9.0 12.9 5.5 7.0 Guyana 17.9 7.1 5.2 4.2 2.5 2.4 Haiti 13.3 3.2 6.9 2.4 5.1 1.2 Jamaica 28.1 21.1 9.8 11.9 4.5 6.3 St. Kitts and Nevis 14.8 24.2 5.1 16.1 2.6 11.6 St. Lucia 21.3 28.0 6.3 16.8 3.7 10.3 St. Vincent and the Grenadines 24.3 24.6 9.5 19.4 5.6 14.0 Trinidad and Tobago 29.0 16.6 13.9 10.7 7.1 6.2
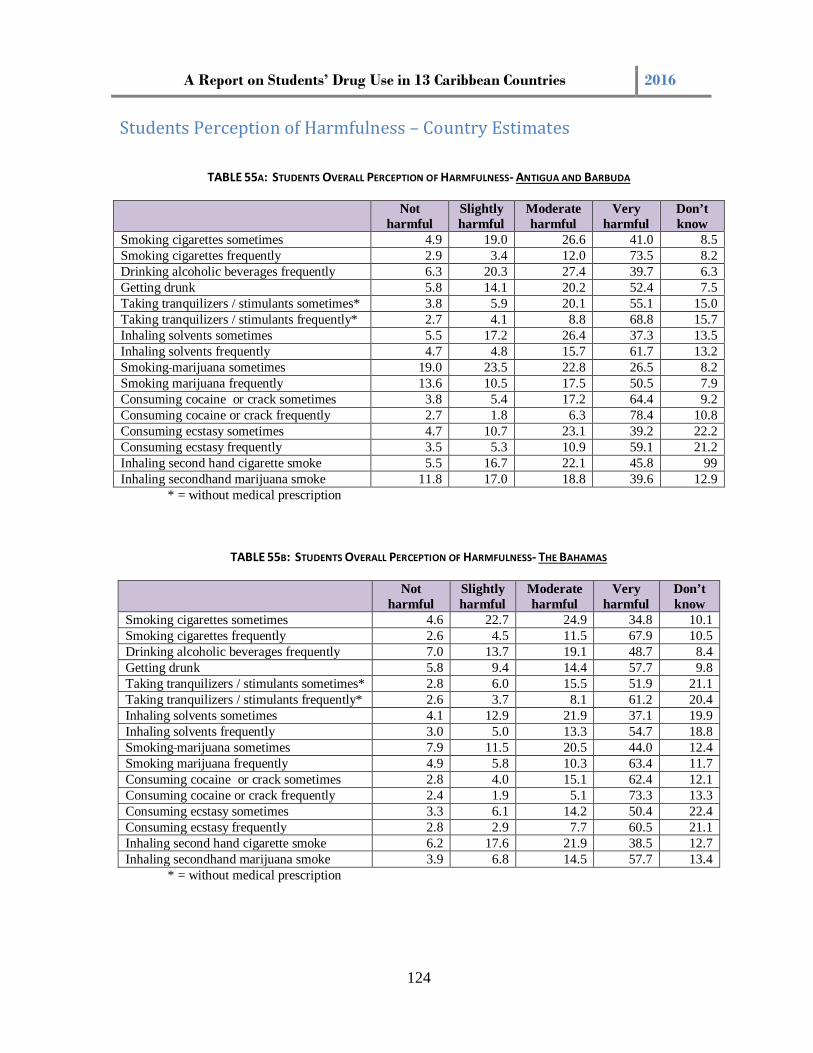
A Report on Students’ Drug Use in 13 Caribbean Countries 2016
124
Students Perception of Harmfulness – Country Estimates
TABLE 55A: STUDENTS OVERALL PERCEPTION OF HARMFULNESS- ANTIGUA AND BARBUDA
Not harmful
Slightly harmful
Moderate harmful
Very harmful
Don’t know
Smoking cigarettes sometimes 4.9 19.0 26.6 41.0 8.5 Smoking cigarettes frequently 2.9 3.4 12.0 73.5 8.2 Drinking alcoholic beverages frequently 6.3 20.3 27.4 39.7 6.3 Getting drunk 5.8 14.1 20.2 52.4 7.5 Taking tranquilizers / stimulants sometimes* 3.8 5.9 20.1 55.1 15.0 Taking tranquilizers / stimulants frequently* 2.7 4.1 8.8 68.8 15.7 Inhaling solvents sometimes 5.5 17.2 26.4 37.3 13.5 Inhaling solvents frequently 4.7 4.8 15.7 61.7 13.2 Smoking marijuana sometimes 19.0 23.5 22.8 26.5 8.2 Smoking marijuana frequently 13.6 10.5 17.5 50.5 7.9 Consuming cocaine or crack sometimes 3.8 5.4 17.2 64.4 9.2 Consuming cocaine or crack frequently 2.7 1.8 6.3 78.4 10.8 Consuming ecstasy sometimes 4.7 10.7 23.1 39.2 22.2 Consuming ecstasy frequently 3.5 5.3 10.9 59.1 21.2 Inhaling second hand cigarette smoke 5.5 16.7 22.1 45.8 99 Inhaling secondhand marijuana smoke 11.8 17.0 18.8 39.6 12.9
* = without medical prescription
TABLE 55B: STUDENTS OVERALL PERCEPTION OF HARMFULNESS- THE BAHAMAS
Not harmful
Slightly harmful
Moderate harmful
Very harmful
Don’t know
Smoking cigarettes sometimes 4.6 22.7 24.9 34.8 10.1 Smoking cigarettes frequently 2.6 4.5 11.5 67.9 10.5 Drinking alcoholic beverages frequently 7.0 13.7 19.1 48.7 8.4 Getting drunk 5.8 9.4 14.4 57.7 9.8 Taking tranquilizers / stimulants sometimes* 2.8 6.0 15.5 51.9 21.1 Taking tranquilizers / stimulants frequently* 2.6 3.7 8.1 61.2 20.4 Inhaling solvents sometimes 4.1 12.9 21.9 37.1 19.9 Inhaling solvents frequently 3.0 5.0 13.3 54.7 18.8 Smoking marijuana sometimes 7.9 11.5 20.5 44.0 12.4 Smoking marijuana frequently 4.9 5.8 10.3 63.4 11.7 Consuming cocaine or crack sometimes 2.8 4.0 15.1 62.4 12.1 Consuming cocaine or crack frequently 2.4 1.9 5.1 73.3 13.3 Consuming ecstasy sometimes 3.3 6.1 14.2 50.4 22.4 Consuming ecstasy frequently 2.8 2.9 7.7 60.5 21.1 Inhaling second hand cigarette smoke 6.2 17.6 21.9 38.5 12.7 Inhaling secondhand marijuana smoke 3.9 6.8 14.5 57.7 13.4
* = without medical prescription

A Report on Students’ Drug Use in 13 Caribbean Countries 2016
125
TABLE 55C: STUDENTS OVERALL PERCEPTION OF HARMFULNESS- BARBADOS
Not harmful
Slightly harmful
Moderate harmful
Very harmful
Don’t know
Smoking cigarettes sometimes 4.5 21.3 3.4 33.5 6.8 Smoking cigarettes frequently 1.4 4.1 10.8 77.5 6.2 Drinking alcoholic beverages frequently 4.8 18.4 27.7 43.7 5.4 Getting drunk 4.2 12.2 24.1 54.1 5.4 Taking tranquilizers / stimulants sometimes* 1.3 5.6 21.5 57.2 14.3 Taking tranquilizers / stimulants frequently* 1.1 2.2 8.4 74.3 13.8 Inhaling solvents sometimes 3.2 14.0 34.3 35.1 13.4 Inhaling solvents frequently 2.0 5.4 16.8 63.0 12.8 Smoking marijuana sometimes 15.7 19.4 270 31.4 6.5 Smoking marijuana frequently 9.1 9.2 14.5 61.0 6.3 Consuming cocaine or crack sometimes 1.9 4.1 22.5 63.3 8.1 Consuming cocaine or crack frequently 1.2 1.7 7.5 80.6 9.0 Consuming ecstasy sometimes 2.7 7.9 23.7 472 18.5 Consuming ecstasy frequently 1.5 3.7 8.4 68.7 17.6 Inhaling second hand cigarette smoke 2.5 13.6 25.1 52.7 6.1 Inhaling secondhand marijuana smoke 1.0 12.0 20.0 50.0 8.0
* = without medical prescription
TABLE 55D: STUDENTS OVERALL PERCEPTION OF HARMFULNESS - BELIZE
Not harmful
Slightly harmful
Moderate harmful
Very harmful
Don’t know
Smoking cigarettes sometimes 5.1 22.1 26.9 36.1 9.8 Smoking cigarettes frequently 2.8 5.5 12.7 71.5 7.5 Drinking alcoholic beverages frequently 4.5 121.7 24.7 51.4 6.7 Getting drunk 4.6 11.4 16.7 59.7 7.6 Taking tranquilizers / stimulants sometimes* 3.5 7.9 21.4 51.0 16.2 Taking tranquilizers / stimulants frequently* 3.1 4.0 11.9 65.1 15.9 Inhaling solvents sometimes 3.5 12.2 27.5 41.8 15.0 Inhaling solvents frequently 2.9 5.2 13.5 64.0 14.4 Smoking marijuana sometimes 9.9 17.7 28.8 34.8 8.8 Smoking marijuana frequently 6.3 6.6 13.6 65.0 8.5 Consuming cocaine or crack sometimes 2.3 6.6 18.1 64.5 11.5 Consuming cocaine or crack frequently 2.4 1.8 6.2 77.6 12.0 Consuming ecstasy sometimes 3.2 7.3 21.3 45.5 22.6 Consuming ecstasy frequently 2.6 3.4 8.8 63.4 21.8 Inhaling second hand cigarette smoke 3.6 10.7 16.9 57.5 11.3 Inhaling secondhand marijuana smoke 6.2 6.9 15.0 57.6 12.1
* = without medical prescription

A Report on Students’ Drug Use in 13 Caribbean Countries 2016
126
TABLE 55E: STUDENTS OVERALL PERCEPTION OF HARMFULNESS- DOMINICA
Not harmful
Slightly harmful
Moderate harmful
Very harmful
Don’t know
Smoking cigarettes sometimes 6.7 25.0 20.0 38.7 6.9 Smoking cigarettes frequently 3.7 4.6 12.4 69.9 6.6 Drinking alcoholic beverages frequently 8.8 18.7 18.6 46.5 4.4 Getting drunk 6.7 11.7 13.9 57.3 5.7 Taking tranquilizers / stimulants sometimes* 5.1 7.4 17.1 51.1 16.5 Taking tranquilizers / stimulants frequently* 4.0 3.5 9.0 64.2 15.6 Inhaling solvents sometimes 5.5 14.5 23.6 37.3 14.3 Inhaling solvents frequently 4.4 7.2 13.5 54.7 13.3 Smoking marijuana sometimes 14.7 20.0 20.4 34.4 6.2 Smoking marijuana frequently 8.9 8.0 13.3 58.6 6.7 Consuming cocaine or crack sometimes 4.2 3.2 12.4 66.9 9.7 Consuming cocaine or crack frequently 3.6 1.6 4.9 74.3 10.9 Consuming ecstasy sometimes 4.6 7.8 16.4 46.2 20.0 Consuming ecstasy frequently 3.6 3.4 9.2 57.8 19.2 Inhaling second hand cigarette smoke 6.5 13.5 16.9 51.2 7.7 Inhaling secondhand marijuana smoke 10.0 12.4 16.5 50.1 7.8
* = without medical prescription
TABLE 55F: STUDENTS OVERALL PERCEPTION OF HARMFULNESS- GRENADA
Not harmful
Slightly harmful
Moderate harmful
Very harmful
Don’t know
Smoking cigarettes sometimes 6.3 20.7 23.9 38.8 10.3 Smoking cigarettes frequently 3.5 5.1 8.8 72.6 9.9 Drinking alcoholic beverages frequently 6.5 17.1 20.3 46.9 9.3 Getting drunk 6.2 15.1 17.2 53.2 8.3 Taking tranquilizers / stimulants sometimes* 4.3 6.7 18.5 49.6 20.9 Taking tranquilizers / stimulants frequently* 3.8 4.9 8.0 615 21.7 Inhaling solvents sometimes 5.0 14.5 25.4 34.9 20.2 Inhaling solvents frequently 4.0 7.4 12.7 56.8 19.1 Smoking marijuana sometimes 10.3 17.7 25.6 36.6 9.9 Smoking marijuana frequently 6.4 6.9 10.8 65.5 10.3 Consuming cocaine or crack sometimes 4.4 4.5 17.9 59.9 13.2 Consuming cocaine or crack frequently 3.8 2.9 6.4 72.5 14.4 Consuming ecstasy sometimes 4.6 9.6 16.3 36.1 33.7 Consuming ecstasy frequently 3.7 4.9 9.4 49.8 32.2 Inhaling second hand cigarette smoke 5.1 11.1 15.7 56.6 11.5 Inhaling secondhand marijuana smoke 6.4 8.6 15.2 56.3 13.4
* = without medical prescription

A Report on Students’ Drug Use in 13 Caribbean Countries 2016
127
TABLE 55G: STUDENTS OVERALL PERCEPTION OF HARMFULNESS- GUYANA
Not harmful
Slightly harmful
Moderate harmful
Very harmful
Don’t know
Smoking cigarettes sometimes 3.6 17.6 15.5 52.7 10.7 Smoking cigarettes frequently 1.3 6.3 10.4 70.2 11.7 Drinking alcoholic beverages frequently 4.4 13.9 17.7 52.4 11.5 Getting drunk 4.2 11.4 13.8 60.6 10.4 Taking tranquilizers / stimulants sometimes* 2.9 5.9 14.6 55.0 21.7 Taking tranquilizers / stimulants frequently* 2.3 5.8 10.3 59.4 22.2 Inhaling solvents sometimes 3.8 13.6 21.0 41.6 20.0 Inhaling solvents frequently 2.4 8.3 13.9 56.8 18.6 Smoking marijuana sometimes 2.3 13.4 20.8 54.1 9.4 Smoking marijuana frequently 2.0 5.1 10.2 73.4 9.3 Consuming cocaine or crack sometimes 1.6 5.3 17.0 64.2 11.9 Consuming cocaine or crack frequently 1.5 2.5 8.8 72.7 14.5 Consuming ecstasy sometimes 3.3 8.1 16.7 41.0 31.0 Consuming ecstasy frequently 12.7 5.0 9.8 54.6 27.9 Inhaling second hand cigarette smoke 2.5 10.5 14.6 60.0 12.3 Inhaling secondhand marijuana smoke 2.3 6.7 12.3 64.9 13.8
* = without medical prescription
TABLE 55H: STUDENTS OVERALL PERCEPTION OF HARMFULNESS -HAITI
Not harmful
Slightly harmful
Moderate harmful
Very harmful
Don’t know
Smoking cigarettes sometimes 3.7 9.5 24.7 50.6 11.4 Smoking cigarettes frequently 1.7 2.9 12.8 73.0 9.7 Drinking alcoholic beverages frequently 3.1 9.0 22.1 56.5 9.3 Getting drunk 2.3 4.5 21.4 60.6 11.2 Taking tranquilizers / stimulants sometimes* 5.2 8.2 21.2 42.8 22.5 Taking tranquilizers / stimulants frequently* 5.3 6.5 15.4 51.1 21.7 Inhaling solvents sometimes 3.1 7.1 19.3 42.1 28.4 Inhaling solvents frequently 2.2 3.8 12.3 57.1 24.6 Smoking marijuana sometimes 1.8 4.2 19.8 59.5 14.6 Smoking marijuana frequently 1.6 2.3 10.3 72.4 13.4 Consuming cocaine or crack sometimes 2.0 3.3 17.3 63.3 14.2 Consuming cocaine or crack frequently 1.3 2.5 9.3 72.3 14.6 Consuming ecstasy sometimes 2.1 4.7 18.8 45.4 28.9 Consuming ecstasy frequently 1.7 4.8 12.2 54.8 26.5 Inhaling second hand cigarette smoke 4.8 18.1 30.0 33.9 13.1 Inhaling secondhand marijuana smoke 2.9 9.0 23.4 46.7 18.1
* = without medical prescription

A Report on Students’ Drug Use in 13 Caribbean Countries 2016
128
TABLE 55I: STUDENTS OVERALL PERCEPTION OF HARMFULNESS - JAMAICA
Not harmful
Slightly harmful
Moderate harmful
Very harmful
Don’t know
Smoking cigarettes sometimes 5.1 18.0 21.8 45.7 9.4 Smoking cigarettes frequently 2.6 3.7 7.6 76.9 9.8 Drinking alcoholic beverages frequently 6.7 14.2 17.8 52.7 8.6 Getting drunk 5.0 10.0 14.5 60.9 9.6 Taking tranquilizers / stimulants sometimes* 3.2 6.7 16.0 56.7 17.3 Taking tranquilizers / stimulants frequently* 2.9 3.7 8.1 68.1 17.3 Inhaling solvents sometimes 3.6 13.7 24.0 49.1 16.8 Inhaling solvents frequently 3.1 5.6 12.1 62.6 16.6 Smoking marijuana sometimes 8.8 16.4 24.6 40.3 10.1 Smoking marijuana frequently 5.0 6.5 10.8 67.7 10.1 Consuming cocaine or crack sometimes 2.6 3.4 12.3 68.9 12.8 Consuming cocaine or crack frequently 2.6 2.5 4.8 76.2 13.8 Consuming ecstasy sometimes 3.8 8.1 17.1 42.9 27.8 Consuming ecstasy frequently 3.0 4.1 8.2 57.6 27.1 Inhaling second hand cigarette smoke 4.0 10.4 15.6 59.0 11.0 Inhaling secondhand marijuana smoke 5.4 9.6 13.8 58.9 12.4
* = without medical prescription
TABLE 55J: STUDENTS OVERALL PERCEPTION OF HARMFULNESS - ST. KITTS AND NEVIS
Not harmful
Slightly harmful
Moderate harmful
Very harmful
Don’t know
Smoking cigarettes sometimes 4.3 213 19.3 40.7 13.8 Smoking cigarettes frequently 3.2 7.7 13.0 62.0 14.1 Drinking alcoholic beverages frequently 7.9 20.2 25.0 34.5 12.3 Getting drunk 7.4 12.8 16.1 52.0 11.4 Taking tranquilizers / stimulants sometimes* 42 5.8 15.9 51.6 225 Taking tranquilizers / stimulants frequently* 3.1 2.6 12.2 59.3 22.8 Inhaling solvents sometimes 4.4 13.9 24.3 32.1 25.4 Inhaling solvents frequently 3.5 8.0 15.9 47.7 24.7 Smoking marijuana sometimes 16.4 191 22.6 29.4 12.5 Smoking marijuana frequently 9.9 13.5 13.4 50.8 12.4 Consuming cocaine or crack sometimes 3.0 6.0 13.7 62.4 14.9 Consuming cocaine or crack frequently 2.6 3.6 6.6 71.5 15.8 Consuming ecstasy sometimes 4.1 9.4 17.7 36.3 32.4 Consuming ecstasy frequently 3.6 6.1 11.3 46.3 32.7 Inhaling second hand cigarette smoke 5.2 11.4 18.3 48.7 16.4 Inhaling secondhand marijuana smoke 7.6 13.1 17.0 45.5 16.8
* = without medical prescription
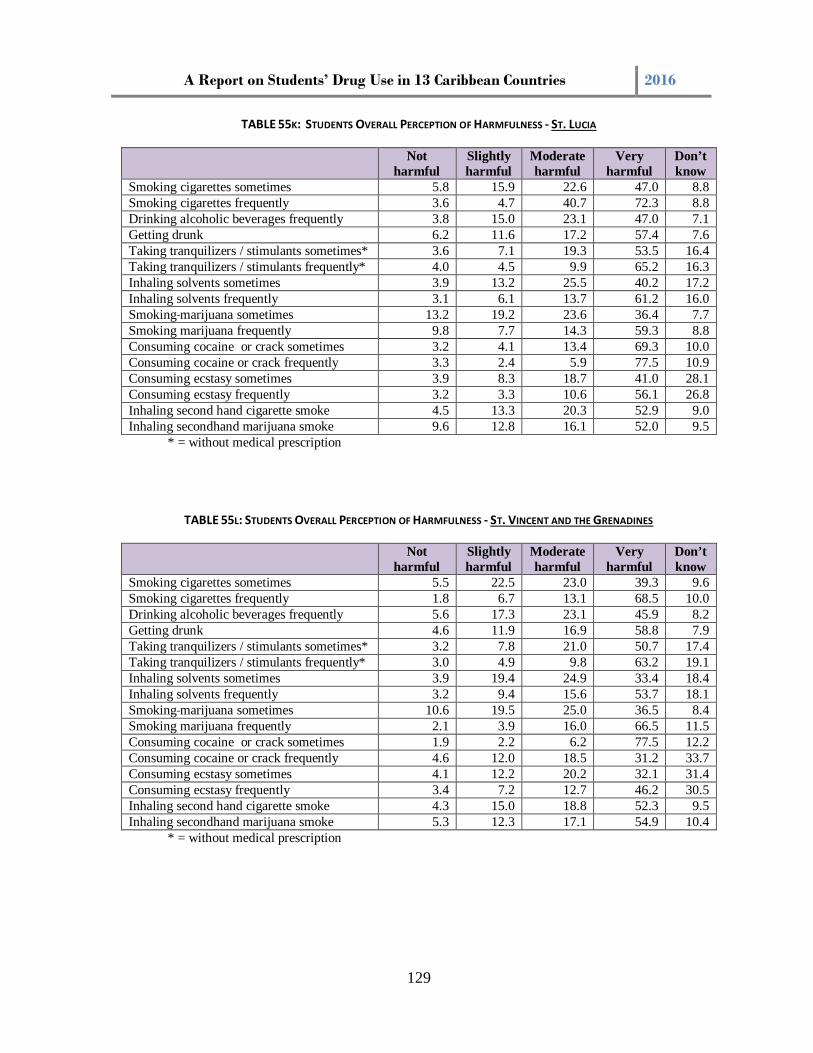
A Report on Students’ Drug Use in 13 Caribbean Countries 2016
129
TABLE 55K: STUDENTS OVERALL PERCEPTION OF HARMFULNESS - ST. LUCIA
Not harmful
Slightly harmful
Moderate harmful
Very harmful
Don’t know
Smoking cigarettes sometimes 5.8 15.9 22.6 47.0 8.8 Smoking cigarettes frequently 3.6 4.7 40.7 72.3 8.8 Drinking alcoholic beverages frequently 3.8 15.0 23.1 47.0 7.1 Getting drunk 6.2 11.6 17.2 57.4 7.6 Taking tranquilizers / stimulants sometimes* 3.6 7.1 19.3 53.5 16.4 Taking tranquilizers / stimulants frequently* 4.0 4.5 9.9 65.2 16.3 Inhaling solvents sometimes 3.9 13.2 25.5 40.2 17.2 Inhaling solvents frequently 3.1 6.1 13.7 61.2 16.0 Smoking marijuana sometimes 13.2 19.2 23.6 36.4 7.7 Smoking marijuana frequently 9.8 7.7 14.3 59.3 8.8 Consuming cocaine or crack sometimes 3.2 4.1 13.4 69.3 10.0 Consuming cocaine or crack frequently 3.3 2.4 5.9 77.5 10.9 Consuming ecstasy sometimes 3.9 8.3 18.7 41.0 28.1 Consuming ecstasy frequently 3.2 3.3 10.6 56.1 26.8 Inhaling second hand cigarette smoke 4.5 13.3 20.3 52.9 9.0 Inhaling secondhand marijuana smoke 9.6 12.8 16.1 52.0 9.5
* = without medical prescription
TABLE 55L: STUDENTS OVERALL PERCEPTION OF HARMFULNESS - ST. VINCENT AND THE GRENADINES
Not harmful
Slightly harmful
Moderate harmful
Very harmful
Don’t know
Smoking cigarettes sometimes 5.5 22.5 23.0 39.3 9.6 Smoking cigarettes frequently 1.8 6.7 13.1 68.5 10.0 Drinking alcoholic beverages frequently 5.6 17.3 23.1 45.9 8.2 Getting drunk 4.6 11.9 16.9 58.8 7.9 Taking tranquilizers / stimulants sometimes* 3.2 7.8 21.0 50.7 17.4 Taking tranquilizers / stimulants frequently* 3.0 4.9 9.8 63.2 19.1 Inhaling solvents sometimes 3.9 19.4 24.9 33.4 18.4 Inhaling solvents frequently 3.2 9.4 15.6 53.7 18.1 Smoking marijuana sometimes 10.6 19.5 25.0 36.5 8.4 Smoking marijuana frequently 2.1 3.9 16.0 66.5 11.5 Consuming cocaine or crack sometimes 1.9 2.2 6.2 77.5 12.2 Consuming cocaine or crack frequently 4.6 12.0 18.5 31.2 33.7 Consuming ecstasy sometimes 4.1 12.2 20.2 32.1 31.4 Consuming ecstasy frequently 3.4 7.2 12.7 46.2 30.5 Inhaling second hand cigarette smoke 4.3 15.0 18.8 52.3 9.5 Inhaling secondhand marijuana smoke 5.3 12.3 17.1 54.9 10.4
* = without medical prescription

A Report on Students’ Drug Use in 13 Caribbean Countries 2016
130
TABLE 55M: STUDENTS OVERALL PERCEPTION OF HARMFULNESS - TRINIDAD AND TOBAGO
Not harmful
Slightly harmful
Moderate harmful
Very harmful
Don’t know
Smoking cigarettes sometimes 4.8 19.2 31.0 39.2 5.8 Smoking cigarettes frequently 2.6 3.8 10.2 78.0 5.4 Drinking alcoholic beverages frequently 5.2 13.5 24.9 51.2 5.3 Getting drunk 5.0 10.2 18.4 60.7 5.7 Taking tranquilizers / stimulants sometimes* 2.7 4.9 19.2 57.7 15.5 Taking tranquilizers / stimulants frequently* 2.7 2.9 8.7 70.5 15.2 Inhaling solvents sometimes 3.6 12.6 28.9 41.4 13.8 Inhaling solvents frequently 3.4 4.6 15.3 64.2 12.5 Smoking marijuana sometimes 12.9 14.7 24.7 41.4 6.3 Smoking marijuana frequently 8.0 7.9 13.2 64.7 6.2 Consuming cocaine or crack sometimes 2.9 3.7 16.3 69.1 8.0 Consuming cocaine or crack frequently 2.6 1.9 5.6 80.5 9.5 Consuming ecstasy sometimes 3.4 7.0 18.8 49.6 12.2 Consuming ecstasy frequently 2.9 3.6 8.4 64.8 20.3 Inhaling second hand cigarette smoke 3.8 10.4 20.4 58.7 6.8 Inhaling secondhand marijuana smoke 7.6 9.2 18.0 56.6 8.8
* = without medical prescription