Embed Size (px)
Citation preview

Integrating Conjoint Analysisand Engineering Design
Rajeev KohliHitendra Wadhwa
Jim Christian 1
August 3, 2006
1Rajeev Kohli is a Professor, and Hitendra Wadhwa is an Assistant Professor, at theGraduate School of Business, Columbia University. Jim Christian is Technical Directorof Global Product Research at General Motors Corporation. The authors acknowledgethe contributions of Dr. Richard Smallwood and Dr. Jim Weisinger, who were bothpartners at Applied Decision Analysis, Inc. in the early 1990s and played a central role,in collaboration with others at General Motors, in the design and implementation of themethodology described in this paper.

Integrating Conjoint Analysis and Engineering Design
Abstract
The authors describe an approach to integrating conjoint analysis and engineeringdesign. Developed in collaboration with General Motors, the proposed approachcan be used for designing products comprising several interconnected subsystems.The proposed approach has four key steps: (i) representation, (ii) linking, (iii)constraining, and (iv) costing. Representation concerns the depiction of a productin ways that are meaningful to consumers and to engineers. Linking refers tothe mapping of engineering attributes onto the conjoint attributes. Constrainingconcerns the restriction of designs to those that are feasible from an engineeringstandpoint; these constraints are propagated, using the linking procedures, to theconjoint designs. Costing refers to the methods used to estimate fixed and vari-ables costs associated with module designs. The linking procedure then mapsthese costs onto the product concepts evaluated by consumers, and allows theimplementation of a profit-maximizing objective in the selection of a product orproduct line.
The proposed procedure allows an assessment of consumer and market re-sponse to engineering choices. It enables product designers to optimize the trade-off between increased customization and increased standardization via the use ofcommon platforms and modules. It allows for the evaluation of the economicsof product variety, and the cannibalization in sales due the use of common plat-forms in product-line designs. It makes possible the imposition of technologicaland cost constraints both in conjoint simulations and in algorithms for identifyingoptimal products and product lines. Finally, it permits feasibility assessments ofalternative technologies, helps prioritize R&D projects, and facilitates the evalu-ation of cost-cutting efforts on the market performance of products. We illustrateaspects of the methodology using as a running example the design of a line ofmid-sized cars by General Motors. We also summarize the key learnings thathave accumulated in over a decade of use of these methods by the company.
Keywords: New-product design; engineering design; marketing/manufacturinginterface; conjoint analysis.

1 Introduction
New product designers need to simultaneously consider financial, technical and
market factors in evaluating alternative design choices and selecting the optimal
design to launch in the market. This problem is simple in conceptual terms —
designers need to establish which product designs are feasible, estimate the cost
and demand for each feasible design, and then use business objectives to guide the
selection of one or more feasible designs. In practice, however, product designers
face a number of challenges. The full range of feasible designs may be too large
to enumerate and evaluate individually. Product engineers, who are experts at
making technical tradeoffs and judgments, may lack a clear understanding of the
market or financial impact of their design decisions. And marketers charged with
studying customer needs and making product design recommendations may lack
an understanding of cost and technological factors that, in addition to customer
factors, will ultimately drive the financial performance of the product. These chal-
lenges grow exponentially as we move from a single product design to a product
portfolio design context because of cross-product effects such as cannibalization
and economies of scope.
Existing methodologies for product design are at best only partially effective in
addressing these challenges. Conjoint analysis is widely recognized as a powerful
methodology for quantifying customer needs and estimating market response. But
researchers have faced significant hurdles in extending this approach to accom-
modate costs and technological constraints. As Srinivasan, Lovejoy and Beach
(1997) observe, the cost of a product described by conjoint attributes can vary
substantially depending on the product architecture, the choice of materials and
the processes used in manufacturing. Similarly, technological constraints arise
naturally in the engineering domain, and are not trivial to map onto conjoint rep-
resentations of product concepts. Quality Function Deployment (QFD), which
1

links the voice of the customer to the engineering dimension of product develop-
ment (Hauser and Clausing 1988, Griffin 1992, Griffin and Hauser 1993), is useful
for detailed design, but is less relevant for relating engineering decisions to such
strategic issues as product-line positioning, market segmentation and cannibaliza-
tion. As it uses aggregate customer data, QFD does not provide a direct link to
the market simulations and optimal product design algorithms used with conjoint
data (e.g., Kohli and Krishnamurti 1987, Nair, Thakur and Wen 1995, Dobson
and Kalish 1993), and it does not directly incorporate costs or provide the kind of
quantitative assessments of market response that are needed to assess the financial
performance of alternative product designs.
The purpose of this paper is to describe methods for linking engineering and
marketing design of new products. Initiated as a collaboration between Applied
Decision Analysis, Inc. (ADA), a quantitative management consulting firm, and
General Motors Corporation (GM) in the early 1990s, these methods have been
tested and improved for over a decade. We illustrate the key aspects of the methods
in the context of a GM initiative focusing on the redesign of Buick, Chevrolet,
Oldsmobile and Pontiac lines of mid-size cars. Teams of engineers, marketers
and designers across several GM divisions collaborated in, and contributed to, the
development, implementation and testing of the method. Since then, the method
has been used for several different lines of GM automobiles.
The methodology has broad applicability, beyond the design of automobiles.
It integrates market data based on conjoint analysis with engineering and cost data.
It can be used as a comprehensive tool to evaluate alternative designs for products
comprising several interconnected components and design features. It can be used
to assess the impact of choices in engineering design on consumer responses, and
on the market performance of products and product lines. It can also be used
to assess the impact of technological changes, alternative R&D investments, and
2

major or minor changes in designs on the performance of new products.
The proposed method has four key steps: (i) representation, (ii) linking, (iii)
constraining, and (iv) costing. Representation refers to the description of a product
in two separate ways: conjoint attributes and levels, based on a customer view-
point; and engineering attributes and levels, based on an engineering viewpoint.
Linking concerns the construction of functional relationships between the engi-
neering attributes and the conjoint attributes. Constraining refers to the specifica-
tion of constraints that limit the evaluations of alternatives to feasible engineering
designs. Costing concerns the estimation of variable and fixed costs for a new
product. These costs are often easier to decompose and estimate for engineering
designs than they are for conjoint profiles.
Figure 1 gives a schematic overview of the four steps and their relation with
an optimizer that selects an engineering design to maximize market share, profits
or ROI, for a single product or for a portfolio of products built around a common
engineering platform. The optimizer also allows for simulations that use the inte-
gration of market, engineering and cost information. It can be used to assess the
value of alternative technology choices; to assess the economics of product variety;
and to prioritize R&D investments based on an integrated analysis of investment
requirements, technology performance, customer needs and manufacturing costs.
The details of the optimization method are not presented in this paper. The rea-
son is that we can use existing algorithms described in the marketing literature on
optimal product and product line design (Green and Krieger 1985, 1989, Kohli
and Krishnamurti 1987, McBride and Zufryden 1988, Dobson and Kalish 1988,
Balakrishnan and Jacobs 1996, Nair, Thakur and Wen 1995, Chen and Hausman
2000). The only difference in the use of these methods is that our search space is
a set of engineering designs. We link these designs to conjoint profiles, and thus
to market response functions maximizing market share, revenue and profits.
3
To the best of our knowledge, the proposed approach is the first to link en-
gineering design to conjoint-based models. We propose a framework for repre-
senting products as a collection of modules, and modules as a set of engineering
attributes. We offer a structured approach to mapping engineering modules and
attributes onto the conjoint attributes relevant for estimating consumer preference
functions. We describe a computationally efficient method for eliminating infeasi-
ble choices in the selection of optimal products and product profiles. We describe
an approach to estimating cost functions, which are more naturally identified with
engineering aspects of a product — the product architecture, the choice of ma-
terials, the processes used in manufacturing — than with the attributes used in
conjoint analysis (Green and Krieger 1991, Srinivasan, Lovejoy and Beach 1997).1
Section 2 provides a brief background on the product design initiative at Gen-
eral Motors that led to the development of the present approach. Section 3 de-
scribes the four steps of this approach, using the design of a line of mid-size car at
GM as an illustrative example. Section 4 discusses how the proposed methodol-
ogy can be used to answer questions concerning investments in new technologies
by a firm, and to project the impact of cost reductions in one or more design choices
on the market performance of products. We couch this discussion in the context
of how managers at General Motors have used the methodology to examine such
issues over the last ten years. Section 5 concludes with a discussion of the areas
in which improvements are still being made, the lessons learnt by users of the
methodology and the general impact the method has had on the process of product
development at General Motors.1Such techniques as Taguchi methods (Taguchi, Elsayed and Hsiang 1989), and the Boothroyd-
Dewhurst approach to cost reduction (Boothroyd and Dewhurst 1983), have gained much use forreducing costs and improving quality. We do not explicitly examine these methods, but assumethat these are available to engineers for estimating the baseline and marginal costs we discuss laterin the paper.
4

2 The GM Midsize Car Portfolio Project
The Midsize Car Division (MCD) and the Strategic Decision Center (SDC) at
General Motors undertook a project to redesign GM’s mid-size car portfolio in
1993-94. We will refer to the project, and the study described below, as the MCD
study.
The task faced by the joint team working on the MCD study was to design a
portfolio of six new sedans to replace the existing line of mid-size cars produced
by GM. At that time, conjoint analysis was already an established market research
methodology within General Motors. Customer preferences along different prod-
uct attributes would be quantified using this technique, and a market simulation
model would be developed to allow product planners to explore the market impact
of a range of product scenarios. Occasionally, the process of searching for the
optimal (revenue or market-share maximizing) product design was automated. To
aid the search process in yielding practical results, simple constraints were devel-
oped in the conjoint attribute space — disallowing, for example, a certain body
style with a certain level of interior room. This process was iterative — the model
would recommend a product or product line, product design staff would evaluate
these designs, and if these were found to be too costly or technically infeasible,
new constraints would be imposed on the optimization model to disallow such
designs.
The MCD portfolio project entailed a highly complex set of design choices for
General Motors. The products were described in terms of 13 conjoint attributes,
such as turncircle (turn radius), fuel economy and bodystyle. Recall that there
were 6 mid-size vehicles to be designed for GM. The market simulation incor-
porated 16 additional competitive vehicles. The team wanted to explore both
market share and financial objectives such as revenues, investment requirements,
and profits. Given the scale of the problem, it was concluded that the traditional
5
process of imposing a few inter-attribute constraints on the conjoint model and
refining these based on early recommendations would break down — there were
simply too many technical constraints for this process to be able to conclude with
a satisfactory portfolio design within a few iterations. Moreover, the simulations
would not help evaluate profits because fixed and variable costs were difficult to
associate with the conjoint attributes. And designers wanted to extend the method-
ology so that the market simulations could be linked to the engineering choices,
which involved such things as engines, transmissions and floorpans.
Spurred by the challenging nature of the assignment, the team, in partnership
with ADA, developed a modeling approach that integrated a model of customer
preferences and purchase behavior — via the traditional conjoint machinery —
with a model of engineering design choices. The approach was developed, refined
and utilized in an ongoing manner within the team to explore a broad array of
strategic design choices, investment requirements and future technological and
competitor scenarios. A number of critical insights were identified that went
substantially beyond the capabilities of traditional tools to deliver. The approach
broadened the perspectives of the designers and allowed them to consider a number
of new possibilities. Specific learnings from the project were instrumental in
shaping a number of the ultimate design decisions taken by the organization.
Since the project’s conclusion in 1994, GM has continued to deploy this in-
tegrated engineering-marketing approach in other design contexts. Elements of
the approach have been standardized to permit swift implementations on a regular
basis. Many of the business insights generated by the methodology have since
been incorporated into mainstream portfolio thinking at GM.
6

3 Integrating Marketing and Engineering Design
There are four key steps in the proposed approach to linking consumer preferences
and engineering design: (i) representation, (ii) linking, (iii) constraining, and
(iv) costing. Representation concerns the depiction of a product in ways that
are meaningful to consumers and to engineers. Linking refers to the mapping
of engineering attributes onto the conjoint attributes. Constraining concerns the
generation of constraints in the engineering domain; these can be mapped, using
the linking procedures, onto the product design optimizer in Figure 1. Costing
refers to the methods used to estimate fixed and variables costs associated with
module designs and, via the linking procedure, to the conjoint descriptions of
product concepts. This approach addresses a problem that can occur when it is
not possible to associate costs directly with conjoint attributes and product profiles.
We now discuss each of these four aspects of the proposed approach.
Representation
The first step comprises the representation of a product in ways that are mean-
ingful to consumers, and to engineers. We use conjoint analysis for the former
representation of a product into attributes that are meaningful to consumers. Table
1 shows the set of attributes used in the MCD study; we refer to these as conjoint
attributes, to distinguish them from the engineering attributes, which we discuss
below. The conjoint attributes are used in a standard manner to obtain consumer
judgments about alternative product concepts, and can be used to simulate the
market performance of new product alternatives. A prolific literature exists in this
area and so we do not elaborate further on this subject here.
The representation of a product by engineering attributes is accomplished in
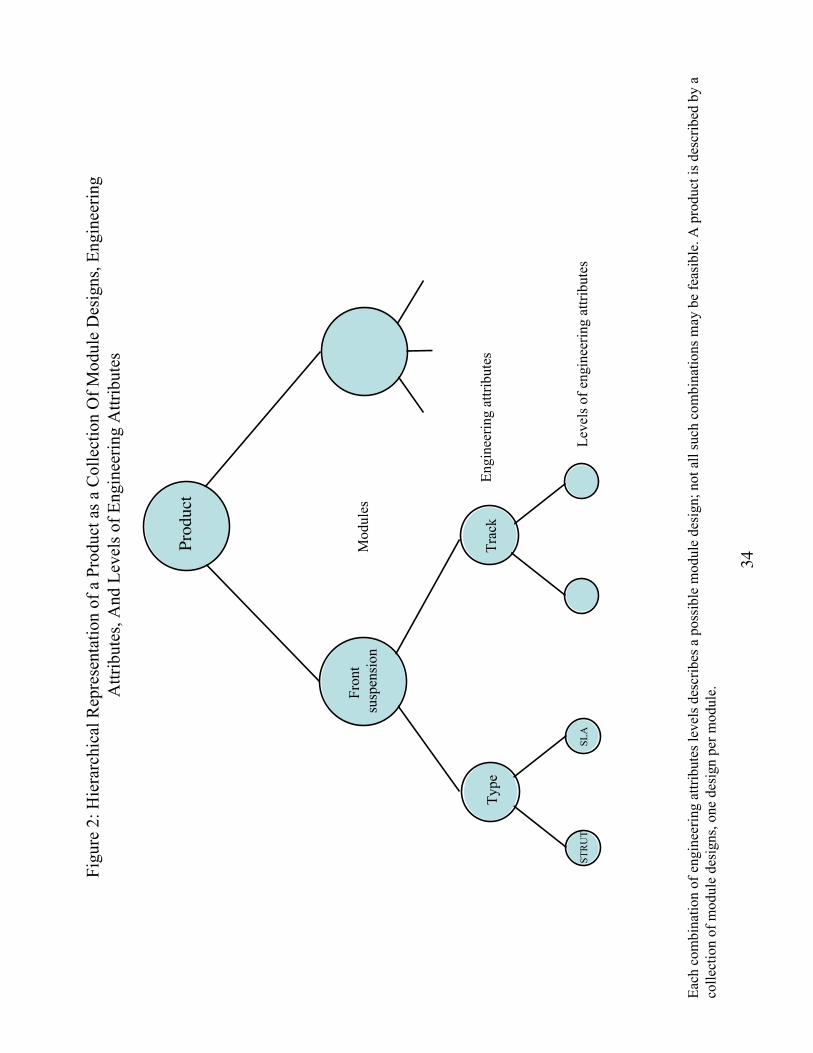
two steps. First, we represent a product by a small collection of modules. Second,
we represent each module in terms of engineering features. Thus, we use a hierar-
7
chical representation in which a product is conceived as a collection of modules.
The levels of each module are the alternative module designs. And each module
design is described by a collection of engineering attributes, each of which has a
number of possible levels.
Modules. Each module is a physical assembly, typically implementing one
major function. For example, the ten modules shown in Table 2 were used in the
MCD study at GM. The process of generating possible module designs typically
begins by examining existing products, and then extends the search to newer,
more novel alternatives that are, or can be made, available. For example, the
design team for the MCD study listed all car engines that were manufactured by
GM, by its suppliers, and by suppliers to other automobile manufacturers who
could potentially be used to source engines. It then added to this list newer engine
designs that, while not available on the market, could be produced, albeit with
investments in plant and equipment. Some of these engines were being designed
elsewhere for use in hybrid (fuel and electric) cars, and for use in cars using natural
gas.
Products can, but do not have to, be built using a modular design. The alter-
native is to build integrated products. We refer the reader to Ulrich (1992) for a
discussion of the key differences between modular and integrated product archi-
tectures. Here, we only note that modular design has become an important way of
making a variety of products — automobiles, computers, watches, and personal
stereo systems. There are three main reasons for this. First, if a product is com-
plex, with many parts and components, it can be virtually impossible to design it
as a single, integrated unit. Second, if the design of a product can be related to
the design of its component modules, then it is possible to combine variants of
a module’s designs in a combinatorial manner to develop wide product lines at
low cost. For example, every Swatch watch is made by mixing and matching a
8
set of modules, each of which is available to designers in a pre-selected number
of options. If there are m modules, each with n possible options, one can, in
principle, design nm possible products by selecting one or another option for each
module. Incompatibilities exist among the modules, reducing the number of fea-
sible designs. But the possible number of feasible designs can still be very large.
Third, there are economies of scope that a firm can exploit by sharing modules
— a common engine, or a common door assembly — across a product line. Of
course, not all products in a line can use all identical modules. The idea is to select
a small number of designs for each module, and then make each product in a line
by combining different module designs.
Table 2 shows the ten modules used in the MCD study. The number of designs
in the table refers to the different designs that were available for each module.
The GM design team needed to select between 1 to 3 designs for each of the
modules numbered 1 to 9 in Table 2, and then decide which combinations of the
selected modules to use in specific cars in a product line. Conjoint experts might
observe how several of these modules, such as Cowl and Rear Compartment Plan,
are unsuitable for capturing customer preference feedback. But this view of the
product is very natural to product design engineers. And that is exactly the point
of this exercise — to decouple, and then link, the engineering-oriented view of the
product and the customer-oriented view.
Engineering attributes. We represent each module by a collection of attributes
that describe certain physical or technological characteristics of the module. We
call these engineering attributes, or module attributes. Each such attribute is
described over a continuous range of values, or over a set of discrete values or
levels. Figure 2 illustrates the hierarchical relation among modules, engineering
attributes and attribute levels. As an illustrative example, all designs of the motor
compartment module were described in the MCD study using four continuous
9
attributes: rail width, rail length, front overhang and dash-to-bumper length. And
all designs of the front suspension module were described using two discrete
attributes: Track and Type (SLA or Strut).2
It is often possible to describe a module over a large number of attributes.
Which attributes are used in a study depends on their relevance for two purposes.
First, some attributes are necessary to specify the dependencies, and thus the
technological constraints, within and across modules. Second, there are attributes
that are useful for constructing relationships between the consumer attributes,
used in the conjoint analysis, and the engineering modules. An attribute should
be selected if it facilitates one or both of these purposes. Otherwise, it can be
excluded.
Linking
The second step of the proposed approach is the construction of functional rela-
tionships between engineering attributes and conjoint attributes. Design engineers
develop a model that translates every feasible combination of module designs into
an associated set of conjoint attribute levels. This can be easier for some modules
than for others. For example, the 2005 Honda Hybrid Accord has a combination
electric and fuel engine, and this is not simply an engineering design feature, but
also a feature of considerable interest to consumers. But other aspects of engineer-
ing design can be more difficult to map onto consumer attributes. In some cases,
there may be no apparent connection between consumer attributes and engineer-
ing attributes/modules; in other cases, several different modules might together
determine the mapping onto a conjoint attribute.2SLA (short-long arm) refers to a type of suspension that uses upper and lower control arms
of unequal length. The upper arm is usually shorter than the lower arm to control camber changesduring jounce and rebound. An automobile strut eliminates the need for an upper suspension armand provides both shock absorption and support for sideways loads that are not along its axis ofcompression.
10

The development of a method for linking conjoint attributes and engineering
modules is perhaps the most important contribution of the MCD study. Without
it, there would have been no integration of engineering and marketing design.
We describe the main aspects of the method that eventually emerged after several
months of work. It consists of the following three steps: (i) decomposing, which
refers to the process by which a conjoint attribute is represented as a function
of other variables, some of which might not have any direct relationship with
the modules or their attributes; (ii) defining intermediate variables, which bridge
relationships between modules and conjoint attributes; and (iii) constructing causal
or empirical relationships between intermediate variables, conjoint attributes and
engineering modules. For concreteness, we describe the three steps in the context
of the method GM designers used to link engineering attribute in the MCD study
to fuel efficiency, a conjoint attribute.
Linking fuel efficiency with engineering attributes. Figure 3 shows the two
major factors that affect fuel consumption: road load and system efficiency. This
is the first decomposition. Our objective is to construct a relationship between
fuel efficiency, which is a conjoint attribute listed in Table 1, and the engineering
modules shown in Table 2. To this end, we first observe that the load on a car
is determined by its weight, and on weather and road conditions that affect the
aerodynamic drag and the rolling resistance of a car.3 We consider the weight to
be our first intermediate variable; it is a factor engineers can control when making
a car.
Figure 4 shows the empirical relationship between auto weight and fuel effi-
ciency for US automobiles in 2002. A linear relationship explains a substantial3Weather and road conditions have a substantially lesser effect on the published/advertised
gas milage of cars, because regulatory agencies specify standard test conditions that eliminatetheir influence on fuel efficiency. For example, the US Environmental Protection Agency (EPA)requires that a test car be parked overnight at a temperature of about 72◦ F (22◦ C). It is then drivenon a dynamometer, in a controlled laboratory, for a specific period of time.
11

part of the variance. Much of the additional variance around the line is explained
by specifying the system efficiency. Thus, we redefine our problem as construct-
ing a relationship between a car’s fuel efficiency, and its weight and system ef-
ficiency. Next, we observe that the system efficiency is determined by three
modules — engine, transmission and the final drive.4 Thus, we obtain the relation
Gallons per 100 mile = a + b Curb weight +X
i
cixi;
where the xi denote (a suitable number of) dummy variable representing the alter-
native engine, transmission and the final drive modules. This empirical relation-
ship explains over 99% of the variance in the fuel efficiency of a car.
It still remains for us to specify how the weight of a car is related to the
modules. To do so, we first represent vehicle weight as a product of the floor area
(overall length × overall width) and the average weight density of a car:
Car weight = Average weight density · (Overall length × Overall width).
The average weight density, overall length and overall width are new intermediate
variables. The average weight density is fairly constant for cars within a partic-
ular class. In the MCD study, designers started by using the mean value across
the existing mid-size cars; later, as choices of materials and components became
known, the value of the constant was refined. The overall length and overall width
of a car is next decomposed into the sums of smaller lengths and widths, in the
manner shown in Table 3. We continue the decomposition until each length and
width can be identified as an attribute of a module — in the present instance, the
modules comprising the Motor Compartment, Floorpan and Rear Compartment.
We have thus completed our mapping of a conjoint attribute — fuel efficiency —4At this point in the design, we ignore the effect of accessories line air conditioning on the
system efficiency.
12

to the modules shown in Table 2 for the MCD study. A summary of the steps
appears in Table 3.
The above example illustrates how constructing a relationship between mod-
ules and conjoint attributes can be a non-trivial exercise. It can require knowledge
of regulations and testing procedures; the use of empirically established relation-
ships; the recursive decomposition of intermediate variables via identities; the
approximation of constants, and the refinement of their values as the design team
makes finer, lower-level decisions about the materials used to make a product.
The three steps — decomposing, introducing intermediate variables, and estimat-
ing relationships — can occur several times in the process of linking conjoint
attributes and engineering modules. The process is typically time-consuming the
first time it is done. Thereafter, it becomes easier, can be standardized, and further
refined over time. Many of the relationships are known to design engineers. And
some of the attributes in terms of which the modules need to be defined become
known only after the linking process is begun. Sometimes, it is easier to begin
the linking process from the conjoint side and moved into the engineering module
side. At other times, the reverse flow is more convenient.
Constraining
The third step of our procedure concerns the development of methods that prevent
the selection of technologically infeasible product concepts. The existing liter-
ature on conjoint-based methods for new product design typically assumes that
designers know which combinations of consumer attribute levels are infeasible,
and that iterative algorithms, such as those described by Kohli and Krishnamurti
(1987), can be used to ensure that an optimal product design is feasible. On the
other hand, constraints arise naturally in the engineering domain: a battery is too
wide to be used in a laptop computer, or an engine is too small for a car. These
13

constraints in turn determine which conjoint designs can be offered to consumers.
One way of generating constraints is to list them out, one by one. This enu-
merative method is impractical because the number of module combinations can
be enormously large. For example, there are 16×12× . . .×6 = 46, 558, 955, 520
possible ways of selecting one each of the ten engineering modules shown in Table
2 — far too many for exhaustive enumeration and evaluation by engineers. Thus,
we need a procedure for efficiently identifying constraints in the engineering do-
main and then propagates these constraints to the domain of conjoint profiles using
the proposed linking procedure. We describe such a procedure next.
The first step is for design engineers to describe the compatibility constraints
in terms of engineering attributes, not the module designs. For example, each
design of the rear suspension module is compatible with only certain designs of
the Transmission and Front Suspension modules. A module-level approach would
consider each Rear Suspension design separately and list the feasible subsets of the
eleven Transmission designs and the nine Front Suspension designs with which
it can be used. A more parsimonious description of the constraints is obtained
by tracing the source of the incompatibilities to the engineering attributes. In
the MCD study, the Rear Suspension was constrained by the Drive Configuration
(an attribute of the Transmission module) and the Track (an attribute of the Front
Suspension module). Since there are only 4 Drive Configurations and 3 Track
levels, this reduces the constraint specification work considerably.
The second step is to separate the modules into three groups: master modules,
secondary modules, and independent modules. Master modules are those that
have a major influence on other modules, in terms of compatibility. Secondary
modules are those which largely do not influence each other, in terms of compat-
ibility, but which are influenced by one or more master modules. Independent
modules are those that are not associated with any compatibility constraints; i.e.,
14

for an independent module, each possible design is compatible with any feasible
combination of designs for the other modules. Observe that independent modules
are readily identified, because they have no dependencies on other modules. The
partitioning of the other attributes into primary and secondary classes is obtained
by solving a maxcut problem. We describe the procedure in the appendix. Here,
we observe that this separation of modules substantially reduces the complexity
of the constraint specification process, as the following numerical example will
show.
Suppose we describe a product using six modules, each module having five
possible designs. The total number of design combinations whose technical feasi-
bility needs to be specified is then 56 = 15, 625. Suppose that we can identify one
of the modules to be independent. Then the total number of design combinations
whose technical feasibility needs to be specified is 55 = 3, 125, since the indepen-
dent module does not need to be considered. Further, suppose we can separate
these remaining 5 modules into two master modules and three secondary modules.
There are then 5 × 5 = 25 possible design combinations of the 2 master modules.
For each of these 25 combinations, we need to specify technical feasibility vis-a-
vis the 5 designs for each of the three secondary modules. This leads to a total of
25 × (5 + 5 + 5) = 375 design combinations — a substantial reduction from the
original 15,625.
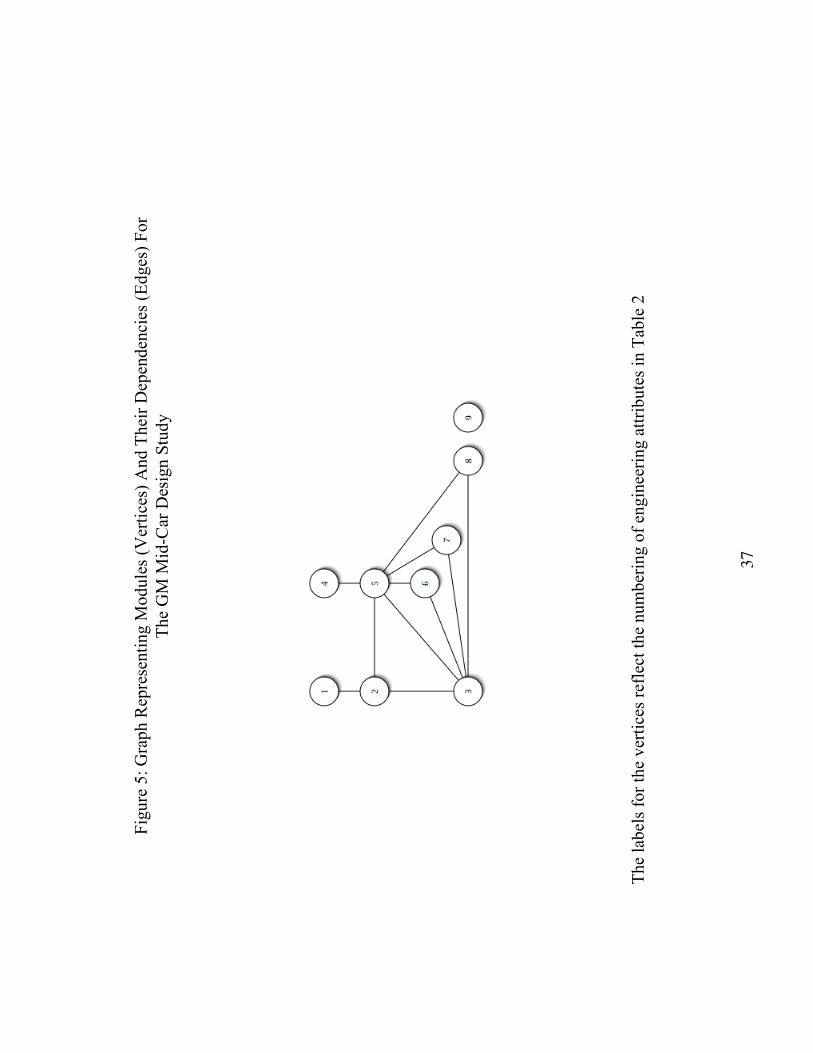
Figure 5 shows a graph in which the vertices, numbered 1–9, correspond to
modules 1–9 in Table 2. An edge connects a pair of vertices if the choice of one
module constrains the choice of another module. We call this graph a dependency
graph. Observe that module 9 (sideframe) has no dependencies; it is the only
independent module. The remaining modules constrain the choices of one to five
other modules. Figure 6 shows a (maxcut) partition: modules 1, 3 and 5 are in
one partition (cut) and the remaining modules are in the other partition. If we
15

associate equal weights with the edges of the dependency graph, the sum of edge
weights (which is then equal to the number of vertices across the partitions) is 10.
In the MCD study, we labeled modules 1, 3 and 5 as the primary modules and the
modules in the other partition as the secondary modules. Note that there are no
constraints among the secondary modules, and only one constraint between a pair
of the primary modules.
To use this partition in a market simulation, or in an algorithm for optimal prod-
uct design, we begin by constructing a composite suspension/motor compartment
module; its designs are the feasible combinations of the front suspension (module
3) and motor compartment (module 5). We select a design for this composite
suspension/motor compartment module and module 1 (floorpan); propagates the
constraints to each of the secondary modules (2, 4, 6, 7 and 8), restricting choices
to only their feasible designs; and then map a feasible engineering profile (speci-
fied by one design for each module) onto a conjoint product profile.
The constraints thus specified encode, in a sense, the current technological
frontier. Further technological innovation may lead to certain new module de-
signs becoming feasible (i.e., new levels of attributes associated with a module,
or new combination of attribute levels associated with a module). If product de-
signers wanted to study the potential market impact of such innovations, it can be
implemented within our methodology in a straightforward manner, simply by ad-
justing the constraints. For instance, in the MCD study, product designers wanted
to study the impact of a new type of engine technology. This was implemented
by specifying an additional level of the technology attribute associated with the
engine module.
16
Costing
Maximizing a profit function is often difficult in conjoint models of optimal prod-
uct design because there are problems in estimating cost as a function of the
conjoint attributes. For example, it is not easy to specify the marginal cost of
an extra mile per gallon of fuel efficiency. The reason is that there is no direct
relationship between such conjoint attributes and manufacturing costs. Instead,
costs are more naturally associated with the engineering modules.
We estimate the total cost of a product as the sum of the costs of its constituent
modules. The module costs are determined using a method described below.
Once these cost estimates are obtained, we use the mapping procedure described
above to identify a conjoint profile with the product. Then we simulate consumer
preferences for the product at a given price, and estimate the demand, revenue and
profit for the product. In this way, we obtain a model in which costs, estimated
in the engineering domain, are combined with the revenue predicted by consumer
choice simulations that are conducted in the conjoint domain. The simulations
do not have to be done explicitly, one product at a time. Instead, we can use
algorithms for selecting optimal products and product lines, similar to those in
the literature. The only difference in the use of these algorithms for the present
problem is that products and costs are defined in terms of engineering modules,
while the market simulations are performed over conjoint attributes and profiles.
The link between the two domains is achieved by the procedure described in
section 3.2.
Product designers at GM often use the following method for estimating the
variable costs for various module designs. They start with an existing car in a
product class, for which the variable costs are known for the entire car and for
the various module designs. We will call this a base car, and will refer to the
associated costs as base costs in the following discussion. The costs of other
17

module designs are specified as increments to the base cost. In a problem with
m modules, where module j is associated with nj levels, we need to estimate
(n1 − 1) + . . . + (nm − 1) = −m +P
j nj incremental costs. For example, a
product defined using m = 5 modules, each with nj = 5 designs per modules,
requires the specification of −5 + 25 = 20 incremental variable costs, relative
to the baseline cost. Some of these costs are easily estimated, for example when
there are existing module designs that are produced for other products, or that can
be purchased from outside vendors.
In some cases, as for example with hybrid engines, there is substantial uncer-
tainty about costs because of lack of prior experience within the firm. GM uses
two methods, often in combination, in these cases. First, when possible, a vehicle
teardown center reverse engineers competing products in which these technologies
are used, and then builds up to a cost estimate. Second, individuals from several
different groups, such as engineering, finance and manufacturing, collaborate to
identify the cost drivers and estimate variable costs. In certain cases, fixed costs
also need to be estimated, if for example a new engine is to be built for a line
of cars. The same inter-functional group then performs a detailed feasibility and
cost analysis before projecting a fixed cost for plant and equipment. Estimates of
this kind are the least accurate, and there is at present no quick substitute for the
detailed analysis required to obtain cost projections.
Product designers at GM typically use the following iterative procedure when
using the proposed method. First, they assume the lower end of the range of fixed
and variable costs for a new module. If it is picked by the optimizer, they then
re-estimate costs using the projected sales volume for a car, or for a line of cars.
The optimizer is rerun, and the costs updated if the module is again selected by the
optimizer. A few iterations are normally sufficient to get a reasonably accurate
estimate of costs.
18
4 Using the methodology
The integrated engineering and marketing model provides product planners with a
learning laboratory where they can conduct hundreds of experiments on the impact
of specific design choices on market acceptance and financial returns. We describe
below a number of different ways in which this machinery can be put to use, and
illustrate these applications with learnings from the MCD portfolio design project
at GM.
Engineering choices and customer decisions
The linking of engineering attributes, module designs, and conjoint attributes pro-
vides a method for assessing the sales and profit impact of different choices of
engineering designs. Product designers and marketers can collaborate to explore
this integrated landscape and develop greater intuition on how certain engineering
decisions increase or decrease the product’s appeal to customers. While some of
these effects are directly apparent — such as the increased customer appeal of
a superior engine technology — others are based on complex interactions in the
model and can yield counter-intuitive results.
For instance, in the MCD project, the design team was surprised to find that a
car with a larger cargo capacity did not perform as well in market simulations as
another design involving a smaller cargo space. Sensitivity and root-cause anal-
ysis revealed the reason to be a tradeoff between cargo capacity and turn circle
that was not directly evident to the designers. The reason for this is that cargo
capacity imposes constraints on the dimensions of a car’s platform. These di-
mensions, in turn, affect the turn circle. From the consumer standpoint, a smaller
turn circle is more important than a larger cargo capacity. Similar analysis in-
volving other attributes and linkages are now done commonly by engineers and
marketers, allowing them to better communicate how and why the ideas and ob-
19
jectives proposed by one group affect the feasibility and impose constraints on the
other group. For example, the idea of designing more environmentally friendly
cars has been proposed several times, by different groups over the years. These
cars tend not to be selected by the conjoint optimizers because the simulations
suggest that consumers are not willing to pay the incremental price that would be
necessary to make the design economically viable. As one of the designers puts
it, people are “green” only as long as they don’t have to pay. Ethanol engines
are another example. These engines are attractive because Ethanol is made from
biomaterial (like corn or grain products), helping reduce dependence on petroleum
and greenhouse gas emissions. However, evaluations of these engines using the
proposed methodology suggest that the cost of Ethanol is a key factor in consumer
acceptance of such cars, not the cost of the car itself. GM thus began working to
make Ethanol competitive with gasoline. Today, about 2 million GM cars on the
road have the capability of running on gasoline or E85, a blend of 85% ethanol
and 15% gasoline.5
Sometimes, products have been developed despite the proposed method pre-
dicting poor market performance. An example is a two-seater electric car. It
was developed, launched, and then withdrawn after it failed in the market. There
are also cases where the proposed methodology has identified important market
opportunities. In these cases, the key decision is not market demand but the fea-
sibility of developing the required technology at a cost that can be justified by
management. For hybrid cars, R&D and production costs, in addition to demand
projections, have been major factors for management to consider.5For details, see http://www.gm.com/company/onlygm/energy_flexfuel.html.
20

Product-line differentiation
Product planners constantly wrestle with the following dilemma. On the one hand,
they want to standardize their product line along a common platform, architecture,
and set of modules, since this reduces manufacturing and logistical complexity
and often yields substantial cost savings. On the other hand, they want to offer a
differentiated product line in order to better meet the needs of different segments
of customers. To assess the tradeoff between costs and customization in the MCD
study, GM designers established three test wells. A test well was a proposed design
for each of the six GM mid-size cars. The three test wells were meant to represent
the designers judgments on what may be optimal portfolio designs. Each test well
was then compared to the designs identified by the proposed integrated model.
The extent of differentiation was assessed by comparing the attribute bandwidth,
which is defined as the range over which attribute levels vary across a product
portfolio.6 As shown in Table 4, the proposed method recommended a product
line with a wider bandwidth — greater differentiation — than the test wells. It also
recommended a product line that was predicted by the conjoint simulator to yield
significantly higher revenues and profits. The results suggested that the designers
had overemphasized the cost of product variety over its benefits in coming up with
the test wells.
Product designers can also utilize the proposed methodology to identify those
attributes for which an increased bandwidth yields the greatest gain in market share
or profits. For instance, the following analyses were conducted in the MCD study.
First, a variety of optimal mid-size car portfolio recommendations, correspond-
ing to different starting conditions or competitive assumptions, were investigated.
The objective of this investigation was to highlight those attributes that consis-6For a discrete attribute, this range is simply the number of levels that appear across products
in the portfolio.
21

tently appear with a larger bandwidth. Next, simplified versions of these recom-
mended product portfolios were evaluated. These simplified portfolios involved
adjustments to the recommended portfolios where all cars were constrained to be
similar along one or more attributes. This analysis provided additional richness
to the team’s understanding on the impact of differentiation along each attribute.
Among the attributes in the MCD study where differentiation was identified to be
important are cargo capacity, turn circle, passing acceleration, fuel economy and
towing capability.
Over time, GM has combined many platforms. It now uses a common plat-
form architecture across a large number of cars. Platforms have also migrated
across product lines, for example from mid-size sedans to small SUVs like the
Saturn Vue. The most recent thrust in this regard is the consolidation to a single
architecture of related product lines across many countries across the world. Sim-
ilar efforts are known to be taking place across the automobile industry; Toyota is
considered to be leading the way in this effort.
Like all conjoint-based models for product-line design, the present approach
accounts for cannibalization in sales, profit and market share when selecting prod-
uct lines. The main difference is that the proposed model allows this assessment
simultaneously in the engineering space and in the market space. In practice, it
seems to be able to differentiate the low margin products from high margin prod-
ucts, while at the same time seeking to establish common technology platforms
that reduce investment requirements and R&D complexity.
Impact of technological innovations
New technologies are often associated with substantial levels of uncertainty in
terms of cost and performance. These technological and financial uncertainties
need to be factored into the product design process. The proposed methodology
22

can be used to evaluate technology development options and to establish target
performance and cost ranges within which a technology would create value for
the business. The essence of this approach to evaluating technological choices
involves two steps. First, designers need to establish linkages between the tech-
nology and the engineering modules and attributes/levels. The technology may,
for instance, trigger changes in the way engineering attributes and levels translate
into conjoint attributes and levels — for instance, by increasing the reliability of
a car. Second, if there are uncertainties in performance or cost, designers can
create multiple scenarios with alternative performance levels and costs for the
technology. By running the market simulation under these alternative scenarios,
designers can map out the range of possible financial outcomes from deploying the
technology, and then determine its suitability and target performance/cost levels.
In the MCD study, designers faced a decision on whether or not GM should
invest in a new engine technology. To evaluate this decision, a number of sce-
narios were constructed involving a range of performance levels — in terms of
fuel economy and passing acceleration — and variable costs for the technology.
Running the market simulation model under these alternative scenarios provided
rich learnings on the conditions under which it was attractive to introduce this
engine technology into GM’s mid-size car portfolio. Such analyses have led to
the investments in such technologies as Ethanol engines.
Highlighting Key Engineering and Customer Attributes
Given the combinatorial complexity of evaluating new, multi-attribute products,
and particularly portfolios of products, a mechanism that efficiently highlights the
likely subspace of the overall feasible region where optimal solutions may lie is
of substantial value to designers. One such mechanism that is facilitated by the
integrated methodology is the identification of specific engineering attributes that
23

are particularly important in driving business performance.
In the MCD study, the methodology provided the project team with specific
insights into the selection of several key engineering attributes such as motor
compartment and engine, and key customer attributes such as fuel economy and
turning circle. In particular, the methodology consistently identified vehicles with
higher fuel economy, slower acceleration and smaller turning circles relative to
vehicles in the three test wells. By further analyzing the interactions across en-
gineering attributes, the team was able to link the recommended smaller turning
circles with specific motor compartments that facilitated a number of benefits to
the customer (of which turning circle was one), discovering through the process
the importance of certain motor compartments.
Product designers also look for designs that are difficult for competitors to
copy. For example, new seat configurations or new floorpans are less likely to
be copied by competitors because these can have high design costs. On the other
hand, smaller engines are easy to copy and build and are therefore considered less
attractive by designers. There are also cases where the conjoint simulations might
make recommendations that are not accepted by the designers because they are
untried and require large investments. An example is the design of folding seats,
which was considered but rejected for a line of SUVs because it required a large
investment. Another example was the decision to not introduce new colors in a
product line because the cost of building a new paint shop can be very high.
5 Conclusion
The methodology we have described has gained wide adoption at GM. After its
initial application to designing mid-size cars, the methodology has been extended
to design small SUVs like the Chevy Equinox, and subsequently, full-sized SUVs
like the Chevy Tahoe and Escalade. Design teams for several additional lines of
24

GM cars have also used these methods. Product engineers and marketers have
benefited by developing a common understanding of the tradeoffs involved be-
tween engineering and marketing decisions. GM focuses on share-maximization
and profit maximization and actively explore the trade-offs between the two.
GM designers have learned several important lessons using the proposed method-
ology over the last ten years. One is that conjoint simulations may tend to under-
state the price sensitivity of consumers. Designers now make subjective adjust-
ments for this in their models, and are currently working on ways to make these
adjustments more formal in the product optimizer. Prices in most simulations are
typically restricted to realistic ranges that depend on models and brands. Closer
to market launch, the actual costs of modules and designs tend to be higher than
the earlier cost estimates. Designers at GM now try to build in a scaling factor in
the conjoint simulations to represent this likelihood.
Experience suggests that it is better to not rely on one optimization run with
all the constraints specified ahead of time. It is easier to start with unconstrained
optimization, and then add constraints one at a time to produce a series of so-
lutions. The advantage is that there is a lot of learning in this process. It is in
effect a structured approach to exploring the design space. GM designers know
when to call in experts, and the entire development team learns about why certain
technological or cost constraints are necessary.
The focus on common platforms tends to make unique architectures less viable
from an economic standpoint. And there are instances where seemingly simple
proposals for changes in a product lead to a cascading sequence of inter-related
changes in design that are otherwise not evident to designers. Certain types of
designs are favored by GM designers if these appear in the simulations. These
are designs that are difficult for competitors to copy; and designs that can be used
across product lines and countries. GM designers try to keep away from easily
25

copied changes, especially if these require large investments.
The largest impact of the method is that GM has been able to better differ-
entiate models like Oldsmobile and Chevrolet while using a common platform
architecture. The methodology is used to evaluate new investment decision, to
target R&D efforts and to identify entirely new ways of introducing competing
products. Navigation systems are one example. Nonreflective flat screens have
been used by many of GM’s competitors in car navigation systems. These screens
are very expensive. They can also be difficult for consumers to use. The methods
described in this paper led to the development of Onstar. GM was looking to
find an alternative that would compete well against flat screens and would also be
much less expensive to produce and maintain. The model described in this paper
recommended a radio (text) screen, accompanied by verbal commands for direc-
tions and map downloads. Design engineers developed this option in the Onstar
system. It was first offered on select models of Buick, Pontiac and Cadillac cars
in the late 1990’s. Today, General Motors offers OnStar on more than 50 models.
26

References
Balakrishnan, P.V. and V.S. Jacob (1996), “Genetic algorithms for product design,”Management Science, 42 (1), 1105–1117.
Boothroyd, G. and P. Dewhurst (1983), Design for assembly: a designer’s hand-book, Amherst, MA.: Boothroyd and Dewhurst.
Chen, K.D. and W.H. Hausman (2000), “Mathematical properties of the optimalproduct line selection problem using choice-based conjoint analysis,” Man-agement Science, 46 (2), 327–332.
Dobson, G. and S. Kalish (1988), “Positioning and pricing a product line,” Mar-keting Science, 7 (2), 107–125.
Dobson, G. and S. Kalish (1993), “Heuristics for pricing and positioning a product-line using conjoint and cost data,” Management Science, 39 (2), 160–175.
Fisher, M., K. Ramdas and K. Ulrich (1999), “Component sharing in the manage-ment of product variety: a study of automotive braking systems,” ManagementScience, 45 (3), 297–315.
Frieze, A. and M. Jerrum (1997), “Improved approximation algorithms for MAXk-CUT and MAX BISECTION,” Algorithmica, 18, 61-77.
Garey, M.R. and D.S. Johnson (1979), Computers and intractability: a guide tothe theory of NP-completeness, San Francisco: Freeman.
Goemans, M.X. and D.P. Williamson (1995), “Improved approximation algo-rithms for maximum cut and satisfiability problems using semidefinite pro-gramming,” Journal of the Association for Computing Machinery, 42, 1115–1145.
Green, P.E., J.D. Carroll and S.M. Goldberg (1981), “A general approach toproduct design optimization via conjoint analysis,” Journal of Marketing, 45,(Summer), 17–37.
Green, P.E. and A.M. Krieger (1985), “Models and heuristics for product lineselection,” Marketing Science, 4, 1–19.
Green, P.E. and A.M. Krieger (1989), “Recent contributions to optimal productpositioning and buyer segmentation,” European Journal of Operational Re-search, 41, 127–141 .
Green, P.E. and A.M. Krieger (1991), “Product design strategies for target-marketpositioning,” Journal of Product innovation Management, 189 (8), 189–202.
Griffin, A. (1992), “Evaluating QFD’s use in U.S. firms as a process for developingproducts,” Journal of Product Innovation Management, 9 (3), 171-187.
Griffin, A. and J.R. Hauser (1993), “The Voice of the Customer,” Marketing Sci-ence, 12 (1), 1-27.
Hauser, J.R. and D. Clausing (1988), “The House of Quality,” Harvard BusinessReview, 3 (May-June), 63–73.
27

Hauser, J.R. (1993), “How Puritan-Bennett used the House of Quality,” SloanManagement Review, 34 (3), 61–70.
Kohli, R. and R. Krishnamurti (1987), “A heuristic approach to product design,”Management Science, 33,1523–1533.
Kohli, R. and V. Mahajan (1991), “A reservation price model for optimal pricing ofmultiattribute products in conjoint analysis,” Journal of Marketing Research,28 (August), 347-354.
Kohli, R. and R. Sukumar (1990), “Heuristics for product-line design using con-joint analysis,” Management Science, 36, 1464–1478.
Krishnan, V. and K. T. Ulrich (2001), “Product development decisions: a reviewof the literature,” Management Science, 47 (1), 1–21.
McBride, R.D. and F.S. Zufryden (1988), “An integer programming approach tothe optimal product line selection problem,” Marketing Science, 7,126–140.
Nair, S.K., Thakur, L.S. and Wen, K. (1995), “Near optimal solutions for productline design and selection: Beam search heuristics,” Management Science, 41(5), 767–785.
Ramdas, K., M. Fisher and K. Ulrich (2003), “Managing variety for assembledproducts: modeling component systems sharing,” Manufacturing and ServiceOperations Management, 5 (2), 142–156.
Srinivasan, V., W. S. Lovejoy and D. Beach (1997), “Integrating product designfor marketability and manufacturing,” Journal of Marketing Research, 34 (1),154–163.
Taguchi, G., E.A. Elsayed and T. Hsiang (1989), Quality engineering in productionsystems, New York: McGraw Hill.
Ulrich, K.T. (1995), “The role of product architecture in the manufacturing firm,”Research Policy, 24, 419–440.
Ulrich, K.T. and W.P. Seering (1990), “Function sharing in mechanical design,”Design Studies, 11 (4), 223–234.
Ulrich, K.T. and S.D. Eppinger (2004), Product design and development, 3rdedition, New York: Irwin/McGraw-Hill.
28

Appendix
Maxcut representation of the module partitioningproblem
The separation of modules into master and secondary categories can be achievedby solving the following maxcut problem. Consider a dependency graph G(V, E)
in which the vertices i ∈ V correspond to modules. An edge e ∈ E connects apair of vertices i, j ∈ V if the associated modules are not independent; i.e., if theselection of one model constrains the choices of designs for the other module. Itis sometimes advantageous to associate weights we for all edges e ∈ E (notation-ally, we will interchangeably write we and wij with the understanding that edge e
connects the pair of vertices i and j). The weights reflect the relative degree ofdependence between pairs of modules. For example, one can use as weights thenumber of pairs of module designs that are mutually infeasible for a pair of mod-ules; these values then reflect the extent to which a pair of modules is mutuallyconstraining. The special case we = 1 for all edges e ∈ E implies no differencein the importance associated with one or another pair of attribute dependencies.
A cut comprises the edges between a partition of the vertices into two subsetsV1, V2 = V \ V1. A cut in which there are no edges within either subset (i.e., alledges are between subsets) has the property that all modules within a partitionare independent: choosing one module design places no feasibility constraints onthe choice of other modules in the subset. Such a solution may not exist; onethen wishes to find a partition of vertices that maximizes the weighted sum of theedge weights across a cut. This is the maxcut problem. It can be written as thefollowing integer quadratic program (see, e.g., Goemans and Williamson 1995):
Maximize 12
Pi<j wij(1 − yiyj)
subject to yi ∈ {−1, 1}, for all i ∈ V.
29
In the above formulation, yi = −1 if vertex i belongs to (say) V1; and yi = 1 if itbelongs to the other subset of vertices. Note that yi = yj if both modules i and j
are in the same subset and then the associated term in the objective function has avalue of zero; but if i and j are modules in different subsets, then yiyj = −1 andthe associated term in the objective function is
1
2wij(1 − yiyj) = wij.
The optimal solution to the maxcut problem is a partition of the modules into twosets so that the weighted number of dependencies is maximized across subsets.As the total number of edges in the graph is fixed, this is equivalent to minimizingthe weighted number of dependencies within each subset of modules. The maxcutproblem is NP-Hard (Garey and Johnson 1979) and so it has no exact polynomialtime solution procedures unless P=NP; but there are well known approximationalgorithms (e.g., Goemann and Williamson’s (1995) randomized algorithm thatuses a semidefinite programming approach).
Given a maxcut solution for a specific set of modules, we define one subset as thecollection of primary modules; and the other set as a collection of secondary mod-ules. We then propagate constraints by first selecting designs for primary modulesand then imposing the implied constraints on the designs for the secondary mod-ules. The labeling of maxcut partitions as primary and secondary is based on thejudgments of engineers and designers.
30

Table 1: Conjoint attributes used in MCD study
Attribute Number of levels
1. Fuel economy 42. Make 23. Cargo capacity 44. Turning circle 45. Drive type 46. Passing acceleration 47. Towing capability 48. Transmission type 49. Front interior package 410. Rear interior package 411. Exteriors 412. Engine technology 413. Price 4
Table 2: Engineering modules and module designs in MCD study
Module Number of designs
1. Floorpan 122. Cowl 43. Front suspension 94. Rear compartment plan 185. Motor compartment 166. Rear suspension 97. Engine 358. Transmission 119. Sideframe 18
31

Table 3: Linking fuel efficiency and module designs in MCD study
Gallons per 100 miles = a + b Curb weight +P
i cixi
Curb weight = k · Floor areaFloor area = Overall width × Overall lengthOverall width = max{(d1+Front shoulder room), (d2+Track})Overall length = (Front overhang) + (Wheelbase) + (Rear overhang)Wheelbase = (Axle to Ball-of-Foot) + (Ball-of-Foot to Rear H-Point)
+ (Rear H-Point to Axle)Axle to BOF = (Dash to Bumper) − (Front overhang) + (Ball-of-foot to Dash)————————————————-Note: a, b and ci are model parameters; k, d1, and d2 are positive constants; xi
denote dummy variables representing the alternative engine, transmission and thefinal drive modules.
Table 4: Attribute bandwidths for the test wells and the proposed model’s recom-mendations
Attribute Test well bandwidth(s) Proposed model bandwidth
1. Transmission 1 level 2 − 3 levels2. Drive 1 level 2 levels3. Passing acceleration 0.5 sec. and 1 sec. 1.5 sec.4. Fuel economy 1 mpg and 3 mpg 2 − 3 mpg
32

Fig
ure
1: O
verv
iew
Of
Pro
duct
Por
tfol
io O
ptim
izat
ion
Sys
tem
(P
RO
PO
SE
)
Con
join
tan
alys
is
Mar
ket m
odel
Eng
inee
ring
mod
el M
odul
es &
at
trib
utes
Cos
tm
odel
Calc
ula
tes
mark
et s
hare
& u
nit
sale
s
Fin
anci
al m
odel
•Pro
fits
•Sal
es•R
OI*
Tra
nsla
tor
E
ngin
eeri
ng m
odel
-->
Mark
et m
odel
Opt
imiz
atio
n m
odel
Pro
duct
por
tfol
io
sear
ch a
lgor
ithm
* R
eturn
on i
nve
stm
ent
Con
stra
ints
Module
des
igns
Tec
hnic
al
const
rain
ts
33
Eac
h co
mbi
nati
on o
f en
gine
erin
g at
trib
utes
leve
ls d
escr
ibes
a p
ossi
ble
mod
ule
desi
gn; n
ot a
ll s
uch
com
bina
tion
s m
ay b
e fe
asib
le. A
pro
duct
is d
escr
ibed
by
aco
llec
tion
of
mod
ule
desi
gns,
one
des
ign
per
mod
ule.
Fig
ure
2: H
iera
rchi
cal R
epre
sent
atio
n of
a P
rodu
ct a
s a
Col
lect
ion
Of
Mod
ule
Des
igns
, Eng
inee
ring
A
ttri
bute
s, A
nd L
evel
s of
Eng
inee
ring
Att
ribu
tes
Eng
inee
ring
att
ribu
tes
Lev
els
of e
ngin
eeri
ng a
ttri
bute
s
Product
Mod
ules
ST
RU
TS
LA
Typ
e
Fro
nt
susp
ensi
on
Tra
ck
34

Eng
ine
Acc
esso
ries
Tra
nsm
issi
on
Fin
al D
rive
Wei
ght (
Iner
tia)
Rol
ling
Res
ista
nce
Aer
odyn
amic
Dra
g
Sys
tem
Eff
icie
ncy
Roa
d L
oad
Fue
l Con
sum
ptio
n
Sou
rce:
Eff
ecti
vene
ss a
nd I
mpa
ct o
f C
orpo
rate
Ave
rage
Fue
l Eco
nom
y (C
AF
É)
Sta
ndar
ds (
2002
)
Fig
ure
3: A
n Il
lust
rati
on o
f D
ecom
posi
tion
for
Fue
l Eco
nom
y
35

Sou
rce:
Eff
ecti
vene
ss a
nd I
mpa
ct o
f C
orpo
rate
Ave
rage
Fue
l Eco
nom
y (C
AF
É)
Sta
ndar
ds (
2002
)
0
100
115
00
250
0
350
0
450
0
550
0
6 5 4 3 2
Cur
b w
eigh
t (po
unds
)
Gallons used per 100 miles
Fig
ure
4: E
mpi
rica
l Rel
atio
nshi
p B
etw
een
Aut
omob
ile
Fue
l Eff
icie
ncy
And
Wei
ght
36
Fig
ure
5: G
raph
Rep
rese
ntin
g M
odul
es (
Ver
tice
s) A
nd T
heir
Dep
ende
ncie
s (E
dges
) F
orT
he G
M M
id-C
ar D
esig
n S
tudy
The
labe
ls f
or th
e ve
rtic
es r
efle
ct th
e nu
mbe
ring
of
engi
neer
ing
attr
ibut
es in
Tab
le 2
37

Fig
ure
6: P
arti
tion
Of
Mod
ules
(V
erti
ces)
Int
o In
depe
nden
t, P
rim
ary
And
Sec
onda
ry M
odul
esF
or T
he G
M M
id-C
ar D
esig
n S
tudy
38