Embed Size (px)
Citation preview

Integrated Annual Report 2016 SUMMARY

Contents
This is the Summary of the fi ft h TITAN Group Integrated Annual Report (IAR 2016), which has been prepared in accordance with the legal requirements at national and European level, the International Integrated Reporting Council Standards (IIRC), the UK Corporate Governance Code and the International Financial Reporting Standards (IFRS).
The full Integrated Annual Report (IAR 2016) comprises the TITAN Group Annual Report 2016 and the 2016 GRI Index that has been developed in line with GRI G4 Guidelines.
The review of non-fi nancial performance of TITAN Group is presented in the Integrated Annual Report 2016, with reference to the issues identifi ed as material for the Group and its key stakeholders. To identify, prioritize and report material issues, TITAN applies international standards and in particular the related principles and guidelines of the Global Reporting Initiative (GRI), the respective guidelines and protocols of the Cement Sustainability Initiative (CSI), which operates in the framework of the World Business Council for Sustainable Development (WBCSD) and the “Advanced” level criteria for Communication on Progress (COP) of the UN Global Compact (UNGC) initiative. The IAR 2016 is independently verifi ed by ERM CVS in accordance with the above sustainability standards.
The IAR 2016 and the ERM CVS Assurance Statement are available online at integratedreport2016.titan.gr
Please send us your feedback through the above URL.
CEO message
Highlights of our business in 2016 and outlook for the Group.
02
Regional performance
Our business development and performance in 2016 in our four regions – USA, Greece and Western Europe, Southeastern Europe and Eastern Mediterranean.
22
Business overview
An overview of our Group, how we build value, assess our material issues and engage with stakeholders.
04
Corporate governance
A summary of our governance and Board activities in 2016.
32
Group performance
Our Group performance in 2016 across a wide range of fi nancial and non-fi nancial measures.
14
Appendices
Our summary fi nancial and non-fi nancial statements.
34

1TITAN Group Integrated Annual Report 2016 Summary
Building our future together
In 2016, we made further progress toward our key priorities of balancing profitability and growth, building operational excellence and nurturing the long-term sustainability of our business.
Our focus on geographical diversification and vertical integration has enhanced the resilience of the business, enabling us to grow in prospering markets and to deliver satisfactory results in some challenging markets. Continuous improvement remains a key driver for everyone at TITAN, with several ongoing initiatives at both Group and local level.
Turnover
€1,509.2 mEBITDA
€278.6 m Profit after taxes
€127.4 m
Total assets
€2,789.8 m Capital expenditure Total:
€150.6 mOn environment:
€37.9 m
Employees
5,482(as at 31 December 2016)
In 2016 we made progress in moving forward together with our stakeholders to foster sustainable development and build a better future for all. This Summary Report draws information from our Integrated Annual Report 2016 and presents supplemental case studies.
While strengthening the business is a priority, collaboration with stakeholders at all levels is a key component of our approach to sustainability. We work to ensure that our operations grow responsibly, learn from stakeholders and deepen partnerships at all levels. To this end, we are committed to supporting the 2030 Agenda for Sustainable Development, engaging in global and local partnerships toward the achievement of its Sustainable Development Goals (SDGs).
2016 highlights

Busin
ess
ove
rvie
w
Gro
up p
erfo
rma
nce
R
eg
iona
l pe
rform
anc
e
Co
rpo
rate
go
vern
anc
e
2 TITAN Group Integrated Annual Report 2016 Summary
CEO message
Dear Shareholders and Stakeholders,
Over the past year, marked by mixed but on balance favorable market developments, TITAN made further progress along its key priorities of balancing profitability and growth, building operational excellence and nurturing the long-term sustainability of its business.
Strong results in the US drive organic growth
TITAN turnover and profitability continued growing for a third consecutive year, driven primarily by market growth in the USA and to a lesser extent operational improvements in Egypt. Consolidated turnover increased by 8% to €1,509 million and Earnings before Interest, Tax, Depreciation and Amortization (EBITDA) increased by 28.7% to €279 million. Net Profit after minority interest and the provision for taxes (NPAT) rose to €127 million, which includes a gain from a deferred tax asset recognition of €90 million in the US, associated with previously unrecognized carry-forward net operating losses generated in previous years.
In the US, demand for building materials continued to grow within a generally positive economic environment of low unemployment, consumer confidence and infrastructure development. TITAN, having implemented a €200 million investment program over the last three years, was able to capitalize on the market growth to increase sales volumes, plant utilization and profitability, both in cement and in its vertically integrated activities.
Egypt enjoyed a growth in demand and benefited significantly from a decline in production costs as it progressed towards its goal of solid fuel self-sufficiency; the last component of the relevant capital expenditure program, the coal mill in Alexandria plant, commenced operations in December. As a consequence, in spite of the devaluation of the Egyptian pound by more than 50% in the course of the year, our operations managed to improve profitability, even in EUR terms, albeit from a low comparative basis.
In Greece, now in its seventh year of austerity, the construction market remains in deep recession, with limited spending on infrastructure projects and a virtual halt in private housing construction. Our Greek operations continued their strong export performance in volume terms, but profitability was negatively affected by competitive pressures in the international trade destinations.
The markets of Southeastern Europe provided a mixed picture, with our operations showing an overall stable performance. Our joint venture in Turkey benefited from the increased local demand for infrastructure and private housing, but was negatively affected, in EUR terms by the Turkish lira devaluation.
Investing for organic growth and regional expansion
In line with our objective of geographical diversification in selected regions, we extended our geographical footprint in South America through the acquisition of an equity stake in Cimento Apodi, a Brazilian cement manufacturer.
3TITAN Group Integrated Annual Report 2016 Summary
Cimento Apodi operates an integrated cement plant and a grinding plant in the state of Ceará in Northeast Brazil, with a production capacity of over 2 million tons of cement per year. Current demand for building materials in Brazil is low; however, the fundamentals in terms of urban population growth indicate stronger longer term prospects.
Investments in existing operations stood at €151 million, primarily in relation to our activities in the US and the solid fuel conversion project in Egypt. Investment programs continued in the other regions as well, mainly linked to sustaining business and environmental improvements.
On the funding side, TITAN was able to raise a 5-year, €300 million bond with a 3.5% coupon; Standard & Poor’s reconfi rmed the company’s “BB” rating, with a positive outlook, highlighting the strong liquidity of the Group.
Group initiatives towards operational excellence
We continuously invest in improving our competitiveness, both through local initiatives led by our regional management teams and centrally at Group level. Current areas of focus include excellence in operational maintenance, new digital and IT infrastructure, enhanced product and process innovation capacity, as well as two major Group-wide initiatives, on procurement and people development.
Our Group Procurement Transformation program, which went through its fi rst phase of implementation in 2016, aims to optimize the number of suppliers and build on long term value-added supplier relationships with an emphasis on “total cost” reduction, transparency and enhancement of our sustainability impact on the supply chain.
The “Titan Leadership Platform”, a major program addressing our employees announced in 2015, was rolled out to all countries, promoting the behaviors that drive strong leadership performance, through a new personal development process. The program addresses the most material issues raised by our employees in the 2015 survey and provides an eff ective conduit through which our core values can be further disseminated.
Aligning with the UN Sustainable Development Goals
Supporting the United Nations Agenda 2030 for sustainable development, launched in late 2015, we proceeded to complete materiality or social impact assessments at local level in all countries with majority owned operations, including a fi rst alignment with the SDGs, which we will support through our existing and new local and global partnerships. On the basis of the regional inputs, the corporate materiality matrix was reviewed and re-confi rmed as an up-to-date record of the priority issues that TITAN aims to address through its sustainability strategy.
Our sustainability governance has been further enhanced through the establishment of a Sustainability Committee, comprising members of the TITAN Board and its Executive Committee, overseeing our long-term commitment to sustainable development.
Indicative highlights of our sustainability eff orts in 2016 include the Group’s continuing focus on safety, which resulted in a reduction in lost time incidents; the increased use of waste or by-products as raw materials; the recognition of our Pennsuco operations in Florida for their “zero waste” performance; and the enhancement of the Group’s partnerships with academia and educational- support programs, in line with our European “Pact for Youth” commitment.
Our investment in emission control and reduction, where needed, continued, leading to a further signifi cant improvement in dust emissions; on the other hand, CO2 emissions increased marginally, as the improvement achieved through the increased use of alternative fuels was not suffi cient to counteract an unfavorable fuel and product mix. In the process of detailing our strategy in alignment with the UN Agenda 2030, we will defi ne within 2017 our new long-range emissions targets.
A positive outlook for 2017
Prospects for TITAN in 2017 appear positive, despite the considerable challenges and uncertainties around the globe. The USA business is expected to remain the main driver of growth and profi tability, thanks to the growth in demand and the benefi ts accrued from our extensive investments.
In Greece, demand may decrease further due to a timing gap in the infrastructure projects pipeline; exports will continue, but under increasingly competitive pressures. Southeastern Europe, in a broader region of political instability and economic weakness, will remain at its current levels of activity. In Egypt, in spite of volatility in the short term, demand is likely to be sustained and our operations will benefi t from the impact of the investment program completed in late 2016. In Turkey, the positive trend is likely to be reversed, as additional cement production capacity comes on stream and domestic challenges may aff ect demand. Finally, in Brazil, demand is expected to begin to stabilize in 2017.
Based on the 2016 results and the outlook for 2017, the Board of Directors is proposing to the General Assembly of Shareholders the payment of a dividend distribution of €0.10 per share and, in addition, a return of capital of €1.00 per share.
We would like to thank our shareholders and stakeholders for their support in the execution of our strategy to deliver on growth and profi tability, to strengthen our competitiveness and to secure the long-term sustainability of our business.
Dimitri PapalexopoulosChief Executive Offi cer
Busin
ess
ove
rvie
w
Gro
up p
erfo
rma
nce
R
eg
iona
l pe
rform
anc
e
Co
rpo
rate
go
vern
anc
e
4 TITAN Group Integrated Annual Report 2016 Summary
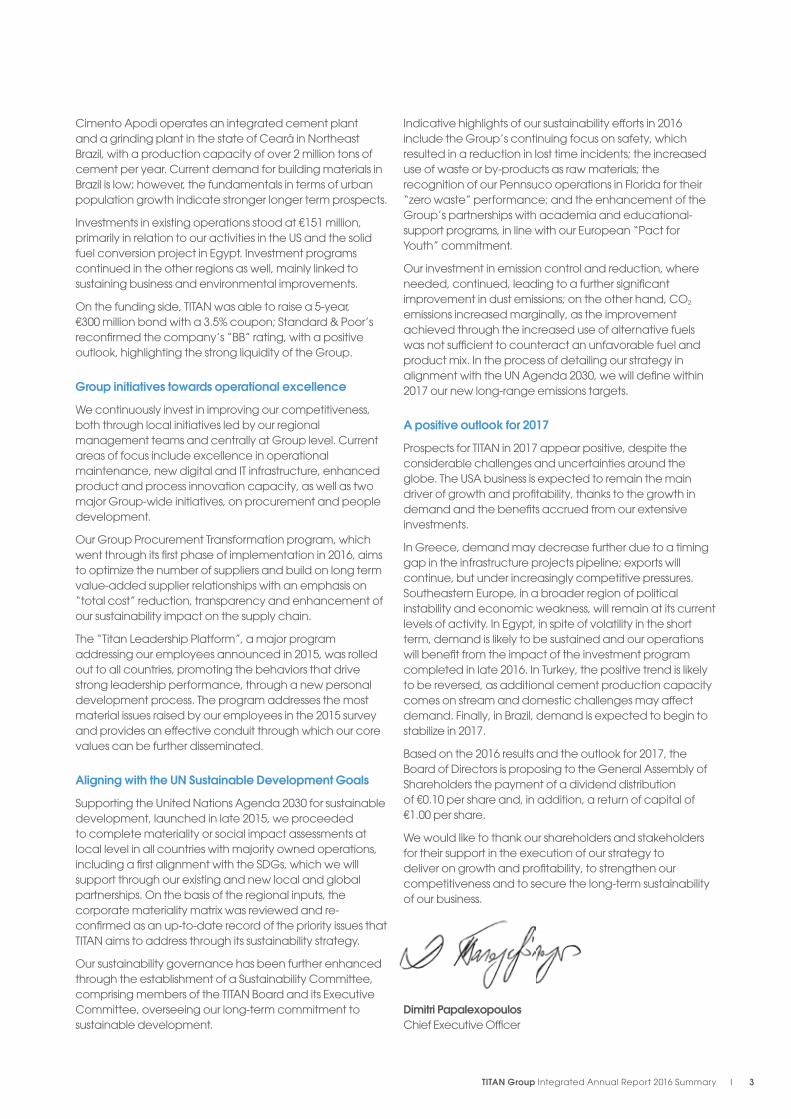
Business overview TITAN is a multiregional cement and building materials producer. Headquartered in Athens, Greece, the Group operates cement plants in ten countries.
During 114 years in business, the values at the heart of our culture have helped us conduct our business with respect, accountability and responsibility. Following an inclusive strategy, we have remained agile and dynamic, and always consider wider stakeholder needs over the longer term in the context of our strategic priorities.
Our success depends on employing the best available technologies, our systematic research and constantly updated know-how. Above all, we rely on our highly skilled and experienced people who live the values of the Group. Our business activities are carried out by both wholly owned companies and joint ventures with established partners; they cover the production, transportation and distribution of cement, concrete, aggregates, fl y ash, mortars and other building materials.
Our history demonstrates our enduring commitment to serving the needs of society while contributing to sustainable growth with responsibility and integrity.The materials we provide help build the structures that shelter people and enhance human life; the places that enable commerce, fuel business growth, support education and foster health; and the infrastructures that connect people from the smallest villages to the largest metropolitan cities.
We remain focused on the long-term sustainability of our business and on improving the triple bottom line of fi nancial, social and environmental performance. We take action at local level, promoting solutions that safeguard sustainable growth for our business, communities and key stakeholders, while seeking also to contribute meaningfully to global initiatives.
We have worked together with stakeholders at global, regional and local level since 2002 to ensure collaboration for sustainable development. Through partnerships and collaborative action, we aim to multiply the value we create, sharing our know-how, experience and best practices, while working together with stakeholders to address the impacts and opportunities facing our business.
The following are our most important global collaborations:
We were among the fi rst 500 signatories of the UN Global Compact (UNGC) and are involved in local UNGC networks in Greece, F.Y.R. of Macedonia, Serbia and Egypt.
We have been a core member of the Cement Sustainability Initiative (CSI), of the World Business Council for Sustainable Development, since 2003.
We joined CSR Europe in 2004, and participate in national partner organizations operating in Greece, Kosovo, Serbia and Albania.
WE SUPPORT

5TITAN Group Integrated Annual Report 2016 Summary
One governing objective, one set of strong values
Geographical diversifi cation
We expand our business through acquisitions and greenfi eld developments into attractive new markets, to diversify our earnings base and mitigate the reliance on few markets.
Vertical integration
We extend our business into other product areas in the cement value chain, serving our customers better and accessing new profi t opportunities.
Continuous competitive improvement
We implement new effi ciencies throughout our business to reduce costs and compete more eff ectively.
Focus on human capital and corporate social responsibility
We care for and develop our employees and continuously improve our good relationships with all internal and external stakeholders, always aiming for mutual respect and understanding.
Strategic prioritiesTo achieve our governing objective, we focus on four strategic priorities:
Underpinning these priorities is our approach to sharing best practice and leveraging expertise. Applying this approach across the Group helps the development of our capabilities and the effi cient delivery of our governing objective.
Our valuesOur values are at the core of who we are; they guide our strategy and provide the foundation for all our operations.They have provided our people with a strong bond and supported the growth that has sustained us for over a century, stemming directly from the principles, beliefs and vision of our founders back in 1902. They remain the solid basis of our culture and family spirit.
Integrity – Ethical business practices – Transparency – Open communication
Value to the customer – Anticipation of customer needs – Innovative solutions – High quality of products and services
Know-how – Enhancement of our knowledge base – Profi ciency in every function – Excellence in core competencies
Our governing objectiveWe aim to grow as a multiregional, vertically integrated cement producer, combining an entrepreneurial spirit and operational excellence with respect for people, society and the environment.
Continuous improvement – Learning organization – Willingness to change – Rise to challenges
Delivering results – Shareholder value – Clear objectives – High standards
Corporate Social Responsibility – Safety fi rst – Sustainable development – Stakeholder engagement
Our values are ingrained in the Group’s ethos – the Greek word for “character” or “spirit” – that guides the way we conduct our business with respect, accountability and responsibility.

Busin
ess
ove
rvie
w
Gro
up p
erfo
rma
nce
R
eg
iona
l pe
rform
anc
e
Co
rpo
rate
go
vern
anc
e
6 TITAN Group Integrated Annual Report 2016 Summary
Where we operate
Our operations are organized into four geographic regions.
USA Greece and Western Europe
5
2
3
Cement plants1 Tokat (Turkey)2 Alexandria (Egypt)3 Beni Suef (Egypt)
Grinding plants4 Marmara (Turkey) 5 Antalya (Turkey)
Egypt
Turkey
Cement plants1 Roanoke (Virginia)2 Pennsuco (Florida)
1
2
USA
Cement plants1 Kosjeric (Serbia)2 Zlatna (Bulgaria)3 Sharr (Kosovo)4 Usje (F.Y.R. of Macedonia)5 Antea (Albania)
1
34
2
5
BulgariaSerbia
Albania
Kosovo
F.Y.R. of Macedonia
Cement plants1 Thessaloniki2 Kamari 3 Patras
Grinding plant4 Elefsina
243
1
Greece
Eastern MediterraneanSoutheastern Europe
14

7TITAN Group Integrated Annual Report 2016 Summary
2 Cement plants
3 Cement plants
5 Cement plants
3 Cement plants
84 Ready-mix plants
6 Ready-mix plants
8 Ready-mix plants
27 Ready-mix plants
9 Concrete block plants
2 Grinding plants
1 Processed engineered fuel facility
1 Grinding plant
6 Quarries
16 Quarries
17 Quarries
26 Quarries
15 Distribution terminals
2 Distribution terminals
1 Distribution terminal
7 Distribution terminals
8 Fly ash processing plants
1 Processed engineered fuel facility
1 Dry mortar plant
Expansion into BrazilIn September 2016, we expanded our geographical footprint into a new region with the acquisition of an equity stake in Companhia Industrial de Cimento Apodi, a Brazilian cement manufacturer with a production capacity of more than 2 million tons of cement per year.
USA Eastern MediterraneanSoutheastern Europe
Greece and Western Europe
Turnover
€794 m53%
Turnover
€249 m16%
Turnover
€204 m14%
Turnover
€261 m17%
EBITDA
€145 m52%
EBITDA
€41 m15%
EBITDA
€56 m20%
EBITDA
€36 m13%
Assets
€1,159 m42%
Assets
€475 m17%
Assets
€489 m18%
Assets
€667 m23%
Principal products/activities
Principal products/activities
Principal products/activities
Principal products/activities
Employees
2,049[As at 31.12.16]
Employees
966[As at 31.12.16]
Employees
1,282[As at 31.12.16]
Employees
1,185[As at 31.12.16]
Principal products/activities key:
CementReady-mix concrete Aggregates
Dry mortars
Building blocks Fly ash
Waste management and alternative fuels
Busin
ess
ove
rvie
w
Gro
up p
erfo
rma
nce
R
eg
iona
l pe
rform
anc
e
Co
rpo
rate
go
vern
anc
e
8 TITAN Group Integrated Annual Report 2016 Summary
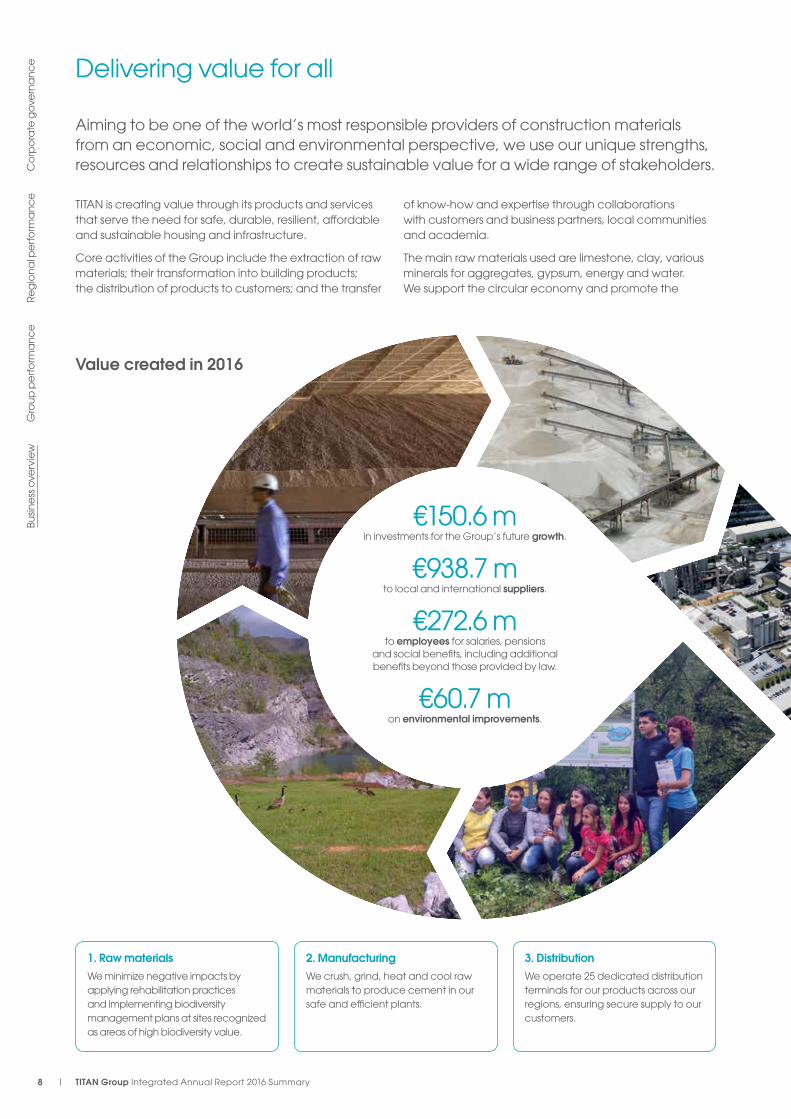
Delivering value for all
Aiming to be one of the world’s most responsible providers of construction materials from an economic, social and environmental perspective, we use our unique strengths, resources and relationships to create sustainable value for a wide range of stakeholders.
TITAN is creating value through its products and services that serve the need for safe, durable, resilient, affordable and sustainable housing and infrastructure.
Core activities of the Group include the extraction of raw materials; their transformation into building products; the distribution of products to customers; and the transfer
of know-how and expertise through collaborations with customers and business partners, local communities and academia.
The main raw materials used are limestone, clay, various minerals for aggregates, gypsum, energy and water. We support the circular economy and promote the
€150.6 m in investments for the Group’s future growth.
€938.7 mto local and international suppliers.
€272.6 m to employees for salaries, pensions
and social benefits, including additional benefits beyond those provided by law.
€60.7 mon environmental improvements.
1. Raw materialsWe minimize negative impacts by applying rehabilitation practices and implementing biodiversity management plans at sites recognized as areas of high biodiversity value.
2. ManufacturingWe crush, grind, heat and cool raw materials to produce cement in our safe and efficient plants.
3. DistributionWe operate 25 dedicated distribution terminals for our products across our regions, ensuring secure supply to our customers.
Value created in 2016

9TITAN Group Integrated Annual Report 2016 Summary
sustainable consumption of materials to achieve greater resource productivity and waste reduction. We operate systems for recycling, processing and utilizing waste as alternative raw materials and alternative fuels, thereby conserving valuable resources and reducing our carbon footprint.
Our research and development activities include the monitoring, integration and application within TITAN of the global best practices for environmental footprint reduction; the improvement of cement and concrete products’ properties; and the development of new products.
We also create value through investments in improving the skills of our people; the implementation of long-term and focused community engagement programs; and through capacity building of our local business partners. Our approach to value creation for all stakeholders contributes to building our reputation, increases control over risks and ensures our long-term license to operate.
€80.6 m in taxes to national
and local authorities.
17.5 m metric tons of cement to customers,
along with many other products.
€30.5 m to shareholders and
minorities for 2015 results.
€2.6 m in community projects.
4. Customers and partnersWe work closely with partners and customers at a local level to enhance the value our business creates for local communities.
5. Society and environmentWe aim to ensure that our business has a positive impact on society and the local communities close to our operations.

Busin
ess
ove
rvie
w
Gro
up p
erfo
rma
nce
R
eg
iona
l pe
rform
anc
e
Co
rpo
rate
go
vern
anc
e
10 TITAN Group Integrated Annual Report 2016 Summary
Focus on material issues
As expectations from business are growing at all levels, focusing on material issues is becoming increasingly important in developing a coherent, inclusive and consistent sustainability strategy.
Employees
Regulators/Authorities
Youth
Localcommunities
and governments
Business partners and
suppliers
Investorsand analysts
Shareholders
Non-governmental organizations
(NGOs)
Customers
Engage with sta
keho
lde
rs
Identify key stakeholders
Revi
ew
and
rep
ort p
erfo
rmance
Engage employees in Strategy developmen
t
2
1
5
strategy implementation
focused on speci�c
prio
ritie
s
to verify ma
teria
lity
and material issues
to s
take
hold
ers
4 3
Materiality assessment
In 2016, all regional operations except for Antea cement plant (TITAN Albania) and Adocim cement plant (TITAN Turkey) reviewed – and updated where needed – their materiality assessments, taking into consideration the outcomes of employee opinion surveys (completed in 2015) and stakeholder consultations (through sustainability initiatives like the Cement Sustainability Initiative, investor roadshows and meetings with local stakeholders).
The results will serve as a basis for the next review of the Group Materiality Assessment in 2017. For 2016, the Group material issues were determined to be the same as in 2015.
We have aligned the outcomes of Group and local materiality assessments with the SDGs and strengthened collaboration through initiatives promoting engagement to “make the global goals local business”, as stated by the UN Global Compact. A special focus has been put on the enhancement of the professional skills of young people through educational and internship programs in line with the commitment undertaken by TITAN as an initiator of the European Pact for Youth.
Stakeholder engagement
Stakeholder engagement is an important element of our corporate social responsibility policy; it builds trust, improves understanding of the impacts of our operations and addresses stakeholder concerns, while providing input to the materiality assessment process. The methods for stakeholder communication and interaction vary from operation to operation, depending on local practices. We seek out feedback to help us address and further improve on issues that are of increasing importance to our stakeholders, such as youth unemployment and sustainability of communities, human rights and supply chain.
We regard stakeholder engagement as a long-term, ongoing process, enabling mutual understanding, establishing and maintaining good relationships, building consensus on issues of common interest, and activating bilateral and multilateral partnerships to support sustainable solutions at both global and local levels.
The following diagram illustrates our ongoing five-step stakeholder engagement process and key stakeholders as defined for the Group.
An ongoing stakeholder engagement process

11TITAN Group Integrated Annual Report 2016 Summary
Financial liquidity and access to funding
Environmental management
Climate change
Circular economy
Governance, transparency and ethics
Health and safety
People management and development
Sustainability of communities
Social and political risks and instability
Our most material issues SDGs most relevant for the Group
Group material issues and the SDGs
The following table shows how the issues with the highest materiality align with the SDGs that were identified as most relevant for the Group in 2015. Throughout the Summary Report, we have included a selection of case studies and actions that support the implementation of the SDGs.
A similar approach is followed at a local level, encouraging the integration of the SDGs in the materiality process, to facilitate stakeholder dialogue and target setting.

2016 Internships by country (number of people)
Albania 5
Bulgaria 13
Egypt 342
F. Y. R. of Macedonia 166
Greece 110
Kosovo 40
Serbia 13
Turkey 19
USA 22
Total 730
730Internships
Busin
ess
ove
rvie
w
Gro
up p
erfo
rma
nce
R
eg
iona
l pe
rform
anc
e
Co
rpo
rate
go
vern
anc
e
12 TITAN Group Integrated Annual Report 2016 Summary
Engaging with youth
Creating long-term employment opportunities for young people is good for a world that needs to engage and empower youth, cover skills gaps and drive economic growth; good for the sustainability of the local communities where we operate; and good for the vitality and creativity of our business.
In 2016, we deepened our support for youth by launching new educational and internship programs aligned with our commitment to the European Pact for Youth. The European Pact for Youth is a mutual engagement of business and European Union leaders, aiming to develop and consolidate partnerships in support of quality internships and apprenticeships that safeguard youth employability and inclusion.
14%of internships directed to entry level jobs
402teachers reached
> 6.000 young people; learners; teachers and staff involved
Within this framework, our operating companies in Greece, Albania and Kosovo contributed to the launch of national initiatives, promoting the development of relevant action plans by the end of 2017. We also support RELOAD GREECE, a UK-based organization providing mentoring and training to students of top UK universities, aiming to create new ventures with a positive social or economic impact for Greece.
Our activities for youth expand well beyond Europe. Applying international standards, a systematic mapping throughout our Group operations recorded more than 400 partnership agreements, mostly with universities, aiming to provide opportunities for work-related experience, internships, apprenticeships and training to young people. In total, 730 young people benefitted from internship programs implemented in nine countries during 2016.
We will continue to work together with stakeholders to further improve the quality of the internships we provide and expand best practices across the Group through the introduction of a Quality Internships Guide that was created in 2016 and will be launched in 2017.
Highlights of our education partnerships in 2016

13TITAN Group Integrated Annual Report 2016 Summary
Part of a wider series of initiatives focused on education, training and the employability of young people, “Graduate Students’ Forum” has been running since 2002 and is hosted by two of our plants in Greece, close to Athens and Thessaloniki. The forum addresses the challenges young people face as they transition from education to employment. In 2016, a total of 380 students were involved, while to date, more than 3,200 students from six educational institutes and 13 graduate programs have
attended the events. We have collaborated with 71 company representatives and 19 academics who have all shared their personal and corporate know-how and insights to help better prepare tomorrow’s executives to start their professional career.
We consistently encourage integration of sustainability issues in the education of all grades and support eff orts to share our know-how and expertise in specifi c areas of interest. We also raise awareness among students and teachers regarding social responsibility and care for the environment. Inspired by the unique nature of Catawba Creek and the need to engage with future generations on responsible citizenship, we organize an annual study visit for around 400 young students who experience active learning in our Roanoke Cement
plant’s riparian buff er project.
While on site, the children are educated on the importance of water quality and sustainable manufacturing and farming through experiential and engaging activities. Subjects include aquatic macro invertebrate sampling, visual stream assessment andtesting, tree species inventory and soil survey. The project aims to educate young people on environmental and biodiversity issues that are increasingly important in the modern workplace.
Sustainability andenvironmental care,Catawba Creek, USA
Graduate Students’Forum, Greece
Helping young people to build valuable professional skills and get their careers off to a successful start, the Leadership Academy is a joint project with student organization Hobeliks. During 2016, 47 students took part in the academy, each attending training courses on key business topics. Working in teams, they were then tasked with defending a case study in front of the company experts during
a presentation session. TITAN Bulgaria participated in 2016 by organizing a training session on “Confl ict Management”, during which key TITAN people provided valuable feedback and guidance to the participants. At the end of the Leadership Academy, the best performing students have the opportunity to begin internships with the companies that are part of the project.
As of August 2016, our Alexandria Plant has worked with Alexandria Businessmen Association (ABA) in their Vocational Training Center (VTEC) and supported the Center’s welding workshop. VTEC’s mission is to provide vocational training programs meeting international standards to young people and technicians in the Alexandria Governorate, TCE will give a priority to the neighborhood in particular. During 2016, TITAN Cement Egypt equipped the
welding workshop with all the necessary machinery, while the training activities by TITAN will commence in 2017. Young students will be off ered a high standard technical education, covering both theoretical and practical skills taught by professional trainers.
LeadershipAcademy, Bulgaria
Vocational Training and Employability Center, Egypt

Busin
ess
ove
rvie
w
Gro
up p
erfo
rma
nce
R
eg
iona
l pe
rform
anc
e
Co
rpo
rate
go
vern
anc
e
14 TITAN Group Integrated Annual Report 2016 Summary
Group performance
Group key performance indicatorsOur Group Performance is measured and assessed against a set of key performance indicators (KPIs), supported by our financial and non-financial results.
Financial
Turnover: Revenue received from the sale of goods and services to customers
€1,509.2 m(2015: €1,397.8 m)
EBITDA: Earnings before interest, tax, depreciation and amortization
€278.6 m(2015: €216.4 m)
Earnings per share: Net earnings attributable to shareholders/weighted average number of common and preference shares
€1.56/share(2015: €0.41/share)
ROACE: Return on average capital employed
Earnings before interest and taxes (EBIT)/Average capital employed
6.9%(2015: 4.4%)
Non-financial
SOCIAL
Training man hours per employee
28(2015: 20)
Lost time injuries frequency rate (LTIFR) for employees
1.92(2015: 2.00)
Internships for young people
730ENVIRONMENTAL
Specific water consumption* (lt/tCement)
255.1(2015: 287.1)
Specific dust emissions* (g/tClinker)
23.9(2015: 35.7)
Gross direct specific CO2 emissions* (kg/tProduct)
718.0(2015: 706.1)
* Figures are calculated based on the equity of the specific year.

15TITAN Group Integrated Annual Report 2016 Summary
Financial performance
TITAN delivered strong results in 2016, posting significant growth in turnover, EBITDA and net profit, further enhancing our solid financial base.
The Group recorded a significant improvement in profitability, primarily thanks to the continuing growth of the US market and also the recovery of results in Egypt. Consolidated turnover increased by 8% to €1.5 billion, while EBITDA rose by 28.7% to €279 million. Net profit after tax also increased to €127 million. 2016 results include a gain from a deferred tax asset recognition of €90 million in the USA, associated with previously unrecognized carry-forward net operating losses generated in previous years. Earnings per share amounted to €1.56 compared to €0.41 cents per share in 2015.
In 2016, the US market was the main source of growth for the Group. Prospects for the USA economy and the country’s construction industry are strong, and industry trends in the east coast of the USA (where the TITAN Group operates) continue to be stronger than in other regions across the country.
In Greece, there are no real signs of recovery in the construction sector, with low levels of consumption and 75% of our output going to exports (mainly the USA). The Southeastern Europe region is profitable and stable, bringing consistent cash flow into the Group. In Egypt, having completed the fuel conversion investments and ensured energy sufficiency for operation at full capacity, TITAN restored high production volumes and significantly reduced production costs. The devaluation of the Egyptian pound, by more than 50% in 2016, had a negative impact on results and is generating volatility in the market.
Sales volume growth driven by the USA
Cement volume sales were up by 6%, an increase of 1 million metric tons, largely due to sales in the USA, Egypt and Southeastern Europe. Ready-mix volumes grew by 14%, reflecting the dynamic USA market and reaching 4.9 million cubic meters overall. In aggregates, volumes increased by 13% mainly due to stronger sales in the US and higher sales coming from a low base in Greece.
2015 2016 +/-
Cement (metric tons) 16.5 m 17.5 m +6%
Ready-mix concrete (m3) 4.3 m 4.9 m +14%
Aggregates (metric tons) 14.0 m 15.9 m +13%
Substantial two-year capital expenditure program and strong cash flow generation
Operating free cash flow nearly doubled, reaching €125 million, primarily due to TITAN’s higher profitability as EBITDA increased by €62.2 million. Strong cash flow enabled the Group to complete an ambitious two-year capital expenditure program of €325 million over the period 2015-2016 aimed at capturing growth opportunities mainly in the US, attaining energy sufficiency in Egypt and improving cost-competitiveness. Furthermore, operating free cash flow was used to fund acquisitions, mainly the Group’s expansion in South America, with the investment of €99 million in Cimento Apodi in Brazil.
In 2017, we anticipate a further improvement in operating free cash flow generation over 2016, helped by higher profitability and lower capital expenditure.
2015 2016
Pre-CAPEX operating cash flow €237 m €275 m
CAPEX €173 m €151 m
Payments for acquisitions €11 m €97 m
Net debt at the year end €621 m €661 m
Strong financials to fund growth - Group net debt
Group net debt stood at €661 million at the end of December 2016, up by €39 million compared to the end of 2015. Meanwhile, the devaluation of the Egyptian pound reduced the euro value of loans taken in local currency in Egypt by €59 million.
Thanks to higher profitability and contained debt levels, the net debt/EBITDA ratio improved further in 2016 and stood at 2.37 times, down from 2.87 times in 2015. The Group has comfortable leverage levels, which offer more financial flexibility to support future business development and investments.
Total shareholders’ equity was €1,553 million, equal to 55.6% of total assets at the end of 2016. Furthermore, the continuing growth of profitability over the last year is leading to higher rates of return on capital employed for TITAN Group. ROACE in 2016 stood at 6.9% compared to 4.4% in 2015.
NPAT Net profit after minority interests and taxes
€127.4 m(2015: €33.8 m)
CAPEX Expenditure on capital investment projects across the Group
€150.6 m(2015: €173 m)
Net debt/EBITDA ratio
2.37(2015: 2.87)
Credit rating by Standard & Poor’s
BB positive outlook(2015: BB positive outlook)

Busin
ess
ove
rvie
w
Gro
up p
erfo
rma
nce
R
eg
iona
l pe
rform
anc
e
Co
rpo
rate
go
vern
anc
e
16 TITAN Group Integrated Annual Report 2016 Summary
Debt issuance
In June 2016, Titan Global Finance Plc. (TGF) issued a 5-year bond of a total nominal amount of €300 million with a coupon of 3.5% per annum, effectively lowering the Group’s cost of debt going forward. The proceeds of the notes were used to repay the €197 million notes due in January 2017 and to fund the investment expenditures of the Group.
Shareholder equity ratio: Total shareholder equity over total assets
55.6%(2015: 57.8%)
Credit facilities provide strong liquidity for the Group
The Group has a strong liquidity profile with diversified sources of committed funding, including short-term and long-term credit facilities.
Total credit facilities, including funding from bonds and capital markets, were €1.35 billion at the end of 2016, while total outstanding gross debt was €840 million. The Group had a cash balance of €180 million at the end of the year, the bulk of which was held with European banks. About half of these funds were used early in 2017 to repay the €88 million outstanding bond which expired in January 2017. The Group’s next important maturity is in July 2019 for the €300 million notes issued in 2014.
Overall, the Group’s cash and available credit facilities provide ample liquidity to meet its obligations and fund future growth.
Credit rating maintained with positive outlook
In June 2016, S&P Global Ratings affirmed TITAN’s long-term credit rating as “BB” with a positive outlook.
Increasing returns to shareholders
Based on the strong improvement of Group profitability, at the Annual General Assembly of Shareholders, the Board of Directors will propose the payment of a dividend of €0.10 per share and, in addition, a return of capital of €1.00 per share, a total payout to shareholders of €93,095,781.
Parent company financial results
In 2016, turnover at TITAN Cement S.A. declined by 3.9% to €262 million, while EBITDA was reduced to €30 million versus €44 million in 2015. Net Profit after Tax (NPAT) for 2016 reached €17 million, which included €29 million (2015: €55 million) of dividends received from international subsidiaries.
2015 2016
TITAN Cement S.A. turnover €273 m €262 m
EBITDA €44 m €30 m
NPAT €60 m €17 m
Post balance sheet event: refinancing activity
On 19 January 2017, Group subsidiary Titan Global Finance PLC repaid at maturity €88 million of the outstanding 8.75% guaranteed notes.
Facilities/Utilization by lender
Total facilities €1,353 m as at 31 December 2016 Maturity profile as at December 2016 (€m)
Bonds Bank debt
350
300
250
200
150
100
50
0 <Dec’17 >Dec’22<Dec’18 <Dec’19 <Dec’20 <Dec’21 <Dec’22
38 26
126
323
88
297
4318
7 415 21
300
285
25
400
500
600
700
800
900
1,000
1,100
1,200
20102009Q1 Q2 Q3 Q4 Q1 Q2 Q3 Q4 Q1 Q2 Q3 Q4 Q1 Q2 Q3 Q4 Q1 Q2 Q3 Q4 Q1 Q2 Q3 Q4 Q1 Q2 Q3 Q4 Q1 Q2 Q3 Q4
2011 2012 2013 2014 20162015
1,112
947988
874930
986831
739
739
707
732
674
754
602
632
562
596
552
563
509
541
490
529
660
630
650
541
621605
578
713
661
Group net debt evolution (€m)
Net debt
International banks 21%
Bonds 51%
Greek banks 28%
17TITAN Group Integrated Annual Report 2016 Summary
Equity market information
TITAN builds trust within the financial markets and the investor community by demonstrating the strength of its financial profile and delivering shareholder value.
Share price performance
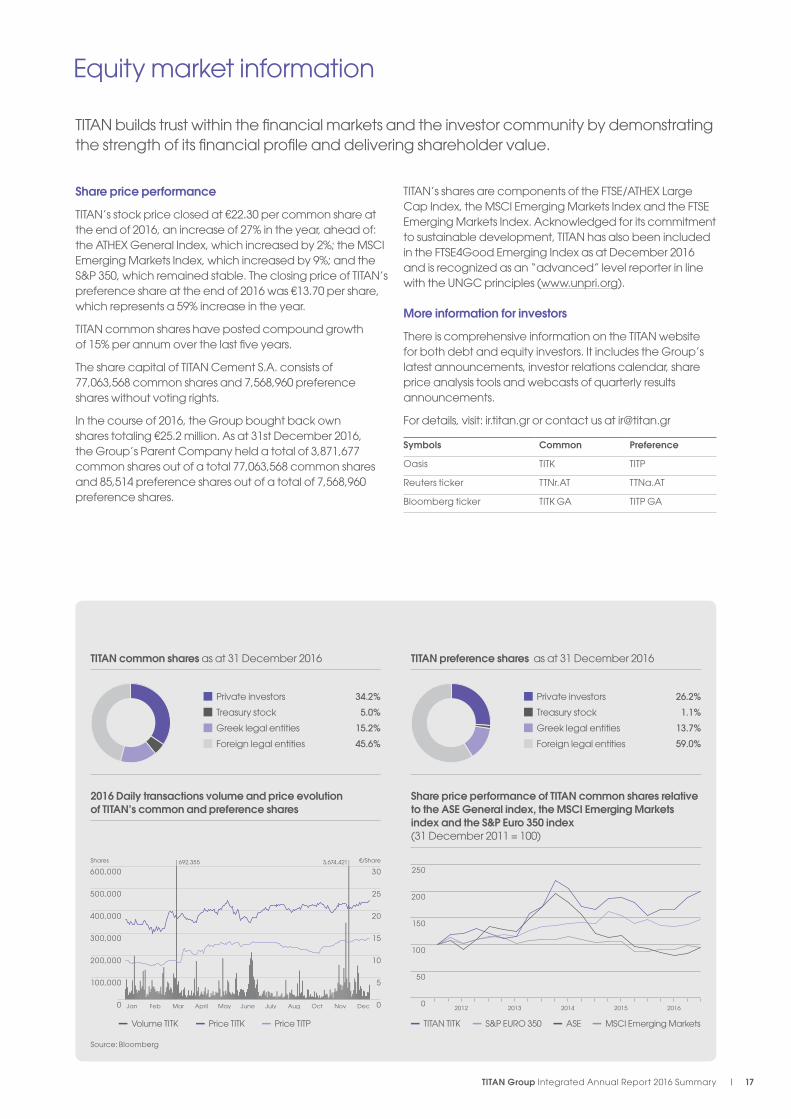
TITAN’s stock price closed at €22.30 per common share at the end of 2016, an increase of 27% in the year, ahead of: the ATHEX General Index, which increased by 2%; the MSCI Emerging Markets Index, which increased by 9%; and the S&P 350, which remained stable. The closing price of TITAN’s preference share at the end of 2016 was €13.70 per share, which represents a 59% increase in the year.
TITAN common shares have posted compound growthof 15% per annum over the last five years.
The share capital of TITAN Cement S.A. consists of 77,063,568 common shares and 7,568,960 preference shares without voting rights.
In the course of 2016, the Group bought back own shares totaling €25.2 million. As at 31st December 2016, the Group’s Parent Company held a total of 3,871,677 common shares out of a total 77,063,568 common shares and 85,514 preference shares out of a total of 7,568,960 preference shares.
TITAN’s shares are components of the FTSE/ATHEX Large Cap Index, the MSCI Emerging Markets Index and the FTSE Emerging Markets Index. Acknowledged for its commitment to sustainable development, TITAN has also been included in the FTSE4Good Emerging Index as at December 2016 and is recognized as an “advanced” level reporter in line with the UNGC principles (www.unpri.org).
More information for investors
There is comprehensive information on the TITAN website for both debt and equity investors. It includes the Group’s latest announcements, investor relations calendar, share price analysis tools and webcasts of quarterly results announcements.
For details, visit: ir.titan.gr or contact us at [email protected]
Symbols Common Preference
Oasis TITK TITP
Reuters ticker TTNr.AT TTNa.AT
Bloomberg ticker TITK GA TITP GA
TITAN common shares as at 31 December 2016
Private investors 34.2%
Treasury stock 5.0%
Greek legal entities 15.2%
Foreign legal entities 45.6%
2016 Daily transactions volume and price evolution of TITAN’s common and preference shares
TITAN preference shares as at 31 December 2016
Private investors 26.2%
Treasury stock 1.1%
Greek legal entities 13.7%
Foreign legal entities 59.0%
Volume TITK Price TITK Price TITP
0
100,000
200,000
300,000
400,000
500,000
600,000
0
5
10
15
20
25
30
Jan Feb Mar April May June July Aug Oct Nov
692,355Shares €/Share3,674,421
Dec
Share price performance of TITAN common shares relative to the ASE General index, the MSCI Emerging Markets index and the S&P Euro 350 index (31 December 2011 = 100)
TITAN TITK S&P EURO 350 ASE MSCI Emerging Markets
0
50
100
150
250
200
2012 2013 2014 2015 2016
Source: Bloomberg

Busin
ess
ove
rvie
w
Gro
up p
erfo
rma
nce
R
eg
iona
l pe
rform
anc
e
Co
rpo
rate
go
vern
anc
e
18 TITAN Group Integrated Annual Report 2016 Summary
Social performance
Through a combination of Group and local initiatives, we are pursuing a consistent company-wide approach to health and safety, people development, community sustainability, transparency and business ethics, including the way we manage our supply chain.
Health and safety
TITAN constantly strives to improve the health and safety performance of direct employees and contractors, and to urge suppliers and third parties to adopt similar views and practices.
In 2016, there were a total of 29 Lost Time Injuries (LTIs), a 14.7% decrease on the previous year. The Lost Time Injuries Frequency Rate (LTIFR) for own employees decreased to 1.92 LTIs per million hours, a 4% improvement. LTIFR for contractors also improved to 0.73 LTIs per million hours, a 33.6% decrease.
The Group deeply regrets that, despite its focus on safety, there was one third-party fatality in 2016, resulting from a road accident involving a mixer-truck driven by a contractor. We seek to strengthen and further improve our efforts to embed a culture of safe driving among our employees and contractors.
We are committed to the continuous improvement of the health and safety performance in all our activities and pursued a variety of Group-wide initiatives in 2016:
– New health surveillance system installed for dust, respirable crystalline silica and noise at all business units; this will streamline efforts, so far made independently by our business units;
– Lock-out Tag-out (LOTO) campaign launched, aimed at producing practical site and equipment-specific work instructions – LOTO–related LTIs reduced from nine in 2015 to two in 2016;
– Training for the prevention of serious accidents, looking at what has contributed to serious incidents or serious near misses at TITAN plants in the past, commenced in 2016 and will extend into 2018;
– Compendium of safety equipment covering plant operation in depth, produced and distributed to all business units;
– New guideline on Safe Work Plans published, for jobs not fully covered by existing procedures;
– Step-by-step guide to the root cause analysis of health and safety incidents produced and distributed, with training to follow in 2017.
Lost time injuries frequency rate (LTIFR) Employees and contractors (all activities)
0.0
0.5
1.0
1.5
2.5
2.0
2012 2013 2014 2015 2016
Employees Contractors
Number of lost time injuries (LTIs) Employees and contractors (all activities)
0
5
10
15
25
20
2012 2013 2014 2015 2016
Employees Contractors

19TITAN Group Integrated Annual Report 2016 Summary
Sustainability of communities
TITAN Group has operations in 14 countries and many different locations, so understanding global issues but taking action at a local level is important to implement its strategy effectively and create value for its key stakeholders. Following our business model, we strive to create value where we operate, both by providing opportunities for long-term and stable employment and by enabling economic development through our value chain. We also share know-how, experience and other available resources with local stakeholders, in an attempt to contribute to the long-term sustainability and wellbeing of our neighboring communities.
In 2016, we placed particular emphasis on improving partnerships with local stakeholders, addressing skills gaps and tackling the issues of quality education and employment.
Apart from Group-wide efforts to develop new skills for jobs and build capacity for future growth, we also continued supporting a number of local community engagement programs addressing material issues, such as the LAB program in Kosovo. A new initiative in 2016 was our participation in the successful effort to nominate Elefsis, the town where the Group’s first plant was built, as the European Capital of Culture 2021.
In 2016, the total amount of Group donations for community development programs was €2,643,704 in kind and in cash. These donations mostly cover the areas of education, health and safety, care for the environment, poverty and unemployment.
Supply chain management
As part of our continuing effort to enhance the competitive position of each of our businesses, we have embarked on a Group Procurement Transformation program. The objective is to address procurement spend and overall business effectiveness through improved processes, specifications and quality and risk management. We aim to optimize the number of suppliers we have and establish and maintain long-term value-adding supplier relationships with an emphasis on “total cost” reduction, transparency and the enhancement of sustainability in the supply chain.
Paid to local and international suppliers
€938.7 m(2015: €901.1 m)
People management and development
TITAN has always been a people-driven organization. We recognize the importance of being a responsible employer and build long-term relationships with employees founded on mutual trust, reliability and shared values.
The rollout of our leadership platform, “Leading the TITAN Way”, was a major initiative throughout 2016. With TITAN’s ethos at the core, the platform describes the fundamental behaviors that define good leadership and helps our people develop their skills accordingly. A new Performance Development Process was implemented incorporating the principles of “Leading the TITAN Way”, with relevant training provided in all our operations.
TITAN Group, as an employer, aims to promote lifelong learning among its people and enhance the professional skills and competencies they need to meet local and global challenges. In this context, training hours have increased across the Group by 43%. Beyond a strong emphasis on health and safety and technical skills, focus has also been placed on improving management capabilities, with 15% of training hours related to building management skills.
Training man-hours
158,210 (2015: 110,776)
Women in management
16%(2015: 15%)
Following a review of all Group policies in 2015, a more comprehensive Human Rights Policy was issued in 2016, complementing the Employee Management Framework and focusing on labor rights and working conditions, fair treatment and equal opportunities for all in recruitment and personal development. The number of women managers increased by 8% compared to 2015, resulting in a total of 16% overall throughout the Group, with the highest rates recorded in Serbia (37%), Bulgaria (35%) and F.Y.R. of Macedonia (30%). Additional Group policies updated in 2016 were the Anti-bribery and Corruption Policy, the Competition Law Compliance Policy and Guidelines and the Sanctions Policy.
Integration of international standards and best practices is an ongoing effort for TITAN and, in 2016, Sharr cement plant in Kosovo became the second TITAN subsidiary after Antea cement plant in Albania to be certified according to the Social Accountability Standard SA 8000.

Busin
ess
ove
rvie
w
Gro
up p
erfo
rma
nce
R
eg
iona
l pe
rform
anc
e
Co
rpo
rate
go
vern
anc
e
20 TITAN Group Integrated Annual Report 2016 Summary
Environmental performance
Addressing our environmental responsibilities creates value for our business,our customers and the communities in which we operate.
Environmental management
Environmental Management Systems (EMS) have been developed and implemented at most of the Group installations to improve monitoring and reporting of environmental impact. All Group cement plants have an EMS, ISO14001 or similar. In 2016, a revision to the EMS was launched to meet the new certification standards defined by ISO14001/2015. All three TITAN cement plants in Greece and one cement plant in Bulgaria have already integrated those requirements and have been certified accordingly.
Our environmental monitoring, reporting and management practices follow the WBCSD/CSI guidelines where applicable.
Specific dust emissions
23.9g/tClinker(2015: 35.7g/tClinker)
Specific NOx emissions
1,702.9g/tClinker(2015: 1,705.8g/tClinker)
Specific SOx emissions
205.6g/tClinker(2015: 206.0g/tClinker)
Quarry rehabilitation and biodiversityRehabilitation activities and biodiversity management are a key focus area for TITAN, mitigating the adverse impacts of the extraction process with the aim of creating a net positive effect where possible.
In 2016, new rehabilitation plans were developed for the quarries of the Beni Suef cement plant in Egypt, increasing the percentage of the Group’s quarry sites where Quarry Rehabilitation Plans are in place and implemented to 87%.
Water managementEfficient water use and management at TITAN’s production sites is an important sustainability goal. TITAN implements water management systems on its sites to monitor and optimize water use and report water data in a consistent way, according to the WBCSD/CSI. In 2016, specific water consumption at the Group’s cement and grinding plants and their attached quarries decreased a further 11% compared to 2015, reaching 255.1lt/tCement.
Water recycling facilities are operating in 92% of the Group’s cement plants. 25.0 million m3 of water was recycled at Group level in 2016, which is equivalent to 82% of the total water withdrawn.
Environmental expenditure (million euros)
0
25
50
75
100
2012 2013 2014 2015 2016
Specific dust emissions (g/tClinker)
0
25
50
75
100
2012 2013 2014 2015 2016
Specific water consumption (lt/tCement)
0
100
200
300
400
2012 2013 2014 2015 2016
Air emissionsTITAN Group has invested heavily in new technologies to reduce its air emissions. In 2016, Group specific dust emissions decreased by about 33% compared to previous year to 23.9g/tClinker.
Both NOx and SOx specific emissions remained broadly at the same level as 2015 at 1,702.9g/tClinker and 205.6g/tClinker respectively.

21TITAN Group Integrated Annual Report 2016 Summary
Note: Environmental performance figures are calculated based on the equity of the specific year.
Climate change
Climate change is among the most significant global challenges today. TITAN is implementing a climate change mitigation strategy, which includes the increased use of alternative fuels, ideally biomass and the reduction of thermal energy consumption at its facilities. The use of alternative fuels increased in 2016 to 8.6% Thermal basis. Our subsidiary companies GAEA Bulgaria and GAEA Egypt have the objective of sourcing and producing suitable alternative fuels for our plants.
We address our carbon emissions in line with the Kyoto Protocol (using 1990 as the base year for CO2 emissions) and report the CO2 emissions from our cement plants. In 2016, specific CO2 emissions increased marginally by 1.7% to 718.0kgCO2/tProduct, mainly due to the forced change of fuel mix in Egypt, as well as the reduction in the sales of processed fly ash, a cement substitute material produced by our US-based ST Equipment and Technology (STET) subsidiary.
Gross direct specific CO2 emissions
718.0kgCO2/tProduct (2015: 706.1kgCO2/tProduct)
Thermal energy consumption
46,855 TJ(2015: 43,965TJ)
Specific CO2 emissions (kg/tClinker)
0
200
400
600
800
2012 2013 2014 2015 2016
Circular economy
The reduction, reuse and recycling of raw materials, energy and waste are key elements of the Group’s environmental policy. In 2016, 5.1% of the total raw materials for the production of clinker and cement were alternative raw materials sourced from such activities, reducing the consumption of extracted (natural) raw materials as well as the by-products that go to landfill. Furthermore, in Greece and the USA, TITAN has implemented programs to collect concrete returns and use them as alternative raw materials for clinker production and block production or aggregates for pavements and other uses.
Similarly, using alternative fuels (163,357 metric tons in 2016) helps to conserve non-renewable fossil fuels, allows for energy recovery and minimizes waste to landfill, while reducing the net amount of CO2 emissions. Dried sewage sludge, refinery sludge, tires, RDF and agricultural waste are the alternative fuels used at different Group cement plants.
Our US-based subsidiary STET provides solutions for the management of fly ash, minimizing the need, cost and risk associated with landfilling. Its products can be used either as alternative raw materials or for energy recovery.
In 2016, 80.8% of the waste produced by the Group as part of its everyday activities was collected, stored and disposed of through authorized contractors for reuse, recycling or recovery.
Externally recycled waste material
413,553 metric tons(2015: 294,000 metric tons)
Percentage of alternative fuels in the total fuel mix
8.58%Thermal basis(2015: 6.75%Thermal basis)
Electrical energy consumption
1,751GWh(2015: 1,600GWh)

Busin
ess
ove
rvie
w
Gro
up p
erfo
rma
nce
R
eg
iona
l pe
rform
anc
e
Co
rpo
rate
go
vern
anc
e
22 TITAN Group Integrated Annual Report 2016 Summary
Regional performance
FinancialTurnover53% of Group
€794 m (2015: €680 m)
EBITDA52% of Group
€145 m (2015: €101 m)
Total assets 42% of Group
€1,159 m (2015: €1,006 m)
Non-Financial SOCIALLost time injuries frequency rate (LTIFR) for employees in 2016 (per 1,000,000 man hours)
1.73 (2015: 2.05)
Our operations meet country-specifi c regulations for health and safety*.
Total training hours
16,647 (2015: 14,659)
ENVIRONMENTALWe use relevant voluntary management systems such as LEED (Leadership in Energy and Environmental Design), Green Star NRMCA and Energy Star which are “unit-focused”.
USA2016 Performance highlights
With growing markets, robust performance and a favorable outlook, we are well positioned to maximize the benefi ts of our investments.
Principal products/activities
Key facts
2 Cement plants
84 Ready-mix plants
9 Concrete block plants
6 Quarries
15 Distribution terminals
8 Fly ash processing plants
CementReady-mix concrete Aggregates
Building blocks
Fly ash
* In particular, we meet MSHA standards (Mine Safety & Health Administration) and OHSA standards (Occupation Health and Safety Administration). There are internal management monitoring systems, but not certifi ed systems.

23TITAN Group Integrated Annual Report 2016 Summary
Management review
Market overview
During 2016, the US cement market continued to demonstrate solid fundamentals, supported by favorable conditions in the economy. Labor markets remained strong, while income growth, consumer confi dence and business sentiment improved.
Demand for building materials in the USA continued to expand in 2016, with overall construction spending increasing by 4.5% to $1.16 trillion – led by the private sector, including the residential construction segment. Cement consumption in the US grew by 2.4% to 94.4 million metric tons. However, consumption in TITAN America’s markets grew at a much stronger rate – improving 10.9% year on year in the South Atlantic States (including Virginia, North and South Carolina and Florida), where TITAN’s US plants are located.
Regional performance
In 2016, demand improved in each of our regional markets in the USA, with a notable acceleration evident in Virginia and the Carolinas, where performance had previously lagged behind earlier improvements in the Metro New York and Florida markets. Combined with better pricing and improvements in manufacturing and distribution costs, the USA delivered a signifi cant improvement in fi nancial performance in 2016. EBITDA grew to €145.2 million – a 44% improvement compared to 2015 and the highest level recorded since 2006. Our capital expenditure program – $200 million over the last two years – has contributed to a signifi cant improvement in operating results.
Key areas of operation
FloridaAccording to the US Geological Survey, cement consumption in Florida increased by 9.9% to 7.0 million metric tons in 2016. At the same time, the Florida cement sector benefi ted from increased market prices. Demand and sales prices for construction aggregates and fl y ash were also higher, contributing to the overall improvement in profi tability. In the concrete products segment (ready-mix and concrete block), strong trends in residential and commercial construction delivered improvements in volumes and profi tability.
Virginia, North and South CarolinaGrowth in cement consumption accelerated in the Mid-Atlantic region in 2016. In Virginia, cement consumption increased 9.7% to 1.9 million metric tons, according to the US Geological Survey, while consumption in North Carolina improved year on year by 21.9% (the highest growth rate in the US), reaching 2.7 million metric tons. Ready-mix demand in the areas served by TITAN’s Mid-Atlantic business grew at a robust rate, however, fl y ash contributions were constrained by available supply.
Looking ahead
We expect continued growth in the USA’s construction markets, driven mainly by the residential and commercial segments. Much anticipated gains from public works are also expected to materialize beyond 2017, as per the announced increase of spending in infrastructure.
Consistent with this positive outlook, the Portland Cement Association forecasts average growth in USA cement consumption of approximately 3.7% per year between 2017 and 2021. Even higher combined growth rates are expected in Florida, Virginia and the Carolinas, where our investments have positioned us to capture growth opportunities and deliver higher levels of profi tability and free cash fl ow.
TITAN America’s Pennsuco Complex became the fi rst facility of its kind in the USA to be offi cially certifi ed as a Gold Level Zero Waste Facility. To qualify for this Certifi cation, we were required to demonstrate greater than 90% diversion from landfi ll use for a minimum of 12 consecutive months. This included reducing, reusing, recycling or composting discarded materials or recovering
materials for productive use.Alongside this eff ort, waste costs for materials to landfi ll and other non-recycling initiatives for 2016 were around 17% below budget. Employee participation and education was crucial to this success, as were new policies and procedures, which will now be embedded across all locations in the Florida business unit.
Pennsuco awarded Zero Waste Certifi cation
New York/Metro
According to the US Geological Survey, cement consumption in the New York Metropolitan area was 1.8 million metric tons in 2016, increasing 4.1% over 2015. A strong market performance by the regional import terminal at Port Newark resulted in another year of strong performance in sales volumes, turnover, and profi tability.

Busin
ess
ove
rvie
w
Gro
up p
erfo
rma
nce
R
eg
iona
l pe
rform
anc
e
Co
rpo
rate
go
vern
anc
e
24 TITAN Group Integrated Annual Report 2016 Summary
GREECE AND WESTERN EUROPE
Strong export activity partly compensated for the continuing recession in the domestic market.
Market overview
Demand for building materials in 2016 was very low, coming mostly from public works, while private construction remained in recession. Cement consumption was roughly on par with 2015, a year when the introduction of capital controls brought building activity essentially to a halt; such low levels were last recorded in the early 1960s. The main contributors to demand were the ongoing public works, under a tight time frame for completion within 2016, as well as some renovation and tourism-related projects.
Domestic cement sales represented little more than 6% of the total volumes sold by the Group in 2016 and exports continued to absorb more than two-thirds of the production of our Greek plants.
Exports benefi ted from historically low sea freights and a strengthening dollar, but prices faced downward pressure because of intensifying international competition.
FinancialTurnover17% of Group
€261 m (2015: €269 m)
EBITDA13% of Group
€36 m (2015: €45 m)
Total assets 23% of Group
€667 m (2015: €559 m)
Non-Financial SOCIALLost time injuries frequency rate (LTIFR) for employees in 2016 (per 1,000,000 man hours)
3.27 (2015: 1.87)
All plants and installations are certifi ed against OHSAS 18001.
Total training hours
43,867 (2015: 34,267)
ENVIRONMENTALAll cement plants and most of the installations related to our other activities are certifi ed against ISO 14001.
2016 Performance highlights
Patras cement plant, Greece
Dry mortars
3 Cement plants
26 Quarries
1 Dry mortar plant
CementReady-mix concrete Aggregates
Principal products/activities
Key facts
1 Grinding plant
7Distribution terminals
27 Ready-mix plants

25TITAN Group Integrated Annual Report 2016 Summary
Management review
Regional performance
Total turnover for the region was 2.8% lower than in 2015 and stood at €261 million. EBITDA dropped 19% to €36.4 million.
In 2016, we undertook a series of measures that enabled us to address our key export markets more efficiently, boosting in particular the export performance of our Patras plant. We also invested in improving the efficiency of our distribution terminals, with multiple benefits for our customers, the local economy and the community.
Our ready-mix network in Greece maintained a leading position in 2016 and through it we continued to participate in all major domestic infrastructure projects.
Investments in our Greek plants were aimed at improving health and safety conditions, reducing costs, enhancing quality and environmental stewardship, and increasing the use of alternative fuels.
In terms of health and safety, 2016 was characterized by a marked increase in the number of incidents; however, 80% of those incidents were due to slips or trips on same-level surfaces. An awareness campaign was launched in the last quarter.
Our environmental efforts were focused on emissions reduction and preparation of our plants for compliance with the new air emission limits going into effect in 2017. We also continued promoting circular economy practices, using 373,440 metric tons of alternative raw materials and more than 90,000 metric tons of alternative fuels.
Looking ahead
Demand for building materials in Greece is likely to remain subdued in 2017. New infrastructure projects will not be sufficient to sustain demand following the completion of the major highway projects. Expectations for residential construction, traditionally the main demand driver, are low. As a result, cement production in Greece is expected to continue to be channeled mainly to export destinations, albeit in a deteriorating supply/demand environment.
Collaborating with specialist non-profit agencies, such as the Hellenic Ornithological Society (HOS) and the University of Patras, Department of Biology, we have been working to update our restoration plans at three quarries and to carry out a new biodiversity study at our aggregates quarry in the island of Leros.
We have restoration plans for all our quarries, not just those in protected areas,
and our aim is to improve rehabilitation and protect biodiversity at a local and global level. Among other activities, this involves: monitoring all our active quarries to identify areas of high biodiversity value; using the techniques of tree planting and “hydro seeding” to rehabilitate quarries; and drawing up biodiversity assessment studies to record local flora and safeguard the process of natural succession.
Collaborations for theprotection of biodiversity

Busin
ess
ove
rvie
w
Gro
up p
erfo
rma
nce
R
eg
iona
l pe
rform
anc
e
Co
rpo
rate
go
vern
anc
e
26 TITAN Group Integrated Annual Report 2016 Summary
FinancialTurnover14% of Group
€204 m (2015: €209 m)
EBITDA20% of Group
€56 m (2015: €56 m)
Total assets 18% of Group
€489 m (2015: €496 m)
Non-Financial SOCIALLost time injuries frequency rate (LTIFR) for employees in 2016 (per 1,000,000 man hours)
1.98 (2015: 3.42)
All plants and installations are certifi ed against OHSAS 18001.
Total training hours
63,536 (2015: 40,034)
ENVIRONMENTALAll cement plants and some of the installations related to our other activities are certifi ed against ISO 14001.
2016 Performance highlights
€204 m €204 m
€489 m €489 m
Stable fi nancial and social performancewith good prospects.
Market overview
In the countries of Southeastern Europe, construction activity exhibited regional variations, with demand growing in the central Balkan countries but declining in the east and west. Building activity is broadly stable in the region, well below the total cement production capacity. Many local economies saw increases in GDP of around 3-4% in the region during 2016. However, low foreign investments, economic uncertainties and political volatility are slowing construction recovery across the region.
SOUTHEASTERN EUROPE
Principal products/activities
Key facts
5 Cement plants
17 Quarries
1Distribution terminals
8 Ready-mix plants
1 Processed engineered fuel facility
CementReady-mix concrete Aggregates
Waste management and alternative fuels
Kosjeric cement plant, Serbia

27TITAN Group Integrated Annual Report 2016 Summary
Management review
Regional performance
There was an increase in total sales volumes in our markets of Southeastern Europe, but at lower average prices. Turnover in 2016 declined 2% at €204.3 million, while EBITDA increased slightly by 0.8% to €56.2 million, leading to an improvement in EBITDA margin from 26.8% in 2015 to 27.5% in 2016.
In 2016, cement consumption in Albania declined by about 7%, reaching the lowest level of cement consumption for 15 years. This reflects lower liquidity in the private sector, low public works spending and the difficulties in obtaining new construction permits. Our company and people have been involved in many community projects during the year, including: the reconstruction of deteriorating local roads; improving the school at Thumana: and the donation of cement for the construction of local houses. In December, our business also celebrated 1,778 days, without any loss time incidents.
In Bulgaria, cement demand declined by over 10% in 2016, mainly due to a decrease in EU-financed public infrastructure projects. The market is expected in the near future to remain dependent on EU financing and the volatile political situation in the country. During the year, we continued our efforts to increase the use of alternative fuels, with the total usage of RDF and used tires reaching 26%, compared to 20% alternative fuel usage in 2015.
Despite the political crisis in F.Y.R. of Macedonia, the construction sector remained a strong driver of the country’s GDP in 2016 and cement consumption increased significantly. During the year, Usje cement plant launched a program to boost youth employment, supporting the aims of the European Pact for Youth, and continued to demonstrate its strong commitment for people development with a total of 15,000 training hours provided to 100% of our employees (an average of 50 training hours per employee).
The construction sector in Kosovo continued to grow in 2016, with an increase in cement demand of around 15% compared to 2015. This was driven by residential and infrastructure construction and Sharrcem cement plant achieved record volume sales, with a more competitive cost base. Strong competition from imports resulted in lower selling prices overall compared to 2015.
The Serbian cement market continued to grow in 2016, for the third consecutive year, recording growth of about 7%. The market of Montenegro – an important market for Kosjeric cement plant – saw an increase of over 10%, supported by the start of works on the Podgorica-Kolasin highway project and developments in projects related to tourism.
Looking ahead
In Southeastern Europe, economic recovery is still being affected by the economic weakness of nearby Eurozone countries – the region’s main trading and investment partners. Although signs of recovery are evident in certain countries, construction in the region lacks momentum. Overall, the region remains stable with significant potential for improvement as conditions change in Europe.
In 2015, Antea cement plant, in cooperation with SOS Village, launched a project to assist children and families who live in deprived conditions in the commune of Thumana.
The project was extended in 2016 and now benefits 19 families and 47 children, under 18 years of age,
helping to ensure the children’s rights to a decent life and development. The basic goal of this project is to create the optimal conditions for a family to thrive, as well as to ensure the protection of human rights, including the rights to education, health, sanitation and food.
Strengthening families in Thumana, Albania

Busin
ess
ove
rvie
w
Gro
up p
erfo
rma
nce
R
eg
iona
l pe
rform
anc
e
Co
rpo
rate
go
vern
anc
e
28 TITAN Group Integrated Annual Report 2016 Summary
Financial1
Turnover16% of Group
€249 m(2015: €241 m)
EBITDA15% of Group
€41 m(2015: €15 m)
Total assets 17% of Group
€475 m(2015: €888 m)
Non-Financial SOCIALLost time injuries frequency rate (LTIFR) for employees in 2016 (per 1,000,000 man hours)
0.91(2015: 0.43)
All plants and some installations are certifi ed against OHSAS 18001.
Total training hours
34,160(2015: 21,816)
ENVIRONMENTALAll cement plants and some of the installations related to our other activities are certifi ed against ISO 14001.
2016 Performance highlights
Signifi cant cement consumption over two countries with production levels increasing to meet growing demand.
Market overview
Cement consumption in Egypt reached 56.5 million metric tons in 2016, up by 4.7% from the previous year. Demand was again mainly driven by national projects, including new cities, roads, infrastructure and housing projects.
The economic situation in Egypt remains very challenging, with devaluations of the Egyptian pound of 17% in March and over 40% in November. The economy is fragile, with tourism suff ering, high infl ation (currently at around 30%) and increasing costs of imported basic food supplies. However, Egypt’s demand for housing remains high, mainly driven by the country’s fast-growing population. Large budgeted investments by the government in the real estate and construction sectors also provide a signifi cant upside for the market.
Turkey’s GDP grew by an estimated 2.5% in 2016. Fueled by the growing economy, domestic cement consumption increased by 3% year on year, reaching 66 million metric tons. Cement exporters managed to increase volumes by around 3% during 2016, but with additional capacity in the market, the gap between excess supply and domestic demand is widening.
EASTERN MEDITERRANEAN
Alexandria cement plant, EgyptPrincipal products/activities
Key facts
3 Cement plants
16 Quarries
2Distribution terminals
6 Ready-mix plants
1 Processed engineered fuel facility
CementReady-mix concrete Aggregates
Waste management and alternative fuels
1 Turkey is not consolidated (50/50 JV)
2Grinding plants

29TITAN Group Integrated Annual Report 2016 Summary
Management review
Regional performance
We have operations in two countries in the region with diverse social and economic needs. In recent years, we have focused on supporting employees and their families during political and social unrest, addressed health issues and engaged in community outreach activities.
Operating results in Egypt showed a significant improvement for four consecutive quarters in 2016. TITAN Cement Egypt’s cement sales in 2016 increased nearly 14% year on year. Despite the devaluation of the Egyptian pound by more than 50% in 2016 and the volatility of market prices, turnover increased by 28.3% in local currency terms, and by 3.5% when converted to euros, reaching €249.2 million. EBITDA more than doubled, reaching €40.8 million in 2016 compared to €15 million the previous year.
The major devaluation of the currency resulted in FX losses and the Balance Sheet of our Egyptian operations shrunk by about 50% in euro terms due to the devaluation, while fixed assets’ value in real terms remains virtually unchanged.
In 2016 we achieved fuel sufficiency as, subsequent to the investments of the last two years in coal mills, both Beni Suef and Alexandria can now grind locally and use solid fuels.
In Turkey, Adocim benefited from strong demand in 2016, due to private housing construction and public works in infrastructure projects. Cement production remained close to record levels, while financial performance was in line with the previous year. Net profit attributable to the Group stood at €3.6 million in 2016, versus €4 million in 2015, negatively impacted by a 14% decline in the value of the Turkish pound.
Looking ahead
In Egypt, by completing our investments for the use of solid fuels at our plants, the Group has ensured fuel sufficiency and improved its cost structure. Egypt’s recent adjustment and reforms program, accompanying a €12 billion loan agreement with the IMF, lays the foundation for sustainable longer term growth. With the country in such a transition and coupled with the massive devaluation of the currency, however, these reforms create short-term pressures and volatility.
In Turkey, following several years of continued economic growth and increase in construction activity, it is expected that the macro-economic challenges of the country, in combination with the increasing surplus of installed capacity, will negatively impact the cement sector.
The Wadi El Kamar Elementary Public School was built more than 30 years ago, and no major restorations have taken place since then, with some limited maintenance organized by the school Μanagement. The 1,300-student school is very important to the neighborhood as there are no other elementary schools in the area.
Supporting education is a priority for TITAN Cement Egypt (TCE), in line with
both its 2015 neighborhood social study and the SDGs. After coordinating a visit to the local school, with the Alexandria Educational Building Authority and a National NGO, TCE undertook to fully renovate the school and also rebuild some parts. The project is realized by TITAN employees and a local contractor active in the neighborhood.. Work began in August 2016 and is scheduled for completion in September 2017.
Improving education in Wadi El Kamar, Egypt

Busin
ess
ove
rvie
w
Gro
up p
erfo
rma
nce
R
eg
iona
l pe
rform
anc
e
Co
rpo
rate
go
vern
anc
e
30 TITAN Group Integrated Annual Report 2016 Summary
Other business developments
Expansion into Brazil
On 20 September 2016, TITAN concluded an agreement to acquire an equity state in Cimento Apodi, a Brazilian cement manufacturer operating in the state of Ceará in Northeast Brazil.
Through this investment, TITAN enters a promising market with long-term potential, joining forces with established local partners. TITAN controls 94% of the vehicle that owns 50% of Apodi and will account for its participation as an equity investment. The amount of TITAN’s investment is €99.1 million and was financed by TITAN’s available cash.
Cimento Apodi owns a modern integrated cement plant in Quixeré that has been operating since 2015, and a grinding cement plant in Pecém port, close to the city of Fortaleza, that has been operating since 2011. Overall, Cimento Apodi has a production capacity of more than 2 million tons of cement per year.
The Brazilian market has strong growth potential due to its young population, lack of infrastructure and the large scope for urbanization, while its economy is coming out of recession, following two years of negative growth.
During 2016, we made an important investment in the Brazilian cement market,and further developed our GAEA and ST Equipment and Technology businesses.
of GAEA in 2011. It is now a self-sustained business, fully supported locally with technology, people, and know-how.
GAEA supports the cement business too, as it enabled Zlatna Panega Cement to achieve a peak daily thermal substitution rate (TSR) of 48% per kiln, using processed engineered fuel and end-of-life whole tires. This type of result has been achieved through continuous improvements in process, equipment, and know-how and strong support by the TITAN Group.
In 2016, GAEA Egypt also commenced operation, producing refuse-derived fuel from municipal solid waste in Alexandria to supply the local cement plant, and dried sewage sludges and biomass for the Beni Suef plant. Co-processing also began in Egypt in the autumn of 2016, with TSR daily peaks of 20% in Alexandria and 5% in Beni Suef.
Separation technologies
Based in Boston, USA, ST Equipment & Technology (STET) designs, manufactures, markets and services proprietary separation equipment worldwide. The company is the global leader in industrial tribo-electrostatic separation using its patented technology.
STET’s unique technology is applied to refine fly ash from coal-fired power plants for use in concrete, with value-adding economic, environmental and product performance benefits. The separation process uses no water and consumes very little energy. The technology is also being used in the beneficiation (or extraction) of industrial minerals, including calcium carbonate, talc and barite.
In recent years, STET’s geographic coverage has expanded into 10 countries. In 2016, new separators were delivered to customers in the US, India, Poland and the Philippines. The company also introduced a containerized mini-separator, which allows prospective customers to “try-before-you-buy” and test the technology onsite.
STET has also opened a new market segment in organic materials, successfully demonstrating that its tribo-electrostatic technology can concentrate proteins, separate different fiber fractions and isolate beta-glucan. The company is currently pursuing separator sales to the animal feed and starch industries.
Alternative fuel solutions through GAEA
GAEA Green Alternative Energy EAD is a Bulgarian company offering solutions for waste management/environmental protection, waste utilization and alternative fuels production.
Alternative fuels (AF) co-processing in Bulgaria completed its first five years of operation from the initial establishment

31TITAN Group Integrated Annual Report 2016 Summary
Regional awards and recognitions
Our companies received many awards and external recognitions during 2016. The following are a few selected highlights from around the Group.
USA USA operations continued to meet the criteria for EnergyStar certification, for Roanoke cement plant (10th year of certification), and Pennsuco cement plant.
The Wildlife Habitat Council certified both of TITAN America’s cement plants – Roanoke Cement and Pennsuco Cement – for their “Wildlife at Work” programs. This prestigious distinction was awarded in recognition of each plant’s demonstrated commitment toward long-term wildlife habitat enhancement efforts.
Roanoke Cement Company was accepted as an Exemplary Environmental Enterprise (E3) participant in the Virginia Environmental Excellence Program (VEEP), run by the Department of Environmental Quality.
Southeastern Europe Albania Antea cement plant was recognized by the Ministry of Energy and Industry for implementing and promoting advanced practices and solutions toward environmental protection.
F.Y.R. of MacedoniaUsje cement plant received Certificates of Appreciation from the Institute of Respiratory Diseases of Children in Kozle and the National Union of Chemists and Technologists.
KosovoSharrcem cement plant was recognized for its contribution and support for the European Investors Council (EIC), which aims to foster investment plans in Kosovo.
Sharrcem’s health and safety performance was recognized by the Kosovar Occupational Safety and Health Association (KOSHA).
SerbiaKosjeric cement plant was recognized for its Leadership and Commitment to CSR by the Responsible Business Forum.
Greece and Western Europe TITAN was distinguished 12th in the FORTUNE “Most Admired Companies” in Greece 2016 – based on criteria such as Innovation, HR Management, Social Responsibility, Resource Management, Long-term Investment Value, and Product and Service Quality.
TITAN received the Best Company award for “International Market” and “FTSE Large Cap” in the “HRIMA Business Awards – Georgios Ouzounis 2016” recognizing its financial performance (stability, market share growth, stock performance and investor relations).
TITAN was recognized as one of the True Leaders of the Greek economy for the 4th time for its overall performance, based on profitability, increasing number of employees, holding a top position in its industry (by revenue) and achieving a High ICAP Score for the Group.
Eastern Mediterranean
Egypt TITAN Egypt received an Appreciation Shield from the General Syndicate of Employees Building Material and Wood Industry.
TITAN Egypt also received Appreciation Shields from Beni Suef University and Beni Suef NUCA (New Urban Communities Authority) during the World Environment Day Celebration.
A further Appreciation Shield was awarded by the ALX Public Health Institute during their 8th International Conference in October 2016.
Turkey Adocim, our joint venture business, was recognized for its contribution to Tokat in northern Turkey and to the whole country’s economy in terms of production, recruitment and exports, by the Governor of Tokat.

Busin
ess
ove
rvie
w
Gro
up p
erfo
rma
nce
R
eg
iona
l pe
rform
anc
e
Co
rpo
rate
go
vern
anc
e
32 TITAN Group Integrated Annual Report 2016 Summary
Corporate governance
Corporate governance at TITAN is based on the underlying principles of all good governance: accountability, transparency, integrity and sustainability.
RequirementsWe have complied with all relevant provisions set by Greek law as well as with the principles and provisions of the UK Corporate Governance Code (September 2014), with the exceptions displayed and explained in the Corporate Governance Statement for the year 2016.
Board composition
15Members
7Independent directors
7 Executive directors
Board diversityGender related:
73%male
27%female
8 Non-executive directors

33TITAN Group Integrated Annual Report 2016 Summary
Role of independent directors
The Chairman meets the independence criteria set out in the UK Corporate Governance Code (“the Code”). His main task is to ensure effi cient operation of the Board, a satisfactory dialogue with shareholders and decision making that is based on the Company’s principles and values.
The independent, non-executive directors of the Board do not have executive or managerial duties; however, they contribute to the Board and its Committees by participating in the determination of TITAN’s strategy, the monitoring of management eff ectiveness, the supervision of internal audit and the eff ectiveness of its risk management systems. According to the Code, they must be independent in character and judgement and free from circumstances which are likely to aff ect their independence, which ensures suffi cient scrutiny in regard to the remuneration of executive directors and in the selection process for suitable new candidates for the Board.
Eight Board members out of 15, are non-executive directors and seven of these are independent directors.
Board diversity improvement
TITAN recognizes the importance of promoting diversity on the Board and at all levels of the Group, particularly in relation to gender but also to other aspects, such as age, educational and professional background, place of domicile and nationality. TITAN promotes diversity across the operations of the Group and supports the recruitment and development of talented employees, regardless of their gender or ethnic background. Likewise, the Board promotes diversity in its composition, as well as in the composition of the Board committees.
During 2016, the number of women on the Board doubled from two to four and one out of the three members on each Board Committee is a woman.
New Sustainability Committee and Advisory Council
Our sustainability governance has been further enhanced with the establishment of a Sustainability Committee, comprising members of the TITAN Board and its Executive Committee, overseeing our long-term commitment to sustainable development. The new Sustainability Committee’s purpose is to strengthen and support management’s long-term approach to the triple bottom line, covering economic, environmental and social matters.
The Board has also established an Advisory Council to provide advice to the Executive Committee and the Managing Director (Group CEO) on major strategic initiatives, senior appointments and issues of special interest to shareholders.
Principal risks
Our principal risks are those that could signifi cantly aff ect the Group’s operations and fi nancial statements. They are closely monitored at business unit and Group level and are managed through policies and systems approved by the Executive Committee.
The Board also regularly monitors the applied risk management policies and the eff ectiveness of internal control systems.
In 2016, the Board undertook a robust assessment of the principal strategic, operational and fi nancial risks the Group faces.

34 TITAN Group Integrated Annual Report 2016 Summary
Summary financial statements
To view or download our full Annual Financial Statements for the year ended 31 December 2016, please go online to integratedreport2016.titan.gr
(all amounts in euro thousands) Group Company
Year ended 31 December Year ended 31 December
2016 2015 2016 2015
Turnover 1,509,153 1,397,818 262,475 273,193
Cost of sales -1,072,139 -1,039,425 -199,836 -202,442
Gross profit before depreciation, amortization and impairment 437,014 358,393 62,639 70,751
Other income 8,972 9,508 15,470 16,651
Administrative expenses -122,108 -114,169 -43,276 -37,048
Selling and marketing expenses -21,628 -21,236 -271 -128
Other expenses -23,651 -16,074 -4,476 -6,458
Profit before interest, taxes, depreciation, amortization and impairment 278,599 216,422 30,086 43,768
Depreciation and amortization related to cost of sales -109,421 -107,442 -13,572 -12,285
Depreciation and amortization related to administrative and selling expenses
-6,872 -6,208 -1,181 -1,256
Impairment of tangible and intangible assets related to cost of sales -10,814 -17,045 - -
Profit before interest and taxes 151,492 85,727 15,333 30,227
Income from participations and investments 1,926 1,565 29,379 55,246
Losses from participations and investments - -2,805 - -
Finance income 2,900 1,767 24 52
Finance expense -67,303 -67,360 -22,333 -23,383
(Losses)/gains from foreign exchange differences -25,982 17,435 303 1,477
Share of profit of associates and joint ventures 492 5,815 - -
Profit before taxes 63,525 42,144 22,706 63,619
Plus/(less): Income tax 63,805 -6,848 -5,887 -3,477
Profit after taxes 127,330 35,296 16,819 60,142
Attributable to:
Equity holders of the parent 127,444 33,754
Non-controlling interests -114 1,542
127,330 35,296
Basic earnings per share (in €) 1.5612 0.4126
Diluted earnings per share (in €) 1.5521 0.4103
Income statement

35TITAN Group Integrated Annual Report 2016 Summary
(all amounts in euro thousands) Group Company
Year ended 31 December Year ended 31 December
2016 2015 2016 2015
Assets
Property, plant & equipment 1,573,235 1,805,720 242,777 237,424
Investment property 9,820 9,548 9,126 9,461
Intangible assets and goodwill 375,116 456,342 4,458 3,612
Investments in subsidiaries - - 862,657 844,762
Investments in associates and joint ventures 170,803 82,508 - -
Derivative financial instruments 1,386 - - -
Available-for-sale financial assets 1,065 1,209 122 172
Other non-current assets 12,638 14,830 3,219 3,063
Deferred income tax asset 20,971 806 - -
Non-current assets 2,165,034 2,370,963 1,122,359 1,098,494
Inventories 248,924 286,793 57,768 70,682
Receivables and prepayments 196,108 167,148 75,892 68,387
Derivative financial instruments 1 - - -
Available-for-sale financial assets - 2,110 - 2,109
Cash and cash equivalents 179,710 121,733 11,218 8,626
Current assets 624,743 577,784 144,878 149,804
Total assets 2,789,777 2,948,747 1,267,237 1,248,298
Statement of financial position

36 TITAN Group Integrated Annual Report 2016 Summary
(all amounts in euro thousands) Group Company
Year ended 31 December Year ended 31 December
2016 2015 2016 2015
Equity and liabilities
Share capital (84,632,528 shares of €4.00) 338,530 338,530 338,530 338,530
Share premium 22,826 22,826 22,826 22,826
Share options 2,978 1,807 2,978 1,807
Treasury shares -101,453 -79,077 -101,453 -79,077
Other reserves 839,364 1,017,304 538,403 519,750
Retained earnings 374,106 285,504 25,985 56,708
Equity attributable to equity holders of the parent 1,476,351 1,586,894 827,269 860,544
Non-controlling interests 76,465 118,391 - -
Total equity (a) 1,552,816 1,705,285 827,269 860,544
Long-term borrowings 710,965 716,766 310,678 300,712
Derivative financial instruments - 924 - -
Deferred income tax liability 56,597 163,786 12,438 7,518
Retirement benefit obligations 33,961 31,018 15,870 13,087
Provisions 22,498 21,481 4,215 2,221
Other non-current liabilities 5,952 6,572 3,788 4,005
Non-current liabilities 829,973 940,547 346,989 327,543
Short-term borrowings 129,499 26,313 42,442 9,324
Trade and other payables 266,584 265,308 44,439 45,204
Income tax payable 3,754 4,959 - -
Provisions 7,151 6,335 6,098 5,683
Current liabilities 406,988 302,915 92,979 60,211
Total liabilities (b) 1,236,961 1,243,462 439,968 387,754
Total equity and liabilities (a+b) 2,789,777 2,948,747 1,267,237 1,248,298
Statement of financial position continued

37TITAN Group Integrated Annual Report 2016 Summary
(all amounts in euro thousands) Group Company
Year ended 31 December Year ended 31 December
2016 2015 2016 2015
Cash flows from operating activities
Cash generated from operations 275,283 237,641 41,840 29,357
Income tax paid -6,065 -18,128 -326 -798
Net cash generated from operating activities (a) 269,218 219,513 41,514 28,559
Cash flows from investing activities
Payments for property, plant and equipment -148,294 -172,465 -20,115 -16,420
Payments for intangible assets -2,262 -1,011 -1,080 -224
Proceeds from sale of PPE, intangible assets and investment property 1,024 1,305 220 356
Proceeds from dividends 5,266 2,218 28,579 55,012
Payments for acquisition of subsidiaries, net of cash acquired -11,781 - - -
Payments for investing in associates and joint ventures -84,953 -400 - -
Share capital (increase)/decrease in subsidiaries - - -18,000 1,180
Share capital increase in associates and joint ventures -2,234 - - -
Net proceeds/(payments) from the sale/(acquisition) of available-for-sale financial assets 2,128 -1,836 2,128 -1,836
Interest received 1,059 1,767 24 52
Net cash flows (used in)/from investing activities (b) -240,047 -170,422 -8,244 38,120
Net cash flows after investing activities (a)+(b) 29,171 49,091 33,270 66,679
Cash flows from financing activities
Proceeds from non-controlling interest's participation in subsidiary's establishment - 35 - -
Payments for shares bought back -25,193 - -25,193 -
Proceeds from sale of treasury shares 436 638 436 638
Proceeds from government grants - 227 - -
Interest paid -64,713 -56,318 -23,774 -22,441
Dividends written-off and paid to the Greek State -24 -36 -24 -36
Dividends & reserves paid to shareholders -25,243 -25,316 -25,243 -25,316
Dividends paid to non-controlling interests -5,281 -5,635 - -
Acquisition of non-controlling interests - -10,591 - -
Proceeds from borrowings 674,505 396,812 220,601 93,421
Payments of borrowings -511,820 -370,366 -177,906 -121,862
Net cash flows from/(used in) financing activities (c) 42,667 -70,550 -31,103 -75,596
Net increase/(decrease) in cash and cash equivalents (a)+(b)+(c) 71,838 -21,459 2,167 -8,917
Cash and cash equivalents at beginning of the year 121,733 142,946 8,626 16,971
Effects of exchange rate changes -13,861 246 425 572
Cash and cash equivalents at end of the year 179,710 121,733 11,218 8,626
Cash flow statement

38 TITAN Group Integrated Annual Report 2016 Summary
Summary non-financial statementsWBCSD/CSI non-financial performance indicators
WBCSD/CSI Description 2012 2013 2014 2015 2016
Impact on natural resources1
Raw material extracted 28.0 29.2 29.5 30.3 32.2
for cement production, million metric tons (wet) 18.5 20.5 18.2 19.0 19.5
for aggregates, million metric tons (wet) 9.5 8.7 11.3 11.3 12.7
Raw material consumed
for cement production, million metric tons (dry) 19.0 20.2 18.2 20.0 21.7
for ready-mix, dry mortar and block production, million metric tons (wet)(2)
6.0 6.0 6.9 8.0 8.7
Total heat consumption, TJ 41,152 43,907 40,093 44,333 47,316
Total electrical energy consumption, TJ 5,848 6,113 5,698 6,101 6,652
Total water consumption, million m3 11.1 9.4 8.4 9.1 9.1
Recycled (externally) waste materials, metric tons 267,800 248,940 353,600 294,000 413,553
Reused (externally) waste materials, metric tons 9,683
Recovered (externally) waste materials, metric tons 3,438
Local impact
Active quarry sites with biodiversity issues(3,5) 8 8 8 8 8
Active quarry sites with biodiversity management plans(4,5)
3 3 3 6 6
Active quarry sites with biodiversity management plans(4,5), %
37.5 37.5 37.5 75.0 75.0
Sites with community engagement plans, % 100.0 100.0 100.0 100.0 100.0
Sites with quarry rehabilitation plans(5), % 65.0 79.0 80.0 82.0 87.0
Active quarry sites (wholly owned) with ISO14001 or similar, % 88.0 94.0 94.0 96.0 93.0
Health and Safety
Employee fatalities 1 0 0 1 0
Employee fatality rate 1.92 0.00 0.00 1.80 0.00
Contractors fatalities 0 1 1 1 0
Third-party fatalities 0 1 1 0 1
Employee Lost Time Injuries (LTIs) 14 5 18 23 22
Employee Lost Time Injuries Frequency Rate (LTIFR) 1.38 0.47 1.65 2.00 1.92
Employee lost working days 1,117 191 1,481 1,624 897
Employee Lost Time Injuries Severity Rate 110.3 17.8 135.6 141.4 78.2
Contractors Lost Time Injuries (LTIs) 16 7 8 11 7
Contractors Lost Time Injuries Frequency Rate (LTIFR) 1.91 0.76 0.87 1.10 0.73
Notes
1 Figures are calculated based on the equity of the specific year.
2 Figures for years before 2015 were revised to reflect only natural material consumed.
3 Active quarries within, containing or adjacent to areas designated for their high biodiversity value.
4 Sites with high biodiversity value where biodiversity management plans are actively implemented.
5 Since 2011, coverage of wholly owned active quarries has expanded, to include both quarries attached to TITAN’s cement plants and quarries for aggregates production.
TITAN Group – all activities performance

39TITAN Group Integrated Annual Report 2016 Summary
WBCSD/CSI Description 2012 2013 2014 2015 2016
Climate change
Total gross direct CO2 emissions, million metric tons 9.6 10.2 9.5 10.5 11.4
Specific gross direct CO2 emissions, kg/tProduct 658.7 664.3 674.4 706.1 718.0
Total indirect(2) CO2 emissions, million metric tons 1.0 1.1 1.1 1.1 1.2
Alternative fuels and materials
Alternative fuel substitution rate, %HB 2.98 4.30 6.65 6.75 8.58
Biomass in fuel mix, %HB 1.86 1.63 2.22 1.57 2.14
Alternative raw materials (clinker & cement), %Dry 6.0 6.1 7.0 5.5 5.1
Clinker to cement ratio 0.850 0.844 0.831 0.847 0.844
Emissions Overall coverage rate, % - - 61.8 75.1 82.5
Coverage rate continuous measurement, % - - 80.9 53.5 52.8
Total dust particulates, metric tons 972 524 416 438 316
Specific dust particulates, g/tClinker 83.5 42.2 37.0 35.7 23.9
Coverage rate, % - - 100.0 92.9 100.0
Total NOx, metric tons 21,361 22,785 18,088 20,927 22,473
Specific NOx, g/tClinker 1,835.0 1,832.5 1,610.4 1,705.8 1,702.9
Coverage rate, % - - 100.0 100.0 100.0
Total SOx, metric tons 2,277 2,351 2,969 2,527 2,713
Specific SOx, g/tClinker 195.6 189.1 264.3 206.0 205.6
Coverage rate, % - - 88.9 100.0 100.0
Impact on natural resources
Total thermal energy consumption, TJ 40,768 43,504 39,512 43,970 46,862
Energy efficiency, kcal/kgClinker 836.1 835.5 840.1 856.0 848.0
Total alternative fuels, metric tons 68,050 89,170 122,790 127,665 163,537
Total electrical energy consumption, GWh 1,536 1,581 1,481 1,600 1,752
Total water consumption, million m3 3.9 4.3 3.8 3.9 3.8
Specific water consumption, lt/tCement 300.0 315.5 305.4 287.1 255.1
Total extracted raw materials consumption, million metric tons 19.0 20.2 18.2 20.0 21.7
Total alternative raw materials consumption, million metric tons
1.2 1.3 1.4 1.2 1.2
Health and Safety
Employee fatalities 1 0 0 1 0
Employee fatality rate 2.69 0.00 0.00 2.68 0.00
Contractors fatalities 0 1 1 1 0
Third-party fatalities 0 1 1 0 0
Employee Lost Time Injuries (LTIs) 8 2 8 13 11
Employee Lost Time Injuries Frequency Rate (LTIFR) 1.13 0.28 1.10 1.75 1.54
Employee lost working days 905 110 494 936 313
Employee Lost Time Injuries Severity Rate 127.7 15.3 67.6 126.0 43.8
Contractors Lost Time Injuries (LTIs) 12 6 8 7 2
TITAN Group – Cement plants, attached and related quarries performance1
Notes
1 Figures are calculated based on the equity of the specific year.
2 Indirect CO2 emissions are related to emissions released for the production of the electrical energy consumed at TITAN’s facilities. For their calculation we use emission factors provided by the supplier of the electrical energy or other publicly available data. If no such data are available, the most recent data provided by CSI are used.

40 TITAN Group Integrated Annual Report 2016 Summary
Notes


TITAN Cement Company S.A.22A Halkidos Str.11143 Athens, GreeceTel: +30 210 2591111www.titan-cement.com