Embed Size (px)
Citation preview
Intangible Knowledge Capital and Innovation in China
Belton M. Fleisher Department of Economics Ohio State University, Center for Human Capital and Labor Market Research, Central University of Finance and Economics, Beijing
William H. McGuireDepartment of Agricultural Environmental and Development EconomicsOhio State University
Adam N. SmithDepartment of EconomicsOhio State University
Mi ZhouAgricultural Bank of China

Overview• We focus on intangible knowledge capital (IKC) not
embodied in workers (e.g., schooling, training)– Produced in China by domestically owned enterprises
(DEs) or foreign-invested enterprises (FIEs)– Can complement imported intangible capital (e.g.
patents)– Can complement imported embodied technology
(physical capital imported by DEs or FIEs)• We view IKC as produced through R&D activities and
reflected in the R&D stock. (Fraumeni and Okubo,2005; Griliches (numerous); Sveikauskas, 2007)
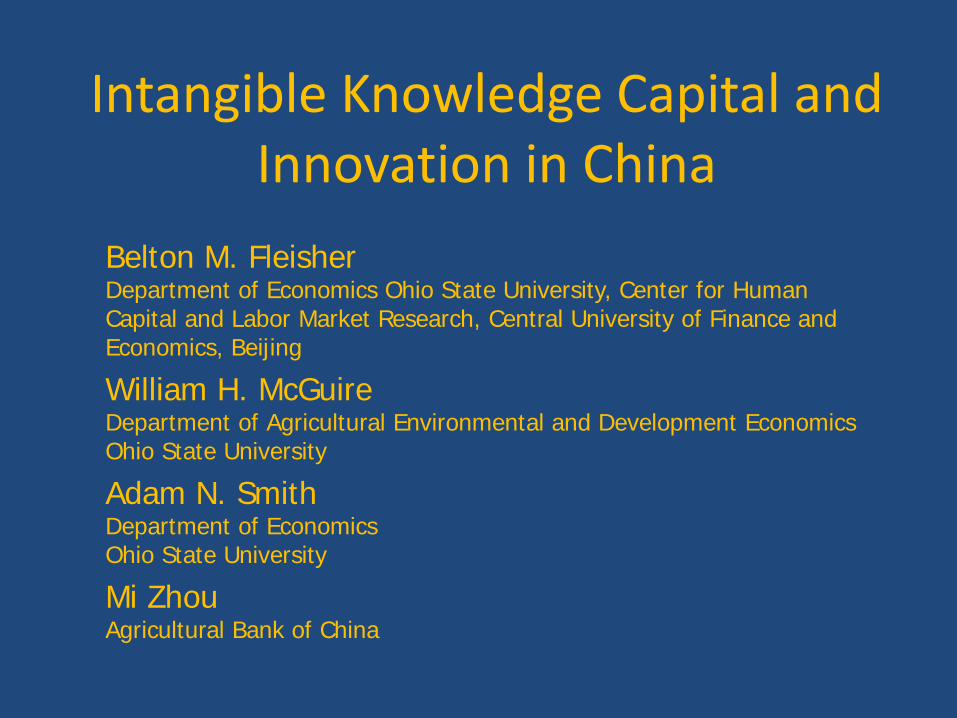
What about the “Marketplace for Ideas” in China? (Coase and Wang, 2012)
• Does the nascent, but imperfectly enforced, protection of IKC property rights in China threaten long-term growth prospects in China? (Coase, 1960; Stigler, 1989)
• Opening to FDI has enhanced competition, leading to increased R&D and new product development in all ownership sectors (Deng and Jefferson, 2008; Girma, Gong, and Görg, 2009)
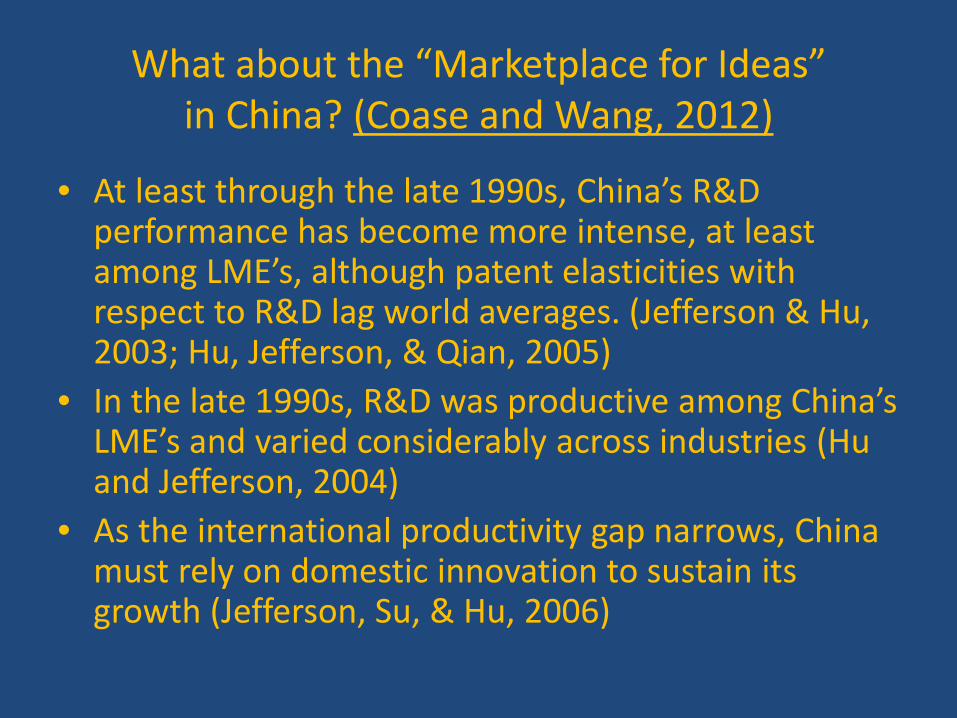
What about the “Marketplace for Ideas” in China? (Coase and Wang, 2012)
• At least through the late 1990s, China’s R&D performance has become more intense, at least among LME’s, although patent elasticities with respect to R&D lag world averages. (Jefferson & Hu, 2003; Hu, Jefferson, & Qian, 2005)
• In the late 1990s, R&D was productive among China’s LME’s and varied considerably across industries (Hu and Jefferson, 2004)
• As the international productivity gap narrows, China must rely on domestic innovation to sustain its growth (Jefferson, Su, & Hu, 2006)
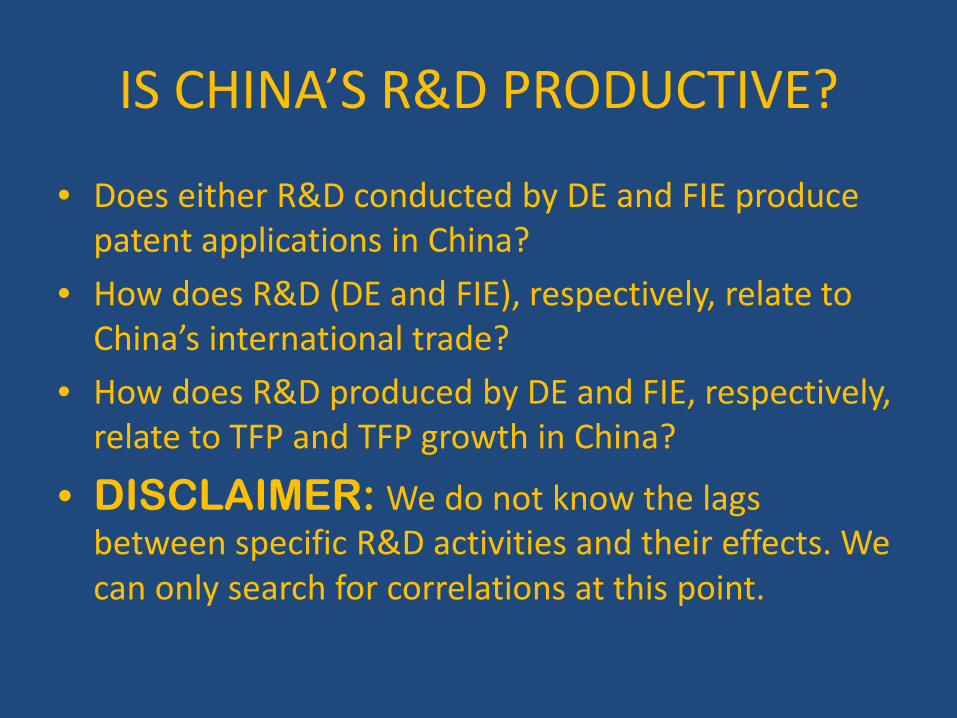
IS CHINA’S R&D PRODUCTIVE?
• Does either R&D conducted by DE and FIE produce patent applications in China?
• How does R&D (DE and FIE), respectively, relate to China’s international trade?
• How does R&D produced by DE and FIE, respectively, relate to TFP and TFP growth in China?
• DISCLAIMER: We do not know the lags between specific R&D activities and their effects. We can only search for correlations at this point.

Data
• Our data are of Large and Medium Enterprises and derived from various issues of China Statistical Yearbook of Science and Technology and Statistical Yearbook of China.

What’s going on with R&D and innovation?
• A few anecdotes follow, then we overview some basic trends.

Importing high-tech cows to beef up the dairy industry requires adaptive R&D.

Ford will bring patentable technology from US and engage in adaptive R&D in China
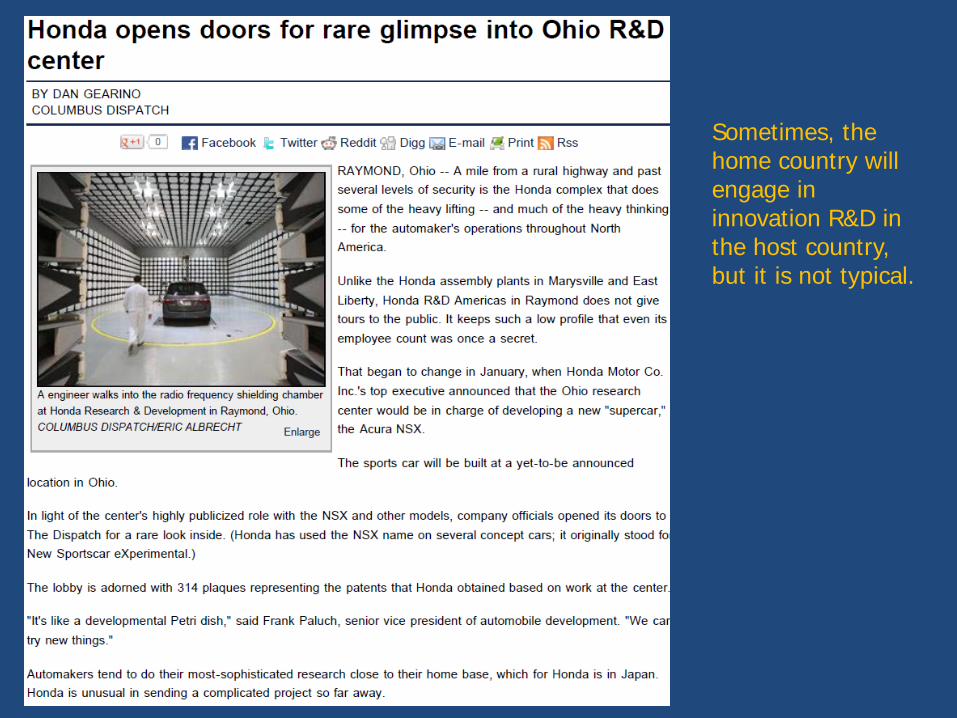
Sometimes, the home country will engage in innovation R&D in the host country, but it is not typical.
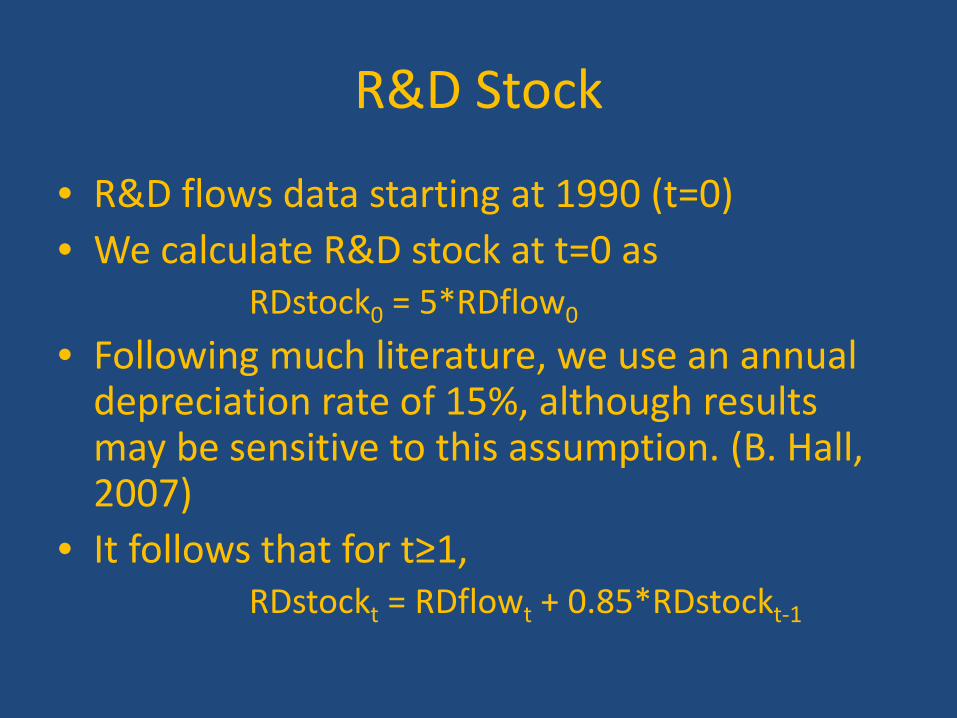
R&D Stock
• R&D flows data starting at 1990 (t=0)• We calculate R&D stock at t=0 as
RDstock0 = 5*RDflow0
• Following much literature, we use an annual depreciation rate of 15%, although results may be sensitive to this assumption. (B. Hall, 2007)
• It follows that for t≥1,RDstockt = RDflowt + 0.85*RDstockt-1

Overview of R&D Stock byEnterprise Ownership
0
0.5
1
1.5
2
2.5
3
3.5
4
4.5
1997 1998 1999 2000 2001 2002 2003 2004 2005 2006 2007
Domestic and FIE R&D Stock 1997-2007DomIndex FIE Index Dom/Total
Index 1997= 1

0
0.05
0.1
0.15
0.2
0.25
0.3
0.35
0.4
0.45
0.5
1000
10000
100000
1000000
1985 1986 1987 1988 1989 1990 1991 1992 1993 1994 1995 1996 1997 1998 1999 2000 2001 2002 2003 2004 2005 2006 2007
Total and Innovation Patent ApplicationsTotal Applications Total Innov Innov/Total
Ratio declines as total applications rise.

0
0.1
0.2
0.3
0.4
0.5
0.6
0.7
0.8
500
5000
50000
2000 2001 2002 2003 2004 2005 2006 2007
Invention Patent Applications by OwnershipTotal Invent Total Inv FIE FIE/Total
WTO, TRIPS

0.0
500.0
1000.0
1500.0
2000.0
2500.0
3000.0
2000 2001 2002 2003 2004 2005 2006 2007
RD Expenditures per Innovation Patent App. by FIEs (unit: 10,000 Yuan 1990 price)
High Tech
Low Tech
WTO, TRIPS
FIE’s import existing patents
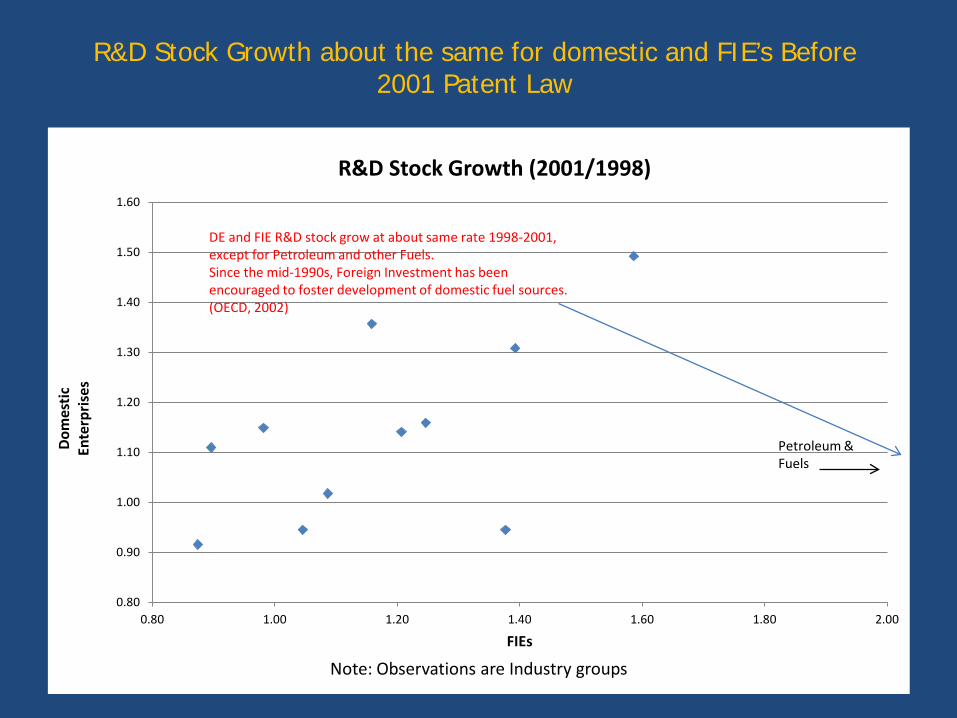
R&D Stock Growth about the same for domestic and FIE’s Before 2001 Patent Law
0.80
0.90
1.00
1.10
1.20
1.30
1.40
1.50
1.60
0.80 1.00 1.20 1.40 1.60 1.80 2.00
Dom
estic
En
terp
rises
FIEs
R&D Stock Growth (2001/1998)
Petroleum & Fuels
Note: Observations are Industry groups
DE and FIE R&D stock grow at about same rate 1998-2001, except for Petroleum and other Fuels. Since the mid-1990s, Foreign Investment has been encouraged to foster development of domestic fuel sources.(OECD, 2002)
2.33
1.59
1.841.75
1.58
2.08
2.56
1.92
2.91
1.98
2.57
2.38
1.20
1.40
1.60
1.80
2.00
2.20
2.40
2.60
2.80
3.00
2.00 2.50 3.00 3.50 4.00 4.50
Dom
estic
Ente
rpris
es
FIEs
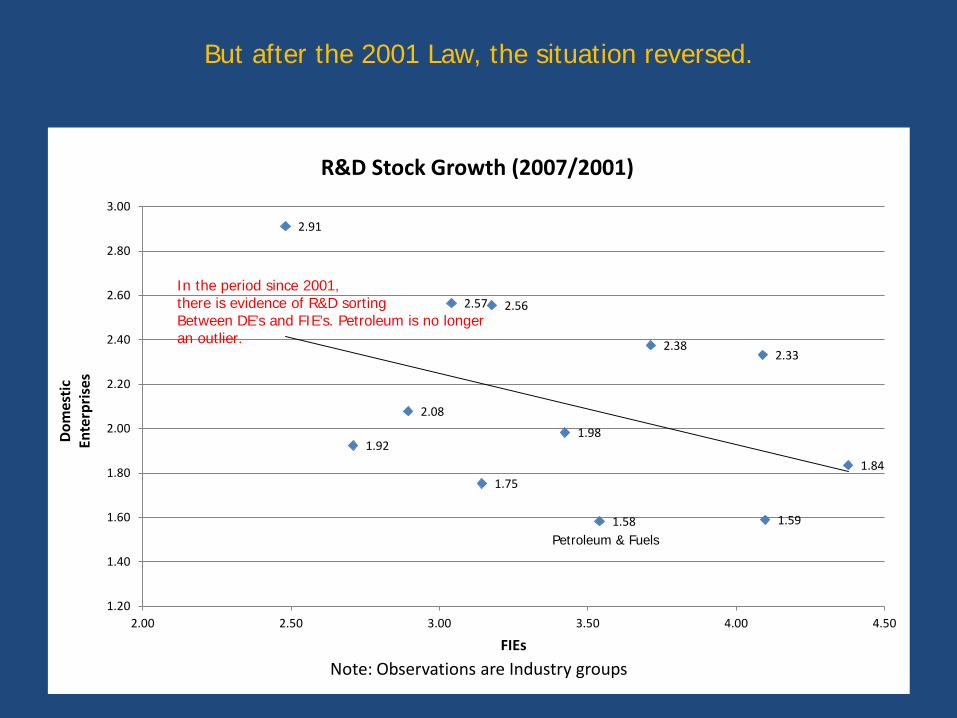
R&D Stock Growth (2007/2001)
Note: Observations are Industry groups
But after the 2001 Law, the situation reversed.
Petroleum & Fuels
In the period since 2001, there is evidence of R&D sorting Between DE’s and FIE’s. Petroleum is no longer an outlier.
-1.80
-1.30
-0.80
-0.30
0.20
0.70
1.20
2.00 2.50 3.00 3.50 4.00 4.50
RCA
Chan
ge
R&D Change
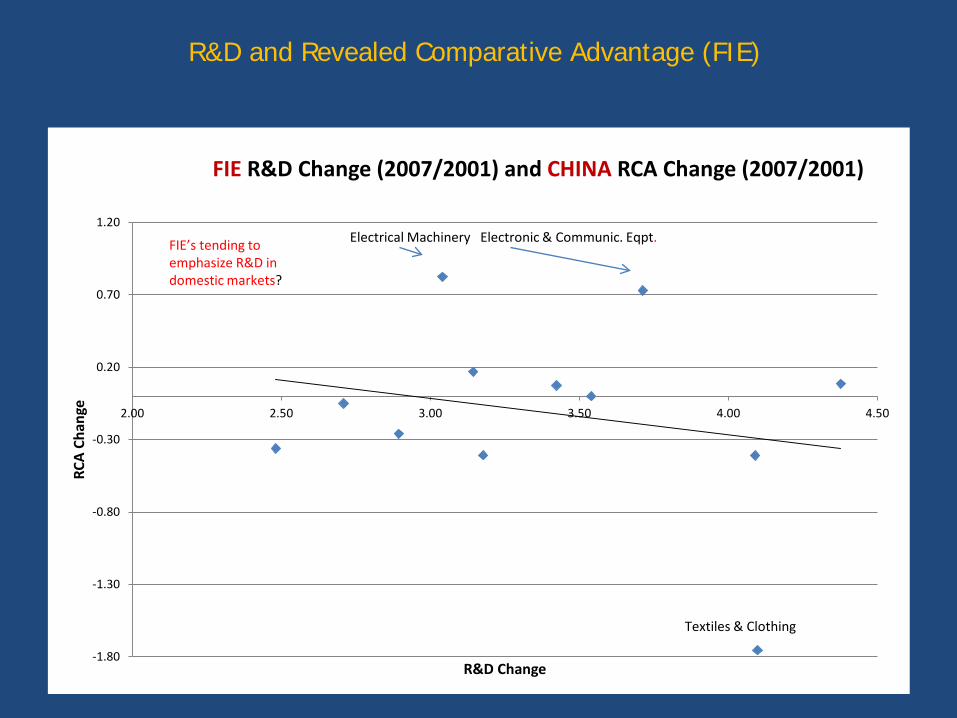
FIE R&D Change (2007/2001) and CHINA RCA Change (2007/2001)
Textiles & Clothing
Electrical Machinery Electronic & Communic. Eqpt.FIE’s tending to emphasize R&D in domestic markets?
R&D and Revealed Comparative Advantage (FIE)
-2.00
-1.50
-1.00
-0.50
0.00
0.50
1.00
1.00 1.50 2.00 2.50 3.00 3.50 4.00
RCA
Chan
ge
R&D Change
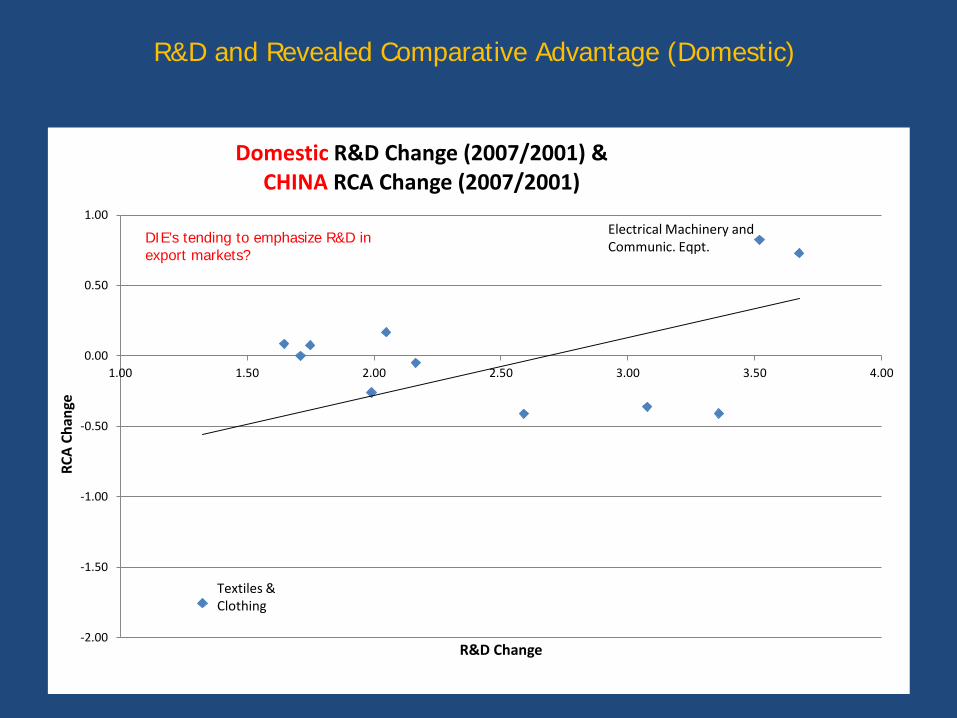
Domestic R&D Change (2007/2001) & CHINA RCA Change (2007/2001)
Textiles &Clothing
Electrical Machinery and Communic. Eqpt.
R&D and Revealed Comparative Advantage (Domestic)
DIE’s tending to emphasize R&D in export markets?
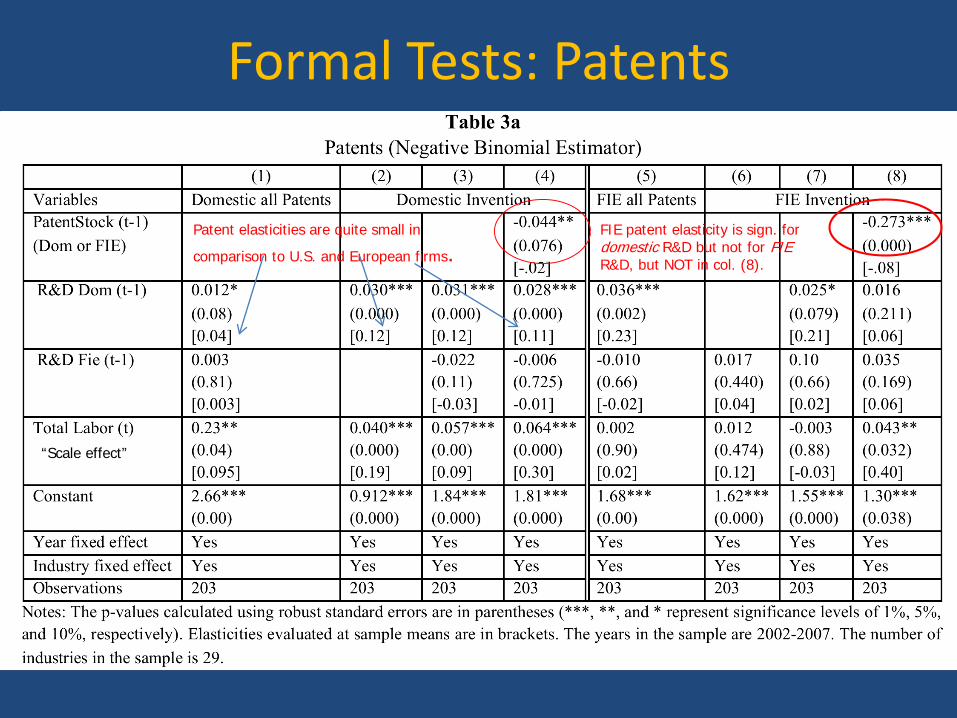
Formal Tests: Patents
Patent elasticities are quite small in
comparison to U.S. and European firms.FIE patent elasticity is sign. for domestic R&D but not for FIE R&D, but NOT in col. (8).
“Scale effect”
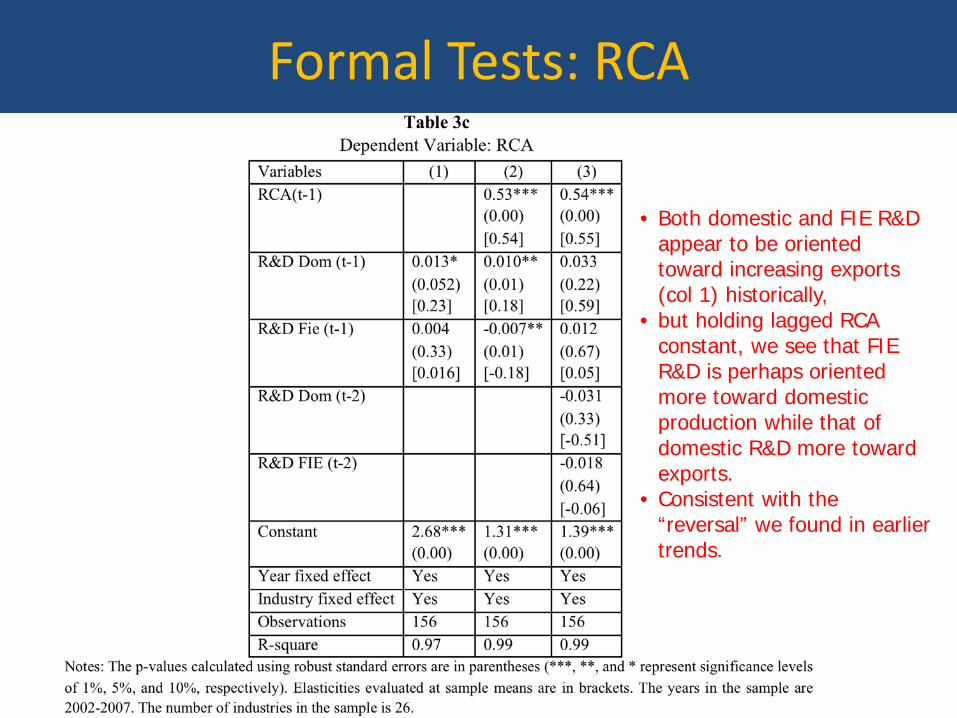
Formal Tests: RCA
• Both domestic and FIE R&D appear to be oriented toward increasing exports (col 1) historically,
• but holding lagged RCA constant, we see that FIE R&D is perhaps oriented more toward domestic production while that of domestic R&D more toward exports.
• Consistent with the “reversal” we found in earlier trends.
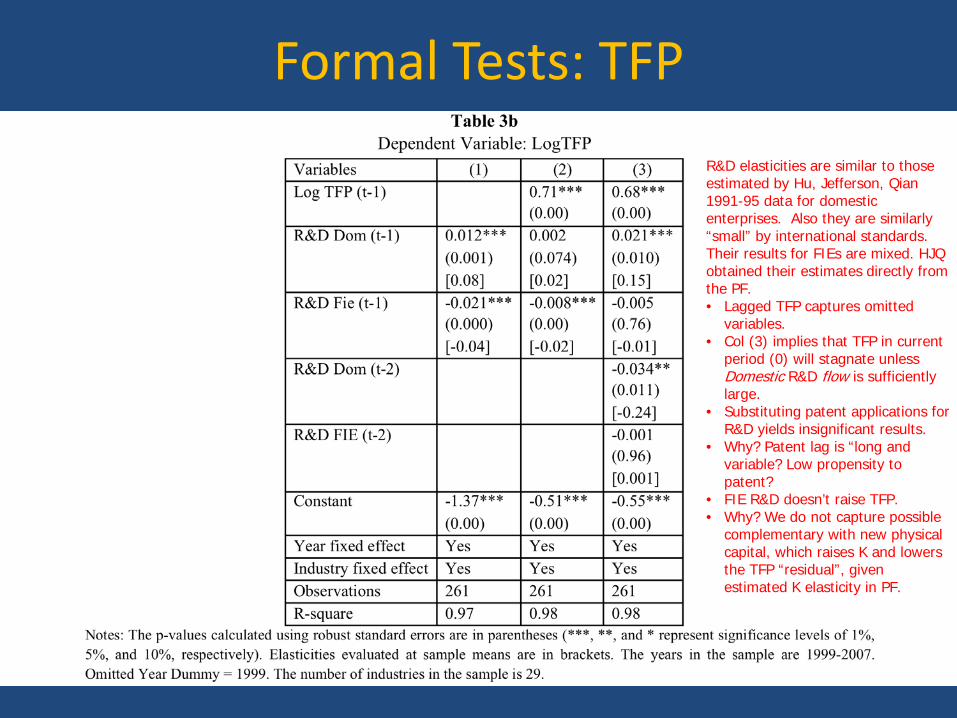
Formal Tests: TFPR&D elasticities are similar to those estimated by Hu, Jefferson, Qian1991-95 data for domestic enterprises. Also they are similarly “small” by international standards. Their results for FIEs are mixed. HJQ obtained their estimates directly from the PF.• Lagged TFP captures omitted
variables.• Col (3) implies that TFP in current
period (0) will stagnate unless Domestic R&D flow is sufficiently large.
• Substituting patent applications for R&D yields insignificant results.
• Why? Patent lag is “long and variable? Low propensity to patent?
• FIE R&D doesn’t raise TFP.• Why? We do not capture possible
complementary with new physical capital, which raises K and lowers the TFP “residual”, given estimated K elasticity in PF.
0
0.05
0.1
0.15
0.2
0.25
0.3
0.35
0.4
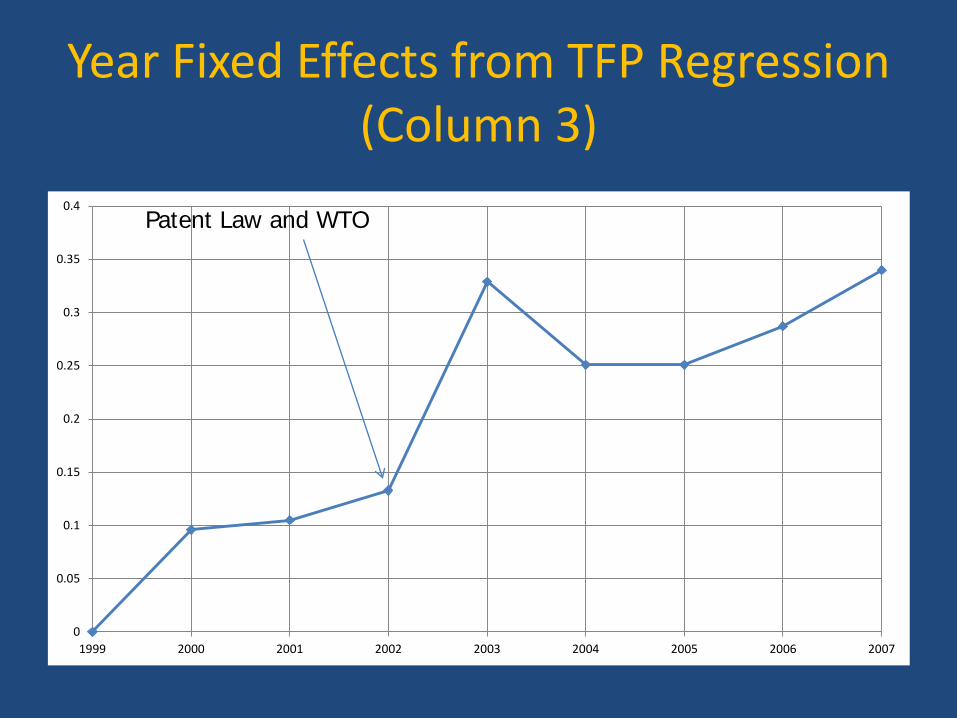
1999 2000 2001 2002 2003 2004 2005 2006 2007
Patent Law and WTO
Year Fixed Effects from TFP Regression (Column 3)
Conclusions • Domestic enterprise R&D is productivity
enhancing in China, but so far it has had a weak impact on new patents.
• This suggests that the formation of knowledge capital in China has yet to reach the world frontier.
• Foreign IKC imported or developed in China appears aimed at the domestic market.
• Continuation of China’s productivity growth at its current pace is likely to depend on incentives for and protection of domestic creativity.
Policy Implications
• Will government get on board or blockade the knowledge train?– Enforce IPR; – Encourage a Marketplace of Ideas such that foreign-
trained scientists are comfortable returning to China; CREATE NEW KNOWLEDGE AS WELL AS FACILITATE TRANSMISSION OF INTERNATIONAL TECHNOLOGY (Keller 2002 & 2009)
– Be prepared to give up control of Strategic Industries; don’t let Sinopec become Pemex