Embed Size (px)
Citation preview

INNOVATION
PROFESSIONALISM
INTEGRITY
CUSTOMER FOCUSED
TEAMWORK
ELEVATINGPROGRESS
TO NEW LEVELSANNUAL REPORT 2016

In an ever-evolving market environment, consumers need change. At MSIG, we understand this. Thus, we constantly strive to maintain our customer’s satisfaction through innovative services and products that cater to both personal and business needs. Powered by the values we hold dear: Customer Focused, Integrity, Teamwork, Innovation and Professionalism, our focus is to constantly move ahead by keeping up with the needs of today whilst also anticipating the needs of tomorrow.

ANNUAL REPORT 2016 3CONTENTS
Board of Directors
Directors’ Profile
Corporate Information
Senior Management
Financial Highlights
Chairman’s Statement
Directors’ Report
Statement of Financial Position
Statement of Profit or Loss and Other Comprehensive Income
Statement of Changes in Equity
Statement of Cash Flows
Notes to the Financial Statements
Statement by Directors
Statutory Declaration
Independent Auditors’ Report
04
05
09
10
12
14
21
33
34
35
36
37
89
90
91

4 ANNUAL REPORT 2016 BOARD OF DIRECTORS
BACK ROW (LEFT TO RIGHT) Hitoshi Kitagawa, Alan John Wilson, Chua Seck Guan, Datuk Seri Dr Nik Norzrul Thani bin N Hassan Thani.
FRONT ROW (LEFT TO RIGHT) Loh Guat Lan, Dato’ Mohd. Sallehuddin bin Othman, Pearl Chan Siew Cheng.

ANNUAL REPORT 2016 5
Dato’ Mohd. Sallehuddin bin Othman
Dato’ Mohd. Sallehuddin bin Othman joined MSIG Insurance (Malaysia) Bhd as an Independent Non-Executive Director in 2005 and was appointed the Chairman of the Board in March 2014. He holds professional accounting qualifi cations from the Association of Chartered and Certifi ed Accountants (ACCA) and Chartered Institute of Management Accountants (CIMA), United Kingdom. He also graduated with a Master’s Degree from City University, London in 1975. He has been registered as a Chartered Accountant with the Malaysian Institute of Accountants since 1981 and became a Fellow member of ACCA in 1983.
Dato’ Mohd. Sallehuddin began his career with brief stints at various audit fi rms in Malaysia and the United Kingdom, a statutory body and a major Government-linked company in Malaysia, before joining the Asian Development Bank based in Manila, Philippines from 1981 to 1986. Upon his return to Malaysia in 1986, Dato’ Mohd. Sallehuddin joined Permodalan Nasional Berhad, working in senior positions in corporate services and human resources until 1994. From mid-1994 to 2000, Dato’ Mohd. Sallehuddin was with UMW Holdings Berhad, initially as Executive Director, and subsequently as Group Managing Director. From 2001 until his retirement in 2006, he served as Group Managing Director of Malaysian Industrial Finance Berhad.
Post retirement, Dato’ Mohd. Sallehuddin has served as an Independent Non-Executive Director of a few companies including a foreign Islamic bank. In addition to MSIG Insurance (Malaysia) Bhd, he is currently an Independent Director of a number of companies, notably Axa Affi n Life Insurance Berhad and Bank of Tokyo-Mitsubishi UFJ (M) Berhad.
DIRECTORS’ PROFILE

6 ANNUAL REPORT 2016
Datuk Seri Dr Nik Norzrul Thani bin N Hassan Thani
Datuk Seri Dr Nik Norzrul Thani bin N Hassan Thani was appointed Director of MSIG Insurance (Malaysia) Bhd on 16 March 2009. He holds a Ph.D in Law from the School of Oriental and African Studies (SOAS), University of London and a Masters in Law from Queen Mary College, University of London. He read law at the University of Buckingham, United Kingdom. Datuk Seri Dr Nik also holds a Post-Graduate Diploma in Syariah Law and Practice (with distinction) from the International Islamic University Malaysia. A Barrister of Lincoln’s Inn and an Advocate and Solicitor of the High Court of Malaya, he was called to the Bar of England and Wales in 1985 and to the Malaysian Bar in 1986. He was previously a Visiting Fulbright Scholar, Harvard Law School and a Chevening Fellow at the Oxford Centre of Islamic Studies. Datuk Seri Dr Nik is a Fellow of the Financial Services Institute of Australasia (FINSIA). Currently, Datuk Seri Dr Nik is the Chairman and Senior Partner of Zaid Ibrahim & Co. Prior to joining Zaid Ibrahim & Co., Datuk Seri Dr Nik was with Baker & McKenzie (International Lawyers), Singapore. He is also a Director of Fraser & Neave Holdings Bhd, Al Rajhi Banking & Investment Corporation (Malaysia) Bhd, UMW Holdings Bhd, T7 Global Berhad, Ranhill Holdings Bhd, Chin Hin Group Berhad and Amanah Saham Nasional Berhad.
Hitoshi Kitagawa
Mr Hitoshi Kitagawa joined the Board of MSIG Insurance (Malaysia) Bhd as an Independent Non-Executive Director on 18 March 2014. He is currently the Managing Director of Toyota Tsusho (Malaysia) Sdn Bhd. Prior to this, he had been the Group Leader of the Techno Park Management Group of Toyota Tsusho Corporation. A graduate of Meiji University, Japan, Mr Kitagawa joined Toyota Tsusho Corporation in Japan in 1981. He has gained over 35 years of working experience in the machinery, global logistics and auto parts manufacturing global operations in his time with the company. His previous overseas posting was to Bangkok, Thailand where he worked from 2005 to 2011.

ANNUAL REPORT 2016 7
Pearl Chan Siew Cheng
Ms Pearl Chan Siew Cheng joined the Board of MSIG Insurance (Malaysia) Bhd on 18 March 2014 as an Independent Non-Executive Director. She has 31 years of experience in the Malaysian fund management industry, having managed institutional money such as government funds, insurance funds, pension funds, charitable foundations and unit trust funds throughout her career. Prior to her retirement in January 2008, Ms Chan was the Deputy Chief Executive Offi cer of CIMB Principal Asset Management for one year, after a merger between CIMB and the Southern Bank Group. Before that, she pioneered SBB Asset Management, a wholly-owned subsidiary of the Southern Bank Group, which became the fi rst commercial bank in Malaysia to have an asset management arm. She held the position of CEO for 17 years, and CEO/Chief Investment Offi cer for the fi rst 14 years, leading a team of equity and fi xed income fund managers. Before setting up SBB Asset Management, she was General Manager of Rashid Hussain Asset Management and a fund manager with Bumiputra Merchant Bankers Berhad for a total of 13 years. During her career, she also spearheaded two major corporate integration exercises in 2003 and 2007, where she successfully completed the entire integration process, involving organisation and governance structures, human resources, administration and technical systems. Ms Chan is a graduate in Economics from the University of Nottingham, England.
Loh Guat Lan
Ms Loh Guat Lan joined the Board of MSIG Insurance (Malaysia) Bhd as a Non-Independent Non-Executive Director on 1 October 2010. She is currently the Group Managing Director / Chief Executive Offi cer of Hong Leong Assurance Berhad (HLA), a subsidiary of HLA Holdings Sdn Bhd (HLAH) wholly-owned by Hong Leong Financial Group Berhad (HLFG), the fi nancial services arm of Hong Leong Group Malaysia. She is also a director of Hong Leong MSIG Takaful Berhad. Ms Loh holds a Bachelor’s degree in Nutrition Science and is a Fellow member of Life Management Institute (FLMI), Customer Service Management (CSM) and Life Offi ce Management (LOMA). She is also a Certifi ed Financial Planner (CFP) and Registered Financial Planner (RFP). Her last role prior to joining HLA as the Chief Operating Offi cer (Life Division) was Vice President & Senior Director of Agency (Malaysia). Ms Loh has over 27 years of experience in the insurance industry.

8 ANNUAL REPORT 2016
Alan John Wilson
Mr Alan Wilson has helmed the Singapore-based Asia regional holding office of Mitsui Sumitomo Insurance Company (MSIG) as Regional CEO since 2008. In his capacity as Regional CEO, he also serves as Chairman or Director (or equivalent) on the boards of 13 MSIG companies around the region. Under Mr Wilson’s leadership, the MSIG network in Asia has now expanded to 17 markets. In April 2015, Mr Wilson was honoured to be appointed as the first foreign Executive Officer, Mitsui Sumitomo Insurance Co Ltd (Japan). Mr Wilson has a sound executive management track record and has over 30 years of experience in the general insurance industry.
Prior to joining MSIG Asia, Mr Wilson was the Asia CEO at Allianz from 1999. He assumed overall responsibility for managing over 20 general, life and health insurance operations across 14 countries and later served on several boards for Allianz and for other groups such as Parkway in Asia. Mr Wilson joined Allianz from Guardian Royal Exchange Assurance Group where he was Asia Managing Director. Over the course of his 21 years there, he held various senior positions with progressive responsibilities, where he managed general and life insurance business in 11 countries.
A British national and a Singaporean Permanent Resident, Mr Wilson has lived and worked in Asia since 1982 in various places, including Hong Kong, Indonesia, Pakistan and Singapore.
Mr Wilson is also Chairman of MSIG Berhad.
Chua Seck Guan
Mr Chua Seck Guan was appointed as the Chief Executive Officer and Executive Director of MSIG Insurance (Malaysia) Bhd on 1 April 2010. A Senior Associate and Certified Insurance Professional from the Australian and New Zealand Institute of Insurance and Finance, he has vast experience in general insurance operations having served 34 years with the company. He provides the leadership and plays key strategic and operational roles in charting the company’s growth to its current revenue and profit level, and has positioned MSIG as one of the leaders in the industry. He was also instrumental in leading MSIG to be the General Insurance Company of The Year 2015, a recognition awarded by the Asia Insurance Review.
He is currently the Deputy Chairman of PIAM Management Committee and sits on the boards of Malaysia Rating Corporation Berhad (MARC), and MSIG Berhad.

ANNUAL REPORT 2016 9
BOARD NOMINATIONS COMMITTEE Chairman: Pearl Chan Siew Cheng
Members: Dato’ Mohd. Sallehuddin bin Othman
Datuk Seri Dr Nik Norzrul Thani bin N Hassan Thani Hitoshi Kitagawa Alan John Wilson
BOARD COMPLIANCE & RISK MANAGEMENT COMMITTEE
Chairman: Datuk Seri Dr Nik Norzrul Thani bin N Hassan Thani
Members: Dato’ Mohd. Sallehuddin bin Othman Hitoshi Kitagawa Pearl Chan Siew Cheng
BOARD INVESTMENT COMMITTEE
Chairman: Pearl Chan Siew Cheng
Members: Dato’ Mohd. Sallehuddin bin Othman Loh Guat Lan Chua Seck Guan Koichi Nagase
COMPANY SECRETARIES
Lee Wai Ngan(LS00184)Chan Toye Ying(LS00185)
REGISTERED OFFICE
Plaza 138,Suite 18.03, 18th Floor,138, Jalan Ampang50450 Kuala Lumpur.
BOARD REMUNERATION COMMITTEE
Chairman: Hitoshi Kitagawa
Members: Dato’ Mohd. Sallehuddin bin Othman Datuk Seri Dr Nik Norzrul Thani bin N Hassan Thani
BOARD AUDIT COMMITTEE
Chairman: Datuk Seri Dr Nik Norzrul Thani bin N Hassan Thani
Members: Dato’ Mohd. Sallehuddin bin Othman Hitoshi Kitagawa Pearl Chan Siew Cheng
SHARE REGISTRAR
System Associates Sdn. Bhd.Plaza 138,Suite 18.03, 18th Floor,138 Jalan Ampang,50450 Kuala Lumpur.
EXTERNAL AUDITOR
KPMG PLT
TECHNICAL ADVISORS
Tetsunori ShojiBachelor of Business Adminstration
Nobuhiro OjioBachelor of Commerce
Kensuke HiraiBachelor of Laws
Yusuke TakamuraBachelor of Laws
Yoshihiro ShibuyaBachelor of LawsYu OiBachelor of Economics
CORPORATE INFORMATION

10 ANNUAL REPORT 2016
CHIEF EXECUTIVE OFFICERChua Seck GuanANZIIF (Snr Assoc)
DEPUTY CHIEF EXECUTIVE OFFICERKoichi NagaseBachelor of Laws
TECHNICAL ADVISORTetsunori ShojiBachelor of Business Administration
CHIEF OPERATING OFFICERJennifer Hsu Chin FenLLB (Hons)
SENIOR VICE PRESIDENTCompliance & EnterpriseRisk ManagementChin Kong MengCA (M), FCPA (Aust), CFP
EXECUTIVE VICE PRESIDENTFinance, Planning & ActuarialSoh Lai SimCA (M), CPA, FCTIM
SENIOR VICE PRESIDENTIT, Digital, E-Commerce & Business IntelligenceChin Jee GwanBSc (Hons), MSc
SENIOR MANAGEMENT

ANNUAL REPORT 2016 11
VICE PRESIDENTBrokingAng Yien ChiaB.Sc (BA), DMII
VICE PRESIDENTFranchise & Direct CorporateVictor Chen Fan LoanANZIIF (Assoc) CIP, DMII
SENIOR VICE PRESIDENTClaims & ReinsuranceLoke Phaik PohFCII, FMII, Chartered Insurer
SENIOR VICE PRESIDENTBranch Operations Support, PSD & AdministrationJessica Teh Siew Kheng
SENIOR VICE PRESIDENTAgencyTeoh Guan HuatMBA, ANZIIF (Snr Assoc) CIP, DMII
SENIOR VICE PRESIDENTUnderwriting & BancassuranceTan Poh SuatB.Sc (Hons), ACII, AMII, Chartered Insurer

12 ANNUAL REPORT 2016
Composition of 2016 Gross Premium Total: RM1.5 Billion
2000 400 600 800 1000 1200 1400 1600
26% 43% 8% 23%
23%7%25% 45%
2016
2015
2014
2013
2012
RM (million)
Fire Motor Marine, Aviation & Transit Miscellaneous
Year Ended 31 December
Paid-up Share Capital
Total Equity
Total Assets
Gross Premium
Net Premium
Underwriting Surplus
Investment & Other Income
Profit Before Taxation
Profit After Taxation
Earning Per Share (RM)
NTA Per Share (RM)
Total Workforce
333,143
2,071,236
3,960,331
1,326,297
1,037,183
135,709
96,396
232,105
182,103
0.55
2.79
1,115
333,143
2,189,496
4,194,057
1,425,924
1,119,674
168,492
88,325
256,817
203,851
0.61
3.15
1,119
333,143
2,298,400
4,344,034
1,486,662
1,203,263
193,165
85,209
278,374
214,960
0.65
3.47
1,133
333,143
2,401,381
4,632,954
1,535,370
1,233,630
173,536
88,299
261,835
200,100
0.60
3.78
1,149
333,143
2,547,953
4,612,182
1,522,503
1,227,640
206,749
106,801
313,550
248,800
0.75
4.22
1,160
2012RM’000
2013RM’000
2014RM’000
2015RM’000
2016RM’000
FINANCIAL HIGHLIGHTS
6%45%26% 23%
7%25% 45% 23%
23%7%27% 44%

ANNUAL REPORT 2016 13
2012 2013 2014 2015 2016
PROFIT BEFORE TAXATIONINVESTMENT & OTHER INCOME
TOTAL EQUITY TOTAL ASSET
RM (million)RM (million)
RM (million) RM (million)
275
300
325
25090
225
200
2700
2400
4800
2100
4200
175
1800
3600
150
15003000
125
12002400
100
900 1800
75
600 1200
50
25
300 600
2012 2013 2014 2015 2016 2012 2013 2014 2015 2016
2012 2013 2014 2015 2016 2012 2013 2014 2015 2016
2012 2013 2014 2015 2016
UNDERWRITING SURPLUSRM (million)
220
200
180
160
140
120
100
80
60
40
20
0
GROSS PREMIUMRM (million)
1540
1400
1260
1120
980
840
700
560
420
280
140
0
0
110
100
80
70
60
50
40
30
20
10
0
0 0

CHAIRMAN’S STATEMENT14 ANNUAL REPORT 2016
“On Behalf Of The Board Of Directors, It Is My Pleasure To Present The Annual Report And Financial Statements Of The Company For The Year Ended 31 December 2016.
“Dato’ Mohd. Sallehuddin bin Othman
Chairman
Bagi Pihak Lembaga Pengarah, Saya Dengan Sukacitanya Mengemukakan Laporan Tahunan Serta Penyata Kewangan Syarikat Bagi Tahun Berakhir 31 Disember 2016.

ANNUAL REPORT 2016 15
FINANCIAL REVIEW
The 2016 financial year recorded a Gross Written Premium of RM1.52 billion against RM1.54 billion in the previous year. This contraction of RM12.9 million (0.8%) can be attributed primarily to the Motor Class which experienced a significant reduction in vehicle sales of 13% year-on-year, continued rate softening and intense competition as insurers strive for larger market share ahead of the Motor Insurance Liberalisation in July 2017. Weak consumer sentiment and sluggish external trade amidst growing uncertainties in the global environment also affected the market.
Despite the decrease in GWP, Underwriting Surplus was up by RM33.2 million (19.1%) from RM173.5 million in 2015 to RM206.7 million, with a Combined Operating Ratio of 83.8%. The Underwriting Surplus, the highest in 5 years, marks a milestone for surpassing the RM200 million and is underpinned by diligent underwriting discipline and robust claims management.
The Company’s total investment size amounted to RM2.7 billion. Investment Income of RM104.3 million registered a double-digit increase of 13.3%, translating into a RM12.3 million increase over 2015. This is another record, crossing the RM100 million level for the first time.
Realised investment profit was also higher at RM9.5 million compared to RM3.8 million in the previous year. However, this gain was negated by the provision for impairment loss on investments amounting to RM7.6 million from equities.
The Profit Before Tax of RM313.6 million and Profit After Tax of RM248.8 million reflect a net earnings per share of 74.7 cents.
A final dividend of RM99.9 million for financial year 2015 was declared in June 2016.
As at end 2016, the Company’s Total Assets, including Goodwill, was RM4.6 billion.
TINJAUAN KEWANGAN
Tahun kewangan 2016 mencatatkan Premium Bertulis Kasar (PBK) sebanyak RM1.52 bilion berbanding laporan tahun lepas sebanyak RM1.54 bilion. Faktor-faktor utama susutan sebanyak RM12.9 juta (0.8%) adalah disebabkan oleh Kelas Motor yang mengalami kadar pengurangan ketara sebanyak 13% dalam penjualan kenderaan semasa, kadar mendatar yang berterusan, serta persaingan sengit di mana syarikat-syarikat insurans lebih menumpukan kepada pasaran yang lebih besar ke arah Liberalisasi Insurans Motor pada Julai 2017. Sentimen pengguna yang lemah serta dagangan luar yang perlahan dengan keadaan global yang tidak menentu juga mempengaruhi keadaan pasaran.
Biarpun terdapat penyusutan dalam PBK, Lebihan Taja Jamin meningkat sebanyak RM33.2 juta (19.1%) dari RM173.5 juta pada 2015, ke RM206.7 juta dengan Kadar Kendalian Digabungkan sebanyak 83.8%. Lebihan Taja Jamin pada 2016 sebanyak RM206.7 juta merupakan rekod tertinggi sepanjang 5 tahun dan merupakan sebuah pencapaian positif, melepasi tanda aras RM200 juta.Kejayaan ini tentu sekali berjaya dicapai melalui penajajaminan yang berdisiplin serta pengurusan tuntutan yang cekap.
Saiz jumlah pelaburan Syarikat berkembang sebanyak RM2.7 bilion manakala Pendapatan Pelaburan sebanyak RM104.3 juta mencatatkan kenaikan sebanyak 13.3%, iaitu RM12.3 juta berbanding tahun 2015. Sekali lagi mencatatkan rekod, melepasi aras RM100 juta untuk kali pertama.
Keuntungan pelaburan terealis juga mencatat angka yang lebih tinggi dengan RM9.5 juta berbanding RM3.8 juta pada tahun lepas. Walau bagaimanapun, peningkatan ini disangkalkan akibat daripada peruntukan untuk kerugian ke atas kemerosotan nilai pelaburan yang bernilai sebanyak RM7.6 juta daripada ekuiti.
Keuntungan Sebelum Cukai sebanyak RM313.6 juta dan Keuntungan Selepas Cukai sebanyak RM248.8 juta menjanakan perolehan bersih setiap saham dengan nilai 74.7 sen.
Dividen akhir sebanyak RM99.9 juta bagi tahun kewangan 2015 diisytiharkan pada Jun 2016.
Akhir 2016, Jumlah Aset Syarikat, termasuk Muhibah bernilai sebanyak RM4.6 bilion.

16 ANNUAL REPORT 2016
OPERATIONAL REVIEW
Customer Focused InnovationWe were honoured to have our Prime PA product,
launched in 2015, awarded 2nd place in the Regional Innovation Award organised by our Regional Office. To continue with our focus on product innovation and improvement, the year in review witnessed the launch of Out-of-Pocket Expenses Insurance (OOPS) to cover Inconvenience Allowances for Flood and Vehicle laid-up for repairs, a common pain point for consumers when their cars are under repair. We also reinforced our Travel Insurance with enhanced benefits such as Adventurous Activity to reflect the trend of participating in adventurous past-times like bungee jumping, hot air balloon rides and other activities as part of the travel experience. This saw our Travel product register a RM2.6 million growth for 2016.
Innovation was also the focus of our Customer Contact Centre which receives 7,000 calls per month for all classes of products and distribution channels. The implementation of a Process Innovation programme resulted in a 66% improvement in productivity, improved calls pick-up rate to 80%, a customer satisfaction rate of 93% and an impressive 83% of customers surveyed willing to be a MSIG brand “ambassador” by introducing MSIG to their family and friends.
In addition, we continued our Digitalisation journey with the introduction of two new systems during the year in review :
n Business Management System – streamlining and automating processes across key functions and lines of business to improve efficiency and to enable the business to quickly respond to changing market needs, competitive forces, growth initiatives and customer demands.n Risk Survey Application – digitalising the pre-acceptance risk survey process on mobile devices for risk surveyors to use out in the field and thus, bring about speedier turnaround time and increased productivity.
TINJAUAN OPERASI
Inovasi Yang Menumpukan Kepada PelangganKami merasa amat bangga dengan produk Prime PA
kami yang telah dilancarkan pada 2015 berjaya merangkul tempat kedua dalam Anugerah Inovasi Peringkat Serantau oleh Pejabat Serantau kami. Bagi meneruskan kecemerlangan proses inovasi dan penambahbaikan produk, Insurans Belanja Tunai Langsung (OOPS) telah dilancarkan pada 2016 untuk memberikan Elaun Kesulitan untuk Banjir dan Kenderaan yang sedang diselenggarakan di bengkel, yang mana menjadi satu keperluan bagi pihak pelanggan setiap kali kenderaan mereka dibaiki akibat kemalangan. Kami juga turut memperkenalkan Insurans Perjalanan yang telah dipertingkatkan dengan manfaat untuk Aktiviti Yang Mencabar bagi memenuhi trend pelanggan yang mengambil bahagian dalam aktiviti-aktiviti mencabar seperti melompat bungee, menaiki belon panas dan pelbagai lagi aktiviti lain yang mereka nikmati ketika melancong. Dengan ini, produk Insurans Perjalanan kami telah mencatatkan peningkatan jualan sebanyak RM2.6 juta pada tahun 2016.
Inovasi juga adalah fokus Pusat Panggilan Pelanggan kami yang menerima 7,000 panggilan setiap bulan untuk semua kelas produk serta saluran edaran. Pelaksanaan program Proses Inovasi berjaya menghasilkan peningkatan produktiviti sebanyak 66%, peningkatan kadar menjawab panggilan sebanyak 80% serta kadar kepuasan pelanggan sebanyak 93% dan melalui kaji selidik, sebanyak 83% pelanggan bersetuju untuk memperkenalkan MSIG kepada keluarga dan rakan-rakan mereka.
Di samping itu, perjalanan Digital kami diteruskan dengan pengenalan 2 sistem baru seperti berikut:
n Sistem Pengurusan Perniagaan – menyelaraskan dan mengautomatikkan proses bagi fungsi-fungsi utama dan aliran perniagaan bagi mempertingkatkan kadar kecekapan dan membolehkan perniagaan bertindak pantas terhadap perubahan mengikut kehendak pasaran, daya saing, inisiatif pertumbuhan dan permintaan pelanggan.
n Aplikasi Tinjauan Risiko – Pendigitalan proses pra-penerimaan tinjauan risiko pada peranti mudah alih untuk digunakan oleh jurunilai risiko, dapat mencapai putaran kerja lebih pantas dan meningkatkan produktiviti.

ANNUAL REPORT 2016 17
Corporate Social Responsibility
On a daily basis, much of the food that we throw away can still be consumed. To help reduce wastage whilst simultaneously doing our bit for the underprivileged and the environment, MSIG embarked on a partnership with Food Aid Foundation which saw staff and intermediaries connect with local communities in transforming excess food to feed the needy. Every alternate Saturday from March to July 2016, 213 staff volunteered, cooked excess food, packed and distributed to 1,300 children and senior citizens in 20 underprivileged homes.
Our CSR outreach programme also included talks by NGOs such as St John Ambulance, UNICEF and The National Autism Society of Malaysia to staff and agents.
Preparation for Liberalisation
Following the release by Bank Negara Malaysia (BNM) of the Phased Liberalisation for Motor and Fire Policy Document outlining the framework, timelines and expectations of BNM when the industry moves from the current tariff environment to risk based pricing on 1 July 2017, plans and strategies pertaining to pricing, products, systems, people, sales and distribution were effected in preparation for this major industry change.
Liberalisation will also provide opportunities for Insurers to offer innovative products from the current restrictive tariff environment.
The Board provided guidance and support to the Management in the setup of the various committees and projects, and overall liberalisation plan.
Tanggungjawab Sosial Korporat
Ramai yang masih tidak sedar bahawa kebanyakan sisa makanan yang kita buang setiap hari masih boleh dimakan. Bagi mengelakkan aktiviti pembaziran terus berlaku sambil menyumbang kepada penduduk yang tidak berkemampuan serta alam sekitar, MSIG telah berkerjasama dengan Food Aid Foundation bagi menghubungkan kakitangan dan pengantara kami kepada komuniti tempatan dengan menyalurkan makanan lebihan kepada mereka yang memerlukan. Seramai 213 staf secara sukarela menyumbangkan bantuan pada setiap selang Sabtu dari Mac hingga Julai 2016 dengan memasak, membungkus dan mengagihkan makanan kepada 20 rumah kebajikan yang menempatkan 1,300 orang kanak-kanak dan warga emas.
Program ‘CSR’ kami juga termasuk ceramah-ceramah oleh ‘NGO’ seperti St John Ambulance, UNICEF dan The National Autism Society of Malaysia bagi kakitangan dan ejen-ejen.
Persediaan Menghadapi Liberalisasi
Terbitan Dokumen Polisi Fasa Liberalisasi bagi Motor dan Kebakaran oleh Bank Negara Malaysia (BNM) yang merangkumi rangka kerja, garis masa dan jangkaan BNM apabila industri berubah dari keadaan tarif semasa hinggalah harga berdasarkan risiko yang bermula pada 1 Julai 2017, memberi kesan kepada pelan-pelan dan strategi-strategi berkaitan harga, produk, sistem, tenaga kerja, jualan dan edaran dalam persediaan menghadapi perubahan besar industri ini.
Liberalisasi juga membuka peluang kepada syarikat-syarikat Insurans untuk menawarkan produk-produk inovatif berbanding dengan keadaan tarif semasa.
Lembaga Pengarah telah memberikan panduan dan menyokong Pihak Pengurusan dalam penubuhan pelbagai komiti dan projek, serta pelan liberalisasi secara keseluruhannya.

18 ANNUAL REPORT 2016
OUTLOOK
Looking ahead, 2017 remains challenging amidst global economic uncertainties, an impending increase in US interest rates and the weakening Ringgit. On the local front, the government has projected a 4% to 5% GDP growth, which augurs well for the industry.
Despite the subdued outlook, there are sectors which are expected to spur growth, e.g. transportation-related Infrastructure projects, new Foreign Direct Investments and a recovery in commodity prices, and which are likely to benefit the Property, Engineering, Marine and Liability classes of our Business. There are also opportunities arising from new emerging risks such as cyber activities, ridesharing, terrorism and the deployment of disruptive technologies (Fintech and Insurtech).
Another possible game-changer for the general insurance industry is changing consumer attitude towards online purchases with the foreseeable future likely to see the inevitable arrival of similar purchasing trends. The recent growth of insurance aggregators or motor pricing comparison sites, online platforms, customer choices and conveniences is an indication that Millennials and Gen Y users will be the drivers of such behavioural change and MSIG needs to rise up to these consumers’ changing trends.
Notwithstanding the above challenges, I am confident 2017 and beyond will be exciting and rewarding with our continued focus on the Company’s core values of Customer Focused, Integrity, Teamwork, Innovation and Professionalism.
ACKNOWLEDGEMENT
On behalf of the Board, I would like to express my gratitude and appreciation to our valued intermediaries, clients and business partners for their strong support in making 2016 another outstanding year.
We also wish to extend our appreciation to the Senior Management Team and our staff for their dedication and commitment to continuous improvements in line with the Company’s core values.
The Board would also like to thank Bank Negara Malaysia and the relevant Regulatory Authorities for their guidance and advice.
Lastly, I would like to thank my fellow Directors for their valuable inputs and contributions.
Dato’ Mohd. Sallehuddin bin Othman Chairman
MELANGKAH KE HADAPAN
Melihat ke hadapan, 2017 pastinya merupakan tahun yang mencabar pada ketika keadaan ekonomi yang tidak menentu, peningkatan kadar faedah AS yang bakal berlaku dan Ringgit yang semakin rendah. Kerajaan telah menjangkakan pertumbuhan KDNK sebanyak 4% hingga 5% yang merupakan satu tanda baik buat industri.
Walaupun masa hadapan yang tidak menjaminkan, terdapat juga sektor-sektor yang dijangka berkembang pesat, contohnya projek infrastruktur berkaitan kenderaan, Pelaburan Langsung Asing yang baru dan harga komoditi yang kian pulih yang mana akan membantu sektor perniagaan insurans seperti kelas Hartanah, Kejuruteraan, Marin dan Liabiliti. Terdapat juga peluang-peluang dari kemunculan risiko baru seperti aktiviti siber, berkongsi kenderaan (ridesharing), keganasan dan perkembangan teknologi-teknologi disruptif (Fintech dan Insurtech).
Satu lagi faktor yang menyumbang kepada perubahan ketara dalam industri insurans am adalah sikap pelanggan yang kini lebih menjurus ke arah pembelian atas talian yang mana bakal menyaksikan trend yang serupa dalam industri ini. Perkembangan laman pengumpulan data (aggregator) insurans atau perbandingan harga insurans motor, platform online, pilihan dan kemudahan pelanggan jelas menunjukkan pengguna Milennial dan Gen Y bakal menjadi penggerak dalam perubahan ini. Oleh itu, MSIG perlu meningkatkan usaha untuk memenuhi trend perubahan keperluan pelanggan ini.
Walaupun terdapat pelbagai rintangan seperti yang disebutkan, saya yakin tahun 2017 dan seterusnya bakal menjanjikan pengalaman yang menarik dan memberi ganjaran seiring dengan fokus terhadap nilai-nilai utama Syarikat iaitu Tumpuan terhadap Pelanggan, Integriti, Kerjasama Berpasukan, Inovasi dan Profesionalisme.
PENGHARGAANBagi pihak Lembaga Pengarah, saya ingin mengucapkan
terima kasih dan menyampaikan penghargaan kepada para perantara, pelanggan dan rakan niaga kami yang amat dihargai atas sokongan padu mereka menjadikan tahun 2016 satu lagi tahun yang cemerlang.
Kami juga ingin menyampaikan penghargaan kepada Kumpulan Pengurusan Kanan dan pekerja atas dedikasi dan komitmen mereka yang berterusan seiring dengan nilai-nilai teras syarikat.
Lembaga Pengarah juga ingin mengucapkan terima kasih kepada Bank Negara Malaysia dan Pihak Berkuasa yang berkenaan atas panduan dan nasihat mereka.
Akhir kata, saya ingin mengucapkan ribuan terima kasih kepada rakan-rakan Pengarah saya di atas nasihat dan sumbangan mereka yang berharga.
Dato’ Mohd. Sallehuddin bin Othman Pengerusi

Financial Statements


ANNUAL REPORT 2016 21
for the year ended 31 December 2016
DIRECTORS’ REPORT
The Directors have pleasure in submitting their report together with the annual audited financial statements of the Company for the financial year ended 31 December 2016.
Principal activities
The Company is principally engaged in the underwriting of all classes of general insurance business. There has been no significant change in the nature of these activities during the financial year.
Ultimate holding company
The Company is a subsidiary of Mitsui Sumitomo Insurance Co., Ltd. and MS&AD Insurance Group Holdings, Inc. is parent company of Mitsui Sumitomo Insurance Co., Ltd., both companies are incorporated in Japan. MS&AD Insurance Group Holdings, Inc. is regarded by the Directors as the Company’s ultimate holding company, during the financial year and until the date of this report.
Financial results RM’000Profit for the year 248,800
Dividends
Since the end of the previous financial year, the Company paid a final dividend of 30 sen per ordinary share totalling RM99,943,000 in respect of the year ended 31 December 2015 on 5 July 2016.
The final ordinary dividends recommended by the Directors in respect of the financial year ended 31 December 2016 is 25 sen per ordinary share totalling RM83,286,000. Such dividend, if approved, will be accounted for in the shareholders’ equity as an appropriation of retained earnings during financial year ending 31 December 2017.
Directors of the Company
Directors who served during the financial year until the date of this report are:
Dato’ Mohd. Sallehuddin bin Othman Datuk Seri Dr Nik Norzrul Thani bin N Hassan Thani Mr Hitoshi Kitagawa Ms Pearl Chan Siew Cheng Ms Loh Guat Lan Mr Alan John Wilson Mr Chua Seck Guan
Directors’ interests in shares
The interests and deemed interests in the shares of the Company and of its related corporations of those who were Directors at financial year end (including the interests of the spouses or children of the Directors who themselves are not Directors of the Company) as recorded in the Register of Directors’ Shareholdings are as follows:
Number of ordinary shares At At 1.1.2016 Bought Sold 31.12.2016Shareholdings in which Director has direct interest
Related companies: BPI/MS Insurance Corporation Mr Alan John Wilson 1 - - 1 Ueang Mai Co Ltd Mr Alan John Wilson 1 - - 1 Yardhimar Company Ltd Mr Alan John Wilson 1 - - 1
None of the other Directors holding office at the end of the financial year had any interest in the ordinary shares of the Company or its related corporations during the financial year.

22 ANNUAL REPORT 2016
Directors’ benefits
Since the end of the previous financial year, no Director of the Company has received nor become entitled to receive any benefit (other than a benefit included in the aggregate amount of remuneration received or due and receivable by Directors as shown in the financial statements or the fixed salary of a full time employee of the Company or of related corporations) by reason of a contract made by the Company or a related corporation with the Director or with a firm of which the Director is a member, or with a company in which the Director has a substantial financial interest.
There were no arrangements during and at the end of the financial year which had the object of enabling Directors of the Company to acquire benefits by means of the acquisition of shares in or debentures of the Company or any other body corporate.
Issue of shares
There was no change in the authorised, issued and paid-up capital of the Company during the financial year.
Options granted over unissued shares and debentures
No options were granted to any person to take up unissued shares or debentures of the Company during the financial year.
Reserves and provisions
There were no material transfers to or from reserves and provisions during the financial year under review except as disclosed in the financial statements.
Provision for insurance liabilities
Before the statement of profit or loss and other comprehensive income and statement of financial position of the Company were made out, the Directors took reasonable steps to ascertain that there was adequate provision for its insurance liabilities in accordance with the valuation basis specified in Part D of the Risk-Based Capital Framework for Insurers.
Impaired debts
Before the statement of profit or loss and other comprehensive income and statement of financial position of the Company were made out, the Directors took reasonable steps to ascertain that action had been taken in relation to the writing off of impaired debts and the making of impairment allowance for impaired debts and satisfied themselves that all known impaired debts had been written off and adequate impairment allowance had been made for impaired debts.
At the date of this report, the Directors are not aware of any circumstances that would render the amount written off for impaired debts or the amount of the impairment of allowance for impaired debts in the financial statements of the Company inadequate to any substantial extent.
Current assets
Before the statement of profit or loss and other comprehensive income and statement of financial position of the Company were made out, the Directors took reasonable steps to ascertain that any current assets, other than debts, which were unlikely to be realised in the ordinary course of business, at their values as shown in the accounting records of the Company have been written down to an amount which they might be expected so to realise.
At the date of this report, the Directors are not aware of any circumstances which would render the values attributed to the current assets in the financial statements of the Company misleading.
Valuation methods
At the date of this report, the Directors are not aware of any circumstances which have arisen which render adherence to the existing method of valuation of assets or liabilities of the Company misleading or inappropriate.

ANNUAL REPORT 2016 23
Contingent and other liabilities
At the date of this report, there does not exist:
(i) any charge on the assets of the Company that has arisen since the end of the financial year and which secures the liabilities of any other person; or
(ii) any contingent liability in respect of the Company that has arisen since the end of the financial year, except as disclosed in Note 37 of the financial statements.
No contingent liability or other liability has become enforceable, or is likely to become enforceable within the period of twelve months after the end of the financial year which, in the opinion of the Directors, will or may substantially affect the ability of the Company to meet its obligations as and when they fall due.
For the purpose of this paragraph, contingent liability or other liabilities do not include liabilities arising from contracts of insurance underwritten in the ordinary course of business of the Company.
Change of circumstances
At the date of this report, the Directors are not aware of any circumstances not otherwise dealt with in this report or the financial statements of the Company, which would render any amount stated in the financial statements of the Company misleading.
Items of an unusual nature
The results of the operations of the Company for the financial year were not, in the opinion of the Directors, substantially affected by any item, transaction or event of a material and unusual nature.
There has not arisen in the interval between the end of the financial year and the date of this report any item, transaction or event of a material and unusual nature likely, in the opinion of the Directors, to affect substantially the results of the operations of the Company for the year in which this report is made.
Indemnity and insurance costs
During the financial year, the Company incurred a premium expense of approximately RM25,000 in respect of the Directors and Officers Liability insurance effected for all the Directors and senior management of the Company.

24 ANNUAL REPORT 2016B
oard
of
Dir
ecto
rsM
emb
ersh
ip a
nd
mee
tin
gs
of t
he
Com
mit
tees
The
com
posi
tion
of
the
Boa
rd a
nd B
oard
Com
mit
tees
, num
ber
of m
eeti
ngs
held
dur
ing
the
fina
ncia
l yea
r en
ded
31
Dec
embe
r 2
016
, inc
ludi
ng n
umbe
r of
mee
ting
s co
nven
ed
by t
he B
oard
and
eac
h B
oard
Com
mit
tee
wit
h th
e at
tend
ance
of
each
mem
ber
are
as f
ollo
ws:
Boa
rd C
omp
lian
ce
B
oard
B
oard
B
oard
&
Ris
k
Boa
rd
Au
dit
N
omin
atio
ns
Rem
un
erat
ion
M
anag
emen
t In
vest
men
t
B
oard
Co
mm
itte
e Co
mm
itte
e Co
mm
itte
e Co
mm
itte
e Co
mm
itte
e
(A
tten
danc
e /
Num
ber
of M
eeti
ngs)
Dat
o’ M
ohd.
Sal
lehu
ddin
bin
Oth
man
(C
hair
man
)
(Inde
pend
ent
Non
-Exe
cutiv
e D
irect
or)
6/6
4
/4
4/4
2
/2
4/4
6
/6
Dat
uk S
eri D
r N
ik N
orzr
ul T
hani
bin
N H
assa
n T
hani
(Cha
irm
an)
(Cha
irm
an)
(Inde
pend
ent
Non
-Exe
cutiv
e D
irect
or)
6/6
3
/4
4/4
1
/1
4/4
-
Mr
Hit
oshi
Kit
agaw
a
(Cha
irm
an)
(Inde
pend
ent
Non
-Exe
cutiv
e D
irect
or)
5/6
2
/4
4/4
2
/2
3/4
-
Ms
Pea
rl C
han
Siew
Che
ng
(Cha
irm
an)
(C
hair
man
)
(Inde
pend
ent
Non
-Exe
cutiv
e D
irect
or)
6/6
4
/4
4/4
-
4/4
6
/6
Ms
Loh
Gua
t La
n
(Non
-Ind
epen
dent
Non
-Exe
cutiv
e D
irect
or)
6/6
-
- -
- 6
/6
Mr
Ala
n Jo
hn W
ilson
(Exe
cutiv
e D
irect
or)
6/6
-
4/4
1
/1
- -
Mr
Chua
Sec
k G
uan
(Chi
ef E
xecu
tive
Offi
cer/
Exec
utiv
e D
irect
or)
6
/6
- -
- -
6/6
Mr
Koi
chi N
agas
e(D
eput
y Ch
ief E
xecu
tive
Offi
cer)
- -
- -
- 5
/6

ANNUAL REPORT 2016 25
Board of Directors (continued)
Profiles of Directors
The profiles of the Directors of the Company are as follows:
Dato’ Mohd. Sallehuddin bin Othman(Chairman / Independent Non-Executive Director)
Dato’ Mohd. Sallehuddin bin Othman joined MSIG Insurance (Malaysia) Bhd as an Independent Non-Executive Director in 2005 and was appointed as the Chairman of the Board in March 2014. He holds professional accounting qualifications in Association of Chartered and Certified Accountants (ACCA) and Chartered Institute of Management Accountants (CIMA), United Kingdom. He also graduated with a Master’s Degree from City University, London in 1975. He is registered as a Chartered Accountant with Malaysia Institute of Accountants in 1981 and became a Fellow member of ACCA in 1983.
Dato’ Mohd. Sallehuddin bin Othman began his career with brief stints in various audit firms in Malaysia and United Kingdom, a statutory body and a major Government linked company in Malaysia before joining the Asian Development Bank based in Manila, Philippines from 1981 to 1986.
Upon returning to Malaysia in 1986, he joined Permodalan Nasional Berhad in senior positions doing corporate services and human resources until 1994. From mid-1994 to 2000, Dato’ Mohd. Sallehuddin was with UMW Holdings Berhad initially as Executive Director and subsequently as Group Managing Director. From 2001 until his retirement in 2006, he served as Group Managing Director of Malaysian Industrial Finance Berhad.
Post retirement, Dato’ Mohd. Sallehuddin has served as an Independent Non-Executive Director of a few companies including a foreign Islamic bank. Currently, apart from MSIG Insurance (Malaysia) Bhd, he is an Independent Director of a number of companies, notably Axa Affin Life Insurance Berhad and Bank of Tokyo-Mitsubishi UFJ (M) Berhad.
Datuk Seri Dr Nik Norzrul Thani bin N Hassan Thani(Independent Non-Executive Director)
Datuk Seri Dr Nik Norzrul Thani bin N Hassan Thani was appointed as Director of MSIG Insurance (Malaysia) Bhd on 16 March 2009.
He holds a Ph.D in Law from the School of Oriental and African Studies (SOAS), University of London and a Masters in Law from Queen Mary College, University of London. He read law at the University of Buckingham, United Kingdom.
Datuk Seri Dr Nik also holds a Post-Graduate Diploma in Syariah Law and Practice (with distinction) from the International Islamic University Malaysia. A Barrister of Lincoln’s Inn and an Advocate and Solicitor of the High Court of Malaya, he was called to the Bar of England and Wales in 1985 and to the Malaysian Bar in 1986. He was previously a Visiting Fulbright Scholar, Harvard Law School and a Chevening Fellow at the Oxford Centre of Islamic Studies. Datuk Seri Dr Nik is a Fellow of the Financial Services Institute of Australasia (FINSIA).
Currently, Datuk Seri Dr Nik is the Chairman and Senior Partner of Zaid Ibrahim & Co. Prior to joining Zaid Ibrahim & Co., Datuk Seri Dr Nik was with Baker & McKenzie (International Lawyers), Singapore.
His directorships in other companies are as Director of Fraser & Neave Holdings Bhd, Al Rajhi Banking & Investment Corporation (Malaysia) Bhd, UMW Holdings Bhd, T7 Global Berhad, Ranhill Holdings Bhd, Chin Hin Group Berhad and Amanah Saham Nasional Berhad.
Mr Hitoshi Kitagawa(Independent Non-Executive Director)
Mr Hitoshi Kitagawa joined the Board of MSIG Insurance (Malaysia) Bhd as an Independent Non-Executive Director on 18 March 2014. Mr Kitagawa is currently the Managing Director of Toyota Tsusho (Malaysia) Sdn Bhd. Prior to this, he was the Group Leader of Techno Park Management Group of Toyota Tsusho Corporation since 2011.
As a graduate from Meiji University Japan, he joined Toyota Tsusho Corporation, Japan in 1981. Mr Kitagawa has more than 35 years of working experience in the machinery, global logistics and assisting the auto parts manufacturers’ global operation during his tenure in Toyota Tsusho Corporation. He also had an overseas posting where he worked in Thailand Office in Bangkok from 2005 to 2011.

26 ANNUAL REPORT 2016
Board of Directors (continued)Profiles of Directors (continued)
Ms Pearl Chan Siew Cheng (Independent Non-Executive Director)
Pearl Chan Siew Cheng joined the Board of MSIG Insurance (Malaysia) Bhd on 18 March 2014 as an Independent Non-Executive Director. She has 31 years of experience in the Malaysian fund management industry, having managed institutional money such as government funds, insurance funds, pension funds, charitable foundations and unit trust funds throughout her career.
Prior to her retirement in January 2008, she was the Deputy Chief Executive Officer of CIMB Principal Asset Management for one year, after a merger between CIMB and the Southern Bank Group. Before that, she pioneered SBB Asset Management, a wholly-owned subsidiary of the Southern Bank Group, which became the first commercial bank in Malaysia to have an asset management arm. She held the position of CEO for 17 years, and CEO/Chief Investment Officer for the first 14 years, leading a team of equity and fixed income fund managers. Before setting up SBB Asset Management, she was General Manager of Rashid Hussain Asset Management and fund manager with Bumiputra Merchant Bankers Berhad for a total of 13 years.
During her career, she also spearheaded two major corporate integration exercises in 2003 & 2007, where she successfully completed the entire integration process, involving organisation and governance structures, human resources, administrative and technical systems. She is a graduate in Economics from the University of Nottingham, England.
Ms Loh Guat Lan(Non-Independent Non-Executive Director)
Loh Guat Lan joined the Board of MSIG Insurance (Malaysia) Bhd as Non-Independent Non-Executive Director on 1 October 2010. She is currently the Group Managing Director / Chief Executive Officer of Hong Leong Assurance Berhad (HLA), a subsidiary of HLA Holdings Sdn Bhd (HLAH) wholly-owned by Hong Leong Financial Group Berhad (HLFG), the financial services arm of Hong Leong Group Malaysia. She is also a director of Hong Leong MSIG Takaful Berhad.
She was appointed to the position on 1 September 2009. She holds a Bachelor’s Degree in Nutrition Science and is a fellow member of Life Management Institute (FLMI), Customer Service Management (CSM) and Life Office Management (LOMA). She is also a Certified Financial Planner (CFP) and Registered Financial Planner (RFP).
Her last role prior to joining HLA as the Chief Operating Officer (Life Division) was Vice President & Senior Director of Agency (Malaysia). She has over 26 years of experience in the insurance industry.
Mr Alan John Wilson(Executive Director)
Mr Alan Wilson has helmed the Singapore-based Asia regional holding office of Mitsui Sumitomo Insurance Company (MSIG) as Regional CEO since 2008. In his capacity as Regional CEO, he also serves as Chairman or Director (or equivalent) on the Boards of 13 MSIG companies around the region. Under Mr Wilson’s leadership, the MSIG network in Asia has now expanded to 17 markets. In April 2015, Mr Wilson was honoured to be appointed as the first foreign Executive Officer, Mitsui Sumitomo Insurance Co Ltd (Japan). Mr Wilson has a sound executive management track record and has over 30 years of experience in the general insurance industry.
Prior to joining MSIG Asia, Mr Wilson was the Asia CEO at Allianz from 1999. He assumed overall responsibility for managing over 20 general, life and health insurance operations across 14 countries and later served on several Boards for Allianz and for other groups such as Parkway in Asia. Mr Wilson joined Allianz from Guardian Royal Exchange Assurance Group where he was Asia Managing Director. Over the course of his 21 years there, he held various senior positions with progressive responsibilities, where he managed general and life insurance business in 11 countries.
A British national and a Singaporean Permanent Resident, Mr Wilson has lived and worked in Asia since 1982 in various places, including Hong Kong, Indonesia, Pakistan and Singapore.
Mr Wilson is also Chairman of MSIG Berhad.
Mr Chua Seck Guan(Chief Executive Officer/Executive Director)
Mr Chua Seck Guan was appointed as the Chief Executive Officer and Executive Director of MSIG Insurance (Malaysia) Bhd on 1 April 2010. A Senior Associate and Certified Insurance Professional from the Australian and New Zealand Institute of Insurance and Finance, he has vast experience in General Insurance operations having served 34 years with the Company. He provides the leadership and played key strategic and operational roles in charting the Company’s growth to its current revenue and profit level, and positioned MSIG as one of the leaders in the industry. He was also instrumental in leading MSIG to be the General Insurance Company of The Year 2015, awarded by the Asia Insurance Review.
He is currently the Deputy Chairman of PIAM Management Committee and sits in the Board of Malaysia Rating Corporation Berhad (MARC), Ombudsman for Financial Services and MSIG Berhad.

ANNUAL REPORT 2016 27
Board of Directors (continued)
Trainings attendedThe trainings attended by the Directors are as follows:-
• A dialogue on “The New and Revised Auditor Reporting Standards: Implications to Financial Institutions”• Special Invitation to Industry Briefing on Directors Register Implementation• 3rd BNM - FIDE FORUM Annual Dialogue with the Governor of Bank Negara• Launch of FIDE Forum’s Directors Register• FIDE Core Programme Module B – Insurance• FinTech: Business Opportunity or Disruptor by Markus Gnirck and Veiverne Yuen• Technology-based Innovation that Counts by Steven Lewis, Patrick Menard and Shankar Kanabiran, Ernst & Young• MSIG In-House Directors’ Training
Responsibilities of the Board and Board Committees (A) The roles and responsibilities of the Board are as follows:
(i) Approve the risk appetite, business plans and other initiatives which would, singularly or cumulatively, have a material impact on the Company’s risk profile.
(ii) Oversee the selection, performance, remuneration and succession plans of the CEO, control function heads and other members of senior management, such that the Board is satisfied with the collective competence of senior management to effectively lead the operations of the Company.
(iii) Oversee the implementation of the Company’s governance framework and internal control framework, and periodically review whether these remain appropriate in light of material changes to the size, nature and complexity of the Company’s operations.
(iv) Promote, together with senior management, a sound corporate culture within the Company which reinforces ethical, prudent and professional behavior.
(v) Promote sustainability through appropriate environmental, social and governance considerations in the Company’s business strategies.
(vi) Oversee and approve the recovery and resolution as well as business continuity plans for the Company to restore its financial strength, and maintain or preserve critical operations and critical services when it comes under stress.
(vii) Promote timely and effective communication between the Company and Bank Negara Malaysia on matters affecting or that may affect the safety and soundness of the Company.
(B) The roles and responsibilities of the Board Committees are as follows:
Board Audit CommitteeThe Board Audit Committee’s primary role is to support the Board in ensuring that there is a reliable and transparent financial reporting process within the Company. In addition, providing oversight over the external auditor to foster a quality audit. In fulfilling this role, the Board Audit Committee must:
(i) Review and approve the audit plan including its scope, procedures and frequency.
(ii) Review and approve the Audit Charter and budget of the Internal Audit Department and to ensure that the Internal Audit Department is distinct and has the appropriate status within the overall Company structure for the internal auditors to achieve their audit objectives.
(iii) Review key audit reports and ensure that Senior Management is taking necessary corrective actions in a timely manner to address control weaknesses, non-compliance with laws, regulatory requirements, policies and other problems identified by the Internal Audit and other control functions.
(iv) Note any significant disagreements between the Chief Internal Auditor and the rest of the Senior Management, irrespective of whether these have been resolved, in order to identify any impact that the disagreements may have on the audit process or findings.
(v) Advice on the appointment, remuneration, performance, evaluation, removal and redeployment of the Chief Internal Auditor and senior officers of the internal audit functions.
(vi) Establishing a mechanism to assess the performance and effectiveness of the internal audit function.
(vii) Make recommendations to the Board on the appointment, removal and remuneration of the external auditor.
(viii) Monitor and assess the independence of the external auditor including approving the provision of non-audit services by the external auditor.

28 ANNUAL REPORT 2016
Responsibilities of the Board and Board Committees (continued)
Board Audit Committee (continued)
(ix) Monitor and assess the effectiveness of the external audit, including by meeting with the external auditor without the presence of senior management at least annually.
(x) Maintain regular, timely, open and honest communication with the external auditor, and requiring the external auditor to report to the Board Audit Committee on significant matters.
(xi) Ensure that Senior Management is taking necessary corrective actions in a timely manner to address external audit findings and recommendations.
(xii) Review and update the Board on all related party transactions.
(xiii) Review the accuracy and adequacy of the Chairman’s statement in the directors’ report, corporate governance disclosure, interim financial reports and preliminary announcements in relation to the preparation of financial statements.
(xiv) Monitor compliance with the Board’s conflicts of interest policy.
(xv) Review third-party opinions on the design and effectiveness of the Company’s internal control framework.
(xvi) Other functions as may be determined by the Board.
Board Nominations Committee
(i) To establish minimum requirements for the Board of Directors and the Chief Executive Officer to perform their responsibilities effectively as well as to oversee the overall composition of the Board in terms of the appropriate size and mix of skills, the balance between Executive, Non-Executive and Independent Directors and other core competencies required.
(ii) To assess and recommend the nominees for Board and Board Committees, as well as nominees for the position of Chief Executive Officer. This includes assessing Directors and the Chief Executive Officer proposed for re-appointment, before an application for approval is submitted to Bank Negara Malaysia.
(iii) To establish a mechanism for formal assessment on the effectiveness of the Board as a whole, the contribution by each Director to the effectiveness of the Board, the contribution of the Board Committees and the performance of the Chief Executive Officer. The assessments should also include ascertaining that the Director is not disqualified under the relevant law and fulfill the “fit and proper” criteria.
(iv) To recommend to the Board on the removal of a Director / Chief Executive Officer if he is ineffective, errant or negligent in discharging his responsibilities.
(v) To ensure that all Directors undergo appropriate induction programmes and receive continuous trainings.
(vi) To oversee the appointment, management succession planning and performance evaluation of Senior Management and recommend to the Board on the removal of Senior Management if they are ineffective, errant or negligent in discharging their responsibilities.
(vii) To ensure that processes are in place to facilitate and monitor the effective transfer of knowledge and expertise from expatriates employed in Senior Management and specialist positions to the staff of the Company as well as the industry generally.
(viii) To ensure all Key Responsible Persons fulfill the “fit and proper” criteria and conducting assessment of the fitness and propriety of Key Responsible Persons and the Company Secretary.
Board Remuneration Committee
(i) To recommend a framework for the remuneration of Directors and Senior Management.
(ii) To recommend specific remuneration packages for Directors and Senior Management.
(iii) To ensure compliance with BNM Risk Governance Policy Document (Principle 10) which states that the Executive remuneration must be aligned with prudent risk-taking and appropriately adjusted for risks.

ANNUAL REPORT 2016 29
Responsibilities of the Board and Board Committees (continued)
Board Compliance & Risk Management Committee
Compliance
(i) Promoting a positive, open and consistent Compliance culture and monitoring the overall compliance with applicable laws, rules and regulations as well as operational manuals.
(ii) Reviewing and assessing the adequacy and effectiveness of the Compliance policies and processes through an appropriate and clear framework of accountability, reporting and controls, including ensuring adequate infrastructure, resources and systems are in place.
(iii) Reviewing and recommending the Company’s Compliance Policy, Compliance Manual and Compliance Program for the Board of Directors’ approval.
(iv) Reviewing and assessment of Compliance with Bank Negara Malaysia (“BNM”) / Persatuan Insurans Am Malaysia (“PIAM”) guidelines / circulars and MSIG Policies in pursuant to Financial Services Act, 2013 requirements.
(v) Reviewing the Management’s periodic Compliance reports and checklists, including Risk Treatment Plans (RTP), Complaint reporting as well as disclosure in regard to Compliance activities in the Company’s Annual Report.
Risk Management
(i) Ensuring effective implementation of expectations in pursuant to Policies for Risk Governance under BNM/ RH/GL/013-5.
(ii) Reviewing and recommending Risk Management strategies, policies and risk tolerance levels for the Board’s approval.
(iii) Reviewing and assessing the adequacy of the Risk Management policies and framework for identifying, measuring, monitoring and controlling risks as well as the extent to which these are operating effectively.
(iv) Ensuring that adequate infrastructure, resources and systems are in place for effective Risk Management e.g. ensuring that the staff responsible for implementing Risk Management systems perform those duties independently of the Company’s risk taking activities.
(v) Reviewing the periodic reports on risk exposure, risk portfolio composition, independent assessment and Risk Management activities, including disclosure in regard to Risk Management activities in the Company’s Annual Report.
(vi) Reviewing activities as well as Risk Appetite Statement, Individual Target Capital Level (“ITCL”) Review Report and Capital Management Plan (A.k.a. ICAAP Report) regularly as required under BNM/RH/GL/003-29.
(vii) Reviewing the Stress Testing progress and corrective action plan to comply with BNM/RH/GL/003-23.
(viii) Reviewing activities and reports in regard to the Risk Management Framework on Outsourcing in compliance with BNM/RH/GL/003-4.
(ix) Reviewing and providing direction on the Internal Control Program (ICP).
The Board Compliance & Risk Management Committee is supported by the Compliance & Risk Management Working Committee comprising the Chief Executive Officer, Deputy Chief Executive Officer and Senior Management Team. To effect a more focused attention on management of compliance risks as prescribed by the BNM Policy Document on Compliance, and on enterprise risk management at the management level, the Board Committee endorsed at the last meeting two management committees, namely the Compliance Committee and the Enterprise Risk Management Committee in supporting the Board Committee.
Board Investment Committee
(i) Review and advise on Investment strategies and policies with a view to optimise investment performance in line with MSIG’s Investments Risk Appetite Statement.
(ii) Review and monitor the Investment Assets Allocation within the risk and limit permitted under the Investment Policy, BNM Guidelines and RBC framework, at least on an annual basis.
(iii) Review and approve the exposure limits for counterparties for Deposits placements.
(iv) Manage and monitor risks associated with investment activities with a view to strengthening the Capital Adequacy Ratio whilst optimising risk adjusted returns.
(v) Ensure proper execution and monitoring of investments by having adequate internal controls for investment assets management, including approval of counterparty limits.

30 ANNUAL REPORT 2016
Responsibilities of the Board and Board Committees (continued)
Board Investment Committee (continued)
(vi) Review and approve the Investment Plan.
(vii) Set Performance Standards for external Fund Managers and review their actual performance on a regular basis.
(viii) Review and approve the appointment / termination of external Fund Managers, including the Custodians for safekeeping of assets.
(ix) Ensure compliance with the Regional Investment Policy, BNM’s requirements, as well as in compliance with legal, accounting, prudential and liquidity requirements.
Internal control framework• The Company has established an Internal Control Programme (“ICP”) comprising of Company Level Control and
Process Level Control Documentation to ensure Internal Controls on significant key risk areas in regard to Financial Reporting are adequately designed, documented and functioning effectively at all times.
• ICP is an annual exercise entailing review and update of the ICP documentation of the Company’s operational processes and controls that include compliance with the requirement of relevant laws and regulations.
• It is subject to independent Testing of Design and Operating Effectiveness on annual basis for the evaluation on Internal Control Over Financial Reporting (“ICOFR”) to provide assurance on reliability of Financial Reporting.
• The internal control requirement on the key risk areas and compliance with relevant laws and regulations will be embedded in the Company’s new Business Process Management system.
• The Risk Management Independent Risk Assessment focusing on the business units’ risk management and governance is performed annually.
• The Company’s outsourcing arrangements and Outsourcing Policy & Procedures are reviewed periodically to ensure compliance with the Guidelines on Outsourcing for Insurers issued by Bank Negara and its effectiveness in managing the Company’s outsourcing activities.
• Besides the framework for internal controls and procedures, the Company puts in place an organisation structure that clearly defines the segregation of roles, responsibilities and authority in the Company.
RemunerationRemuneration Policy
The Company adopts a fair and competitive Remuneration Policy where rewards commensurate with position responsibilities and individual performance of the job, and to avoid directors and employees from engaging in excessive or inappropriate risk taking.
It is also guided by equal opportunities principles and principles to balance risk and incentives associated with remuneration in order to ensure a sound and appropriate design and operation of the remuneration framework.
Performance and job sizes will be assessed by the consistent application of an objective process to establish job weight and its relative value in the organisation, taking into account the incumbent’s experience, performance and the positions’ potential risk exposure, ensuring equitable remuneration practices for both existing and new employees.
Remuneration Policy’s Key Objectives
1. Success of the organisation is built on a true performance culture. Individual contributions must be recognized and rightfully rewarded to enable the organisation to continue to attract and retain quality staff that will support the Company’s operations.
2. The Company believes that an equitable and competitive Remuneration Policy, balanced with the appropriate management of risk exposure will establish the Company as a sustainable and preferred employer, helping us to recruit and motivate employees to deliver business success and build a performance culture.
3. The policy provides a consistent framework to develop the Company’s pay policy within the context of statutory requirements, market conditions and business challenges.

ANNUAL REPORT 2016 31
Remuneration (continued)
Scope of Remuneration Policy
Scope covers all members of staff (including but not limited to permanent employee, contract and temporary staff).
The policy however excludes expatriates assigned to the Company.
Senior Management members comprises of:
1. Chief Executive Officer
2. Executive Vice President – HR, L&D, Marketing, Business Excellence, Accident & Health Underwriting
3. Senior Vice President – Finance, Planning & Actuarial
4. Senior Vice President – Underwriting (Commercial Lines), Claims & Reinsurance
5. Senior Vice President – IT, E Commerce & Business Intelligence
6. Senior Vice President – Compliance & Enterprise Risk Management
7. Senior Vice President – Agency & Motor Franchise
8. Senior Vice President – Branch Operations Support, PSD, Motor Underwriting & Administration
Risk Governance
In compliance with Bank Negara Malaysia Policy Document on Risk Governance, the Company has also incorporated the Principle 10 into its remuneration structure where executive remuneration is aligned with prudent-risk taking and appropriately adjusted for risks.
A guided performance management process is in place to ensure that the payments of variable remuneration are conducted in accordance with the Remuneration Policy.
At this juncture, the Company is satisfied with the existing remuneration structure and performance management process to meet the objectives of the Company’s Remuneration Policy. The Company will review the remuneration framework to ensure it continues to meet the Company’s long term objectives.
Remuneration for employees in control functions are structured in a way that is principally based on the achievement of their control objectives and does not compromise their independence.
Pay structure is designed to consider all types of risks and long-term benefits of the Company. Specifically such structure is determined by using market data for the level of remuneration that is sourced from external consultants and by taking into account conditions (such as business structure, organisation, legal system, employment / pay structure / practices), financial position of the entity, existing and potential risks, and the roles and tasks of the jobs.
The Company’s key risks are identified through the Risk Management Framework and the Company’s 3 year Business Plan, which includes actions plans. Such actions are incorporated into the performance measurements of employees to enforce the performance and competencies through remuneration measures.
In 2016, there were no specific changes to the nature and type of measures.
Performance Management System
The Company uses a comprehensive performance measurement framework that incorporates both financial and non-financial performance in determining the size and allocation of the variable remuneration under the Company’s Short Term Incentive Plan (STI).
The financial matrix links the STI to the profits, revenue and other performance measurements of the Company as a whole, and the contributions of the employee in deciding the quantum.
The non-financial matrix captures the performance of the qualitative aspects such as the compliance of Risk Management Policy, adherence to legal, regulatory and other ethical standards, customer’s satisfaction, effectiveness and efficiency of support functions.
The overall assessment of the Individual is a combination of Individual Performance and Competencies. The overall scores will be given a weightage which falls into a structured performance banding ranging from Outstanding Performance, Strong Performance, Effective Performance, Marginal Performance and Unsatisfactory Performance. This ensures the employees are appropriately assessed and compensated at the level corresponding to the performance.
For Unsatisfactory Performance, this would impact the salary / bonus of the affected employees and in certain circumstances the Company would not grant bonus or increase in salary.

32 ANNUAL REPORT 2016
Remuneration (continued)
Remuneration Structure
The Company’s Remuneration Policy is limited to cash and benefits-in-kind which commensurate with the position of the officers. There are no shares and/or share-linked instruments, deferring or vesting as part of its remuneration framework.
The Company’s Remuneration Policy does not accord the following:-
1. Deferral and/or vesting of variable remuneration.
2. Deferred remuneration with claw-back arrangements.
The breakdowns of the total amount of remuneration awards to the Senior Management for the financial year are as follows:
Total Value of Remuneration Awards for the Financial Year
UnrestrictedRM
DeferredRM
Fixed remuneration
• Cash-based 4,507,611 Nil
• Shares and share-linked instruments Nil Nil
• Others Nil Nil
Variable remuneration
• Cash-based 991,252 Nil
• Shares and share-linked instruments Nil Nil
• Others Nil Nil
TOTAL 5,498,863 Nil
Auditors
The auditors, KPMG PLT (converted from a conventional partnership, KPMG, on 27 December 2016), have indicated their willingness to accept re-appointment.
The auditors’ remuneration is disclosed in note 25 to financial statements.
Signed on behalf of the Board of Directors in accordance with a resolution of the Directors:
……………………………………….........................................………………… Dato’ Mohd. Sallehuddin bin Othman
……………………………………….........................................………………… Chua Seck Guan
Kuala Lumpur,Date: 21 March 2017

ANNUAL REPORT 2016 33
as at 31 December 2016Statement of financial position
Note 2016 2015 RM’000 RM’000Assets
Plant and equipment 3 23,272 18,036Investment property 4 141 146Goodwill 5 1,141,224 1,141,224Available-for-sale financial assets 6 1,342,506 1,277,800Deferred tax assets 7 12,292 9,664Reinsurance assets 8 440,744 547,902Loans and receivables, excluding insurance receivables 9 1,209,716 1,205,228Insurance receivables 10 194,259 217,613Deferred acquisition costs 11 74,414 77,191Cash and cash equivalents 12 173,614 138,150
Total assets 4,612,182 4,632,954
Equity and liabilities Share capital 13 333,143 333,143Reserves 2,214,810 2,068,238
Total equity 2,547,953 2,401,381
Insurance contract liabilities 15 1,848,749 1,975,730Other financial liabilities 16 20,374 30,281Insurance payables 17 117,974 152,525Other payables 18 62,707 61,098Tax payable 14,425 11,939
Total liabilities 2,064,229 2,231,573
Total equity and liabilities 4,612,182 4,632,954
The notes on pages 37 to 88 are an integral part of the financial statements.

34 ANNUAL REPORT 2016
Note 2016 2015 RM’000 RM’000
Operating revenue 19 1,638,304 1,566,567
Gross written premiums 15.2 1,522,503 1,535,370Change in unearned premiums provision 19,062 (54,088)
Gross earned premiums 1,541,565 1,481,282
Gross written premiums ceded to reinsurers 15.2 (294,863) (301,740)Change in unearned premiums provision (1,723) 8,874
Premiums ceded to reinsurers (296,586) (292,866)
Net earned premiums 1,244,979 1,188,416
Investment income 20 96,739 85,285Realised gains and losses 21 9,704 3,494Commission income 22 43,682 50,926Other operating income/(expenses) 23 358 (480)
Other income 150,483 139,225
Gross claims paid 15.1 (926,567) (781,019)Claims ceded to reinsurers 15.1 238,968 147,929Gross change in contract liabilities 107,919 (99,253)Change in contract liabilities ceded to reinsurers (105,435) 49,710
Net claims incurred 24 (685,115) (682,633)
Commission expense 22 (186,527) (175,915)Management expenses 25 (210,270) (207,258)
Other expenses (396,797) (383,173)
Profit before tax 313,550 261,835Tax expense 27 (64,750) (61,735)
Profit for the year 248,800 200,100
Other comprehensive income Items that may be reclassified subsequently to profit or loss
Net (loss)/gain on fair value of available-for-sale financial assets (3,017) 3,764Tax effect 07 732 (940)
Other comprehensive (loss)/income for the year, net of tax (2,285) 2,824 Total comprehensive income for the year 246,515 202,924 Basic earnings per share (sen) 28 74.7 60.1
The notes on pages 37 to 88 are an integral part of the financial statements.
for the year ended 31 December 2016Statement of profit or loss and other comprehensive income

ANNUAL REPORT 2016 35
for
the
year
end
ed 3
1 D
ecem
ber
201
6St
atem
ent
of c
hang
es in
equ
ity
Shar
e Sh
are
Fair
val
ue
R
etai
ned
To
tal
cap
ital
p
rem
ium
re
serv
e ea
rnin
gs
equ
ity
N
ote
RM
’00
0
RM
’00
0
RM
’00
0
RM
’00
0
RM
’00
0
At
1 Ja
nu
ary
20
15
333
,143
1
,17
8,4
03
(2
,23
5)
78
9,0
89
2
,29
8,4
00
Fair
val
ue o
f av
aila
ble-
for-
sale
fina
ncia
l ass
ets
-
- 2
,824
-
2,8
24
Tota
l oth
er c
ompr
ehen
sive
inco
me
for
the
year
- -
2,8
24
- 2
,824
Pro
fit
for
the
year
- -
- 2
00
,10
0
20
0,1
00
Tota
l com
preh
ensi
ve in
com
e fo
r th
e ye
ar
-
- 2
,824
2
00
,10
0
20
2,9
24D
ivid
ends
pai
d du
ring
the
yea
r 2
9
- -
- (9
9,9
43)
(99
,943
)
At
31
Dec
emb
er 2
01
5/1
Jan
uar
y 2
01
6
3
33
,14
3
1,1
78
,40
3
58
9
88
9,2
46
2
,40
1,3
81
Fair
val
ue o
f av
aila
ble-
for-
sale
fina
ncia
l ass
ets
-
- (2
,28
5)
- (2
,28
5)
Tota
l oth
er c
ompr
ehen
sive
loss
for
the
yea
r
- -
(2,2
85
) -
(2,2
85
)P
rofi
t fo
r th
e ye
ar
-
- -
248
,80
0
248
,80
0
Tota
l com
preh
ensi
ve (l
oss)
/ in
com
e fo
r th
e ye
ar
-
- (2
,28
5)
248
,80
0
246
,51
5D
ivid
ends
pai
d du
ring
the
yea
r 2
9
- -
- (9
9,9
43)
(99
,943
)
At
31
Dec
emb
er 2
01
6
3
33
,14
3
1,1
78
,40
3
(1,6
96
) 1
,03
8,1
03
2
,54
7,9
53
Not
e 1
3
N
ote
14.1
N
ote
14.2
The
not
es o
n pa
ges
37
to
88
are
an
inte
gral
par
t of
the
fina
ncia
l sta
tem
ents
.
Dis
trib
uta
ble
/ -----
- Non
-dis
trib
uta
ble
------
/

36 ANNUAL REPORT 2016
Note 2016 2015 RM’000 RM’000
Cash flows from operating activitiesProfit before tax 313,550 261,835Adjustments for: Depreciation of plant and equipment 3 6,514 6,599 Depreciation of investment property 5 4 Investment income 20 (96,739) (85,285) Realised gains recorded in profit or loss 21 (9,704) (3,494) Purchase of available-for-sale financial assets 6 (1,523,716) (1,413,142) Proceeds from disposal of available-for-sale financial assets 1,457,046 1,095,032 Retirement gratuities charged 673 755 Unrealised foreign exchange loss 90 63
Operating profit/(loss) before changes in working capital 147,719 (137,633)Change in reinsurance assets 107,158 (58,584)Change in insurance receivables 23,354 (29,616)Change in deferred acquisition costs 2,777 (5,815)Change in loans and receivables (3,983) 118,268Change in insurance contract liabilities (126,981) 153,341Change in other financial liabilities (9,952) 2,779Change in insurance payables (34,573) 33,525Change in other payables 943 (8,068)
Cash generated from operating activities 106,462 68,197Dividend income received 26,808 16,672Interest income received 77,822 73,996Income tax paid (64,161) (59,733)
Net cash flows from operating activities 146,931 99,132
Cash flows from investing activities Proceeds from disposal of plant and equipment 284 716Proceeds from disposal of assets classified as held for sale - 77Purchase of plant and equipment (11,800) (4,202)
Net cash flows used in investing activities (11,516) (3,409)
Cash flows from financing activities Dividend paid 29 (99,943) (99,943)Repayment of finance lease 18.1 (8) (36)
Net cash flows used in financing activities (99,951) (99,979) Net increase/(decrease) in cash and cash equivalents 35,464 (4,256)Cash and cash equivalents at beginning of year 138,150 142,406
Cash and cash equivalents at end of year 12 173,614 138,150
The notes on pages 37 to 88 are an integral part of the financial statements.
for the year ended 31 December 2016Statement of cash flows

ANNUAL REPORT 2016 37
Notes to the financial statementsMSIG Insurance (Malaysia) Bhd is a public limited liability company, incorporated and domiciled in Malaysia. The addresses of its registered office and principal place of business are as follows:
Registered officePlaza 138, Suite 18.0318th Floor, 138 Jalan Ampang,50450 Kuala Lumpur.
Principal place of businessLevel 15, Menara Hap Seng 2, Plaza Hap Seng,No. 1, Jalan P.Ramlee,50250 Kuala Lumpur.
The Company is principally engaged in the underwriting of all classes of general insurance business. There has been no significant change in the nature of these activities during the financial year.
The immediate holding company is MSIG Holdings (Asia) Pte. Ltd., a company incorporated in Singapore. The penultimate and ultimate holding companies are Mitsui Sumitomo Insurance Co., Ltd. and MS&AD Insurance Group Holdings, Inc., respectively. Both companies are incorporated in Japan.
The financial statements were authorised for issue by the Board of Directors on 21 March 2017.
1. Basis of preparation(a) Statement of compliance
The financial statements of the Company have been prepared in accordance with Malaysian Financial Reporting Standards (“MFRS”), International Financial Reporting Standards, the requirements of the Companies Act, 1965 and the Financial Services Act, 2013 in Malaysia.
The following are accounting standards, amendments and interpretations that have been issued by the Malaysian Accounting Standards Board (“MASB”) but have not been adopted by the Company:
MFRSs, Interpretations and amendments effective for annual periods beginning on or after 1 January 2017
• Amendments to MFRS 12, Disclosure of Interests in Other Entities (Annual Improvements to MFRS Standards 2014-2016 Cycle)
• Amendments to MFRS 107, Statement of Cash Flows – Disclosure Initiative
• Amendments to MFRS 112, Income Taxes – Recognition of Deferred Tax Assets for Unrealised Losses MFRSs, Interpretations and amendments effective for annual periods beginning on or after
1 January 2018
• MFRS 9, Financial Instruments (2014)
• MFRS 15, Revenue from Contracts with Customers
• Clarifications to MFRS 15, Revenue from Contracts with Customers
• IC Interpretation 22, Foreign Currency Transactions and Advance Consideration
• Amendments to MFRS 1, First-time Adoption of Malaysian Financial Reporting Standards (Annual Improvements to MFRS Standards 2014-2016 Cycle)
• Amendments to MFRS 2, Share-based Payment – Classification and Measurement of Share-based Payment Transactions
• Amendments to MFRS 4, Insurance Contracts – Applying MFRS 9 Financial Instruments with MFRS 4 Insurance Contracts
• Amendments to MFRS 128, Investments in Associates and Joint Ventures (Annual Improvements to MFRS Standards 2014-2016 Cycle)
• Amendments to MFRS 140, Investment Property – Transfers of Investment Property
MFRSs, Interpretations and amendments effective for annual periods beginning on or after 1 January 2019
• MFRS 16, Leases

38 ANNUAL REPORT 2016
1. Basis of preparation (continued)
(a) Statement of compliance (continued)
MFRSs, Interpretations and amendments effective for annual periods beginning on or after a date yet to be confirmed
• Amendments to MFRS 10, Consolidated Financial Statements and MFRS 128, Investments in Associates and Joint Ventures – Sale or Contribution of Assets between an Investor and its Associate or Joint Venture
The Company plans to apply the abovementioned accounting standards, amendments and interpretations:
• from the annual period beginning on 1 January 2017 for those amendments that are effective for annual periods beginning on or after 1 January 2017, except for Amendments to MFRS 12 which is not applicable to the Company.
• from the annual period beginning on 1 January 2018 for those accounting standards, amendments and interpretation that are effective for annual periods beginning on or after 1 January 2018, except for Amendments to MFRS 2 which is not applicable to the Company.
• from the annual period beginning on 1 January 2019 for the accounting standard that is effective for annual periods beginning on or after 1 January 2019.
The initial application of the accounting standards, amendments or interpretations are not expected to have any material financial impact to the current period and prior period financial statements of the Company except as mentioned below:
MFRS 15, Revenue from Contracts with Customers
MFRS 15 replaces the guidance in MFRS 111, Construction Contracts, MFRS 118, Revenue, IC Interpretation 13, Customer Loyalty Programmes, IC Interpretation 15, Agreements for Construction of Real Estate, IC Interpretation 18, Transfers of Assets from Customers and IC Interpretation 131, Revenue - Barter Transactions Involving Advertising Services. Upon adoption of MFRS 15, it is expected that the timing of revenue recognition of non-insurance contracts might be different as compared with the current practice.
The Company is currently assessing the financial impact that may arise from the adoption of MFRS 15.
MFRS 9, Financial Instruments
MFRS 9 replaces the guidance in MFRS 139, Financial Instruments: Recognition and Measurement on the classification and measurement of financial assets and financial liabilities, and on hedge accounting. Upon adoption of MFRS 9, financial assets will be measured at either fair value or amortised cost.
The Company is currently assessing the financial impact that may arise from the adoption of MFRS 9.
MFRS 16, Leases
MFRS 16 replaces the guidance in MFRS 117, Leases, IC Interpretation 4, Determining whether an Arrangement contains a Lease, IC Interpretation 115, Operating Leases – Incentives and IC Interpretation 127, Evaluating the Substance of Transactions Involving the Legal Form of a Lease.
The Company is currently assessing the financial impact that may arise from the adoption of MFRS 16.
(b) Basis of measurement
The financial statements of the Company have been prepared on the historical cost basis except as disclosed in the financial statements.
(c) Functional and presentation currency
These financial statements are presented in Ringgit Malaysia (“RM”), which is the Company’s functional currency. All financial information is presented in RM and has been rounded to the nearest thousand, unless otherwise stated.
(d) Use of estimates and judgements
The preparation of financial statements requires management to make judgements, estimates and assumptions that affect the application of accounting policies and the reported amounts of assets, liabilities, income and expenses. Actual results may differ from these estimates.
Estimates and underlying assumptions are reviewed on an ongoing basis. Revisions to accounting estimates are recognised in the period in which the estimate is revised and in any future periods affected.

ANNUAL REPORT 2016 39
1. Basis of preparation (continued)
(d) Use of estimates and judgements (continued) There are no significant areas of estimation uncertainty and critical judgements in applying accounting policies
that have a significant effect on the amounts recognised in the financial statements other than those disclosed in the following notes:
• Notes 2(f)(iii) and 5 – Valuation of goodwill
• Note 2(k), 2(l) and 2(p) – Valuation of insurance contract liabilities
2. Significant accounting policiesThe accounting policies set out below have been applied consistently to the periods presented in these financial statements, unless otherwise stated.
(a) Foreign currencyForeign currency transactions
Transactions in foreign currencies are translated to the functional currency of the Company at the exchange rate at the dates of the transactions. Monetary assets and liabilities denominated in foreign currencies at the end of the reporting period date are retranslated to the functional currency at the exchange rate at that date. Non-monetary assets and liabilities denominated in foreign currencies are not retranslated at the end of the reporting date except for those that are measured at fair value, which are retranslated to the functional currency at the exchange rate at the date that the fair value was determined. Foreign exchange differences arising on retranslation are recognised in the profit or loss.
(b) Plant and equipment(i) Recognition and measurement
Items of plant and equipment are measured at cost less any accumulated depreciation and any accumulated impairment losses.
Cost includes expenditures that are directly attributable to the acquisition of the asset and any other costs directly attributable to bringing the asset to working condition for its intended use, and the costs of dismantling and removing the items and restoring the site on which they are located. Purchased software that is integral to the functionality of the related equipment is capitalised as part of that equipment.
When significant parts of an item of plant and equipment have different useful lives, they are accounted for as separate items (major components) of plant and equipment.
The gains or losses on disposal of an item of plant and equipment is determined by comparing the proceeds from disposal with the carrying amount of the plant and equipment and is recognised within “realised gains and losses” in the profit or loss.
(ii) Subsequent costs
The cost of replacing part of an item of plant and equipment is recognised in the carrying amount of the item if it is probable that the future economic benefits embodied within the component will flow to the Company and its cost can be measured reliably. The carrying amount of the replaced component is derecognised to profit or loss. The costs of the day-to-day servicing of plant and equipment are recognised in the profit or loss as incurred.
(iii) Depreciation
Depreciation is recognised in profit or loss on a straight-line basis over the estimated useful lives of each component of an item of plant and equipment from the date that they are available for use. Leased assets are depreciated over the shorter of the lease term and their useful lives unless it is reasonably certain that the Company will obtain ownership by the end of the lease term.
The estimated useful lives for the current and comparative periods are as follows:
• Office equipment 5 years
• Furniture and fittings 6 - 7 years
• Computers 5 years
• Motor vehicles 5 years
Depreciable amount is determined after deducting the residual value.
Depreciation method, useful lives and residual values are reviewed at the end of the reporting period, and adjusted as appropriate.

40 ANNUAL REPORT 2016
2. Significant accounting policies (continued)
(c) Investment property
Investment property carried at cost
Investment property is property which is owned or held under a leasehold interest to earn rentals or for capital appreciation or for both, but not for sale in the ordinary course of business, use in the production or supply of services or for administrative purposes.
Investment property is initially and subsequently measured at cost and is accounted for similarly to plant and equipment.
Cost includes expenditure that is directly attributable to the acquisition of the investment property.
An investment property is derecognised on its disposal, or when it is permanently withdrawn from use and no future economic benefits are expected from its disposal. The difference between the net disposal proceeds and the carrying amount is recognised in profit or loss in the period in which the item is derecognised.
(d) Goodwill
Goodwill arises on business combinations is measured at cost less any accumulated impairment losses. The goodwill arose from the acquisition of general insurance businesses in 2006 and 2010.
Goodwill represents the excess of the cost of the acquisition over the net fair value of the identifiable assets, liabilities and contingent liabilities of the business purchased.
Goodwill is measured at cost and is not amortised. Goodwill is allocated to cash-generating units or a group of cash-generating units and is tested annually for impairment or more frequently if events or changes in circumstances indicate that it might be impaired (see Note 2(f)(iii)).
(e) Financial instruments
(i) Initial recognition and measurement
A financial asset or a financial liability is recognised in the statement of financial position when, and only when, the Company becomes a party to the contractual provisions of the financial instrument.
A financial instrument is recognised initially, at its fair value plus, in the case of a financial instrument not at fair value through profit or loss, transaction costs that are directly attributable to the acquisition or issue of the financial instrument.
(ii) Financial instrument categories and subsequent measurement
The Company categorises and measures financial instruments as follows:
Financial assets
(a) Loans and receivables, excluding insurance receivables
Loans and receivables category comprises debt instruments that are not quoted in an active market and other receivables.
Financial assets categorised as loans and receivables are subsequently measured at amortised cost using the effective interest method.
(b) Available-for-sale (“AFS”) financial assets
Available-for-sale category comprises investment in equity and debt instruments that are not held for trading.
(c) Insurance receivables
Insurance receivables are recognised when due and measured on initial recognition at the fair value of the consideration received or receivable. Subsequent to initial recognition, insurance receivables are measured at amortised cost, using the effective interest method.

ANNUAL REPORT 2016 41
2. Significant accounting policies (continued)
(e) Financial instruments (continued)
(ii) Financial instrument categories and subsequent measurement (continued)
(c) Insurance receivables (continued)
If there is objective evidence that the insurance receivable is impaired, the Company reduces the carrying amount of the insurance receivable accordingly and recognises that impairment loss in profit or loss. The Company gathers the objective evidence that an insurance receivable is impaired using the same process adopted for financial assets carried at amortised costs. The impairment loss is calculated under the same method used for these financial assets. These processes are described in Note 2(f)(ii). Insurance receivables are derecognised when the derecognition criteria for financial assets, as described in Note 2(e)(iii), have been met.
All financial assets, are subject to review for impairment (see Note 2(f)).
Financial liabilities
All financial liabilities are initially recognised at fair value and subsequently measured at amortised cost.
(iii) Derecognition
A financial asset or part of it is derecognised when, and only when, the contractual rights to the cash flows from the financial asset expire or control of the asset is not retained or substantially all risks and rewards of the financial asset is transferred to another party. On derecognition of a financial asset, the difference between the carrying amount and the sum of the consideration received (including any new asset obtained less any new liability assumed) and any cumulative gain or loss that had been recognised in equity is recognised in the profit or loss.
A financial liability or a part of it is derecognised when, and only when, the obligation specified in the contract is discharged, cancelled or expires. On derecognition of a financial liability, the difference between the carrying amount of the financial liability extinguished or transferred to another party and the consideration paid, including any non-cash assets transferred or liabilities assumed, is recognised in the profit or loss.
(f) Impairment
(i) Financial assets, excluding insurance receivables
All financial assets are assessed at each reporting date whether there is any objective evidence of impairment as a result of one or more events having an impact on the estimated future cash flows of the asset. Losses expected as a result of future events, no matter how likely, are not recognised.
For an investment in an equity instrument, a significant or prolonged decline in the fair value below its cost is an objective evidence of impairment. If any such objective evidence exists, then the financial asset’s recoverable amount is estimated.
An impairment loss in respect of loans and receivables (excluding insurance receivables as set out in Note 2(f)(ii) below) is recognised in profit or loss and is measured as the difference between the asset’s carrying amount and the present value of estimated future cash flows discounted at the asset’s original effective interest rate. The carrying amount of the asset is reduced through the use of an allowance account.
An impairment loss in respect of available-for-sale financial assets is recognised in the profit or loss and is measured as the difference between the asset’s acquisition cost (net of any principal repayment and amortisation) and the asset’s current fair value, less any impairment loss previously recognised. Where a decline in the fair value of an available-for-sale financial asset has been recognised in the other comprehensive income, the cumulative loss in other comprehensive income is reclassified from equity and recognised to profit or loss.
An impairment loss in respect of unquoted equity instrument that is carried at cost is recognised in profit or loss and is measured as the difference between the asset’s carrying amount and the present value of estimated future cash flows discounted at the current market rate of return for a similar financial asset.
Impairment losses recognised in profit or loss for an investment in an equity instrument classified as available-for-sale is not reversed through the profit or loss.

42 ANNUAL REPORT 2016
2. Significant accounting policies (continued)
(f) Impairment (continued)
(i) Financial assets, excluding insurance receivables (continued)
If, in a subsequent period, the fair value of a debt instrument increases and the increase can be objectively related to an event occurring after the impairment loss was recognised in profit or loss, the impairment loss is reversed, to the extent that the asset’s carrying amount does not exceed what the carrying amount would have been had the impairment not been recognised at the date the impairment is reversed. The amount of the reversal is recognised in the profit or loss.
(ii) Insurance receivables
Insurance receivables are assessed at each reporting date whether there is any objective evidence of impairment as a result of one or more events having an impact on the estimated future cash flows of the asset. Losses expected as a result of future events, no matter how likely, are not recognised. An objective evidence of impairment is deemed to exist where the principal or interest or both for insurance receivables is past due for more than 90 days or 3 months, as prescribed in the Guidelines on Financial Reporting for Insurers issued by Bank Negara Malaysia.
Insurance receivables that are individually significant shall be tested for impairment individually. Insurance receivables that are not individually significant shall be tested for impairment collectively as a member of portfolio of assets with similar credit risk characteristics collective assessment.
If it is determined that no objective evidence of impairment exists for an insurance receivable that has been individually assessed (whether individually significant or not), insurance receivable should subsequently be included within a group of financial assets with similar credit risk characteristics and assessed collectively for impairment as prescribed in the Guidelines on Financial Reporting for Insurers issued by Bank Negara Malaysia.
An impairment loss in respect of insurance receivables is recognised in profit or loss and is measured as the difference between the asset’s carrying amount and the present value of estimated future cash flows discounted at the asset’s original effective interest rate. The carrying amount of the asset is reduced through the use of an allowance account.
If, in a subsequent period, the fair value of insurance receivables increases and the increase can be objectively related to an event occurring after the impairment loss was recognised in profit or loss, the impairment loss is reversed, to the extent that the asset’s carrying amount does not exceed what the carrying amount would have been had the impairment not been recognised at the date the impairment is reversed. The amount of the reversal is recognised in the profit or loss.
(iii) Other assets
The carrying amounts of other assets (except for deferred tax asset, investment property and non-current assets or disposal groups classified as held for sale) are reviewed at the end of each reporting period to determine whether there is any indication of impairment. If any such indication exists, then the asset’s recoverable amount is estimated. For goodwill and intangible assets that have indefinite useful lives or that are not yet available for use, the recoverable amount is estimated each period at the same time.
For the purpose of impairment testing, assets are grouped together into the smallest group of assets that generates cash inflows from continuing use that are largely independent of the cash inflows of other assets or cash-generating units. Subject to an operating segment ceiling test, for the purpose of goodwill impairment testing, cash-generating units to which goodwill has been allocated are aggregated so that the level at which impairment testing is performed reflects the lowest level at which goodwill is monitored for internal reporting purposes. The goodwill acquired in a business combination, for the purpose of impairment testing, is allocated to a cash-generating unit or a group of cash-generating units that are expected to benefit from the synergies of the combination.
The recoverable amount of an asset or cash-generating unit is the greater of its value in use and its fair value less costs of disposal. In assessing value in use, the estimated future cash flows are discounted to their present value using a pre-tax discount rate that reflects current market assessments of the time value of money and the risks specific to the asset or cash-generating unit.
An impairment loss is recognised if the carrying amount of an asset or its related cash-generating unit exceeds its estimated recoverable amount.
Impairment losses are recognised in profit or loss. Impairment losses recognised in respect of cash-generating unit are allocated first to reduce the carrying amount of any goodwill allocated to the cash-generating unit (group of cash-generating units) and then to reduce the carrying amounts of the other assets in the cash-generating unit (groups of cash-generating units) on a pro rata basis.

ANNUAL REPORT 2016 43
2. Significant accounting policies (continued)
(f) Impairment (continued)
(iii) Other assets (continued)
An impairment loss in respect of goodwill is not reversed. In respect of other assets, impairment losses recognised in prior periods are assessed at the end of each reporting period for any indications that the loss has decreased or no longer exists. An impairment loss is reversed if there has been a change in the estimates used to determine the recoverable amount since the last impairment loss was recognised. An impairment loss is reversed only to the extent that the asset’s carrying amount does not exceed the carrying amount that would have been determined, net of depreciation or amortisation, if no impairment loss had been recognised. Reversals of impairment losses are credited to profit or loss in the financial year in which the reversals are recognised.
(g) Cash and cash equivalents
Cash and cash equivalents consist of cash on hand, balances and deposits with banks and highly liquid investments which have an insignificant risk of changes in value with original maturities of three months or less, and are used by the Company in the arrangement of its short term commitments.
(h) Product classification
The Company issues contracts that transfer insurance risk.
Insurance contracts are those contracts that transfer significant insurance risk. An insurance contract is a contract under which the Company (the insurer) has accepted significant insurance risk from another party (the policyholders) by agreeing to compensate the policyholders if a specified uncertain future event (the insured event) adversely affects the policyholders. As a general guideline, the Company determines whether it has significant insurance risk, by comparing benefits paid with benefits payable if the insured event did not occur.
Once a contract has been classified as an insurance contract, it remains an insurance contract for the remainder of its life-time, even if the insurance risk reduces significantly during this period, unless all rights and obligations are extinguished or expired.
(i) Reinsurance
Reinsurance enables an insurer to evaluate and transfer exposures to risks that cannot be successfully managed within insurers resources.
The Company may cede insurance risk in the normal course of business for some of its businesses. Reinsurance assets represent balances due from reinsurance companies. Amounts recoverable from reinsurers on ceded business are estimated in a manner consistent with the outstanding claims provision or settled claims associated with the reinsurer’s policies and are in accordance with the related reinsurance contracts.
The risk transfer (ceded reinsurance) does not relieve the Company from its obligations to policyholders. The privacy direct contract is between Company and policyholders. Premiums and claims are presented on a gross basis for both ceded and assumed reinsurance.
Reinsurance assets are reviewed for impairment at each reporting date or more frequently when an indication of impairment arises during the reporting period. Impairment occurs when there is objective evidence as a result of an event that occurred after initial recognition of the reinsurance asset that the Company may not receive all outstanding amounts due under the terms of the contract and the event has a reliably measurable impact on the amounts that the Company will receive from the reinsurer. The impairment loss is recorded in profit or loss.
The Company also assumes reinsurance risk from other insurers in the normal course of business when applicable.
Premiums and claims on assumed reinsurance are recognised as revenue or expenses in the same manner as they would be if the reinsurance were considered direct business, taking into account the product classification of the reinsured business. Reinsurance liabilities represent balances due to reinsurance companies. Amounts payable are estimated in a manner consistent with the related reinsurance contracts.
Reinsurance assets or liabilities are derecognised when the contractual rights are extinguished or expired or when the contract is transferred to another party.
Reinsurance contracts that do not transfer significant insurance risk are accounted for directly through the statement of financial position. These are deposit assets or financial liabilities that are recognised based on the consideration paid or received less any explicit identified premiums or fees to be retained by the reinsured. Investment income on these contracts is accounted for using the effective yield method when accrued.

44 ANNUAL REPORT 2016
2. Significant accounting policies (continued)
(j) Commission expense
Gross commission expense, which are cost directly incurred in securing premium on insurance policies, and income derived from reinsurers in the course of ceding of premiums to reinsurers, are charged to profit or loss in the period in which they are incurred or deferred where appropriate as set out in Note 2(k).
(k) General insurance underwriting results
The general insurance underwriting results, are determined for each class of business after taking into account inter alia reinsurances, commissions, unearned premium reserves and claims incurred.
Premium income
Premium is recognised in a financial period in respect of risks assumed during that particular financial period except for inward treaty reinsurance premiums which are recognised on the basis of periodic advices/accounts received from ceding insurers.
Insurance contract liabilities
These liabilities comprise premium liabilities and claims liabilities.
Premium liabilities
Premium liabilities is the higher of the aggregate of the Unearned Premium Reserves (“UPR”) for all lines of business and the best estimate value of the Unexpired Risk Reserves (“URR”) at the required risk margin for adverse deviation (“PRAD”).
Unearned Premium Reserves
The UPR represents the portion of the net premiums of insurance policies written that relate to the unexpired periods of the policies at the end of the financial year.
In determining the UPR at the end of the reporting date, the method that most accurately reflects the actual unearned premium is used and is as follows:
Annual policies
(i) 25% method for marine cargo, aviation cargo and transit business.(ii) 1/24th method for all other classes of Malaysian general policies and overseas inward business.
The UPR calculation is adjusted for additional UPR in respect of premiums ceded to overseas reinsurers as required under the guidelines issued by Bank Negara Malaysia.
Non annual policies
Premiums are apportioned evenly over the period the policy is on risk.
Unexpired Risk Reserves
At each reporting date, the Company reviews its unexpired risks and a liability adequacy test is performed to determine whether there is any overall excess of expected claims and expenses over unearned premiums. The best estimate of URR is calculated based on the projected claims cost from the unexpired period, indirect claims handling expenses, future maintenance expenses in handling the run-off of unexpired policies and a provision for risk margin.
If these estimates show that the carrying amount of the unearned premiums less related deferred acquisition costs is inadequate, the deficiency is recognised in the financial statements by setting up a provision for liability adequacy.
Claims liabilities
Outstanding claims provision are based on the estimated ultimate cost of all claims incurred but not settled at the end of reporting period, whether reported or not, together with related claims handling costs and reduction for the expected value of salvage and other recoveries. Delays can be experienced in the notification and settlement of certain types of claims, therefore, the ultimate cost of these claims cannot be known with certainty at the end of reporting period. The liability is calculated at the reporting date using a range of standard actuarial claim projection techniques based on empirical data and current assumptions that included a regulatory risk margin for adverse deviation. The liability is not discounted for the time value of money. No provision for equalisation or catastrophe reserves is recognised. The liabilities are derecognized when the contract expires, is discharged or is cancelled.

ANNUAL REPORT 2016 45
2. Significant accounting policies (continued)
(k) General insurance underwriting results (continued)
Acquisition costs and deferred acquisition cost (“DAC”)
The gross cost of acquiring and renewing insurance policies net of income derived from ceding reinsurance premiums is recognised as incurred and properly allocated to the periods in which it is probable they give rise to income. Acquisition costs or ceding income which are not recoverable, or not payable in the event of a termination of the policy to which they relate, are not deferred but are recognised in the period in which they occur.
Those costs are deferred to the extent that they are recoverable out of future premiums. All other acquisition costs are recognised as an expense when incurred.
Subsequent to initial recognition, these costs are amortised/allocated to the periods according to the original policies which give rise to income. DAC is incorporated as part of the computation to derive at UPR which is subject to liability adequacy test for each accounting period. Guidelines are prescribed in the RBC Framework.
(l) General insurance contract liabilities
General insurance contract liabilities are recognised when contracts are entered into and premiums are charged.
These liabilities comprise outstanding claims provision and provision for unearned premiums.
Estimating the outstanding claims provision involves projection of the Company’s future claims experience based on current claims experience. As with all projections, there are elements of uncertainty and thus the projected future claims experience may be different from its actual claims experience due to the level of uncertainty involved in projecting future claims experience based on past claims experience. These uncertainties arise from changes in underlying risks, changes in spread of risks, timing and amounts of claims settlement as well as uncertainties in the projection model and underlying assumptions.
The provision for unearned premiums represents premiums received for risks that have not yet expired. Generally, the reserve is released over the term of the contract and is recognised as premium income.
At each reporting date, the Company reviews its unexpired risks and a liability adequacy test is performed to determine whether there is any overall excess of expected claims and DAC over unearned premiums. The best estimate of URR is calculated based on the projected claims cost from the unexpired period, indirect claims handling expenses, future maintenance expenses in handling the run-off of unexpired policies and a provision for risk margin. If this estimate shows that the carrying amount of the unearned premiums less related DAC is inadequate, the deficiency is recognised in profit or loss by setting up a provision for liability adequacy.
(m) Tax expense
Tax expense comprises current and deferred tax. Current and deferred tax are recognised in profit or loss except to the extent that it relates to items recognised directly in equity, in which case it is recognised directly in equity or other comprehensive income.
Current tax is the expected tax payable on the taxable income for the year, using tax rates enacted or substantially enacted at the end of the reporting period, and any adjustment to tax payable in respect of previous financial years.
Deferred tax is recognised using the liability method, providing for temporary differences between the carrying amounts of assets and liabilities in the statement of financial position and their tax bases. Deferred tax is not recognised for the initial recognition of assets or liabilities in a transaction that is not a business combination and that affects neither accounting nor taxable profit or loss. Deferred tax is measured at the tax rates that are expected to be applied to the temporary differences when they reverse, based on the laws that have been enacted or substantively enacted by the end of the reporting period.
Deferred tax liability is recognised for all taxable temporary differences. Deferred tax assets and liabilities are offset if there is a legally enforceable right to offset current tax liabilities and assets, and they relate to income taxes levied by the same tax authority on the same taxable entity, or on different tax entities, but they intend to settle current tax liabilities and assets on a net basis or their tax assets and liabilities will be realised simultaneously.
A deferred tax asset is recognised to the extent that it is probable that future taxable profits will be available against which temporary difference can be utilised. Deferred tax assets are reviewed at each reporting date and are reduced to the extent that it is no longer probable that the related tax benefit will be realised.

46 ANNUAL REPORT 2016
2. Significant accounting policies (continued)
(n) Other income recognition
(i) Interest income
Interest income from securities with fixed or determinable payment and fixed maturity are recognised using the effective interest rate method.
Interest income on loans and other interest-bearing investments are recognised on an accrual basis except where a loan is considered non-performing i.e. where repayments are in arrears for more than six (6) months, in which case recognition of such interest is suspended. Subsequent to suspension, interest income is recognised on the receipt basis until all arrears have been paid.
(ii) Rental income
Rental income is recognised on an accrual basis except where default in payment of rent has already occurred and rent due remains outstanding for over six (6) months, in which case recognition of rental income is suspended. Subsequent to suspension, rental income is recognised on the receipt basis until all arrears have been paid.
(iii) Dividend income
Dividend income represents gross dividends from quoted and unquoted investments and is recognised in profit or loss when the Company’s right to receive payment is established, which in the case of quoted securities, is the ex-dividend date.
(o) Employee benefits
Short-term employee benefits
Short-term employee benefit obligations in respect of salaries, annual bonuses, paid annual leave and sick leave are measured on an undiscounted basis and are expensed as the related service is provided.
A liability is recognised for the amount expected to be paid under short-term cash bonus or profit-sharing plans if the Company has a present legal or constructive obligation to pay this amount as a result of past service provided by the employee and the obligation can be estimated reliably.
The Company’s contributions to statutory pension funds are charged to the profit or loss in the year to which they relate. Once the contributions have been paid, the Company has no further payment obligations.
(p) Valuation of general insurance contract liabilities
For general insurance contracts, estimates have to be made for both the expected ultimate cost of claims reported at the end of reporting period and for the expected ultimate cost of claims incurred but not yet reported (“IBNR”) at the end of the reporting period.
It can take a significant period of time before the ultimate claims costs can be established with certainty and for some type of policies, IBNR claims form the majority of the statement of financial position liability. The ultimate cost of outstanding claims is estimated by using a range of standard actuarial claims projection techniques, such as Expected Claims Ratio, Chain Ladder, Payment Per Claim Incurred and Bornhuetter-Ferguson methods.
For older accident periods, the Company has mainly used the incurred Chain Ladder method in establishing the best estimate of the claim liability. This method calculates the ratios of claim development using historical data, and these ratios are then used to project further development in the data. Since this approach takes into account the actual claim information, they are generally simple to apply.
For more recent accident periods where there is little credible data, more reliance is placed on the Expected Claims Ratio method and the Bornhuetter-Ferguson method. The Expected Claims Ratio method is simply the product of the initial expected loss ratio assumption and premium exposure (i.e. net earned premium) across each accident period. The ultimate cost of claims based on this method places no reliance on the emergence of actual claims data. The projected liabilities using the Bornhuetter-Ferguson method is essentially a blending of the estimates from the Chain Ladder method and the Expected Claims Ratio method, where the credibility for blending is based on the expected development.
The Company has also relied on payments based method as the payments experience is least affected by the changes.

ANNUAL REPORT 2016 47
2. Significant accounting policies (continued)
(p) Valuation of general insurance contract liabilities (continued)
Historical claims development is analysed by homogeneous business lines and claim types. Large claims are usually separately addressed, either by being reserved at the face value of loss adjustor estimates or separately projected in order to reflect their future development. In most cases, no explicit assumptions are made regarding future rates of claims inflation or loss ratios. Instead, the assumptions used are those implicit in the historic claims development data on which the projections are based.
Additional qualitative judgment is used to assess the extent to which past trends may not apply in the future, (for example, to reflect one-off occurrences, changes in external or market factors such as public attitudes to claiming, economic conditions, levels of claims inflation, judicial decisions and legislation, as well as internal factors such as portfolio mix, policy features and claims handling procedures) in order to arrive at the estimated ultimate cost of claims that present the likely outcome from the range of possible outcomes, taking account of all the uncertainties involved.
Indirect claims handling expense (“CHE”) allowance is included as a part of best estimate of claims liability. CHE is intended to cover the indirect costs of administering outstanding claims until all claims are fully settled.
(q) Earnings per share (“EPS”)
The Company presents basic EPS data for its ordinary shares. Basic EPS is calculated by dividing the profit or loss attributable to ordinary shareholders of the Company by the weighted average number of ordinary shares outstanding during the period.
(r) Fair value measurements
Fair value of an asset or a liability, except for lease transactions, is determined as the price that would be received to sell an asset or paid to transfer a liability in an orderly transaction between market participants at the measurement date. The measurement assumes that the transaction to sell the asset or transfer the liability takes place either in the principal market or in the absence of a principal market, in the most advantageous market.
For non-financial asset, the fair value measurement takes into account a market participant’s ability to generate economic benefits by using the asset in its highest and best use or by selling it to another market participant that would use the asset in its highest and best use.
When measuring the fair value of an asset or a liability, the Company uses observable market data as far as possible. Fair value are categorised into different levels in a fair value hierarchy based on the input used in the valuation technique as follows:
Level 1: quoted prices (unadjusted) in active markets for identical assets or liabilities that the Company can access at the measurement date.
Level 2: inputs other than quoted prices included within Level 1 that are observable for the asset or liability, either directly or indirectly.
Level 3: unobservable inputs for the asset or liability.
The Company recognises transfers between levels of the fair value hierarchy as of the date of the event of change in circumstances that caused the transfers.

48 ANNUAL REPORT 2016
Office Furniture Motor equipment and fittings Computers vehicles Total RM’000 RM’000 RM’000 RM’000 RM’000
Cost At 1 January 2015 4,715 25,392 23,126 8,280 61,513Additions 351 1,040 1,221 1,590 4,202Disposals (487) (11,884) (2,199) (2,111) (16,681)
At 31 December 2015/1 January 2016 4,579 14,548 22,148 7,759 49,034Additions 219 676 9,694 1,211 11,800Disposals (53) (213) (1,799) (1,153) (3,218)
At 31 December 2016 4,745 15,011 30,043 7,817 57,616
Accumulated depreciation At 1 January 2015 2,443 15,122 17,436 5,070 40,071Charge for the year 716 2,358 2,100 1,425 6,599Disposals (461) (11,035) (2,103) (2,073) (15,672)
At 31 December 2015/1 January 2016 2,698 6,445 17,433 4,422 30,998Charge for the year 651 2,080 2,407 1,376 6,514Disposals (46) (196) (1,795) (1,131) (3,168)
At 31 December 2016 3,303 8,329 18,045 4,667 34,344
Carrying amount At 1 January 2015 2,272 10,270 5,690 3,210 21,442
At 31 December 2015/1 January 2016 1,881 8,103 4,715 3,337 18,036
At 31 December 2016 1,442 6,682 11,998 3,150 23,272
Included in plant and equipment are the following fully depreciated assets which are still in use:
2016 2015 RM’000 RM’000At cost: Office equipment 1,670 1,302 Furniture and fittings 2,925 2,957 Computers 12,767 12,879 Motor vehicles 958 830
3. Plant and equipment

ANNUAL REPORT 2016 49
2016 2015 RM’000 RM’000Cost At 1 January/31 December 233 233 Accumulated depreciation At 1 January 80 76 Charge for the year 5 4
At 31 December 85 80 Accumulated impairment At 1 January/31 December 7 7 Carrying amount At 1 January 146 150
At 31 December 141 146 Included in the above is:
2016 2015 Carrying Fair Carrying Fair amount value amount value RM’000 RM’000 RM’000 RM’000
Leasehold building 141 260 146 260
The following are recognised in profit or loss in respect of investment property: 2016 2015 RM’000 RM’000 Direct operating expenses 5 5
Policy on transfer between levels
The fair value of an asset to be transferred between levels is determined as of the date of the event or change in circumstances that caused the transfer.
Level 1 fair value
Level 1 fair value is derived from quoted price (unadjusted) in active markets for identical investment properties that the entity can access at the measurement date.
Level 2 fair value
Level 2 fair value is estimated using inputs other than quoted prices included within Level 1 that are observable for the investment property, either directly or indirectly.
Level 2 fair value of building have been generally derived using the sales comparison approach. Sales price of comparable properties in close proximity are adjusted for differences in key attributes such as property size. The most significant input into this valuation approach is price per square foot of comparable properties.
Transfer between Level 1 and 2 fair values
There is no transfer between Level 1 and 2 fair values during the financial year.
4. Investment property

50 ANNUAL REPORT 2016
Fair value information
Fair value disclosed for the investment property is categorised as follows:
Level 1 Level 2 Level 3 Total RM’000 RM’000 RM’000 RM’0002016 Leasehold building - 260 - 260 2015 Leasehold building - 260 - 260
5. Goodwill 2016 2015 RM’000 RM’000
At 1 January/31 December 1,141,224 1,141,224
For the purpose of annual impairment testing, goodwill has been allocated to the general insurance business of the Company as one single cash-generating unit which represents the lowest level within the Company at which the goodwill is monitored for internal management purposes.
The recoverable amount of the general insurance business was based on its value in use. Value in use was determined by discounting the future cash flows generated from the continuing use of the unit using estimated operating results which was projected to perpetuity based on the Company’s business plan for financial year 2017 to 2019.
The key assumptions used in the value in use calculations are as follows:
2016 2015
Perpetual growth rate (for terminal value) 3.0% 3.0%Discount rate 8.1% 9.2%
The values assigned to the key assumptions represent management’s assessment of future trends in the general insurance industry and are based on both external sources and internal sources (historical data).
The carrying amount of the unit was determined to be lower than its recoverable amount and thus no impairment loss is recognised.
The Board of Directors has reviewed and approved the goodwill impairment assessment for the financial year 2016.
4. Investment property (continued)

ANNUAL REPORT 2016 51
2016 2015At fair value RM’000 RM’000Equity securities in corporations Quoted in Malaysia 173,513 168,350 Unquoted in Malaysia 602 602Unit Trust 467,373 492,495Malaysian Government Securities 144,143 98,646Government Investment Issues 173,088 186,318Government Guaranteed Bonds - 19,710Corporate debt securities: Unquoted in Malaysia 383,787 311,679
Total AFS financial assets 1,342,506 1,277,800
Estimation of fair value
The fair values of quoted equity securities and unit trusts are their quoted closing bid prices at the end of reporting period.
The fair value of the unquoted equity securities in corporations is determined to approximate the carrying amounts as these are immaterial in the context of the financial statements.
The fair values for Malaysian Government Securities, Government Investment Issues and Government Guaranteed Bonds are their indicative mid market prices quoted by regulatory agencies at the end of the reporting period.
The estimated fair value of unquoted corporate debt securities is based on the indicative mid market prices obtained from a bond pricing agency.
Carrying value of AFS financial assets AFS RM’000
At 1 January 2015 958,826Addition 1,413,142Disposal (1,091,246)Fair value gains recorded in other comprehensive income 3,764Amortisation 66Provision for impairment loss (6,752)
At 31 December 2015/1 January 2016 1,277,800Addition 1,523,716Disposal (1,447,576)Fair value loss recorded in other comprehensive income (3,017)Accretion (856)Provision for impairment loss (7,561)
At 31 December 2016 1,342,506
6. Available-for-sale (“AFS”) financial assets

52 ANNUAL REPORT 20167.
Def
erre
d ta
x (a
sset
s)/l
iabi
litie
s
Rec
ogn
ised
def
erre
d ta
x (
asse
ts)/
liabi
litie
s
Rec
ogni
sed
defe
rred
tax
(ass
ets)
/lia
bilit
ies
are
attr
ibut
able
to
the
follo
win
g:
2
01
6
20
15
R
M’0
00
R
M’0
00
Ava
ilabl
e-fo
r-sa
le fi
nanc
ial a
sset
s
(5
36
) 1
96
Pla
nt a
nd e
quip
men
t
1
, 416
1
, 127
Pro
visi
ons
(13
,151
) (1
0,9
72)
Oth
er it
ems
(21 )
(1
5)
Def
erre
d ta
x a
sset
s
(1
2,2
92
) (9
,66
4)
Mov
emen
t in
tem
pora
ry d
iffer
ence
s du
ring
the
yea
r:
Rec
ogn
ised
R
ecog
nis
ed
R
ecog
nis
ed
Rec
ogn
ised
in p
rofi
t in
oth
er
At
in p
rofi
t in
oth
er
A
t or
loss
co
mpr
ehen
sive
3
1.1
2.2
01
5/
or lo
ss
com
preh
ensi
ve
At
1
.1.2
01
5
(Not
e 2
7)
inco
me
1.1
.20
16
(N
ote
27
) in
com
e 3
1.1
2.2
01
6
RM
’00
0
RM
’00
0
RM
’00
0
RM
’00
0
RM
’00
0
RM
’00
0
RM
’00
0
Ava
ilabl
e-fo
r-sa
le fi
nanc
ial a
sset
s
(74
4)
- 9
40
1
96
-
(732
) (5
36
)P
lant
and
equ
ipm
ent
1,7
19
(59
2)
- 1
,127
2
89
-
1,4
16P
rovi
sion
s (9
,99
6)
(976
) -
(10
,97
2)
(2,1
79)
-
(13
,151
)O
ther
item
s (3
) (1
2)
- (1
5)
(6)
- (2
1)
Def
erre
d ta
x (a
sset
s)/l
iabi
litie
s (9
,02
4)
(1,5
80
) 9
40
(9
,66
4)
(1,8
96
) (7
32
) (1
2,2
92
)
7. D
efer
red
tax
(ass
ets)
/lia
bilit
ies

ANNUAL REPORT 2016 53
Note 2016 2015 RM’000 RM’000
Reinsurance of insurance contracts Claims liabilities 15.1 313,991 419,426 Premium liabilities 15.2 126,753 128,476
440,744 547,902
9. Loans and receivables, excluding insurance receivables
2016 2015 RM’000 RM’000Staff loans: Receivable within twelve months 57 54 Receivable after twelve months 227 284
284 338
Fixed and call deposits with maturity > 3months with licensed financial institutions: - Licensed banks in Malaysia 1,164,790 1,164,784 - Bank outside Malaysia 3,103 - Other receivables: Other receivables, deposits and prepayments 12,044 11,317 Income due and accrued 29,040 28,514 Amount due from holding companies 480 294 Amount due from related companies 2 - 41,566 40,125 Less: Impairment allowance (27) (19) 41,539 40,106Total loans and receivables, excluding insurance receivables 1,209,716 1,205,228
The amounts due from holding companies and related companies are non-trade in nature, interest free, unsecured and repayable on demand.
The following loans and receivables mature after 12 months:
2016 2015 RM’000 RM’000 Staff loans 227 284
Estimation of fair value
The fair value of staff loans and other receivables were determined to approximate the carrying amounts as these are immaterial in the context of the financial statements. The carrying amounts of the fixed and call deposits approximate their fair values.
8. Reinsurance assets

54 ANNUAL REPORT 2016
Note 2016 2015 RM’000 RM’000
Due premiums including agents/ brokers and co-insurers balances 183,777 205,907Due from reinsurers and cedants 10,869 12,263Amount due from holding companies - 16Amount due from related companies 3 24Amount due from affiliated companies 3,052 2,547
197,701 220,757
Less: Impairment allowance 10.1 (3,442) (3,144)
194,259 217,613
10.1 During the year, impaired receivables written off against allowance for impairment made previously amounted to RM342,000 (2015: RM68,000).
11. Deferred acquisition costs Note 2016 2015 RM’000 RM’000
Gross At 1 January 91,924 85,327Movement during the year 22 (2,681) 6,597
At 31 December 89,243 91,924 Reinsurance At 1 January (14,733) (13,951)Movement during the year 22 (96) (782)
At 31 December (14,829) (14,733) Net At 1 January 77,191 71,376Movement during the year (2,777) 5,815
At 31 December 74,414 77,191
10. Insurance receivables

ANNUAL REPORT 2016 55
2016 2015 RM’000 RM’000
Fixed and call deposits with licensed banks in Malaysia 147,600 120,445Cash and bank balances 26,014 17,705
173,614 138,150
The carrying amounts approximate their fair values due to the relatively short term nature of these financial instruments.
13. Share capital 2016 2015
Number Number Amount of shares Amount of shares RM’000 ’000 RM’000 ’000
Authorised: Ordinary shares of RM1.00 each 500,000 500,000 500,000 500,000 Issued and fully paid: Ordinary shares of RM1.00 each 333,143 333,143 333,143 333,143
14. Reserves
14.1 Fair value reserve
The fair value reserve comprises the cumulative net change in the fair value of available-for-sale financial assets until the investments are derecognised or impaired. The fair value reserve is in respect of unrealised gains on securities available-for-sale, net of deferred taxation.
14.2 Retained earnings
The Company may distribute single tier exempt to its shareholders out of its retained earnings. Pursuant to section 51(1) of the Financial Services Act 2013, the Company is required to obtain Bank Negara Malaysia’s written approval prior to declaring or paying any dividend.
Pursuant to the RBC Framework for Insurers, the Company shall not pay dividends if its Capital Adequacy Ratio is less than its internal target or if the payment of dividend would impair its Capital Adequacy Ratio to below its internal target.
12. Cash and cash equivalents

56 ANNUAL REPORT 2016
The
gen
eral
insu
ranc
e co
ntra
ct li
abili
ties
and
its
mov
emen
ts a
re f
urth
er a
naly
sed
as f
ollo
ws:
2
01
6
20
15
N
o te
Gro
ss
Rei
nsu
ran
ce
Ne t
G
ross
R
e in
sura
nce
N
e t
R
M’0
00
R
M’ 0
00
R
M’ 0
00
R
M’ 0
00
R
M’0
00
R
M’ 0
00
Pro
visi
on f
or c
laim
s re
port
ed b
y po
licyh
olde
rs
9
62
,79
6
(29
6,6
05
) 6
66
,19
1
1,0
25
,78
0
(37
7,5
87
) 6
48
,19
3P
rovi
sion
for
IBN
R
9
5,8
51
(1
7,3
86
) 7
8,4
65
14
0,7
86
(4
1,8
39)
9
8,9
47
Pro
visi
on f
or o
utst
andi
ng c
laim
s 1
5.1
1
,05
8,6
47
(31
3,9
91)
74
4,6
56
1
,16
6,5
66
(4
19
,42
6)
747,
140
Pro
visi
on f
or u
near
ned
prem
ium
s 1
5.2
7
90
,10
2
(12
6,7
53)
66
3,3
49
80
9,1
64
(1
28
,47
6)
68
0,6
88
1,8
48
,74
9
(44
0,7
44
) 1
,40
8,0
05
1
,97
5,7
30
(5
47,
90
2)
1,4
27,
82
8
N
ote
8
Not
e 8
15
.1 P
rovi
sion
for
ou
tsta
nd
ing
clai
ms
2
01
6
20
15
N
o te
Gro
ss
Rei
nsu
ran
ce
Ne t
G
ross
R
e in
sura
nce
N
e t
R
M’0
00
R
M’0
00
R
M’0
00
R
M’0
00
R
M’0
00
R
M’0
00
At
1 Ja
nuar
y
1,1
66
,56
6
(41
9,4
26
) 74
7,14
0
1,0
67,
31
3
(36
9,7
16)
697
,597
Clai
ms
incu
rred
in t
he c
urre
nt a
ccid
ent
year
1,0
17,4
82
(2
50
,44
2)
76
7,0
40
1
,05
2,0
72
(3
21
,90
8)
73
0,1
64
Adj
ustm
ent
to c
laim
s in
curr
ed in
pri
or a
ccid
ent
year
s
(17
5,6
10)
98
,70
7
(76
,90
3)
(14
2,7
49)
103
,474
(3
9,2
75
)A
djus
tmen
t to
cla
ims
incu
rred
in t
he e
x-H
LA r
un-o
ff p
ortf
olio
(16
,52
0)
11
,24
0
(5,2
80
) (3
8,6
13
) 2
7,9
88
(1
0,6
25
) M
ovem
ent
in P
RA
D o
f cl
aim
s lia
bilit
ies
at 7
5%
con
fide
nce
leve
l
(6,5
40
) 6
,47
6
(64
) 8
,19
5
(6,3
10)
1,8
85
M
ovem
ent
in c
laim
s ha
ndlin
g ex
pens
es
(1
64
) -
(16
4)
1, 3
67
-
1, 3
67
Cl
aim
s pa
id d
urin
g th
e ye
ar
24
(92
6,5
67
) 2
38
,96
8
(68
7,5
99)
(7
81
,01
9)
147,
92
9
(633
,09
0)
Mov
emen
t in
rei
nsur
ance
def
ault
pro
visi
on
-
48
6
48
6
- (8
83
) (8
83
)
At
31
Dec
embe
r
1,0
58
,64
7
(31
3,9
91
) 74
4,6
56
1
,16
6,5
66
(4
19
,42
6)
747,
14
0
15
.2 P
r ovi
sion
for
un
earn
ed p
rem
ium
s
20
16
2
01
5
Not
e G
ross
R
ein
sura
nce
N
et
Gro
ss
Rei
nsu
ran
ce
Net
RM
’00
0
RM
’00
0
RM
’00
0
RM
’00
0
RM
’00
0
RM
’00
0
A
t 1
Janu
ary
8
09
,16
4
(12
8,4
76
) 6
80
,68
8
755
,07
6
(11
9,6
02
) 6
35,4
74P
rem
ium
s w
ritt
en in
the
yea
r
1,5
22
,50
3
(29
4,8
63
) 1
,22
7,6
40
1
,53
5,3
70
(3
01
,74
0)
1,2
33,6
30
Pre
miu
ms
earn
ed d
urin
g th
e ye
ar
19
(1
,541
,56
5)
29
6,5
86
(1
,24
4,9
79)
(1
,48
1,2
82
) 2
92
,86
6
(1,1
88
,416
)
At
31
Dec
embe
r
79
0,1
02
(1
26
,75
3)
66
3,3
49
8
09
,16
4
(12
8,4
76
) 6
80
,68
8
15
. Ins
uran
ce c
ontr
act
liabi
litie
s

ANNUAL REPORT 2016 57
Note 2016 2015 RM’000 RM’000
Cash collateral deposit received from policyholders 16.1 16,078 19,615Deposit received from reinsurers 4,296 10,666
20,374 30,281
16.1 Fixed deposits held as cash collateral for guarantees issued on behalf of policyholders are included in loans and receivables and fixed and call deposits with licensed financial institutions.
The carrying amounts disclosed above approximate their fair values at the end of the reporting period. All amounts are payable within one year except for cash collateral deposit which has no maturity date.
17. Insurance payables 2016 2015 RM’000 RM’000 Due to reinsurers and cedants 78,403 105,314Due to agents/brokers, co-insurers and insureds 26,371 37,075Amount due to holding companies 11,381 7,420Amount due to related companies 1,121 1,904Amount due to affiliated companies 698 812
117,974 152,525
The carrying amounts disclosed above approximate fair values at the end of the reporting period. All amounts are payable within one year.
18. Other payables Note 2016 2015 RM’000 RM’000
Finance lease liabilities 18.1 - 8Other payables 15,694 18,582Accrued expenses 46,996 42,486Amount due to holding companies 17 22
62,707 61,098
18.1 Finance lease liabilities are payable as follows: 2016 2015 RM’000 RM’000 Less than one year - 8 Between one and five years - -
- 8
16. Other financial liabilities

58 ANNUAL REPORT 2016
Shareholders General Note fund business Total RM’000 RM’000 RM’0002016 Gross earned premiums - 1,541,565 1,541,565Investment income 20 609 96,130 96,739 609 1,637,695 1,638,304
2015 Gross earned premiums - 1,481,282 1,481,282Investment income 20 595 84,690 85,285 595 1,565,972 1,566,567
20. Investment income 2016 2015 RM’000 RM’000AFS financial assets Dividend/distribution income: - Equity securities quoted in Malaysia 5,795 4,925 - Unquoted equity securities in Malaysia 127 127 - Unit Trust 20,903 11,546Interest/profit income: - Malaysian Government Securities 5,767 3,021 - Government Investment Issues 5,707 5,712 - Government Guaranteed Bonds 260 836 - Corporate debt securities 16,305 13,766Amortisation of premiums, net of accretion of discounts (856) 66Impairment loss on investment (7,561) (6,752)Loans and receivables and cash and cash equivalents: Interest/profit income 50,292 52,038
96,739 85,285
21. Realised gains and losses 2016 2015 RM’000 RM’000Realised gains/(losses) for: Plant and equipment 234 (292) AFS financial assets Quoted equity securities in Malaysia 3,632 2,834 Unit trust (2) (105) Malaysian Government Securities 2,874 340 Government Investment Issues 2,627 500 Government Guarantee Bonds 17 105 Corporate debt securities 322 115 BNM Paper/Sukuk - (1) Treasury Bills - (2) 9,704 3,494
19. Operating revenue
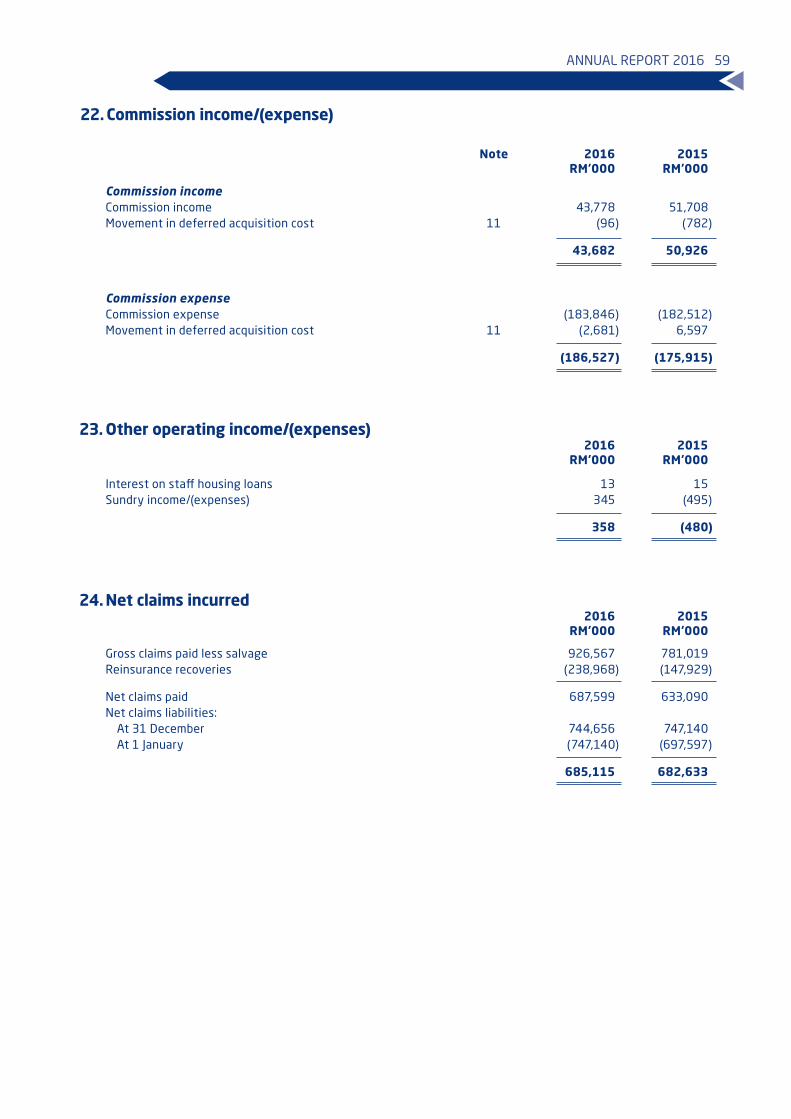
ANNUAL REPORT 2016 59
Note 2016 2015 RM’000 RM’000
Commission income Commission income 43,778 51,708Movement in deferred acquisition cost 11 (96) (782)
43,682 50,926
Commission expense Commission expense (183,846) (182,512)Movement in deferred acquisition cost 11 (2,681) 6,597
(186,527) (175,915)
23. Other operating income/(expenses) 2016 2015 RM’000 RM’000 Interest on staff housing loans 13 15Sundry income/(expenses) 345 (495)
358 (480)
24. Net claims incurred 2016 2015 RM’000 RM’000 Gross claims paid less salvage 926,567 781,019Reinsurance recoveries (238,968) (147,929)
Net claims paid 687,599 633,090Net claims liabilities: At 31 December 744,656 747,140 At 1 January (747,140) (697,597)
685,115 682,633
22. Commission income/(expense)

60 ANNUAL REPORT 2016
Note 2016 2015 RM’000 RM’000
Allowance for impairment 661 2,092Auditors’ remuneration - Audit fees - current year 385 383 - prior year - 7 - Non-audit fees 29 29Bad debts written off 325 1,296Depreciation of investment property 5 4Depreciation of plant and equipment 6,514 6,599Directors’ remuneration - fees 26 429 383 - emoluments 26 1,810 1,642Employee benefits expenses 25.1 103,325 99,531Rental expense on office premises 11,228 11,102Other expenses 85,559 84,190
210,270 207,258
25.1 Employee benefits expenses 2016 2015 RM’000 RM’000 Wages, salaries and others 88,957 85,889 Social security contributions 767 664 Contribution to Employees’ Provident Fund 12,928 12,223 Contribution to retirement gratuities 673 755
103,325 99,531
25. Management expenses

ANNUAL REPORT 2016 61
Det
ails
of
the
Dir
ecto
rs’ r
emun
erat
ion
(incl
udin
g be
nefi
ts-i
n-ki
nd) o
f ea
ch D
irec
tor
duri
ng t
he fi
nanc
ial y
ear
20
16 a
re a
s fo
llow
s:
20
16
Ben
efits
-
Fe
es
Sal
ary
Bon
us
EPF
Oth
er
in-k
ind
Tota
l
R
M’0
00
R
M’0
00
R
M’0
00
R
M’0
00
R
M’0
00
R
M’0
00
R
M’0
00
Chie
f Ex
ecut
ive
Offi
cer
and
Exec
utiv
e D
irec
tor
- M
r Ch
ua S
eck
Gua
n -
1,1
85
3
75
2
50
-
34
1
,84
4
Exec
utiv
e D
irec
tor
-
Mr
Ala
n Jo
hn W
ilson
-
- -
- -
- -
Non
-Exe
cuti
ve D
irec
tors
-
Dat
o’ M
ohd.
Sal
lehu
ddin
bin
Oth
man
1
34
-
- -
95
-
22
9-
Dat
uk S
eri D
r N
ik N
orzr
ul T
hani
bin
N H
assa
n T
hani
9
1
- -
- 4
8
- 1
39
- M
r H
itos
hi K
itag
awa*
9
5
- -
- 3
6
- 1
31
- M
s P
earl
Cha
n Si
ew C
heng
10
9
- -
- 9
2
- 2
01
- M
s Lo
h G
uat
Lan
- -
- -
- -
-To
tal D
irec
tors
’ Rem
uner
atio
n
(incl
udin
g be
nefi
ts-i
n-ki
nd)
42
9
2
71
70
0
Tota
l Chi
ef E
xecu
tive
Offi
cer
and
Dir
ecto
rs’ R
emun
erat
ion
(incl
udin
g be
nefi
ts-i
n-ki
nd)
42
9
1,1
85
3
75
2
50
2
71
3
4
2,5
44
* T
he D
irec
tor’s
fee
and
Mee
ting
fee
wer
e pa
id t
o To
yota
Tsu
sho
(Mal
aysi
a) S
dn B
hd.
26
. Key
man
agem
ent
pers
onne
l com
pens
atio
n

62 ANNUAL REPORT 2016
20
15
Ben
efits
-
Fe
es
Sal
ary
Bon
us
EPF
Oth
er
in-k
ind
Tota
l
R
M’ 0
00
R
M’0
00
R
M’0
00
R
M’0
00
R
M’ 0
00
R
M’ 0
00
R
M’ 0
00
Chie
f Ex
ecut
ive
Offi
cer
and
Exec
utiv
e D
irec
tor
- M
r Ch
ua S
eck
Gua
n -
1, 0
93
3
23
2
26
-
34
1
, 67
6
No n
-Exe
cuti
ve D
irec
tors
-
Dat
o’ M
ohd.
Sal
lehu
ddin
bin
Oth
man
1
28
-
- -
20
-
148
- D
atuk
Ser
i Dr
Nik
Nor
zrul
Tha
ni b
in N
Has
san
Tha
ni
90
-
- -
10
- 10
0-
Mr
Hit
oshi
Kit
agaw
a*
95
-
- -
9
- 10
4-
Ms
Pea
rl C
han
Siew
Che
ng
70
-
- -
16
- 8
6-
Ms
Loh
Gua
t La
n -
- -
- -
- -
- M
r A
lan
John
Wils
on
- -
- -
- -
--
Mr
Nor
iaki
Ham
anak
a (R
esig
ned
on 0
4.0
7.2
01
5)
- -
- -
- -
-
Tota
l Dir
ecto
rs’ R
emun
erat
ion
(in
clud
ing
bene
fits
-in-
kind
) 3
83
-
- -
55
- 43
8
Tota
l Chi
ef E
xecu
tive
Offi
cer
and
Dir
ecto
rs’ R
emun
erat
ion
(incl
udin
g be
nefi
ts-i
n-ki
nd)
38
3
1,0
93
3
23
2
26
55
3
4
2,1
14
* T
he D
irec
tor’s
fee
and
Mee
ting
fee
wer
e pa
id t
o To
yota
Tsu
sho
(Mal
aysi
a) S
dn B
hd.
26
. Key
man
agem
ent
pers
onne
l com
pens
atio
n (c
onti
nued
)

ANNUAL REPORT 2016 63
Note 2016 2015 RM’000 RM’000
Current tax expense Malaysian - current 67,642 63,231 - prior years (996) 84
66,646 63,315Deferred tax expense Malaysian - current (1,671) (1,633) - prior years (225) 53
7 (1,896) (1,580)
Total tax expense 64,750 61,735
Reconciliation of tax expense
Profit for the year 248,800 200,100Tax expense 64,750 61,735
Profit before taxation 313,550 261,835 Income tax using Malaysian tax rate of 24% (2015: 25%) 75,252 65,459Effect of lower tax rates for offshore business and business outside Malaysia (5,781) (3,126)Effect of change in tax rate - 413Non-deductible expenses 2,624 2,726Tax exempt income (6,116) (3,928)Other items (8) 54
65,971 61,598
(Over)/Under provision in prior years - Current tax (996) 84 - Deferred tax (225) 53
Tax expense 64,750 61,735
Income tax recognised directly in equity
Available-for-sale financial assets 7 732 (940)
28. Earnings per share
Basic earnings per share
The calculation of basic earnings per ordinary share is based on the profit attributable to ordinary shareholders of RM248,800,000 (2015: RM200,100,000) and the weighted average number of ordinary shares outstanding during the year of 333,143,000 (2015: 333,143,000).
27. Tax expense

64 ANNUAL REPORT 2016
Dividends recognised by the Company are: Sen Total per share amount net of tax RM’000 Date of payment2016 Final 2015 - tax-exempt 30.00 99,943 5 July 2016 2015 Final 2014 - tax-exempt 30.00 99,943 1 June 2015
The final ordinary dividends recommended by the Directors in respect of the financial year ended 31 December 2016 is 25 sen per ordinary share totalling RM83,286,000. These dividends will be accounted for in the shareholders’ equity as an appropriation of retained earnings in the financial year ending 31 December 2017 upon approval by Bank Negara Malaysia and the shareholders of the Company.
30. Operating leases
Leases as lessee
The future minimum lease payments under the non-cancellable operating lease are as follows:
2016 2015 RM’000 RM’000 Less than one year 9,463 10,206Between one and five years 3,843 8,796
13,306 19,002
The Company leases office premises under operating lease, the leases typically run for a period of 3 years, with an option to renew the lease after that date. Lease payments are increased every 3 years to reflect market rentals. None of the leases includes contingent rentals.
31. Capital expenditure commitments
2016 2015 RM’000 RM’000Plant and equipment Authorised but not contracted for - 3,730Contracted but not provided for 974 2,000
29. Dividends

ANNUAL REPORT 2016 65
For the purpose of these financial statements, parties are considered to be related to the Company if the Company has the ability, directly or indirectly, to control the other party or exercise significant influence over the other party in making financial or operational decisions, or vice versa, or where the Company and the party are subject to common control or common significant influence. Related parties may be individuals or other entities. The related parties of the Company are:
i) Holding companies
The immediate holding company is MSIG Holdings (Asia) Pte. Ltd., a company incorporated in Singapore. The penultimate and ultimate holding companies are Mitsui Sumitomo Insurance Co., Ltd and MS&AD Insurance Group Holdings, Inc., respectively. Both companies are incorporated in Japan.
ii) Fellow subsidiaries
These are entities which are under common control of the ultimate, penultimate and immediate holding companies.
iii) Affiliated companies
Affiliated companies comprised of companies having equity interest of between 20% to 50% in the Company and including other corporations related to the first mentioned corporation.
iv) Key management personnel
Key management personnel include the Company’s Executive and Non-Executive Directors and are defined as those persons having authority and responsibility for planning, directing and controlling the activities of the Company either directly or indirectly. Executive and Non-Executive Directors compensation is disclosed in Note 26.
Significant related party transactions
Related party transactions have been entered into in the normal course of business under normal trade terms. The significant related party transactions of the Company, other than key management personnel remuneration are shown below. The outstanding balances related to the below transactions are as shown in notes 9, 10, 17 and 18. 2016 2015 RM’000 RM’000 Ultimate/Penultimate holding company Premium ceded 56,882 50,213Commission received (11,457) (11,592)Claims recoveries (51,682) (30,352)Claims settling fee received (397) (553) Immediate holding company Service fee 1,888 1,692IT Project cost 1,816 1,390 Fellow subsidiary companies Premium ceded 4,348 6,108Commission received (885) (1,209)Claims recoveries (1,775) (3,217) Affiliated companies Premium received (84,271) (80,777)Commission paid 10,420 8,094Claims paid 13,847 11,622Bank merchant fees 3,093 2,402Surveying fee 503 764Interest income (14,896) (13,054)
32. Significant related party disclosures

66 ANNUAL REPORT 2016
The Company recognises the importance of effective risk management to realise the Company’s corporate objectives and responsibilities to achieve financial soundness and capital efficiency.
In this regard, the Board has set out the overall risk management strategies, policies and framework for identifying, measuring, monitoring and controlling risks as well as the extent to which these are operating effectively.
The major areas of risk that the Company is exposed to are insurance risks, financial risks and operational risks.
The Company’s risk management framework is as follows:
• A Compliance and Risk Management Committee (“CRMC”) is established at the Board Committee level to set the direction and to oversee the overall risk management framework as well as to ensure that resources, infrastructure and systems are in place for risk management activities. The CRMC is supported by Compliance & Risk Management Working Committee (“CRMWC”). In line with the emerging risk development amidst the era of Tariff Disapplication, the Board Committee approves of the restructuring of the CRMWC to Compliance Committee and Enterprise Risk Management Committee with more focus placed on Compliance and Enterprise Risk Management separately in 2017 onwards.
• The CRMWC which comprises the Senior Management Team, supports the CRMC in the process of risk identification, risk assessment and risk mitigation as well as promoting risk management culture and governance across all levels of staff through an effective organisation structure, communication, training as well as clear policies and procedures.
• The Company has an Enterprise Risk Management Department and also makes references to the risk management functions at the Head Office and Regional Office in Japan and Singapore for advice and guidance on risk management approach and best practices.
• The Internal Audit function which is independent from the business operations also provides support in identifying and highlighting key risk areas for improvement.
• The Company has in place a Risk Management Manual and maintains a Risk Register to record details of the various risks faced by the Company. The Company has also developed a Company Risk Profile which is subject to periodic review.
• The Company has established an Internal Control Programme comprising Company Level and Process Level Control Documentation with regular Testing of Design and Testing of Operating Effectiveness; as well as further Evaluation on Internal Controls Over Financial Reporting (“ICOFR”) on annual basis.
Stress Testing
The risk management framework also includes a Stress Testing Policy and Stress Testing Methodology. The Stress Testing exercise is conducted twice a year to identify potential threats due to exceptional but adverse plausible events and to evaluate the sustainability of the Company’s capital to withstand the impact.
Internal Capital Adequacy Assessment Process (“ICAAP”)
Bank Negara Malaysia (“BNM”) issued a Guideline on ICAAP for Insurers on 24 February 2012 with effective date from 1 September 2012.
Among the key elements under ICAAP, insurers are required to put in place:
(i) A Capital Management Framework which includes setting of risk appetite or risk tolerance level as well as determine Individual Target Capital Level (“ITCL”) that commensurate with own risk profile and control environment through comprehensive Stress Testing. As at to date, the Company has established a Risk Appetite Statement and performed the comprehensive Stress Testing for ITCL Review required under ICAAP; and
(ii) To maintain a sound Capital Management to ensure insurers operate at a level above ITCL all the time.
33. Risk Management Framework

ANNUAL REPORT 2016 67
Internal Capital Adequacy Assessment Process (ICAAP) Report
Driven by the BNM requirements on Capital Management as well as Risk Governance, the Company has addressed the necessary performance and issued a report approved by the CRMC on 20 December 2016 covering the following areas:
Risk Appetite
The Risk Appetite Framework has been established to address the major types of risks that the Company needs to manage in executing its business strategies through the Business Plan.
Individual Target Capital Level (“ITCL”) Review
Under the RBC Framework, BNM has set a supervisory target capital level of 130% (Supervisory Capital Adequacy Ratio) and insurer should establish an ITCL which is higher against Supervisory Capital Adequacy Ratio.
The Company has performed a series of Scenario Stress Tests to review and determine appropriate ITCL from actuarial technical stand point which is required to be maintained by the Company in order to withstand the exceptional and adverse plausible events.
Capital Management Plan (“CMP”)
The CMP has been established to be in line with the requirements set out in the RBC Framework and formed an integral part of ICAAP. The CMP sets out procedures to implement and maintain an appropriate level of capital which commensurate with risk profile at all times as required under regulatory requirements.
34. Insurance risk
The Company underwrites various classes of general insurance contracts, with a portfolio mix comprising mainly of Motor, Fire and Marine Cargo policies.
The risk under insurance contracts is the possibility of occurrence of an insured event and uncertainty of the amount and timing of resulting claim. The principal risk the Company faces under such contracts is that the actual claims exceed the carrying amount of insurance liabilities. This could occur due to any of the following:
Occurrence risk - the possibility that the number of insured events will differ from those expected.
Severity risk - the possibility that the cost of the events will differ from those expected.
Development risk - the possibility that changes may occur in the amount of an insurer’s obligation at the end of the contract period.
The variability of risk events can be managed by writing a large diversified portfolio of insurance contracts, because a more diversified portfolio is less likely to be affected across the board by changes in any subset of the portfolio. The variability of risk events can also be managed by careful selection of risks and implementation of underwriting strategy and guidelines as well as claims management and control systems.
The objective of the Company is to control and manage insurance risk to reduce volatility of operating profits. The Company manages insurance risk through the following:
• The Company’s underwriting approach is governed by an underwriting policy and guidelines which sets out a control framework for risk acceptance and referrals, underwriting capacity and authority limits granted to the various operations.
• The Company’s claims philosophy which provides the framework for claims management, regular claims review and claims handling procedures with the objectives to minimise the uncertainty of claims development and inflationary costs as well as to mitigate dubious or fraudulent claims whilst ensuring fair claims settlement.
• Reinsurance is used to limit the Company’s exposure to large claims and catastrophes by placing risk with reinsurers providing high security.
33. Risk Management Framework (continued)

68 ANNUAL REPORT 2016
The table below sets out the concentration of the Company’s insurance business by type of product based on gross and net written premiums.
Gross Reinsurance Net RM’000 RM’000 RM’0002016 Motor 663,239 (21,847) 641,392Fire 409,947 (169,700) 240,247Marine Cargo, Aviation Cargo, and Transit 99,733 (23,540) 76,193Miscellaneous 349,584 (79,776) 269,808
1,522,503 (294,863) 1,227,640
2015 Motor 685,415 (22,597) 662,818Fire 402,599 (151,759) 250,840Marine Cargo, Aviation Cargo, and Transit 90,791 (16,289) 74,502Miscellaneous 356,565 (111,095) 245,470
1,535,370 (301,740) 1,233,630
The table below sets out the concentration of the Company’s insurance contracts liabilities by type of product.
Gross Reinsurance Net RM’000 RM’000 RM’0002016 Motor 891,101 (19,165) 871,936Fire 412,260 (223,527) 188,733Marine Cargo, Aviation Cargo, and Transit 72,003 (28,139) 43,864Miscellaneous 473,385 (169,913) 303,472
1,848,749 (440,744) 1,408,005
2015 Motor 947,098 (41,446) 905,652Fire 434,784 (234,798) 199,986Marine Cargo, Aviation Cargo, and Transit 89,764 (41,511) 48,253Miscellaneous 504,084 (230,147) 273,937
1,975,730 (547,902) 1,427,828
Key assumptions
The principal assumption underlying the estimation of liabilities is that the Company’s future claims development will follow a similar pattern to past claims development experience. This includes assumptions in respect of average claims costs, claims handling cost and claims numbers for each accident year. Additional qualitative judgments are used to assess the extent to which past trends may not apply in the future, for example isolated occurrence of large claims as well as internal factors such as portfolio mix, policy conditions and claims handling procedures.
No discounting is made to the recommended claims and premium liability provisions. In most cases, no explicit inflation adjustment has been made to claims amounts payable in the future. However, implicit inflation is allowed for future claims to the extent evident in past claims development.
The Company has based the provisions for unexpired risks and insurance claims at a minimum 75% level of sufficiency, according to the requirement set by Bank Negara Malaysia under the RBC Framework.
34. Insurance risk (continued)

ANNUAL REPORT 2016 69
Sensitivity analysis of insurance liabilities
Estimates of an insurance company’s claim and premium liabilities may be affected by future events, which cannot be predicted with any certainty. The assumptions made may well vary from actual experience such that the actual liability may vary considerably from the best estimates.
The Company re-runs its valuation models on various bases. An analysis of sensitivity around various scenarios provides an indication of the adequacy of the Company’s estimation process in respect of its insurance contracts. The analysis presented in page 69 demonstrates the sensitivity of insurance liability estimates to particular movements in assumptions used in the estimation process. Certain assumptions can be expected to impact the liabilities more than others, and consequently a greater degree of sensitivity to these variables may be expected.
The analysis below is performed to assess movements in key assumptions with all other assumptions held constant and ignores changes in values of the related assets. The correlation of assumptions will have a significant effect in determining the ultimate claim liabilities, but to demonstrate the impact due to changes in assumptions, assumptions had to be changed on an individual basis.
The key assumptions considered in the sensitivity analysis are as follows:
• Initial Expected Loss Ratio (“IELR”) for accident year 2016
• Selected Ultimate Loss Ratio (“ULR”)
The IELR is a parameter used in the Expected Claims Ratio and Bornhuetter-Ferguson methods. These methods are usually used by actuaries to estimate the claim liability for more recent accident periods where there is little credible data. The sensitivity test is performed by changing the IELR by -15% multiplicatively to +15% multiplicatively to derive the claim liabilities and the net impact is disclosed in the following table.
The selected ULR is derived from the best estimation of claims reserve, and is a major factor to determine the actuarial unexpired risk reserve which is a component of premium liability. A change in the expected ULR also affects the claim liability as it is a function of ultimate losses. To show the sensitivity of this assumption, the impact of changing ULR by -15% multiplicatively and +15% multiplicatively is shown in the table below. For claims liabilities, 2016 accident year ULRs were changed only. For premium liabilities, the expected ULRs were changed.
The results of the sensitivity analysis (net of reinsurance) showing the impact on the claim and premium liabilities are as follows: IELR ULR +15% -15% +15% -15% RM’000 RM’000 RM’000 RM’0002016 Premium liabilities - - - -Claim liabilities 3,938 (3,938) 114,825 (114,825)
Total 3,938 (3,938) 114,825 (114,825) Impact on profit before tax 3,938 (3,938) 114,825 (114,825)Impact on equity * 2,993 (2,993) 87,267 (87,267) 2015 Premium liabilities - - - -Claim liabilities 3,585 (3,585) 107,157 (107,157)
Total 3,585 (3,585) 107,157 (107,157) Impact on profit before tax 3,585 (3,585) 107,157 (107,157)Impact on equity * 2,689 (2,689) 80,368 (80,368)
* Impact on equity reflects adjustments for tax, where applicable.
Claims Development Table
The following tables show the estimated cumulative incurred claims, including both claims notified and IBNR for each successive accident year at end of each reporting period, together with cumulative payments to date.
While the information in the tables provides a historical perspective on the adequacy of the unpaid claims estimate established in previous years, users are cautioned against extrapolating redundancies or deficiencies of the past on current unpaid loss balances.
34. Insurance risk (continued)

70 ANNUAL REPORT 2016
Gro
ss g
ener
al in
sura
nce
con
trac
t lia
bilit
ies
for
20
16
:
B
efor
e
20
09
2
00
9
20
10
2
01
1
20
12
2
01
3
20
14
2
01
5
20
16
To
tal
Acc
iden
t ye
ar
R
M’ 0
00
R
M’0
00
R
M’ 0
00
R
M’0
00
R
M’ 0
00
R
M’ 0
00
R
M’0
00
R
M’0
00
R
M’ 0
00
R
M’ 0
00
At
e nd
of a
ccid
ent
year
45
0,8
03
768
,476
8
95
,625
9
21
,14
0
94
6,0
43
98
5,7
08
1
, 052
,07
2
1, 0
17,4
82
O
n e y
ear l
ater
63
9,9
63
72
0,4
79
8
6 3,6
30
7
84
,38
8
80
2,4
75
86
6,4
21
9
61
,55
0
Tw
o ye
ars
late
r
6
4 5,7
71
6
82
,09
6
84
0,8
11
75
0,6
68
7
79
,716
8
00
,218
T
h ree
yea
rs la
ter
62
0,3
97
659
,622
8
3 7,0
06
7
3 7,4
19
759
,35
8
Fo
ur y
ears
late
r
6
15
,152
65
0,8
20
8
41,6
41
740
,55
6
Five
yea
rs la
ter
60
8,4
78
65
3,8
08
8
43,9
70
Si
x ye
ars
late
r
59
1,6
14
635
,05
8
Seve
n ye
ars
late
r
59
3,0
42
Curr
ent
esti
mat
e of
cum
ula
tive
cla
ims
incu
rred
59
3,0
42
63
5,0
58
8
43,9
70
740
,55
6
759
,35
8
80
0,2
18
96
1,5
50
1
,017
,48
2
At
end
of a
ccid
ent
year
22
2,6
09
3
04
,26
0
343
,655
35
0,2
98
35
2,8
82
3
88
,474
41
1,6
04
4
46
,98
3
One
yea
r lat
er
498
,12
6
553
,40
0
693
,618
6
20
,04
6
632
,151
65
4,1
21
7
73
,865
Two
year
s la
ter
554
,274
59
7,59
5
753
,35
6
67
3,3
09
6
90
,44
6
714
,733
T
hree
yea
rs la
ter
572
,047
6
12
,69
9
78
9,3
24
69
9,6
68
7
10,8
80
Four
yea
rs la
ter
577,
706
6
1 6,9
77
7
9 7,8
54
70
5,3
43
Five
yea
rs la
ter
579
,219
6
23,0
46
8
11
,75
0
Si
x ye
ars
late
r
5
83
,825
63
0,5
68
Se
ven
year
s la
ter
590
,907
Cum
ula
tive
pay
men
ts t
o-d
ate
590
,907
63
0,5
68
8
11
,75
0
705
,343
7
1 0,8
80
7
1 4,7
33
77
3,8
65
44
6,9
83
34
. In
sura
nce
ris
k (c
onti
nu
ed)

ANNUAL REPORT 2016 71
Gro
ss g
ener
al in
sura
nce
con
trac
t lia
bilit
ies
for
20
16
:
B
efor
e
N
o te
20
09
2
00
9
20
10
2
01
1
20
12
2
01
3
20
14
2
01
5
20
16
To
t al
R
M’0
00
R
M’0
00
R
M’0
00
R
M’0
00
R
M’0
00
R
M’0
00
R
M’0
00
R
M’0
00
R
M’0
00
R
M’0
00
Gro
ss g
ener
al in
sura
nce
lia
bilit
ies
(dir
ect,
fac
ult
ativ
e
and
trea
ty in
war
d)
6
,96
0
2,1
35
4
,49
0
32
,22
0
35
,21
3
48
,47
8
85
,48
5
18
7,6
85
5
70
,49
9
973
,165
Cl
aim
s ha
ndlin
g ex
pens
es
30
,26
2P
RA
D a
t 75
% c
onfi
denc
e le
vel
55,2
20
Gro
ss g
ener
al in
sura
nce
con
trac
t lia
bilit
ies
per
stat
emen
t of
fin
anci
al p
osit
ion
15
.1
1,0
58
,647
34
. In
sura
nce
ris
k (c
onti
nu
ed)

72 ANNUAL REPORT 20163
4.
Insu
ran
ce r
isk
(con
tin
ued
)
Gro
ss g
ener
al in
sura
nce
con
trac
t lia
bilit
ies
for
20
15
:
Bef
ore
20
08
2
00
8
20
09
2
01
0
20
11
2
01
2
20
13
2
01
4
20
15
To
tal
Acc
iden
t ye
ar
RM
’00
0
RM
’ 00
0
RM
’ 00
0
RM
’ 00
0
RM
’ 00
0
RM
’00
0
RM
’00
0
RM
’00
0
RM
’ 00
0
RM
’ 00
0
At
end
of a
ccid
ent
year
43
1,5
37
450
,803
76
8,4
76
89
5,6
25
92
1,1
40
9
46
,043
9
85
,70
8
1,0
52,0
72
O
ne y
ear l
ater
39
1,3
67
63
9,9
63
72
0,4
79
8
63,6
30
7
84
,38
8
80
2,4
75
86
6,4
21
Two
year
s la
ter
63
5,7
37
645
,77
1
68
2,0
96
8
40
,81
1
750
,66
8
77
9,7
16
Thr
ee y
ears
late
r
633
,110
6
20
,397
65
9,6
22
837
,00
6
737
,419
Four
yea
rs la
ter
6
22,6
48
6
15
,152
65
0,8
20
8
41,6
41
Five
yea
rs la
ter
6
14,0
61
6
08
,47
8
653
,80
8
Si
x ye
ars
late
r
591
,924
59
1,6
14
Seve
n ye
ars
late
r
58
8,2
66
Curr
ent
esti
mat
e of
cum
ula
tive
cla
ims
incu
rred
5
88
,26
6
591
,614
65
3,8
08
8
41,6
41
737
,419
7
79
,716
8
66
,42
1
1,0
52,0
72
6
,110
,957
A
t en
d of
acc
iden
t ye
ar
181
,78
4
222
,60
9
30
4,2
60
3
43,6
55
350
,29
8
352
,88
2
38
8,4
74
411
,60
4
One
yea
r lat
er
3
10,0
90
49
8,1
26
55
3,4
00
6
93,6
18
62
0,0
46
63
2,1
51
654
,12
1
Tw
o ye
ars
late
r
549
,249
55
4,2
74
597,
595
75
3,3
56
6
73
,30
9
69
0,4
46
T
hree
yea
rs la
ter
57
2,2
13
572
,047
6
12,6
99
7
89
,324
6
99
,66
8
Fo
ur y
ears
late
r
578
,822
57
7,70
6
616
,97
7
797
,85
4
Five
yea
rs la
ter
5
80
,655
57
9,2
19
623
,04
6
Si
x ye
ars
late
r
58
2,8
44
5
83
,825
Se
ven
year
s la
ter
5
85
,95
0
Cum
ula
tive
pay
men
ts t
o-d
ate
58
5,9
50
5
83
,825
6
23,0
46
7
9 7,8
54
6
99
,66
8
69
0,4
46
65
4,1
21
41
1,6
04
5
,04
6,5
14

ANNUAL REPORT 2016 73
Gro
ss g
ener
al in
sura
nce
con
trac
t lia
bilit
ies
for
20
15
:
Bef
ore
N
ote
20
08
2
00
8
20
09
2
01
0
20
11
2
01
2
20
13
2
01
4
20
15
To
tal
RM
’00
0
RM
’ 00
0
RM
’ 00
0
RM
’ 00
0
RM
’ 00
0
RM
’00
0
RM
’00
0
RM
’00
0
RM
’ 00
0
RM
’ 00
0
Gro
ss g
ener
al in
sura
nce
liabi
litie
s (d
irec
t fa
cult
ativ
e
and
trea
ty in
war
d)
9
,93
7
2,3
16
7,
78
9
30
,76
2
43
,78
7
37,
75
1
89
,27
0
21
2,3
00
6
40
,46
8
1,0
74,3
80
Cl
a im
s ha
ndlin
g ex
pens
es
30
,42
6
PR
AD
at
75%
con
fide
nce
leve
l
6
1,7
60
Gro
ss g
ener
al in
sura
nce
cont
ract
liab
iliti
es p
er
st
atem
ent
of fi
nanc
ial p
osit
ion
15
.1
1,1
66
,56
6
34
. In
sura
nce
ris
k (c
onti
nu
ed)

74 ANNUAL REPORT 2016
Net
gen
eral
insu
ran
ce c
ontr
act
liabi
litie
s fo
r 2
01
6:
Bef
ore
20
09
2
00
9
20
10
2
01
1
20
12
2
01
3
20
14
2
01
5
20
16
To
tal
Acc
iden
t ye
ar
RM
’00
0
RM
’ 00
0
RM
’ 00
0
RM
’ 00
0
RM
’ 00
0
RM
’00
0
RM
’00
0
RM
’00
0
RM
’ 00
0
RM
’ 00
0
At
end
of a
ccid
ent
year
3
69
,13
4
555
,770
6
11
,593
6
42
,619
6
87,
177
7
25,5
56
75
4,5
10
79
5,8
39
One
yea
r lat
er
49
0,6
24
541
,72
0
597,
01
5
60
9,3
05
6
47,9
24
69
5,2
09
6
88
,712
Tw
o ye
ars
late
r
490
,28
7
52
9,7
30
5
83
,28
6
595
,233
6
29
,52
1
66
0,2
27
T
hree
yea
rs la
ter
47
7,7
77
51
7,70
2
590
,141
5
81
,86
7
618
,735
Fo
ur y
ears
late
r
475
,46
7
50
1,7
45
591
,265
5
86
,87
8
Fi
ve y
ears
late
r
472
,853
5
01
,45
4
58
8,7
26
Si
x ye
ars
late
r
459
,818
4
86
,18
1
Se
ven
year
s la
ter
45
7,2
13
Curr
ent
esti
mat
e of
cum
ula
tive
cla
ims
incu
rred
45
7,2
13
48
6,1
81
5
88
,72
6
58
6,8
78
6
1 8,7
35
66
0,2
27
68
8,7
12
79
5,8
39
At
end
of a
ccid
ent
year
19
3,0
19
259
,27
7
29
5,8
55
29
6,6
11
3
19,7
51
34
6,1
45
349
,67
3
39
9,3
32O
ne y
ear l
ater
40
0,0
33
44
6,1
47
493
,965
5
0 7,5
06
53
6,9
15
5
61
,016
55
8,2
68
Tw
o ye
ars
late
r
437,
949
47
8,5
10
52
9,1
13
54
4,8
14
573
,09
4
60
0,8
13
T
h ree
yea
rs la
ter
4
48
,47
1
48
8,6
36
55
9,0
64
55
8,0
05
5
85
,04
2
Four
yea
rs la
ter
45
2,2
72
47
9,6
88
5
63,5
87
5
62
,40
4
Fi
ve y
ears
late
r
453
,78
3
48
2,0
10
56
6,3
32
Six
year
s la
ter
45
4,8
95
4
83
,06
1
Se
ven
year
s la
ter
45
5,7
29
Cum
ula
tive
pay
men
ts t
o-d
ate
455
,72
9
48
3,0
61
5
66
,332
5
62
,40
4
58
5,0
42
6
00
,813
55
8,2
68
3
99
,332
34
. In
sura
nce
ris
k (c
onti
nu
ed)

ANNUAL REPORT 2016 75
Net
gen
eral
insu
ran
ce c
ontr
act
liabi
litie
s fo
r 2
01
6:
Bef
ore
N
ote
20
09
2
00
9
20
10
2
01
1
20
12
2
01
3
20
14
2
01
5
20
16
To
tal
RM
’00
0
RM
’00
0
RM
’00
0
RM
’00
0
RM
’00
0
RM
’00
0
RM
’00
0
RM
’00
0
RM
’00
0
RM
’00
0
Net
gen
eral
insu
ran
ce
liabi
litie
s (d
irec
t,
facu
ltat
ive
and
trea
ty in
war
d)
4
,83
7
1,4
84
3
,12
0
22
,39
4
24
,474
3
3,6
93
5
9,4
14
1
30
,44
4
39
6,5
07
6
76,3
67
Cl
aim
s ha
ndlin
g ex
pens
es
30
,26
2P
RA
D a
t 75
% c
onfi
denc
e le
vel
36
,870
Rei
nsur
ance
def
ault
pro
visi
on
1,1
57
Net
gen
eral
insu
ran
ce
co
ntr
act
liabi
litie
s pe
r
st
atem
ent
of fi
nan
cial
pos
itio
n 1
5. 1
744
,65
6
The
dia
gona
ls f
or 2
010
onw
ards
sho
wn
abov
e re
flec
t th
e im
pact
of
addi
tion
al c
laim
s co
sts
aris
ing
from
the
bus
ines
s co
mbi
nati
on o
f H
ong
Leon
g A
ssur
ance
Ber
had’
s po
rtfo
lio o
n 1
Oct
ober
20
10.
34
. In
sura
nce
ris
k (c
onti
nu
ed)

76 ANNUAL REPORT 2016
Net
gen
eral
insu
ran
ce c
ontr
act
liabi
litie
s fo
r 2
01
5:
Bef
ore
20
08
2
00
8
20
09
2
01
0
20
11
2
01
2
20
13
2
01
4
20
15
To
tal
Acc
iden
t ye
ar
RM
’00
0
RM
’ 00
0
RM
’ 00
0
RM
’ 00
0
RM
’ 00
0
RM
’00
0
RM
’00
0
RM
’00
0
RM
’ 00
0
RM
’ 00
0
At
end
of a
ccid
ent
year
33
9,5
12
36
9,1
34
55
5,7
70
61
1,5
93
64
2,6
19
68
7,17
7
725
,55
6
754
,510
O
ne y
ear l
ater
331
,635
49
0,6
24
541
,72
0
597,
01
5
60
9,3
05
6
47,9
24
69
5,2
09
Two
year
s la
ter
4
82
,670
49
0,2
87
5
29
,73
0
58
3,2
86
59
5,2
33
62
9,5
21
T
hree
yea
rs la
ter
47
6,9
07
477,
77
7
517,
702
59
0,1
41
58
1,8
67
Four
yea
rs la
ter
47
3,4
86
47
5,4
67
5
01
,745
59
1,2
65
Five
yea
rs la
ter
4
68
,876
47
2,8
53
50
1,4
54
Six
year
s la
ter
45
4,2
43
459
,818
Se
ven
year
s la
ter
45
0,2
45
Curr
ent
esti
mat
e of
cum
ula
tive
cla
ims
incu
rred
45
0,2
45
459
,818
5
01
,45
4
591
,265
5
81
,86
7
62
9,5
21
6
95
,20
9
754
,510
4
,663
,88
9
At
end
of a
ccid
ent
year
1
51,8
90
1
93,0
19
259
,27
7
29
5,8
55
29
6,6
11
3
19,7
51
34
6,1
45
349
,67
3
One
yea
r lat
er
2
68
,907
4
00
,033
4
46
,147
49
3,9
65
507
,50
6
536
,91
5
56
1,0
16
Tw
o ye
ars
late
r
427
,43
1
437,
949
47
8,5
10
52
9,1
13
54
4,8
14
573
,09
4
Thr
ee y
ears
late
r
44
2,0
73
4
48
,47
1
48
8,6
36
55
9,0
64
55
8,0
05
Four
yea
rs la
ter
4
46
,922
45
2,2
72
47
9,6
88
5
63,5
87
Fi
ve y
ears
late
r
44
8,1
84
45
3,7
83
4
82
,010
Six
year
s la
ter
4
48
,32
6
454
,89
5
Seve
n ye
ars
late
r
44
8,7
81
Cum
ula
tive
pay
men
ts t
o-d
ate
44
8,7
81
45
4,8
95
4
82
,010
5
6 3,5
87
55
8,0
05
57
3,0
94
5
61
,016
3
4 9,6
73
3
,99
1,0
61
34
. In
sura
nce
ris
k (c
onti
nu
ed)

ANNUAL REPORT 2016 77
Net
gen
eral
insu
ran
ce c
ontr
act
liabi
litie
s fo
r 2
01
5:
Bef
ore
N
ote
20
08
2
00
8
20
09
2
01
0
20
11
2
01
2
20
13
2
01
4
20
15
To
tal
RM
’00
0
RM
’00
0
RM
’00
0
RM
’00
0
RM
’00
0
RM
’00
0
RM
’00
0
RM
’00
0
RM
’00
0
RM
’00
0
N
et g
ener
al in
sura
nce
lia
bilit
ies
(dir
ect,
fa
cult
ativ
e an
d tr
eaty
inw
ard)
6, 2
81
1
, 46
4
4, 9
23
1
9,4
44
2
7 ,6
78
2
3,8
62
5
6,4
27
1
34
,19
3
40
4,8
37
6
79
, 10
9
Cl
aim
s ha
ndlin
g ex
pens
es
30
,42
6P
RA
D a
t 75
% c
onfi
denc
e le
vel
36
,935
Rei
nsur
ance
def
ault
pro
visi
on
670
Net
gen
eral
insu
ran
ce
co
ntr
act
liab
ilit
ies
per
stat
emen
t of
fin
anci
al p
osit
ion
15
.1
74
7,1
40
The
dia
gona
ls f
or 2
010
onw
ards
sho
wn
abov
e re
flec
t th
e im
pact
of
addi
tion
al c
laim
s co
sts
aris
ing
from
the
bus
ines
s co
mbi
nati
on o
f H
ong
Leon
g A
ssur
ance
Ber
had’
s po
rtfo
lio o
n 1
Oct
ober
20
10.
34
. In
sura
nce
ris
k (c
onti
nu
ed)

78 ANNUAL REPORT 2016
In addition to insurance risks, the Company is also subjected to financial risks namely credit risk, liquidity risk, market risk (comprising currency risk, interest rate risk and price risk) as well as operational risk arising from its exposure in financial instruments.
In this regard, the Company is guided by a framework of policies and procedures governing credit control and investments as well as general risk management policies in order to mitigate such financial risks. The Company has established robust processes to monitor and address these risks on an ongoing basis.
The policies and measures undertaken by the Company to manage these risks are as set out below:
Credit risk
Credit risk is the risk of a financial loss resulting from the failure of a customer, an intermediary or counterparty to settle its financial and contractual obligations to the Company as and when they fall due.
The Company monitors and manages credit risk exposures with the objective to ensure that it is able to meet policyholder obligations when they are due and maintain adequate capital and solvency requirements.
The Company’s primary exposure to credit risk arises through its receivables from sales of insurance policies, obligations of reinsurers through reinsurance contracts and its investment in fixed income securities, deposits and bank balances. The Company has put in place a credit control policy and investment policy as part of its overall credit risk management framework.
The task of monitoring receivables arising from insurance and reinsurance contracts is undertaken by the Credit Control Division of the Finance Department with oversight from the Credit Control Committee to ensure adherence to the Company’s credit control policies and procedures. These policies and procedures entail approval requirements for credit period extension for overdue receivables and cancellation processes. The Company also has guidelines to evaluate intermediaries before their appointment.
The Company manages the credit risk of its reinsurers by monitoring the credit quality and financial conditions of its reinsurers on an ongoing basis and reviews its reinsurance arrangements periodically. The Company cedes business to reinsurers that satisfy the minimum credit rating requirements of the Company.
In relation to its credit risk exposure from fixed income securities, the Company evaluates and assesses an issuer’s credit risk by using the ratings assigned by external rating agencies. Proper monitoring and control of credit and concentration risks are carried out by the Investment Division of the Finance Department and regularly reviewed by the Investment Committee and Board of Directors. The Company manages individual exposures as well as concentration of credit risks in its fixed income portfolio through a prescribed framework of asset allocation, minimum credit rating, maximum duration as well as setting maximum permitted exposure to a single counterparty or group of counterparties.
Cash and deposits are placed with financial institutions licensed under the Financial Services Act 2013 which are regulated by Bank Negara Malaysia, guided by the Company’s approved exposure limits and minimum credit rating requirements for each financial institution.
At the end of the reporting period, there was no significant concentration of credit risks.
Credit exposure
The table below shows the maximum exposure to credit risk for the components on the statement of financial position. 2016 2015 RM’000 RM’000 AFS financial assets - Debt instruments 701,018 616,353Reinsurance assets 440,744 547,902Loans and receivables, excluding insurance receivables and prepayments 1,207,188 1,203,065Insurance receivables 194,259 217,613Cash and cash equivalents 173,614 138,150
2,716,823 2,723,083
35. Financial risks

ANNUAL REPORT 2016 79
Credit exposure by credit rating
The table below provides information regarding the credit risk exposure of the Company by classifying assets according to the Company’s credit ratings of counterparties.
Not past due/ Past due Past due Investment but not and grade impaired impaired Total RM’000 RM’000 RM’000 RM’000
2016 AFS financial assets - Debt instruments 701,018 - - 701,018Reinsurance assets 440,744 - - 440,744Loans and receivables, excluding insurance receivables and prepayments 1,207,188 - 27 1,207,215Insurance receivables 183,686 10,582 3,433 197,701Cash and cash equivalents 173,614 - - 173,614
2,706,250 10,582 3,460 2,720,292Impairment allowance (9) - (3,460) (3,469)
2,706,241 10,582 - 2,716,823 2015 AFS financial assets - Debt instruments 616,353 - - 616,353Reinsurance assets 547,902 - - 547,902Loans and receivables, excluding insurance receivables and prepayments 1,203,065 - 19 1,203,084Insurance receivables 197,230 20,664 2,863 220,757Cash and cash equivalents 138,150 - - 138,150
2,702,700 20,664 2,882 2,726,246Impairment allowance (281) - (2,882) (3,163)
2,702,419 20,664 - 2,723,083
35. Financial risks (continued)

80 ANNUAL REPORT 2016
The
tab
le b
elow
pro
vide
s in
form
atio
n re
gard
ing
the
cred
it r
isk
expo
sure
of
the
Com
pany
by
clas
sify
ing
asse
ts a
ccor
ding
to
the
Rat
ing
Age
ncy
of M
alay
sia’
s, M
alay
sian
R
atin
g Co
rpor
atio
n B
erha
d’s,
A.M
. Bes
t Co
mpa
ny R
atin
g Se
rvic
es’ o
r Sta
ndar
d an
d P
oor’s
Rat
ing
Serv
ices
’ (w
here
app
licab
le) c
redi
t ra
ting
s of
cou
nter
part
ies.
AA
A is
the
hi
ghes
t po
ssib
le r
atin
g.
AA
A
AA
A
B
BB
B
B
B
Not
-rat
ed
Tota
l
R
M’0
00
R
M’0
00
R
M’0
00
R
M’0
00
R
M’0
00
R
M’0
00
R
M’0
00
R
M’0
00
20
16
AFS
fina
ncia
l ass
ets
- D
ebt
inst
rum
ents
8
2,8
85
2
83
,72
8
15
,05
7
- -
- 3
19
,34
8
70
1,0
18
Rei
nsur
ance
ass
ets
- 75
,53
8
19
9,6
89
-
- -
165
,517
4
40
,74
4Lo
ans
and
rece
ivab
les,
excl
udin
g in
sura
nce
re
ceiv
able
s an
d pr
epay
men
ts
63
7,5
03
4
67,
92
1
62
,46
8
- -
- 3
9,2
96
1
,20
7,1
88
Insu
ranc
e re
ceiv
able
s -
77
9
492
-
95
3
- 1
92
,03
5
19
4,2
59
Cash
and
cas
h eq
uiva
lent
s 14
2,3
85
2
8,4
80
2
,72
0
- -
- 2
9
173
,614
86
2,7
73
8
56
,44
6
28
0,4
26
-
95
3
- 7
16
,22
5
2,7
16
,82
3
20
15
AFS
fina
ncia
l ass
ets
- D
ebt
inst
rum
ents
7
7,7
24
22
1,8
57
9
,98
1
- -
- 3
06
,79
1
616
,353
Rei
nsur
ance
ass
ets
- 2
2,7
77
14
4,3
08
-
- -
38
0,8
17
547
,90
2Lo
ans
and
rece
ivab
les,
exc
ludi
ng in
sura
nce
rece
ivab
les
and
prep
aym
ents
7
12
,00
7
39
2,3
14
60
,46
3
- -
- 3
8,2
81
1
,20
3,0
65
Insu
ranc
e re
ceiv
able
s -
24
29
1
- 3
,06
0
- 2
14,2
38
2
17,6
13
Cash
and
cas
h eq
uiva
lent
s 10
8,3
59
2
7,9
04
1
,85
8
- -
- 2
9
13
8,1
50
89
8,0
90
6
64
,87
6
21
6,9
01
-
3, 0
60
-
94
0,1
56
2
, 72
3,0
83
Ag
e an
aly
sis
of fi
nan
cial
ass
ets
pas
t-d
ue
bu
t n
ot im
pai
red
1 -
30
day
s 3
1 -
60
day
s 6
1 -
90
day
s
>9
0 d
ays
Tota
l
R
M’ 0
00
R
M’0
00
R
M’0
00
R
M’0
00
R
M’ 0
00
20
16
In
sura
nce
rece
ivab
les
6,0
60
2
,04
8
1,0
69
1
,40
5
10
,58
2
20
15
In
sura
nce
rece
ivab
les
8,9
62
3
,55
5
3,0
34
5
,11
3
20
,66
4
35
. Fi
nanc
ial r
isks
(con
tinu
ed)

ANNUAL REPORT 2016 81
Impaired financial assets
At 31 December 2016, based on a collective and individual assessment of receivables, there are impaired insurance receivables of RM3,442,000 (2015: RM3,144,000). The Company records impairment allowance for loans and receivables and insurance receivables in separate “Allowance for impairment” accounts. A reconciliation of the allowance for impairment losses for insurance receivables is as follows:
Insurance receivables Individual Collective Impairment Impairment Total RM’000 RM’000 RM’000 At 1 January 2015 881 1,232 2,113Movement during the year 299 732 1,031
At 31 December 2015 / 1 January 2016 1,180 1,964 3,144Movement during the year 1,245 (947) 298
At 31 December 2016 2,425 1,017 3,442
Liquidity riskLiquidity risk is the risk that the Company is unable to meet its obligations due to insufficient liquid resources, or would have to incur excessive cost in meeting the obligations. In respect of catastrophic events, there is also a liquidity risk associated with the timing differences between gross cash outflows and expected reinsurance recoveries.
The Company manages this risk by monitoring daily cash inflows and outflows and by ensuring that a reasonable amount of financial assets are kept in liquid instruments at all times. The Company also observes principles on asset-liability management and ensures that the average investment duration and maturity profiles match the Company’s liabilities.
The Company’s treaty reinsurance contracts contains a “cash call” clause which enables the Company to call for advance payment from reinsurers in the event of a large claim exceeding an agreed amount.
35. Financial risks (continued)

82 ANNUAL REPORT 2016
Mat
uri
ty p
rofi
les
T
he t
able
bel
ow s
umm
aris
es t
he m
atur
ity
profi
le o
f th
e fi
nanc
ial l
iabi
litie
s of
the
Com
pany
bas
ed o
n re
mai
ning
und
isco
unte
d co
ntra
ctua
l obl
igat
ions
, inc
ludi
ng in
tere
st/
profi
t pa
yabl
e.
For i
nsur
ance
con
trac
t lia
bilit
ies,
mat
urit
y pr
ofile
s ar
e de
term
ined
bas
ed o
n th
e es
tim
ated
tim
ing
of c
ash
outfl
ows
from
reco
gnis
ed in
sura
nce
liabi
litie
s. U
near
ned
prem
ium
s an
d th
e re
insu
rers
’ sha
re o
f un
earn
ed p
rem
ium
s ha
ve b
een
excl
uded
fro
m t
he a
naly
sis
as t
hey
are
not
cont
ract
ual o
blig
atio
ns.
No
Carr
yin
g U
p to
a
1 -
3
4 -
5
6 -
15
O
ver
15
m
atu
rity
va
lue
year
ye
ars
year
s ye
ars
year
s da
te
Tota
l
R
M’0
00
R
M’0
00
R
M’0
00
R
M’0
00
R
M’0
00
R
M’0
00
R
M’0
00
R
M’0
00
20
16
Insu
ranc
e co
ntra
ct li
abili
ties
1
,05
8,6
47
748
,955
27
3,6
73
32
,32
1
3,6
98
-
- 1
,05
8,6
47O
ther
fina
ncia
l lia
bilit
ies
20
,374
2
0,3
74
- -
- -
- 2
0,3
74In
sura
nce
paya
bles
1
17,9
74
117
,974
-
- -
- -
117
,974
Oth
er p
ayab
les
62
,707
6
2,7
07
- -
- -
- 6
2,7
07Ta
x pa
yabl
e 14
,425
14
,425
-
- -
- -
14,4
25
Tota
l lia
bilit
ies
1, 2
74,1
27
9
64
,43
5
27
3,6
73
3
2,3
21
3
, 69
8
- -
1, 2
74,1
27
20
15
Insu
ranc
e co
ntra
ct li
abili
ties
1
,16
6,5
66
8
10,6
77
3
14,2
03
36
,58
1
5,1
05
-
- 1
,16
6,5
66
Oth
er fi
nanc
ial l
iabi
litie
s 3
0,2
81
3
0,2
81
-
- -
- -
30
,28
1In
sura
nce
paya
bles
1
52,5
25
152
,525
-
- -
- -
152
,525
Oth
er p
ayab
les
61
,09
8
61
,09
8
- -
- -
- 6
1,0
98
Tax
paya
ble
11
,93
9
11
,93
9
- -
- -
- 1
1,9
39
Tota
l lia
bilit
ies
1,4
22
,40
9
1,0
66
,52
0
31
4,2
03
3
6,5
81
5
,10
5
- -
1,4
22
,40
9
35
. Fi
nanc
ial r
isks
(con
tinu
ed)

ANNUAL REPORT 2016 83
Market risk
Market risk is the risk that the fair value or future cash flows of a financial instrument will fluctuate because of changes in market prices. Market risk comprises three types of risk, i.e. foreign exchange rates (currency risk), market interest rates/profit yields (interest rate/profit yield risk) and market prices (price risk).
The Company manages its market risk by setting policies on asset allocation, investment limits and diversification benchmarks. These policies have been set in line with the Company’s investment and risk management policies and in compliance with regulatory requirements in respect of maintenance of assets and solvency.
Investment in derivatives is prohibited, unless specifically approved.
Currency risk
Currency risk is the risk that the fair value or future cash flows of a financial instrument will fluctuate because of changes in foreign exchange rates.
As the Company’s business is conducted primarily in Malaysia, the Company’s financial assets are also primarily maintained in Malaysia as required under the Financial Services Act, 2013 and denominated in the same currency as its insurance and investment contract liabilities.
The Company’s primary transactions are carried out in Ringgit Malaysia (“RM”), with limited exposure to foreign currency risks.
The Company’s exposure to foreign currency risk arises from fixed deposits maintained in Brunei in relation to the run-off branch operations and one foreign currency current account maintained to facilitate payments.
The Company’s exposure to foreign currency risk based on carrying amounts as at the end of the reporting period was:
2016 2015 RM’000 RM’000Cash and cash equivalents Brunei Dollar - 43United States Dollar 34 34
As the total foreign currency risk exposure is not significant, the Company does not hedge its position. In addition, no sensitivity analysis is performed as the impact from foreign currency risk is deemed minimal.
Interest rate/profit yield risk
Interest rate/profit yield risk is the risk that the value or future cash flows of a financial instrument will fluctuate because of changes in market interest rates/profit yields.
Floating rate instruments expose the Company to cash flow interest/profit risk, whereas fixed rates/yield instruments expose the Company to fair value interest/profit risk.
The Company’s exposure to interest rate risk arises primarily from investments in fixed income securities and deposits with licensed institutions.
The Company has no significant concentration of interest rate/profit yield risk.
As the Company mainly invests in fixed rate instruments, the impact on profit before tax arising from exposure to interest rate/profit yield risk is insignificant.
Exposure to interest rate risk
The interest rate profile of the Company’s significant interest-bearing financial instruments, based on carrying amounts as at the end of the reporting period was:
2016 2015 RM’000 RM’000Fixed rate instruments AFS financial assets - Debt instruments 701,018 616,353Fixed and call deposits 1,315,493 1,285,229
2,016,511 1,901,582
35. Financial risks (continued)

84 ANNUAL REPORT 2016
Interest rate risk sensitivity analysis
Fair value sensitivity analysis for fixed rate instruments
The Company does not account for any fixed rate financial assets at fair value through profit or loss. Therefore, a change in interest rates at the end of the reporting period would not affect profit or loss.
Price risk
Equity price risk is the risk that the fair value or future cash flows of a financial instrument will fluctuate because of changes in market prices (other than those arising from interest rate/profit yield risk or currency risk), whether those changes are caused by factors specific to the individual financial instruments or its issuer or factors affecting similar financial instruments traded in the market.
The Company’s exposure to price risk arises from its investment in quoted equities traded on Bursa Malaysia.
The Company manages its exposure to price risk by setting policies and investment parameters governing asset allocation and investment limits as well as specific review by the Investment Committee for equity investments falling by 20% or more of its cost.
The Company has no significant concentration of price risk.
The analysis below is performed for reasonable possible movements in equity market price with all other variables held constant, showing the impact of statement of comprehensive income and equity (due to changes in fair value of AFS financial assets).
2016 2015 Impact on Impact on Change in income Impact on income Impact on variables statement equity* statement equity* RM’000 RM’000 RM’000 RM’000 Market price +10% - 13,187 - 12,626Market price -10% - (13,187) - (12,626)
* Impact on equity reflects adjustments for tax effect, where applicable.
The method used for deriving sensitivity information and significant variables did not change from the previous period.
Operational risks
Operational risk is the risk of loss arising from system failure, human error, fraud or external events. When controls fail to perform, operational risks can cause damage to reputation, have legal or regulatory implications or can lead to financial loss.
The Company cannot expect to eliminate all operational risks.
The Company mitigates operational risks by putting in place a framework for controls and procedures, which includes the establishment of a Company Risk Profile, an Internal Control Programme, as well as Business Process Management (“BPM”) documenting procedures as well as work instructions, encapsulating effective segregation of duties, access controls, authorisation and reconciliation procedures. Regional and internal audits also play a role in ensuring that operational risks are mitigated.
External events such as interruption of business operation due to disasters may disrupt working environment, facilities and personnel. The Company has developed a Business Continuity Management Framework (“BCM”) in line with Bank Negara Malaysia requirements (BNM/RH/GL/013-3 Guidelines on Business Continuity Management (Revised)) with the objectives of protecting the business, customers and all stakeholders by addressing and minimising serious interruption to the business through a structured framework of business and systems recovery plans in the event of a disaster.
Fair value information
It was not practicable to estimate the fair value of the Company’s investment in unquoted shares due to the lack of comparable quoted prices in an active market and the fair value cannot be reliably measured.
35. Financial risks (continued)

ANNUAL REPORT 2016 85
Fair
val
ue
info
rmat
ion
The
tab
le b
elow
ana
lyse
s fi
nanc
ial i
nstr
umen
ts c
arri
ed a
t fa
ir v
alue
and
tho
se n
ot c
arri
ed a
t fa
ir v
alue
for
whi
ch f
air
valu
e is
dis
clos
ed, t
oget
her
wit
h th
eir
fair
val
ues
and
carr
ying
am
ount
s sh
own
in t
he s
tate
men
t of
fina
ncia
l pos
itio
n.
Fa
ir v
alu
e of
fin
anci
al
Fair
val
ue
of fi
nan
cial
To
tal f
air
Carr
yin
g
inst
rum
ents
car
ried
at
fair
val
ue
inst
rum
ent
not
car
ried
at
fair
val
ue
valu
e am
oun
t
Le
vel 1
Le
vel 2
Le
vel 3
Le
vel 1
Le
vel 2
Le
vel 3
RM
’00
0
RM
’00
0
RM
’00
0
RM
’00
0
RM
’00
0
RM
’00
0
RM
’00
0
RM
’00
02
01
6
Fin
anci
al a
sset
s
A
FS F
inan
cial
ass
ets
Equi
ty s
ecur
itie
s in
cor
pora
tion
Quo
ted
in M
alay
sia
173
,513
-
- -
- -
173
,513
17
3,5
13U
nit
Trus
t 4
67,
373
-
- -
- -
46
7,37
3
46
7,37
3M
alay
sian
Gov
ernm
ent
Secu
riti
es
- 14
4,1
43
- -
- -
144
,143
14
4,1
43G
over
nmen
t In
vest
men
t Is
sues
-
173
,08
8
- -
- -
173
,08
8
173
,08
8G
over
nmen
t G
uara
ntee
d B
onds
-
- -
- -
- -
-Co
rpor
ate
debt
sec
urit
ies
Unq
uote
d in
Mal
aysi
a -
38
1,6
71
2
,116
-
- -
38
3,7
87
3
83
,78
7
64
0,8
86
6
98
,90
2
2,1
16
-
- -
1,3
41
,90
4
1,3
41
,90
4
20
15
Fi
nan
cial
ass
ets
AFS
Fin
anci
al a
sset
s
Eq
uity
sec
urit
ies
in c
orpo
rati
on
Q
uote
d in
Mal
aysi
a 16
8,3
50
-
- -
- -
168
,35
0
168
,35
0U
nit
Trus
t 49
2,4
95
-
- -
- -
492
,49
5
492
,49
5M
alay
sian
Gov
ernm
ent
Secu
riti
es
- 9
8,6
46
-
- -
- 9
8,6
46
9
8,6
46
Gov
ernm
ent
Inve
stm
ent
Issu
es
- 18
6,3
18
- -
- -
186
,318
18
6,3
18G
over
nmen
t G
uara
ntee
d B
onds
-
19
,710
-
- -
- 1
9,7
10
19
,710
Corp
orat
e de
bt s
ecur
itie
s
Unq
uote
d in
Mal
aysi
a -
30
9,5
63
2,1
16
- -
- 3
11
,67
9
31
1,6
79
66
0,8
45
6
14
,23
7
2,1
16
-
- -
1,2
77,
19
8
1,2
77,
19
8
35
. Fi
nanc
ial r
isks
(con
tinu
ed)

86 ANNUAL REPORT 2016
Fair value information (continued)
Policy on transfer between levels
The fair value of an asset to be transferred between levels is determined as of the date of the event or change in circumstances that caused the transfer.
Level 1 fair value
Level 1 fair value is derived from quoted price (unadjusted) in active markets for identical financial assets or liabilities that the entity can access at the measurement date.
Level 2 fair value
Level 2 fair value is estimated using inputs other than quoted prices included within Level 1 that are observable for the financial assets or liabilities, either directly or indirectly.
Transfers between Level 1 and Level 2 fair values
There has been no transfer between Level 1 and Level 2 fair values during the financial year (2015: no transfer in either directions).
Level 3 fair value
Level 3 fair value is estimated using unobservable inputs for the financial assets and liabilities.
The following table shows a reconciliation of Level 3 fair values:
2016 2015 RM’000 RM’000 Balance at 1 January 2,116 2,116Gains and losses recognised in profit or loss Realised gains and losses - -Gains and losses recognised in other comprehensive income Net loss on fair value of available-for-sale financial assets - -
Balance at 31 December 2,116 2,116
35. Financial risks (continued)

ANNUAL REPORT 2016 87
Fair value information (continued)
The following table shows the valuation techniques used in the determination of fair values within Level 3, as well as the key unobservable inputs used in the valuation models.
Financial instruments carried at fair value
Inter-relationship Significant between significant unobservable unobservable inputs and Type Valuation technique inputs fair value measurement Unquoted Discounted cash Effective The estimated fair valuedebt securities flows interest rates would increase (decrease) (2016: 7-8%) if the effective interest rate were lower (higher)
Sensitivity analysis for Level 3 Other comprehensive Profit or loss income, net of tax Increase Decrease Increase Decrease RM’000 RM’000 RM’000 RM’0002016 Interest rate (1% movement) - - 32 31
2015 Interest rate (1% movement) - - 35 33
Valuation processes applied by the Company for Level 3 fair value
The Company has an established control framework in respect to measurement of fair values of financial instruments. This includes a valuation team that has overall responsibility of overseeing all significant fair value measurements, including Level 3 fair values, and reports directly to the Chief Financial Officer. The valuation team regularly reviews significant unobservable inputs and valuation adjustments.
35. Financial risks (continued)

88 ANNUAL REPORT 2016
The Company’s capital management policy is to optimise the efficient and effective use of resources to maximise the return on equity and provide an appropriate level of capital to protect policyholders and meet regulatory requirements.
The Company is required to comply with the regulatory capital requirement prescribed in the RBC Framework which is imposed by the Ministry of Finance. Under the RBC Framework guidelines issued by Bank Negara Malaysia, insurance companies are required to satisfy a minimum Capital Adequacy Ratio of 130%. As at year end, the Company has a Capital Adequacy Ratio in excess of the minimum requirement.
The capital structure of the Company as at 31 December, as prescribed under the RBC Framework is provided below:
Note 2016 2015 RM’000 RM’000Eligible Tier 1 Capital
Share capital (paid-up) 13 333,143 333,143Reserves, excluding fair value reserve 2,216,506 2,067,649
2,549,649 2,400,792
Tier 2 Capital
Eligible reserves – Fair value reserve (1,696) 589 Amount deducted from capital (1,160,248) (1,151,951)
Total capital available 1,387,705 1,249,430
37. Contingent liability
Subsequent to the financial year end date, the Company has received a notice from the Malaysia Competition Commission (“MyCC”) on its proposed decision to fine the Company a sum of RM22,567,737 with regard to its investigation into alleged infringement in the agreement between Persatuan Insurans Am Malaysia (“PIAM”) and the Federation of Automobile Workshop Owners’ Association of Malaysia (“FAWOAM”) on trade discount rates for parts for certain vehicle makes and labour hourly rates for PIAM approved repairers scheme workshops.
The alleged infringement applies to all the General Insurers who are members of PIAM. These rates were applied by the Company pursuant to a members’ circular issued by PIAM, which arose from Bank Negara Malaysia’s directive to PIAM to engage FAWOAM towards resolution of the issues of parts trade discounts and labour hourly rate. This is a Proposed Decision and the finding and/or penalty is not final at this stage. Under the relevant provisions in Competition Act 2010, PIAM and its members have the option to make written and/or oral representations and submit their case to MyCC.
The Company is currently taking the necessary action in order to make the requisite representations to MyCC on this matter.
36. Regulatory capital requirements

ANNUAL REPORT 2016 89
In the opinion of the Directors, the financial statements set out on pages 33 to 88 are drawn up in accordance with Malaysian Financial Reporting Standards, International Financial Reporting Standards and the requirements of the Companies Act, 1965 in Malaysia so as to give a true and fair view of the financial position of the Company as of 31 December 2016 and of its financial performance and cash flows for the financial year then ended.
Signed on behalf of the Board of Directors in accordance with a resolution of the Directors:
……………………………………….........................................………………… Dato’ Mohd. Sallehuddin bin Othman
……………………………………….........................................………………… Chua Seck Guan
Kuala LumpurDate: 21 March 2017
Statement by Directorspursuant to Section 251(2) of the Companies Act, 2016

90 ANNUAL REPORT 2016
I, Soh Lai Sim, the Officer primarily responsible for the financial management of MSIG Insurance (Malaysia) Bhd, do solemnly and sincerely declare that the financial statements set out on pages 33 to 88 are, to the best of my knowledge and belief, correct and I make this solemn declaration conscientiously believing the declaration to be true, and by virtue of the Statutory Declarations Act, 1960.
Subscribed and solemnly declared by the above named at Kuala Lumpur on 21 March 2017.
……………………………………….........................................………………… Soh Lai Sim
Before me:
Statutory Declaration pursuant to Section 251(1)(b) of the Companies Act, 2016

ANNUAL REPORT 2016 91
Report on the Audit of the Financial Statements
Opinion
We have audited the financial statements of MSIG Insurance (Malaysia) Bhd, which comprise the statement of financial position as at 31 December 2016, and the statement of profit or loss and other comprehensive income, statement of changes in equity and statement of cash flows for the year then ended, and notes to the financial statements, including a summary of significant accounting policies, as set out on pages 33 to 88.
In our opinion, the accompanying financial statements give a true and fair view of the financial position of the Company as at 31 December 2016, and of its financial performance and cash flows for the year then ended in accordance with Malaysian Financial Reporting Standards, International Financial Reporting Standards and the requirements of the Companies Act, 1965 in Malaysia.
Basis for Opinion
We conducted our audit in accordance with approved standards on auditing in Malaysia and International Standards on Auditing. Our responsibilities under those standards are further described in the Auditors’ Responsibilities for the Audit of the Financial Statements section of our auditors’ report. We believe that the audit evidence we have obtained is sufficient and appropriate to provide a basis for our opinion.
Independence and Other Ethical Responsibilities
We are independent of the Company in accordance with the By-Laws (on Professional Ethics, Conduct and Practice) of the Malaysian Institute of Accountants (“By-Laws”) and the International Ethics Standards Board for Accountants’ Code of Ethics for Professional Accountants (“IESBA Code”), and we have fulfilled our other ethical responsibilities in accordance with the By-Laws and the IESBA Code.
Information Other than the Financial Statements and Auditors’ Report Thereon
The Directors of the Company are responsible for the other information. The other information comprises the information included in the Directors’ report, but does not include the financial statements of the Company and our auditors’ report thereon.
Our opinion on the financial statements of the Company does not cover the Directors’ report and we do not express any form of assurance conclusion thereon.
In connection with our audit of the financial statements of the Company, our responsibility is to read the Directors’ report and, in doing so, consider whether the Directors’ report is materially inconsistent with the financial statements of the Company or our knowledge obtained in the audit, or otherwise appears to be materially misstated. If, based on the work we have performed, we conclude that there is a material misstatement of the Directors’ report, we are required to report that fact. We have nothing to report in this regard.
Responsibilities of the Directors for the Financial Statements
The Directors of the Company are responsible for the preparation of financial statements of the Company that give a true and fair view in accordance with Malaysian Financial Reporting Standards, International Financial Reporting Standards and the requirements of the Companies Act, 1965 in Malaysia. The Directors are also responsible for such internal control as the Directors determine is necessary to enable the preparation of financial statements of the Company that are free from material misstatement, whether due to fraud or error.
In preparing the financial statements of the Company, the Directors are responsible for assessing the ability of the Company to continue as a going concern, disclosing, as applicable, matters related to going concern and using the going concern basis of accounting unless the Directors either intend to liquidate the Company or to cease operations, or have no realistic alternative but to do so.
KPMG PLT(LLP0010081-LCA & AF 0758)Chartered AccountantsLevel 10, KPMG Tower8, First Avenue, Bandar Utama47800 Petaling JayaSelangor Darul Ehsan, Malaysia
Tel: +60(3) 7721 3388Fax: +60(3) 7721 3399Internet: www.kpmg.com.my
Independent Auditors’ Report to the members of MSIG Insurance (Malaysia) Bhd (Company No. 46983-W) (Incorporated in Malaysia)

92 ANNUAL REPORT 2016
Auditors’ Responsibilities for the Audit of the Financial Statements
Our objectives are to obtain reasonable assurance about whether the financial statements of the Company as a whole are free from material misstatement, whether due to fraud or error, and to issue an auditors’ report that includes our opinion. Reasonable assurance is a high level of assurance, but is not a guarantee that an audit conducted in accordance with approved standards on auditing in Malaysia and International Standards on Auditing will always detect a material misstatement when it exists. Misstatements can arise from fraud or error and are considered material if, individually or in the aggregate, they could reasonably be expected to influence the economic decisions of users taken on the basis of these financial statements.
As part of an audit in accordance with approved standards on auditing in Malaysia and International Standards on Auditing, we exercise professional judgement and maintain professional scepticism throughout the audit. We also:
• Identify and assess the risks of material misstatement of the financial statements of the Company, whether due to fraud or error, design and perform audit procedures responsive to those risks, and obtain audit evidence that is sufficient and appropriate to provide a basis for our opinion. The risk of not detecting a material misstatement resulting from fraud is higher than for one resulting from error, as fraud may involve collusion, forgery, intentional omissions, misrepresentations, or the override of internal control.
• Obtain an understanding of internal control relevant to the audit in order to design audit procedures that are appropriate in the circumstances, but not for the purpose of expressing an opinion on the effectiveness of the internal control of the Company.
• Evaluate the appropriateness of accounting policies used and the reasonableness of accounting estimates and related disclosures made by the Directors.
• Conclude on the appropriateness of the Directors’ use of the going concern basis of accounting and, based on the audit evidence obtained, whether a material uncertainty exists related to events or conditions that may cast significant doubt on the ability of the Company to continue as a going concern. If we conclude that a material uncertainty exists, we are required to draw attention in our auditors’ report to the related disclosures in the financial statements of the Company or, if such disclosures are inadequate, to modify our opinion. Our conclusions are based on the audit evidence obtained up to the date of our auditors’ report. However, future events or conditions may cause the Company to cease to continue as a going concern.
• Evaluate the overall presentation, structure and content of the financial statements of the Company, including the disclosures, and whether the financial statements of the Company represent the underlying transactions and events in a manner that gives a true and fair view.
We communicate with the Directors regarding, among other matters, the planned scope and timing of the audit and significant audit findings, including any significant deficiencies in internal control that we identify during our audit.
Report on Other Legal and Regulatory Requirements
In accordance with the requirements of the Companies Act, 1965 in Malaysia, we also report that in our opinion, the accounting and other records and the registers required by the Act to be kept by the Company have been properly kept in accordance with the provisions of the Act.
Other Matters
This report is made solely to the members of the Company, as a body, in accordance with Section 266 of the Companies Act, 2016 in Malaysia and for no other purpose. We do not assume responsibility to any other person for the content of this report.
KPMG PLT Khaw Hock Hoe(LLP0010081-LCA & AF 0758) Approval Number: 2229/04/18 (J)Chartered Accountants Chartered AccountantPetaling Jaya
Date: 21 March 2017

ANNUAL REPORT 2016 93
Notes

94 ANNUAL REPORT 2016
Notes


96 ANNUAL REPORT 2016
MSIG Insurance (Malaysia) Bhd (46983-W)
Head O�ce: Customer Service Centre,
Level 15, Menara Hap Seng 2, Plaza Hap Seng,
No. 1, Jalan P. Ramlee, 50250 Kuala Lumpur.
Tel: +603 2050 8228, Fax: +603 2026 8086
Customer Service Hotline: 1-800-88-MSIG (6744)
Email: [email protected]
Website: www.msig.com.my
www.facebook.com/MSIGMalaysia