Embed Size (px)
Citation preview

Innate immune responses to soluble factors from Pseudomonas aeruginosa
by
Mark Aaron Grabiner
A dissertation submitted in partial satisfaction of the requirements for the degree of
Doctor of Philosophy
in
Molecular and Cell Biology
in the
Graduate Division
of the
University of California, Berkeley
Committee in charge:
Professor Terry Machen, Chair
Professor Russell Vance
Professor Ehud Isacoff
Professor Kathleen Ryan
Fall 2013


1
Abstract
Innate immune responses to soluble factors from Pseudomonas aeruginosa
by
Mark Aaron Grabiner
Doctor of Philosophy in Molecular and Cell Biology
University of California, Berkeley
Professor Terry Machen, Chair
Pseudomonas aeruginosa are gram-negative bacteria that colonize the human airway.
They are of great clinical importance, especially for patients with the genetic disorder Cystic
Fibrosis, a disease characterized by persistent infection and hyper-inflammation in the airways
(Hoiby et al., 1977). The innate immune response to P. aeruginosa in airway cells consists of
fluid secretion driven by the Cystic Fibrosis Transmembrane conductance Regulator (CFTR) and
the release of inflammatory cytokines for the recruitment of phagocytes. The present work
addresses the role of two secreted products from P. aeruginosa and their effects on these
processes. Flagellin, the protein monomer of the P. aeruginosa flagellum, has been previously
shown to induce cytokine secretion through Toll-Like Receptor 5 (TLR5) (Zhang et al., 2005)
and to activate CFTR-mediated secretion through an unknown mechanism (Illek et al., 2008). In
the present study I attempted to discover the signaling pathway mediating CFTR secretion from
flagellin. Though this work did not yield a definitive pathway, many possibilities were explored
and the response to flagellin was better characterized than in previous work. In addition to my
study of flagellin, I also studied the effects of a P. aeruginosa quorum-sensing signaling
molecule, N-(3-Oxododecanoyl)-L-homoserine lactone (HSL-C12), on inflammatory signaling
in mammalian cells. Previous work has characterized the response to HSL-C12 as either pro- or
anti-inflammatory depending on the system used and the measurements taken (Telford et al.,
1998, Smith et al., 2001, Smith et al., 2002, Kravchenko et al., 2006, Jahoor et al., 2008,
Kravchenko et al., 2008). In my study I utilized both gene expression and cytokine secretion
measurements to determine that HSL-C12 has anti-inflammatory characteristics in short
treatments but pro-inflammatory characteristics in longer treatments and that both of these
phenotypes stem from an inhibition of host protein synthesis. Together with what is already
known about P. aeruginosa infection, my data helps to paint a picture of how secreted factors
affect the course of infection and inflammatory response to P. aeruginosa in the human airway.

i
TABLE OF CONTENTS
Title Page
Abstract
Table of Contents i
List of Figures ii
Abbreviations Used iii
Acknowledgements v
Chapter 1 1
Introduction 2
Materials and Methods 4
Results 5
Discussion 21
Chapter 2 23
Introduction 24
Materials and Methods 25
Results 27
Discussion 42
Conclusions 44
References 45

ii
LIST OF FIGURES
Chapter 1
Figure 1-1. Flagellin induces chloride current through the CFTR. 7
Figure 1-2. XesC and BAPTA reduce the amplitude of flagellin-induced CFTR currents. 8
Figure 1-3. Flagellin recruits STIM1 to membrane. 10
Figure 1-4. STIM1 shRNA functionally knocks down STIM1. 11
Figure 1-5. STIM1 shRNA does not prevent flagellin-induced CFTR currents. 12
Figure 1-6. Flagellin does not cause measureable cAMP increases in bulk extracts. 14
Figure 1-7. Apical apyrase has no effect on flagellin-induced chloride currents. 16
Figure 1-8. Basolateral Suramin has a non-specific effect on chloride currents. 17
Figure 1-9. Wortmannin inhibits Flagellin-induced and Forskolin-induced chloride currents. 19
Figure 1-10. bpV induces CFTR-dependent and CFTR-independent chloride currents. 20
Chapter 2
Figure 2-1. Effects of HSL-C12 and TNFα on KC secretion and gene expression. 28
Figure 2-2. Effects of HSL-C12 on protein synthesis. 29
Figure 2-3. WT and PERK-corrected PERK-/- MEF have similar PERK levels. 31
Figure 2-4. Effects of HSL-C12 on elF2α phosphorylation. 32
Figure 2-5. HSL-C12 protein synthesis block is PERK-dependent. 33
Figure 2-6. HSL-C12 effects on KC secretion and gene expression are PERK-dependent. 35
Figure 2-7. HSL-C12-induced degradation of IκBα is PERK-dependent. 36
Figure 2-8. HSL-C12 induced apoptosis is PERK-independent. 37
Figure 2-9. Effects of HSL-C12 + TNFα on KC secretion and gene expression at 4 + 8 hrs. 39
Figure 2-10. HSL-C12 reduces NF-κB luciferase at 2 hours and increases at 8 hours. 40
Figure 2-11. Flowchart of the inflammatory phenotypes during HSL-C12 treatment. 41
iii
ABBREVIATIONS USED
AC Adenylate Cyclase
AP Apical
ASL Airway Surface Liquid
ATP Adenosine Triphosphate
BAPTA 1,2-bis(o-aminophenoxy)ethane-N,N,N',N'-tetraacetic acid
BL Basolateral
bpV Potassium Bisperoxo(1,10-phenanthroline)oxovanadate (V)
Ca2+
Ionic Calcium
CaCC Ca2+
-activated Chloride Channels
cAMP Cyclic Adenosine Monophosphate
CF Cystic Fibrosis
CFTR Cystic Fibrosis Transmembrane conductance Regulator
cGKII cGMP-dependent Kinase II
Cl- Ionic Chloride
DMEM Dulbecco’s Modified Eagles Medium
eI-F2α Eukaryotic Initiation Factor 2 alpha
ELISA Enzyme Linked ImmunoSorbent Assay
GCN2 General Control Nonrepressed 2
GFP Green Fluorescent Protein
GPCR G-Protein Coupled Receptor
HSL-C12 N-(3-Oxododecanoyl)-L-homoserine lactone
IBMX Isobutylmethylxanthine
ICl Transepithelial chloride current
IκB Inhibitor of nuclear factor κB
IL-1β Interleukin 1 beta
IL-8 Interleukin 8
IP3R Inositol trisphosphate receptor
KC Keratinocyte-derived Chemokine
MEF Mouse Embryonic Fibroblasts
NBD Nucleotide Binding Domain
NF-κB Nuclear Factor κB
NKCC Na-K-Cl Cotransporter
PBS Phosphate Buffered Saline
PBSA Phosphate Buffered Saline with Bovine Serum Albumin
PBST Phosphate Buffered Saline with Tween-20
PDE Phosphodiesterase
PERK Eukaryotic translation initiation factor 2-alpha kinase 3
PI3K Phosphatidylinositide 3-kinase
PKA Protein Kinase A
PKC Protein Kinase C
PLC Phospholipase C
PM Plasma Membrane
PTEN Phosphatase and Tensin homolog
qPCR Quantitative Polymerase Chain Reaction
RIPA Radioimmunoprecipitation Assay Buffer

iv
SDS-PAGE SDS Polyacrylamide-Gel Electrophoresis
SERCA Sarco/Endoplasmic Reticulum Ca2+
-ATPase
SOCE Store-Operate Calcium Entry
SOcAMP Store-Operate cAMP
STIM1 Stromal Interaction Molecule 1
TNFα Tumor Necrosis Factor α
TLR5 Toll-Like Receptor 5
WT Wild Type
XesC Xestospongin C

v
ACKNOWLEDGEMENTS
I would like to thank and acknowledge the many people who made this work possible.
First I need to thank my friends and family whose immense support was necessary to help me
see this through. I’d like to thank my colleagues, especially Zhu Fu, Christian Schwarzer, Tara
Wu, Kevin Barry, Ryan Arant and Bharat Ravishankar for lending a hand, an ear, and their
valuable time. I also need to acknowledge the hard work of the members of my thesis committee
for guiding me to this point, especially Russell Vance for the many times he saved my project
with the right piece of information or the right experiment. Lastly, and most importantly, I need
to thank Terry Machen. This work would not exist and I would not be where I am today if it was
not for his support and his confidence in me. Terry, despite the limited resources available to
him, took me into his lab when my future in graduate school was looking very uncertain. He has
always been there for me to lend advice or just help me talk through an issue, but he has also
allowed me the independence to choose my own path. He gave me the necessary encouragement
and the occasional, also necessary, kick in the ass, but he was never harsh. I don’t think I would
have ever finished graduate school with any other PI, and I am forever indebted to him.

1
Chapter 1
CFTR currents induced by exposure to
Pseudomonas aeruginosa flagellin

2
INTRODUCTION
The flagellin protein from P. aeruginosa induces an increase in CFTR currents in airway
epithelial cells, through a mechanism that has not yet been fully elucidated (Illek et al., 2008).
Flagellin is the bacterial protein monomer that forms the bacterial flagellum. Flagellin peptides
are trafficked through both bacterial membranes via an export machinery similar to the type-
three secretion system. The peptides traverse the length of the nascent flagellum within the
hollow interior and are then positioned at the growing end with the help of a cap protein.
Flagellin contains an epitope that is recognized by the innate immune receptor toll-like receptor 5
(TLR5) (Hayashi et al., 2001). The epitope is buried in the intact flagellum but is accessible on
free flagellin (Smith et al., 2003). P. aeruginosa flagellin induces cytokine production in airway
epithelial cells through TLR5 signaling (Zhang et al., 2005). TLR5 activation, through the
mediator MyD88 and downstream targets, causes the phosphorylation and degradation of IκB,
the inhibitory subunit of the cytosolic NF-κB complex (Choi et al., 2010). The transcription
factor p65 is then freed to enter the nucleus and drive inflammatory gene transcription.
CFTR is a chloride/bicarbonate anion channel in the ABC protein transporter family that
is found prominently in many epithelia, but also in other cells like leucocytes, smooth muscle
and neurons, in the human body (Gadsby et al., 2006). Its role as an ion channel rather than a
transporter makes it unique among ABC proteins. CFTR possesses the classic ABC family
structure with two transmembrane domains, each with six membrane-spanning helices, along
with two nucleotide binding domains (NBDs) and a unique R domain. The R domain includes
multiple phosphorylation sites for both protein kinase A (PKA), the kinase activated by cyclic
adenosine monophosphate (cAMP), and protein kinase C (PKC), the kinase activated by Ca2+
and diacylglycerol (Cheng et al., 1991, Bear et al., 1992, Liedtke et al., 1998). Activation of
CFTR by cGMP-dependent kinase II (cGKII) has also been observed in fibroblasts, rat intestinal
cells, and human Clara airway cells (French et al., 1995, Kulaksiz et al., 2002). Phosphorylation
of the R domain by PKA allows the NBDs to bind two ATP molecules and dimerize in a head-
to-tail fashion, opening the channel (Gadsby et al., 1999). It has also been proposed that
phosphorylation of PKC sites is required for actions of PKA or that phosphorylation of PKC
sites facilitates the phosphorylation of PKA sites. Membrane-bound protein phosphatases of the
PP2C family constitutively dephosphorylate CFTR, thereby requiring active PKA to open CFTR
(Hanrahan et al., 2003). Excised patches of CFTR with no cAMP or PKA lose conductance in
about 10 seconds (Becq et al., 1994). Overall, it is clear that cAMP, acting through PKA, is
central to the regulation of CFTR, while Ca2+
and diacylglycerol, acting through PKC, may play
modulatory roles. cGMP acting through cGKII may also play a role in CFTR regulation, though
this has not been established in the cell types used for this study.
cAMP is produced by a group of enzymes called adenylate cyclases (ACs) and is
degraded by phosphodiesterases (PDEs) (Hanoune et al., 2001). Previous unpublished work in
the Machen lab had shown that cAMP is likely involved in flagellin-induced CFTR currents: the
PKA antagonist RpBrcAMPS prevented flagellin-induced chloride currents while the
phosphodiesterase blocker isobutylmethylxanthine (IBMX) enhanced flagellin-stimulated
currents. It had also been reported that flagellin stimulated release of ER calcium and increases
in cytosolic calcium in some human airway epithelial cell lines (Adamo et al., 2004, West et al.,
2005), though other airway lines showed no increases in cytosolic Ca2+
in response to flagellin
(Fu et al., 2007). ACs, which produce cAMP, have been shown to be regulated primarily by G

3
proteins, but also by Ca2+
and STIM1, a transmembrane ER calcium sensor responsible for
regulating store-operated calcium entry (SOCE) (Hanoune et al., 2001, Lefkimmiatis et al.,
2009). The ER lumenal side of STIM1 contains a calcium-binding EF hand, and the cytosolic
side contains protein interaction domains known to directly gate ORAI, the plasma membrane
(PM) calcium channel associated with SOCE (Ong et al., 2007). Calcium levels are maintained
in the ER through the action of the sarco/endoplasmic reticulum Ca2+
-ATPase (SERCA) which
pumps cytosolic calcium into the ER (Christensen et al., 1993). Calcium is released from the ER
primarily through the inositol trisphosphate receptor (IP3R), which is opened by the ligand
inositol trisphosphate produced by the enzyme phospholipase C (PLC). When calcium levels
drop in the ER, STIM1 forms multimers that translocate to portions of the ER adjacent to the
PM; STIM1 then activates ORAI and lets in a flood of extracellular calcium. It has been
proposed that calcium release from the ER can also activate cAMP production by ACs in a
STIM1-dependent manner in the absence of extracellular calcium (Lefkimmiatis et al., 2009).
These data suggested that STIM1 and AC interact directly. This signaling pathway was dubbed
store-operated cAMP (SOcAMP). Because SOcAMP requires the release of ER calcium, which
has been observed in response to flagellin by the Machen lab, but not necessarily an observable
increase in cytosolic calcium, which has not been observed by the Machen lab, I decided to
examine the role of calcium signaling, STIM1, and cAMP production in flagellin-induced CFTR
currents.
First, I examined the role of intracellular calcium signaling utilizing the calcium chelater
BAPTA and a pharmacological inhibitor of the IP3R. I explored the role of STIM1 using STIM1-
GFP to visualize translocation and shRNA to knock-down STIM1. I found that both free calcium
and the IP3R contributed to flagellin-induced CFTR currents, and that flagellin could cause
STIM1 to translocate proximal to the plasma membrane. However, STIM1 shRNA failed to
have any measurable effect on flagellin-induced CFTR currents. Lastly, I measured intracellular
cAMP production using an ELISA and found that flagellin does not cause a measureable
increase in whole cell cAMP levels.
In addition to calcium signaling, I also assayed the role of extracellular ATP in flagellin-
induced CFTR currents. ATP is used as a paracrine signaling molecule in multiple systems and
can induce the production of cAMP through GPCR receptors and activate a number of ion
channels. Extracellular ATP and UTP both cause fluid and chloride secretion from cultured
human airway epithelial cells (Benali et al., 1994). Extracellular ATP has also been implicated
in inflammatory signaling in asthma (Idzko et al., 2007). Lastly, flagellin has been shown to
cause ATP release by activating the signaling glycolipid asialoGM1 (McNamara et al., 2001,
Adamo et al., 2004, McNamara et al., 2006).
The ATP scavenging enzyme apyrase was utilized to remove free ATP from the
extracellular bath. Suramin, an inhibitor of GPCR’s and purinergic receptors, was utilized as
well. Though apyrase appeared to have an effect in earlier pilot experiments, in a larger number
of experiments apyrase did not have an effect on flagellin or forskolin induced currents. Suramin
did strongly curtail flagellin-induced currents, but also prevented forskolin-induced currents, so
the effect was likely non-specific. Overall, no evidence was found to support the notion that
extracellular ATP was involved in flagellin-induced CFTR currents.
Lastly, I examined the role of PI3K signaling in flagellin-induced CFTR currents. It has
been reported that flagellin causes activation of PI3K through TLR5 signaling as a mechanism

4
for reducing inflammatory signaling and hyperinflammation (Yu et al., 2006). It has also been
reported that inhibitors of PI3K reduce CFTR-mediated secretion in response to forskolin, which
activates adenylate cyclase, and genistein, which binds and directly activates CFTR (Tuo et al.,
2009, Tuo et al., 2011). The pharmacological inhibitor wortmannin was used to dampen PI3K
activity and potassium bisperoxo(1,10-phenanthroline)oxovanadate (bpV) was used to inhibit
Phosphatase and Tensin homolog (PTEN), the phosphatase that antagonizes PI3K activity.
Wortmannin decreased the magnitude of flagellin-induced CFTR currents when applied after
flagellin; bpV induced CFTR currents on its own, and flagellin increased the rate of current
increase when used after bpV. Together this data indicated that the PI3K pathway may be
involved in regulating flagellin-induced CFTR currents, however the effects may not be specific.
MATERIALS AND METHODS
Reagents
Unless otherwise stated, reagents were acquired from Sigma (St. Louis, MO). Purified,
recombinant P. aeruginosa flagellin (Enzo Life Sciences, Farmingdale, New York) was
reconstituted in water to 100µg/mL, aliquoted and stored at -80˚C. Individual aliquots were
thawed and immediately used for each experiment. CFTR-172 inhibitor and forskolin were both
prepared as 20mM stocks solutions in DMSO. Xestospongin C was reconstituted in ethyl
alcohol at 1mM. Thapsigargin was prepared as a 5mM stock in DMSO. IBMX was prepared as
a 100mM stock in DMSO. Apyrase powder was reconstituted in water to 2,000 Units/mL.
Suramin was prepared as a 100mM stock in water. Wortmannin was prepared as a 1mM stock in
DMSO. Potassium Bisperoxo(1,10-phenanthroline)oxovanadate (bpV) (EMD Millipore,
Darmstadt, Germany) was prepared as a 10mM stock in water.
Cell Culture
Calu-3 cells were cultured in DMEM supplemented with 10% FBS, 1% pen-strep, and
2mM L-glutamine. For Ussing chamber experiments, cells were passaged onto 1.12-cm2
permeable polycarbonate supports (0.4-μm pore size, Snapwell, Corning Costar, Cambridge,
MA) and then grown until cells formed confluent monolayers. JME(CF15) nasal epithelial cells
were cultured in DMEM/F-12 media supplemented with 10% FBS, 2 mM l-glutamine, 1%
penicillin/streptomycin, 10 ng/mL EGF, 1 μm hydrocortisone, 5 μg/mL insulin, 5 μg/mL
transferrin, 30 nM triiodothyronine, 180 μM adenine, and 5.5 μM epinephrine.
Transepithelial Electrophysiology
For measurements of transepithelial Cl− current, Calu-3 cell monolayers were grown on
permeable supports, washed in PBS, mounted into water-jacketed (37 °C) Ussing chambers
(Physiologic Instruments, San Diego). Transepithelial voltage (Vt), resistance (Rt), and short
circuit current (ISC) were measured using typical four-electrode voltage clamp with Ag/AgCl
electrodes (World Precision Instruments, Sarasota, FL) connected to the solutions through agar
bridges containing 1M KCl. Positive currents were defined as cation movement from mucosa to
serosa or anion movements in the opposite direction. Chamber compartments were separately
perfused with 5 ml of Krebs-Henseleit solutions. A serosal-to-mucosal Cl− gradient was used to
increase the electrochemical driving force for Cl− secretion across the apical membrane. The
5
basolateral solution contained (in mM) the following: 120 NaCl, 25 NaHCO3, 5 KCl, 1.2
NaH2PO4, 5.6 glucose, 2.5 CaCl2, and 1.2 MgCl2. The mucosal Cl−-free solution contained (in
mM) the following: 120 sodium gluconate, 20 NaHCO3, 5 KHCO3, 1.2 NaH2PO4, 5.6 glucose,
2.5 Ca(gluconate)2, and 1.2 MgSO4. Solutions were gassed with 95% O2 and 5% CO2 resulting
in pH 7.4. Voltage was clamped at 0mV across the epithelia with 1mV steps every 60 seconds to
aid in observing transepithelial conductance. Transepithelial ISC measured under these
conditions was termed ICl.
STIM1 TIRF Microscopy
JME cells were plated on cover glasses and incubated in growth media for 24 h before
co-transfection with STIM1-GFP and CD8-tagRFP. Cells were allowed to express for 48 h
before experiments were performed. Total internal reflection fluorescence measurements were
made to exclude fluorescence from the ER, and CD8-tagRFP was utilized to focus exclusively
on the cell’s plasma membrane and ensure that the focal plane did not change during the course
of the experiment. EGFP and tagRFP were alternately excited at 0.1 Hz by a 488-nm argon laser
and 532-nm DPSS laser, respectively. Fluorescence emissions of GFP (525/50-nm bandpass
filter, Chroma) and tagRFP (592/50-nm bandpass filter, Chroma) were acquired by an EMCCD
camera (Andor iXon DV-897 BV) with 500-ms exposure per frame. Base-line images were
acquired in standard Ringer's solution for 5 min before 1µg/mL flagellin was pipetted into the
imaging chamber. 20 min after adding flagellin, 2μM thapsigargin was added, and images were
taken for an additional 10 min. Fluorescence intensities were analyzed offline with ImageJ.
STIM1 RNAi
Plasmids expressing Stim1shRNA or non-silencing control shRNA from the GIPZ
Lentiviral shRNAmir Library (Dr. Greg Hannon ,CSHL, and Dr. Steve Elledge, Harvard) were
purchased from Thermo Scientific Open Biosystems (Huntsville, AL). Lentivirus particles were
produced by transfecting HEK293T cells with the shRNA vectors along with the helper plasmid
using the protocol from Nature Protocols 1, 241 - 245 (2006). The lentivirus was then used to
infect Calu-3 cells and stable lines were established using puromycin selection.
cAMP ELISA
Competitive cAMP ELISA was performed using the cAMP-Screen® System (Applied
Biosystems, Bedford, MA). Calu-3 cells were grown in 24 well plates and lysed with 100µL
lysis buffer. Manufacturer protocol was followed utilizing 60µL per sample.
RESULTS
Intracellular calcium stores contribute to flagellin-stimulated currents, but STIM1 and cAMP
production are not involved
Flagellin-induced chloride currents were measured by mounting Calu-3 human airway
epithelia cells in an Ussing chamber (Fig. 1-1) (Li et al., 2004a). Calu-3 cells were grown on
permeable membranes until they formed an epithelial monolayer. The monolayers were then
placed in an Ussing chamber, two-bath system with different solutions on the basolateral and

6
apical sides. A chloride gradient was established across the epithelial monolayer by using a high
chloride solution in the basolateral bath and a chloride free solution in the apical bath.
Electrodes in each bath were used to clamp voltage across the epithelium and measure chloride
current through the use of a balancing short circuit current. Forskolin, an activator of ACs, was
used in multiple experiments as a positive control for CFTR-mediated chloride currents, and
CFTR-172 inhibitor was used to determine if CFTR was the current conductor. To examine the
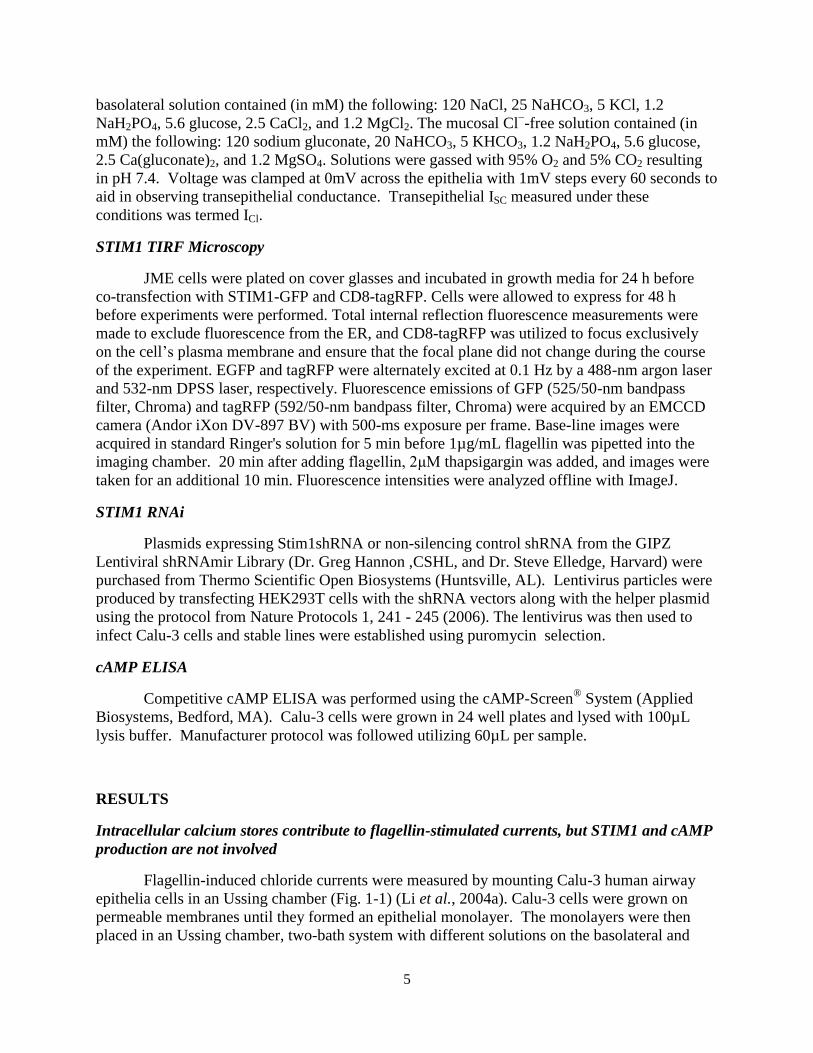
role of intracellular calcium signaling in flagellin-induced CFTR currents I began by employing
an inhibitor of the IP3R, Xestospongin C (XesC). Pretreatment of monolayers with 10µM XesC
in the apical bath reduced the average magnitude of flagellin-induced CFTR currents by
approximately 50% (Fig. 1-2 A,B). I then performed a similar experiment pre-treating Calu-3
cells for 90 minutes with the 20µM BAPTA-AM, a calcium chelator which enters the cell and
becomes trapped. BAPTA pretreatment had a similar effect to XesC, reducing the magnitude of
flagellin-induced chloride currents (Fig1-2 C,D). Adding flagellin and XesC or BAPTA at the
same time also altered the normal dynamics of the response. Monolayers that responded
strongly to flagellin exhibited oscillations in current magnitude with peaks occurring between 10
and 20 minutes apart (Fig. 1-1,1-2). XesC or BAPTA-treated cells exhibited either smaller
oscillations or no oscillations with a plateau once maximum current was reached, perhaps
indicating that the oscillations in chloride current were the result of oscillations in cytosolic
calcium. Though there are many examples of calcium oscillations in the literature (Dupont et al.,
2011), calcium oscillations with a period of more than 10 minutes would be novel.

7
0
5
10
15
20
25
ICl (m
A/c
m2
)
.1ug/ml Flagellin25uM CFTR inhb172
10 min
Figure 1-1. Flagellin induces chloride current through the CFTR. (A) Setup for Calu-3
monolayers in Ussing chambers with high basolateral chloride and low apical chloride,
voltage clamp and short-circuit current. Image courtesy of C. Schwarzer. (B) Calu-3
monolayers exposed to apical .1µg/mL flagellin followed by 25uM CFTRinhb172. Current
trace is representative of numerous experiments.
B A
8
0
5
10
15
20
25
30
35
0 20 40 60
I Cl(µ
A/c
m2)
Time (minutes)
flagellin flagellin + Xestospongin C
0
5
10
15
20
25
30
ΔI C
l (µ
A/c
m2)
flagellin
flagellin +Xestospongin C
Figure 1-2. Xestospongin C and BAPTA reduce the amplitude of flagellin-induced
CFTR currents. (A) Calu-3 monolayers mounted in Ussing chambers with high
basolateral chloride and low apical chloride exposed to apical .1µg/mL flagellin or
flagellin with 10uM Xestospongin C followed by 20µM CFTR172 inhibitor.
Representative current traces. (B) Maximum change in current displayed as group
averages from (A) with error bars representing standard error. N=3 biological replicates
for each treatment. (C) Calu-3 monolayers either pretreated for 90 min with 20µM
BAPTA-AM or untreated and mounted in Ussing chambers and exposed to apical
.1µg/mL flagellin followed by 20µM CFTR172 inhibitor. Representative current traces.
(D) Maximum change in current displayed as group averages from (C) with error bars
representing standard error. N=3 biological replicates for each treatment.
B A
0
5
10
15
20
25
30
35
0 200 400 600 800
I Cl(µ
A/c
m2)
Time (Seconds)
flagellin flagellin + BAPTA
0
5
10
15
20
25
30
ΔI C
l(µA
/cm
2)
flagellinflagellin + BAPTA
D C

9
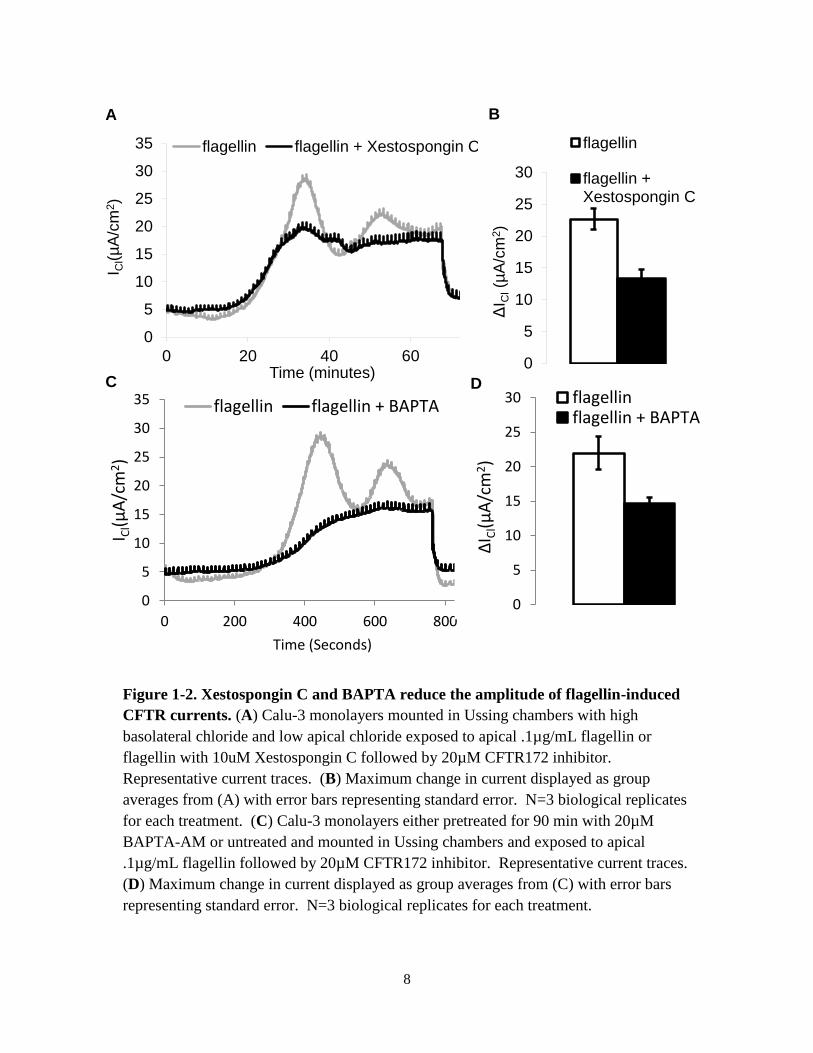
Given the implicated role of the IP3R, I next examined the role of the ER calcium sensor
STIM1. JME nasal epithelial cells were transfected with STIM1-GFP and imaged using TIRF
fluorescence. In this system, an increase in fluorescence signal implies that STIM1 is
translocating proximal to the plasma membrane, a necessary step in its activated signaling
pathway. In most experiments, 1µg/mL flagellin caused an increase in STIM1-GFP TIRF signal
(Fig. 1-3). The addition of the SERCA blocker thapsigargin, which lowers ER calcium levels by
inhibiting the pump used to refill the ER, caused an increase in STIM1-GFP TIRF signal that
was roughly 2-3 times that of flagellin. These data indicated that flagellin was releasing a
fraction of stored calcium from the ER and partially activating STIM1, a requirement for
activating SOCE and/or SOcAMP. Thapsigargin fully releases ER calcium and further increases
STIM1 activation. This experiment however comes with a number of caveats. In this
experiment, STIM1 was overexpressed, perhaps leading to enhanced sensitivity to minor
changes in ER calcium levels. Since STIM1 is held inactive by free Ca2+
in the ER lumen, more
STIM1 would require more Ca2+
to prevent activation and could lead to higher baseline STIM1
activation and increased sensitivity to small changes in Ca2+
. Flagellin also failed to induce a
response in several experiments, including many in which thapsigargin continued to have an
effect.
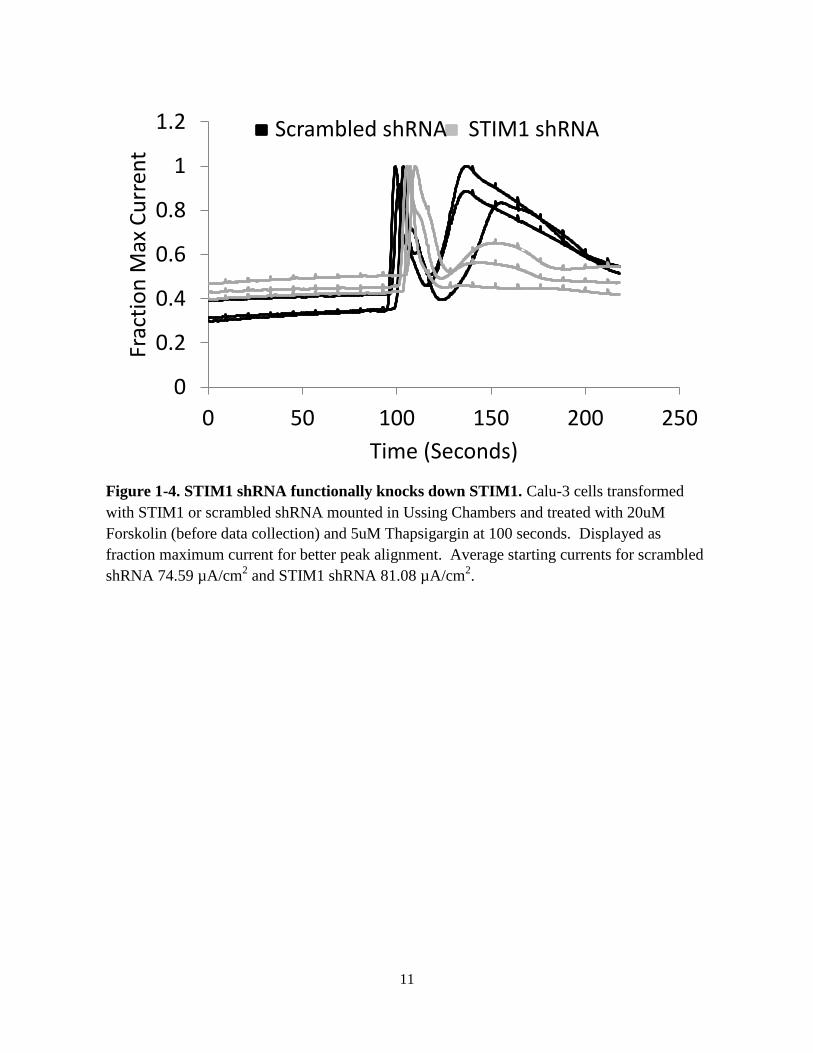
As a further test of the role of STIM1 in flagellin signaling, I utilized Calu-3 cells
prepared by Zhu Fu which had been infected with STIM1 shRNA via a lentiviral vector. The
efficacy of the shRNA was measured by RT-PCR and through a functional assay. The functional
assay consisted of placing STIM1 shRNA and scrambled shRNA Calu-3 monolayers in Ussing
chambers, inducing a maximal CFTR current using forskolin, and then measuring responses to
thapsigargin which induces a current through calcium-gated chloride channels. In scrambled
shRNA Calu-3 monolayers, thapsigargin induced sequential increases in chloride current (Fig. 1-
4). The first increase likely resulted from release of calcium into the cytosol from the ER,
activating Ca2+
-activated chloride channels (CaCC) in the apical plasma membrane to directly
increase chloride current and/or Ca2+
-activated potassium channels in the basolateral membrane
that hyperpolarize the cell and drive chloride across the apical membrane through either CFTR or
CaCC. The second phase of the current response to thapsigargin likely resulted from STIM1
activating ORAI and allowing calcium to enter the cytosol from the extracellular bath. In STIM1
shRNA Calu-3 cells the first current increase from thapsigargin was present and similar to
scrambled shRNA. However, the second increase in current attributed to STIM1 was absent or
greatly muted in all STIM1 shRNA Calu-3 monolayers, indicating a functional knockdown of
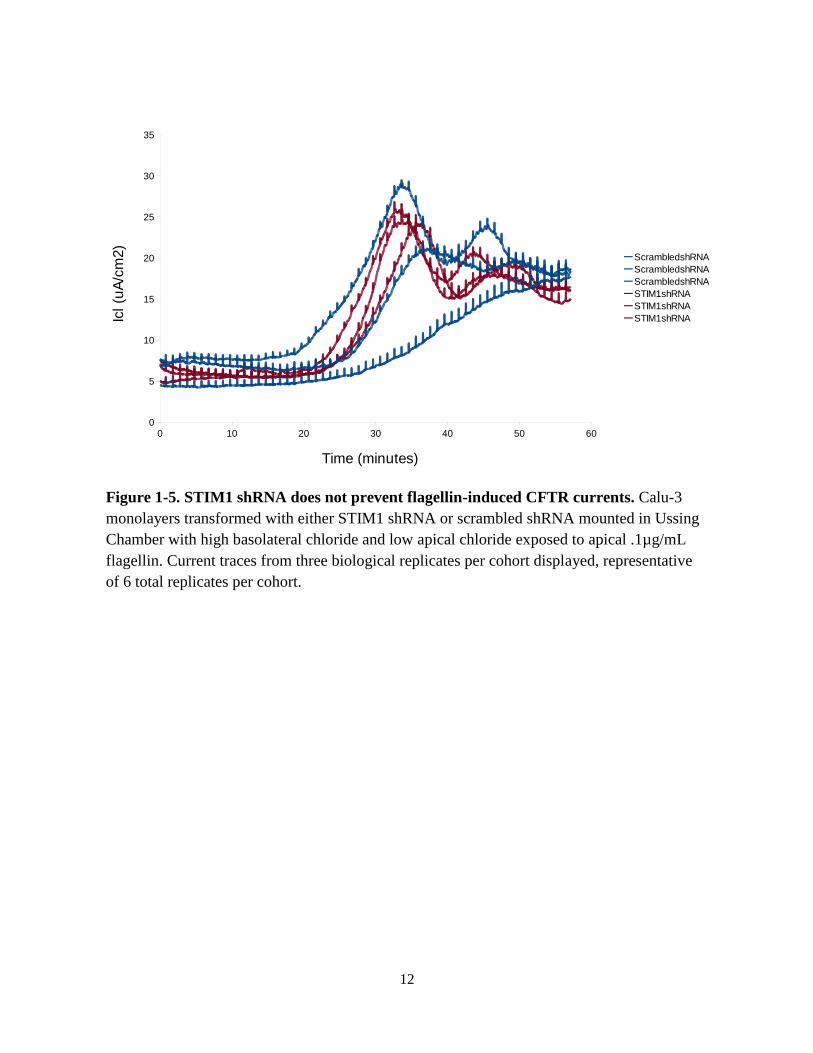
STIM1. With this information, I went on to treat STIM1 shRNA and scrambled shRNA Calu-3
monolayers with 0.1µg/mL flagellin (Fig. 1-5). There was no difference in flagellin-induced
CFTR currents between STIM1 and scrambled shRNA Calu-3 cells, indicating that functional
STIM1 was likely not required for flagellin-induced CFTR currents.
10
Figure 1-3. Flagellin recruits STIM1 to membrane. JME cells transfected with STIM1-
GFP and imaged using TIRF microscopy with indicated treatments. Representative of
multiple experiments. Data courtesy of Ryan Arant (UC Berkeley).
11
Figure 1-4. STIM1 shRNA functionally knocks down STIM1. Calu-3 cells transformed
with STIM1 or scrambled shRNA mounted in Ussing Chambers and treated with 20uM
Forskolin (before data collection) and 5uM Thapsigargin at 100 seconds. Displayed as
fraction maximum current for better peak alignment. Average starting currents for scrambled
shRNA 74.59 µA/cm2 and STIM1 shRNA 81.08 µA/cm
2.
0
0.2
0.4
0.6
0.8
1
1.2
0 50 100 150 200 250
Frac
tio
n M
ax C
urr
ent
Time (Seconds)
Scrambled shRNA STIM1 shRNA
12
0 10 20 30 40 50 600
5
10
15
20
25
30
35
ScrambledshRNA
ScrambledshRNA
ScrambledshRNA
STIM1shRNA
STIM1shRNA
STIM1shRNA
Time (minutes)
Icl (u
A/c
m2)
Figure 1-5. STIM1 shRNA does not prevent flagellin-induced CFTR currents. Calu-3
monolayers transformed with either STIM1 shRNA or scrambled shRNA mounted in Ussing
Chamber with high basolateral chloride and low apical chloride exposed to apical .1µg/mL
flagellin. Current traces from three biological replicates per cohort displayed, representative
of 6 total replicates per cohort.

13
To test the final part of the SOcAMP hypothesis, that flagellin was eventually causing
cAMP production, I performed a cAMP ELISA. The idea that flagellin was inducing cAMP
production was based on experiments showing that the addition of a competitive inhibitor to
cAMP, RpBrcAMPS, prevented CFTR responses to flagellin. However, ELISA experiments in
Calu-3 cells showed no increase in cAMP levels in flagellin treated cells, even in the presence of
the PDE inhibitor IBMX (Fig. 1-6). Calu-3 cells treated with forskolin in the same experiment
showed a 50-fold increase in cAMP levels.
There are three possible explanations for the difference between the RpBrcAMPS data
and the ELISA data. The first is that the ELISA assay is insufficiently sensitive to measure
small, local changes in cAMP that may activate PKA adjacent to nearby CFTR at the apical
membrane (Sun et al., 2000, Naren et al., 2003).
A second possible explanation for the apparent discrepancy between the ELISA data and
the electrophysiological data with RpBrcAMPS is centered around the fact that the current
response to flagellin in Calu-3 cells is inconsistent. Current measurements in response to
flagellin often yielded minimal or no responses. As much of the variance in flagellin response
occurred from one day to the next, the inconsistency could be accounted for in
electrophysiological experiments by using multiple replicates and only taking data from days in
which control experiments consistently showed a strong response to flagellin. In the ELISA
experiment we have no way of knowing whether or not CFTR currents were elicited in these
cells, so the lack of cAMP production may just be because no flagellin response occurred.
A third possibility is that RpBrcAMPs reduces PKA activity that is required for flagellin
to trigger an increase in current, i.e., cAMP is necessary but not sufficient for flagellin-activation
of CFTR. This possibility is consistent with the data in the literature that shows that CFTR
excised in patches and removed from PKA loses conductance in seconds (Becq et al., 1994).
Thus, even if flagellin were not acting through cAMP/PKA, a drop in PKA activity might greatly
hinder CFTR currents of all types.
Overall, these data were inconclusive about the role of PKA in regulating CFTR in
response to flagellin stimulation. The possibility still exists that PKA, PKC or cGKII may be
effectors in this response.

14
Figure 1-6. Flagellin does not cause measureable cAMP increases in bulk extracts. Calu-
3 cells pretreated for 30 minutes with 50µM IBMX (PDE Inhibitor) followed by 30 minutes
with 1µg/mL Flagellin or 20µM Forskolin added. Cell extracts were taken and cAMP ELISA
was performed with standards. N=3 biological replicates, error bars indicate standard error.

15
Extracellular ATP is not required for flagellin-induced CFTR currents
Next, I examined the role of paracrine ATP signaling in flagellin responses. The ATP
scavenging enzyme apyrase was added to the apical bath before flagellin treatment. Although an
initial experiment from Bharat Ravishankar showed a repression of the flagellin response under
these conditions, this conclusion was based on only one replicate. When I repeated the
experiment, I saw no correlation between the presence of apyrase and the magnitude of flagellin
or forskolin responses (Fig 1-7). In addition to the experiments with apyrase, suramin, an
inhibitor of purinergic receptors and GPCRs, was also tested for its efficacy in preventing
flagellin-induced CFTR currents. Though suramin added to the basolateral bath did prevent
flagellin-induced CFTR currents, it also greatly reduced the size of forskolin responses, so the
inhibitory effect may not have been specific to flagellin signaling (Fig 1-8). The fact that
suramin was only effective when added to the basolateral bath suggests that it must be acting on
a protein in the basolateral membrane. I could find no explanation for this effect based on
published interactions of suramin. One novel possibility is that it is in an inhibitor of the Na-K-
Cl cotransporter (NKCC), which is in the basolateral membrane and is required for chloride
transport across the epithelium. Taken together, the lack of a phenotype observed with apyrase
treatment and the non-specific effect seen from suramin indicated that paracrine ATP signaling
may not have been involved in flagellin-induced CFTR currents.

16
0
50
100
150
200
0 20 40 60I C
l(µA
/cm
2)
Time (Seconds)
ATP
ATP +Apyrase
0
5
10
15
20
25
30
Flagellin
ΔI C
l(µA
/cm
2)
Control Apyrase
B A
Figure 1-7. Apical apyrase has no effect on flagellin-induced chloride currents. (A)Calu-
3 cells mounted in Ussing Chambers and treated apically with buffer control or 2 U/mL
apyrase followed by .1 µg/mL flagellin and then 20µM forskolin. Data displayed as average
changed in current from pre-treatment minimum to post-treatment maximum. N=3
biologicals replicates, error bars indicate standard error. (B) Calu-3 cells mounted in Ussing
chambers with 50µM ATP or 50µM ATP preincubated for 10min with 2 U/mL apyrase
applied to basolateral bath.

17
0
20
40
60
80
100
120
140
0 200 400 600 800
I Cl(µ
A/c
m2)
Time (Seconds)
Control
Apical Suramin
Apical + Basolateral SuraminSuramin
Flagellin
Forskolin
Figure 1-8. Basolateral Suramin has a non-specific effect on chloride currents. Calu-3
cells mounted in Ussing Chambers and either untreated, treated with 1mM apical suramin or
.5mM apical and basolateral Suramin followed by .1 µg/mL flagellin and then 20µM
forskolin. Representative traces from three experiments plotted.
18
Flagellin and the PI3K pathway
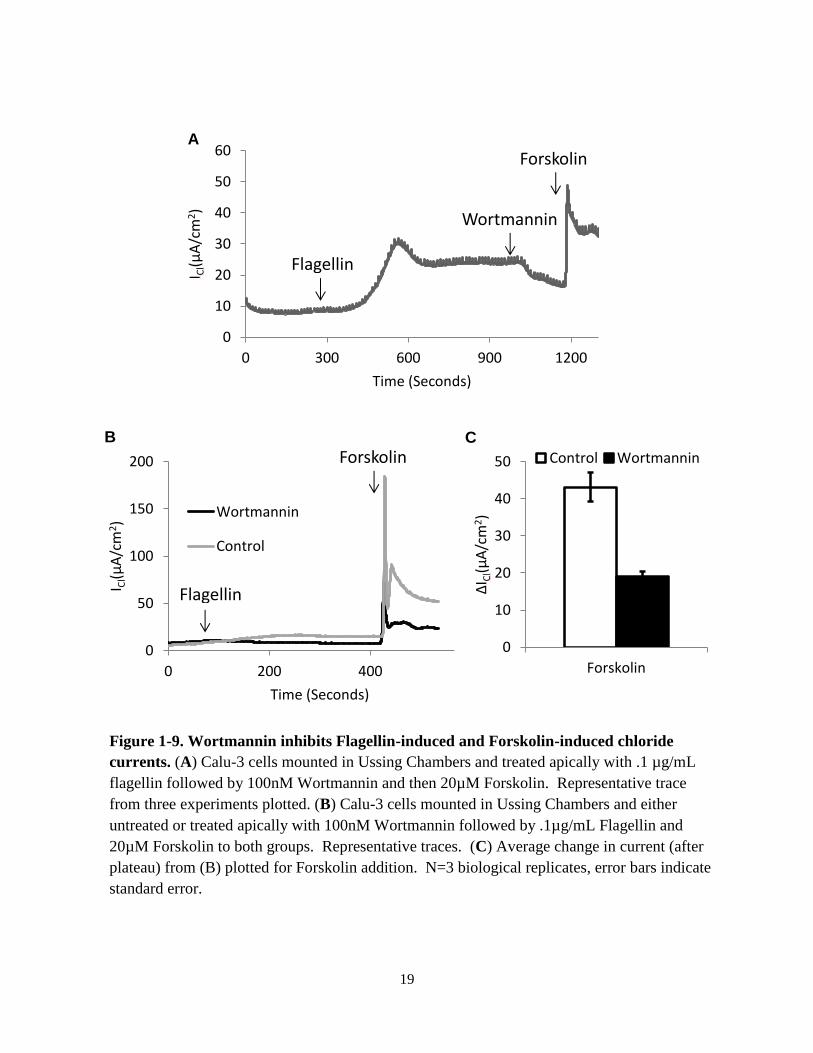
Lastly, I examined interaction between flagellin-induced chloride currents and the PI3K
pathway. When applied to the apical bath after flagellin stimulation, wortmannin, the PI3K
inhibitor, caused a decrease in chloride current (Fig. 1-9). However, wortmannin treatment also
caused a more than 50% reduction in forskolin induced chloride currents. This finding is
consistent with previous published work (Tuo et al., 2009, Tuo et al., 2011). This result
suggests that wortmannin’s effect on flagellin currents may not be specific. I further explored
the role of the PI3K pathway with the PTEN inhibitor bpV. PTEN is the phosphatase which
antagonizes PI3K, so inhibiting PTEN should have a similar effect to activating PI3K. bpV
caused an increase in chloride currents in Calu-3 cells which was partially inhibited by CFTR-
172 inhibitor, however chloride currents continued to increase after the addition of the inhibitor
with increasing conductance as seen during the voltage steps (Fig. 1-10). Addition of flagellin
after bpV increased the rate with which both the chloride current and conductance increased.
The large conductance observed was consistent with the breakdown of epithelial integrity, either
through cell death or the loss of tight junction integrity. The caspase inhibitor ZVAD was
utilized to examine the role of programmed cell death. Pretreatment with ZVAD failed to
prevent the large conductance caused by bpV and flagellin, suggesting that this effect was likely
due to the loss of tight junction integrity, not due to caspase-dependent programmed cell death.
This is consistent with published work which has shown that PI3K co-immunoprecipitates with
occludin and PI3K inhibition increases epithelial and endothelial barrier function during
conditions of inflammatory stimulation or oxidative stress (Sheth et al., 2003, Cain et al., 2010).
Taken together, these data reflect that flagellin likely causes activation of PI3K and that this
activity may be involved both in CFTR-dependent chloride conductance and loss of tight
junction barrier function.
19
0
50
100
150
200
0 200 400 600
I Cl(µ
A/c
m2)
Time (Seconds)
Wortmannin
Control
0
10
20
30
40
50
60
0 300 600 900 1200
I Cl(µ
A/c
m2)
Time (Seconds)
Wortmannin
Flagellinn
Forskolin
0
10
20
30
40
50
Forskolin
ΔI C
l(µA
/cm
2)
Control Wortmannin
B
A
Figure 1-9. Wortmannin inhibits Flagellin-induced and Forskolin-induced chloride
currents. (A) Calu-3 cells mounted in Ussing Chambers and treated apically with .1 µg/mL
flagellin followed by 100nM Wortmannin and then 20µM Forskolin. Representative trace
from three experiments plotted. (B) Calu-3 cells mounted in Ussing Chambers and either
untreated or treated apically with 100nM Wortmannin followed by .1µg/mL Flagellin and
20µM Forskolin to both groups. Representative traces. (C) Average change in current (after
plateau) from (B) plotted for Forskolin addition. N=3 biological replicates, error bars indicate
standard error.
Flagellinn
Forskolin
C
20
0
10
20
30
40
50
0 200 400 600 800
I Cl(µ
A/c
m2)
Time (Seconds)
bpV
CFTR-172
0
20
40
60
80
100
120
0 200 400 600 800 1000 1200
I Cl(µ
A/c
m2)
Time (Seconds)
bpV
bpV + Flag
bpV + Flag + ZVAD
ZVAD
Flagellin bpV
B
A
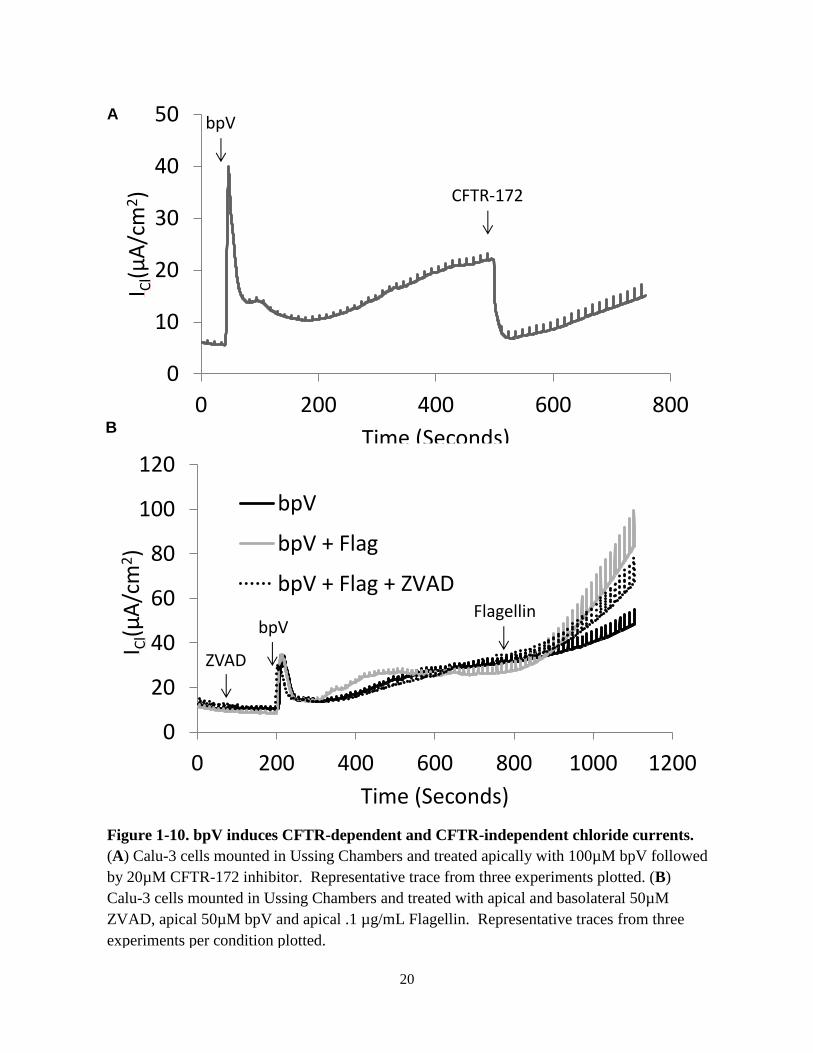
Figure 1-10. bpV induces CFTR-dependent and CFTR-independent chloride currents.
(A) Calu-3 cells mounted in Ussing Chambers and treated apically with 100µM bpV followed
by 20µM CFTR-172 inhibitor. Representative trace from three experiments plotted. (B)
Calu-3 cells mounted in Ussing Chambers and treated with apical and basolateral 50µM
ZVAD, apical 50µM bpV and apical .1 µg/mL Flagellin. Representative traces from three
experiments per condition plotted.

21
DISCUSSION
In this study I have explored possible mechanisms for flagellin-induced chloride currents
in human airway cells. I found that intracellular calcium signaling may have contributed to, but
was not necessary for, flagellin-induced chloride currents. This was evidenced by the smaller
magnitude currents observed when cells were treated with XesC, an inhibitor of the IP3R, or the
calcium chelator BAPTA. I found that STIM1 may be recruited to the plasma membrane during
flagellin exposure, however STIM1 shRNA experiments failed to have any effect on flagellin-
induced chloride currents. I also failed to find any new evidence of cAMP production in
response to flagellin as measured through an ELISA, though this does not preclude smaller, local
changes regulating PKA and CFTR activity. Apyrase, the ATP scavenging enzyme, had no
effect on flagellin responses, and suramin, a purinergic receptor angtagonist, had only non-
specific effects on chloride currents, leading to the conclusion that paracrine ATP signaling was
not necessary for flagellin-induced chloride currents. Lastly, through the use of kinase and
phosphatase inhibitors, I found that PI3K activity may contribute to flagellin-induced chloride
currents, though this effect may be due to regulation of tight junction barrier integrity, not the
CFTR.
The connection between known flagellin signaling pathways and CFTR regulation
remains unclear. There is no established signaling pathway that links TLR5 activation to
adenylate cyclase activity. Adenylate cyclases are most commonly activated by G-protein
coupled receptors (GCPRs), suggesting that TLR5-induced autocrine signaling of some form
may lead to adenylate cyclase activation (Hanoune et al., 2001). This study suggests that if
autocrine signaling is responsible flagellin-induced chloride currents, the signaling molecule is
unlikely to be ATP. Adenylate cyclases can also be activated in multiple ways through
intracellular calcium signaling. In addition to free calcium and calmodulin, it has been reported
that drops in ER calcium can lead to adenylate cyclase activity through activation by the ER
calcium sensor STIM1 (Lefkimmiatis et al., 2009). This study offers evidence that cytosolic
calcium released from the ER through the IP3R may contribute to flagellin-induced chloride
currents, however STIM1 does not appear to be necessary for this effect. This suggests that
signaling from TLR5 may lead to ER calcium release, and this has been observed in response to
flagellin in the literature (McNamara et al., 2006), however the known pathway leading from
TLR5 to ER calcium involves autocrine ATP signaling, which I found no evidence for in this
study. I did find evidence that PI3K activity contributes to flagellin-induced chloride currents,
and PI3K is known to be activated by TLR5 signaling to reduce inflammatory gene expression
(Yu et al., 2006), however PI3K inhibitors also reduce chloride secretion induced by forskolin.
The loss of epithelial integrity observed with bpV treatment indicates that the effects of PI3K on
flagellin-induced chloride currents may be the result of altered tight junction barrier function.
From this study I conclude that cytosolic calcium and PI3K activity contribute to
flagellin-induced chloride currents, though neither appears to be necessary, and PI3K activity
may not relate to CFTR-dependent currents. This remains an interesting field a study with the
possibility of discovering a novel pathway linking flagellin receptors to CFTR activity, however
this research is severely hindered by the inconsistent response to flagellin I observed in Calu-3
cells. Attempts to study flagellin-induced chloride currents in CFTR-corrected CFBE cells were
even less promising. Until a reliable system for studying this effect can be discovered, it will

22
remain a very difficult task to decipher the signaling cascade which leads from flagellin exposure
to CFTR-dependent chloride secretion.

23
Chapter 2
Effects on immune signaling of Pseudomonas
aeruginosa quorum sensor HSL-C12

24
INTRODUCTION
Pseudomonas aeruginosa are gram-negative bacteria that form biofilms in the airways of
patients with Cystic Fibrosis (CF) (Hoiby et al., 1977). P. aeruginosa coordinate the production
of biofilms using the small molecule N-(3-oxododecanoyl)-homoserine lactone (HSL-C12) as a
diffusible quorum-sensing molecule (Schuster et al., 2006, Rumbaugh, 2007, Irie et al., 2008).
HSL-C12 has multiple effects on mammalian cells, including inducing apoptosis and activating
store-operated calcium signaling (Tateda et al., 2003, Li et al., 2004b, Jacobi et al., 2009, Li et
al., 2009, Schwarzer et al., 2010, Schwarzer et al., 2012). HSL-C12 has also been reported to
affect inflammatory signaling, though some reports indicate an activation of pro-inflammatory
signaling while others indicate a suppression of inflammatory signaling (Telford et al., 1998,
Smith et al., 2001, Smith et al., 2002, Kravchenko et al., 2006, Jahoor et al., 2008, Kravchenko
et al., 2008).
The goal of this study was to elucidate HSL-C12’s role in inflammatory signaling and
discover associated effector molecules. To accomplish this we used mouse embryonic fibroblasts
(MEF). Fibroblasts are expected to be exposed to the membrane-permeant HSL-C12 in P.
aeruginosa biofilm-infected lungs. In addition, MEF are a genetically tractable system with
many knockout lines available. We measured expression and secretion of KC, the mouse
equivalent of human IL-8, because it is an important cytokine mediating epithelial immunity
produced in response to NF-κB signaling. TNFα and IL-1β were utilized as potent activators of
the NF-κB pathway. We found that HSL-C12 increased KC gene expression, but prevented KC
secretion, even in the presence of TNFα or IL-1β. This uncoupling of gene expression from
secretion appeared to result from an inhibition of protein synthesis. Because HSL-C12 is known
to release Ca2+
from the endoplasmic reticulum (ER) (Shiner et al., 2006, Schwarzer et al., 2010,
Schwarzer et al., 2012) and reductions in ER [Ca2+
] trigger ER stress (Kaufman, 1999), we
explored the role of ER stress transducers in HSL-C12-mediated translation inhibition.
PERK, a kinase embedded in the ER membrane, is one of four kinases known to
phosphorylate the eukaryotic translation elongation factor eI-F2α (Harding et al., 1999). PERK
becomes activated when BiP chaperone proteins, which usually inhibit PERK, release PERK and
are sequestered to the ER lumen due to a buildup of unfolded proteins (Bertolotti et al., 2000).
eI-F2α is a translation elongation factor which, when phosphorylated on serine 52 (51 in human),
causes selective inhibition of protein synthesis and allows only certain chaperones and ER stress
response proteins to be translated (Hinnebusch, 1994). We observed that HSL-C12’s stimulation
of KC gene expression and inhibition of KC secretion in WT and PERK-corrected PERK-/-
MEF
were greatly reduced in PERK-/-
MEF. HSL-C12 also caused an increase in KC secretion in a
PERK-dependent manner in longer treatment regimens. Together these data suggest that HSL-
C12, through its effector PERK, reduces KC secretion in the short term but could contribute to a
hyper-inflammatory state in the long term.

25
MATERIALS AND METHODS
Reagents
Unless otherwise specified, reagents and chemicals were obtained from Sigma. HSL-C12
(Cayman Chemical, Ann Arbor MI and Sigma) was dissolved in DMSO as 50mM stock ad
freeze thaw cycles were limited. HSL-C12 from different suppliers displayed different activities
and therefore 50uM or 100uM doses were used accordingly. TNFα and IL-1β (both R&D
Systems, Minneapolis, MN) were used at 10ng/mL from 10μg/mL stock solutions in water. The
Ca2+
-ATPase blocker thapsigargin (Christensen et al., 1993) was prepared as a 1 mM stock in
DMSO and used at 1 μM.
Cell Culture of MEF
WT MEF were obtained from C. Li (Univ. Louisville). PERK-/-
and corresponding
PERK-corrected PERK-/-
MEF cells lines were obtained from R. Kaufman (Sanford|Burnham
Medical Research Institute). MEF were cultured in Dulbecco’s Modified Eagles Medium
(DMEM) containing 10% FBS and 1% penicillin-streptomycin. The cells were passaged at 1:5-
1:15 dilutions and the remaining cell suspension was seeded directly onto a 24-well, 12-well or
6-well tissue culture plate (BD Falcon, Bedford, MA).
ELISA and quantitative PCR for KC
WT, PERK-/-
and PERK-corrected PERK-/-
MEF were grown to confluency on 24-well
plates, and experimental cells were treated for 4hrs with HSL-C12 (50 µM), TNFα (10-20
ng/ml), IL-1β (10ng/mL) or HSL-C12 in combination with TNFα or IL-1β. The cell culture
medium was removed, the cells were washed with PBS, and samples were taken using TRIzol
reagent (Life Technologies, Grand Island, NY). ELISAs were performed using R&D Systems
Duo Set® kit (R&D Systems, Minneapolis, MN). Capture antibodies were incubated on Nunc
MaxiSorp 96-well plates in 0.1M sodium phosphate buffer pH 8.0 overnight at 4°C, and then the
plates were blocked with DPBS with 1% BSA (PBSA) for 4hrs at 4°C. 50uL of culture media
per well were taken from the MEF’s and applied to the plate overnight at 4°C, followed by five
washes with PBS with 0.1% Tween-20 (PBST) and biotinylated capture antibodies in PBSA for
2 hrs at room temperature. Five more PBST washes were performed followed by 30 mins of
streptavidin-HRP at room temperature. After five more PBST washes wells were developed for
10 min at room temperature in the dark with 1mg/ml OPD in 0.05M sodium phosphate/0.02M
Citrate buffer, pH 5.0 and stopped with 3M HCl. Absorbance was read in a spectrophotometer at
490nm.
Extensive cell death in longer HSL-C12 treatments required that the KC ELISA be
normalized to cell number. This was accomplished by normalizing to [protein] adherent to the
cell culture plate after washing. Samples were taken from organic phase from TRIzol preparation
and dot-blotted onto filter paper. Filter paper was then stained with Coomassie Blue and then
destained with 10% methanol 10% acetic acid. Filter paper was then scanned and quantified
using ImageJ. KC concentrations obtained through ELISA were then divided by [protein]
acquired through dot-blot. This normalization was only performed for experiment in Figure 7.
For qPCR experiments, purified RNA samples from TRIzol lysates were treated with
DNase (Frementas, Glen Burnie, Maryland) and then reverse transcribed using SuperScript III
26
(Life Technologies, Grand Island, NY) with random primers. KC gene expression level was
determined by real-time PCR carried out in 7900HT Fast Real-Time PCR System (Applied
Biosystems) with SYBR mix (KAPA Biosystems, Woburn, MA) using gene-specific primers.
House-keeping gene Rps17 was used as normalization control throughout all experiments, and
all data are presented as RQ score relative to RPS17. Primers used for real-time PCR were: KC:
forward: 5′-CTTGAAGGTGTTGCCCTCAG-3′ and reverse: 5′-
TGGGGACACCTTTTAGCATC-3′. Rps17: forward: 5’-CGCCATTATCCCCAGCAAG-3’ and
reverse: 5’-TGTCGGGATCCACCTCAATG-3’
Western Blotting
MEF were grown in 6-well plates to confluency and treated for up to 4 hours with HSL-
C12 or 1 hour with 1μM thapsigargin and then lysed in M-PER mammalian protein extraction
reagent (Pierce, Rockford, IL) containing 5 μg/ml leupeptin, 5 μg/ml pepstatin, 1 mM
phenylmethylsulfonyl fluoride, and 50 nM calyculin A. Protein sample concentrations were
determined with Bradford reagent (Bio-Rad, Hercules, CA). Immunoblot analysis was performed
by first separating protein (10 to 50 μg/lane) by sodium dodecyl sulfate-polyacrylamide gel
electrophoresis and subsequently transferring it to nitrocellulose membranes. Individual gels
with identical loading were run side by side when multiple primary antibodies were utilized.
Membranes were blocked (5% nonfat dried milk) in 20 mM Tris-HCl (pH 7.5)-150 mM NaCl-
0.1% Tween 20 for 1 hour and then incubated with specific antibodies overnight. Primary
antibodies (diluted 1:1,000 in blocking buffer) for phosphoS51- eI-F2α (119A11), eI-F2α (9722),
IκΒα (L35A5), and NF-κB p65 (C22B4) were acquired from Cell Signaling (Danvers, MA).
Binding of primary antibodies was visualized by enhanced chemiluminescence with horseradish
peroxidase-conjugated secondary antibodies (1:2,500 in blocking buffer) and Renaissance
Chemiluminescence Reagent Plus (Perkin-Elmer Life Sciences). Quantitation was performed
with ImageJ (National Institutes of Health, Bethesda, MD).
35S uptake into protein
Figure 2-2: WT MEF were grown in 24-well plates to confluency. Wells were pretreated
for 3hrs with either 50µM HSL-C12 or DMSO (control). At 3hrs post-infection, medium was
removed and incubated with 25 μCi/ml [35
S]methionine (Perkin Elmer, Waltham, MA) in RPMI
1640 medium without methionine supplemented with 10% serum, 2 mM L-glutamine, and 50µM
HSL-C12 or DMSO. Cells were labeled for 1hr, washed three times with cold PBS, and then
lysed with radioimmunoprecipitation assay (RIPA) buffer supplemented with 2 mM Na3VO4, 1
mM PMSF, 25 mM NaF, and 1x Roche protease inhibitor mixture (no EDTA) (pH 7.2) for 10
min at 4°C. Total protein levels were measured by bicinchoninic acid assay, and equal amounts
of protein were mixed with SDS sample buffer (40% glycerol, 8% SDS, 2% 2-ME, 40 mM
EDTA, 0.05% bromophenol blue, and 250 mM Tris-HCl [pH 6.8]), boiled for 5 min, and then
separated by SDS-PAGE. The gels were stained with Coomassie blue to show equal protein
loading, dried, and exposed to a phosphor screen and visualized using a Typhoon Trio imager
(GE Healthcare).
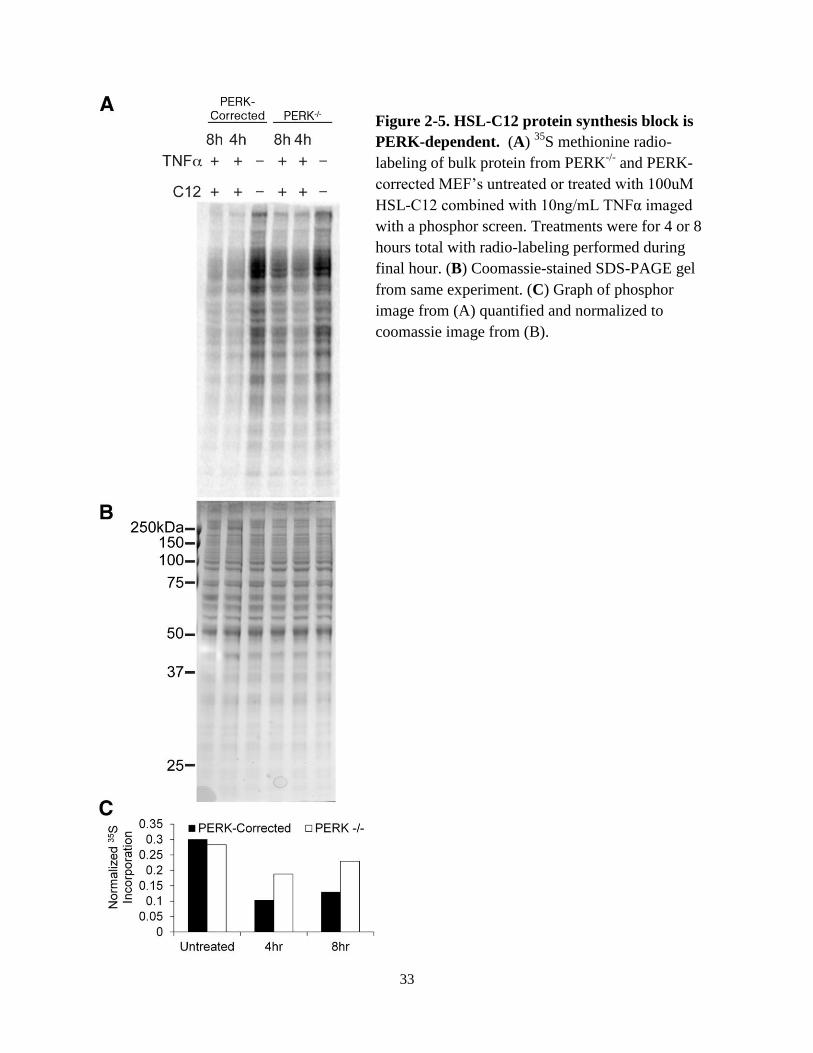
Figure 2-5: Same as Figure 2, with treatments of 100uM HSL-C12 combined with
10ng/mL TNFα for 3 or 7 hours pre-labeling. Phosphor and coomassie images were quantified
using ImageJ (NIH, Bethesda, MD).
27
RESULTS
Short Exposures to HSL-C12 Reduces KC Secretion and Inhibits Protein Synthesis
In order to determine HSL-C12’s effects on inflammatory signaling in MEF we measured
both cytokine gene expression using quantitative PCR (qPCR) and protein secretion into the cell
medium using ELISA. MEF were treated for 4 hours with HSL-C12 (50µM), TNFα (10ng/mL)
or a combination of the two. Results have been summarized in Figure 2-1. TNFα caused an
increase in both KC gene expression and secretion as expected. In contrast, HSL-C12 caused
increases in KC gene expression but decreased KC secretion. When TNFα was given in
combination with HSL-C12, KC gene expression increased but KC secretion decreased when
compared to TNFα alone. Similar results were obtained when IL-6 secretion and gene expression
were measured by ELISA and qPCR, respectively (data not shown).
The decoupling of gene expression and protein secretion caused by HSL-C12 could have
been due to either a block of KC protein synthesis or an inhibition of protein secretion. To
distinguish between these two possibilities we utilized a 35
S-methionine metabolic labeling
approach to measure global translation levels in MEF after treatment with HSL-C12 (Fig. 2-2).
During the final hour of HSL-C12 or DMSO 4 hour treatments on WT MEF’s, the media were
replaced with media in which the only source of methionine was radioactive 35
S-methionine.
Any new proteins synthesized during this time would incorporate radioactive methionine, and
the level of incorporation will be directly proportional to the amount of translation occurring in
those cells. When protein samples were taken, run on an SDS-PAGE gel and exposed on a
phosphor screen, WT MEF samples treated with only DMSO contained radio-labeled proteins
over a wide range of molecular weights (Fig. 2-2A). In contrast, MEF treated with HSL-C12
showed very little 35
S-labeling, indicating that HSL-C12 was inducing a block in protein
synthesis. Coomassie labeling of the SDS-PAGE gel revealed equal protein loading between
lanes (Fig. 2-2B), indicating that the difference in radio-labeling was not caused by differential
loading. These results suggested that the decoupling of KC gene expression and protein secretion
in MEF caused by HSL-C12 was the result of a global reduction in protein synthesis.

28
Figure 2-1. Effects of HSL-C12 and TNFα on KC secretion and gene expression. (A) KC
ELISA. WT MEF were rinsed with fresh media then treated for 4 hours with TNFα, HSL-C12
or TNFα+HSL-C12, and samples were taken from cell medium. Averages +/- Std. Error. (B)
Quantitative PCR. RNA was isolated from cells in (A), and cDNA was formed for qPCR
assay. Results are given as RQ score normalized to RPS17 cDNA. Averages displayed with
min and max. N=3 biological replicates for all conditions.

29
Figure 2-2. Effects of HSL-C12 on protein synthesis. (A) 35
S methionine radio-labeling of
bulk protein from 50µM HSL-C12 or DMSO mock-treated WT MEF imaged with a phosphor
screen. HSL-C12 treatments were for 4 hours total with radio-labeling performed during final
hour. (B) Coomassie-stained SDS-PAGE gel from same experiment. Results are
representative of two experiments.

30
ER Stress Transducer PERK Plays a Role in HSL-C12-Mediated Translation Inhibition
HSL-C12 has previously been shown to induce the phosphorylation of eI-F2α
(Kravchenko et al., 2006), and given the known effects of HSL-C12 on the ER (Shiner et al.,
2006, Schwarzer et al., 2010, Schwarzer et al., 2012) we explored the role of ER stress
transducers in HSL-C12-mediated translation inhibition. The kinase PERK is well established to
induce translation-inhibition in response to ER stress by phosphorylating the initiation factor eI-
F2α (Harding et al., 1999). To assay the role of PERK in HSL-C12-mediated inhibition of
translation, we compared HSL-C12-induced responses in PERK-/-
and corresponding PERK-
corrected PERK-/-
(PERK-corrected) MEF cell lines. Western blot analysis indicated that PERK
levels were similar in the WT and PERK-corrected PERK-/-
MEF and PERK was absent in
PERK-/-
MEF (Fig. 2-3A,B). WT and PERK-corrected PERK-/-
MEF also displayed a similar gel
shift when treated with HSL-C12, consistent with phosphorylation and activation of PERK (Fig.
2-3C). We tested the functional PERK activity of these cell lines by activating ER stress using
the common ER stress inducer thapsigargin (Christensen et al., 1993, Harding et al., 1999).
There was only a small increase in eI-F2α phosphorylation in PERK-/-
cells, while PERK-
corrected cells displayed much more phosphorylation as measured in western blots (Fig. 2-3D).
Similarly, HSL-C12 increased eI-F2α phosphorylation in PERK-corrected cells compared to
PERK-/-
cells, particularly during the first two hours of treatment (Fig. 2-4). Finally, when cells
were treated with both HSL-C12 and TNFα, there was greater inhibition of protein synthesis in
PERK-corrected than PERK-/-
cells as measured by 35
S labeling (Fig. 2-5). Similar results were
obtained with HSL-C12 treatment alone (data not shown). Together these results indicated that a
portion of HSL-C12’s inhibitory effects on protein synthesis resulted from activation of PERK
and the phosphorylation of eI-F2α.

31
Figure 2-3. WT and PERK-corrected PERK-/-
MEF have similar PERK levels. (A) WT,
PERK-corrected PERK-/-
(PC), and PERK-/-
(P-/-
) MEF were either untreated or treated for 1
hour with 100µM HSL-C12. Protein samples were taken, run at equal concentrations on an
SDS-PAGE gel, and western blots were performed using anti-PERK and anti-α/βTubulin
antibodies. (B) Results from untreated lanes from (A) quantified and displayed as ratio PERK
to α/βTubulin. Results typical of two experiments. (C) PERK-corrected PERK-/-
(PC) and
PERK-/-
(P-/-
) MEF’s were either untreated or treated for 1 hour with 1µM thapsigargin to
activate ER stress. Protein samples were taken, run at equal concentrations on an SDS-PAGE
gel, and western blots were performed using anti-phosphoS51-eI-F2α and anti-eI-F2α
antibodies. (D) Results from (C) quantified and displayed as ratio phosphoS51-eI-F2α to bulk
eI-F2α. Results typical of two experiments.

32
Figure 2-4. Effects of HSL-C12 on elF2α phosphorylation. PERK-/-
and PERK-corrected
MEF were treated with 50µM HSL-C12 for 0, 1, 2, 3 or 4 hours. (A) Protein samples were
taken, and run at equal concentrations on an SDS-PAGE gel; western blots were performed
using anti-phosphoS51-eI-F2α and anti-eI-F2α antibodies. (B) Results from (A) were
quantified and displayed as the ratio of phosphoS51-eI-F2α to bulk eI-F2α. (C) Average
induction of eI-F2α phosphorylation (treated divided by untreated) in response to 1hr 100uM
HSL-C12 from western blots. N=2 biological replicates, error bars indicate std. error. *p =
0.00463 in unpaired 2-tailed T-test.
33
Figure 2-5. HSL-C12 protein synthesis block is
PERK-dependent. (A) 35
S methionine radio-
labeling of bulk protein from PERK-/-
and PERK-
corrected MEF’s untreated or treated with 100uM
HSL-C12 combined with 10ng/mL TNFα imaged
with a phosphor screen. Treatments were for 4 or 8
hours total with radio-labeling performed during
final hour. (B) Coomassie-stained SDS-PAGE gel
from same experiment. (C) Graph of phosphor
image from (A) quantified and normalized to
coomassie image from (B).

34
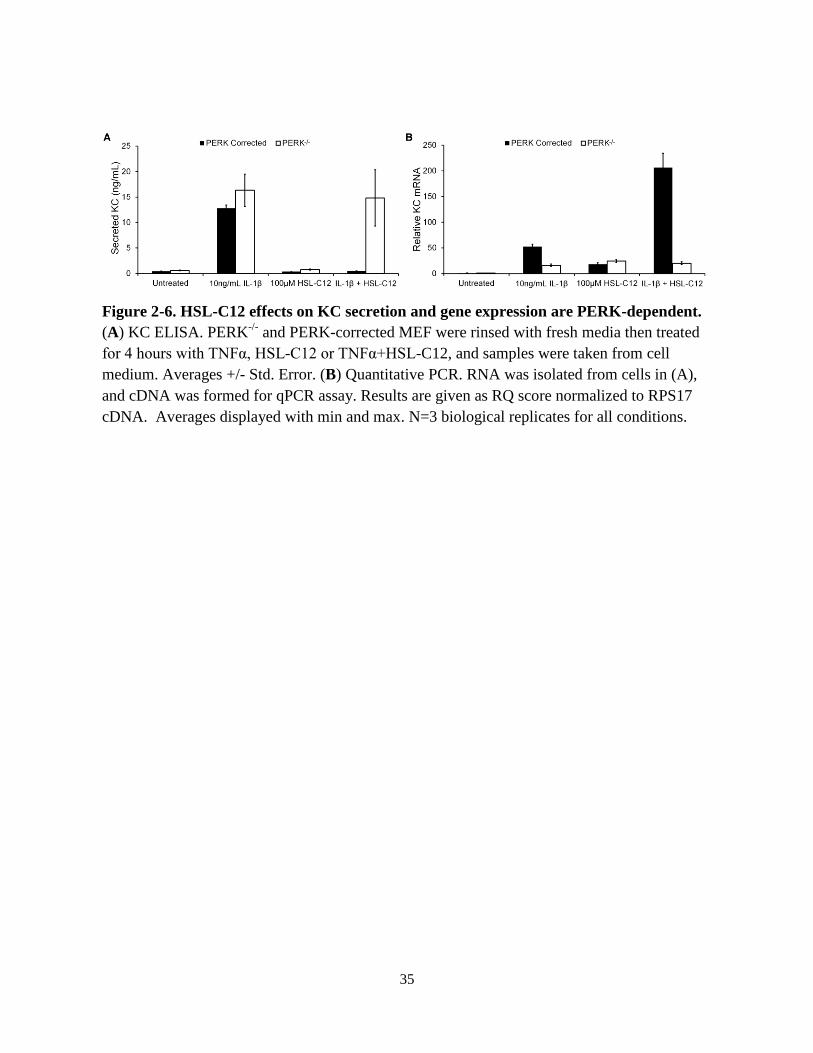
HSL-C12’s Effects on KC Expression and Secretion in MEF’s are PERK-dependent
The data to this point suggested that HSL-C12 caused a PERK-dependent block in host
translation that inhibited the production of the inflammatory cytokine KC. Therefore, we
explored PERK’s role in the KC responses observed during HSL-C12 treatment. Similar to WT
MEF, PERK-corrected MEF secreted very little KC when co-treated with both IL-1β (utilized
here because it is a more potent activator of the NF-κB pathway than TNFα in MEF) and HSL-
C12 for 4 hours (Fig. 2-6A). Conversely, when co-treated with IL-1β and HSL-C12, PERK-/
MEF displayed KC secretion levels similar to IL-1β treatment alone after 4 hours. These data
indicated that the HSL-C12-induced block of protein synthesis that is responsible for the
reduction in cytokine secretion by MEF was dependent on the kinase PERK and the
phosphorylation of eIF2a.
HSL-C12 treatment increased cytokine gene expression so we tested PERK’s role in this
induction. After 4 hours of IL-1β and HSL-C12 co-treatment, PERK-corrected MEF exhibited
higher levels of KC gene expression than cells treated with IL-1β alone (Fig. 2-6B), similar to
the effects on WT MEF. Interestingly, PERK-/-
MEF showed similar levels of KC gene
expression during IL-1β treatment either in the absence or presence of HSL-C12. HSL-C12 on
its own did increase KC gene expression in PERK-/-
MEF, possibly through another effector
pathway, but unlike the PERK-corrected MEF, this effect was not synergistic when combined
with IL-1β.
The synergy between IL-1β and HSL-C12 in PERK-corrected MEF’s may be explained by the
inhibition of protein synthesis. IκB, the repressor of NF-κB, is a high-turnover protein
(Krappmann et al., 1997). Treatment with an activator of the NF-κB pathway causes
phosphorylation of IκB and increased degradation. It has been reported that activators of PERK,
including UV-light, can lead to NF-κB signaling by inhibiting protein synthesis, thereby
decreasing the available pool of IκB (Wu et al., 2004). We measured IκBα and p65 (a subunit of
NF-κB) levels and found that over the course of 4 hours, HSL-C12 caused IκBα levels to
decrease more in PERK-corrected than PERK-/-
cells, particularly during the first two hours of
treatment (Fig. 2-7A). Levels of p65 were similar between the two lines, so the ratio of p65 to
IκB, and therefore potential NF-κB activity, was greater in PERK-corrected cells during the first
two hours of treatment. These results indicated that PERK was responsible for a major part of
both the anti-secretion and also the pro-gene expression effects of HSL-C12 on cytokines. By
inhibiting protein synthesis, PERK may have prevented the production and secretion of KC,
while synergistically increasing KC gene expression when co-treated with IL-1β by causing
reduced re-synthesis of the NF-κB repressor, IκB.
Given the apparent role for PERK in HSL-C12 inflammatory phenotypes, we also tested
whether PERK might play a role in other HSL-C12-triggered responses. PERK and other
members of the unfolded protein response are known to produce pro-apoptotic signals under
certain conditions (Jordan et al., 2002, Oyadomari et al., 2002). However, caspase 3/7 activation
assays did not reveal any differences between PERK-corrected and PERK-/-
cells treated with
HSL-C12 (Fig. 2-8). HSL-C12 has also been reported to cause depolarization of mitochondrial
membrane potential (Schwarzer et al., 2012), but PERK-corrected and PERK-/-
cells showed
similar HSL-C12-induced rates of depolarization of mitochondrial membrane potential as
measured using the dye JC-1 (data not shown). Together these results indicated that HSL-C12
affected KC signaling and apoptosis through different pathways.
35
Figure 2-6. HSL-C12 effects on KC secretion and gene expression are PERK-dependent.
(A) KC ELISA. PERK-/-
and PERK-corrected MEF were rinsed with fresh media then treated
for 4 hours with TNFα, HSL-C12 or TNFα+HSL-C12, and samples were taken from cell
medium. Averages +/- Std. Error. (B) Quantitative PCR. RNA was isolated from cells in (A),
and cDNA was formed for qPCR assay. Results are given as RQ score normalized to RPS17
cDNA. Averages displayed with min and max. N=3 biological replicates for all conditions.

36
Figure 2-7. HSL-C12-induced degradation of IκBα is PERK-dependent. PERK
-/- and
PERK-corrected MEF were treated with 100µM HSL-C12. (A) Protein samples were taken
from cells at times shown, and run at equal concentrations on an SDS-PAGE gel; western
blots were performed using anti-IκBα and anti-p65 antibodies. (B) Results from (A)
quantified and displayed as ratio p65 to bulk IκBα. High ratios indicate high potential for NF-
κB p65 driven transcription. Results typical of two experiments.

37
Figure 2-8. HSL-C12 induced apoptosis is PERK-independent. PERK-/-
and PERK-
corrected MEF’s were treated with increasing doses of HSL-C12, and caspase 3/7 activation
was measured. N=3 biological replicates, averages with std. error plotted.
38
HSL-C12-mediated Block of KC Secretion is Temporary
It has been reported that HSL-C12’s effects vary based on the length of exposure
(Vikström et al., 2006). We therefore compared HSL-C12’s effects on TNFα-induced KC
secretion and gene expression during 4 and 8 hour treatments. At 4 hours, HSL-C12 inhibited
TNFα-induced KC secretion and increased TNFα-induced KC gene expression in PERK-
corrected cells (Fig. 2-9). However, at 8 hours, HSL-C12 caused an increase in TNFα-induced
KC secretion but only minimally increased KC expression, especially compared to the effects at
4 hours, in PERK-corrected cells. This transition from suppression to induction of cytokine
protein was confirmed in WT MEF using an NF-κB-driven luciferase assay (Fig. 2-10). This
assay was not performed in PERK-corrected or PERK-/-
MEF due to reduced transfection
efficiencies. There were no apparent effects of HSL-C12 on TNFα-induced KC gene expression
or secretion in PERK-/-
MEF at either four or eight hours.

39
Figure 2-9. Effects of HSL-C12 and TNFα on KC secretion and gene expression at 4 and
8 hrs. (A) KC ELISA. PERK-/-
and PERK-corrected MEF’s were rinsed with fresh medium
and then treated for 4 and 8 hours with the indicated treatments, and samples were taken from
cell medium. To account for cell death, results were normalized to adherent protein collected
from trizol preparation as measured via protein dot blot (data not shown). Averages +/- Std.
Error. (B) Quantitative PCR. RNA was isolated from cells in (A), and cDNA was formed for
qPCR assay. Results are given as RQ score normalized to RPS17 cDNA. Averages displayed
with min and max. N=3 biological replicates for all conditions. *p = 0.0337 in unpaired 2-
tailed T-test.

40
Figure 2-10. HSL-C12 reduces NF-κB luciferase at 2 hours and increases at 8 hours. WT
MEF were transfected with a luciferase reporter plasmid utilizing the NF-κB responsive
promoter from the ELAM gene. Cells were either untreated, treated with 10ng/mL IL-1β or a
combination of IL-1β and 100uM HSL-C12. Cells were harvested after 2 or 8 hours of
treatment and samples were analyzed for protein concentration and luciferase activity.
Luciferase activity normalized to protein concentration and then to the untreated condition for
each time point is plotted. N=4 biological replicates, averages with std. error plotted.

41
Figure 2-11. Flowchart showing the inflammatory phenotypes observed during HSL-
C12 treatment. See text for details.

42
DISCUSSION
In this study we showed that HSL-C12 reduced KC secretion in 4 hour-treatments, but
increased KC secretion in 8 hour-treatments in wild type MEF. Both of these effects were
greatly reduced in cells that did not express the ER stress mediator PERK. HSL-C12 also caused
the phosphorylation of eI-F2α and inhibition of protein synthesis, and again these effects were
muted, though not fully ablated, in PERK-/-
MEF. These data were consistent with the
interpretation that HSL-C12 acts through the effector proteins PERK and eI-F2α to inhibit
protein synthesis, leading to decreased cytokine secretion in the short term (4 hrs), and increased
cytokine secretion in the long term (8 hrs), particularly in the presence of the pro-inflammatory
mediators IL-1β and TNFα.
A flow chart summarizing our conclusions about the effects of HSL-C12 is presented in
Fig. 2-11. HSL-C12 causes the activation of PERK and the subsequent phosphorylation of eI-
F2α and inhibition of protein synthesis. Since HSL-C12 causes the release of calcium stores from
the ER, and many of the ER chaperones require calcium, it is possible that reducing calcium
levels in the ER activates the unfolded protein response and PERK (Christensen et al., 1993,
Harding et al., 1999). This is supported by the similarity between responses to HSL-C12 and
thapsigargin in PERK-/-
and PERK-corrected MEF (Figs. 2-3, 2-4). Once eI-F2α is
phosphorylated, new inflammatory protein production will likely be reduced, leading to low
levels of secreted cytokines, even in the presence of ligands like TNF and IL-1 that normally
induce inflammatory secretion. However, phosphorylation of eI-F2α also prevents the re-
synthesis of IκB, the NF-κB inhibitor. IκB is a high turnover protein (Krappmann et al., 1997),
and as IκB levels fall, NF-κB can enter the nucleus and induce transcription of inflammatory
gene products. Though HSL-C12-induced protein synthesis inhibition persists up to 8 hours (Fig.
4), HSL-C12 increases TNFα-induced KC secretion by 8 hours (Fig. 7), perhaps because the
large amount of KC mRNA produced at 4 hours (Fig. 5) is sufficient to induce increased KC
translation and secretion even under conditions of reduced translation. Though protein synthesis
is still inhibited in these cells, it does still occur and therefore high transcript levels could lead to
preferential translation.
The present work also suggests that HSL-C12 acts through multiple effector pathways in
mammalian cells. For example, we observed that PERK was not required for HSL-C12 to
activate caspase 3/7 or depolarize the mitochondrial membrane potential. The presence of some
eI-F2α phosphorylation and the partial inhibition of protein synthesis observed in PERK-/-
cells
treated with HSL-C12 was likely the result of another of HSL-C12’s effector pathways. One
potential candidate is the eI-F2α kinase GCN2, which is activated by metabolic stress through
the buildup of unloaded tRNAs (Harding et al., 2003). HSL-C12’s effects on the mitochondria
(Kravchenko et al., 2006, Schwarzer et al., 2012) may lead to metabolic stress and subsequent
GCN2 activation.
Although it has not been fully established that HSL-C12 is an important virulence factor
for P. aeruginosa in vivo, the present results help to paint a picture of how HSL-C12’s effects on
inflammatory signaling could affect the course of P. aeruginosa infection. HSL-C12 secreted by
P. aeruginosa would have the short term effects of creating gaps in epithelia resulting from its
proapoptotic effects (Tateda et al., 2003, Li et al., 2004b, Jacobi et al., 2009, Schwarzer et al.,
2012), while suppressing immune signaling. This would allow P. aeruginosa access to the

43
basolateral membrane, an important factor for virulence (Hybiske et al., 2004), while avoiding
immune detection. However, in the long term, HSL-C12 may increase cytokine secretion and
contribute to the hyperinflammatory state observed in CF patients infected with P. aeruginosa.
PERK’s role in this effect also suggests ties to phenotypes observed in cells from CF patients.
CF airway cells are characterized by increased ER volume and a chronically active unfolded
protein response (Martino et al., 2009), perhaps indicating prolonged exposure to ER stress
inducers like HSL-C12. This study suggest that HSL-C12 may be an important factor in P.
aeruginosa infections, and it deserves further study.

44
CONCLUSIONS
Cystic Fibrosis is the most prevalent genetic disorder among Caucasians and
Pseudomonas aeruginosa infections represent a clinically significant problem for sufferers of CF
(Hoiby et al., 1977). Existing treatments for CF are costly and fail to fully address the issues
stemming from the disease. As CF appears to be in part a disease of hyperinflammation, the
study of the inflammatory responses to P. aeruginosa remains an important field. This study is
complicated by the various secreted factors from P. aeruginosa which affect immune secretion
and signaling. The present study highlights the complicated nature of the mammalian response
to P. aeruginosa factors. The data acquired from flagellin-induced chloride secretion paint a
picture of multiple signaling pathways affecting secretion through the CFTR, and perhaps
through tight junctions as well. The data acquired on HSL-C12’s effects on cytokine secretion
show a bi-phasic response mediated by multiple effector pathways as well, though my data
suggest that the ER stress transducer PERK is mostly responsible for HSL-C12’short term anti-
inflammatory and long term pro-inflammatory effects. There remain multiple questions to be
answered in both of these systems. It is still unclear which receptor is mediating flagellin-
induced chloride currents and what the primary intracellular effector molecules are. It is also
unclear which receptor is mediating HSL-C12 responses and if PERK’s role in HSL-C12
responses is an effect of the canonical UPR pathway observed when cells are treated with
thapsigargin or tunicamycin or a novel use of PERK. Lastly, it remains to be seen if P.
aeruginosa biolfilms will have a similar effect on inflammatory signaling as purified HSL-C12
and if the PERK-mediated response exists in other cell types and is an important factor is P.
aeruginosa infections. The present study shows that the study of P. aeruginosa secreted factor
holds promise for understanding P. aeruginosa infections in CF, but much work remains to be
done and there are many gaps left to bridge.
45
REFERENCES
Adamo, R., Sokol, S., Soong, G., Gomez, M.I. and Prince, A. (2004). Pseudomonas aeruginosa
flagella activate airway epithelial cells through asialoGM1 and toll-like receptor 2 as well
as toll-like receptor 5. American journal of respiratory cell and molecular biology 30,
627-634.
Bear, C.E., Li, C., Kartner, N., Bridges, R.J., Jensen, T.J., Ramjeesingh, M. and Riordan, J.R.
(1992). Purification and functional reconstitution of the cystic fibrosis transmembrane
conductance regulator (CFTR). Cell 68, 809-818.
Becq, F., Jensen, T.J., Chang, X.-B., Savoia, A., Rommens, J.M., Tsui, L.-C., et al. (1994).
Phosphatase inhibitors activate normal and defective CFTR chloride channels.
Proceedings of the National Academy of Sciences 91, 9160-9164.
Benali, R., Pierrot, D., Zahm, J.M., de Bentzmann, S. and Puchelle, E. (1994). Effect of
extracellular ATP and UTP on fluid transport by human nasal epithelial cells in culture.
American Journal of Respiratory Cell and Molecular Biology 10, 363-368.
Bertolotti, A., Zhang, Y., Hendershot, L.M., Harding, H.P. and Ron, D. (2000). Dynamic
interaction of BiP and ER stress transducers in the unfolded-protein response. Nat Cell
Biol 2, 326-332.
Cain, R.J., Vanhaesebroeck, B. and Ridley, A.J. (2010). The PI3K p110α isoform regulates
endothelial adherens junctions via Pyk2 and Rac1. The Journal of cell biology 188, 863-
876.
Cheng, S.H., Rich, D.P., Marshall, J., Gregory, R.J., Welsh, M.J. and Smith, A.E. (1991).
Phosphorylation of the R domain by cAMP-dependent protein kinase regulates the CFTR
chloride channel. Cell 66, 1027-1036.
Choi, Y.J., Im, E., Chung, H.K., Pothoulakis, C. and Rhee, S.H. (2010). TRIF mediates Toll-like
receptor 5-induced signaling in intestinal epithelial cells. Journal of Biological Chemistry
285, 37570-37578.
Christensen, S.B., Andersen, A., Poulsen, J.-C.J. and Treiman, M. (1993). Derivatives of
thapsigargin as probes of its binding site on endoplasmic reticulum Ca2+ ATPase:
Stereoselectivity and important functional groups. FEBS Letters 335, 345-348.
Dupont, G., Combettes, L., Bird, G.S. and Putney, J.W. (2011). Calcium Oscillations. Cold
Spring Harbor Perspectives in Biology 3.
French, P.J., Bijman, J., Edixhoven, M., Vaandrager, A.B., Scholte, B.J., Lohmann, S.M., et al.
(1995). Isotype-specific activation of cystic fibrosis transmembrane conductance
regulator-chloride channels by cGMP-dependent protein kinase II. Journal of Biological
Chemistry 270, 26626-26631.
Fu, Z., Bettega, K., Carroll, S., Buchholz, K.R. and Machen, T.E. (2007). Role of Ca2+ in
responses of airway epithelia to Pseudomonas aeruginosa, flagellin, ATP, and
thapsigargin. American Journal of Physiology-Lung Cellular and Molecular Physiology
292, L353-L364.
Gadsby, D.C. and Nairn, A.C. (1999). Control of CFTR channel gating by phosphorylation and
nucleotide hydrolysis. Physiological reviews 79, S77-S107.
Gadsby, D.C., Vergani, P. and Csanády, L. (2006). The ABC protein turned chloride channel
whose failure causes cystic fibrosis. Nature 440, 477-483.
Hanoune, J. and Defer, N. (2001). Regulation and role of adenylyl cyclase isoforms. Annual
review of pharmacology and toxicology 41, 145-174.
46
Hanrahan, J.W., Zhu, T. and Howell, L.D. (2003). Phosphatase Regulation of CFTR. The Cystic
Fibrosis Transmembrane Conductance Regulator, 35.
Harding, H.P., Zhang, Y. and Ron, D. (1999). Protein translation and folding are coupled by an
endoplasmic-reticulum-resident kinase. Nature 397, 271-274.
Harding, H.P., Zhang, Y., Zeng, H., Novoa, I., Lu, P.D., Calfon, M., et al. (2003). An Integrated
Stress Response Regulates Amino Acid Metabolism and Resistance to Oxidative Stress.
Molecular Cell 11, 619-633.
Hayashi, F., Smith, K.D., Ozinsky, A., Hawn, T.R., Yi, E.C., Goodlett, D.R., et al. (2001). The
innate immune response to bacterial flagellin is mediated by Toll-like receptor 5. Nature
410, 1099-1103.
Hinnebusch, A.G. (1994) The eIF-2α kinases: regulators of protein synthesis in starvation and
stress. In Seminars in cell biology. Elsevier, pp. 417-426.
Hoiby, N., Flensborg, E.W., Beck, B., Friis, B., Jacobsen, S.V. and Jacobsen, L. (1977).
Pseudomonas aeruginosa infection in cystic fibrosis. Diagnostic and prognostic
significance of Pseudomonas aeruginosa precipitins determined by means of crossed
immunoelectrophoresis. Scandinavian journal of respiratory diseases 58, 65-79.
Hybiske, K., Ichikawa, J.K., Huang, V., Lory, S.J. and Machen, T.E. (2004). Cystic fibrosis
airway epithelial cell polarity and bacterial flagellin determine host response to
Pseudomonas aeruginosa. Cellular microbiology 6, 49-63.
Idzko, M., Hammad, H., van Nimwegen, M., Kool, M., Willart, M.A.M., Muskens, F., et al.
(2007). Extracellular ATP triggers and maintains asthmatic airway inflammation by
activating dendritic cells. Nat Med 13, 913-919.
Illek, B., Fu, Z., Schwarzer, C., Banzon, T., Jalickee, S., Miller, S.S. and Machen, T.E. (2008).
Flagellin-stimulated Cl− secretion and innate immune responses in airway epithelia: role
for p38. American Journal of Physiology-Lung Cellular and Molecular Physiology 295,
L531-L542.
Irie, Y. and Parsek, M. (2008) Quorum sensing and microbial biofilms. In Bacterial biofilms.
Springer, pp. 67-84.
Jacobi, C.A., Schiffner, F., Henkel, M., Waibel, M., Stork, B., Daubrawa, M., et al. (2009).
Effects of bacterial< i> N</i>-acyl homoserine lactones on human Jurkat T lymphocytes-
OdDHL induces apoptosis via the mitochondrial pathway. International Journal of
Medical Microbiology 299, 509-519.
Jahoor, A., Patel, R., Bryan, A., Do, C., Krier, J., Watters, C., et al. (2008). Peroxisome
proliferator-activated receptors mediate host cell proinflammatory responses to
Pseudomonas aeruginosa autoinducer. Journal of bacteriology 190, 4408-4415.
Jordan, R., Wang, L., Graczyk, T.M., Block, T.M. and Romano, P.R. (2002). Replication of a
cytopathic strain of bovine viral diarrhea virus activates PERK and induces endoplasmic
reticulum stress-mediated apoptosis of MDBK cells. Journal of virology 76, 9588-9599.
Kaufman, R.J. (1999). Stress signaling from the lumen of the endoplasmic reticulum:
coordination of gene transcriptional and translational controls. Genes & Development 13,
1211-1233.
Krappmann, D. and Scheidereit, C. (1997). Regulation of NF-κB activity by IκBα and IκBβ
stability. Immunobiology 198, 3-13.
Kravchenko, V.V., Kaufmann, G.F., Mathison, J.C., Scott, D.A., Katz, A.Z., Grauer, D.C., et al.
(2008). Modulation of gene expression via disruption of NF-κB signaling by a bacterial
small molecule. Science 321, 259-263.

47
Kravchenko, V.V., Kaufmann, G.F., Mathison, J.C., Scott, D.A., Katz, A.Z., Wood, M.R., et al.
(2006). N-(3-oxo-acyl) homoserine lactones signal cell activation through a mechanism
distinct from the canonical pathogen-associated molecular pattern recognition receptor
pathways. Journal of Biological Chemistry 281, 28822-28830.
Kulaksiz, H., Schmid, A., Hönscheid, M., Ramaswamy, A. and Cetin, Y. (2002). Clara cell
impact in air-side activation of CFTR in small pulmonary airways. Proceedings of the
National Academy of Sciences 99, 6796-6801.
Lefkimmiatis, K., Srikanthan, M., Maiellaro, I., Moyer, M.P., Curci, S. and Hofer, A.M. (2009).
Store-operated cyclic AMP signalling mediated by STIM1. Nature cell biology 11, 433-
442.
Li, H., Sheppard, D.N. and Hug, M.J. (2004a). Transepithelial electrical measurements with the
Ussing chamber. Journal of Cystic Fibrosis 3, 123-126.
Li, H., Wang, L., Ye, L., Mao, Y., Xie, X., Xia, C., et al. (2009). Influence of Pseudomonas
aeruginosa quorum sensing signal molecule N-(3-oxododecanoyl) homoserine lactone on
mast cells. Medical microbiology and immunology 198, 113-121.
Li, L., Hooi, D., Chhabra, S.R., Pritchard, D. and Shaw, P.E. (2004b). Bacterial N-
acylhomoserine lactone-induced apoptosis in breast carcinoma cells correlated with
down-modulation of STAT3. Oncogene 23, 4894-4902.
Liedtke, C.M. and Cole, T.S. (1998). Antisense oligonucleotide to PKC-ε alters cAMP-
dependent stimulation of CFTR in Calu-3 cells. American Journal of Physiology-Cell
Physiology 275, C1357-C1364.
Martino, M.E., Olsen, J.C., Fulcher, N.B., Wolfgang, M.C., O'Neal, W.K. and Ribeiro, C.M.
(2009). Airway epithelial inflammation-induced endoplasmic reticulum Ca2+ store
expansion is mediated by X-box binding protein-1. Journal of Biological Chemistry 284,
14904-14913.
McNamara, N., Gallup, M., Sucher, A., Maltseva, I., McKemy, D. and Basbaum, C. (2006).
AsialoGM1 and TLR5 cooperate in flagellin-induced nucleotide signaling to activate
Erk1/2. American journal of respiratory cell and molecular biology 34, 653.
McNamara, N., Khong, A., McKemy, D., Caterina, M., Boyer, J., Julius, D. and Basbaum, C.
(2001). ATP transduces signals from ASGM1, a glycolipid that functions as a bacterial
receptor. Proceedings of the National Academy of Sciences 98, 9086-9091.
Naren, A.P., Cobb, B., Li, C., Roy, K., Nelson, D., Heda, G.D., et al. (2003). A macromolecular
complex of β2 adrenergic receptor, CFTR, and ezrin/radixin/moesin-binding
phosphoprotein 50 is regulated by PKA. Proceedings of the National Academy of
Sciences 100, 342-346.
Ong, H.L., Cheng, K.T., Liu, X., Bandyopadhyay, B.C., Paria, B.C., Soboloff, J., et al. (2007).
Dynamic assembly of TRPC1-STIM1-Orai1 ternary complex is involved in store-
operated calcium influx Evidence for similarities in store-operated and calcium release-
activated calcium channel components. Journal of Biological Chemistry 282, 9105-9116.
Oyadomari, S., Araki, E. and Mori, M. (2002). Endoplasmic reticulum stress-mediated apoptosis
in pancreatic β-cells. Apoptosis 7, 335-345.
Rumbaugh, K.P. (2007). Convergence of hormones and autoinducers at the host/pathogen
interface. Analytical and bioanalytical chemistry 387, 425-435.
Schuster, M. and Peter Greenberg, E. (2006). A network of networks: Quorum-sensing gene
regulation in< i> Pseudomonas aeruginosa</i>. International journal of medical
microbiology 296, 73-81.
48
Schwarzer, C., Fu, Z., Patanwala, M., Hum, L., Lopez‐Guzman, M., Illek, B., et al. (2012).
Pseudomonas aeruginosa biofilm‐associated homoserine lactone C12 rapidly activates
apoptosis in airway epithelia. Cellular microbiology 14, 698-709.
Schwarzer, C., Wong, S., Shi, J., Matthes, E., Illek, B., Ianowski, J.P., et al. (2010).
Pseudomonas aeruginosa homoserine lactone activates store-operated cAMP and cystic
fibrosis transmembrane regulator-dependent Cl− secretion by human airway epithelia.
Journal of Biological Chemistry 285, 34850-34863.
Sheth, P., Basuroy, S., Li, C., Naren, A.P. and Rao, R.K. (2003). Role of phosphatidylinositol 3-
kinase in oxidative stress-induced disruption of tight junctions. Journal of Biological
Chemistry 278, 49239-49245.
Shiner, E., Terentyev, D., Bryan, A., Sennoune, S., Martinez‐Zaguilan, R., Li, G., et al. (2006).
Pseudomonas aeruginosa autoinducer modulates host cell responses through calcium
signalling. Cellular microbiology 8, 1601-1610.
Smith, K.D., Andersen-Nissen, E., Hayashi, F., Strobe, K., Bergman, M.A., Barrett, S.L.R., et al.
(2003). Toll-like receptor 5 recognizes a conserved site on flagellin required for
protofilament formation and bacterial motility. Nature immunology 4, 1247-1253.
Smith, R.S., Fedyk, E.R., Springer, T., Mukaida, N., Iglewski, B.H. and Phipps, R.P. (2001). IL-
8 production in human lung fibroblasts and epithelial cells activated by the Pseudomonas
autoinducer N-3-oxododecanoyl homoserine lactone is transcriptionally regulated by NF-
κB and activator protein-2. The Journal of Immunology 167, 366-374.
Smith, R.S., Kelly, R., Iglewski, B.H. and Phipps, R.P. (2002). The Pseudomonas autoinducer N-
(3-oxododecanoyl) homoserine lactone induces cyclooxygenase-2 and prostaglandin E2
production in human lung fibroblasts: implications for inflammation. The Journal of
Immunology 169, 2636-2642.
Sun, F., Hug, M.J., Lewarchik, C.M., Yun, C.-H.C., Bradbury, N.A. and Frizzell, R.A. (2000).
E3KARP mediates the association of ezrin and protein kinase A with the cystic fibrosis
transmembrane conductance regulator in airway cells. Journal of Biological Chemistry
275, 29539-29546.
Tateda, K., Ishii, Y., Horikawa, M., Matsumoto, T., Miyairi, S., Pechere, J.C., et al. (2003). The
Pseudomonas aeruginosa autoinducer N-3-oxododecanoyl homoserine lactone accelerates
apoptosis in macrophages and neutrophils. Infection and immunity 71, 5785-5793.
Telford, G., Wheeler, D., Williams, P., Tomkins, P., Appleby, P., Sewell, H., et al. (1998). The
Pseudomonas aeruginosaQuorum-Sensing Signal MoleculeN-(3-Oxododecanoyl)-l-
Homoserine Lactone Has Immunomodulatory Activity. Infection and Immunity 66, 36-
42.
Tuo, B., Wen, G., Song, P., Xu, J., Liu, X., Seidler, U. and Dong, H. (2011). Genistein stimulates
duodenal HCO< sub> 3</sub>< sup>−</sup> secretion through PI3K pathway in mice.
European journal of pharmacology 651, 159-167.
Tuo, B., Wen, G., Zhang, Y., Liu, X., Wang, X., Liu, X. and Dong, H. (2009). Involvement of
phosphatidylinositol 3-kinase in cAMP-and cGMP-induced duodenal epithelial CFTR
activation in mice. American Journal of Physiology-Cell Physiology 297, C503-C515.
Vikström, E., Tafazoli, F. and Magnusson, K.-E. (2006). < i> Pseudomonas aeruginosa</i>
quorum sensing molecule< i> N</i>-(3 oxododecanoyl)-l-homoserine lactone disrupts
epithelial barrier integrity of Caco-2 cells. FEBS letters 580, 6921-6928.
49
West, A.P., Dancho, B.A. and Mizel, S.B. (2005). Gangliosides inhibit flagellin signaling in the
absence of an effect on flagellin binding to toll-like receptor 5. Journal of Biological
Chemistry 280, 9482-9488.
Wu, S., Tan, M., Hu, Y., Wang, J.-L., Scheuner, D. and Kaufman, R.J. (2004). Ultraviolet light
activates NFκB through translational inhibition of IκBα synthesis. Journal of Biological
Chemistry 279, 34898-34902.
Yu, Y., Nagai, S., Wu, H., Neish, A.S., Koyasu, S. and Gewirtz, A.T. (2006). TLR5-mediated
phosphoinositide 3-kinase activation negatively regulates flagellin-induced
proinflammatory gene expression. The Journal of Immunology 176, 6194-6201.
Zhang, Z., Louboutin, J.-P., Weiner, D.J., Goldberg, J.B. and Wilson, J.M. (2005). Human
airway epithelial cells sense Pseudomonas aeruginosa infection via recognition of
flagellin by Toll-like receptor 5. Infection and immunity 73, 7151-7160.