Embed Size (px)
Citation preview

Atmos. Chem. Phys., 14, 3977–3989, 2014www.atmos-chem-phys.net/14/3977/2014/doi:10.5194/acp-14-3977-2014© Author(s) 2014. CC Attribution 3.0 License.
Atmospheric Chemistry
and PhysicsO
pen Access
Injection heights of springtime biomass-burning plumes overpeninsular Southeast Asia and their impacts on long-range pollutanttransport
Y. Jian and T.-M. Fu
Laboratory for Climate and Ocean-Atmosphere Studies, Department of Atmospheric and Oceanic Sciences, School ofPhysics, Peking University, Beijing, 100871, China
Correspondence to:T.-M. Fu ([email protected])
Received: 13 August 2013 – Published in Atmos. Chem. Phys. Discuss.: 10 September 2013Revised: 2 March 2014 – Accepted: 9 March 2014 – Published: 22 April 2014
Abstract. We analyzed observations from the Multi-angleImaging SpectroRadiometer (MISR) to determine the injec-tion heights of biomass-burning smoke plumes over penin-sular Southeast Asia (PSEA, here defined as Vietnam, Cam-bodia, Thailand, Laos, and Myanmar) in the spring, with thegoal of evaluating the impacts on long-range pollutant trans-port. We retrieved the heights of 22 000 MISR smoke pix-els from 607 smoke plumes over PSEA during February toApril of the years 2001–2010. Forty-five percent of the an-alyzed smoke pixels were above the local mean boundarylayer (1 km) at MISR overpass time (10:30 a.m. local time).We used the GEOS–Chem model to simulate the transportof PSEA biomass-burning pollutants in March 2001. On amonthly mean basis, we found that the direct injection of40 % of the PSEA biomass-burning emissions had little im-pact on the long-range transport of CO to downwind regions,compared to a control simulation where all biomass-burningemissions were released in the boundary layer. This was be-cause CO at the surface over PSEA was efficiently liftedinto the free troposphere by deep convection associated withsynoptic-scale weather systems. For pollutants with lifetimesshorter than the synoptic timescale, such as black carbonaerosol (BC), their long-range transport was much more sen-sitive to the initial plume injection height. The direct injec-tion of NOx from PSEA biomass burning into the free tro-posphere drove increased formation and transport of peroxy-acetyl nitrate (PAN), which in turn led to a small increase inozone over downwind southern China and the northwesternPacific. The Pacific subtropical high transported BC emittedfrom PSEA biomass burning to the marine boundary layer
over the tropical northwestern Pacific. We compared ourmodel results to aircraft measurements over the northwesternPacific during the TRACE-P campaign (March 2001). Thedirect injection of 40 % of the PSEA biomass-burning pol-lutants into the free troposphere in the model led to a morepronounced BC peak at 3 km over the northwestern Pacific.Our analysis highlights the point that the injection heights ofsmoke plumes presents great uncertainty over the interpre-tation of BC measurements downwind of biomass-burningregions.
1 Introduction
Open burning of biomass emits large amounts of trace gasesand aerosols into the atmosphere, affecting atmosphericchemistry and climate. Buoyed by the thermal energy of fireand local atmospheric instability, biomass-burning smokeplumes can sometimes rise above the boundary layer andinject directly into the free troposphere, affecting the long-range transport efficiency of the emitted pollutants (e.g., Co-larco et al., 2004; Fromm et al., 2005; Damoah et al., 2006).Over Peninsular Southeast Asia (PSEA, here defined asVietnam, Cambodia, Thailand, Laos, and Myanmar), heavybiomass burning occurs annually in the spring (February toApril) due to slash-and-burn and land-clearing practices be-fore the local growing season (Fox et al., 2009). Here we an-alyzed space-based observations to determine the injectionheights of biomass burning smoke plumes over PSEA in thespring, as well as assessed their impacts on the long-range
Published by Copernicus Publications on behalf of the European Geosciences Union.
3978 Y. Jian and T.-M. Fu: Injection heights of springtime biomass burning plumes
transport of pollutants and the formation of ozone in down-wind regions.
The pollutants emitted from PSEA biomass burning in thespring can be transported by the prevailing westerly wind toaffect the air quality and chemistry over downwind southernChina and the northwestern Pacific. Surface and ozonesondemeasurements in southern China in the spring showed sig-nificant enhancements in CO, black carbon aerosol (BC),PM2.5, PM10, and ozone when the local air was impacted byair masses back-traceable to PSEA (Liu et al., 1999; Chanet al., 2000; Deng et al., 2008; Lin et al., 2009, 2010; Yen etal., 2012). Using a regional model, Fu et al. (2012) found thatthe long-range transport of PSEA biomass-burning emissionsduring spring 2006 contributed significantly to the monthlymean surface concentrations of CO (20–50 %), ozone (10–30 %), and PM2.5 (10–70 %) in southern China, as well asleading to 2–5 ppbv ozone enhancement in the lower tropo-sphere over the western Pacific. Aircraft measurements alongthe Pacific Rim during the Transport and Chemical Evolu-tion over the Pacific (TRACE-P) campaign in spring 2001characterized the outflow of biomass-burning pollutants fromPSEA to the northwestern Pacific (Jacob et al., 2003). Overthe northwestern Pacific, back trajectories showed that 45 %and 60 % of the air masses sampled by TRACE-P aircraft at2–4 km and 4–8 km altitude, respectively, were transportedfrom PSEA (Kondo et al., 2004). Model simulations showedthat the PSEA biomass-burning pollutants were lifted fromthe surface near their source region by deep convection.These pollutants were then transported along the warm con-veyor belts ahead of cold fronts to the northwestern Pacificat altitudes above 2 km (Carmichael et al., 2003; Liu et al.,2003; Miyazaki et al., 2003; Lin et al., 2009).
Model studies showed that direct injection of biomassburning pollutants into the free troposphere generally leadsto enhanced long-range transport, due to faster transport bythe stronger winds and/or prolonged lifetime of the pollu-tants in the free troposphere (Leung et al., 2007; Chen et al.,2009). The standard treatment in most large-scale chemicaltransport models has been to release biomass-burning emis-sions in the boundary layer (e.g., Bey et al., 2001). Leunget al. (2007) and Turquety et al. (2007) simulated the trans-port of CO from summertime boreal forest fires. Both stud-ies found that injecting 60 % of the biomass burning emis-sions directly into the free troposphere in the model improvedagreement with downwind CO surface and column mea-surements, compared to simulations where biomass-burningemissions were released only in the boundary layer. Severalstudies embedded high resolution models or parameteriza-tion schemes to resolve the plume-rising process in large-scale chemical transport models (Freitas et al., 2006, 2007;Rio et al., 2010). These studies also found that the injectionsof biomass-burning emissions into the free troposphere havea large impact on CO concentrations downwind (Freitas etal., 2006, 2007). Conversely, Chen et al. (2009) found thatthe injection heights of North American boreal fire emis-
sions had limited impacts on CO concentrations over thedownwind areas in North America. They attributed this lackof sensitivity to frequent strong convective activities occur-ring along the transport pathway, which would lift CO intothe free troposphere regardless of the initial injection height.However, they showed that the long-range transport of BCwas much more sensitive to injection height, owing to theshorter lifetime of BC compared to CO.
Space-based remote sensing, such as images fromthe Multi-angle Imaging SpectroRadiometer (MISR) andbackscatter measurements from the Cloud-Aerosol Lidarwith Orthogonal Polarization (CALIOP), can be used todetermine the injection heights of biomass-burning smokeplumes (e.g., Kahn et al., 2007, 2008; Labonne et al., 2007).Height-retrieval studies using MISR images showed that theinjection heights of smoke plumes associated with summer-time North American forest fires ranged from a few hun-dred meters to 5 km (Mazzoni et al., 2007; Kahn et al., 2008;Val Martin et al., 2010). Analyses of CALIOP backscatteringmeasurements of smoke plumes from summertime Europeanforest fires similarly found injection heights of 1.6–5.9 km(Amiridis et al., 2010). However, Labonne et al. (2007)analyzed CALIOP backscatter measurements over 8 majorbiomass burning regions over the world during July–August2006. They found that the injection height for most smokeplumes were within the boundary layer, especially in thetropics. Studies indicated that the injection heights of smokeplumes are sensitive to the type of biomass burned, the ther-mal power of the fire, and the atmospheric stability structureat the burning site (Ferguson et al., 2003; Mims et al., 2010;Val Martin et al., 2010, 2012; Tosca et al., 2011; Zender etal., 2012).
In this study, we analyzed satellite observations overPSEA in the spring during the years 2001 to 2010 to deter-mine the injection heights of biomass burning smoke plumes.We applied the resulting probability distribution of smokeplume injection heights to a chemical transport model to as-sess the impacts on the long-range transport of pollutants todownwind southern China and the northwestern Pacific. Wecompared model results against aircraft measurements dur-ing the TRACE-P campaign in spring 2001 to further exam-ine the impacts on long-range transport and the interpretationof measurements.
2 Data and methodology
2.1 Fire observation from MISR and MODIS, andsmoke plume identification using MINX
We used a two-step approach to extract MISR observationsof biomass-burning smoke plumes over PSEA in the springduring the years 2001 to 2010. We first used the Level 2thermal anomalies product from the Moderate ResolutionImaging Spectroradiometer (MODIS) instrument (MOD14)
Atmos. Chem. Phys., 14, 3977–3989, 2014 www.atmos-chem-phys.net/14/3977/2014/

Y. Jian and T.-M. Fu: Injection heights of springtime biomass burning plumes 3979
(Giglio et al., 2003) to locate possible open fires over PSEAduring this period. We then extracted the MISR scenes inter-secting these thermal anomalies to screen for smoke plumes.
Both MODIS and MISR are onboard the NASA Terrasatellite, which overpasses the equator in the descendingmode at approximately 10:30 a.m. local time. The cross-trackswath width of MODIS is 2330 km, such that global cover-age is achieved every one to two days. MODIS has 36 spec-tral channels with wavelengths between 0.4 µm and 14.2 µm.Thermal anomalies are detected at 1 km spatial resolution(nadir) using the brightness temperatures derived from the4 µm and 11 µm channels (Giglio et al., 2003).
The MISR instrument (Diner et al., 1998) consists of ninepush-broom cameras placed at viewing angles from−70.5◦
to 70.5◦ (relative to nadir) in line with the ground track. Eachcamera acquires data at four wavelengths: 446 nm, 558 nm,672 nm, and 866 nm. The cross-track width of the MISRswath, common to all nine cameras, is 360 km, such thatglobal coverage is achieved every nine days at the equator.The horizontal resolution is 275 m in the red band for all ninecameras and in all four bands for the nadir camera. The hor-izontal resolution for the remaining 24 bands is 1.1 km.
We manually screened for smoke plumes with the aid ofthe MISR INteractive eXplorer software (MINX) developedby the Jet Propulsion Laboratory (Nelson et al., 2008, 2013).MINX combines the four spectral bands to form a high-resolution true-color image for each of the nine cameras onMISR, and the resulting nine images can be animated. Weused this animation, superimposed with the MODIS ther-mal anomalies, as a visual aid to subjectively identify smokeplumes. Our criteria for identifying a biomass-burning smokeplume were: (1) a plume-shaped area of high reflectivity wasvisible from the MINX animation; (2) that high-reflectivityarea showed a shift in position relative to the surface betweencameras, indicating that it was above the surface; and (3) thevertex of that high-reflectivity area was marked by one ormore MODIS thermal anomalies. We manually determinedthe boundary and surface origin of the smoke plume, as wellas the local wind direction, using the animation.
2.2 Smoke pixel height retrieval using MINX
We used the stereoscopic algorithm in MINX to retrieve theheights of the individual smoke pixels in the identified smokeplumes. Stereo-height retrieval is based on the shifts of pix-els relative to the surface between cameras (Nelson et al.,2008, 2013). The MINX height retrieval algorithm uses datafrom the seven inner cameras on MISR, instead of usingdata from only the three center cameras as does the stan-dard MISR height retrieval algorithm (Moroney et al., 2002).Also, MINX allows its users to specify the wind directionover the targeted area to better account for advection dur-ing the time lapses between cameras. The height of eachsmoke pixel was defined relative to the terrain directly un-derneath that smoke pixel. For most smoke pixels, we used
the wind-corrected stereo-height retrieved by MINX. How-ever, the wind correction factor could not be calculated forpixels less than 226 m above the local terrain or in sceneswhere the wind direction was within 15◦ of the instrumenttrack. In such cases, we used the zero-wind stereo-heightretrieval instead. The differences between wind-correctedstereo-height and zero-wind stereo-height were almost al-ways within 500 m. Only 2 % of all the analyzed pixels hadwind-corrected stereo-heights and zero-wind stereo-heightsdiffering by more than 1 km, and these pixels were not ex-cluded from the analysis. The horizontal and vertical reso-lutions for the pixel stereo-height retrieved by MINX were1.1 km and 275 m, respectively (Nelson et al., 2013).
2.3 Land cover data
We used the MODIS Level 3 land cover product (MOD12Q1– Friedl et al., 2010) to determine the type of land cover asso-ciated with each of the identified smoke plumes. This productwas derived from a year of MODIS observations from boththe Terra and Aqua platforms and contained the 17 Interna-tional Geosphere-Biosphere Programme (IGBP) land coverclasses. The horizontal resolution of the land cover data setwas 0.5 km.
2.4 Model simulations
We used the GEOS–Chem global chemical transport modelto simulate the transport of biomass-burning pollutants fromPSEA during spring 2001. GEOS–Chem (version 9.1.2;http://acmg.seas.harvard.edu/geos) was driven by the assimilatedmeteorological data (MERRA) from the Goddard Earth Ob-serving System (GEOS) of the NASA Global Modeling As-similation Office (Bey et al., 2001). The native resolution ofthe meteorological data was 0.67◦ longitude× 0.5◦ latitude,with 72 levels extending from the surface to 0.01 hPa. Todrive our simulation, the horizontal resolution was reducedto 2.5◦ longitude× 2.0◦ latitude. Vertical levels were reducedto 47 levels, with 8 levels in the lowest 1 km and 14 levels be-tween 1 km and 5 km. Meteorology fields were updated in themodel every 3 h (every 1 h for surface quantities and plane-tary boundary layer depths, and every 6 h for instantaneousfields). The chemistry scheme in GEOS–Chem was as de-scribed in Bey et al. (2001) and Mao et al. (2010). Turbulentmixing within the boundary layer was assumed to be full andinstantaneous (Bey et al., 2001). We conducted a sensitivitysimulation using a non-local boundary layer mixing scheme(Lin and McElroy, 2010) but found that it had little impact onthe results reported below in Sects. 4 and 5. Convective trans-port was computed from the convective mass fluxes in themeteorological fields, as described by Wu et al. (2007). Drydeposition was based on Wesely (1989) as implemented byWang et al. (1998). Wet deposition was as described by Liuet al. (2001). Freshly emitted BC was assumed to be 80 % hy-drophobic and 20 % hydrophilic, with a conversion timescale
www.atmos-chem-phys.net/14/3977/2014/ Atmos. Chem. Phys., 14, 3977–3989, 2014
3980 Y. Jian and T.-M. Fu: Injection heights of springtime biomass burning plumes
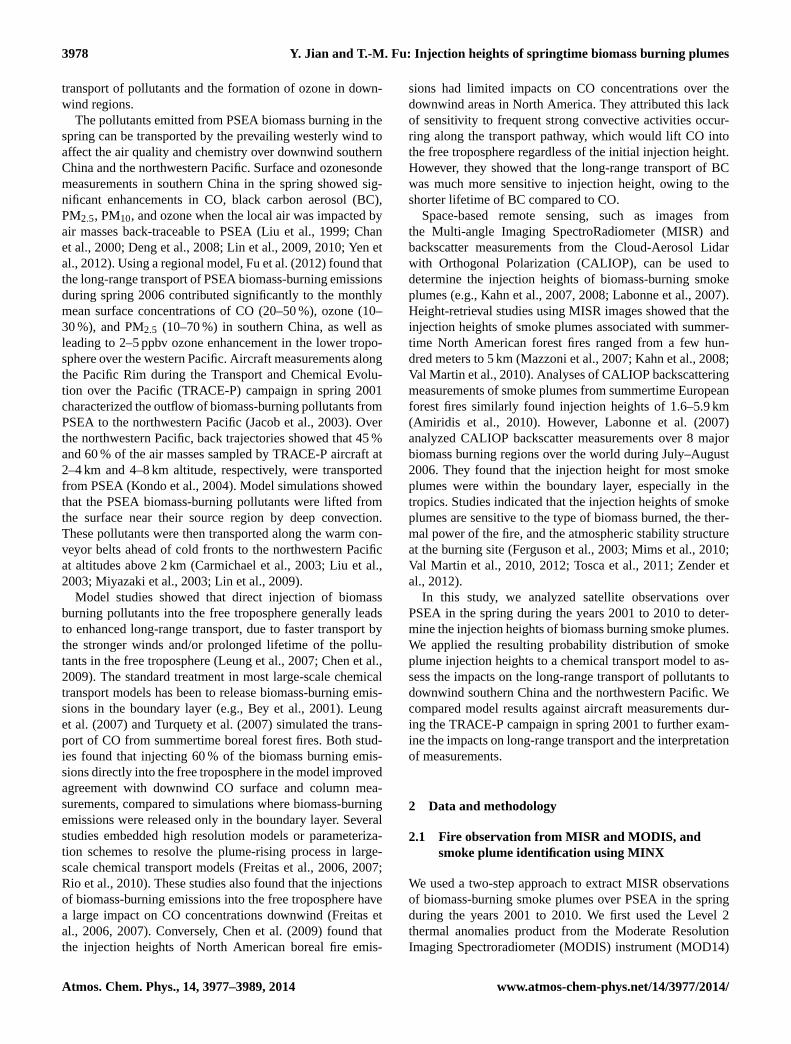
Table 1. Annual biomass burning and anthropogenic emissionsfrom PSEAa and from the entire East and South Asiab.
Biomass Anthropogenicburningc activitiesd
PSEA East and PSEA East andSouth Asia South Asia
CO [Tg yr−1] 32 67 21 300BC [TgC yr−1] 0.21 0.45 0.18 3.0NOx [TgN yr−1] 0.33 0.85 0.58 11NMVOC [TgC yr−1] 5.7 12 5.0 55
a Here defined as Vietnam, Cambodia, Thailand, Laos, and Myanmar.b Domain as defined in Fig. 3.c From Streets et al. (2003).d From Zhang et al. (2009) and include biofuel emissions.
from hydrophobic to hydrophilic of 1.15 days (Park et al.,2005). GEOS–Chem has been used extensively to study thelong-range transport of pollutants from Asia and from otherparts of the world (e.g, Liu et al., 2003; Park et al., 2005;Leung et al., 2007; Turquety et al., 2007; Zhang et al., 2008).
Table 1 summarizes the emissions used in our model sim-ulations. Annual biomass-burning emission totals for Eastand South Asia (domain shown in Fig. 3, including EastAsia, South Asia and Southeast Asia) were taken from theinventory developed by Streets et al. (2003a), which had anative resolution of 1◦ × 1◦ and represented average burn-ing conditions of the mid-1990s. Annual biomass-burningemissions of CO, NOx, non-methane volatile organic com-pounds (NMVOC), and BC from PSEA were 32 Tg yr−1,0.33 TgN yr−1 (as NO2), 5.7 Tg yr−1, and 0.21 TgC yr−1,respectively. Monthly variations of East and South Asiabiomass-burning emissions were from Duncan et al. (2001).Over PSEA, 82 % of the annual total biomass-burning emis-sions were emitted in the spring; half of the annual emissiontotal was emitted in March. We applied daily variations tothe emission fluxes by convoluting the monthly emission to-tals with the satellite-based daily burned area from the GlobalFire Emissions Database version 4 (GFED4 – Giglio et al.,2013). Monthly mean biomass-burning emissions for the restof the world were taken from the Global Fire EmissionsDatabase version 2 (GFED2 – van der Werf et al., 2006) forthe year 2001. The GFED2 inventory was not used for PSEA,because it has been shown to be significantly low-biased forthe PSEA region (Fu et al., 2012).
Anthropogenic emissions for East and South Asia weretaken from the inventory developed by Zhang et al. (2009),which had a native resolution of 0.5◦
× 0.5◦ and includedemissions from power generation, industry, transportation,as well as residential sources. This inventory was devel-oped for the year 2006 but the emission totals were con-sistent with top-down emission estimates for CO (Heald etal., 2004) and NMVOC (Fu et al., 2007) for the year 2001.BC and NOx emission estimates were likely to be high rel-ative to the actual emissions in the year 2001 (Zhang etal., 2009). For PSEA, the total annual anthropogenic emis-
sions of CO, NOx, NMVOC, and BC were 20.5 Tg yr−1,0.59 TgN yr−1 (as NO2), 5.0 Tg yr−1, and 0.18 TgC yr−1, re-spectively. The seasonal variations of emissions for the res-idential sector were dependent on monthly mean tempera-tures (Streets et al., 2003b). The monthly variations of power-generation and industrial emissions for China were basedon provincial monthly activity data (Zhang et al., 2009).For the rest of the world, we used annual mean anthro-pogenic emissions from the Emissions Database for GlobalAtmospheric Research (EDGAR) inventory for the year 2000(Olivier and Berdowski, 2001) for CO and NOx and fromthe Reanalysis of the Tropospheric (RETRO) inventory forthe year 2000 (Schultz et al., 2007) for NMVOCs. BiogenicVOC emissions were from the Model of Emissions of Gasesand Aerosols from Nature (MEGAN) inventory version 2.1(Guenther et al., 2012), with seasonal variations driven byleaf area index observations from MODIS (Myneni et al.,2002).
2.5 Aircraft measurements from the TRACE-Pcampaign
We compared our model results to aircraft measurementsduring the TRACE-P campaign in spring 2001 (Jacob et al.,2003). Two NASA aircraft were deployed during the cam-paign: the DC-8 (12 km ceiling) and the P-3B (7 km ceiling).BC absorption was measured on both aircraft at 565 nm usingparticle soot absorption photometers (Radiance Research)and corrected for scattering (Bond et al., 1999; Clarke etal., 2004). We calculated BC concentrations by assuming amass absorption efficiency of 7.5 m2 g−1 (Bond et al., 2013)and converting to standard temperature and pressure condi-tions (298 K and 1013 hPa, STP). On both aircraft, wholeair samples were collected in canisters every 3–7 min dur-ing horizontal flight legs and every 1–3 min during ascentsand descents. CH3Cl and C2Cl4 concentrations in these can-ister air samples were determined using gas chromatogra-phy (Blake et al., 2003). BC, CH3Cl, and C2Cl4 measure-ments were synchronized to a time resolution of one minuteto identified the samples heavily impacted by biomass burn-ing (CH3Cl > 550 ppt and C2Cl4 < 3 ppt) following Kondoet al. (2004). Measurements and model results were bothaveraged to the temporal (15 min) and spatial (2.5◦ longi-tude× 2◦ latitude) resolution of the model for comparison(Sect. 5).
3 Injection height of springtime biomass-burningsmoke plumes over PSEA
3.1 Probability distributions of smoke pixel heights
We analyzed the MODIS and MISR observations over PSEAbetween February–April for the years 2001–2010 to identifythe smoke plumes from biomass burning. MODIS detected20 000 thermal anomalies in MISR footprints over PSEA
Atmos. Chem. Phys., 14, 3977–3989, 2014 www.atmos-chem-phys.net/14/3977/2014/

Y. Jian and T.-M. Fu: Injection heights of springtime biomass burning plumes 3981
Fig. 1. Locations of identified smoke plumes over PSEA duringFebruary–April (a) for the years 2001 to 2010 and(b) for theyear 2001. Symbols represent plumes over evergreen and decidu-ous broadleaf forests (red), woody savannas (green), and croplandand cropland/natural vegetation mosaics (blue).
during the target time periods. Using the criteria described inSect. 2.2, a total of 607 biomass-burning smoke plumes wereidentified. Each identified smoke plume contained 10 to 400smoke pixels. In all, heights were retrieved for 22 350 smokepixels during February–April for the years 2001–2010.
Figure 1 shows the spatial distributions of the identifiedbiomass-burning smoke plumes during February–April forthe years 2001 to 2010 and for the year 2001 alone. Theidentified smoke plumes were largely distributed over agri-cultural areas near major rivers, including the Mekong, theChao Phraya, the Salween, and the Irrawaddy. The areas withhighest densities of identified smoke plumes were northernLaos and western Myanmar. The MODIS thermal anomaliesalso showed a similar spatial distribution (not shown). Therewas no significant difference in the spatial distributions of theidentified smoke plumes from year to year.
Figure 2 shows the probability distribution of all smokepixel heights (binned into 0.5 km intervals) in the spring dur-ing the years 2001 to 2010. Retrieved smoke pixel heightsranged from 0 to 6 km above the local terrain. Fifty-five per-cent of the smoke pixels were below 1 km, which was themean local boundary layer height at Terra overpass time(10:30 a.m. local time) in the MERRA data set. Approxi-mately 28 % of the smoke pixels were between 1 km and2 km, and 17 % of the smoke pixels were above 2 km. Only1.5 % of the smoke pixels were between 4 and 5 km, and only0.4 % of the smoke pixels were between 5 and 6 km. Overall,45 % of the smoke pixels were above the local mean bound-ary layer. Figure 2 also shows the range of smoke pixel heightprobability for each year between 2001 and 2010. There wasconsiderable interannual variability in the probability distri-bution of the smoke pixel heights. The percentage of smokepixels above 1 km was lowest at 24 % in 2010 and highest at
Fig. 2. Probability distribution of all smoke pixel heights fromsmoke plumes observed by MISR during February to April forthe years 2001–2010 (black line). The grey area below 1 km al-titude indicates the mean local boundary layer at Terra overpasstime (10:30 local time) in the MERRA assimilated meteorologydata set. Also shown are probability distributions for smoke pixelheights associated with different land covers: evergreen and decidu-ous broadleaf forest (red), woody savanna (green), and cropland andcropland/natural vegetation mosaic (blue). The error bars show therange of probability for individual years between 2001 and 2010.
58 % in 2007. The percentage of smoke pixels above 1 kmwas 57 % in 2001.
We found that the smoke pixel heights varied with the typeof land cover burned. Figure 1 shows the land cover at the lo-cations of each of the identified smoke plumes. Out of the607 smoke plumes identified during 2001–2010, 64 % wereover evergreen and deciduous broadleaf forests, 30 % wereover woody savanna, and 6 % were over cropland or crop-land/natural vegetation mosaic. This likely indicates exten-sive slashing and burning of forested areas for agriculture inthe PSEA region. Alternatively, the smaller scale fires overcroplands may be under-detected, and we will return to thispoint in Sect. 3.2. Figure 2 also shows the probability distri-butions of smoke pixel heights over broadleaf forests, woodysavanna, and cropland. The retrieved heights of smoke pix-els over croplands were significantly lower in altitude com-pared to those over broadleaf forests and savanna. We an-alyzed several cases of MODIS fire radiative power withinthe smoke plumes and found that the fires were less ener-getic over croplands than over forests and savanna. Seventy-six percent of the smoke pixels over croplands were below1 km, with no pixels above 4 km. Forty-four percent of thesmoke pixels over woody savanna were above 1 km, with1.1 % above 5 km. Forty-seven percent of the smoke pixels
www.atmos-chem-phys.net/14/3977/2014/ Atmos. Chem. Phys., 14, 3977–3989, 2014

3982 Y. Jian and T.-M. Fu: Injection heights of springtime biomass burning plumes
over broadleaf forests were above 1 km, with 0.1 % above5 km.
3.2 Uncertainty analysis
The probability distributions of smoke pixel heights deter-mined in Sect. 3.1 were susceptible to possible biases fromsampling. The smoke plume heights detected at Terra satel-lite overpass time (approximately 10:30 a.m. local time) maynot be representative of the smoke plumes during other timesof the day, especially for fires associated with agriculture.Giglio (2007) showed that the diurnal cycle of fire activ-ity over Southeast Asia peaks at 15:00 local time. Also, theMISR swath is 360 km wide while the MODIS swath is2330 km wide. As a result, 85 % of the fire pixels detected byMODIS were not within MISR footprints. In addition, firesand smoke plumes obscured by clouds were not detected byeither MODIS or MISR. We assumed that the smoke plumesoutside of the MISR temporal and spatial footprints or ob-scured by clouds had the same smoke pixel height distribu-tion as the ones analyzed in Sect. 3.1. However, we acknowl-edge that these are important uncertainties that should be fur-ther investigated using complementary in situ or remote sens-ing measurements.
Additional uncertainty in the smoke pixel height proba-bility distribution may come from the under-identification ofsmall or low plumes. In our analysis, only half of the MODISthermal anomalies within MISR footprints were associatedwith a visible smoke plume. Some of the thermal anomalieswithout visible smoke plumes may be false detection due tosun glint, hot desert surface, coasts, or clouds (Giglio et al.,2003). However, it was also possible that smoke plumes thatwere small or close to the surface were not visible to oureyes in the MISR imageries due to their low reflectivity con-trast. To assess this bias, we analyzed the number of ther-mal anomalies associated with each of the identified smokeplumes in spring 2010. We found that each of the identi-fied smoke plumes was associated with a range of 1 to 12MODIS thermal anomalies at the vertex of the plume. Thethermal anomalies not associated with visible smoke plumeswere in most cases stand-alone. We assumed that these stand-alone thermal anomalies were detected falsely or associatedwith very small fires with little emission. To each cluster ofmore than two MODIS thermal anomalies but without a vis-ible smoke plume, we assigned five smoke pixels (half thesmallest number of smoke pixels in identified plumes), eachwith a height < 500 m (the lowest altitude bin in Fig. 2). Atotal of 105 smoke pixels were thus assigned. The resultingdifference in the overall probability of smoke pixel heightbelow 1 km was less than 3 %, and we ignored this source oferror henceforth.
Fig. 3. Monthly mean biomass-burning emissions of CO from Eastand South Asia for March 2001. Monthly mean emission totals werefrom the inventory developed by Streets et al. (2003) and temporallydistributed based on the daily burned area from GFED4 (Giglio etal., 2013). Also shown are the locations of the BC measurementsover the northwestern Pacific from the Trace-P aircraft campaignwhich we used for model evaluation in Sect. 5 (black lines: DC-8;red lines: P-3B).
4 Impacts of smoke injection height on long-rangepollutant transport and ozone formation
4.1 Long-range transport of CO
We used the GEOS–Chem model to simulate the outflowof PSEA biomass-burning pollutants in spring 2001 and as-sessed the impacts of smoke plume injection heights on thelong-range transport of pollutants. Two simulations wereconducted. In the control simulation, all biomass-burningemissions were released evenly within the boundary layerfollowing the standard practice in GEOS–Chem. In the sensi-tivity simulation, the biomass-burning emissions over PSEAwere released according to the probability distribution ofsmoke pixel heights observed by MISR for the year 2001.That is, 40 % of the PSEA biomass-burning emissions werereleased in the model evenly between the top of the lo-cal boundary layer and 5 km altitude, while the remain-ing 60 % were released in the boundary layer. Both simu-lations were conducted from July 2000 to April 2001. Thefirst eight months spun up the model. Below we focusedon March 2001, when the biomass-burning emissions fromPSEA were at their peak. Figure 3 shows the biomass-burning emissions of CO for March 2001. Emissions werehigh over the entire PSEA with the largest fluxes exceeding5× 1012 molecules cm−2 s−1 over northern Laos and west-ern Myanmar, consistent with the locations of smoke plumesobserved by MISR (Fig. 1).
Figure 4a and b show the monthly mean CO concentra-tions in March 2001 in the control simulation, as well asthe fraction contributed by PSEA biomass burning and themonthly mean wind fields, at five different altitudes. At the
Atmos. Chem. Phys., 14, 3977–3989, 2014 www.atmos-chem-phys.net/14/3977/2014/
Y. Jian and T.-M. Fu: Injection heights of springtime biomass burning plumes 3983
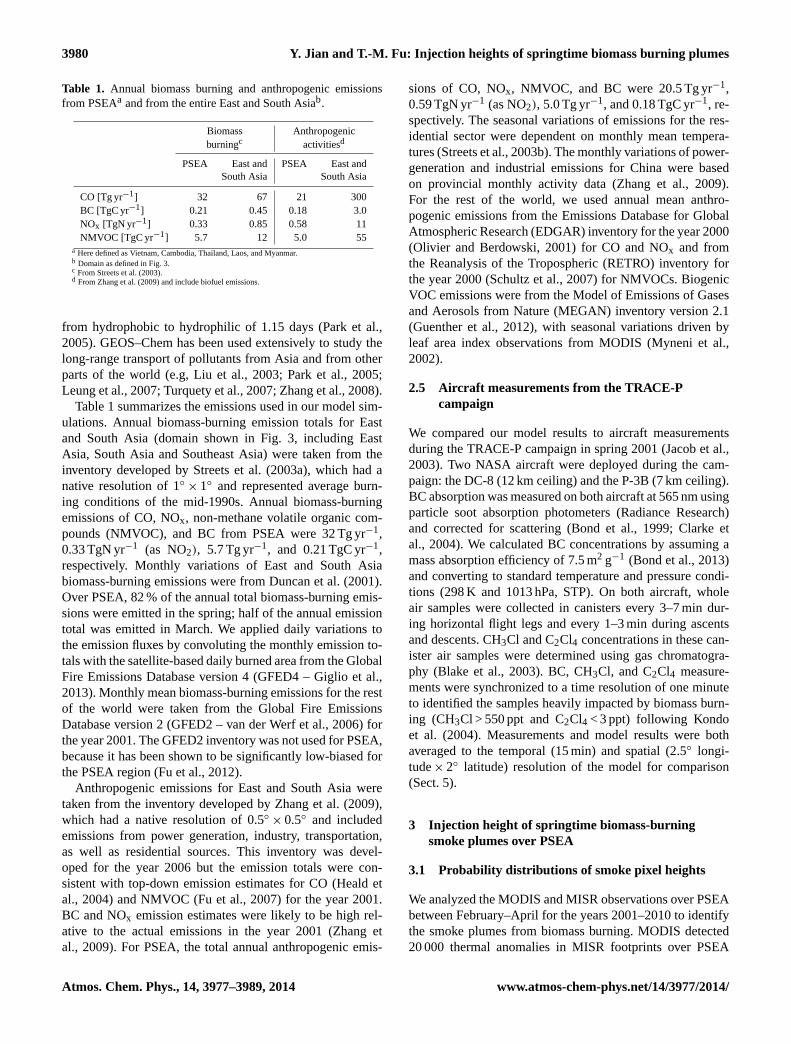
surface, the highest CO concentrations exceeding 300 ppbwere found over PSEA, where the local biomass-burningemissions contributed 10–40 % of the surface CO. PSEAbiomass-burning emissions also contributed 5–15 % of sur-face CO over Southwest China near the China-PSEA border,but otherwise had little impact on the surface CO concentra-tions over the rest of East Asia. At 850 hPa, the area mostaffected by PSEA biomass-burning emissions remained overPSEA, indicating that the emitted pollutants were largelytransported vertically between the surface and 850 hPa overPSEA in the control simulation. At 700 hPa and above, how-ever, the area most affected by PSEA biomass-burning emis-sions shifted northwestward to southern China and extendedto the northwestern Pacific, reflecting the transport by thesouthwesterly to westerly wind at this altitude. Over southernChina and the northwestern Pacific, PSEA biomass-burningcontribution was most prominent at 700 hPa, consistent withprevious ozonesonde and aircraft observations of the PSEAoutflows (Liu et al., 1999; Chan et al., 2000; Carmichael etal., 2003).
Figure 4c shows the percent changes of the monthly meanCO concentrations in the MISR-constrained simulation rela-tive to the control simulation. We found that directly injectingPSEA biomass-burning pollutants into the free tropospherehad only a small impact on the long-range transport of CO.Over the PSEA source region, CO concentrations decreasedby 3–10 % at the surface and increased by 3–10 % at 700 hPa,reflecting the direct injection of CO into the free tropospherein the MISR-constrained simulation. Downwind, CO con-centrations increased by less than 5 % at 700 hPa over theSouth China sea, with no significant changes anywhere else.Figure 5a shows the percentage difference of the troposphericcolumn CO burden in the MISR-constrained simulation rel-ative to the control simulation. The direct injection of PSEAsmoke plumes into the free troposphere led to less than 1 %decrease in the CO burden over the source and downwindregions.
Why was the long-range transport of biomass-burning COfrom PSEA insensitive to the smoke plume injection height?We found that the surface circulation over PSEA in Marchwas dominated by a persisting low-pressure system, whichconverged surface air and induced deep convection over theregion (Fig. 4b). That deep convection was enhanced by thepassage of cold fronts associated with midlatitude cyclonesevery 2–7 days (Liu et al., 2003). Therefore, CO, whichhas a lifetime of 1–2 months, was efficiently lifted by thesesynoptic-scale processes from the surface to 2–3 km, whereit was subsequently transported downwind by the persistentwesterly. We concluded that for PSEA biomass-burning pol-lutants with lifetime significantly longer than 7 days (the syn-optic timescale), their long-range transport was relatively in-sensitive to the plume injection heights on a monthly basis.This finding was similar to that of Chen et al. (2009) forNorth American boreal fire emissions.
Fig. 4. (a) Monthly mean CO concentrations and(b) the fractionscontributed by biomass burning from PSEA at five different alti-tudes during March 2001 in the control simulation. Arrows indi-cate the monthly mean wind.(c) The percent changes of simulatedmonthly mean CO concentrations in the MISR-constrained simula-tion relative to the control simulation.
4.2 Impacts on the long-range transport of BC, NOx,and peroxyacetyl nitrate (PAN), and the formationof ozone
Figure 6a shows the percent changes of BC concentrationsin the MISR-constrained simulation relative to the controlsimulation during March 2001. We found that the long-rangetransport of BC was more sensitive to the smoke plume injec-tion height than that of CO. Over PSEA, surface BC concen-trations decreased by 20–40 %, reflecting the smaller amountof biomass-burning pollutants released at the surface in theMISR-constrained simulation. At 700 hPa, the increases inBC concentrations as a result of the direct injection of BCpollutants into the free troposphere were 50–100 %, muchlarger than those for CO. BC over PSEA was removed bywet scavenging at a timescale of four days. As a result, sur-face BC was not as efficiently transported into the free tro-posphere by deep convection, such that the impact of directinjection into the free troposphere was more pronounced.Subsequent eastward transport of BC to southern China andthe northwestern Pacific between 15–25◦ N increased by asmuch as 70 % at 700 hPa and by 20–50 % at 500 hPa. Inter-estingly, BC concentrations also increased significantly byover 50 % at low altitudes (surface to 850 hPa) over the trop-ical northwestern Pacific (5–15◦ N, 130–160◦ E), where theprevailing wind was easterly. We found that this was dueto the increased transport of BC to the northwestern Pa-cific (15–25◦ N) between 700 hPa and 500 hPa. Part of thisBC was then transported clockwise by the Pacific subtropi-cal high pressure system and carried to lower altitude by thesubsiding northeasterly flow between 5–15◦ N (Fig. 6a). To
www.atmos-chem-phys.net/14/3977/2014/ Atmos. Chem. Phys., 14, 3977–3989, 2014

3984 Y. Jian and T.-M. Fu: Injection heights of springtime biomass burning plumes
Fig. 5. Percent differences of tropospheric column(a) CO, (b) BC,(c) NOx, (d) peroxyacetyl nitrate (PAN), and(e) ozone concentra-tions in the MISR-constrained simulation relative to control simu-lation during March 2001.
the best of our knowledge, this transport pathway of PSEApollutants to the tropical northwestern Pacific in the springhas not been reported previously. The BC thus transportedmay impact the marine boundary layer dynamics through itssemi-direct radiative effect (Koch and Del Genio, 2010) andwarrants further investigation.
Figure 6 also shows the percent changes of NOx, PAN,and ozone concentrations in the MISR-constrained simula-tion relative to the control simulation. The photochemicallifetime of NOx in the lower troposphere is only severalhours, shorter than the timescale of deep convection. There-fore, the vertical profile of NOx over the source region wasalso sensitive to the injection height of smoke plume. As seenin Fig. 6b, monthly mean NOx concentrations over PSEAdecreased by 5–20 % at the surface and increased by 10–50 % at 700 hPa. This change in NOx then drove changesin the formation of PAN (Fig. 6c), such that PAN concen-trations increased by 10–40 % at 700 hPa. The increases ofNOx and PAN lead to increase in ozone over PSEA and thedownwind region (Fig. 6d). During 1–5 March, when PSEAbiomass burning was strongest, the daily mean NOx, PANand ozone concentrations could increase by as much as 40 %,
Fig. 6. Percent changes of pollutant concentrations in the MISR-constrained simulation relative to the control simulation for(a) BC,(b) NOx, (c) PAN, and(d) ozone at five altitudes during March2001. Arrows indicate the monthly mean wind.
50 % and 20 %, respectively, over the northwestern Pacific.On a monthly mean basis, however, the changes of NOx,PAN and ozone concentrations over the northwestern Pacificwere within 5 %, since the monthly mean contribution of thePSEA biomass-burning emissions to NOx there was less than2 %.
Figure 5b–e shows the percent changes of the monthlymean column burden of BC, NOx, PAN, and ozone in theMISR-constrained simulation relative to the control simula-tion. The tropospheric BC burden was most sensitive to thesmoke plume injection height and increased by 20–30 % be-tween 5–25◦ N over the northwestern Pacific. The columnburden of NOx, PAN, and ozone increased 1–10 % abovePSEA.
5 Comparison with TRACE-P aircraft measurementsof BC
Our model simulations in Sect. 4 showed the injection heightof smoke plumes over PSEA had the largest impact onthe long-range transport of PSEA biomass-burning BC tothe northwestern Pacific. Here we compared model resultsagainst TRACE-P aircraft measurements over the northwest-ern Pacific (south of 25◦ N). Figure 3 shows the location ofaircraft measurements used in our analysis. We sampled themodel along the flight tracks at 1 min intervals. Measure-ments and model results were both averaged to the tempo-ral (15 min) and spatial resolution of the model for compar-ison. Intercomparison flights during TRACE-P showed thatthe aerosol absorption measurements on the DC-8 were sys-tematically higher than that on the P-3B (Moore et al., 2004).We examined the data from the two aircraft separately.
Atmos. Chem. Phys., 14, 3977–3989, 2014 www.atmos-chem-phys.net/14/3977/2014/

Y. Jian and T.-M. Fu: Injection heights of springtime biomass burning plumes 3985
Fig. 7.Vertical profiles of BC concentrations over the northwesternPacific (south of 25◦ N) as measured by aircraft during the TRACE-P campaign and as simulated by the model. The black, red and greenlines represent BC concentrations from the aircraft observations,the sensitivity simulation using the MISR injection height profile,and the control simulation, respectively. Upper panel: all air massessampled by the TRACE-P aircraft (DC-8 and P-3B). Lower panel:air masses significantly impacted by biomass burning. Model re-sults were sampled along the flight tracks (Fig. 3). Measurementsand model results were both averaged to the temporal and spatialresolution of the model for comparison. The error bars show thestandard deviations. The numbers on the right are the numbers ofmodel grids averaged.
Figure 7a and b compare the observed and simulated ver-tical profiles of BC concentrations in all air masses sam-pled by the aircraft. On both aircraft, measured BC con-centrations were less than 1.1 µg m−3 below 2 km, increasedto > 1.4 µg m−3 around 3 km, and decreased sharply to< 0.3 µg m−3 above 4 km. The local maximum of BC concen-trations at 2–3 km (1.4 µg m−3 on the DC-8 and 1.7 µg m−3
on the P-3B) reflected the altitude of the outflow from PSEA,as shown previously in the back trajectory analysis by Kondoet al. (2004). Both the control simulation and the MISR-constrained simulation reproduced the general features of theobserved vertical profiles. The outflow feature at 2–3 km wasmore pronounced in the MISR-constrained simulation, withsimulated BC concentrations 21 % (DC-8 track) and 27 %(P-3B track) higher than those in the control simulation.
We further compared model results against the measuredBC concentrations only in air masses significantly impactedby biomass-burning emissions (Figs. 7c, d), based on the cri-teria that measured CH3Cl > 550 ppt and C2Cl4 < 3 ppt fol-lowing Kondo et al. (2004). There was no measurement be-
low 2 km on both aircraft. Measured BC concentrations onboth aircraft were highest at approximately 3 km (3.9 µg m−3
on the DC-8 and 1.2 µg m−3 on the P-3B) then decreased to< 0.2 µg m−3 above 4 km. Both the control simulation andthe MISR-constrained simulation reproduced the shape ofthe observed BC vertical profiles. Again, the outflow featureat approximately 3 km was more pronounced in the MISR-constrained simulation, with simulated BC concentrations22 % (DC-8) and 168 % (P3-B) higher than those in the con-trol simulation.
Our analysis above showed that directly injecting 40 %of the PSEA biomass-burning pollutants in the free tropo-sphere in the model led to a more pronounced BC outflow at3 km over the northwestern Pacific. This resulted in a slightlyimproved simulation of the DC-8 observations and a slightoverestimation of the P-3B observations, although the differ-ences were within the observed variances. We emphasize thatsuch comparison is neither sufficient proof nor disproof forthe smoke plume injection height presented in Sect. 3. Manyother factors may contribute to the model performance whencomparing to the aircraft observations, such as the large un-certainties in the PSEA biomass-burning emissions and theBC wet scavenging rate. Our analysis highlighted the pointthat the injection heights of smoke plumes presents great un-certainty over the interpretation of BC measurements down-wind of biomass-burning regions. In particular, discrepanciesbetween model and measurements cannot be attributed solelyto errors in the biomass-burning emission inventory, unlessthe impacts of plume injection heights have been addressed.
6 Conclusions
We analyzed satellite observations to determine the injectionheights of biomass-burning smoke plumes over PSEA in thespring, with the goal of assessing the impacts of smoke injec-tion heights on long-range pollutant transport. We retrievedthe heights of 22 350 smoke pixels during February to Aprilof the years 2001 to 2010. On average, 45 % of the smokepixels were above the mean local boundary layer top (1 km)at satellite overpass time.
We simulated the long-range transport of biomass-burningpollutants from PSEA using the GEOS–Chem model. Weconducted a control simulation where all PSEA biomass-burning emissions were released in the boundary layer, aswell as a sensitivity simulation where 40 % of the PSEAbiomass-burning emissions were injected into the free tro-posphere. We found that the surface air over PSEA in Marchwas well ventilated by deep convective activities triggeredby synoptic-scale weather systems, such that the long-rangetransport of pollutants with lifetimes significantly longer thanseven days (e.g., CO) was relatively insensitive to the smokeplume injection heights.
The long-range transport of shorter-lived pollutants wasmuch more sensitive to the smoke plume injection height.
www.atmos-chem-phys.net/14/3977/2014/ Atmos. Chem. Phys., 14, 3977–3989, 2014

3986 Y. Jian and T.-M. Fu: Injection heights of springtime biomass burning plumes
The eastward transport of BC to southern China and thenorthwestern Pacific increased by 20–70 % at 700 hPa. BCconcentrations also increased significantly at low altitudesover the tropical northwestern Pacific, due to transport bythe Pacific subtropical high pressure system. The direct injec-tion of PSEA biomass-burning NOx into the free tropospheredrove increased formation and transport of PAN, which inturn led to a small increase in ozone over downwind regions.
We compared our model results to aircraft measurementsover the northwestern Pacific during the TRACE-P campaign(March 2001). The direct injection of 40 % of the PSEAbiomass-burning pollutants in the free troposphere in themodel led to a more pronounced BC peak at 3 km over thetropical northwestern Pacific, consistent with the outflow fea-ture observed by the aircraft.
Our results showed that the smoke plume injection heightspresents great uncertainty over the interpretation of short-lived species measurements downwind of biomass-burningregions. Discrepancies between model and measurementscannot be attributed solely to errors in the biomass-burningemission estimates, unless the impacts of plume injectionheights have been addressed.
Acknowledgements.This work was funded by the National Nat-ural Science Foundation of China (41222035, 41175101) and bythe Ministry of Science and Technology of China (2014CB441303).
Edited by: I. Aben
References
Amiridis, V., Giannakaki, E., Balis, D. S., Gerasopoulos, E.,Pytharoulis, I., Zanis, P., Kazadzis, S., Melas, D., and Zerefos,C.: Smoke injection heights from agricultural burning in EasternEurope as seen by CALIPSO, Atmos. Chem. Phys., 10, 11567–11576, doi:10.5194/acp-10-11567-2010, 2010.
Bey, I., Jacob, D. J., Yantosca, R. M., Logan, J. A., Field, B.D., Fiore, A. M., Li, Q. B., Liu, H. G. Y., Mickley, L. J., andSchultz, M. G.: Global modeling of tropospheric chemistry withassimilated meteorology: Model description and evaluation, J.Geophys. Res., 106, 23073–23095, doi:10.1029/2001JD000807,2001.
Blake, N. J., Blake, D. R., Simpson, I. J., Meinardi, S., Swan-son, A. L., Lopez, J. P., Katzenstein, A. S., Barletta, B., Shi-rai, T., Atlas, E., Sachse, G., Avery, M., Vay, S., Fuelberg, H.E., Kiley, C. M., Kita, K., and Rowland, F. S.: NMHCs andhalocarbons in Asian continental outflow during the Transportand Chemical Evolution over the Pacific (TRACE-P) Field Cam-paign: Comparison With PEM-West B, J. Geophys. Res., 108,8806, doi:10.1029/2002JD003367, 2003.
Bond, T. C., Anderson, T. L., and Campbell, D.: Calibrationand intercomparison of filter-based measurements of visiblelight absorption by aerosols, Aerosol Sci. Tech., 30, 582–600,doi:10.1080/027868299304435, 1999.
Bond, T. C., Doherty, S. J., Fahey, D. W., Forster, P. M., Berntsen,T., DeAngelo, B. J., Flanner, M. G., Ghan, S., Kärcher, B.,
Koch, D., Kinne, S., Kondo, Y., Quinn, P. K., Sarofim, M.C., Schultz, M. G., Venkataraman, C., Zhang, H., Zhang, S.,Bellouin, N., Guttikunda, S. K., Hopke, P. K., Jacobson, M.Z., Kaiser, J. W., Klimont, Z., Lohmann, U., Schwarz, J. P.,Shindell, D., Storelvmo, T., Warren, S. G., and Zender, C.S.: Bounding the role of black carbon in the climate sys-tem: a scientific assessment, J. Geophys. Res., 118, 5380–5552,doi:10.1002/jgrd.50171, 2013.
Carmichael, G. R., Tang, Y., Kurata, G., Uno, I., Streets, D., Woo, J.H., Huang, H., Yienger, J., Lefer, B., Shetter, R., Blake, D., Atlas,E., Fried, A., Apel, E., Eisele, F., Cantrell, C., Avery, M., Bar-rick, J., Sachse, G., Brune, W., Sandholm, S., Kondo, Y., Singh,H., Talbot, R., Bandy, A., Thorton, D., Clarke, A., and Heikes,B.: Regional-scale chemical transport modeling in support of theanalysis of observations obtained during the TRACE-P experi-ment, J. Geophys. Res., 108, 8823, doi:10.1029/2002JD003117,2003.
Chan, L. Y., Chan, C. Y., Liu, H. Y., Christopher, S., Olt-mans, S. J., and Harris, J. M.: A case study on the biomassburning in southeast Asia and enhancement of troposphericozone over Hong Kong, Geophys. Res. Lett., 27, 1479–1482,doi:10.1029/1999GL010855, 2000.
Chen, Y., Li, Q., Randerson, J. T., Lyons, E. A., Kahn, R. A., Nel-son, D. L., and Diner, D. J.: The sensitivity of CO and aerosoltransport to the temporal and vertical distribution of North Amer-ican boreal fire emissions, Atmos. Chem. Phys., 9, 6559–6580,doi:10.5194/acp-9-6559-2009, 2009.
Clarke, A. D., Shinozuka, Y., Kapustin, V. N., Howell, S., Huebert,B., Doherty, S., Anderson, T., Covert, D., Anderson, J., Hua, X.,Moore, K. G., McNaughton, C., Carmichael, G., and Weber, R.:Size distributions and mixtures of dust and black carbon aerosolin Asian outflow: physiochemistry and optical properties, J. Geo-phys. Res., 119, D15S09, doi:10.1029/2003JD004378, 2004.
Colarco, P., Schoeberl, M., Doddridge, B., Marufu, L., Torres, O.,and Welton, E.: Transport of smoke from Canadian forest firesto the surface near Washington, D.C.: Injection height, entrain-ment, and optical properties, J. Geophys. Res., 109, D06203,doi:10.1029/2003jd004248, 2004.
Damoah, R., Spichtinger, N., Servranckx, R., Fromm, M., Elo-ranta, E. W., Razenkov, I. A., James, P., Shulski, M., Forster, C.,and Stohl, A.: A case study of pyro-convection using transportmodel and remote sensing data, Atmos. Chem. Phys., 6, 173–185, doi:10.5194/acp-6-173-2006, 2006.
Deng, X., Tie, X., Zhou, X., Wo, D., Zhong, L., Tan, H., Li, F.,Huang, X., Bi, X., and Deng, T.: Effects of Southeast Asiabiomass burning on aerosols and ozone concentrations over thePearl River Delta (PRD) region, Atmos. Environ., 42, 8493–8501, doi:10.1016/j.atmosenv.2008.08.013, 2008.
Diner, D. J., Beckert, J. C., Reilly, T. H., Bruegge, C. J., Conel,J. E., Kahn, R. A., Martonchik, J. V., Ackerman, T. P., Davies,R., Gerstl, S. A. W., Gordon, H. R., Muller, J. P., Myneni, R.B., Sellers, P. J., Pinty, B., and Verstraete, M. M.: Multi-angleImaging SpectroRadiometer (MISR) instrument description andexperiment overview, IEEE T. Geosci. Remote, 36, 1072–1087,doi:10.1109/36.700992, 1998.
Duncan, B. N., Martin, R. V., Staudt, A. C, Yevich, R., and Logan,J. A.: Interannual and seasonal variability of biomass burningemissions constrained by satellite observations, J. Geophys. Res.,108, 4100, doi:1029/2002JD002378, 2001.
Atmos. Chem. Phys., 14, 3977–3989, 2014 www.atmos-chem-phys.net/14/3977/2014/

Y. Jian and T.-M. Fu: Injection heights of springtime biomass burning plumes 3987
Ferguson, S. A., Collins, R. L., Ruthford, J., and Fukuda, M.:Vertical distribution of nighttime smoke following a wildlandbiomass fire in boreal Alaska, J. Geophys. Res., 108, 4743,doi:10.1029/2002JD003324, 2003.
Fox, J., Fujita, Y., Ngidang, D., Peluso, N., Potter, L., Sakunta-ladewi, N., Sturgeon, J., and Thomas, D.: Policies, Political-Economy, and Swidden in Southeast Asia, Hum. Ecol., 37, 305–322, doi:10.1007/s10745-009-9240-7, 2009.
Freitas, S. R., Longo, K. M., and Andreae, M. O.: Impact of in-cluding the plume rise of vegetation fires in numerical simula-tions of associated atmospheric pollutants, Geophys. Res. Lett.,33, L17808, doi:10.1029/2006GL026608, 2006.
Freitas, S. R., Longo, K. M., Chatfield, R., Latham, D., Silva Dias,M. A. F., Andreae, M. O., Prins, E., Santos, J. C., Gielow, R., andCarvalho Jr., J. A.: Including the sub-grid scale plume rise of veg-etation fires in low resolution atmospheric transport models, At-mos. Chem. Phys., 7, 3385–3398, doi:10.5194/acp-7-3385-2007,2007.
Friedl, M. A., Sulla-Menashe, D., Tan, B., Schneider, A., Ra-mankutty, N., Sibley, A., and Huang, X.: MODIS Collection5 global land cover: Algorithm refinements and characteriza-tion of new datasets, Remote Sens. Environ., 114, 168–182,doi:10.1016/j.rse.2009.08.016, 2010.
Fromm, M., Bevilacqua, R., Servranckx, R., Rosen, J., Thayer, J.P., Herman, J., and Larko, D.: Pyro-cumulonimbus injection ofsmoke to the stratosphere: Observations and impact of a superblowup in northwestern Canada on 3–4 August 1998, J. Geophys.Res., 110, D08205, doi:10.1029/2004JD005350, 2005.
Fu, T.-M., Jacob, D. J., Palmer, P. I., Chance, K., Wang, Y.X., Barletta, B., Blake, D. R., Stanton, J. C., and Pilling, M.J.: Space-based formaldehyde measurements as constraints onvolatile organic compound emissions in east and south Asiaand implications for ozone, J. Geophys. Res., 112, D06312,doi:10.1029/2006JD007853, 2007.
Fu, J. S., Hsu, N. C., Gao, Y., Huang, K., Li, C., Lin, N.-H., andTsay, S.-C.: Evaluating the influences of biomass burning dur-ing 2006 BASE-ASIA: a regional chemical transport modeling,Atmos. Chem. Phys., 12, 3837–3855, doi:10.5194/acp-12-3837-2012, 2012.
Giglio, L.: Characterization of the tropical diurnal fire cycle usingVIRS and MODIS observations, Remote Sens. Environ., 108,407–421, doi:10.1016/j.rse.2006.11.018, 2007.
Giglio, L., Descloitres, J., Justice, C. O., and Kaufman, Y. J.:An enhanced contextual fire detection algorithm for MODIS,Remote Sens. Environ., 87, 273–282, doi:10.1016/S0034-4257(03)00184-6, 2003.
Giglio, L., Randerson, J. T., and van der Werf, G. R.: Analy-sis of daily, monthly, and annual burned area using the fourth-generation global fire emissions database (GFED4), J. Geophys.Res., 118, 317–328, doi:10.1002/jgrg.20042, 2013.
Guenther, A. B., Jiang, X., Heald, C. L., Sakulyanontvittaya, T.,Duhl, T., Emmons, L. K., and Wang, X.: The Model of Emissionsof Gases and Aerosols from Nature version 2.1 (MEGAN2.1): anextended and updated framework for modeling biogenic emis-sions, Geosci. Model Dev., 5, 1471-1492, doi:10.5194/gmd-5-1471-2012, 2012.
Heald, C. L., Jacob, D. J., Jones, D. B., Palmer, P. I., Logan, J.A., Streets, D., Sachse, G. W., Gille, J. C., Hoffman, R. N.,and Nehrkorn, T.: Comparative inverse analysis of satellite (MO-
PITT) and aircraft (TRACE-P) observations to estimate Asiansources of carbon monoxide, J. Geophys. Res., 109, D23306,doi:10.1029/2004JD005185, 2004.
Jacob, D. J., Crawford, J. H., Kleb, M. M., Connors, V. S., Bendura,R. J., Raper, J. L., Sachse, G. W., Gille, J. C., Emmons, L., andHeald, C. L.: Transport and Chemical Evolution over the Pacific(TRACE-P) aircraft mission: Design, execution, and first results,J. Geophys. Res., 108, 9000, doi:10.1029/2002jd003276, 2003.
Kahn, R. A., Li, W.-H., Moroney, C., Diner, D. J., Martonchik, J.V., and Fishbein, E.: Aerosol source plume physical characteris-tics from space-based multiangle imaging, J. Geophys. Res., 112,D11205, doi:10.1029/2006JD007647, 2007.
Kahn, R. A., Chen, Y., Nelson, D. L., Leung, F. Y., Li, Q. B.,Diner, D. J., and Logan, J. A.: Wildfire smoke injection heights:two perspectives from space, Geophys. Res. Lett., 35, L04809,doi:10.1029/2007GL032165, 2008.
Koch, D. and Del Genio, A. D.: Black carbon semi-direct effectson cloud cover: review and synthesis, Atmos. Chem. Phys., 10,7685–7696, doi:10.5194/acp-10-7685-2010, 2010.
Kondo, Y., Morino, Y., Takegawa, N., Koike, M., Kita, K.,Miyazaki, Y., Sachse, G. W., Vay, S. A., Avery, M. A., Flocke,F., Weinheimer, A. J., Eisele, F. L., Zondlo, M. A., Weber, R.J., Singh, H. B., Chen, G., Crawford, J., Blake, D. R., Fuelberg,H. E., Clarke, A. D., Talbot, R. W., Sandholm, S. T., Brow-ell, E. V., Streets, D. G., and Liley, B.: Impacts of biomassburning in Southeast Asia on ozone and reactive nitrogen overthe western Pacific in spring, J. Geophys. Res., 109, D15S12,doi:10.1029/2003JD004203, 2004.
Labonne, M., Breon, F. M., and Chevallier, F.: Injection height ofbiomass burning aerosols as seen from a spaceborne lidar, Geo-phys. Res. Lett., 34, L11806, doi:10.1029/2007GL029311, 2007.
Leung, F.-Y. T., Logan, J. A., Park, R., Hyer, E., Kasis-chke, E., Streets, D., and Yurganov, L.: Impacts of enhancedbiomass burning in the boreal forests in 1998 on troposphericchemistry and the sensitivity of model results to the injec-tion height of emissions, J. Geophys. Res., 112, D10313,doi:10.1029/2006JD008132, 2007.
Lin, C.-Y., Hsu, H.-M., Lee, Y. H., Kuo, C. H., Sheng, Y.-F., andChu, D. A.: A new transport mechanism of biomass burningfrom Indochina as identified by modeling studies, Atmos. Chem.Phys., 9, 7901–7911, doi:10.5194/acp-9-7901-2009, 2009.
Lin, C.-Y., Chang, C.-C., Chan, C. Y., Kuo, C. H., Chen,W.-C., Chu, D. A., and Liu, S. C.: Characteristics ofspringtime profiles and sources of ozone in the low tropo-sphere over northern Taiwan, Atmos. Environ., 44, 182–193,doi:10.1016/j.atmosenv.2009.10.020, 2010.
Lin, J.-T. and McElroy, M. B.: Impacts of boundary layer mixingon pollutant vertical profiles in the lower troposphere: impli-cations to satellite remote sensing, Atmos. Environ., 44, 1726–1739, doi:10.1016/j.atmosenv.2010.02.009, 2010.
Liu, H., Chang, W. L., Oltmans, S. J., Chan, L. Y., and Harris, J. M.:On springtime high ozone events in the lower troposphere fromSoutheast Asian biomass burning, Atmos. Environ., 33, 2403–2410, doi:10.1016/S1352-2310(98)00357-4, 1999.
Liu, H. Y., Jacob, D. J., Bey, I., and Yantosca, R. M.: Constraintsfrom Pb-210 and Be-7 on wet deposition and transport in aglobal three-dimensional chemical tracer model driven by as-similated meteorological fields, J. Geophys. Res., 106, 12109–12128, 2001.
www.atmos-chem-phys.net/14/3977/2014/ Atmos. Chem. Phys., 14, 3977–3989, 2014

3988 Y. Jian and T.-M. Fu: Injection heights of springtime biomass burning plumes
Liu, H. Y., Jacob, D. J., Bey, I., Yantosca, R. M., Duncan, B. N., andSachse, G. W.: Transport pathways for Asian pollution outflowover the Pacific: Interannual and seasonal variations, J. Geophys.Res., 108, 8786, doi:10.1029/2002JD003102, 2003.
Mao, J., Jacob, D. J., Evans, M. J., Olson, J. R., Ren, X., Brune, W.H., Clair, J. M. St., Crounse, J. D., Spencer, K. M., Beaver, M.R., Wennberg, P. O., Cubison, M. J., Jimenez, J. L., Fried, A.,Weibring, P., Walega, J. G., Hall, S. R., Weinheimer, A. J., Co-hen, R. C., Chen, G., Crawford, J. H., McNaughton, C., Clarke,A. D., Jaeglé, L., Fisher, J. A., Yantosca, R. M., Le Sager, P.,and Carouge, C.: Chemistry of hydrogen oxide radicals (HOx) inthe Arctic troposphere in spring, Atmos. Chem. Phys., 10, 5823–5838, doi:10.5194/acp-10-5823-2010, 2010.
Mazzoni, D., Logan, J. A., Diner, D., Kahn, R., Tong, L. L., andLi, Q. B.: A data-mining approach to associating MISR smokeplume heights with MODIS fire measurements, Remote Sens.Environ., 107, 138–148, doi:10.1016/j.rse.2006.08.014, 2007.
Mims, S. R., Kahn, R. A., Moroney, C. M., Gaitley, B. J., Nelson,D. L., and Garay, M. J.: MISR Stereo heights of grassland firesmoke plumes in Australia, IEEE T. Geosci. Remote, 48, 25–35,doi:10.1109/TGRS.2009.2027114, 2010.
Miyazaki, Y., Kondo, Y., Koike, M., Fuelberg, H. E., Kiley, C. M.,Kita, K., Takegawa, N., Sachse, G. W., Flocke, F., Weinheimer,A. J., Singh, H. B., Eisele, F. L., Zondlo, M., Talbot, R. W., Sand-holm, S. T., Avery, M. A., and Blake, D. R.: Synoptic-scale trans-port of reactive nitrogen over the western Pacific in spring, J.Geophys. Res., 108, 8788, doi:10.1029/2002JD003248, 2003.
Moore, K. G., Clarke, A. D., Kapustin, V. N., McNaughton, C.,Anderson, B. E., Winstead, E. L., Weber, R., Ma, Y., Lee, Y.N., Talbot, R., Dibb, J., Anderson, T., Doherty, S., Covert, D.,and Rogers, D.: A comparison of similar aerosol measurementsmade on the NASA P3-B, DC-8, and NSFC-130 aircraft dur-ing TRACE-P and ACE-Asia, J. Geophys. Res., 109, D15S15,doi:10.1029/2003jd003543, 2004.
Moroney, C., Davies, R., and Muller, J. P.: Operational retrieval ofcloud-top heights using MISR data, IEEE T. Geosci. Remote, 40,1532–1540, doi:10.1109/TGRS.2002.801150, 2002.
Myneni, R. B., Hoffman, S., Knyazikhin, Y., Privette, J. L., Glassy,J., Tian, Y., Wang, Y., Song, X., Zhang, Y., Smith, G. R.,Lotsch, A., Friedl, M., Morisette, J. T., Votava, P., Nemani,R. R., and Running, S. W.: Global products of vegetation leafarea and fraction absorbed PAR from year one of MODISdata, Remote Sens. Environ., 83, 214–231, doi:10.1016/s0034-4257(02)00074-3, 2002.
Nelson, D. L., Chen, Y., Kahn, R. A., Diner, D. J., and Mazzoni, D.:Example applications of the MISR INteractive eXplorer (MINX)software tool to wild?re smoke plume analyses, in: SPIE 7089Remote Sensing of Fire: Science and Application, San Diego,USA, 27 August 2008, 708909, 2008.
Nelson, D. L., Garay, M. J., Kahn, R. A., and Dunst, B. A.: Stereo-scopic height and wind retrievals for aerosol plumes with theMISR INteractive eXplorer (MINX), Remote Sens., 5, 4593–4628, doi:10.3390/rs5094593, 2013.
Olivier, J. G. J. and Berdowski, J. J. M.: Global emissions sourcesand sinks, in: The Climate System, edited by: Berdowski, J.,Guicherit, R., and Heij, B. J., A. A. Balkema Publishers/Swets& Zeitlinger Publishers, Lisse, the Netherlands, 33–78, 2001.
Park, R. J., Jacob, D. J., Palmer, P. I., Clarke, A. D., Weber, R.J., Zondlo, M. A., Eisele, F. L., Bandy, A. R., Thornton, D. C.,
Sachse, G. W., and Bond, T. C.: Export efficiency of black carbonaerosol in continental outflow: Global implications, J. Geophys.Res., 110, D11205, doi:10.1029/2004JD005432, 2005.
Rio, C., Hourdin, F., and Chédin, A.: Numerical simulation of tro-pospheric injection of biomass burning products by pyro-thermalplumes, Atmos. Chem. Phys., 10, 3463–3478, doi:10.5194/acp-10-3463-2010, 2010.
Schultz, M., Backman, L., Balkanski, Y., Bjoerndalsaeter, S.,Brand, R., Burrows, J., Dalsoeren, S., de Vasconcelos, M., Grodt-mann, B., Hauglustaine, D., Heil, A., Hoelzemann, J., Isaksen,I., Kaurola, J., Knorr, W., Ladstaetter-Weienmayer, A., Mota, B.,Oom, D., Pacyna, J., Panasiuk, D., Pereira, J., Pulles, T., Pyle,J., Rast, S., Richter, A., Savage, N., Schnadt, C., Schulz, M.,Spessa, A., Staehelin, J., Sundet, J., Szopa, S., Thonicke, K., vanhet Bolscher, M., van Noije, T., van Velthoven, P., Vik, A., andWittrock, F.: REanalysis of the TROpospheric chemical com-position over the past 40 years (RETRO) – A long-term globalmodeling study of tropospheric chemistry, Report No. 48/2007,Reports on Earth System Science, Max Planck Institute for Me-teorology, Julich/Hamburg, Germany, 2007.
Streets, D. G., Yarber, K. F., Woo, J. H., and Carmichael, G.R.: Biomass burning in Asia: Annual and seasonal estimatesand atmospheric emissions, Global Biogeochem. Cy., 17, 1099,doi:10.1029/2003gb002040, 2003a.
Streets, D. G., Bond, T. C., Carmichael, G. R., Fernandes, S. D., Fu,Q., He, D., Klimont, Z., Nelson, S. M., Tsai, N. Y., Wang, M.Q., Woo, J.-H., and Yarber, K. F.: An inventory of gaseous andprimary aerosol emissions in Asia in the year 2000, J. Geophys.Res., 108, 8809, doi:10.1029/2002JD003093, 2003b.
Tosca, M. G., Randerson, J. T., Zender, C. S., Nelson, D. L., Diner,D. J., and Logan, J. A.: Dynamics of fire plumes and smokeclouds associated with peat and deforestation fires in Indone-sia, J. Geophys. Res., 116, D08207, doi:10.1029/2010JD015148,2011.
Turquety, S., Logan, J. A., Jacob, D. J., Hudman, R. C., Leung,F. Y., Heald, C. L., Yantosca, R. M., Wu, S. L., Emmons, L.K., Edwards, D. P., and Sachse, G. W.: Inventory of boreal fireemissions for North America in 2004: Importance of peat burn-ing and pyroconvective injection, J. Geophys. Res., 112, 1–13,doi:10.1029/2006JD007281, 2007.
Val Martin, M., Logan, J. A., Kahn, R. A., Leung, F.-Y., Nelson,D. L., and Diner, D. J.: Smoke injection heights from fires inNorth America: analysis of 5 years of satellite observations, At-mos. Chem. Phys., 10, 1491–1510, doi:10.5194/acp-10-1491-2010, 2010.
Val Martin, M., Kahn, R. A., Logan, J. A., Paugam, R., Wooster,M., and Ichoku, C.: Space-based observational constraints for 1-D fire smoke plume-rise models, J. Geophys. Res., 117, D22204,doi:10.1029/2012jd018370, 2012.
van der Werf, G. R., Randerson, J. T., Giglio, L., Collatz, G. J.,Kasibhatla, P. S., and Arellano Jr., A. F.: Interannual variabil-ity in global biomass burning emissions from 1997 to 2004, At-mos. Chem. Phys., 6, 3423–3441, doi:10.5194/acp-6-3423-2006,2006.
Wang, Y. H., Jacob, D. J., and Logan, J. A.: Global sim-ulation of tropospheric O-3-NOx-hydrocarbon chemistry 1.Model formulation, J. Geophys. Res., 103, 10713–10725,doi:10.1029/98JD00158, 1998.
Atmos. Chem. Phys., 14, 3977–3989, 2014 www.atmos-chem-phys.net/14/3977/2014/

Y. Jian and T.-M. Fu: Injection heights of springtime biomass burning plumes 3989
Wesely, M. L.: Parameterization of surface resistances to gaseousdry deposition in regional-scale numerical models, Atmos. Envi-ron., 23, 1293–1304, doi:10.1016/0004-6981(89)90153-4, 1989.
Wu, S, Mickley, L. J., Jacob, D. J., Logan, J. A., and Yantosca, R.M.: Why are there large differences between models in globalbudgets of tropospheric ozone?, J. Geophys. Res, 112, D05302,doi:10.1029/2006JD007801, 2007.
Yen, M.-C., Peng, C.-M., Chen, T.-C., Chen, C.-S., Lin, N.-H.,Tzeng, R.-Y., Lee, Y.-A., and Lin, C.-C.: Climate and weathercharacteristics in association with the active fires in north-ern Southeast Asia and spring air pollution in Taiwan during2010 7-SEAS/Dongsha Experiment, Atmos. Environ., 78, 35–50, doi:10.1016/j.atmosenv.2012.11.015, 2012.
Zender, C. S., Krolewski, A. G., Tosca, M. G., and Randerson,J. T.: Tropical biomass burning smoke plume size, shape, re-flectance, and age based on 2001–2009 MISR imagery of Bor-neo, Atmos. Chem. Phys., 12, 3437–3454, doi:10.5194/acp-12-3437-2012, 2012.
Zhang, L., Jacob, D. J., Boersma, K. F., Jaffe, D. A., Olson, J. R.,Bowman, K. W., Worden, J. R., Thompson, A. M., Avery, M.A., Cohen, R. C., Dibb, J. E., Flock, F. M., Fuelberg, H. E.,Huey, L. G., McMillan, W. W., Singh, H. B., and Weinheimer,A. J.: Transpacific transport of ozone pollution and the effect ofrecent Asian emission increases on air quality in North Amer-ica: an integrated analysis using satellite, aircraft, ozonesonde,and surface observations, Atmos. Chem. Phys., 8, 6117–6136,doi:10.5194/acp-8-6117-2008, 2008.
Zhang, Q., Streets, D. G., Carmichael, G. R., He, K. B., Huo, H.,Kannari, A., Klimont, Z., Park, I. S., Reddy, S., Fu, J. S., Chen,D., Duan, L., Lei, Y., Wang, L. T., and Yao, Z. L.: Asian emis-sions in 2006 for the NASA INTEX-B mission, Atmos. Chem.Phys., 9, 5131–5153, doi:10.5194/acp-9-5131-2009, 2009.
www.atmos-chem-phys.net/14/3977/2014/ Atmos. Chem. Phys., 14, 3977–3989, 2014