Embed Size (px)
Citation preview

Atmos. Chem. Phys., 10, 11323–11336, 2010www.atmos-chem-phys.net/10/11323/2010/doi:10.5194/acp-10-11323-2010© Author(s) 2010. CC Attribution 3.0 License.
AtmosphericChemistry
and Physics
Impact of biomass burning on ocean water quality in Southeast Asiathrough atmospheric deposition: field observations
P. Sundarambal1,2, R. Balasubramanian3,4, P. Tkalich1, and J. He3,4
1Tropical Marine Science Institute, National University of Singapore, 14 Kent Ridge Road, 119223, Singapore2Department of Chemical and Biomolecular Engineering, National University of Singapore, 117576, Singapore3Division of Environmental Science and Engineering, National University of Singapore, 117576, Singapore4Singapore Delft Water Alliance, National University of Singapore, Engineering Drive 1, 117576, Singapore
Received: 27 February 2010 – Published in Atmos. Chem. Phys. Discuss.: 25 March 2010Revised: 13 August 2010 – Accepted: 7 September 2010 – Published: 1 December 2010
Abstract. Atmospheric nutrients have recently gained con-siderable attention as a significant additional source of newnitrogen (N) and phosphorus (P) loading to the ocean. Theeffect of atmospheric macro nutrients on marine productiv-ity depends on the biological availability of both inorganicand organic N and P forms. During October 2006, the re-gional smoke haze episodes in Southeast Asia (SEA) thatresulted from uncontrolled forest and peat fires in Suma-tra and Borneo blanketed large parts of the region. In thiswork, we determined the chemical composition of nutrientsin aerosols and rainwater during hazy and non-hazy days toassess their impacts on aquatic ecosystem in SEA for the firsttime. We compared atmospheric dry and wet deposition ofN and P species in aerosol and rainwater in Singapore be-tween hazy and non-hazy days. Air mass back trajectoriesshowed that large-scale forest and peat fires in Sumatra andKalimantan were a significant source of atmospheric nutri-ents to aquatic environments in Singapore and SEA regionon hazy days. It was observed that the average concentra-tions of nutrients increased approximately by a factor of 3 to8 on hazy days when compared with non-hazy days. The es-timated mean dry and wet atmospheric fluxes (mg/m2/day) oftotal nitrogen (TN) were 12.72± 2.12 and 2.49± 1.29 duringnon-hazy days and 132.86± 38.39 and 29.43± 10.75 dur-ing hazy days; the uncertainty estimates are represented as1 standard deviation (1σ) here and throughout the text. Theestimated mean dry and wet deposition fluxes (mg/m2/day)of total phosphorous (TP) were 0.82± 0.23 and 0.13± 0.03
Correspondence to:R. Balasubramanian([email protected])
for non-hazy days and 7.89± 0.80 and 1.56± 0.65 for hazydays. The occurrences of higher concentrations of nutrientsfrom atmospheric deposition during smoke haze episodesmay have adverse consequences on receiving aquatic ecosys-tems with cascading impacts on water quality.
1 Introduction
Enrichment of nutrients in aquatic ecosystems can lead toundesirable effects including algal blooms and depletion ofoxygen in the water. Among sources of nutrients to aquaticecosystems, atmospheric deposition (“wet atmospheric de-position (WAD)” and “dry atmospheric deposition (DAD”,Fig. 1) is least understood despite its significance; the thesupplementary material provides more details. Atmosphericinputs of nutrients (nitrogen (N), phosphorus (P) species andiron) have been hypothesized to play an important role inthe chemical and biological dynamics of open oceans andaquatic ecosystems although delivered as a diffuse flux incontrast to localized river inputs (Menzel and Spaeth, 1962;Duce, 1986; Duce et al., 1991; Prospero et al., 1996; Spokeset al., 2000; Whitall et al., 2003). The role of atmosphericinputs as an annual source of nutrients to the euphotic zonehas recently been evaluated (Duce, 1986; Duce et al., 1991;Hasager, 2003; Duce et al., 2008). Increasing quantities ofatmospheric fixed N of anthropogenic origin, entering theopen ocean, could account for up to about a third of theocean’s external (non-recycled) N supply and up to 3% ofthe annual new marine biological production (Duce et al.,2008). Atmospheric inputs of bioavailable N and P reinforcethe unusual N:P ratios, and can lead to possible P limitation
Published by Copernicus Publications on behalf of the European Geosciences Union.

11324 P. Sundarambal et al.: Impact of biomass burning on ocean water quality
31
817
818
Land
Sea/ocean
Indirect deposition
Direct deposition
Dry particle deposition
Gases & particulate matter released from
natural and anthropogenic sources
Wet deposition
Air/water gas exchange
Air masses
Sea/ocean bed
Groundwater
Water surface
Biomass burning
Atmospheric transport
Land
Sea/ocean
Indirect deposition
Direct deposition
Dry particle deposition
Gases & particulate matter released from
natural and anthropogenic sources
Wet deposition
Air/water gas exchange
Air masses
Sea/ocean bed
Groundwater
Water surface
Biomass burning
Atmospheric transport
819 820
Fig. 1. A schematic illustration of atmospheric deposition processes 821 Fig. 1. A schematic illustration of atmospheric deposition pro-cesses.
as has been documented in the Mediterranean Sea (Herut etal., 1999; Thingstad et al., 1998; Krom et al., 1991). It shouldalso be noted that as human activities continue to prefer-entially increase N deposition (e.g. Galloway et al., 1994),ocean ecosystems may shift from N limitation to limitationby other nutrients (e.g. phosphorus) or trace elements.
Biomass burning is an important source of nutrientsand numerous trace elements, especially in Southeast Asia(SEA), where the smoke haze phenomenon is a major and re-curring problem (Balasubramanian et al., 1999, 2003; Zhonget al., 2001; Balasubramanian and Qian, 2004). To date,there has been no systematic study to estimate the atmo-spheric deposition of nutrients in SEA despite recurring for-est and peat fires in the region. Atmospheric fluxes of nutri-ents, derived from biomass burning, could contribute a sub-stantial fraction of dissolved N or P species to the euphoticzone, and enhance primary production, when nutrients arelimited, leading to eutrophication. Quantified atmosphericinputs of nutrients are therefore needed for development andvalidation of water quality models and for estimation of pol-lution loading budgets. N is usually considered as the limit-ing nutrient in the oceans, although PO3−
4 or even trace met-als may also play a role in regulating phytoplankton growth.Gin et al. (2006) reported that Singapore waters were gener-ally N limited. However, the variable anthropogenic inputsand a N:P ratio close to the Redfield ratio imply that nutri-ent limitation can easily switch to phosphorus. Water qualitymodels with the capability of simulating such scenarios interms of shifts in the N:P ratio can provide insights into theeffects of nutrient deposition on aquatic ecosystems.
The present study is focused on quantification of water sol-uble nutrients (N and P species only) resulting from DAD(aerosol particulates) and WAD (rainwater) in SEA for thefirst time. Quantification of iron and its impact on eutroph-ication is currently being studied and will be reported else-where. In this study, observational data were collected to
estimate DAD and WAD fluxes of N and P species duringhazy and non-hazy days to the coastal waters in Singapore.The atmospheric nutrients analyzed were: N species such asammonium (NH+4 ), nitrate (NO−
3 ), nitrite (NO−
2 ), total nitro-gen (TN) and organic nitrogen (ON), and P species such asphosphate (PO3−
4 ), total phosphorous (TP) and organic phos-phorous (OP). A selected number of DAD samples, 4 and 16for the hazy and non-hazy days, respectively, are presentedin this article. This work represents the first study of itskind focused on bringing together field-based investigationsto quantify atmospheric nutrient deposition (the present arti-cle) and eutrophication modeling (presented in a companionarticle, Sundarambal et al., 2010) to investigate the impact ofatmospheric nutrient deposition on coastal water quality andprovide a scientific basis for a more in-depth future study inthis region.
2 Materials and methods
2.1 Experimental
2.1.1 Sampling location
Singapore is a small island with total land area of 710 km2
located at latitudes between 1◦06′ N and 1◦24′ N and longi-tudes between 103◦24′ E and 104◦24′ E (Fig. 2). It is highlyurbanized and industrialized with small water resources andlimited ocean environment surrounding the island. Becauseof its geographical location, Singapore’s climate is charac-terized by uniform temperature and pressure, high humid-ity and abundant rainfall throughout the year. Singapore hastwo main seasons, the Northeast Monsoon (NEM) (Novem-ber to March) and the Southwest Monsoon (SWM) sea-son (June to September), separated by two relatively shorterinter-monsoon (IM) periods (April to May and October, re-spectively). The ambient air temperature ranges from 21.1to 35.1◦C, and the annual average rainfall is 2136 mm. Thepopulation of Singapore is 4.99 million (Singapore Depart-ment of Statistics, 2009). Southwest (SW) and Northeast(NE) winds occur in the coastal area periodically, with themean daily maximum wind speeds ranging from 5 m/s to10 m/s. Both aerosol and rainwater samples were collectedat the Tropical Marine Science Institute in St. John’s Is-land (SJI), Singapore (Fig. 2). This island is geographi-cally located at latitude of 1◦13′10′′ N and the longitude 103◦
50′54′′ E. There are no industrial air pollution sources closeto the sampling site. This sampling station in SJI was se-lected as it is near the open coastal area in the southern part ofSingapore and does not have local pollution sources. Excepton regional hazy days, the air is free from major air pollution.In this study, the DAD and WAD samples collected at the SJIstation during hazy and non-hazy days were analyzed.
Atmos. Chem. Phys., 10, 11323–11336, 2010 www.atmos-chem-phys.net/10/11323/2010/

P. Sundarambal et al.: Impact of biomass burning on ocean water quality 11325
32
822 823
824
NUSNUSNUS
Kalimantan
Sumatra
Malaysia
South China Sea
Singapore Strait
Johor Strait
SJIMS
Singapore
To Malacca Strait
To South China Sea
To Java Sea
Malaysia
Java Sea
65
4
3
1
2
825 826
Fig. 2. Map showing sampling locations in Singapore and surrounding regions. Note: 827 1. Johor Bahru, 2. Malacca Town, 3. Kuala Lumpur, 4. George Town, 5. Kuantan and 828 6. Kuching 829 830
Fig. 2. Map showing sampling locations in Singapore and surrounding regions. Note: 1. Johor Bahru, 2. Malacca Town, 3. Kuala Lumpur,4. George Town, 5. Kuantan and 6. Kuching.
2.1.2 Sample collections
The total suspended particulates (TSP) have been widelymeasured for the characterization of their elemental compo-sition and nutrients for estimation of dry deposition fluxes(Caruso et al., 1981; Herut et al., 1999; Duarte et al., 2006;Chen et al., 2007; Ayars and Gao, 2007). The TSP sampleswere collected using a High Volume Air Sampler (HVAS,model 3800 AFC: HI-Q Environmental Products Company,USA). The air flow in HVAS was maintained at 40 SCFM(Standard Cubic Feet per Minute) by an automatic air flowcontrol device. For collection of TSP samples, WhatmanQM-A Quartz air-sampling filters of 20.3×25.4 cm size wereused. All filters used in this study were inspected for defectsunder bright illumination. All blank filters and filter sampleswere handled with a pair of stainless steel forceps. The filterswere pre-equilibrated in a dry box with stabilized tempera-ture (22–25◦C) and relative humidity (30–35%) for at least24 h before the actual weighing. Filters were then weighedusing a MC5 microbalance (Sartorius AG, Goettingen, Ger-many) with a sensitivity of 0.0001 mg. The balance wasregularly checked with NIST-traceable standard calibratedweights. TSP samples were collected every 24 h three timesa week at the sampling location mainly during dry weatherconditions for the characterization of water soluble ions andnutrients. The filters were folded in half lengthwise so thatonly surfaces with collected particulate matter were in con-tact, when placed in the filter holder (glassine envelope). Thepre- and post-sampling weights were used to obtain the par-ticulate mass collected on the filters. The TSP filters werestored in a refrigerator at 4◦C until extraction for sampleanalysis. Although storage of filter samples at−20◦C isoptimum for long term preservation, it was observed that4◦C is still sufficient for short term storage of nutrient sam-ples (Karthikeyan and Balasubramanian, 2006; Karthikeyanet al., 2009a, b). The mass concentration of TSP (µg/m3)
was calculated from the collected mass of particulates (µg)divided by the volume of air passed through the filter (m3)
during sampling period.
Whenever there were rain events, the rainwater sampleswere collected by using an automated wet only rainwatersampler (Ecotech Model 200: Ecotech Pty Ltd, Australia)at the sampling location. The frequency of rain eventsthat occurred during the biomass burning period was rela-tively less than that during the wet season. Rainwater sam-ples were transferred from the sampler to pre-cleaned high-density polyethylene (HDPE) bottles after the rain eventand immediately filtered using 0.45 µm nylon membrane fil-ters and refrigerated at 4◦C for sample analysis. For pre-cleaning, HPDE bottles (250 mL, Nalgene®) were filled with2N HNO3 for 3 days and subsequently with ultrapure waterfor 3 days. Finally, they were rinsed with ultrapure waterthree times and kept safely in plastic bags until use. Noresidual NO−3 was found in the rinse water after washing(Karthikeyan et al., 2009a, b). Rainfall with less than 1 mmwas not considered for laboratory analysis because suchevents yielded low or negligible nutrient loads even thoughthe nutrient concentration was high (Bartoli et al., 2005).The following QA/QC procedures were used for both lab andfield methods. Total sampling times, average actual volumet-ric flow rates, tare and gross-filter weights were checked foraccuracy. Field blanks, obtained at regular intervals by plac-ing filters in the filter holder with no air being drawn throughthem, were used to detect any contamination that may haveoccurred in the sample transport process. Likewise, labora-tory blanks (unexposed filters) were also weighed and pro-cessed for quality assurance purposes. Both particulate andrainwater samples were collected using established methodsas frequently as possible to study the impact of biomassburning on surface water quality through atmospheric de-position. Daily rainfall amounts and other meteorologicalparameters were obtained during the sampling period fromSeptember 2006 through January 2007 using an automatedweather station maintained by the Department of Geographyat the National University of Singapore (NUS). The precipi-tation amounts at the two sampling locations (NUS and SJI)were similar during major storm events as observed from ourprevious studies. Altogether, 55 aerosol particulate samples
www.atmos-chem-phys.net/10/11323/2010/ Atmos. Chem. Phys., 10, 11323–11336, 2010

11326 P. Sundarambal et al.: Impact of biomass burning on ocean water quality
and 21 rainwater samples (collected on event-to-event basis)were collected during the sampling period, and the resultsobtained from this field study are presented in this paper.
2.1.3 Reagents and standards
For preparation of reagents and standards, ultrapure wa-ter (MilliQ® Gradient A 10 System, Millipore, USA) wasused. All reagents were of analytical grade. Anionic stan-dards of chloride (Cl−), NO−
2 , NO−
3 , and sulfate (SO2−
4 ) andNH+
4 were procured from AccuStandard, USA. Sodium hy-droxide (NaOH), potassium persulfate (K2S2O8), ethylene-diaminetetraacetic acid (EDTA) (C10H16N2O8), glycine(C2H5NO2), and urea (CH4N2O) were obtained from Merck,Germany.
SRM 1648 (Urban Particulate Matter), obtained fromNational Institute of Standards and Technology (NIST,Gaithersburg, MD, USA), was used for validation of themethods for both N and P species analysis. This standardconsists of natural atmospheric particulate matter collectedat an urban location, and is certified for its major, minor, andtraces inorganic constituents.
For ON, N standards were prepared from ETDA, urea,and glycine by dissolving appropriate amounts in ultrapurewater in order to have a stock solution of 1000 mg N/L.EDTA-based standard N solution was used for optimizationof microwave-assisted persulfate oxidation (Karthikeyan etal., 2009a). The other two reagents were used to check therobustness of the optimized procedure.
2.1.4 Sample processing and analysis
The aerosol particulate and rainwater samples were analyzedto characterize atmospheric wet and dry nutrient depositionas per the protocol developed in our laboratory (Sundaram-bal et al., 2006, 2009). The atmospheric nutrients analyzed inthis study were: N species- NH+4 , NO−
3 , NO−
2 , TN and ON,and P species- PO3−
4 , TP and OP. A portion of filter samples(1/4 or 1/8th portion of total filter area) was extracted with20 or 50 ml Milli-Q water (Millipore) in an ultrasonic bath at60◦C for l h. The filter extracts from the ultrasonic bath werecooled to ambient temperature (room temperature 25◦C).The solution was then filtered through a 0.45 µm polyte-trafluoroethylene (PTFE) membrane syringe filter. Rainwa-ter samples were taken after filtration for laboratory anal-ysis. The rainwater and aerosol particulate samples wereanalyzed for the ionic species by ion chromatography (IC)(Model ICS-2000; Dionex Corporation) using a cation col-umn and an anion column. TN and TP were analyzed ac-cording to our standard laboratory procedure (Karthikeyanet al., 2005a, b; Sundarambal et al., 2006; Karthikeyan andBalasubramanian, 2006; Karthikeyan et al., 2007, 2009a, b).Field and laboratory filter blanks were analyzed for the nutri-ents (N and P) species, and the values obtained for the blankswere subtracted from those of the filter samples. Both the
quality assurance and quality control protocols were carriedout regularly to avoid analytical errors in the laboratory mea-surements. The analytical quality of the data obtained wasdetermined using important parameters such as limits of de-tection, recovery, linearity, and by eliminating sampling arti-facts (Karthikeyan and Balasubramanian, 2006; Karthikeyanet al., 2009a, b).
2.2 Deposition flux calculations
2.2.1 Dry deposition
DAD is a slow, but continuous flux of airborne contaminantsto an underlying surface. DAD fluxes (Fdry in mg/m2/day)were calculated from the product of dry deposition velocity(Vd in cm/s) and measured concentrations of nutrient species(Caerosolin µg/m3), as shown in Eq. (1) with unit conversionfactor of 0.864.
Fdry = 0.864CaerosolVd (1)
Deposition velocity,Vd, may be viewed as the velocity atwhich pollutant gases and aerosols existing at a given atmo-spheric concentration are deposited to the Earth’s surface.Processes that controlVd include gravitational settling, im-paction, and diffusion. These processes act simultaneouslyand are affected by many variables including particle size,wind speed, relative humidity, and sea surface roughness.The termVd is the result of many processes (for a full ex-planation see, e.g. Seinfeld and Pandis, 2006), and it is thusvery difficult to determine. However, the calculation ofFdryis usually carried out usingVd reported in the literature formany elements including nutrients (see e.g. Sehmel, 1980;Slinn and Slinn, 1980; William, 1982; Joffre, 1988; Dulacet al., 1989; Migon et al., 1991, 2001; Duce et al., 1991;Prospero et al. 1996; Nielsen et al., 1996; Zhuang et al.,1999; Spokes et al., 2000; Wesley and Hicks, 2000; Qi et al.,2005; Seinfeld and Pandis, 2006; Zhang et al., 2007). DADfluxes were calculated using species-specificVd since the nu-trients are known to be associated with different particle frac-tions. The calculation ofVd is based on a simple parameter-ization of experimental meteorological measurements to de-termine atmospheric transport characteristics (Slinn, 1982;Zhang et al., 2001). The magnitudes ofVd estimated were1.2 and 0.6 cm/s for NO−3 and NH+
4 , respectively and 2 cm/sfor PO3−
4 , 1.2 cm/s for TN and ON and 2 cm/s for TP andOP, which are consistent with results reported in the litera-ture (Duce et al., 1991; Prospero et al., 1996; Spokes et al.,2000; Herut et al., 2002, Poor et al., 2006). These estimatedVd could result in an uncertainty of a factor of 2–3 in thecalculated fluxes (Duce et al., 1991).
AerosolVd varies with particle size from gravitational set-tling of large particles to impaction and diffusion of smallparticles (sub-micrometer), and is dependent on climatolog-ical and physical conditions in the troposphere. The mostimportant parameters required for estimatingVd through
Atmos. Chem. Phys., 10, 11323–11336, 2010 www.atmos-chem-phys.net/10/11323/2010/

P. Sundarambal et al.: Impact of biomass burning on ocean water quality 11327
empirical calculations are standard deviation of wind speed(σθ ), molecular diffusion, particle density and particle size.Vd at a particular vertical height was calculated as the inverseof the sum of a number of resistances (Seinfeld and Pandis,2006) using the following equation:
Vd =1
Ra+ Rb+RaRbvs+vs (2)
where vs is the gravitational settling velocity (which is afunction of particle size, density, and viscosity) (Seinfeld andPandis, 2006),Ra is aerodynamic resistance refers to turbu-lent transport from the free atmosphere down to the recep-tor surface (Ra=9/[uσ 2
θ ], which is a function of wind speed,u and standard deviation of wind speed,σθ , Yamartino,1984; Turner, 1986) andRb is quasi-laminar layer resistance(which is a function of particle size, Brownian diffusion, in-terception and impaction;Rb on water surface is given by vanden Berg et al., 2000). BothRa andRb are site-specific andare determined to a large extent by atmospheric properties.The formula used forVd calculation is given in supplemen-tary material (Appendix A). Meteorological parameters suchas ambient temperature (K) of 300.8± 0.6 and 299.7± 0.7,wind speed (m/s) of 1.3± 0.49 and 1.0± 0.32, and standarddeviation of wind directionσθ (rad) of 0.773 and 0.513 wereobserved at the sampling location during October 2006 andNovember 2006, respectively. In SEA atmospheric environ-ment, a majority of aerosols observed in the size range of0.1–20 µm by the optical counter (Clark and Kremer, 2005)was in the fine mode (<1 µm). Dominance by fine particlesis typical for biomass burning plumes as was observed, forexample, in Brazil (Reid and Hobbs, 1998). Both the massand number concentrations were elevated across the entiresize range on hazy days, and the increase in coarse and fineparticles could be explained by increased emissions of fineparticles during biomass burning through direct or indirect(gas-to-particle conversion) means and the agglomeration ofthese particles during the long- range transport (See et al.,2006). Based on the size-distributed chemical compositiondata obtained in Singapore (See et al., 2006 and unpublisheddata), the coarse (PM2.5−30) particles for NO−3 and PO3−
4 andfine particles (PM0−2.5) in the case of NH+4 ions were con-sidered in this study. This assumption is also in agreementwith other reports in the literature (Wall et al., 1988; Zhuanget al, 1999; Migon et al., 2001; Herut et al., 2002; Reid et al.,2005; Yang et al, 2005; Seinfeld and Pandis, 2006).
2.2.2 Wet deposition
WAD involves the removal of atmospheric substances withinclouds and below the cloud base mainly by precipitation(Pryor and Barthelmie, 2000). Wet deposition fluxes (Fwetin mg/m2/day) were calculated from the product of the pre-cipitation rate (P in m/day) and measured concentrations of
nutrient species (Crain in mg/l) by the following Eq. (3) withunit conversion factor of 1000:
Fwet= 1000CrainP (3)
Precipitation rate represents the velocity with which pollu-tants incorporated into precipitation and existing at a givenliquid concentrations are deposited. Despite low frequencyof rainfall during the 2006 haze episodes, precipitation sam-ples were still collected and analyzed. The cumulative to-tal of rain events during the time interval may be expressedas the sum of all events. The cumulative total precipita-tion of 48 mm, 250.8 mm and 495.2 mm was measured dur-ing October, November and December 2006, respectively.In this study, the total precipitation by summing the above-mentioned three cumulative total precipitation amounts wasused for the wet atmospheric flux calculation. Annual precip-itation during the year 2006 was 2294.6 mm. The depositionfluxes may show short term variations, rendering the quan-tification of the annual atmospheric input of nutrients intothe sea very difficult.
3 Results and discussion
3.1 Smoke haze episode
The smoke haze episodes that took place in Singaporeduring October 2006 were due to the occurrence of hundredsof bush, forest and peat fires across Sumatra and Borneo(National Environment Agency (NEA), Singapore). Theprevailing southerly to southwesterly winds transportedthe smoke haze directly from southern Sumatra towardsthe Malacca Straits, peninsular Malaysia and Singapore;the smoke haze was also influenced by the prevailingsoutheasterly winds from Kalimantan to Singapore. The PSI(Pollutant Standards Index) measured by NEA, Singaporeand the API (Air Pollution Index) by DOE (Departmentof Environment), Malaysia are indicators of the prevail-ing air quality in Singapore and Malaysia, respectively.The air quality categories based on PSI or API and thegeneral health effects associated with different categoriesof air quality are summarized as follows: PSI or APIup to 50:Good; 51–100:Moderate; 101–200:Unhealthy;201–300:Very Unhealthy;>300:Hazardous. These indicesare representative of the levels of particulate air pollutionat the respective sites during biomass burning periods. Airquality measurements made by NEA, Singapore at the north,south, east, west and central regions of Singapore formedthe basis for the PSI calculation. The TSP measured in thisstudy, PSI (NEA, Singapore) and API (2006 API data fromhttp://en.wikipedia.org/wiki/2006SoutheastAsian haze)(Fig. 3a) show the pattern of particulate air pollution inSingapore and Malaysia at George Town (5◦25′00′′ N100◦19′00′′ E), Johor Bahru (1◦29′00′′ N 103◦44′00′′ E),Kuala Lumpur (3◦8′00′′ N 101◦42′00′′ E), Kuantan
www.atmos-chem-phys.net/10/11323/2010/ Atmos. Chem. Phys., 10, 11323–11336, 2010

11328 P. Sundarambal et al.: Impact of biomass burning on ocean water quality
33
0
40
80
120
160
200
4-O
ct-2
006
6-O
ct-2
006
8-O
ct-2
006
10-O
ct-2
006
12-O
ct-2
006
14-O
ct-2
006
16-O
ct-2
006
18-O
ct-2
006
20-O
ct-2
006
22-O
ct-2
006
24-O
ct-2
006
26-O
ct-2
006
28-O
ct-2
006
30-O
ct-2
006
1-N
ov-2
006
3-N
ov-2
006
5-N
ov-2
006
7-N
ov-2
006
9-N
ov-2
006
11-N
ov-2
006
13-N
ov-2
006
Date
TSP
(µg/
m3 ) /
API
/ PS
I
TSP (µg/cu.m) PSI-Singapore API-Kuala LumpurAPI-Johor Bahru API-Kuching API-KuantanAPI-George Town API-Malacca Town PSI=50 831
(a)
34
3-hour PSI during 7 October 2006
0
20
40
60
80
100
120
140
160
7 8 9 10 11 12 1 2 3 4 5 6 7 8 9 10 11 12
Hours of a day (am to pm)
PSI
832 833
(b)
35
834 835
Fig. 3. (a) 3-hr PSI on 7 October 2006; (b) Total Suspended Particulates (TSP), Pollutant Standards Index (PSI) (Data from NEA, Singapore) 836 and Air pollution index (API) (Data from DOE, Malaysia) from October 2006 to November 2006; (c) Percentage of normal rainfall distribution 837 in SEA during September 2006 (NEA, Singapore). Note: PSI or API < 50 (Good); 51-100 (Moderate); 101-200 (Unhealthy); 201-300 (Very 838 Unhealthy); > 300 (Hazardous). 839
840
(c)
Fig. 3. (a)3-h PSI on 7 October 2006;(b) Total Suspended Particu-lates (TSP), Pollutant Standards Index (PSI) (Data from NEA, Sin-gapore) and Air pollution index (API) (Data from DOE, Malaysia)from October 2006 to November 2006;(c) percentage of normalrainfall distribution in SEA during September 2006 (NEA, Singa-pore). Note: PSI or API<50 (Good); 51–100 (Moderate); 101–200(Unhealthy); 201–300 (Very Unhealthy);>300 (Hazardous).
(3◦49′00′′ N 103◦20′00′′ E), Kuching (1◦33′00′′ N110◦25′00′′ E), and Malacca Town (2◦11′20′′ N102◦23′4′′ E). Figure 3a–b shows moderate and unhealthy airquality during regional smoke haze events in SEA in October2006. Kuching, the capital of the East Malaysian state ofSarawak, is the largest city near Kalimantan (Borneo) where
extensive forest fires took place. These islands are situatedaround Singapore from southeast (SE) to southwest (SW).
The areas of forest fires ranged from several hundred kilo-meters to about 2000 km from Singapore. A higher levelof TSP was measured in Singapore during the 2006 smokehaze event (maximum TSP∼140 µg/m3) as compared tothat measured during the 1997–1998 haze events (maximumTSP∼110 µg/m3) (Balasubramanian et al., 1999) caused byprolonged forest fires in the nearby provinces of Indonesia.The highest 3-h PSI (150) recorded in Singapore during thishaze episode occurred on 7 October 2006 (Fig. 3b); the PSIwas calculated based on PM10 (diameter≤10 µm) concentra-tions (NEA, Singapore). Figure 3a shows that the day-to-day particle concentrations varied substantially in responseto spatial and temporal changes of meteorological factors,such as rainfall distribution (Fig. 3c) and wind conditions(Fig. 4a), and of fire activity and intensity (hotspots in Fig. 4).The TSP values measured in Singapore followed a trendwhich was similar to those in the PSI and API data. Theparticle concentration exhibited a distinct rise and high fluc-tuation during October. After mid-November, it decreasedand remained at the background level.
The extreme smoke haze episodes that occurred on 7,15, 17 and 20 October 2006 were selected for DAD es-timation during hazy days and the 16 samples collectedfrom 13 November 2006 to 4 January 2007 were selectedfor non-hazy days. The range of TSP was 99–138 µg/m3
and 18–31 µg/m3, respectively, during hazy and non-hazydays; the range of PSI was 92–119 and 25–47 during hazyand non-hazy days, respectively. The arithmetic means ofTSP and PSI during hazy days were 113± 17 µg/m3 and102± 12, respectively while those during non-hazy dayswere 24± 5 µg/m3 and 35± 7, respectively. The air qual-ity reached the unhealthy range (PSI>100) on 3 days withthe highest value being 128 (24 h average PSI) on 7 October2006.
To investigate the possible sources of particulate air pollu-tion and to assess the recent history and transport pathways ofair masses before reaching the monitoring station in SJI, airmass back trajectories were constructed at 3 different heights40, 100 and 500 m for a 5-day period using NOAA/ARL Hy-brid Single-Particle Lagrangian Integrated Trajectory model(HYSPLIT; Draxler and Rholph, 2003). The 2006 smokehaze event, caused by prolonged, uncontrolled burning from“slash and burn” cultivation in Indonesia, affected severalcountries in the SEA region and beyond (see Fig. 4a–d), andas far as Saipan (Source:www.saipantribune.comon 5 Oc-tober 2006). The fires originated mostly in Kalimantan, theIndonesian part of Borneo, and in Sumatra. The 5-day back-ward trajectories of air masses arriving at the SJI samplingstation on three representative days 7, 17 and 20 October2006 (SWM) and the representative smoke haze extent mapin SEA are shown in Fig. 4a–d, respectively. The PSI duringthese three sampling days was 128, 92 and 102, respectively.During periods of active and intense biomass burning in
Atmos. Chem. Phys., 10, 11323–11336, 2010 www.atmos-chem-phys.net/10/11323/2010/

P. Sundarambal et al.: Impact of biomass burning on ocean water quality 11329
36
841
(a)
Surface winds Hotspots Slight smoke Moderate smokeThick smoke
Smoke haze map 7 Oct 2006, 04:00pm
South China Sea
Malaysia
Sumatra Borneo
Kalimantan
Java Sea
Indian Ocean
Singapore
Australia
Malaysia
Thailand
37
842
(b) Smoke haze map 17 Oct 06, 04:00pm
Hotspots Thick smoke Moderate smoke
South China Sea
Kalimantan
Indian Ocean
Java Sea
Sumatra
Malaysia
Singapore
38
843
(c)
Borneo Kalimantan
Sumatra
Malaysia
Singapore
South China Sea
Java Sea Hotspots Thick smoke Moderate smoke
Smoke haze map 19 Oct 06, 04:00pm
39
844 845
Fig. 4. Back trajectories of air masses for starting altitude of 500 m, 100 m, and 40 m above ground level (AGL) calculated from NOAA HY-846 SPLIT model for the sampling site in SJI and the extent of the smoke haze in SEA due to forest fires in Indonesia (courtesy: NEA, Singapore) (a) 847 7 October 2006; (b) 17 October 2006; (c) 20 October 2006 and (d) the representative regional smoke haze map (NEA, Singapore). 848
849
(d)
Fig. 4. Back trajectories of air masses for starting altitude of 500 m, 100 m, and 40 m above ground level (a.g.l.) calculated from NOAA HY-SPLIT model for the sampling site in SJI and the extent of the smoke haze in SEA due to forest fires in Indonesia (courtesy: NEA, Singapore)(a) 7 October 2006;(b) 17 October 2006;(c) 20 October 2006 and(d) the representative regional smoke haze map (NEA, Singapore).
Sumatra and Borneo, spells of moderate to dense smoke hazecould be expected in the vicinity of the larger fire/hotspotclusters in the affected areas (see Fig. 4). The HYSPLITmodel calculation results showed that the air mass was trans-ported from different source areas to Singapore across theIndian Ocean at lower altitudes.
During the first haze event (Fig. 4a), one air mass back tra-jectory traveled from Australia at a high altitude of 2000 mwhile other two air mass back trajectories travelled fromthe Indian Ocean at a low attitude (<500 m) through Suma-tra, Java Sea and other areas impacted by forest and peat
fires. The PM concentration at SJI was largely dependent onthe direction of the prevailing winds (with southeasterly tosouthwesterly winds favoring the transport of haze towardsSingapore), the fire activity (its location and intensity) andEl Nino/Southern Oscillation (ENSO) (its effect on rainfall,atmospheric stability and convective activity). The mon-soon transition shifted the wind pattern towards PeninsularMalaysia. It created convergence zones near Singapore andinduced subsidence in the area as well (Koe et al., 2001). Thelocal effects of land and sea breezes also contributed to theenhancement of PM concentration in Singapore, particularly
www.atmos-chem-phys.net/10/11323/2010/ Atmos. Chem. Phys., 10, 11323–11336, 2010

11330 P. Sundarambal et al.: Impact of biomass burning on ocean water quality
during the transition period (Koe et al., 2001). During theother two haze events (Fig. 4b–c), the air masses mostlyoriginated from Kalimantan and the surrounding areas. Thebiomass burning-impacted air masses contained elevated lev-els of airborne particulate matter compared to those origi-nated from other sources of air pollution (Koe et al., 2001;Abas et al., 2004; See et al., 2006).
3.2 Atmospheric nutrient deposition
3.2.1 Dry deposition
The concentration of soluble inorganic and organic nutrients(N and P species) obtained from TSP samples on selecteddays with hazy (October 2006) and non-hazy (November2006–January 2007) conditions in Singapore are shown inFig. 5a. It is clearly seen that there is similarity in the pat-terns of N and P species and the occurrences of very highconcentrations of nutrients during hazy days when comparedto non-hazy days. Higher fluctuations in concentration ofN and P species were observed during hazy days than thoseduring non-hazy days with the exception of NH+
4 and PO3−
4 .The dry deposition of NO−2 +NO−
3 was generally greater thanthat of NH+
4 . However, NH+4 deposited onto water bodies issusceptible to be oxidized to NO−3 under favorable weatherconditions. ON deposition was generally greater than that ofinorganic N (NH+
4 + NO−
3 + NO−
2 ) deposition. OP deposi-tion was generally much greater than that of PO3−
4 duringhazy days. As the tropical biomass burning is an impor-tant source of atmospheric N and P (Crutzen and Andreae,1990; Mahowald et al., 2005), the increased deposition of Nand P species is conceivable. The high proportion of OP ob-served in this study is consistent with the findings reported inthe literature that OP could account for about 30–80% of TPconcentration (Markaki et al., 2003; Mahowald et al., 2008;Vicars et al., 2010).
DAD fluxes of N and P species were calculated from thefield observations of DAD nutrients concentration (Fig. 5a)using the Eq. (1) in Sect. 2.3.1. Figure 5b shows the DADfluxes of N and P species during hazy and non-hazy days.The DAD flux was much higher for TN and TP during hazydays as compared to non-hazy days. The flux decreased inthe following order: ON>NO−
2 +NO−
3 >NH+
4 for N speciesand OP>PO3−
4 for P species during both hazy and non-hazydays. For both N and P species, mean total deposition rateswere several times greater than the deposition rates of in-organic species, indicating that much of the dry depositionwas in soluble organic form. It is known that dissolved ON(DON) is the most abundant organic N form and is poten-tially mineralized in ecosystems. Also, DON such as ureaand amino acids can be directly taken up by some plants(Cornell et al., 2003). Consequently, the DON depositionrate must be one of the important factors controlling the N inecosystems.
3.2.2 Wet deposition
The concentrations of nutrients (N and P species) in rain-water during hazy and non-hazy days are shown in Fig. 6a.Rainwater samples (3 rain events) were selected based onthe PSI from 15 to 21 October 2006 for hazy days. 3 rainevents were selected from 11 November 2006 to 23 De-cember 2006 for non-hazy days. The range of PSI dur-ing hazy and non-hazy days was 81–93 and 35–39, re-spectively. The range of wet deposition concentrations ofN species during hazy days was in the order of 11.76–20.36 mg/l for TN, 3.21–10.50 mg/l for ON, 7.78–9.48 mg/lfor NO−
3 + NO−
2 , and 0.77–1.19 mg/l for NH+4 . On theother hand, the range of WAD concentrations of N speciesduring non-hazy days was in the order of 2.38–4.79 mg/lfor TN, 1.30–2.52 mg/l for ON, 1.03–2.24 mg/l for NO−
3 +NO−
2 , and 0.03–0.39 mg/l for NH+4 . On an event basis,the concentration of macro-nutrients in rainwater was highlyvariable. The mean concentrations of P species from wetdeposition were 0.91± 0.09 mg/l for TP, 0.65± 0.29 mg/lfor OP and 0.26± 0.20 mg/l for PO3−
4 for hazy daysand 0.18± 0.08 mg/l for TP, 0.15± 0.09 mg/l for OP and0.03± 0.01 mg/l for PO3−
4 for non-hazy days. The reportedconcentrations of NH+4 and NO−
3 in rainwater were 0.31 mg/land 1.04 mg/l during 1997 to 1998 in Singapore (Balasub-ramanian et al., 2001), and 0.25 mg/l and 1.23 mg/l, respec-tively during 1996 to 1997 in Malaysia (Ayers et al., 2002). Asporadic increase in the concentration levels of nutrients suchas NH+
4 , NO−
3 and PO3−
4 resulting from biomass burning hasbeen reported by Lobert et al., 1990; Crutzen and Andreae,1990; Mayewski et al., 1993, 1997; Kondo et al., 2004; Ma-howald et al., 2005, 2008. The contribution of WAD of nutri-ents followed the order TN>NO−
2 +NO−
3 >ON>NH+
4 for Nspecies and TP>OP>PO3−
4 for P species. The mean concen-trations of atmospheric aerosol and rainwater were compara-ble to the fluxes from land-based sources such as wastew-ater treatment plants (TN=2.13 mg/l and TP=0.17 mg/l)and rivers (NH+4 =0.16 mg/l, NO−
2 +NO−
3 =0.34 mg/l andPO3−
4 =0.14 mg/l) (DHI, 2004) in the Singapore coastal wa-ters.
The magnitude of wet deposition fluxes depends onprecipitation rate. In this study, the precipitation of 794 mm,a cumulative rainfall amount of rain events during thestudy period of October 2006 to December 2006, wasused for estimation of the wet deposition flux. Figure 6bshows the wet atmospheric deposition fluxes of N and Pspecies during hazy and non-hazy days in Singapore. Theestimated mean wet deposition fluxes of water solubleNO−
2 +NO−
3 N and PO3−
4 into the Singapore coastal waterswere 75.57± 7.31 mg/m2/day and 2.25± 1.75 mg/m2/dayduring hazy days, and 13.33± 5.39 mg/m2/day and0.29± 0.09 mg/m2/day during non-hazy days, respectively.The estimated mean wet deposition fluxes (mg/m2/day) ofNH+
4 were 8.11± 1.94 and 1.33± 1.79 during hazy and
Atmos. Chem. Phys., 10, 11323–11336, 2010 www.atmos-chem-phys.net/10/11323/2010/

P. Sundarambal et al.: Impact of biomass burning on ocean water quality 11331
40
850
851
OPTPPhosphate
0.090.080.070.060.050.040.030.020.010.00
Con
cent
ratio
n (µ
g/cu
.m)
0.02
0.07
0.05
non-hazy days
PO43- TP OP
Nut
rien
t con
cent
ratio
n (μ
g/m
3 )
ONNitrite+NitrateTNAmmonium
9876543210C
once
ntra
tion
(µg/
cu.m
)
0.28
2.40
0.80
1.49
non-hazy days
NH4+ TN NO2
- + NO3- ON
Nut
rien
t con
cent
ratio
n (μ
g/m
3 )
OPTPPhosphate
0.8
0.7
0.6
0.5
0.4
0.3
0.2
0.1
0.0
Con
cent
ratio
n (µ
g/cu
.m)
0.09
0.48
0.38
hazy days
PO43- TP OP
Nut
rien
t con
cent
ratio
n (μ
g/m
3 )
ONNitrite+NitrateTNAmmonium
16
14
12
10
8
6
4
2
0
Con
cent
ratio
n (µ
g/cu
.m)
1.92
12.61
4.25
6.44
hazy days
NH4+ TN NO2
- + NO3- ON
Nut
rien
t con
cent
ratio
n (μ
g/m
3 )
(a)
41
852 Fig. 5. (a) Box plot showing mean concentration of nutrients (N and P species) (µg/m3) in aerosol samples on selected days with hazy (October 853 2006) and non-hazy (November 2006 – January 2007) conditions (crossed circle shows mean); (b) Fluxes of nutrients (N and P species) in DAD 854 during hazy and non-hazy days. Note: In Figure 5a, the bottom and the top edges of each box are located at the sample 25 and 75 percentiles, the 855 height of each box shows the interquartile range for each species which is an indicator of the variability of the values; the central horizontal line 856 is drawn at the sample median. 857
0
0.2
0.4
0.6
0.8
1
1.2
1.4
1.6
TP hate
OP
DAD
P Fl
ux (m
g/m
2 /day
) Hazy Non-hazy
TP PO43- OP
0
2
4
6
8
10
12
14
16
TN
um ate
ON
DA
D N
Flu
x (m
g/m
2 /day
) Hazy Non-hazy
TN NH4+ NO2
- + NO3- ON
(b)
Fig. 5. (a) Box plot showing mean concentration of nutrients (N and P species) (µg/m3) in aerosol samples on selected days with hazy(October 2006) and non-hazy (November 2006–January 2007) conditions (crossed circle shows mean);(b) fluxes of nutrients (N and Pspecies) in DAD during hazy and non-hazy days. Note: in (a), the bottom and the top edges of each box are located at the sample 25 and75 percentiles, the height of each box shows the interquartile range for each species which is an indicator of the variability of the values; thecentral horizontal line is drawn at the sample median.
non-hazy days, respectively. Nominal annual average wetdeposition fluxes (g/m2/year) of NH+
4 and NO−
3 reported inSEA were 0.718 and 3.607 in Malaysia during 1993–1998(Ayers et al., 1999, 2002), 1.383 and 1.74 in Indonesia dur-ing 1992 and 1996 (Gillett et al., 2000) and 0.079 and 0.308in Australia (Ayers and Yeung, 1996). The estimated meanwet deposition fluxes of TN and TP were higher during hazydays by a factor of 4 as compared to those during non-hazydays. Inorganic N species accounted for a higher proportionof TN. In contrast, OP made a higher contribution to TP thanIP. The estimated atmospheric N fluxes during non-hazydays in this study are comparable to those reported earlierfor Singapore (Karthikeyan et al., 2009a). The WAD fluxes(about 3 times) were higher when annual precipitation rate(2136 mm) was used for flux estimation instead of 794 mmas obtained during the study period. This ultimate WAD fluxmight be applied as a constant uniform load deposited fromthe atmosphere over the coastal water in these region for a
eutrophication modelling study to understand their impacton water quality (Sundarambal et al., 2010).
Baeyens et al. (1990) described a method which allowsestimation of the annual wet deposition flux of dissolvedions without measuring all rain events. When one rain eventwas sampled in several steps (sequential sampling), a nice,smooth dilution profile was obtained (Xianren and Baeyens,1990) and the concentration decreased gradually with thevolume of rainfall. Moy et al. (1994) found that slow aircirculation coincided with a high concentration of pollutantgases in the atmosphere. If substantial precipitation occurredthen, more removal of pollutants from the atmosphere wouldoccur, as evidenced by their high concentrations in the rainwater measurement. As reported by Migon et al. (1991),the number of rain events has a greater influence on fluxthan the intensity of the rain. It was observed in our studythat, after long dry periods (typically several days), nutrientconcentrations in rainwater were systematically higher than
www.atmos-chem-phys.net/10/11323/2010/ Atmos. Chem. Phys., 10, 11323–11336, 2010

11332 P. Sundarambal et al.: Impact of biomass burning on ocean water quality
42
858
859
0
0.005
0.01
0.015
0.02
0.025
0.03
0
0.3
0.6
0.9
1.2
1.5
1.8
2.1
TP ate
OP
Nut
rien
t con
cent
ratio
n in
seaw
ater
(m
g/l)
Nut
rien
t con
cent
ratio
n in
rai
nwat
er
(mg/
l)
Rainwater: Hazy
Rainwater: Non-Hazy
Seawater
TP PO43- OP
0
0.02
0.04
0.06
0.08
0.1
0.12
0
3
6
9
12
15
18
21
TN um rate
ON N
utri
ent c
once
ntra
tion
in se
awat
er
(mg/
l)
Nut
rien
t con
cent
ratio
n in
rai
nwat
er
(mg/
l)
Rainwater: Hazy
Rainwater: Non-Hazy
Seawater
TN NH4+ NO2
- + NO3- ON
(a)
43
860 861 Fig. 6. (a) Concentration of nutrients (N and P species) in rainwater during hazy and non-hazy days and seawater; (b) Fluxes of nutrients (N and 862 P species) in WAD during hazy and non-hazy days. 863
864
02468
1012141618
TP ate
OP
WAD
P F
lux (
mg/
m2 /d
ay) Hazy Non-hazy
TP PO43- OP
020406080
100120140160180
TN um ate
ON
WA
D N
Flu
x (m
g/m
2 /day
) Hazy Non-hazy
TN NH4+ NO2
- + NO3- ON
(b)
Fig. 6. (a)Concentration of nutrients (N and P species) in rainwater during hazy and non-hazy days and seawater;(b) fluxes of nutrients (Nand P species) in WAD during hazy and non-hazy days.
monthly mean concentrations, regardless the intensity of therain event.
Concentrations of most ions in rainwater were higher dur-ing periods of intense biomass fires and the resultant hazethan during periods when there were no significant forestfires. This conclusion derived from a short measurementperiod is consistent with the findings from earlier studies(Balasubramanian et al., 1999; See et al., 2006), accordingto which most of the chemical species (including inorganicions) were higher on hazy days as compared to clear days.These air pollution episodes affected the local air quality inSingapore, and contributed to the increase in TN content inprecipitation samples (Karthikeyan et al., 2009a). The WADflux is higher than the DAD flux. The total budget showsthat the biologically available N load to the surface water issignificantly more than 10 times the biologically available Pload to the surface water (Figs. 5 and 6). A similar pattern ofnutrient concentrations was observed in rainwater and seawa-ter (Fig. 6a). The seawater concentrations (which are used asmodel baseline values) in Fig. 6a were obtained by the statis-tical analysis of the data measured every month at 3 differentdepths (surface, mid depth and bottom) at field monitoringstations in the Singapore seawaters (as part of the routine wa-ter quality monitoring program by the Tropical Marine Sci-ence Institute (TMSI)) (Tkalich and Sundarambal, 2003; Ginet al., 2006). There was a significant concentration variationin coastal areas of the Singapore Strait and the Johor Strait inboth space and time (Gin et al., 2000, 2006).
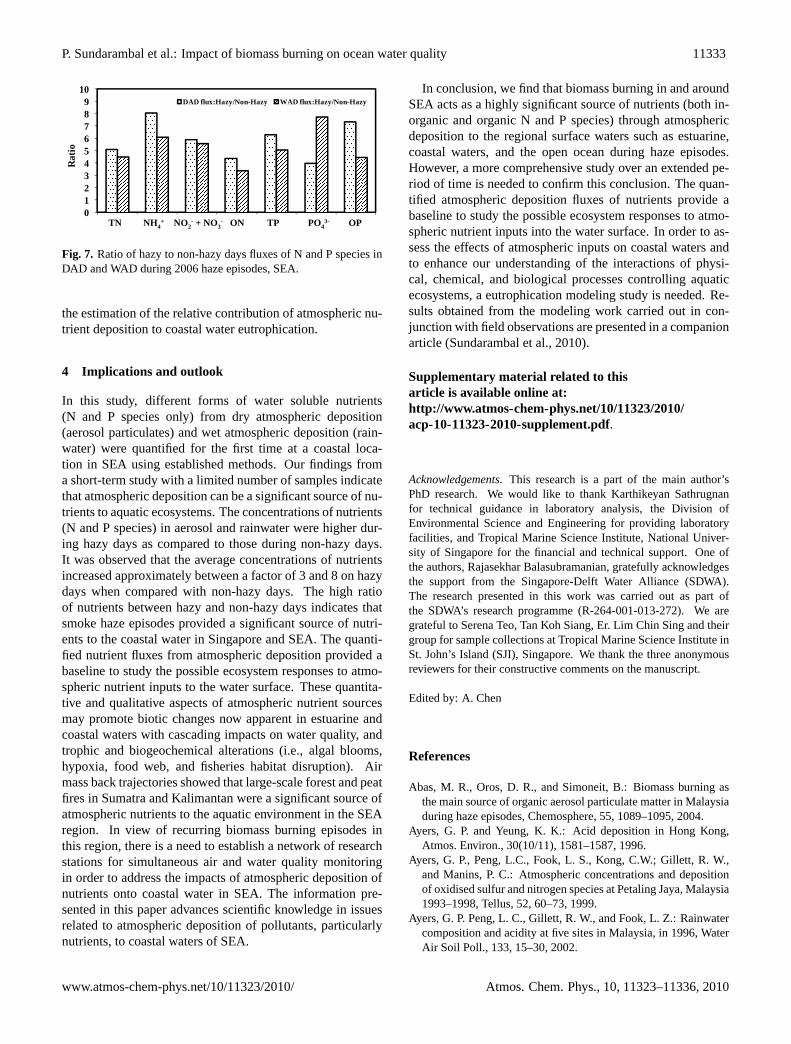
The high ratio of nutrients between hazy and non-hazydays (Fig. 7) in aerosol and rainwater clearly indicates thatatmospheric deposition during smoke haze episodes is a sig-nificant source of nutrients to the coastal waters of Singaporeand SEA. The ranking of N species from DAD and WAD interms of ratios between those observed during hazy and non-hazy days was NH+4 >NO+
3 +NO+
2 >TN>ON. The rankingof P species from DAD and WAD was OP>TP>PO3−
4 andPO3−
4 >TP>OP, respectively (Fig. 7). The purpose of therankings of nutrients resulting from atmospheric depositionduring hazy and non-hazy days is to understand the contribu-tion of each species to changes in the water quality and thusto coastal water eutrophication. Since WAD and DAD con-tribute different forms of nutrients at different rates, the avail-ability, stoichiometry, and nutrient loads from atmosphericsources would vary greatly with the rate and timing of pre-cipitation. The haze events that have plagued SEA are likelyto affect atmospheric fluxes of nutrients and other pollutantsinto aquatic systems.
Atmospheric deposition in Singapore and surroundingcountries appears to provide considerable fluxes of nutrientsof environmental concern, and it may thus play an importantrole in the coastal eutrophication. The eutrophication model“NEUTRO” (Tkalich and Sundarambal, 2003) was used forthe simulation of spatial and temporal nutrient dynamics, andto predict the water quality trends in Singapore coastal wa-ters. The research focus of this paper is only to quantify theatmospheric deposition of nutrients (N and P species) whilethe companion article (Sundarambal et al., 2010) deals with
Atmos. Chem. Phys., 10, 11323–11336, 2010 www.atmos-chem-phys.net/10/11323/2010/
P. Sundarambal et al.: Impact of biomass burning on ocean water quality 11333
44
865 Fig. 7. Ratio of hazy to non-hazy days fluxes of N and P species in DAD and WAD during 2006 haze episodes, SEA 866
0123456789
10
TN m ate
ON TP te OP
Rat
io
DAD flux:Hazy/Non-Hazy WAD flux:Hazy/Non-Hazy
TN NH4+ NO2
- + NO3- ON TP PO4
3- OP
Fig. 7. Ratio of hazy to non-hazy days fluxes of N and P species inDAD and WAD during 2006 haze episodes, SEA.
the estimation of the relative contribution of atmospheric nu-trient deposition to coastal water eutrophication.
4 Implications and outlook
In this study, different forms of water soluble nutrients(N and P species only) from dry atmospheric deposition(aerosol particulates) and wet atmospheric deposition (rain-water) were quantified for the first time at a coastal loca-tion in SEA using established methods. Our findings froma short-term study with a limited number of samples indicatethat atmospheric deposition can be a significant source of nu-trients to aquatic ecosystems. The concentrations of nutrients(N and P species) in aerosol and rainwater were higher dur-ing hazy days as compared to those during non-hazy days.It was observed that the average concentrations of nutrientsincreased approximately between a factor of 3 and 8 on hazydays when compared with non-hazy days. The high ratioof nutrients between hazy and non-hazy days indicates thatsmoke haze episodes provided a significant source of nutri-ents to the coastal water in Singapore and SEA. The quanti-fied nutrient fluxes from atmospheric deposition provided abaseline to study the possible ecosystem responses to atmo-spheric nutrient inputs to the water surface. These quantita-tive and qualitative aspects of atmospheric nutrient sourcesmay promote biotic changes now apparent in estuarine andcoastal waters with cascading impacts on water quality, andtrophic and biogeochemical alterations (i.e., algal blooms,hypoxia, food web, and fisheries habitat disruption). Airmass back trajectories showed that large-scale forest and peatfires in Sumatra and Kalimantan were a significant source ofatmospheric nutrients to the aquatic environment in the SEAregion. In view of recurring biomass burning episodes inthis region, there is a need to establish a network of researchstations for simultaneous air and water quality monitoringin order to address the impacts of atmospheric deposition ofnutrients onto coastal water in SEA. The information pre-sented in this paper advances scientific knowledge in issuesrelated to atmospheric deposition of pollutants, particularlynutrients, to coastal waters of SEA.
In conclusion, we find that biomass burning in and aroundSEA acts as a highly significant source of nutrients (both in-organic and organic N and P species) through atmosphericdeposition to the regional surface waters such as estuarine,coastal waters, and the open ocean during haze episodes.However, a more comprehensive study over an extended pe-riod of time is needed to confirm this conclusion. The quan-tified atmospheric deposition fluxes of nutrients provide abaseline to study the possible ecosystem responses to atmo-spheric nutrient inputs into the water surface. In order to as-sess the effects of atmospheric inputs on coastal waters andto enhance our understanding of the interactions of physi-cal, chemical, and biological processes controlling aquaticecosystems, a eutrophication modeling study is needed. Re-sults obtained from the modeling work carried out in con-junction with field observations are presented in a companionarticle (Sundarambal et al., 2010).
Supplementary material related to thisarticle is available online at:http://www.atmos-chem-phys.net/10/11323/2010/acp-10-11323-2010-supplement.pdf.
Acknowledgements.This research is a part of the main author’sPhD research. We would like to thank Karthikeyan Sathrugnanfor technical guidance in laboratory analysis, the Division ofEnvironmental Science and Engineering for providing laboratoryfacilities, and Tropical Marine Science Institute, National Univer-sity of Singapore for the financial and technical support. One ofthe authors, Rajasekhar Balasubramanian, gratefully acknowledgesthe support from the Singapore-Delft Water Alliance (SDWA).The research presented in this work was carried out as part ofthe SDWA’s research programme (R-264-001-013-272). We aregrateful to Serena Teo, Tan Koh Siang, Er. Lim Chin Sing and theirgroup for sample collections at Tropical Marine Science Institute inSt. John’s Island (SJI), Singapore. We thank the three anonymousreviewers for their constructive comments on the manuscript.
Edited by: A. Chen
References
Abas, M. R., Oros, D. R., and Simoneit, B.: Biomass burning asthe main source of organic aerosol particulate matter in Malaysiaduring haze episodes, Chemosphere, 55, 1089–1095, 2004.
Ayers, G. P. and Yeung, K. K.: Acid deposition in Hong Kong,Atmos. Environ., 30(10/11), 1581–1587, 1996.
Ayers, G. P., Peng, L.C., Fook, L. S., Kong, C.W.; Gillett, R. W.,and Manins, P. C.: Atmospheric concentrations and depositionof oxidised sulfur and nitrogen species at Petaling Jaya, Malaysia1993–1998, Tellus, 52, 60–73, 1999.
Ayers, G. P. Peng, L. C., Gillett, R. W., and Fook, L. Z.: Rainwatercomposition and acidity at five sites in Malaysia, in 1996, WaterAir Soil Poll., 133, 15–30, 2002.
www.atmos-chem-phys.net/10/11323/2010/ Atmos. Chem. Phys., 10, 11323–11336, 2010

11334 P. Sundarambal et al.: Impact of biomass burning on ocean water quality
Ayars, J. and Gao, Y.: Atmospheric nitrogen deposition to the Mul-lica River-Great Bay Estuary, Marine Environ. Res., 64, 590–600, 2007.
Baeyens, W., Dehairs, F., and Dedeurwaerder, H. Wet and dry de-position fluxes above the North Sea, Atmos. Environ., 24A(7),1693–1703, 1990.
Balasubramanian, R., Victor, T., and Begum, R.: Impact ofbiomassburning on rainwater acidity and composition in Singa-pore, J. Geophys. Res., 104, 26881–26890, 1999.
Balasubramanian, R., Victor, T., and Chun, N.: Chemical and statis-tical analysis of precipitation in Singapore, Water Air Soil Poll.,130, 451–456, 2001.
Balasubramanian, R., Qian, W. B., Decesari, S., Facchini, M.C., and Fuzzi, S.: Comprehensive characterization of PM2.5aerosols in Singapore, J. Geophys. Res., 108(D16), 4523,doi:10.1029/2002JD002517, 2003.
Balasubramanian, R. and Qian, W. B.: Characterization and sourceidentification of airborne trace metals in Singapore, J. Environ.Monit., 8, 813–818, 2004.
Bartoli, G., Migon, C., and Losno, R.: Atmospheric input of dis-solved inorganic phosphorus and silicon to the coastal northwest-ern Mediterranean Sea: Fluxes, variability and possible impacton phytoplankton dynamics, Deep-Sea Res. Pt. I, 52, 2005–2016,2005.
Caruso, E., Braga Marcazzan, G. M. and Redaelli, P.: PIXE inves-tigation of element concentration and particle size distributionin Milan atmospheric aerosol, Nucl. Instrum. and Methods, 181,425–429, 1981.
Chen, Y., Mills, S., Street, J., Golan, D. Post, A., Jacobson, M., andPaytan, A.: Estimates of atmospheric dry deposition and asso-ciated input of nutrients to Gulf of Aqaba seawater, J. Geophys.Res., 112, D04309, doi:10.1029/2006JD007858, 2007.
Clark, H. and Kremer, J. N.: Estimating direct and episodic atmo-spheric nitrogen deposition to a coastal waterbody, Marine Env-iron. Res., 59(4), 349–366, 2005.
Cornell, S. E., Jickells, T. D., Cape, J. N., Rowland, A. P., andDuce, R. A.: Organic nitrogen deposition on land and coastalenvironments: a review of methods and data, Atmos. Environ.,37, 2173–2191, 2003.
Crutzen, P. J. and Andreae, M. O.: Biomass burning in the trop-ics: impact on atmospheric chemistry and biogeochemical cy-cles, Science, 250, 1669–1678, 1990.
DHI: Detailed studies on Tuas View extension and Pulau Tekongland reclamation. Final Report, Volume VIII Water quality im-pact assessment, Danish Hydraulic Institute, 2004.
DOE: Department Of Environment, Ministry of Natural Resourcesand Environment, Malaysia, URL:http://www.doe.gov.my/, lastaccess: October 2006.
Draxler, R. R. and Rholph, G. D.: HYbrid Single-Particle La-grangian Integrated Trajectory (HYSPLIT) Model access viaNOAA ARL READY, Website, NOAA Air Resources Labora-tory, Silver Spring, MD, 2003.
Duarte, C. M., Dachs, J., Llabres, M., Alonso-Laita, P., Gasol,J. M., Tovar-Sanchez, A., Sanudo-Wilhemy, S., and Agustı,S.: Aerosol inputs enhance new production in the sub-tropical northeast Atlantic, J. Geophys. Res., 111, G04006,doi:10.1029/2005JG000140, 2006.
Duce, R.: The impact of atmospheric nitrogen, phosphorus, andiron species on marine biological productivity, in: The Role of
Air-Sea Exchange in Geochemical Cycling, edited by: Buat-Menard, P., D. Reidel, Norwell, MA, 497–529, 1986.
Duce, R. A., Liss, P. S., Merrill, J. T., Atlas, E. L., Buat-Menard,P., Hicks, B. B., Miller, J. M., Prospero, J. M., Arimoto, R.,Church, T. M., Ellis, W., Galloway, J. N., Hansen, L., Jickells,T. D., Knap, A. H., Reinhardt, K. H., Schneider, B., Soudine,A., Tokos, J. J., Tsunogai, S., Wollast, R., and Zhou, M.: Theatmospheric input of trace species to the world ocean, GlobalBiogeochem. Cy., 5, 193–259, 1991.
Duce, R. A., LaRoche, J., Altieri, K., Arrigo, K. R., Baker, A.R., Capone, D. G., Cornell, S., Dentener, F., Galloway, J.,Ganeshram, R. S., Geider, R. J., Jickells, T., Kuypers, M. M.,Langlois, R., Liss, P. S., Liu, S. M., Middelburg, J. J., Moore,C. M., Nickovic, S., Oschlies, A., Pedersen, T., Prospero, J.,Schlitzer, R., Seitzinger, S., Sorensen, L. L., Uematsu, M., Ul-loa, O., Voss, M., Ward, B., and Zamora, L.: Impacts of Atmo-spheric Anthropogenic Nitrogen on the Open Ocean, Science,320(5878), 893–897, 2008.
Dulac, F., Buat-Menard, P., Ezat, U., and Bergametti, G.: Atmo-spheric input of trace metals to the western Mediterranean Sea:uncertainties in modelling dry deposition from cascade impactordata, Tellus, 41B, 362–378, 1989.
Galloway, J. N., Levy II, H., and Kasibhatla, P. S.: Year 2020: Con-sequences of population growth and development on depositionof oxidized nitrogen, Ambio, 23, 120–123, 1994.
Gillett, R. W., Ayers, G. P., Selleck, P. W., Tuti, M. H. W., andHarjanto, H.: Concentrations of nitrogen and sulfur species ingas and rainwater from several sites in Indonesia, Water Air SoilPoll., 120, 205–215, 2000.
Gin, K. Y. H., Lin, X., and Zhang, S.: Dynamics and size structureof phytoplankton in the coastal waters of Singapore, J. PlanktonRes., 22, 1465–1484, 2000.
Gin, K. Y. H., Holmes, M. J., Zhang, S., and Lin, X.: Phytoplank-ton structure in the tropical port waters of Singapore, in: TheEnvironment in Asia Pacific Harbours, Chapter 21, edited by:Wolanski, E., Springer, Netherlands, 347–375, 2006.
Hasager, C. B., Carstensen, J., Ellermann, T., Gustafson, B. G., Her-tel, O., Johnsson, M., Markager, S., and Ambelas Skjøth, C.: Onextreme atmospheric and marine nitrogen fluxes and chlorophyll-a levels in the Kattegat Strait, Atmos. Chem. Phys., 3, 797–812,doi:10.5194/acp-3-797-2003, 2003.
Herut, B., Krom, M. D., Pan, G., and Mortimer, R.: Atmospheric in-put of nitrogen and phosphorus to the Southeast Mediterranean:sources, fluxes, and possible impact, Limnol. Oceanogr., 44,1683–1692, 1999.
Herut, B., Collier, R., and Krom, M.: The role of dust in supplyingnitrogen and phosphorus to the Southeast Mediterranean, Lim-nol. Oceanogr., 47, 870–878, 2002.
Joffre, S. M.: Modelling the dry deposition velocity of highly solu-ble gases to the sea surface, Atmos. Environ., 22(6), 1137–1146,1988.
Karthikeyan, S. and Balasubramanian, R.: Evaluation of microwaveassisted extraction for determination of water soluble inorganicspecies in airborne particulate matter, Anal. Bioanal. Chem., 381,1604–1608, 2005a.
Karthikeyan, S. and Balasubramanian, R.: Rapid extraction for wa-ter soluble organic compounds in airborne particulate matter,Anal. Sci., 21, 1505–1508, 2005b.
Karthikeyan, S. and Balasubramanian, R.: Determination of water
Atmos. Chem. Phys., 10, 11323–11336, 2010 www.atmos-chem-phys.net/10/11323/2010/

P. Sundarambal et al.: Impact of biomass burning on ocean water quality 11335
soluble inorganic and organic species, Michrochem. J., 82, 49–55, 2006.
Karthikeyan, S., See, S., and Balasubramanian, R.: Simultaneousdetermination of inorganic anions and selected organic acids inairborne particulate patter by Ion Chromatography, Anal. Lett.,40, 1–12, 2007.
Karthikeyan, S., He, J., Sundarambal, P., Balasubramanian, R., andBurger, D. Determination of total nitrogen in atmospheric wetand dry deposition samples, Talanta, 77(3), 979–984, 2009a.
Karthikeyan, S., Balasubramanian, R., and He, J.: Inter-laboratorystudy to improve the quality of the analysis of nutrients in rain-water chemistry, Atmos. Environ., 43(21), 3424–3430, 2009b.
Koe, L. C. C., Arellano Jr., A. F., and McGregor, J. L.: Investigat-ing the haze transport from 1997 biomass burning in SoutheastAsia: its impact upon Singapore, Atmos. Environ., 35, 2723–2734, 2001.
Kondo, Y., Morino, Y., Takegawa, N., Koike, M., Kita, K.,Miyazaki, Y., Sachse, G. W., Vay, S. A., Avery, M. A., Flocke,F., Weinheimer, A. J., Eisele, F. L., Zondlo, M. A., Weber, R. J.,Singh, H. B., Chen, G., Crawford, J., Blake, D. R., Fuelberg,H. E., Clarke, A. D., Talbot, R. W., Sandholm, S. T., Brow-ell, E. V., Streets, D. G., and Liley, B.: Impacts of biomassburning in Southeast Asia on ozone and reactive nitrogen overthe Western Pacific in spring, J. Geophys. Res., 109, D15S12,doi:10.1029/2003JD004203, 2004.
Krom, M. D., Kress, N., Brenner, S., and Gordon, L. I.: Phosphoruslimitation of primary productivity in the eastern MediterraneanSea, Limnol. Oceanogr., 36, 424–432, 1991.
Lobert, J. M., Scharffe, D. H., Hao, W. M., and Crutzen, P. J.:Importance of biomass burning in the atmospheric budgets ofnitrogen-containing gases, Nature, 346, 552–554,1990.
Mahowald, N. M., Artaxo, P., Baker, A. R., Jickells, T. D., Okin, G.S., Randerson, J. T., and Townsend, A. R.: Impacts of biomassburning emissions and land use change on Amazonian atmo-spheric phosphorus cycling and deposition, Global Biogeochem.Cy., 19, GB4030, doi:10.1029/2005GB002541, 2005.
Mahowald, N., Jickells, T. D., Baker, A. R., Artaxo, P., Benitez-Nelson, C. R., Bergametti, G., Bond, T. C., Chen, Y., Cohen,D. D., Herut, B., Kubilay, N., Losno, R., Maenhaut, C. L. W.,McGee, K. A., Okin, G. S., Siefert, R. L., and Tsukuda, S.:Global distribution of atmospheric phosphorus sources, concen-trations and deposition rates and anthropogenic impacts, GlobalBiogeochem. Cy., 22, GB4026, doi:10.1029/2008GB003240,2008.
Markaki, Z., Oikonomou, K., Kocak, M., Kouvarakis, G., Chan-iotaki A., Kubilay, N., and Mihalopoulos, N.: Atmospheric de-position of inorganic phosphorus in the Levantine Basin, east-ernMediterranean: Spatial and temporal variability and its rolein seawater productivity, Limnol. Oceanogr., 48(4), 1557–1568,2003.
Mayewski, P., Meeker, L. D., Morrison, M. C., Twickler, M. S.,Whitlow, S. I., Ferland, K. K., Meese, D. A., Legrand, M. R., andSteffensen, J. P.: Greenland ice core ”signal” characteristics: Anexpanded view of climate change, J. Geophys. Res., 98, 12839–12847, 1993.
Mayewski, P. A., Meeker, L. D., Twickler, M. S., Whitlow, S. I.,Yang, Q., Lyons, W. B., and Prentice, M.: Major features andforcing of high latitude northern hemisphere atmospheric circu-lation over the last 110 000 years, J. Geophys. Res., 102(C12),
26345–26366, 1997.Menzel, D. W. and Spaeth, J. P.: Occurrence of ammonia in
Sargasso Sea waters and in rain water at Bermuda, Limnol.Oceanogr., 7, 159–162, 1962.
Migon, C., Morelli, J., Nicolas, E., and Copin-Montegut, G.: Eval-uation of total atmospheric deposition of Pb, Cd, Cu and Zn tothe Ligurian Sea, Sci. Total Environ., 105, 135–148, 1991.
Migon, C., Sandroni, V., and Bethoux, J. P.: Atmospheric inputof anthropogenic phosphorus to the northwest mediterranean un-der oligotrophic conditions, Mar. Environ. Res., 52(5), 413–426,2001.
Moy, L. A., Dickerson, R. R., and Ryan, W. F.: Relationship be-tween back trajectories and tropospheric trace gas concentrationsin rural Virginia, Atmos. Environ., 28, 2789–2800, 1994.
NEA: National Environment Agency, Ministry of the Environmentand Water Resources, Singapore. available at:http://app2.nea.gov.sg/images/RegionalPSI for 2006.pdf, 2010.
Nielsen, T., Pilegaard, K., Egelarv, A. H., Granby, K., Hummelshøj,P., Jensen, N. O., and Skov, H.: Atmospheric nitrogen com-pounds: occurrence, composition and deposition, Sci. Total En-viron., 189/190, 459–465, 1996.
Poor, N., Pollman, C., Tate, P., Begum, M., Evans, M., and Camp-bell, S.: Nature and magnitude of atmospheric fluxes of totalinorganic nitrogen and other inorganic species to the Tampa BayWatershed, FL, USA, Water Air Soil Poll., 170, 267–283, 2006.
Prospero, J. M., Barrett, K., Church, T., Dentener, F., Duce, R. A.,Galloway, J. N., Levy II, H., Moody, J., and Quinn, P.: Atmo-spheric deposition of nutrients to the North Atlantic Basin, Bio-geochemistry, 35(1), 27–73, 1996.
Pryor, S. C. and Barthelmie, R. J.: Particle dry deposition to wa-ter surfaces: processes and consequences, Mar. Pollut. Bull., 41,220–231, 2000.
Qi, J., Li, P., Li, X., Feng, L., and Zhang, M.: Estimation of drydeposition fluxes of particulate species to the water surface inthe Qingdao area, using a model and surrogate surfaces, Atmos.Environ., 39, 2081–2088, 2005.
Reid, J. S. and Hobbs, P. V.: Physical and optical properties ofyoung smoke from individual biomass fires in Brazil, J. Geo-phys. Res., 103, 32013–32030, 1998.
Reid, J. S., Koppmann, R., Eck, T. F., and Eleuterio, D. P.: A reviewof biomass burning emissions part II: intensive physical proper-ties of biomass burning particles, Atmos. Chem. Phys., 5, 799–825, doi:10.5194/acp-5-799-2005, 2005.
See, S. W., Balasubramanian, R., and Wang, W.: A study of thephysical, chemical and optical properties of ambient aerosol par-ticles in Southeast Asia during hazy and non hazy days. J. Geo-phys. Res., 111, D10S08, doi:10.1029/2005JD006180, 2006.
Seinfeld, J. H. and Pandis, S. N.: Atmospheric Chemistry andPhysics: from Air Pollution to Climate Change, 2nd ed, JohnWiley, New York, 1203 pp., 2006.
Sehmel, G. A.: Particle and gas dry deposition: a review, Atmos.Environ., 14, 983–1011, 1980.
Slinn, S. A. and Slinn, W. G. N.: Predictions for particle depositionon natural waters, Atmos. Environ., 14, 1013–1016, 1980.
Slinn, W. G. N.: Predictions for particle deposition to vegetativecanopies, Atmos. Environ., 16, 1785–1794, 1982.
Spokes, L. J., Yeatman, S. G., Cornell, S. E., and Jickells, T. D.: Ni-trogen deposition to the eastern Atlantic Ocean: The importanceof south-easterly flow, Tellus, 52B, 37–49, 2000.
www.atmos-chem-phys.net/10/11323/2010/ Atmos. Chem. Phys., 10, 11323–11336, 2010

11336 P. Sundarambal et al.: Impact of biomass burning on ocean water quality
Sundarambal, P., Balasubramanian, R., Karthikeyan, S., andTkalich, P.: Atmospheric deposition of nutrients and its role oncoastal eutrophication in Southeast Asia, in: Advances in Geo-sciences: Vol. 9- Solid Earth, Ocean Science and AtmosphericScience, edited by: Yun-Tai Chen, World Scientific PublishingCompany, Singapore, 149–166, 2006.
Sundarambal, P.: Estimation of the contribution of atmospheric de-position to coastal water eutrophication, Ph.D. Thesis, Depart-ment of Chemical and Biomolecular Engineering, National Uni-versity of Singapore, Singapore, 2009.
Sundarambal, P., Tkalich, P., and Balasubramanian, R.: Im-pact of biomass burning on ocean water quality in SoutheastAsia through atmospheric deposition: eutrophication modeling,Atmos. Chem. Phys., 10, 11337–11357, doi:10.5194/acp-10-11337-2010, 2010.
Thingstad, T. F., Zweifel, U. L., and Rassoulzadegan, F.: P limita-tion of heterotrophic bacteria and phytoplankton in the northwestMediterranean, Limnol. Oceanogr., 43, 88–94, 1998.
Tkalich, P. and Sundarambal. P.: Eutrophication modelling for theSingapore waters, Singapore Maritime and Port Journal, 122–136, 2003.
Turner, D. B.: Comparison of three methods for calculating thestandard deviation of the wind direction, J. Climate Appl. Me-teor., 25, 703–707, l986.
van den Berg, A., Dentener, F., and Lelieveld, J.: Modelling thechemistry of the marine boundary layer: Sulfate formation andthe role of sea-salt aerosol particles, J. Geophys. Res., 105,11671–11698, 2000.
Vicars, W. C., Sickman, J. O., and Ziemann, P. J.: Atmosphericphosphorus deposition at a montane site: Size distribution,effectsof wildfire, and ecological implications, Atmos. Environ., 44,2813–2821, 2010.
Wall, S.M., John, W., and Ondo, J. L.: Measurement of aerosol sizedistribution for nitrate and major ionic species, Atmos. Environ.,22, 1649–1656, 1988.
Wesely, M., and Hicks, B.: A review of the current status of knowl-edge on dry deposition, Atmos. Environ., 34, 2261–2282, 2000.
Whitall, D., Hendrickson, B., and Paerl, H.: Importance of atmo-spheric deposited nitrogen to the annual nitrogen budget of theNeuse River estuary, North Carolina, Environ. Int., 29, 393–399,2003.
William, R. M.: A model for the dry deposition of particles to nat-ural water surfaces, Atmos. Environ., 16(8), 1933–1938, 1982.
Xianren, Q. and Baeyens, W.: The chemical composition of precip-itation and atmospheric aerosols in relation to rain water acidity,in: Global and Regional Atmospheric Chemistry, Proceedingsof the International Conference on Global and Regional Atmo-spheric Chemistry, Bejing, China, 622–625, 1990.
Yamartino, R. J.: A comparison of several “single-pass” estimatorsof the standard deviation of wind direction, J. Climate Appl. Me-teor., 23, 1362–1366, 1984.
Yang, H. H., Hsieh, L. T., and Cheng, S. K.: Determination of at-mospheric nitrate particulate size distribution and dry depositionvelocity for three distinct areas, Chemosphere, 60, 1447–1453,2005.
Zhang, L., Gong, S., Padro, J., and Barrie, L.: A size-segregatedparticle dry deposition scheme for an atmospheric aerosol mod-ule, Atmos. Environ., 35, 549–560, 2001.
Zhong, Z. C., Victor, T., and Balasubramanian, R.: Measurement ofmajor organic acids in Southeast Asia during burning and non-burning period, Water, Air and Soil Poll., 130(1–4), 457–462,2001.
Zhuang, H., Chan, C. K., Fang, M., and Wexler, A. S.: Size distri-butions of particulate sulfate, nitrate, and ammonium at a coastalsite in Hong Kong, Atmos. Environ., 33, 843–853, 1999.
Zhang G., Zhang, J., and Liu, S.: Characterization of nutrients in theatmospheric wet and dry deposition observed at the two monitor-ing sites over Yellow Sea and East China Sea, J. Atmos. Chem.,57, 41–57, 2007.
Atmos. Chem. Phys., 10, 11323–11336, 2010 www.atmos-chem-phys.net/10/11323/2010/