Embed Size (px)
Citation preview

ORIGINAL RESEARCHpublished: 11 August 2015
doi: 10.3389/fncel.2015.00315
Edited by:Christian D. Wilms,
University College London, UK
Reviewed by:Khursheed Wani,
University of Michigan, USACheng-Chang Lien,
National Yang-Ming University, Taiwan
*Correspondence:Ákos Kulik,
Institute of Physiology, Universityof Freiburg, Hermann Herder Straße
7, D-79104 Freiburg, [email protected]
Received: 15 May 2015Accepted: 28 July 2015
Published: 11 August 2015
Citation:Althof D, Baehrens D, Watanabe M,
Suzuki N, Fakler B and Kulik Á (2015)Inhibitory and excitatory axon
terminals share a commonnano-architecture of their Cav2.1
(P/Q-type) Ca2+ channels.Front. Cell. Neurosci. 9:315.
doi: 10.3389/fncel.2015.00315
Inhibitory and excitatory axonterminals share a commonnano-architecture of their Cav2.1(P/Q-type) Ca2+ channelsDaniel Althof1, David Baehrens 1, Masahiko Watanabe2, Noboru Suzuki3, Bernd Fakler1,4
and Ákos Kulik1,4*
1 Institute of Physiology, University of Freiburg, Freiburg, Germany, 2 Department of Anatomy, Graduate School of Medicine,Hokkaido University, Sapporo, Japan, 3 Department of Animal Genomics, Functional Genomics Institute, Mie University, Mie,Japan, 4 Centre for Biological Signalling Studies, University of Freiburg, Freiburg, Germany
Tuning of the time course and strength of inhibitory and excitatory neurotransmitterrelease is fundamental for the precise operation of cortical network activity andis controlled by Ca2+ influx into presynaptic terminals through the high voltage-activated P/Q-type Ca2+ (Ca 2
v2.1) channels. Proper channel-mediated Ca +-signalingcritically depends on the topographical arrangement of the channels in the presynapticmembrane. Here, we used high-resolution SDS-digested freeze-fracture replicaimmunoelectron microscopy together with automatized computational analysis ofCav2.1 immunogold labeling to determine the precise subcellular organization ofCav2.1 channels in both inhibitory and excitatory terminals. Immunoparticles labelingthe pore-forming α1 subunit of Cav2.1 channels were enriched over the active zoneof the boutons with the number of channels (3–62) correlated with the area of thesynaptic membrane. Detailed analysis showed that Cav2.1 channels are non-uniformlydistributed over the presynaptic membrane specialization where they are arranged inclusters of an average five channels per cluster covering a mean area with a diameterof about 70 nm. Importantly, clustered arrangement and cluster properties did notshow any significant difference between GABAergic and glutamatergic terminals. Ourdata demonstrate a common nano-architecture of Cav2.1 channels in inhibitory andexcitatory boutons in stratum radiatum of the hippocampal CA1 area suggesting thatthe cluster arrangement is crucial for the precise release of transmitters from the axonalboutons.
Keywords: Ca2+ channels, quantitative immunoelectron microscopy, cluster analysis, rat, hippocampus
Introduction
A balance between inhibitory and excitatory synaptic transmission is essential forthe normal functioning of cortical neuronal circuits. The net effect of synapticinhibition and excitation is determined by the firing properties of inhibitoryGABAergic and excitatory glutamatergic cells as well as by the release dynamics ofGABA- and glutamate-filled vesicles. The transmitter release is primarily triggeredby Ca2+ influx through voltage-gated Ca2+ (Cav) channels (Clapham, 2007) that are
Frontiers in Cellular Neuroscience | www.frontiersin.org 1 August 2015 | Volume 9 | Article 315

Althof et al. Ca2+ channels in hippocampal cells
activated by action potentials and/or sub-threshold depolarizingsignals (Schneggenburger and Neher, 2005; Nadkarni et al.,2010). Consequently, number, density and spatial relationshipof Cav channels relative to the active zone of the presynapticboutons, the actual locus of vesicle fusion, are assumed tobe crucial factors in fine-tuning the temporal precision oftransmitter release (Eggermann et al., 2012; Scimemi andDiamond, 2012; Sheng et al., 2012). At fast mammalian centralsynapses the subfamily two Cav channels, Cav2.1 (P/Q-type) andCav2.2 (N-type), are essential for coupling the presynaptic actionpotential to transmitter release (Wu and Saggau, 1994; Stevens,2004; Cao and Tsien, 2010; Ariel et al., 2013) thus controlling theefficacy of transmission (Poncer et al., 1997; Catterall and Few,2008; Lipscombe et al., 2013).
In the CA1 area of the hippocampus, pyramidal cells areunder the control of inhibitory GABAergic and excitatoryglutamatergic cells. GABAergic inputs originating mainly fromlocal interneurons, controlling the firing rate of pyramidalcells and modulate their spike timing as well as synchronizetheir activity (Klausberger, 2009). In contrast, glutamatergicinputs arriving predominantly from pyramidal cells in CA3 andentorhinal cortex carry predictions based on memory recall andsensory information, respectively (Lisman, 1999; Otmakhovaand Lisman, 2004). Thus, inhibitory and excitatory projections,targeting different subcellular domains of the CA1 principal cells,exert distinct effects on concerted and synchronous activities ofhippocampal neurons and overall on rhythmic brain activitiesby released GABA and glutamate. The amount and kineticsof neurotransmitter release related to the intracellular Ca2+concentration ([Ca2+]i) needs to be tightly regulated in terminalsby Ca2+ entry through Cav channels, as even small changesin presynaptic Ca2+ influx lead to large changes in vesiclerelease and neurotransmission (Frank, 2014). This raises thequestion of whether hippocampal inhibitory and excitatorysynapses are similar or fundamentally different regarding thesubcellular organization of the Cav channels. The Ca2+-dependent synchronous release of neurotransmitters require theconcerted compliance of various functionally interacting proteinsforming the Cav2 channel-associated networks, termed nano-environment (Müller et al., 2010), in presynaptic compartments.The spatial arrangements of these specific proteins maydetermine the two-dimensional distribution pattern of Cav2channels in membrane segments of axonal boutons therebyplacing the channel at a position optimal for triggeringthe release machinery. Although, recent functional studiesachieved substantial progress in localizing Cav2 channels incortical inhibitory (Bucurenciu et al., 2008; Kisfali et al.,2013) and excitatory (Kulik et al., 2004; Holderith et al.,2012; Parajuli et al., 2012; Indriati et al., 2013; Baur et al.,2015) synapses as well as at the calyx of Held (Nakamuraet al., 2015), qualitative and quantitative comparison ofCav2.1 channel topographical arrangement in small presynapticboutons in the CA1 area of the hippocampus remainedunresolved.
Here, we combined the high-resolution sodium dodecylsulfate-digested freeze-fracture replica labeling (SDS-FRL)immunoelectron microscopy with automatized computational
cluster analysis of immunoreactivity to determine thenumber and the spatial distribution profile of Cav2.1channels in terminals of both GABAergic and glutamatergiccells in the stratum radiatum of the hippocampal CA1region.
Materials and Methods
Sodium Dodecyl Sulfate-DigestedFreeze-Fracture Replica Immunolabeling(SDS-FRL) and Electron MicroscopyImmunolabelingFor the current study 6-week-old male Wistar rats (n = 6),one adult male Cav2.1 knock-out (ko) mouse, and one adultmale wild type (wt) mouse were used. The perfusion of theanimals and preparation of tissues and replicas for SDS-FRLwere performed as described previously (Kulik et al., 2006;Masugi-Tokita and Shigemoto, 2007). Care and handling ofthe animals prior to and during the experimental proceduresfollowed European Union regulations and was approved by theAnimal Care and Use Committees of the authors’ institutions.Animals were anesthetized with sodium pentobarbital (50 mg/kg,i.p.), and the hearts were surgically exposed for perfusion fixation.First, the vascular system was flushed by 25 mM phosphate-buffered saline (PBS) followed by transcardial perfusion witha fixative containing 2% paraformaldehyde (Merck, Germany)and 15% saturated picric acid made up in 0.1 M phosphatebuffer (PB). Sagittal sections from the CA1 area were cuton a microslicer at a thickness of 110 μm. The slices werecryoprotected in a solution containing 30% glycerol made upin 0.1 M PB and then frozen by a high-pressure freezingmachine (HPM 100, Leica, Austria). Frozen samples wereinserted into a double replica table and then fractured intotwo pieces at −130◦C. Fractured faces were replicated bydeposition of carbon (5 nm thickness), platinum (2 nm),and carbon (18 nm) in a freeze-fracture replica machine(BAF 060, BAL-TEC, Lichtenstein). They were digested ina solution containing 2.5% SDS and 20% sucrose made upin 15 mM Tris buffer (TB), pH 8.3, at 80◦C for 18 h.Replicas were washed in 50 mM Tris-buffered saline (TBS)containing 0.05% BSA (Roth, Germany) and 0.1% Tween20(Tw20, Roth) and then incubated in a blocking solution(5% BSA) and then in mixtures of primary antibodies: (i)Cav2.1 [Guinea pig (Gp), 5 μg/ml] and RIM1/2 [Rabbit(Rb), 1 μg/ml; Synaptic System, Göttingen, Germany], (ii)vesicular GABA transporter (VGAT, Gp, 4.5 μg/ml) and Cav2.1(Rb, 1 μg/ml; Synaptic System, Göttingen), (iii) vesicularglutamate transporter-1 (VGLUT-1, Rb, 6 μg/ml) and Cav2.1(Gp, 5 μg/ml), (iv) VGAT (Gp, 4.5 μg/ml) and VGLUT-1 (Rb, 6 μg/ml) in 50 mM TBS containing 1% BSA and0.1% Tw20 overnight (O/N) at room temperature. Replicaswere reacted with a mixture of gold-coupled (10 and 15 nmor 5 and 10 nm) goat anti-guinea pig and goat anti-rabbitIgGs secondary antibodies (1:30; BioCell Research Laboratories,Cardiff, UK) made up in 50 mM TBS containing 5% BSA O/N at15◦C.
Frontiers in Cellular Neuroscience | www.frontiersin.org 2 August 2015 | Volume 9 | Article 315
Althof et al. Ca2+ channels in hippocampal cells
Electron MicroscopyThe labeled replicas were examined using a transmission electronmicroscope (Philips CM100).
Control ExperimentsThe specificity of immunolabeling for Cav2.1 was controlled bystaining of sections obtained from wt and ko mice. In wt animals[VGAT-Cav2.1 (n= 76 terminals; VGLUT-1-Cav2.1 (n= 40)] thepattern of immunostaining was identical to that of rat, whereas inko mouse [VGAT-Cav2.1 (n = 68); VGLUT-1-Cav2.1 (n = 53)]no immunolabeling for the channel subunit was detected furtherconfirming the specificity of the antibodies.
Quantification of Immunogold DistributionThe distribution of immunogold labeling for Cav2.1was evaluated using an in-house developed automatizedcomputational procedure. As an input, the underlying algorithmused x- and y-coordinates (in pixels) of the particles thatwere extracted from electron micrographs with the ImageJsoftware package (Schneider et al., 2012). The plasma membranearea covered with immunoparticles was calculated using theconvex hull, the smallest area containing all particles as wellas every line segment between all pairs of particles that wasdetermined with the QuickHull algorithm (Barber et al., 1996).The cluster-assignment was obtained from the single-linkmethod (Sibson, 1973). Accordingly, particles are assigned tothe same cluster if their distances fall below a given thresholdlength that was set to 21 nm around the center of a goldparticle. This distance is equivalent to the combined lengthof the radius of the 10 nm gold particle and the lengths ofprimary and secondary antibodies (2 × 8 nm = length oftwo IgGs, Figure 4A) (Amiry-Moghaddam and Ottersen,2013).
To validate the clustering of Cav2.1 immunoparticles ourcomputational procedure was applied to random samples thatwere generated as follows: for each putative active zone, anequal number of control particles was randomly placed withina frame defined by the coordinates of the outer most particles(Figure 4D). When the size of the putative active zone was
large enough while maintaining an equal number of particlesthey were placed not closer than 10 nm, which correspondsto the diameter of a gold particle and avoids overlap of twoneighboring particles. The final random control for any activezone was the average of ten individually generated randomdistributions.
Control ExperimentsTo assure that clustering of Cav2.1 channels is not due to anartifact by the secondary antibody we investigated the subcellulardistribution of VGAT and VGLUT-1 as well as the GluRδ2receptor by using the same 10 nm gold-coupled secondaryantibodies. These proteins showed a distribution pattern differentfrom Cav2.1 and did not form clusters. The automatizedcomputational cluster analysis of immunoreactivity for GluRδ2showed no significant difference compared to a random uniformsampling regarding both cohesion (p = 0.069) and separation(p = 0.86).
Statistical AnalysisImmunoreactivity for Cav2.1 was quantitatively analyzed inputative active zones of GABAergic, putative glutamatergicand glutamatergic boutons (n = 54 for VGAT+, n = 67for VGAT−, n = 90 for VGLUT-1+) obtained from twoanimals. Absolute numbers of Cav2.1 immunoparticles peractive zone were compared using the Mann–Whitney test.Correlation of the number of Cav2.1 and the respectiveconvex hull area was determined by the Spearman coefficientof correlation (rs). Clusters of immunogold particles inVGAT+ and VGAT− boutons as well as in VGAT+ andVGLUT-1+ boutons as regards cohesion and separation werecompared using the cumulative probability distributions andby performing the two-sample Kolmogorov–Smirnov test. Thenumber of clusters per active zone, particles per clusters,and diameter of clusters in VGAT+ and VGAT− boutons aswell as in VGAT+ and VGLUT-1+ boutons were statisticallycompared using the two-sample Kolmogorov–Smirnov test.Statistical significance was assessed by a p-value thresholdof 0.05.
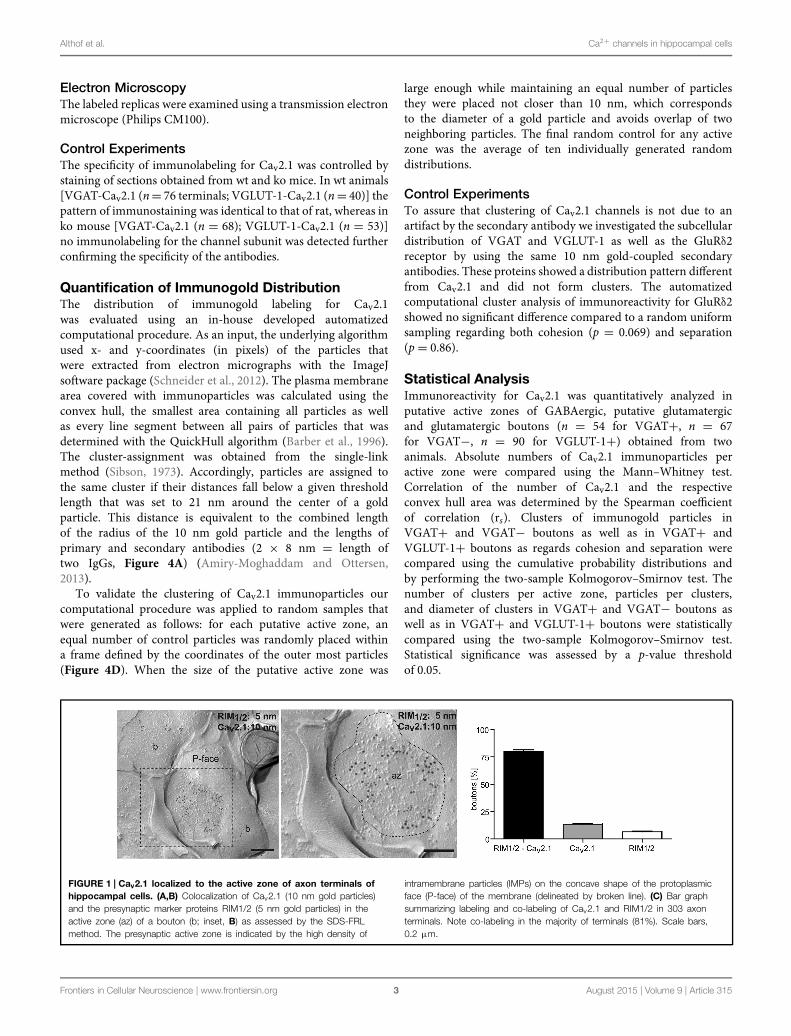
FIGURE 1 | Cav2.1 localized to the active zone of axon terminals ofhippocampal cells. (A,B) Colocalization of Cav2.1 (10 nm gold particles)and the presynaptic marker proteins RIM1/2 (5 nm gold particles) in theactive zone (az) of a bouton (b; inset, B) as assessed by the SDS-FRLmethod. The presynaptic active zone is indicated by the high density of
intramembrane particles (IMPs) on the concave shape of the protoplasmicface (P-face) of the membrane (delineated by broken line). (C) Bar graphsummarizing labeling and co-labeling of Cav2.1 and RIM1/2 in 303 axonterminals. Note co-labeling in the majority of terminals (81%). Scale bars,0.2 μm.
Frontiers in Cellular Neuroscience | www.frontiersin.org 3 August 2015 | Volume 9 | Article 315

Althof et al. Ca2+ channels in hippocampal cells
Results
Cav2.1 Protein is Localized to the Active Zonesof Axon TerminalsAll antibodies used target intracellular epitopes and, therefore,result in labeling of the protoplasmic face (P-face) of the replicas.First, we determined the distribution of the Cav2.1 channelsat presynaptic sites. Immunogold labeling for the channel’s
pore-forming α1 subunit was observed in the active zone ofaxon terminals that were recognized by their high density ofintramembrane particles (IMPs) on the P-face of the invaginatedplasma membrane and were identified by immunolabelingfor the presynaptic marker proteins RIM1/2 (Figures 1A,B).Quantitative analysis further revealed a high degree of co-localization of Cav2.1 and RIM1/2 in the majority (81%) of theinvestigated terminals (n = 303; Figure 1C), indicating that
FIGURE 2 | Cav2.1 channels are organized in discrete groups in thepresynaptic active zone of boutons in inhibitory GABAergic andexcitatory glutamatergic cells in the stratum radiatum of thehippocampal CA1 area. (A) Electron micrograph of a replica double-labeledfor vesicular GABA transporter (VGAT; 10 nm gold particles) and VGLUT-1(15 nm) showing no overlap between the two subpopulations. (B) Quantificationof gold particles further demonstrated that 15% of the examined axon terminals
(n = 328) were VGAT+ (bVGAT+ ) and 85% were immunoreactive for VGLUT-1(bVGLUT−1+ ). (C–H) Replica images showing aggregation of immunogoldparticles labeling Cav2.1 (10 nm) in small (C,E,G) and large (D,F,H) active zonesof VGAT+ (15 nm; C,D), VGAT− (E,F) and VGLUT-1+ (15 nm; G,H) boutons(b). Note that VGAT− and VGLUT-1+ terminals make asmmetrical synapseswith dendritic spines (s in E,F,G) that can be recognized by the high density ofIMPs on the E-face of the plasma membrane. Scale bars, 0.2 μm.
Frontiers in Cellular Neuroscience | www.frontiersin.org 4 August 2015 | Volume 9 | Article 315

Althof et al. Ca2+ channels in hippocampal cells
Cav2.1 channels are mainly confined to the active zone of boutonsin the stratum radiatum of CA1.
Inhibitory and Excitatory Boutons ShowSimilar Arrangement of Cav2.1Next we compared the distribution of immunoparticles labelingCav2.1 in axon terminals of inhibitory GABAergic andexcitatory glutamatergic neurons. For this purpose, threeseries of double immunolabeling experiments were performed:(i) labeling for vesicular GABA transporter (VGAT) andvesicular glutamate transporter-1 (VGLUT-1), (ii) labeling forVGAT and Cav2.1, and (iii) labeling for VGLUT-1 andCav2.1. Immunoreactivity for VGAT and VGLUT-1 appeared intwo non-overlapping subpopulations of boutons (Figure 2A):15% of the terminals (n = 328) showed immunoreactivityfor VGAT, while 85% of them were labeled for VGLUT-1(Figure 2B). To directly compare the localization of Cav2.1in GABAergic and glutamatergic terminals we then analyzedreplicas double labeled for VGAT and the channel subunit.Inhibitory terminals were recognized from immunoreactivityfor VGAT (VGAT+; Figures 2C,D), whereas VGAT− putativeexcitatory boutons were adjacent to postsynaptic dendritic spinesthat were characterized by a high density of IMPs on theexoplasmic face (E-face) of the membrane (Figures 2E,F) that
FIGURE 3 | The number of immunoparticles for Cav2.1 channels ishighly variable and proportional to the active zone area of theboutons. (A) Summary plot (scatter plot: single values, box-, and whiskerplots: median, interquartile range (iqr) as well as minimum and maximum) ofCav2.1 particles in the indicated terminals. Note the lack of differencesbetween the distinct types of boutons (p = 0.22 and p = 0.11),Mann–Whitney test between VGAT+ and VGAT− and between VGAT− andVGLUT-1+ terminals. (B–D) The number of immunogold particles labelingCav2.1 strongly correlated with the convex hull area of both GABAergic andglutamatergic boutons [Spearman correlation coefficient (rs ) = 0.83 forVGAT+; rs = 0.92 for VGAT−; rs = 0.86 for VGLUT-1+].
represent AMPA-type glutamate receptors in the postsynapticmembrane of asymmetrical synapses (Holderith et al., 2012).Immunoparticles for Cav2.1 were highly concentrated in thesynaptic membrane and were distributed non-homogeneouslyover small (Figures 2C,E) and large (Figures 2D,F) activezones of the terminals of both populations of neurons.Similar to VGAT− terminals, excitatory boutons, visualized byimmunoreactivity for VGLUT-1 (VGLUT-1+), showed a non-homogeneous pattern for Cav2.1 distribution: gold particleslabeling the channel protein were confined to the presynapticmembrane specialization where they formed discrete groupsthroughout the active zones (Figures 2G,H).
FIGURE 4 | Rational and operation of the automatized computationalprocedure used for quantitative assessment of immunoparticledistribution. (A) Spatial constraints arising from the Cav2.1 (embedded intothe carbon (C) and platinum (Pt) layers of the replica) labeling by primary andsecondary antibodies (8 nm each) and the gold particle (10 nm).(B) Agglomerative clustering of immunoparticles (black dots) using a maximalinter-particle distance of 42 nm (overlapping circles in red); blue broken linesframe individual clusters of immunoparticles derived by this distanceconstraint (overlapping vs non-overlapping circles). (C,D) Operation of thecomputational procedure: all immunoparticles (black dots) detected in anelectron micrograph are evaluated for inter-particle distances based on their2D-coordinates and grouped into clusters as shown in (B). (C) Application toa set of Cav2.1 particles (left image) resulting in the assignment of two distinctclusters (right image). (D) Comparison of a clustered distribution (‘biological’)determined by the algorithm for a set of Cav2.1 particles in an axon terminal(area given by box framed in red) and a random sample (‘random’) generatedby randomly distributing the same number of particles on an area identical tothat determined in the terminal.
Frontiers in Cellular Neuroscience | www.frontiersin.org 5 August 2015 | Volume 9 | Article 315
Althof et al. Ca2+ channels in hippocampal cells
These results indicate that Cav2.1 channels display similardistribution patterns with clustered appearance in thesynaptic membrane of axon terminals of both GABAergicand glutamatergic neurons in the stratum radiatum ofCA1.
Next we determined the absolute number of Cav2.1immunogold particles in the presynaptic active zones andcorrelated them with the convex hull area of either type ofbouton. These analyses showed that the number of Cav2.1immunogold particles was highly variable ranging from 3 to62 per active zone in all the three subpopulations of axonterminals [median (mdn) = 14 and (interquartile range(iqr) = 10–23] determined in 54 active zones of VGAT+,mdn = 18 (iqr = 11–26) in 67 active zones of VGAT− andmdn = 13 (iqr = 9–23) in 90 active zones of VGLUT-1+neurons from two animals, Figure 3A. These quantificationsrevealed no significant difference between VGAT+ andVGAT− groups of neurons (p = 0.22, Mann–Whitney test),neither between VGAT− and VGLUT-1+ terminals (p = 0.11;Figure 3A). In addition, plotting the number of immunoparticleslabeling Cav2.1 against the convex hull area indicated astrong correlation between the number of Cav channels andthe synaptic area in both inhibitory and excitatory boutons
[Figures 3B–D; Spearman correlation coefficient (rS) 0.83, 0.92,and 0.86 for VGAT+, VGAT− and VGLUT-1+ terminals,respectively].
Together, these analyses showed that the number ofCav2.1 channels, despite clear synapse-to-synapse variation,is proportional to the area of active zones suggesting thattheir overall density in axon terminals of GABAergic andglutamatergic neurons in the stratum radiatum of CA1 is ratherconstant.
Cav2.1 Proteins are Organized in Clusterswithin the Active Zone of BoutonsFor unbiased and quantitative assessment of the distribution ofCav2.1 channels in the active zone, we set up a computationalprocedure performing automatized distribution analysis basedon distances between neighboring immunoparticles (seeMaterials and Methods). Moreover, the underlying algorithmuses agglomerative clustering of particles when their distancesfall below a threshold value that is given by the combined lengthof the primary and secondary antibodies as well as the radius ofthe gold particles (21 nm; Figures 4A,B). Accordingly, particleslocated within distances of ≤42 nm from each other are assignedto a common cluster (Figure 4C).
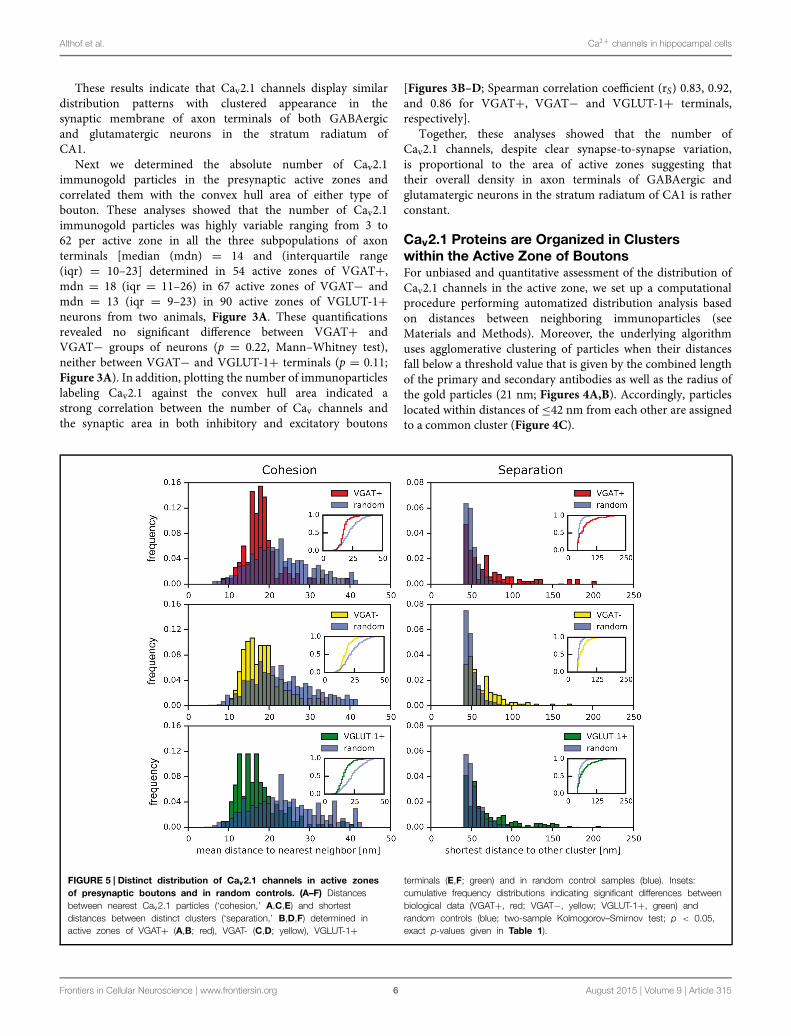
FIGURE 5 | Distinct distribution of Cav2.1 channels in active zonesof presynaptic boutons and in random controls. (A–F) Distancesbetween nearest Cav2.1 particles (‘cohesion,’ A,C,E) and shortestdistances between distinct clusters (‘separation,’ B,D,F) determined inactive zones of VGAT+ (A,B; red), VGAT- (C,D; yellow), VGLUT-1+
terminals (E,F; green) and in random control samples (blue). Insets:cumulative frequency distributions indicating significant differences betweenbiological data (VGAT+, red; VGAT−, yellow; VGLUT-1+, green) andrandom controls (blue; two-sample Kolmogorov–Smirnov test; p < 0.05,exact p-values given in Table 1).
Frontiers in Cellular Neuroscience | www.frontiersin.org 6 August 2015 | Volume 9 | Article 315

Althof et al. Ca2+ channels in hippocampal cells
Using this computer-assisted analysis, we first probed thesignificance of clustered organization of Cav2.1 channelsillustrated above (Figures 1 and 2) over random distribution.For this purpose, we determined the distributions of (i)distances between nearest neighboring particles (‘cohesion,’Figures 5A,C,E) and of (ii) shortest distances between twoclusters (‘separation,’ Figures 5B,D,F), in active zones ofVGAT+, VGAT−, and VGLUT-1+ terminals (biologicaldistribution, Figure 4D, left panel) and in ‘randomcontrols’ (Figure 4D, right panel). For the latter, the samenumber of particles was positioned randomly within thesame area as determined for the respective active zones(red framed box, Figure 4D, and see also Materials andMethods).
As illustrated in Figure 5 and summarized in Table 1,the cohesion determined in the various types of boutonswas almost identical (values for the median of 18 and16 nm for VGAT+, VGAT−, and VGLUT-1+ terminals,respectively), but in either case was significantly stronger thanthe cohesion obtained in random control samples (respectivemedians of 25, 23, and 23 nm, respectively; p < 0.05 two-sample Kolmogorov–Smirnov test, Figures 5A,C,E; Table 1).Conversely, the separation between clusters was significantly
larger in all actual terminals than in random controls (valuesfor the median of 61 and 48 nm (VGAT+), 56 and 48 nm(VGAT−), 58 and 50 nm (VGLUT-1+); p < 0.05 two-sample Kolmogorov–Smirnov test, Figures 5B,D,F; Table 1).These results were independent of the distance constraints,as biological distributions were still significantly differentfrom the respective random controls upon variation ofthe maximal inter-particle distance between 35 and 55 nm(Table 2).
Together, these computational analyses indicated that Cav2.1channels are in fact organized in clusters over the active zones ofboth inhibitory and excitatory axon terminals.
The Nano-Architecture of Cav2.1 Channels isShared between the Active Zones of Inhibitoryand Excitatory BoutonsDirect comparison of cohesion and separation of the Cav2.1clustering did not reveal statistically significant differencesbetween inhibitory and excitatory terminals (Figures 6A–D),strongly suggesting a more general architecture that isshared among presynaptic compartments of differenttypes of neurons. The slight difference observed for thecohesion between VGAT+ and VGLUT-1+ terminals is
TABLE 1 | Analysis of Cav2.1 immunogold distribution in inhibitory and excitatory boutons.
Biological Median interquartilerange (IQR) [nm]
Random Median (IQR) [nm] p-values
Cohesion
VGAT+/random 18 (16–20) 25 (17–27) 5.80E-15
VGAT-/random 18 (15–20) 23 (18–28) 5.70E-20
VGLUT-1+/random 16 (13–20) 23 (18–29) 8.20E-35
VGAT+/VGAT− 0.27
VGAT+/VGLUT−1+ 0.00028
Biological Median interquartilerange (IQR) [nm]
Random Median (IQR) [nm] p-values
Separation
VGAT+/random 61 (46–81) 48 (45–55) 5.10E-12
VGAT−/random 56 (48–71) 48 (45–54) 2.30E-14
VGLUT-1+/random 58 (48–82) 50 (45–59) 2.80E-18
VGAT+/VGAT− 0.22
VGAT+/VGLUT−1+ 0.3
Number of clusters Median(IQR) [particles]
Particles/cluster Median(IQR) [particles]
Cluster diameter Median (IQR) [nm]
Cluster parameters
VGAT+ 2 (1–3) 5 (3–9) 63 (40–110)
VGAT− 2 (1–3) 6 (3–11) 70 (39–110)
VGLUT-1+ 2 (1–4) 4 (2–8) 66 (39–140)
p-values
p (VGAT+/VGAT−) 1 0.59 0.5
p (VGAT+/VGLUT1+) 0.13 0.11 0.35
The cohesion, distances between nearest neighboring particles, in vesicular GABA transporter (VGAT+), VGAT−, and VGLUT-1+ terminals was significantly strongerthan in random control samples, whereas the separation between clusters was significantly larger in all terminals than in random controls. Parameters such as number ofclusters, number of particles for Cav2.1 in individual cluster and diameter of clusters indicate a strikingly similar subcellular arrangement of Cav2.1 channels in inhibitoryand excitatory terminals.
Frontiers in Cellular Neuroscience | www.frontiersin.org 7 August 2015 | Volume 9 | Article 315
Althof et al. Ca2+ channels in hippocampal cells
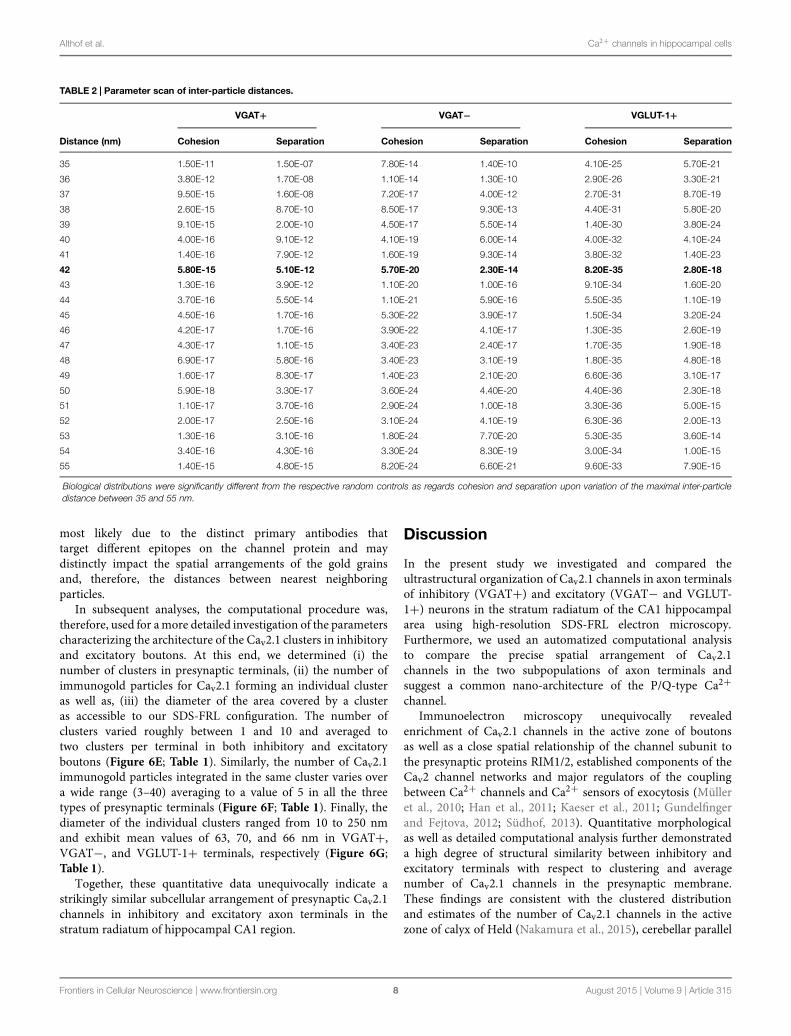
TABLE 2 | Parameter scan of inter-particle distances.
VGAT+ VGAT− VGLUT-1+
Distance (nm) Cohesion Separation Cohesion Separation Cohesion Separation
35 1.50E-11 1.50E-07 7.80E-14 1.40E-10 4.10E-25 5.70E-21
36 3.80E-12 1.70E-08 1.10E-14 1.30E-10 2.90E-26 3.30E-21
37 9.50E-15 1.60E-08 7.20E-17 4.00E-12 2.70E-31 8.70E-19
38 2.60E-15 8.70E-10 8.50E-17 9.30E-13 4.40E-31 5.80E-20
39 9.10E-15 2.00E-10 4.50E-17 5.50E-14 1.40E-30 3.80E-24
40 4.00E-16 9.10E-12 4.10E-19 6.00E-14 4.00E-32 4.10E-24
41 1.40E-16 7.90E-12 1.60E-19 9.30E-14 3.80E-32 1.40E-23
42 5.80E-15 5.10E-12 5.70E-20 2.30E-14 8.20E-35 2.80E-18
43 1.30E-16 3.90E-12 1.10E-20 1.00E-16 9.10E-34 1.60E-20
44 3.70E-16 5.50E-14 1.10E-21 5.90E-16 5.50E-35 1.10E-19
45 4.50E-16 1.70E-16 5.30E-22 3.90E-17 1.50E-34 3.20E-24
46 4.20E-17 1.70E-16 3.90E-22 4.10E-17 1.30E-35 2.60E-19
47 4.30E-17 1.10E-15 3.40E-23 2.40E-17 1.70E-35 1.90E-18
48 6.90E-17 5.80E-16 3.40E-23 3.10E-19 1.80E-35 4.80E-18
49 1.60E-17 8.30E-17 1.40E-23 2.10E-20 6.60E-36 3.10E-17
50 5.90E-18 3.30E-17 3.60E-24 4.40E-20 4.40E-36 2.30E-18
51 1.10E-17 3.70E-16 2.90E-24 1.00E-18 3.30E-36 5.00E-15
52 2.00E-17 2.50E-16 3.10E-24 4.10E-19 6.30E-36 2.00E-13
53 1.30E-16 3.10E-16 1.80E-24 7.70E-20 5.30E-35 3.60E-14
54 3.40E-16 4.30E-16 3.30E-24 8.30E-19 3.00E-34 1.00E-15
55 1.40E-15 4.80E-15 8.20E-24 6.60E-21 9.60E-33 7.90E-15
Biological distributions were significantly different from the respective random controls as regards cohesion and separation upon variation of the maximal inter-particledistance between 35 and 55 nm.
most likely due to the distinct primary antibodies thattarget different epitopes on the channel protein and maydistinctly impact the spatial arrangements of the gold grainsand, therefore, the distances between nearest neighboringparticles.
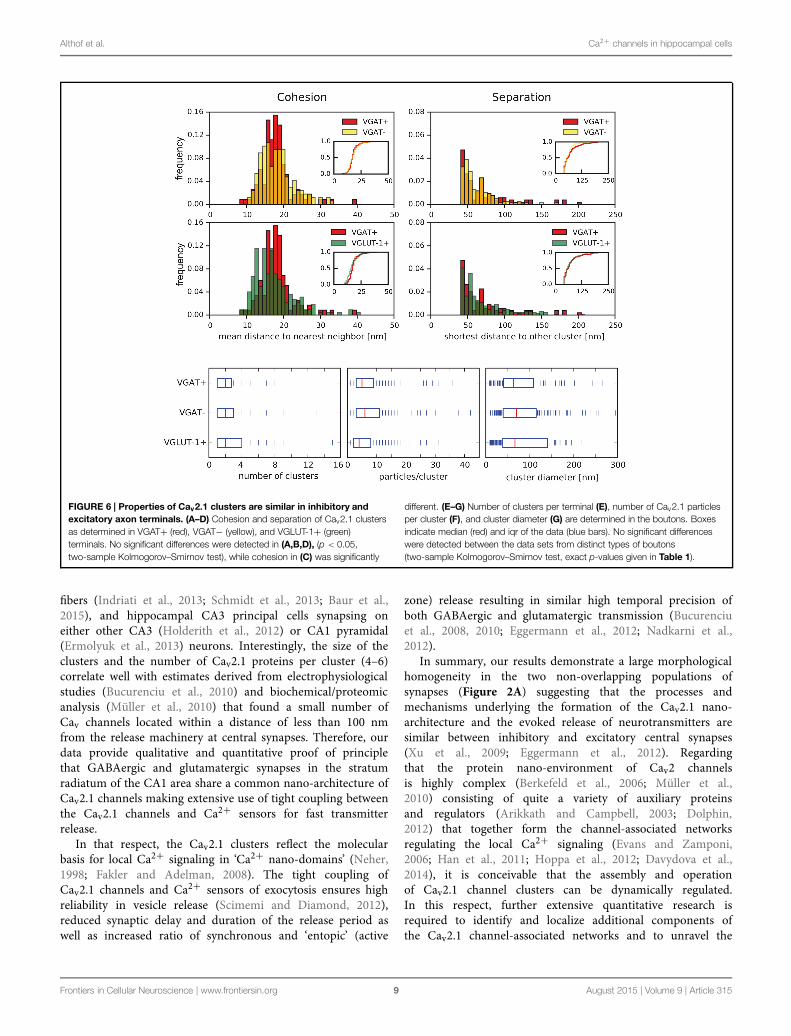
In subsequent analyses, the computational procedure was,therefore, used for amore detailed investigation of the parameterscharacterizing the architecture of the Cav2.1 clusters in inhibitoryand excitatory boutons. At this end, we determined (i) thenumber of clusters in presynaptic terminals, (ii) the number ofimmunogold particles for Cav2.1 forming an individual clusteras well as, (iii) the diameter of the area covered by a clusteras accessible to our SDS-FRL configuration. The number ofclusters varied roughly between 1 and 10 and averaged totwo clusters per terminal in both inhibitory and excitatoryboutons (Figure 6E; Table 1). Similarly, the number of Cav2.1immunogold particles integrated in the same cluster varies overa wide range (3–40) averaging to a value of 5 in all the threetypes of presynaptic terminals (Figure 6F; Table 1). Finally, thediameter of the individual clusters ranged from 10 to 250 nmand exhibit mean values of 63, 70, and 66 nm in VGAT+,VGAT−, and VGLUT-1+ terminals, respectively (Figure 6G;Table 1).
Together, these quantitative data unequivocally indicate astrikingly similar subcellular arrangement of presynaptic Cav2.1channels in inhibitory and excitatory axon terminals in thestratum radiatum of hippocampal CA1 region.
Discussion
In the present study we investigated and compared theultrastructural organization of Cav2.1 channels in axon terminalsof inhibitory (VGAT+) and excitatory (VGAT− and VGLUT-1+) neurons in the stratum radiatum of the CA1 hippocampalarea using high-resolution SDS-FRL electron microscopy.Furthermore, we used an automatized computational analysisto compare the precise spatial arrangement of Cav2.1channels in the two subpopulations of axon terminals andsuggest a common nano-architecture of the P/Q-type Ca2+channel.
Immunoelectron microscopy unequivocally revealedenrichment of Cav2.1 channels in the active zone of boutonsas well as a close spatial relationship of the channel subunit tothe presynaptic proteins RIM1/2, established components of theCav2 channel networks and major regulators of the couplingbetween Ca2+ channels and Ca2+ sensors of exocytosis (Mülleret al., 2010; Han et al., 2011; Kaeser et al., 2011; Gundelfingerand Fejtova, 2012; Südhof, 2013). Quantitative morphologicalas well as detailed computational analysis further demonstrateda high degree of structural similarity between inhibitory andexcitatory terminals with respect to clustering and averagenumber of Cav2.1 channels in the presynaptic membrane.These findings are consistent with the clustered distributionand estimates of the number of Cav2.1 channels in the activezone of calyx of Held (Nakamura et al., 2015), cerebellar parallel
Frontiers in Cellular Neuroscience | www.frontiersin.org 8 August 2015 | Volume 9 | Article 315
Althof et al. Ca2+ channels in hippocampal cells
FIGURE 6 | Properties of Cav2.1 clusters are similar in inhibitory andexcitatory axon terminals. (A–D) Cohesion and separation of Cav2.1 clustersas determined in VGAT+ (red), VGAT− (yellow), and VGLUT-1+ (green)terminals. No significant differences were detected in (A,B,D), (p < 0.05,two-sample Kolmogorov–Smirnov test), while cohesion in (C) was significantly
different. (E–G) Number of clusters per terminal (E), number of Cav2.1 particlesper cluster (F), and cluster diameter (G) are determined in the boutons. Boxesindicate median (red) and iqr of the data (blue bars). No significant differenceswere detected between the data sets from distinct types of boutons(two-sample Kolmogorov–Smirnov test, exact p-values given in Table 1).
fibers (Indriati et al., 2013; Schmidt et al., 2013; Baur et al.,2015), and hippocampal CA3 principal cells synapsing oneither other CA3 (Holderith et al., 2012) or CA1 pyramidal(Ermolyuk et al., 2013) neurons. Interestingly, the size of theclusters and the number of Cav2.1 proteins per cluster (4–6)correlate well with estimates derived from electrophysiologicalstudies (Bucurenciu et al., 2010) and biochemical/proteomicanalysis (Müller et al., 2010) that found a small number ofCav channels located within a distance of less than 100 nmfrom the release machinery at central synapses. Therefore, ourdata provide qualitative and quantitative proof of principlethat GABAergic and glutamatergic synapses in the stratumradiatum of the CA1 area share a common nano-architecture ofCav2.1 channels making extensive use of tight coupling betweenthe Cav2.1 channels and Ca2+ sensors for fast transmitterrelease.
In that respect, the Cav2.1 clusters reflect the molecularbasis for local Ca2+ signaling in ‘Ca2+ nano-domains’ (Neher,1998; Fakler and Adelman, 2008). The tight coupling ofCav2.1 channels and Ca2+ sensors of exocytosis ensures highreliability in vesicle release (Scimemi and Diamond, 2012),reduced synaptic delay and duration of the release period aswell as increased ratio of synchronous and ‘entopic’ (active
zone) release resulting in similar high temporal precision ofboth GABAergic and glutamatergic transmission (Bucurenciuet al., 2008, 2010; Eggermann et al., 2012; Nadkarni et al.,2012).
In summary, our results demonstrate a large morphologicalhomogeneity in the two non-overlapping populations ofsynapses (Figure 2A) suggesting that the processes andmechanisms underlying the formation of the Cav2.1 nano-architecture and the evoked release of neurotransmitters aresimilar between inhibitory and excitatory central synapses(Xu et al., 2009; Eggermann et al., 2012). Regardingthat the protein nano-environment of Cav2 channelsis highly complex (Berkefeld et al., 2006; Müller et al.,2010) consisting of quite a variety of auxiliary proteinsand regulators (Arikkath and Campbell, 2003; Dolphin,2012) that together form the channel-associated networksregulating the local Ca2+ signaling (Evans and Zamponi,2006; Han et al., 2011; Hoppa et al., 2012; Davydova et al.,2014), it is conceivable that the assembly and operationof Cav2.1 channel clusters can be dynamically regulated.In this respect, further extensive quantitative research isrequired to identify and localize additional components ofthe Cav2.1 channel-associated networks and to unravel the
Frontiers in Cellular Neuroscience | www.frontiersin.org 9 August 2015 | Volume 9 | Article 315

Althof et al. Ca2+ channels in hippocampal cells
synapse- and/or state-specific properties of the nano-environments of P/Q-type Ca2+ channels as well as theirconcerted (Wheeler et al., 1994; Spafford and Zamponi, 2003;Williams et al., 2012) implication in the homeostatic control ofcortical synapses function.
Author Contributions
DA, BF, and AK designed the project; DA and DB performedcomputational cluster analysis; DA and AK performed SDS-FRL immunoelectron microscopy; MW provided reagents; NS
provided knock-out tissues; DA, DB, BF, and AK analyzed data;DA, BF, and AK wrote the paper.
Acknowledgments
We thank N. Wernet for technical support; A. Hauptfor help with figures; Drs. Y. Fukazawa and H. Schmidtfor reading the manuscript. This work was fundedby BIOSS-2 A6 (AK) and grants of the DeutscheForschungsgemeinschaft (SFB 746, TP16, Fa 332/9-1 toBF).
References
Amiry-Moghaddam, M., and Ottersen, O. P. (2013). Immunogold cytochemistryin neuroscience. Nat. Neurosci. 16, 798–804. doi: 10.1038/nn.3418
Ariel, P., Hoppa, M. B., and Ryan, T. A. (2013). Intrinsic variability in Pv, RRP size,Ca2+ channel repertoire, and presynaptic potentiation in individual synapticboutons. Front. Syn. Neurosci. 4:9. doi: 10.3389/fnsyn.2012.00009
Arikkath, J., and Campbell, K. P. (2003). Auxiliary subunits: essential componentsof the voltage-gated calcium channel complex. Curr. Opin. Neurobiol. 13,298–307. doi: 10.1016/S0959-4388(03)00066-7
Barber, C. B., Dobkin, D. P., and Huhdanpaa, H. (1996). The quickhullalgorithm for convex hulls. ACM Trans. Math. Softw. 22, 469–483. doi:10.1145/235815.235821
Baur, D., Bornschein, G., Althof, D., Watanabe, M., Kulik, A., Eilers, J., et al.(2015). Developmental tightening of cerebellar cortical synaptic influx-releasecoupling. J. Neurosci. 35, 1858–1871. doi: 10.1523/JNEUROSCI.2900-14.2015
Berkefeld, H., Sailer, C. A., Bildl, W., Rohde, V., Thumfart, J.-O., Eble, S., et al.(2006). BKCa-Cav channel complexes mediate rapid and localized Ca2+-activated K+ signaling. Science 314, 615–620. doi: 10.1126/science.1132915
Bucurenciu, I., Bischofberger, J., and Jonas, P. (2010). A small number of openCa2+ channels trigger transmitter release at a central GABAergic synapse. Nat.Neurosci. 13, 19–21. doi: 10.1038/nn.2461
Bucurenciu, I., Kulik, A., Schwaller, B., Frotscher, M., and Jonas, P. (2008).Nanodomain coupling between Ca2+ channels and Ca2+ sensors promotes fastand efficient transmitter release at a cortical GABAergic synapse. Neuron 57,536–545. doi: 10.1016/j.neuron.2007.12.026
Cao, Y.-Q., and Tsien, R. W. (2010). Different relationship of N- and P/Q-typeCa2+ channels to channel-interacting slots in controlling neurotransmissionat cultured hippocampal synapses. J. Neurosci. 30, 4536–4546. doi:10.1523/JNEUROSCI.5161-09.2010
Catterall,W. A., and Few,A. P. (2008). Calcium channel regulation and presynapticplasticity. Neuron 59, 882–898. doi: 10.1016/j.neuron.2008.09.005
Clapham, D. E. (2007). Calcium signaling. Cell 131, 1047–1058. doi:10.1016/j.cell.2007.11.028
Davydova, D., Marini, C., King, C., Klueva, J., Bischof, F., Romorini, S., et al.(2014). Bassoon specifically controls presynaptic P/Q-type Ca2+ channels viaRIM-binding protein. Neuron 82, 181–194. doi: 10.1016/j.neuron.2014.02.012
Dolphin, A. C. (2012). Ca2+ channel auxiliary a2d and b subunits: trafficking andone step beyond.Nat. Rev. Neurosci. 13, 542–555. doi: 10.1038/nrn3311
Eggermann, E., Bucurenciu, I., Goswami, S. P., and Jonas, P. (2012). Nanodomaincoupling betwen Ca2+ channels and sensors of exocytosis at fast mammaliansynapses. Nat. Rev. Neurosci. 13, 7–21. doi: 10.1038/nrn3125
Ermolyuk, Y. S., Alder, F. G., Surges, R., Pavlov, I. Y., Timofeeva, Y., Kullmann,D. M., et al. (2013). Differential triggering of spontaneous glutamate releaseby P/Q-, N- and R- type Ca2+ channels. Nat. Neurosci. 16, 1754–1763. doi:10.1038/nn.3563
Evans, R. M., and Zamponi, G.W. (2006). Presynaptic Ca2+ channels – integrationcenters for neuronal signaling pathways. Trends Neurosci. 29, 617–624. doi:10.1016/j.tins.2006.08.006
Fakler, B., and Adelman, J. P. (2008). Control of KCa channels by Ca2+nano/microdomains. Neuron 59, 873–881. doi: 10.1016/j.neuron.2008.09.001
Frank, C.A. (2014).How voltage-gated calcium channels gate forms of homeostaticsynaptic plasticity. Front. Cell. Neurosci. 8:40. doi: 10.3389/fncel.2014.00040
Gundelfinger, E. D., and Fejtova, A. (2012). Molecular organization and plasticityof the cytomatrix at the active zone. Curr. Opin. Neurobiol. 22, 423–430. doi:10.1016/j.conb.2011.10.005
Han, Y., Kaeser, P. S., Südhof, T. C., and Schneggenburger, R. (2011). RIMdetermines Ca2+ channel density and vesicle docking at the presynaptic activezone. Neuron 69, 304–316. doi: 10.1016/j.neuron.2010.12.014
Holderith, N., Lorincz, A., Katona, G., Rozsa, B., Kulik, A., Watanabe, M., et al.(2012). Release probability of hippocampal glutamatergic terminals scales withthe size of the active zone. Nat. Neurosci. 15, 988–997. doi: 10.1038/nn.3137
Hoppa, M. B., Lana, B., Margas, W., Dolphin, A. C., and Ryan, T. A. (2012).Alpha2delta expression sets presynaptic calcium channel abundance and releaseprobability. Nature 486, 122–125. doi: 10.1038/nature11033
Indriati, D. W., Kamasawa, N., Matsui, K., Meredith, A. L., Watanabe, M.,and Shigemoto, R. (2013). Quantitative localization of Cav2.1 (P/Q-type)voltage-dependent calcium channels in Purkinje cells: somatodendritic gradientand distinct somatic coclustering with Ca2+-activated potassium channels.J. Neurosci. 33, 3668–3678. doi: 10.1523/JNEUROSCI.2921-12.2013
Kaeser, P. S., Deng, L., Wang, Y., Dulubova, I., Liu, X., Rizo, J., et al. (2011).RIM proteins tether Ca2+ channels to presynaptic active zones via direct PDZ-domain interaction. Cell 144, 282–295. doi: 10.1016/j.cell.2010.12.029
Kisfali, M., Lorincz, T., and Vizi, S. (2013). Comparision of Ca2+ transientsand [Ca2+]i in the dendrites and boutons of non-fast-spiking GABAergichippocampal interneurons using two-photon laser microscopy and high-and low-affinity dyes. J. Physiol. 591, 5541–5553. doi: 10.1113/jphysiol.2013.258863
Klausberger, T. (2009). GABAergic interneurons targeting dendrites of pyramidalcells in the CA1 area of the hippocampus. Eur. J. Neurosci. 30, 947–957. doi:10.1111/j.1460- 9568.2009.06913.x
Kulik, A., Nakadate, K., Hagiwara, A., Fukazawa, Y., Lujan, R., Saito, H., et al.(2004). Immunocytochemical localization of the α1A subunit of the P/Q-typecalcium channel in the rat cerebellum. Eur. J. Neurosci. 19, 2169–2178. doi:10.1111/j.0953-816X.2004.03319.x
Kulik, A., Vida, I., Fukazawa, Y., Guetg, N., Kasugai, Y., Marker, C. L., et al. (2006).Compartment-dependent colocalization of Kir3.2-containing K+ channels andGABAB receptors in hippocampal pyramidal cells. J. Neurosci. 26, 4289–4297.doi: 10.1523/JNEUROSCI.4178-05.2006
Lipscombe, D., Allen, S. E., and Toro, C. P. (2013). Control of neuronal voltage-gated calcium ion channels from RNA to protein. Trends Neurosci. 36, 598–609.doi: 10.1016/j.tins.2013.06.008
Lisman, J. E. (1999). Relating hippocampal circuitry to function: recall of memorysequences by reciprocal dentate-CA3 interactions. Neuron 22, 233–242. doi:10.1016/S0896-6273(00)81085-5
Masugi-Tokita, M., and Shigemoto, R. (2007). High-resolution quantitativevisualization of glutamate and GABA receptors at central synapses. Curr. Opin.Neurobiol. 17, 387–393. doi: 10.1016/j.conb.2007.04.012
Müller, C. S., Haupt, A., Bildl, W., Schindler, J., Knaus, H.-G., Meissner, M., et al.(2010). Quantitative proteomics of the Cav2 channel nano-environments inthe mammalian brain. Proc. Natl. Acad. Sci. U.S.A. 107, 14950–14957. doi:10.1073/pnas.1005940107
Frontiers in Cellular Neuroscience | www.frontiersin.org 10 August 2015 | Volume 9 | Article 315
Althof et al. Ca2+ channels in hippocampal cells
Nadkarni, S., Bartol, T. M., Sejnowski, T. J., and Levine, H. (2010). Modellingvesicular release at hippocampal synapses. PLoS Comput. Biol. 6:e1000983. doi:10.1371/journal.pcbi.1000983
Nadkarni, S., Bartol, T. M., Stevens, C. F., Sejnowski, T. J., and Levine, H.(2012). Short-term plasticity constrains spatial organization of a hippocampalpresynaptic terminal. Proc. Natl. Acad. Sci. U.S.A. 109, 14657–14662. doi:10.1073/pnas.1211971109
Nakamura, Y., Harada, H., Kamasawa, N., Matsui, K., Rothman, J. S.,Shigemoto, R., et al. (2015). Nanoscale distribution of presynaptic Ca2+channels and its impact on vesicular release during development. Neuron 85,1–14. doi: 10.1016/j.neuron.2014.11.019
Neher, E. (1998). Vesicle pools and Ca2+ microdomains: new tools forunderstanding their roles in neurotransmitter release.Neuron 20, 389–399. doi:10.1016/S0896-6273(00)80983-6
Otmakhova, N. A., and Lisman, J. E. (2004). Contribution of Ih and GABAB tosynaptically induced afterhyperpolarizations in CA1: a brake on the NMDAresponse. J. Neurophysiol. 92, 2027–2039. doi: 10.1152/jn.00427.2004
Parajuli, L. K., Nakajima, C., Kulik, A., Matsui, K., Schneider, T., Shigemoto, R.,et al. (2012). Quantitative regional and ultrastructural localization of the Cav2.3subunit of R-type calcium channels in mouse brain. J. Neurosci. 32, 13555–13566. doi: 10.1523/JNEUROSCI.1142-12.2012
Poncer, J.-C.,McKinney, R. E., Gähwiler, B. H., and Thompson, S.M. (1997). EitherN- or P- type calcium channels mediate GABA release at distinct hippocampalinhibitory synapses. Neuron 18, 463–472. doi: 10.1016/S0896-6273(00)81246-5
Schmidt, H., Brachtendorf, S., Arendt, O., Hallermann, S., Ishiyama, S.,Bornschein, G., et al. (2013). Nanodomain coupling at an excitatory corticalsynapse. Curr. Biol. 23, 244–249. doi: 10.1016/j.cub.2012.12.007
Schneggenburger, R., and Neher, E. (2005). Presynaptic calcium andcontrol of vesicle fusion. Curr. Opin. Neurobiol. 15, 266–274. doi:10.1016/j.conb.2005.05.006
Schneider, C. A., Rasband, W. S., and Eliceiri, K. W. (2012). NIH Image to ImageJ:25 years of image analysis. Nat. Meth. 9, 671–675. doi: 10.1038/nmeth.2089
Scimemi, A., and Diamond, J. S. (2012). The number and organizationof Ca2+ channels in the active zone shapes neurotransmitter releasefrom Schaffer collateral synapses. J. Neurosci. 32, 18157–18176. doi:10.1523/JNEUROSCI.3827-12.2012
Sheng, J., He, L., Zheng, H., Xue, L., Luo, F., Shin, W., et al. (2012). Calcium-channel number critically influences synaptic strength and plasticity at theactive zone. Nat. Neurosci. 15, 998–1006. doi: 10.1038/nn.3129
Sibson, R. (1973). SLINK: An optimally efficient algorithm for the single-linkcluster method. Comput. J. 16, 30–34. doi: 10.1093/comjnl/16.1.30
Spafford, J. D., and Zamponi, G. W. (2003). Functional interactions betweenpresynaptic calcium channels and the neurotransmitter release machinery.Curr. Opin. Neurobiol. 13, 308–314. doi: 10.1016/S0959-4388(03)00061-8
Stevens,C. F. (2004). Presynaptic function. Curr. Opin. Neurobiol. 14, 341–345. doi:10.1016/j.conb.2004.04.004
Südhof, T. C. (2013). Neurotransmitter release: the last millisecond in the life of asynaptic vesicle.Neuron 80, 675–690. doi: 10.1016/j.neuron.2013.10.022
Wheeler, D. B., Randall, A., and Tsien, R. W. (1994). Roles of N-type and Q-typeCa2+ channels in supporting hippocampal synaptic transmission. Science 264,107–111. doi: 10.1126/science.7832825
Williams, C., Chen,W., Lee, C-H., Yaeger, D., Vyleta, N. P., and Smith, S. M. (2012).Coactivation of multiple tightly coupled Ca2+ channels triggers spontaneousrelease of GABA. Nat. Neurosci. 15, 1195–1197. doi: 10.1038/nn.3162
Wu, L-G., and Saggau, P. (1994). Pharmacological identification of two types ofpresynaptic voltage-dependent calcium channels at CA3-CA1 synapses of thehippocampus. J. Neurosci. 14, 5613–5622.
Xu, J., Pang, Z. P., Shin, O. H., and Südhof, T. C. (2009). Synamptotagmin-1functions as a Ca2+ sensor for spontaneous release.Nat. Neurosci. 12, 759–766.doi: 10.1038/nn.2320
Conflict of Interest Statement: The authors declare that the research wasconducted in the absence of any commercial or financial relationships that couldbe construed as a potential conflict of interest.
Copyright © 2015 Althof, Baehrens, Watanabe, Suzuki, Fakler and Kulik. Thisis an open-access article distributed under the terms of the Creative CommonsAttribution License (CC BY). The use, distribution or reproduction in other forumsis permitted, provided the original author(s) or licensor are credited and that theoriginal publication in this journal is cited, in accordance with accepted academicpractice. No use, distribution or reproduction is permitted which does not complywith these terms.
Frontiers in Cellular Neuroscience | www.frontiersin.org 11 August 2015 | Volume 9 | Article 315