Embed Size (px)
Citation preview

8/2/2019 Infrastructure 2007 - A Global Perspective
http://slidepdf.com/reader/full/infrastructure-2007-a-global-perspective 1/69
Infrastructure 2007
a global perspective

8/2/2019 Infrastructure 2007 - A Global Perspective
http://slidepdf.com/reader/full/infrastructure-2007-a-global-perspective 2/69
Infrastructure 2007
a global perspective

8/2/2019 Infrastructure 2007 - A Global Perspective
http://slidepdf.com/reader/full/infrastructure-2007-a-global-perspective 3/69
© 2007 by uli–the urban land institute and ernst &
young
Printed in the United States of America. All rights reserved.
No part of this book may be reproduced in any form or by
any means, electronic or mechanical, including photocopy-
ing and recording, or by any information storage and re-
trieval system, without written permission of the publisher.
recommended bibliographical listing:
ULI–the Urban Land Institute and Ernst & Young. Infrastruc-
ture 2007: A Global Perspective. Washington, D.C.:
ULI–the Urban Land Institute, 2007.
ULI Catalog Number: I18
ISBN: 978-0-87420-990-7
cover: The Millau Viaduct in Millau, France.
pages 2–3: A rusting bridge in Middlesex, Vermont. Aging
infrastructure is becoming more apparent as bridges and
roads reach the end of their life cycles.
pages 12–13: The Chicago Skyway was leased to Australia's
Macquarie Infrastructure Group and Spain's Cintra Conce-
siones de Infraestructuras de Transporte S.A. for 99 years.
In return, the city received a one-time lump sum payment of
$1.83 billion (courtesy Skyway Concessions Co., llc).
back cover: The Chicago Skyway (courtesy Skyway Con-
cessions Co., llc).
design and composition:
Marc Alain Meadows, Meadows Design O≈ce, Inc.
www.mdomedia.com
author/editor
Jonathan D. Miller
uli principal researchers and advisers
Maureen McAvey
Executive Vice President
Infrastructure Initiatives
Robert Dunphy
Senior Fellow
Infrastructure and Transportation
Rick Reinhard
Past Managing Director
Infrastructure Initiatives
Rizwan Sheikh
Scholar in Residence
Carl Koelbel
Research Associate
ernst & young advisers
Dale Anne Reiss
Global & Americas Director of Real Estate
Rick Sinkuler
Executive Director
Global Real Estate
Michelle Horner
Marketing Manager
Global Real Estate
Christopher Lawton
Partner
production staff
Nancy H. Stewart
Managing Editor
David James Rose
Manuscript Editor
Betsy VanBuskirk
Art Director
Ronnie Van Alstyne
Former Senior Administrative Assistant

8/2/2019 Infrastructure 2007 - A Global Perspective
http://slidepdf.com/reader/full/infrastructure-2007-a-global-perspective 4/69
Civilizations are built and sustained by the quality of their infrastructure. Next
year, the world marks a major turning point: one out of every two people on
the planet will live in cities—the critical role of infrastructure provision, main-
tenance, and financing rests like never before at the heart of sustainable cities.
Infrastructure is the skeleton around which the city is built. Ranging from radial hub-and-
spoke systems, new town centers, villages, corridors, and current sprawling patterns, infra-
structure dictates how we move and interact with each other. It also can help or detract from
the building of community.
Coincident with these trends has been the declining ability of governments at all levels
worldwide to fund infrastructure as they have traditionally done, through taxation. Fortu-
nately, the world is awash in investment capital looking for secure assets. Urban infrastruc-
ture has begun to emerge as a major investment class promising both income and capital re-
turns.
ULI members at the city and global levels are at the forefront of developing new forms
of infrastructure and in the creation of capital markets products to finance them. When Mar-
ilyn Taylor became chairman of ULI in 2005, she recognized the importance of infrastruc-
ture in this new environment and launched the Infrastructure Initiative. The initiative will
create a heightened awareness of public infrastructure and its essential role in communities
around the world—and will explore new forms of infrastructure financing.This report, funded through the generous support of Ernst & Young, is based on wide
research and four forums that were held in New York, Los Angeles, Mumbai, and Washing-
ton, D.C. These forums, generously funded by James Curtis III, ULI trustee and principal,
Bristol Group, brought together experts from the fields of development, design, finance, en-
gineering, and the public sector. The role of infrastructure in the urban form, the current
state of infrastructure repair and maintenance, and new financing vehicles were highlighted.
Infrastructure 2007: A Global Perspective examines trends in infrastructure and finance
and the nexus between infrastructure and the built environment. Our initial goal is to define
the problem, outline solutions, inspire leadership, and provide case studies to demonstrate
that these goals are achievable. Of critical importance is an increased understanding of the
necessary role that must be played by public finance.
The health and well-being of public infrastructure are a keystone to the Urban Land In-
stitute’s mission to provide leadership in the responsible use of land and in creating and sus-
taining thriving communities worldwide. Infrastructure plays a critical role in every aspect
of community building. Done well, it can make an average development good, and a good
one great. Done poorly, it can sabotage a great development, if not an entire community.
Richard M. Rosan, President
ULI Worldwide
C

8/2/2019 Infrastructure 2007 - A Global Perspective
http://slidepdf.com/reader/full/infrastructure-2007-a-global-perspective 5/69
Contents

8/2/2019 Infrastructure 2007 - A Global Perspective
http://slidepdf.com/reader/full/infrastructure-2007-a-global-perspective 6/69
Part One Infrastructure 2007
Emerging Crisis, Shifting Priorities 4
Issues and Trends ∫ Best Practices
Part Two U.S. and Global Issues
Infrastructure World Overview 14
Asia ∫ China ∫ India ∫ Japan ∫ Singapore ∫ South Korea ∫ Europe ∫ Spain ∫ France ∫
Italy ∫ Germany ∫ Eastern Europe/Russia ∫ Australia and Canada
The State of U.S. Infrastructure 28
Looming Crisis ∫ Deterioration, Congestion, Unreliability ∫ Approaching Train Wreck ∫
Searching for Answers ∫ An Outmoded Model ∫ Rising Driving Costs ∫ Confronting the Reality ∫
Gloal Warming Impetus
Part Three A Road to the Future
Finding a New Model 40
Absent Political Will ∫ Overcoming Bureaucratic Myopia ∫ More Centralized Control ∫ Master
Regional Plans ∫ Understanding Costs ∫ The Outsized Cost of Trucks ∫ Different Challenges/
Modernizing Aging System ∫ Reconfiguring Failing Environments ∫ Visioning Exercises
Infrastructure: Paying the Way 50
Privatization Wave ∫ Investment Funds Proliferate ∫ Attractive Returns ∫ Capturing U.S.
Opportunities ∫ Proponents and Critics ∫ Sharks v. Bureaucrats ∫ Need for Standards ∫
No Magic Solution ∫ Blind Eye to the Big Picture ∫ Narrowed Scope ∫ More Tolls ∫ Higher Taxes
∫ Equitable Cost Burdens

8/2/2019 Infrastructure 2007 - A Global Perspective
http://slidepdf.com/reader/full/infrastructure-2007-a-global-perspective 7/69
Part OneInfrastructure
2007

8/2/2019 Infrastructure 2007 - A Global Perspective
http://slidepdf.com/reader/full/infrastructure-2007-a-global-perspective 8/69

8/2/2019 Infrastructure 2007 - A Global Perspective
http://slidepdf.com/reader/full/infrastructure-2007-a-global-perspective 9/69
We take it all for granted—the networks
of interconnected highways branching
out from cities over bridges and through
tunnels into streets and country roads
to neighborhood culs-de-sac; clean water that may travel
hundreds of miles in aqueducts and mains before reaching
our faucets; electricity that turns on with a flick of a switch
from who knows where; the vast lake system and park cre-
ated by the upriver dam; the airports, the subways, and the
rail service; and the fiber optics that somehow make life as
we know it today possible.
We grudgingly pay income and property taxes, fuel
taxes hidden in the pump price, and, where necessary, tolls
and other user fees like transit fares. The monthly electric
bills have all that small print about surcharges. And we shell
out for the occasional water bill. But who ever thinks about
the true costs of the freeway to the city, the sewage pipes
and water lines, or the levee? And who wants to pay more
taxes or higher bills to maintain and repair them as long as
they seem to be working? Can anyone calculate the conse-
quences of putting off repairs or upgrades beyond the stress
of roadway congestion and displeasure over rust in the tap
water? Most likely, it takes a Hurricane Katrina or a car-falls-
through-a-bridge mishap to help us connect the dots.
Sound infrastructure forms the backbone that is critical
to maintaining and enhancing regional economic growth,
competitiveness, productivity, and quality of life. For busi-
nesses, infrastructure has the greatest influence on location
after tax rates, the availability of an educated workforce, and
low crime. Where time is money, moving people to and from
jobs, facilitating deliveries and shipments, freedom frombusiness interruptions like loss of power, and ample tele-
communications capacity all enter the equation. Prime ac-
cess to ports and airports along global pathways becomes
more essential for expanding enterprise and profits. Con-
gestion and transport bottlenecks, meanwhile, can threaten
regional sustainability.
In countries on every continent, grappling with how to
emerge as winners in the rapidly globalizing economy re-
quires coming to terms with vast challenges for building
and maintaining roads, mass transit, airports, railways, wa-
ter treatment plants, electric grids, schools, hospitals, and
housing. It all takes vast sums of money and massive in-
vestment, which many countries, even the world’s richest,
can no longer afford to pay without substantial increases in
taxes, more borrowing, and new user fees. The bottom line
pulls no punches: “Sustainability of facilities does not come
cheap.”
At budget time, government leaders focus on funding
military and defense, social security, health care, and edu-
cation—all of which are worthy and supported by con-
Emerging Crisis,Shifting Priorities
W

8/2/2019 Infrastructure 2007 - A Global Perspective
http://slidepdf.com/reader/full/infrastructure-2007-a-global-perspective 10/69
introduction: emerging crisis, shifting priorities 5
stituents. Infrastructure increasingly gets put on the back
burner and most places fall miserably short when it comes
to financing needs. Projected funding gaps for infrastruc-
ture are enormous and ominous, especially in the United
States: $1.6 trillion over the next five years. Putting the U.S.
dilemma in sharper relief, the World Bank forecasts Asia’s
infrastructure needs at a relatively modest $1 trillion over the
next five years, led by emerging economic powers China
and India. These countries make infrastructure a national
priority and are racing to build and expand modern infra-
structure in wholesale makeovers to foster growth poten-
tial supported in part by their burgeoning economies. The
United States, in particular, and most of Europe stumble to
repair and retool aging roads, plants, and levees that may
no longer serve a changing paradigm for how people will
live and work in the future.
Typically, breakdowns—bridges washing out, overpass
collapses, dam breaches—must occur before politicians and
voters react to need. Dislocation leads to rushed funding on
an emergency basis with dramatically heightened costs. Too
often, projects focus on restoration rather than rethinking
the model and finding possible e≈ciencies. Indeed, “there
is a tendency to invest in the infrastructure we have instead
of the infrastructure we will need,” warns A Global Per-
spective interviewee.*
“We need to understand that the payoff for infrastruc-
ture often is not delivered until many years after it is built,”
says an interviewee. “The political generation that pays for
it is not usually the political generation that benefits from
the rewards.” Adds another interviewee: “It’s an education
process that moves too glacially. People need to think 20 to30 years ahead and take into account the intergenerational
benefits” rather than the short-term costs. Too often, infra-
structure priorities get caught in shortsighted pork barrel
spending, as politicians seek local favor with expenditures
on high-cost/low-benefit projects like Alaska’s infamous
“bridge to nowhere.” Absent political will and vision, deci-
sive action is lacking.
For starters, governments—federal, state, provincial,
and local—“need to inventory their needs and budgets; es-
tablish priorities for expanding, maintaining, and operating
more e≈ciently; and identify the necessary resources for
funding improvements. “In the United States [and many
other countries], we are falling short on each step.”
Ideally, the political resolve must be found to break
down silos among local, state, and federal government
agencies, and engage in regional master planning. It’s a
failed model to let highway depar tments lobby for extra
lanes and connector roads while the transit authority inde-
pendently pushes to extend subway lines without anybody
thinking about zoning for housing and commercial devel-
opment around exit interchanges and rail stations. Politi-
cians and planners need to grasp the bigger picture—how
integrated networks of roads, mass transit, and sidewalks
can bolster mobility between communities and commercial
districts as well as facilitate the movement of goods and ser-
vices in and out of regions. Sound approaches could relieve
congestion and manage future growth, all with an eye to-
ward reducing pollution.
E≈ciencies can be realized through better regional plan-
ning, which integrates infrastructure expenditures with land
use and population trends. Federal and state grants to local
governments can be structured to encourage integrated re-
gional schemes. Intermodal approaches should be favored
over one-off highway projects or transit stops where the
only pedestrian walks lead to parking lots. Roads, rail, and
mass transit systems should link to walkable neighborhoods
and pedestrian-friendly commercial centers. In addition to
underwriting costs over time, increased reliance on user
fees would help orient behaviors and lifestyles to more
efficient location preferences and reduced dependence on
cars. If owners had to foot the full bill for far-flung infra-
structure enabling their exurban homesteads, would sprawl
development seem so attractive and affordable? “When
people really understand how much something really costs,
they tend to act accordingly.”
Of course, this classic paradigm shift faces daunting hur-
dles: upending established neighborhoods in expensive
retrofits; overcoming entrenched bureaucratic and political
interest groups, including the patchwork of local govern-
ments; changing people’s priorities; and reordering
lifestyles and habits. “It’s human nature—people don’t wantto change if they don’t have to.” And forget about it when
change means paying a lot now for some future hard-to-
grasp reward.
But maybe we must change just to stay competitive and
secure our desirable lifestyles!
For now, the excitement or “smoke” hovers around pri-
vate financing of infrastructure projects and government
sales of infrastructure assets to private concessions. The
United Kingdom propelled the trend under Prime Minister
Margaret Thatcher and other European countries have fol-
lowed suit. Australia and Canada have latched onto pub-
lic/private infrastructure partnerships and India views pri-
vatization as an answer for funding massive infrastructure
needs to support its economic expansion. States and cities
in the United States sow interest in the potential for raising
capital and funding road projects without incurring more
debt or hiking taxes.
Private entities can use equity ownership structures to
reduce the cost of capital and assume the risk for project
overruns. The assumption is that private management also
We need to
understand
that the pay-
off for infra-
structure
often is not
delivered
until many
years after it
is built.
* All quotes in this report are
from interviews conducted
with industry experts. The list
of interviewees can be found
on page 61.
8/2/2019 Infrastructure 2007 - A Global Perspective
http://slidepdf.com/reader/full/infrastructure-2007-a-global-perspective 11/69
6 infrastructure 2007
can drive e≈ciencies through incentives that public man-
agers cannot. Pension funds, financial companies, and in-
vestment banks pour money into infrastructure investment
funds, attracted by predictable, income-oriented returns
and the potential for value gains from development projects.
But whether financing derives from public or private
sources, the public remains on the hook for infrastructure
and expenditures keep rising—construction and repair ex-
penses alone have increased by 50 percent since 1999. Pri-
vate road concessions will charge drivers tolls to meet re-
turn targets at rates considerably higher than customary
under government management. In other public/private
models, the government and private investors negotiate a
long-term payment schedule with the operator taking on
development risk and ongoing expenses for maintaining fa-
cilities, whether roads, schools, or hospitals. The govern-
ment still pays the bill from traditional revenue sources—
taxes or bonds paid off by taxes. Even investment bankers,
who gorge on healthy fees from all these transactions, warn
that privatization “will not be a panacea.” Forecasts suggest
that only about 10 percent of U.S. roads will attract pub-
lic/private partnerships and these will focus mostly on new
interstate and highway construction using toll concessions.
Even in the U.K., where public/private partnerships have
been embraced for more than a decade, only about 16 per-
cent of the country’s infrastructure has been ripe for priva-
tization models, including schools, hospitals, and govern-
ment buildings.
Sorry—there will be no free ride as we begin to tackle
a deferred maintenance crisis and the need to ponder out-
of-the-mold infrastructure solutions. The time has comesuddenly to add infrastructure to that list of costly national
priorities. . . . The country’s very future depends on it!
issues and trends
Infrastructure Becomes a Competitive
Imperative
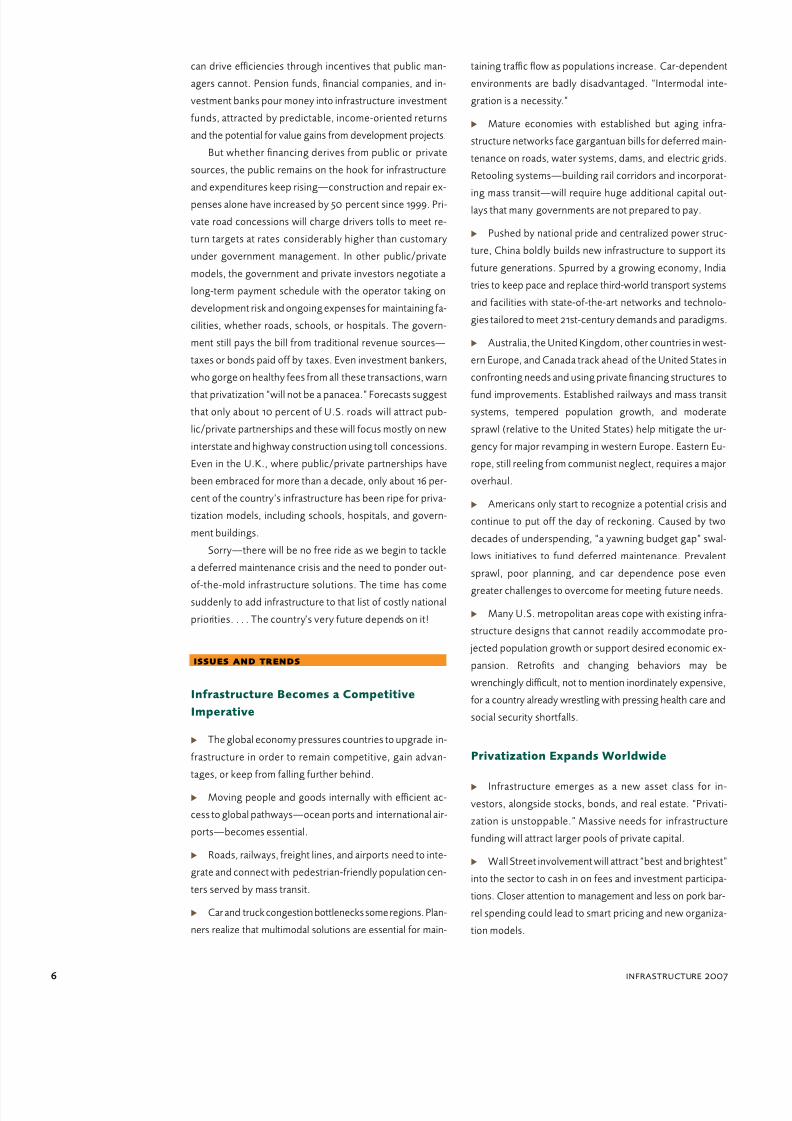
† The global economy pressures countries to upgrade in-
frastructure in order to remain competitive, gain advan-
tages, or keep from falling further behind.
† Moving people and goods internally with e≈cient ac-
cess to global pathways—ocean ports and international air-
ports—becomes essential.
† Roads, railways, freight lines, and airports need to inte-
grate and connect with pedestrian-friendly population cen-
ters served by mass transit.
† Car and truck congestion bottlenecks some regions. Plan-
ners realize that multimodal solutions are essential for main-
taining tra≈c flow as populations increase. Car-dependent
environments are badly disadvantaged. “Intermodal inte-
gration is a necessity.”
† Mature economies with established but aging infra-
structure networks face gargantuan bills for deferred main-
tenance on roads, water systems, dams, and electric grids.
Retooling systems—building rail corridors and incorporat-
ing mass transit—will require huge additional capital out-lays that many governments are not prepared to pay.
† Pushed by national pride and centralized power struc-
ture, China boldly builds new infrastructure to support its
future generations. Spurred by a growing economy, India
tries to keep pace and replace third-world transport systems
and facilities with state-of-the-art networks and technolo-
gies tailored to meet 21st-century demands and paradigms.
† Australia, the United Kingdom, other countries in west-
ern Europe, and Canada track ahead of the United States in
confronting needs and using private financing structures to
fund improvements. Established railways and mass transit
systems, tempered population growth, and moderate
sprawl (relative to the United States) help mitigate the ur-
gency for major revamping in western Europe. Eastern Eu-
rope, still reeling from communist neglect, requires a major
overhaul.
† Americans only start to recognize a potential crisis and
continue to put off the day of reckoning. Caused by two
decades of underspending, “a yawning budget gap” swal-
lows initiatives to fund deferred maintenance. Prevalent
sprawl, poor planning, and car dependence pose even
greater challenges to overcome for meeting future needs.
† Many U.S. metropolitan areas cope with existing infra-
structure designs that cannot readily accommodate pro-
jected population growth or support desired economic ex-
pansion. Retrofits and changing behaviors may be
wrenchingly di≈cult, not to mention inordinately expensive,
for a country already wrestling with pressing health care and
social security shortfalls.
Privatization Expands Worldwide
† Infrastructure emerges as a new asset class for in-vestors, alongside stocks, bonds, and real estate. “Privati-
zation is unstoppable.” Massive needs for infrastructure
funding will attract larger pools of private capital.
† Wall Street involvement will attract “best and brightest”
into the sector to cash in on fees and investment participa-
tions. Closer attention to management and less on pork bar-
rel spending could lead to smart pricing and new organiza-
tion models.

8/2/2019 Infrastructure 2007 - A Global Perspective
http://slidepdf.com/reader/full/infrastructure-2007-a-global-perspective 12/69
introduction: emerging crisis, shifting priorities 7
† Various forms of private/public partnerships offer gov-
ernments the opportunity to retain control, transfer risk of
cost overruns, and gain e≈ciencies from private operators.
† Compared with the U.K. and Europe, the United States
is an emerging market for infrastructure investment, withmany more potential opportunities.
† In Europe, a surfeit of investment players and a dearth
of new investments in mature assets set the stage for a sec-
ondary market where early-in investment banks sell hold-
ings to longer-term pension fund investors who gain
confidence in consistent track records of steady, predictable
income-oriented returns.
† India puts out the red carpet for investors, who will en-
ter the market cautiously over worries about corruption and
bureaucratic hurdles. Only China has the luxury of relying
on its booming economic engine to fund vast infrastructuredevelopment directly.
† Various forms of public/private partnerships may cre-
ate e≈ciencies and reduce some costs for governments, but
taxpayers and users must still pay the bills. In the United
States, political delay will only increase the costs and force
harder choices.
Rates of Return Tighten
† Increasing capital demand will push down return ex-
pectations, but provide greater market liquidity.
† Investors shoot for returns in the low teens, but mature
infrastructure assets will more likely provide high-single-
digit performance with attractive low volatility, somewhat
akin to core real estate.
† More opportunistic players—particularly investment
banks—bankroll development projects, taking on added
risk. Private investor consortiums anticipate selling com-
pleted projects to pension funds and other institutional in-
vestors looking for stabilized assets or turning investments
into public companies.
U.S. Public/Private Partnerships FaceResistance and Early Skepticism
† Political scrutiny will intensify over appropriate transac-
tion models and terms for private toll road concessions.
† State and local governments fret that savvy private in-
vestors may “take them to the cleaners” and look for politi-
cal cover from private consultants, who can help guide them
through best practices learned in other countries.
Substantial urban growth
means that these Indian
workers wait for a barge to
cross the river as a newly
built bridge stands in the
background.

8/2/2019 Infrastructure 2007 - A Global Perspective
http://slidepdf.com/reader/full/infrastructure-2007-a-global-perspective 13/69
8 infrastructure 2007
† Public skittishness will persist regarding turning over
public franchises to private “for profit” operators, some
based offshore, who can raise tolls and fares under con-
cession contracts.
† As a result, some investors worry about “too many re-
strictions” and “overregulation.”
† Critics question the practicality of long concession terms
(up to 99 years) in early deals. Who can predict needs and
requirements 30 or 40 years from now, let alone in the sec-
ond half of the century? Will the Jetsons’ space cars become
a reality by then? No one knows what to expect despite
many contract contingencies.
† Anticipate transaction models to move away from sell-
ing concessions to highest bidders (Chicago Skyway, East-
West Tollway) to revenue-sharing arrangements and avail-
ability contracts for lowest-cost operators.
† Eventually, private/public partnerships in the United
States will extend from initial forays into toll roads to water
supply/treatment, schools, hospitals, public housing, and
even lotteries, following the U.K. model.
† Homeland security issues will hamstring U.S. airport
privatizations. The most tested operators have offshore
pedigrees, a no-no for security o≈cials.
U.S. Road Funding Burden Shifts to States
and Local Governments
† Reluctance to raise the federal gas tax threatens the vi-
ability of the Highway Trust Fund, which could turn insol-
vent by 2009 and create a “train wreck” for funding inter-
state improvements.
† Adjusted for inflation and fuel e≈ciency, the gas tax has
only one-half its purchasing power compared to what it had
in 1965, short-circuiting federal contributions to highway
construction and repair.
† States and particularly local governments must become
more self-su≈cient for funding infrastructure improve-
ments, spurring public/private partnerships and greater re-
liance on user fees.
Trenton, New Jersey, like
many municipalities across
the country, is faced with
repairing or replacing aging
infrastructure.

8/2/2019 Infrastructure 2007 - A Global Perspective
http://slidepdf.com/reader/full/infrastructure-2007-a-global-perspective 14/69
introduction: emerging crisis, shifting priorities 9
† Expect an epidemic of sticker shock as governors and
local leaders come to terms with approaching budget short-
falls and receding federal support.
† Anticipate increases in local sales taxes as well as
greater reliance on tax increment financing (tif).
† Developer impact fees will pay for most new roads and
water/sewer systems. Special tax districts, patterned on
California’s Mello-Roos districts, will be embraced by towns
and counties to fund repairs for local streets and sewers.
Property taxes have nowhere to go but up.
† Disadvantaged areas with declining tax bases will face
substantial challenges to improve facilities and roads. Nine-
to-five cities, weakened by loss of manufacturing industries,
will struggle to fund necessary projects, hastening their de-
clines. Some inner-ring suburbs also suffer. Rural areas may
let roads go back to seed without outside help.
Tolls Will Become More Prevalent,
Driving Costs Increase
† Most new U.S. highways will be constructed as toll
roads—states will finance through bond issues and private
concessions.
† Elected o≈cials initially will resist morphing existing
freeways into toll roads, fearing voter repercussions.
† But over the longer term, funding shortfalls will dictate
greater reliance on tolls for existing roads and transponder
technologies will facilitate toll collections.
† Congestion pricing lanes gain momentum on urbanhighways, but congestion cordons (like London’s) have lim-
ited application, except in 24-hour cities with established
mass transit alternatives to cars.
† Emerging technologies—satellite and gps—will facili-
tate charging drivers based on miles traveled on specific
roads—only 0.08 percent of paved roads in the United
States are tolled. But “Big Brother” hang-ups will deter in-
troduction.
† Trucker lobbies will need to gear up to fight sharply
higher rates for moving goods. Politicos eventually will re-
alize that charging tractor-trailer fleets is more voter friendly
than sticking constituents with repair bills from trucks’ out-
sized damage to roads. They’re just passing through town.
† States may consider tolled truck corridors to facilitate
movement of goods and expanding freight rail corridors to
take pressure off overtaxed roads.
† Other user fees—parking fares and metering—will be-
come more common. Property owners eventually may get
taxed for their parking spaces.
† Despite current resistance, fuel taxes will increase, too.
† Bottom line: Drivers will pay more for the privilege.
Local Governments Begin to Face
Hard Realities
† American government o≈cials and taxpayers have bliss-
fully avoided the consequences of laissez-faire suburban de-velopment generously enabled by a federally funded,
postWorld War II interstate highway boom.
† In particular, high-population-growth metropolitan ar-
eas in the Sunbelt have evolved around multiple commer-
cial nodes and low-density subdivision projects, served al-
most entirely by spiderwebs of roads.
† Major arterials will soon approach the end of typical 50-
year life cycles, needing expensive overhauls. Sewer and
water systems are overburdened, too.
† Congestion, meanwhile, will increasingly overwhelm
existing road systems, designed for lower tra≈c volumes.
Without mass transit alternatives and more high-density
apartment development in commercial centers, these areas
may be unable to sustain projected growth and economic
development. Additional lanes and congestion pricing
strategies will be part of the mix. “All the transit in the world
won’t solve the entire problem.”
† But creating e≈cient hub-and-spoke transit systems
may be next to impossible in the absence of pedestrian-
friendly commercial hubs. Identifying potential rights-of-
way through suburban backyards will prove extraordinarily
contentious.
† Taxes (sales, property, special district) and user fees (tolls,
fuel taxes, parking) will increase dramatically, raising the cost
of living in places where people and businesses had moved
for suburban quiet and convenience on modest budgets.
† At the suburban fringes, escalating impact fees to fund
new streets and sewer lines will discourage greenfield de-
velopers and significantly raise new housing costs.
† Some suburban agglomerations could be severely com-
promised if they cannot find infrastructure solutions to re-
duce congestion.
Environmental Issues Could Foster
Acceptance of Change
† Global warming concerns may turn into a passing fancy,
but they could also help spur greater acceptance of smart
growth principles, which are generally more environmen-
tally friendly.

8/2/2019 Infrastructure 2007 - A Global Perspective
http://slidepdf.com/reader/full/infrastructure-2007-a-global-perspective 15/69
10 infrastructure 2007
† Reducing car pollution and co2 emissions comports
with raising driving fees and encouraging lifestyle changes,
including living in pedestrian-friendly places with nearby
mass transit.
† User fees can exact “pollution” premiums for larger cars
and trucks with poor gas mileage.
† Water quality and availability will become more press-
ing concerns in many places, and could exact development
restrictions. The arid western part of the United States con-
fronts growing demand from expanding populations.
Agribusiness interests, meanwhile, compete for supply.
Runoff from development and population encroachment in
watershed areas threatens water purity in many built-out re-
gions, including the Northeast and Southeast. Rising sea
levels could damage aquifers and infiltrate other fresh wa-
ter sources in vulnerable coastal zones, particularly Florida.
Coping with demand and protecting quality will turn into in-
frastructure priorities. Wind farms and hydropower tech-
nologies could present opportunities for private initiativesto source electric power alternatives.
best practices
Planning
governments need to provide a broad vision for
land use and future infrastructure needs, involving roads,
mass transit, airports, and freight corridors as well as wa-
ter/sewer and power requirements. Integrated, multimodal
solutions require centralized, regional oversight. Parochial
local planning and zoning regulation must defer. “China has
an advantage over the U.S. in this respect.”
to sustain regions, planners must anticipate
needs over the next half-century, not look for short-term
fixes.
transport planners need to focus on the whole
journey, not particular stages of trips. Sidewalks and
roads from neighborhoods need to link effectively to mass
transit and railways that lead to ports, airports, and com-
mercial districts. A “holistic” approach requires under-standing how to move people and freight most efficiently
across regions using multiple options in order to relieve con-
gestion. One-off road building or a new rail link offers a tem-
porary bandage that may shif t traffic, not provide compre-
hensive solutions.
states should use the carrot of grant money
to encourage more uniform, compact transit-oriented de-
velopment by local governments and discourage more
costly infrastructure sprawl models.
zoning behaviors can be changed by linking
transportation and housing grants—for sewer,
water, roads, transit—to more high-density development
along transit corridors. Sprawl-supporting infrastructure
should not be subsidized.
in new transit corridors, station districts
must be zoned to encourage apartment-, retail-, and
pedestrian-friendly multiuse development, enabling people
to walk home or to stores from trains without having to
drive. Stations shouldn’t be designed as islands surrounded
by parking lots and parking decks, the conventional ap-
proach that nurtures dependence on cars.
funding needs to concentrate on high-speed,
intercity rail corridors,supporting regional growth
and providing alternatives to car and short-hop air travel.
Much of the 21,000-mile (33,796-km) national Amtrak net-
work inefficiently serves low-population areas over long dis-
tances. Cross-country railways should focus on increasing
freight shipping to regional distribution centers.
Financing
privatization models should move away from
how governments can get the most dollars for a concession
to models that secure the lowest bidder for providing the
most efficient service as well as revenue sharing in the
efficiency gains. Private operators get paid for running the
concession better with a stake in the ongoing benefits rather
than the government selling an asset for a short-term cash
infusion.
the french “improvisation” system offers guid-
ance on navigating public/private contracts. Long-term
operating agreements can be renegotiated if underlying
conditions change. Special courts rule on modifications, bal-
ancing between a reasonable rate of return and the public
good.
governments need to make bidding and docu-
mentation process more uniform and less onerous
in reviewing privatization proposals from funders and op-
erators. Uniform standards and practices would help speed
up the process and reduce costs, improving clarity without
necessarily compromising thoroughness.

8/2/2019 Infrastructure 2007 - A Global Perspective
http://slidepdf.com/reader/full/infrastructure-2007-a-global-perspective 16/69
introduction: emerging crisis, shifting priorities 11
increased user fees on drivers—tolls, higher fuel
taxes, parking fees, congestion pricing—could have huge
economic benefits. Fee revenues would provide reserves
for infrastructure repair and improvements, while drivers
would be charged more directly for the true cost of their
road use. Auto insurance rates should correspond to miles
traveled in addition to driver history and age. By aligning
pricing with use, market incentives will help adjust behav-
iors to find the most efficient and cost-effective travel as well
as inform decisions on where to live and work.
cost burdens for new local infrastructure—
streets and water mains—should continue to shift to de-
velopers and owners through impact fees and special tax
districts.
the u.s. federal government needs to define its
policy about funding infrastructure, address approaching
highway trust fund insolvency, and decide on possible fuel
tax hikes. Until the feds set their course, state and local gov-
ernments will delay funding decisions, hoping for bailouts.
Changing Behaviors
user fees have similar applicability to electric
and other utility rates. Fixed infrastructure costs for
bringing power into homes are higher per capita in sprawl-
ing, single-family areas than in compact urban centers. But
flat rates that are charged users can distort true costs, sub-
sidizing transmission lines and other infrastructure in sub-
urban areas. Smart metering technology can help electric
users understand costs and how to reduce them.
impose axle taxes on trucks. Passenger cars actu-
ally subsidize trucks on intercity travel since trucks cause
disproportionably more damage to roads than lighter vehi-
cles. Many highways and most local streets have not been
engineered to withstand wear and tear from heavier, wider,
and longer rigs. Weight/distance fees will help pay the bills
and assess costs more fairly. Improved rail corridors could
provide competitive, lower-cost freight-hauling alterna-
tives—more energy efficient and less polluting, too. The Eu-
ropean Union takes regulatory steps to encourage rail
freight through member countries.
travel convenience can be enhanced without
pouring so much concrete. New technologies can
provide information to reduce lost time and travel tedium at
transfer and interchange points. Among the solutions are
the following: improved directional signage, real-time in-
formation on train arrivals at station platforms, up-to-the-
minute information on clogged roads, better lighting and
security in stations to encourage off-peak travel, improved
airport check-in, security clearance, and baggage claim.
controlling traffic flows—through improved in-
formation and congestion pricing—can speed up road travel
without adding lanes. Pricing mechanisms should be con-
venient for drivers and accurately reflect trip costs. Tollsshould reflect peak and off-peak congestion levels in vari-
able pricing schemes and apply to all major thoroughfares.
Rates should be as predictable and easy to understand
as possible. Avoid frequency discounts—they encourage
driving. Provide more choices—transit improvements and
bike lanes.

8/2/2019 Infrastructure 2007 - A Global Perspective
http://slidepdf.com/reader/full/infrastructure-2007-a-global-perspective 17/69
Part TwoU.S. and
Global Issues

8/2/2019 Infrastructure 2007 - A Global Perspective
http://slidepdf.com/reader/full/infrastructure-2007-a-global-perspective 18/69
8/2/2019 Infrastructure 2007 - A Global Perspective
http://slidepdf.com/reader/full/infrastructure-2007-a-global-perspective 19/69
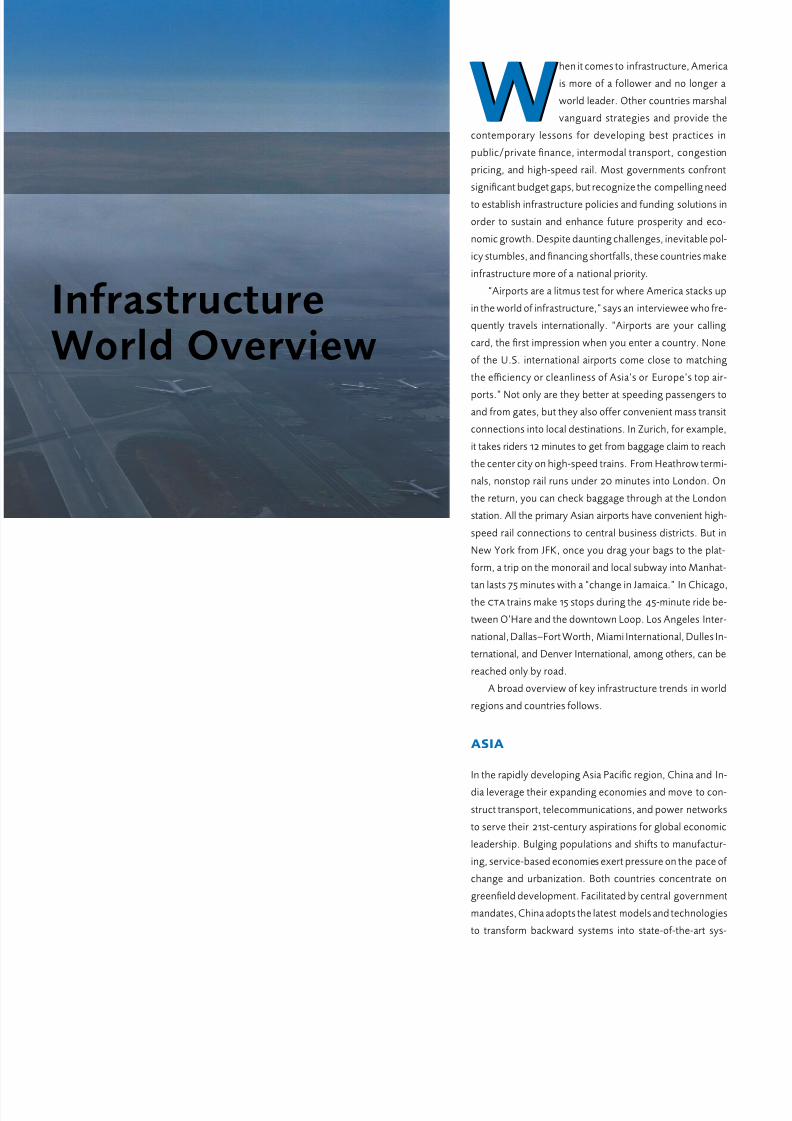
When it comes to infrastructure, America
is more of a follower and no longer a
world leader. Other countries marshal
vanguard strategies and provide the
contemporary lessons for developing best practices in
public/private finance, intermodal transport, congestion
pricing, and high-speed rail. Most governments confront
significant budget gaps, but recognize the compelling need
to establish infrastructure policies and funding solutions in
order to sustain and enhance future prosperity and eco-
nomic growth. Despite daunting challenges, inevitable pol-
icy stumbles, and financing shortfalls, these countries make
infrastructure more of a national priority.
“Airports are a litmus test for where America stacks up
in the world of infrastructure,” says an interviewee who fre-
quently travels internationally. “Airports are your calling
card, the first impression when you enter a country. None
of the U.S. international airports come close to matching
the e≈ciency or cleanliness of Asia’s or Europe’s top air-
ports.” Not only are they better at speeding passengers to
and from gates, but they also offer convenient mass transit
connections into local destinations. In Zurich, for example,
it takes riders 12 minutes to get from baggage claim to reach
the center city on high-speed trains. From Heathrow termi-
nals, nonstop rail runs under 20 minutes into London. On
the return, you can check baggage through at the London
station. All the primary Asian airports have convenient high-
speed rail connections to central business districts. But in
New York from JFK, once you drag your bags to the plat-
form, a trip on the monorail and local subway into Manhat-
tan lasts 75 minutes with a “change in Jamaica.” In Chicago,the cta trains make 15 stops during the 45-minute ride be-
tween O’Hare and the downtown Loop. Los Angeles Inter-
national, DallasFort Worth, Miami International, Dulles In-
ternational, and Denver International, among others, can be
reached only by road.
A broad overview of key infrastructure trends in world
regions and countries follows.
ASIA
In the rapidly developing Asia Pacific region, China and In-
dia leverage their expanding economies and move to con-
struct transport, telecommunications, and power networks
to serve their 21st-century aspirations for global economic
leadership. Bulging populations and shifts to manufactur-
ing, service-based economies exert pressure on the pace of
change and urbanization. Both countries concentrate on
greenfield development. Facilitated by central government
mandates, China adopts the latest models and technologies
to transform backward systems into state-of-the-art sys-
InfrastructureWorld Overview
W

8/2/2019 Infrastructure 2007 - A Global Perspective
http://slidepdf.com/reader/full/infrastructure-2007-a-global-perspective 20/69
infrastructure world overview 15
tems. In India, progress comes more in fits and starts after
decades of neglect. Like the United States and later Japan
in the postWorld War II period, they benefit from bur-
geoning economies, which can propel infrastructure devel-
opment across underutilized expanses. China spends 9 per-
cent of its gross domestic product (gdp) on infrastructure
and India budgets 3.5 percent ($25.5 billion) while aiming to
increase its allocation to 8 percent. By comparison, the
United States budgets $112.9 billion or just 0.93 percent of
its gdp, and sidesteps the reality of a ballooning $1.6 trillion
deficit for necessary upgrades over the next five years.
In contrast to fast-developing China and India, Japan,
South Korea, and Singapore offer examples of how more
mature economies cope with augmenting infrastructure sys-
tems. These countries continue to concentrate spending on
maintaining and modernizing transport networks and other
infrastructure to retain and, where possible, enhance their
economic clout.
China
New infrastructure supports the rapid, almost hell-bent,
modernization of China. “The whole process, which oc-
curred in the West over the last 200 years, has been tele-
scoped in China into the past 15 years,” says an interviewee.
The country completed a vast 25,000-mile (40,233-km)
highway system, comparable to the U.S. interstates, in just
12 years and the Beijing subway expands from 70 to 335
miles (114 km to 540 km) in little more than a decade. Thou-
sands of miles of high-speed rail lines are under construc-
tion to speed up travel between large cities, while airports
are constructed or redesigned to cement the country’s place
along global pathways. Cash, human capital, and national
pride focus on showcasing the Asian juggernaut during the
2008 Olympic Games as a world innovator and economic
power. “They are building like crazy,” investing approxi-
mately $160 billion annually into new projects.
“China is developing from the inside out,” expanding
old cities like Beijing and Shanghai and building 30 new
“sustainable” metropolitan areas, based on traditional neigh-
borhood models with integrated mass transit systems. The
country needs to accommodate vast population movements
from rural regions gravitating to exploding numbers of man-
ufacturing and service jobs, which are concentrated in cities.
Two major hallmarks of China’s approach to building in-
frastructure are centralized planning and emphasis on inte-
grating projects with land use. The country also has in-
vested heavily in research and development, sending
engineers and government o≈cials overseas to learn from
other countries’ best practices as well as mistakes. “Many
government leaders are engineers, who understand the im-
portance of training, research, and regional planning. They
Airports are
your calling
card. . . [and
none of the
U.S. interna-
tional airport
come close to
matching the
e≈ciency or
cleanliness
of Asia’s or
Europe’s top
airports.
new york 8,986
london 7,804
paris 4,986
chicago 1,685
san francisco 1,565
los angeles 1,451
washington, d.c. 1,337
atlanta 412
dallas 397
phoenix 215
figure 1.
Public Transit
Operating Budgets
by City, 2005
millions of $us
Sources: National Transit
Database (U.S. cities);
ratp financial statement
(Paris); Mayor of London's
2005/2006 budget;
exchange rates for
12/31/05.

8/2/2019 Infrastructure 2007 - A Global Perspective
http://slidepdf.com/reader/full/infrastructure-2007-a-global-perspective 21/69
16 infrastructure 2007
understand the importance of investing in research and
technology.”
China’s history of authoritarian rule orients the country
to acceptance of central government mandates and policy
control. “The dictatorship lays down policy and that is the
way.” Regional planning links into national policy, and land
use is integrated around moving people and goods ef-
ficiently. “In the U.S., we talk for years about developing
bullet train corridors and it never happens. In China, they
just do it.” After initial missteps in the early 1990s, Chinese
planners have rejected models based on American subur-
ban development—o≈ce parks and parking decks sepa-
rated by roads from cul-de-sac subdivisions. “At first, they
copied what they saw in the United States and parts of west-
ern Europe—no bike paths and six-lane roads with turning
lanes,” says an interviewee. “But rising oil costs, depen-
dence on Middle Eastern energy sources, and pollution is-
sues had to be addressed.” They realized quickly that “the
Irvine, California, concept” would be counterproductive to
greater energy independence.
While extensive road construction accommodates
ramped-up use of cars, land use policy now emphasizes pro-
viding mass transit and rail service, connecting to pedes-
trian-friendly districts. Beijing plans ten new subway lines
and Shanghai quadruples the size of its underground. New
cities adopt traditional neighborhood design (tnd) princi-
ples of concentrating high-density residential projects
around mass transit stations and retail. “They want to keep
typical walking distance within one-fourth of a mile of sta-
tions.” Bike lanes are incorporated everywhere.
High-speed trains have also been integrated intoChina’s infrastructure strategy. The country launched the
world’s first magnetic levitation train in regular service be-
tween downtown Pudong and the city’s international air-
port, an eight-minute trip with speeds reaching upwards of
270 miles per hour (434 km per hour). Conventional high-
speed rail lines are under construction between Beijing and
Shanghai, and Beijing and Tianjin, among other cities.
Looking ahead, the national government has joined
forces with regional and municipal authorities to form an ex-
pressway development corporation to build, maintain, and
expand highways across the country. “It’s like the Federal
Highway Administration, New Jersey Turnpike Authority,
New York Thruway, and various county and municipal road
departments rolled into one to form a business.” This entity
has issued an initial public offering ( ipo) to create a public
company. “For all our talk in the U.S. about financing and
privatizing infrastructure, we are light years behind China.”
But offshore infrastructure funds have been discour-
aged by China, whose laws limit foreign investment in favor
of domestic control and homegrown talent. Concerns about
Top: This new road to the
Beijing airport can be
quickly built by the highly
centralized Chinese gov-
ernment.
Above: Japan’s bullet trains
are an e≈cient method for
transporting passengers
distances that are too far
to commute by car and too
short to travel by plane.

8/2/2019 Infrastructure 2007 - A Global Perspective
http://slidepdf.com/reader/full/infrastructure-2007-a-global-perspective 22/69
infrastructure world overview 17
Railways provide the primary option for
e≈cient and convenient high-speed in-
tercity transport in many countries.
† The Japanese introdued a network of bullet
trains in 1964 that travel at speeds of close to
200 miles (321 km) an hour between Tokyo and
other major cities.
† In fast-developing China, rail use is increas-
ing at a 30 percent annual clip—an estimated156 million people boarded trains during this
year’s 40-day lunar New Year holiday. Making a
major investment in railways, the Chinese gov-
ernment just completed a $4.2 billion rail line
between Beijing and Lhasa in Tibet, which pow-
ers through mountain passes and the Gobi
Desert over tracks designed to remain stable
in permafrost.
† Taiwan just completed a $15 billion high-
speed line between Taipei and the southern port
of Kaohsiung, reducing travel time from four
hours to 90 minutes. South Korea also builds
bullet train corridors between Seoul and othermajor cities.
† Advanced hub-and-spoke rail systems carry
passengers in and out of primary European cities
where proximity makes for e≈cient travel. Fu-
turistic tgv electric trains power riders at aver-
age speeds of 186 miles (299 km) per hour
through France. High-speed center city to cen-
ter city rail transport between Paris and Lyon
has cut into service by airline competition
significantly. By year-end 2007, high-speed
Chunnel trains are scheduled to begin opera-
tions between London and both Paris and Brus-
sels. The Paris trip will take two hours and 15minutes, and the Brussels route will take under
two hours. Expectations are that the new train
service will substantially reduce air travel be-
tween these European capitals. Germany, Italy,
and Spain also spend heavily on high-speed rail.
Low Rail Use
In the United States, rail travel takes a back seat
to cars and planes. Amtrak’s intercity rail system
carried only 25 million passengers during all of
2006, compared to airlines, which served 712
million. Americans, meanwhile, own more than
200 million automobiles. Less than 5 percent of
Americans commute to work by forms of mass
transit, including trains. Most of those trips con-
centrate in the handful of 24-hour cities, partic-
ularly New York and Chicago. For most people in
fast-growing Sunbelt metropolitan areas devel-
oped around interstates, cars are the only way
to get to their jobs.
Critics point out that Amtrak continues to
operate in the red, incurring a $1 billion deficit in
2006, despite infusions and capital support from
the federal government (recently about $1 bil-
lion annually). Every year, Congress seems to
battle over proposals to privatize or scuttle the
system. Many representatives in far-flung dis-
tricts inevitably vote to support service, but
with major strings attached: unprofitable routes
need to remain available to their constituents.As a result, the Amtrak network extends over
21,000 track miles/33,796 track km (half the size
of the interstate system) to 500 communities in
46 states including a slew of small cities like
Moscow, Idaho; Cheyenne, Wyoming; Burling-
ton, Iowa; and Jackson, Mississippi.
Trailing Behind
While Amtrak extends low-volume passenger
service over nationwide routes, the United
States has fallen well behind other parts of the
world in taking advantage of the potential for
bullet train lines linking cities in densely popu-lated regions, covering distances from 50 up to
250 miles (80 up to 402 km). High-speed rail
service could prove more e≈cient and conve-
nient than either air or car travel, and help re-
lieve growing road and airport congestion in
corridors like Boston/New York/Washington,
D.C., in the Northeast; San Diego/Los Angeles/
San Francisco on the West Coast; Miami/Or-
lando/Tampa in Florida; Houston/Austin/Dallas
in Texas; and Chicago/St. Louis/Kansas City in
the Midwest.
The lone U.S. version of an aerodynamic
tgv-style bullet train, the Acela Express, theo-
retically can travel up to 150 miles (241 km) per
hour on its Northeast route from Washington,
D.C., through Baltimore, Philadelphia, and New
York and up to Boston. But curving rail beds,
conflicts with freight tra≈c schedules on shared
tracks, and various municipal restrictions put the
brakes on bullet trainlike schedules. Without
dedicated, state-of-the-art tracks and freedom
from local speed encumbrances, a reasonable
three-hour timetable for end-to-end Acela ser-
vice appears unattainable. Currently, the 210-
mile (338-km) trip between New York and Wash-
ington actually takes 2.5 hours if everything
clicks, while travel time on the comparable New
York to Boston leg extends to more than three
hours.
Airports and Cars
So if they don’t drive, most intercity travelers in
the Northeast continue to take the airline shut-
tles, which can get them door to door in two to
2.5 hours if everything works, but also means
taking cabs on often jammed roadways, bridges,
and tunnels to get to and from airports. A single
shuttle arrival into LaGuardia Airport can result
in 100 to 200 extra car trips flooding onto the
Grand Central Parkway, while another 150 cabs
and cars may be heading to the terminal for the
next outbound flight. Four shuttle flights leave
LaGuardia for Boston and Washington each hour
while four other planes land. So conservatively,
the shuttles can result in approximately 15,000
car trips each day onto New York’s swollen high-
way system.
Trains drop off passengers in central down-
town locations, which can facilitate use of mass
transit connections or pedestrian routes that
don’t further tax already crammed streets and
highways. Cab rides would presumably cover
shorter intracity distances. Bullet trains also use
less energy per passenger mile than either carsor planes. Faster train service could buttress in-
tercity regional economies, energizing Balti-
more, Philadelphia, New Haven, and Providence
as more convenient support centers for the 24-
hour economic giants: Washington, New York,
and Boston.
Intercity Connections
With the exception of San Francisco, cities in
California, Florida, and Texas do not yet have
the mass transit networks found in Northeast
centers. But bullet train systems could help en-
courage the evolution of more multifaceted 24-hour downtowns with light-rail links to sur-
rounding districts. Service could slow escalating
congestion on major interstates and relieve de-
pendence on cars, at least on the margins.
To make bullet trains work, government reg-
ulators need to fashion dedicated rights-of-way
without local speed restrictions. Resources must
be focused on high-volume corridors where train
service can make a difference in relieving con-
gestion and providing convenient and e≈cient
transportation alternatives. But expanding corri-
dors through heavily populated areas presents
discomfiting environmental and NIMBY chal-
lenges, not to mention extraordinary costs. Ex-perts budget a Sacramento/San Francisco to San
Diego rail link at $60 billion. Refashioning Am-
trak, dropping service to low-population areas,
and/or bringing in private operators won’t make
a dent in that bill. Proven rail systems and tech-
nologies exist, but the United States has not
found the will or a way to take advantage of
them.
The Bullet Train AlternativeR

8/2/2019 Infrastructure 2007 - A Global Perspective
http://slidepdf.com/reader/full/infrastructure-2007-a-global-perspective 23/69
18 infrastructure 2007
corruption and opaque laws also contribute to investors’
skittishness over higher risk. For now, the government has
the considerable luxury of ample resources to pay its own
way, using low-cost labor, tapped from the world’s most
populous nation. “They are willing to do whatever it takes
to pave the way for future growth.” At some point, funding
realities will require at least a modest level of private in-
vestment to stoke continued advances.
India
India’s headlong transformation from cauldron of third-
world dysfunction into global powerhouse will depend on
proliferating infrastructure capacity and refurbishing anti-quated systems—transport, water, utility, and communica-
tions. Overwhelming poverty, endemic corruption, and frac-
tious politics create significant hurdles. State and local gov-
ernments can short-circuit plans for rights-of-way, stalling
road, transmission line, and railway projects, while adding
to costs. But explosive growth in the middle class—now
comprising more than 250 million people—fuels mush-
rooming consumer and capital markets to sustain progress.
Unlike China, India does not have enough cash to self-
finance its considerable infrastructure wish list, although
the country boasts $190 billion in foreign exchange re-
serves to leverage project funding. The finance ministry
encourages an increase in savings by domestic households
to help fund new infrastructure, underscoring concerns
about stymieing economic advances. A proposal underconsideration would create tax-free infrastructure savings
The pan-Himalayan railroad
in Tibet reaches altitudes of
over 16,000 feet (4,877 m)
above sea level and is
indicative of China’s com-
mitment to infrastructure.
france germany italy spain japan taiwan china unitedstates
unitedkingdom
3,000
2,500
2,000
1,500
1,000
500
0
figure 2.
Speeding Forward:
High-Speed Rail by
Nation
in kilometers
ı To be completedby 2020
ı Completed
Source: International
Union of Railways.
Note (below): The Acela
route between Washington,
D.C., and Boston is not con-
sidered a true high-speed
rail because it never reaches
speeds near those of otherhigh-speed rail systems.

8/2/2019 Infrastructure 2007 - A Global Perspective
http://slidepdf.com/reader/full/infrastructure-2007-a-global-perspective 24/69
infrastructure world overview 19
bonds as part of retirement savings plan options. Investors
would be guaranteed a stable return for helping underwrite
essential projects.
The government welcomes (indeed needs) private in-
vestment through public/private partnerships, allowing up
to 100 percent foreign equity in projects, and hopes for an
injection of $320 billion in private capital during the next five
years. But India is somewhat undermined by weakness in
regulatory controls and capacity to evaluate and manage
public/private partnerships. Bureaucracy and corruption
create delays, add costs, and create uncertainties. In addi-
tion, questions abound about ongoing ability to meet long-
term equity and debt financing for projects. The country also
lacks China’s internal engineering and planning resources.
Not shy to innovate, the finance ministry examines us-
ing collateralized debt obligations (cdos) to enable banks
to spread credit risks across a broad group of bond investors
and fund infrastructure products. The country’s capitalist
environment and English legal traditions provide a solid
foundation for growth and give confidence to investors de-
spite the evident impediments. In addition, tax exemptions
have been enacted for infrastructure investments. Such
financial heavyweights as Citigroup and Blackstone commit
to raising capital for a multibillion-dollar infrastructure fund
and an array of investment banks investigate potential deals.
Transport infrastructure needs the most immediate at-
tention, if India is to maintain a gdp growth rate of 7 percent
or better. The country has fewer than 4,000 miles (6,437
km) of interstate-caliber highways. Many major ar terials
leading out of cities are rutted, potholed, and chronically
jammed. About 50 percent of the country’s produce—the-oretically enough to feed all of its people—spoils in transit
or rots in the fields, because of ine≈cient and insu≈cient
road and rail systems. Recent initiatives make significant in-
roads in launching myriad infrastructure projects with set-
backs and lessons learned along the way:
† The government has instituted a sophisticated road pri-
vatization system that includes public/private partnerships
funded by annuities and revenue sharing. Many new roads
will be tolled and privately operated. The prime minister
pushes for rural road development, setting benchmarks and
deadlines. A $12 billion national ring road, connecting In-dia’s major cities, nears completion. Private toll concessions
come into vogue to finance construction. The government
enters into “shadow tolling” arrangements, paying private
partners based on actual usage.
† Brimming with freighters and cargo ships, the country’s
12 major ports fill to capacity and require expansion. The
government pegs $22 billion for new ports and modern-
ization programs. Port construction has been facilitated by
This tra≈c jam in New Delh
illustrates the challenges
inherent in India’s rapid
urbanization.

8/2/2019 Infrastructure 2007 - A Global Perspective
http://slidepdf.com/reader/full/infrastructure-2007-a-global-perspective 25/69
20
allowing more foreign construction companies into the mar-
ket. A $500 million container terminal is under construction
in Kochi, a southwestern city.
† Business travel and tourism growth have been ham-
pered by inadequate airports. A $430 million privately man-
aged international airport is scheduled for completion in
Bangalore next year. Large-scale expansions and facelifts
also are underway at the Mumbai ($515 million), Delhi ($600million), and Hyderabad airports, which have been turned
over to private operators, while the government retains con-
trol of security and air tra≈c control. As part of the transac-
tions, operators gain valuable development rights around
the airports for badly needed new hotels and mixed-use de-
velopment.
† Delhi’s metro has been successful, but maintenance
problems throw monkey wrenches in Mumbai’s subway
service. Bus rapid transit solutions hit practical obstacles—
a lack of roads makes it hard to identify dedicated rights-of-
way and car drivers ignore lane restrictions anyway.
† Railways get short shrift, if only because the system is
relatively functional and long established. In fact, India has
the world’s second-largest rail network. Budget-busting
costs deter interest in high-speed trains. Aging and in-
creasingly rickety, the rail system risks further decline, but
limited resources are directed elsewhere out of greater ne-
cessity, for now.
Despite advances, crime and corruption continue to
mire some infrastructure sectors in third-world conditions
as demand grows for greater capacity:
† Water and sewer systems range from inadequate to
nonexistent. Victorian-era mains and pipes suffer chronic
leaks in major cities. Theft is rampant and water purity is
problematic. Entrepreneurs sell water to city dwellers to en-
sure uninterrupted supplies.
† About 45 percent of Indian households have no power
and transmission quality is poor for those connected to ser-
vice. Peak demand exceeds supply by 15 percent, andgrowth in consumption outstrips new supply, while demand
could double by 2020. Individuals and businesses steal an
estimated 55 percent of electric transmissions. Private in-
vestors show little appetite for investing in desperately
needed power plants and utilities until the government
cracks down effectively on the current ongoing larceny.
In India, progress will be choppy, but government and
business understand the imperatives for pushing infra-
structure initiatives. At least a decade behind China, the
country will be hobbled until its transport network becomes
more advanced and increases capacity to meet its econ-
omy’s potential. Basics like electricity and water delivery
systems must become more dependable.
Japan
Always a technology leader, Japan benefits from bullet train
corridors and new airports with rapid transit connections
into major cities. The government has traditionally budgeted
more than 10 percent of its spending on infrastructure, gen-
erously investing in its transport and utility systems. The
country launched bullet train service in 1964 and featuresone of the most advanced networks of international airports.
Corruption in India has
made international financing
for infrastructure hard to
come by; without it, India’s
infrastructure will remain
stuck in a previous era.

8/2/2019 Infrastructure 2007 - A Global Perspective
http://slidepdf.com/reader/full/infrastructure-2007-a-global-perspective 26/69
infrastructure world overview 21
Significant expansions and upgrades are underway or have
been recently completed at six airports.
Japan’s mountainous island landscapes have oriented
planners to use land e≈ciently and concentrate develop-
ment. “They don’t have ten feet of flat land to work with
anywhere” and earthquake engineering is a priority.“Everything is built to exacting standards and they use
every inch of land to best effect.” Declining and aging pop-
ulation trends remove pressure for vastly expanding road
networks (the nationwide highway system has yet to be
completed), but budgetary deficits for repairs and im-
provements should become more pronounced as sluggish
economic growth and increasing social costs to support
large numbers of senior citizens create imbalances. The
government’s infrastructure budget has been declining as
a percentage of overall spending since 2003, a trend ex-
pected to continue. The country was an early proponent
of public/private financing partnerships in Asia, forming
companies to build and operate ports, airports, road sys-
tems, and telecommunications networks. Unlike the U.K.
financing model, Japanese public/private partnerships limit
risk transfer and operate more on trust, an abiding cultural
governor. Company cartels, tied into the government, con-
trol the bidding process. “The downside is that foreign
companies are kept out and lack of competition increases
costs. The good news is these companies make a lot of
money and invest heavily in R&D.” If budget shortfalls per-
sist, as expected, Japan may open to greater outside in-
vestment by private players.
Singapore
China and India can look directly in their backyard for an ex-
emplar of how inspired infrastructure can drive economic
growth. Singapore, a tiny city-state with only 4.5 million
people, ranks as the world’s 22nd-wealthiest country, op-
erating the world’s largest port and a primary foreign ex-
change center. Its airport, rated among the best in the
world, serves as the aviation hub between Europe and Aus-
tralia as well as for southern Asia. More than 1.3 million peo-
ple a day travel on the country’s advanced rail and light-rail
systems, and more than 2.8 million use its bus network. Van-
guard congestion pricing, meanwhile, helps control tra≈c
in the center city. “This country developed from nothing af-
ter World War II,” says an interviewee who visits often.
“They built prosperity off building some of the world’s best
transport infrastructure and continuing to maintain and up-
grade it.” The latest project involves construction of the air-
port’s third terminal.
canada
united states
australia
france
germany
japan
nited kingdom
spain
italy
china*
india
kilograms of oil equivalent per person
0 1,000 2,000 3,000 4,000 5,000 6,000 7,000 8,000
figure 3.
Energy Consumption
per Capita, 2003
*Includes Taiwan.
Source: World
Resouces Institute.

8/2/2019 Infrastructure 2007 - A Global Perspective
http://slidepdf.com/reader/full/infrastructure-2007-a-global-perspective 27/69
22 infrastructure 2007
South Korea
Another Pacific Rim success story, South Korea’s economic
advances had been propelled by massive government in-
vestment in transport infrastructure—roads, railways, sub-
ways, and airports. One of Asia’s poorest countries at the
end of the Korean War in 1954, South Korea ranks today as
the world’s 11th-largest economy. Despite recent setbacks
precipitated by the 1997 Asian financial crisis, the country
has engaged a phased expansion of its primary international
airport, Incheon, with a goal of positioning the facility as the
primary passenger and cargo hub in northeast Asia. Also,
a major push is underway to expand the nation’s railways,
including completion of a high-speed line between Seoul
and Mokpo. The country keeps building new roads—ten
highway projects are under construction, mostly serving
gridlocked Seoul, which concentrates nearly one-fourth of
the country’s population. On the near horizon, the govern-
ment plans to build a new, $50 billion capital city, 90 miles
(145 km) southeast of Seoul, to help relieve congestion
around the current capital. South Korea ac tively encour-
ages private investment, especially in greenfield toll road
projects, schools, and hospitals; but like Japan, it favors par-
ticipation by domestic players over foreign companies.
EUROPE
Western Europeans were forced to confront the conse-
quences of aging infrastructure sooner than the United
States as their mature economies lagged in the 1970s and
1980s and competitive pressures increased. France and
Spain needed to revamp road networks and the United
Kingdom started facing up to overtaxed road and rail sys-
tems as well as crumbling hospitals and schools. Other
western European countries followed suit with a spur from
formation of the European Union, which seeks to compete
economically against the United States. These nations have
drawn up extensive infrastructure plans, assessing needs
and seeking funding. The European Conference of Minis-
ters of Transport also has been at the forefront for explor-
ing solutions. Many countries encourage partnerships with
private operators to finance and manage infrastructure fa-
cilities, looking to achieve greater e≈ciencies and transfer-
ring risk of cost overruns from governments. In particular,
united states
japan
italy
germany
france
spain
australia
united kingdom
south korea
singapore
china
india
number of cars per 1,000 people
0 100 200 300 400 500 600 700 800
figure 4. Car Ownership by Nation, 2000
Source: “The High
Cost of Free Parking,”
by Donald Shoup.

8/2/2019 Infrastructure 2007 - A Global Perspective
http://slidepdf.com/reader/full/infrastructure-2007-a-global-perspective 28/69
infrastructure world overview 23
many airports have been turned over to private managers.
“We have huge needs for rehabilitation and maintaining ex-
isting facilities,” says one European transport expert. “But
generally we don’t need huge new projects.”
Europe benefits from a tradition of core-centric cities,
towns, and villages and greater reliance on rail and mass
transit alternatives to the car. Biking, motorbiking, and walk-
ing are more accepted there than they are in the United
States for running errands and traveling short distances.
Countries sympathize with global warming concerns, boost-
ing the cause of rail freight over trucks and embracing car-
bon caps. While driving remains overwhelmingly preferred
and desirable for flexibility and mobility, limits placed on car
culture are more common and accepted. Still, growing sub-
urban areas around major cities have not been immune to
increasing congestion and other side effects of traditional
sprawl.
In Europe, car ownership costs more, helping to mod-
erate auto-buying appetites. Some countries like the U.K
even tax car ownership and fuel taxes are significantly
higher than in the United States. The number of toll roads
increases across many countries—“there’s a strong move-
ment in Europe of not leaving drivers the free option.” At
the extreme, Italy’s motorway system is composed of mostly
private toll roads. New motorway construction in the U.K.,
France, Portugal, and Spain, among other countries, will be
funded mostly through privately operated toll road conces-
sions. Even Germany, home of the high-speed Autobahn,
jumps on the bandwagon.
As a result of higher driving-related expenses, car own-
ership per-capita ratios are lower and rails are somewhatmore favored (as well as heavily subsidized). France, for ex-
ample, spends 20 times more per capita on railways than
the United States does. Nevertheless, rail use has declined
steadily among passengers and freight haulers in European
Union countries since 1970. Railways carry only about a 6
percent market share of passenger tra≈c, down from 10
percent in 1970; freight transport captures a 13 percent mar-
ket share, down from 30 percent. But overall, Eurozone
countries want to reverse these trends. They increase bud-
gets to expand railways and political momentum builds for
revitalizing rail use. In 2007, the European Union has moved
to deregulate rail freight and open markets to cross-border
competition with uniform practices. Privatization advocates
suggest that breaking national railway monopolies in coun-
tries like France and Italy will stimulate innovation and en-
able “interoperability” across rail systems throughout the
continent, facilitating transport and reducing costs. They
push for deregulation of passenger trains, too.
In most EU countries, infrastructure decision-making
and land planning tend to be centralized and top down, re-
sulting in more integrated national transport systems and
better-contained suburban growth. “We consciously try to
avoid investments that lead to sprawl, and concentrate on
infill like success stories in the Docklands [London] and
Manchester,” says an interviewee. “Reinvesting in public
transport for central cities is a common strategy. Paris and
other French cities as well as Dublin invest in tramways.”
Light rail has been embraced in many countries. Germany
has the most systems—every large to mid-sized city useslight rail. Eleven cities in France, including Paris, now have
light rail, and six Italian cities have constructed or are plan-
ning light-rail systems. Dublin, Edinburgh, and Barcelona
also have built systems.
Demographic trends, meanwhile, anticipate slow-grow-
ing, graying populations in most countries, with declines
forecast in Italy, Germany, and some central European
states. This outlook suggests slackened new demand on
strained infrastructure systems. The region’s enduring em-
phasis on mass transit will help serve less mobile aging pop-
ulations in urban centers. But government budgets will be
stressed in supporting increased numbers of older citizens
with greater needs and by lower percentages of younger,
working cohorts able to generate tax revenues. As a result,
the privatization wave in Europe will get a further boost as
leaders seek to fill funding gaps.
Sources: 2000 U.S. Census—Journey to Work Survey;
World Watch Institute (international data).
london paris new york washington,
d.c.
san
francisco
atlanta los ang
figure 5. Percentage of People Commuting to Work by Transit, 2003

8/2/2019 Infrastructure 2007 - A Global Perspective
http://slidepdf.com/reader/full/infrastructure-2007-a-global-perspective 29/69
24 infrastructure 2007
United Kingdom
Budget constraints have coaxed the U.K. into becoming the
world leader in implementing public/private partnerships
to make up funding deficits. Nearly 800 so-called private
finance initiative (pfi) projects, totaling $55 billion, are either
underway or operational, involving mostly hospitals,
schools, police stations, and government o≈ce buildings.
About 16 percent of U.K. infrastructure outlays involve pub-
lic/private partnerships, including all major airports and rail-
ways. Most water systems have also been privatized as well
as the gas and electricity industries. The breadth of privati-
zation activities is leading to development of a secondary
market where original investor/operators sell assets to in-
vestment funds. The country has never embraced toll roads,
other than for a handful of bridges and tunnels, but user fees
begin to come into vogue, starting with the London con-
gestion pricing scheme. New road projects, following the
example of the M6 highway in Birmingham (opened in
2005), will likely be tolled and operated privately. Existing
motorways may be turned into toll roads eventually too, if
political opposition tempers. For Brits, driving gets even
more expensive. . . . Extensive U.K. rail networks have been
privatized with decidedly mixed results. Prices have sky-
rocketed—a first-class ticket on the London/Manchester
route costs £250! But trains have better on-time records.
“Tube” fares in London also rise. The public gnashes its teeth
and gets a dose of reality—transport and congestion costs
begin to align more directly with user fees. That’s what hap-
pens when a government no longer chooses to provide all
the necessary funds to build and maintain infrastructureprojects.
Spain
Since 2000, Spain has budgeted more than $120 billion for
an extensive infrastructure and public works makeover
plan, focused on increasing road, rail, port, and airport ca-
pacity throughout the country. An additional $200 billion
has been earmarked through 2020. The country evidences
long-term focus on infrastructure needs and planning to
serve future growth. High-speed rail lines are under con-
struction to link all provincial capitals to Madrid by train
within three hours. About $4.4 billion has been allocated
to modernize and expand the nation’s ports and an addi-
tional $7 billion has been targeted to upgrade airports, in-
cluding large-scale expansions for major international hubs
in Madrid and Barcelona.
The Spanish rank as world leaders in building privately
managed toll roads. After years of neglect during the post-
war Franco era, o≈cials finally determined in the 1960s that
upgrading the country’s deficient road networks would be
essential to boost tourism and help jump-start an ailing
economy. With limited public financing sources, the cash-
strapped government offered toll concessions to private
builder operators, backed by government guarantees to at-
tract foreign loans. Over the next two decades, private com-
panies constructed thousands of miles of new roads criss-
crossing the country, and developed successful financial
models for calculating tolling rates, based on usage and im-
provement costs. Spanish companies have turned their ex-
perience into a major industry, exporting their toll road ex-
pertise for billion-dollar projects across Europe and Latin
America as well as to Canada and most recently the United
States.
France
The French boast the most advanced high-speed rail net-
work in Europe and benefit from one of the world’s most
modern motorway systems after playing catch-up in road
building for most of the postWorld War II period. France’s
nearly 20,000 miles (32,187 km) of railways, the most ex-
tensive in Europe after Germany, e≈ciently move passen-
gers and freight. Its renowned tgv trains have set speed
records, most recently at 357 miles (574 km) per hour, and
link Paris to key French cities like Lyon as well as to desti-
nations in Great Britain, Belgium, the Netherlands, and other
bordering countries.
About three-fourths of France’s 7,400-mile (11,909-km)
motorway system is tolled and managed by various private
and semiprivate companies to which the government hassold concessions through 2032. The government continues
to hold freehold interest in the roads themselves. Beginning
in the 1960s, the privatization process jump-started fund-
ing for needed highway construction, which the govern-
ment could not finance directly. During the 1980s, France’s
then-socialist government attempted to roll back tolls in an
egalitarian gesture, but backed off when it became evident
that the cost to build and maintain roads would become ex-
ceedingly prohibitive. Today, the country moves toward
public/private partnership models to fund new projects with
less state control. France trails only Spain and Italy in
planned infrastructure constructions on the continent.
Among the major projects is a new Paris metro line. Like
other global urban centers, Paris suffers from an inordinate
amount of congestion, but superior metro and rail service
alleviates some of the pain for commuters.

8/2/2019 Infrastructure 2007 - A Global Perspective
http://slidepdf.com/reader/full/infrastructure-2007-a-global-perspective 30/69
infrastructure world overview 25
Italy
Infrastructure suddenly has become a major priority for Italy
after more than two decades of neglect and severe under-
funding. The government got religion when tra≈c bottle-
necks around Rome forced some trucks to sit in lines for five
hours or more before finally inching their way into the cap-
ital city. The country budgets for more than 100 needed
projects ranging from rail and roads to water management,
electricity grids, and ports. An early proponent of high-
speed rail in the 1970s, Italy fell asleep at the switch after in-
troduction of a Rome to Florence line, and now makes up
for lost time. About e7 billion has been spent or budgeted
on expanding bullet train lines and freight transport capac-
ity. New high-speed routes have been recently completed
between Turin and Milan, Milan and Bologna, Bologna and
Florence, and Rome and Naples. Italians accept the toll road
concept—they pay their way on most motorways, which are
operated by private or semiprivate operators. New road
construction will also be tolled and likely financed through
public/private partnerships.
Germany
Germans love their cars almost as much as Americans do
(maybe more)—zipping about on Autobahns free of speed
limits and tolls. But a day of reckoning approaches. Built
during the Nazi era to facilitate military transport, many of
these roads have reached the end of their life cycles when
extensive repairs and makeovers are required. Increasing
truck tra≈c—fivefold since 1970—tears up the motorways,
exacting significant damage and congestion. Germany has
become a European Union crossroads for increasing com-
merce transported between western Europe and the newly
integrated states to the east. The government, meanwhile,
faces a traumatic future marked by declining population,
growing percentages of older Germans, and shrinking rev-
enue sources. In order to fund repairs and improvements,
a shift to user fees is inevitable.
The country has successfully implemented an electronic
tolling system for trucks, many of which are based abroad
and just pass through. But politicians have been reluctant
to impose user fees on individuals, fearing extreme voter
antipathy. Advocates argue that the public needs to under-
stand tolls are a quid pro quo for improved tra≈c flows, up-
Even the notoriously
speedy German Autobahn
not immune to congestion

8/2/2019 Infrastructure 2007 - A Global Perspective
http://slidepdf.com/reader/full/infrastructure-2007-a-global-perspective 31/69
26 infrastructure 2007
Central Europe and eastern
Europe are slowly improving
the decrepit infrastructure
they inherited from the
Soviet Union as this nearly
completed bridge in Hun-
gary illustrates.

8/2/2019 Infrastructure 2007 - A Global Perspective
http://slidepdf.com/reader/full/infrastructure-2007-a-global-perspective 32/69
infrastructure world overview 27
graded roads, and sustained economic benefits. High fuel
taxes are not the only answer. Proponents contend that the
experience of Spain, Italy, and France points to the eventual
acceptance and rationality of tolling roadways. When insti-
tuted, tolling will open the door to various privatization
schemes, modeled on French, Spanish, or Italian systems.
The government will be eager to gain e≈ciencies and real-
ize capital or income from road concession agreements.
Demographic shifts—a 10 percent decline in population
and doubling of seniors by 2050—portend lowering de-
mand for schools and reduced requirements for water/
sewage treatment capacity. Individual car usage is expected
to flatten, but truck tra≈c and air cargo capacity will increase
substantially. The country’s focus will need to shift from
new-build projects to maintenance. Increasing cargo tra≈c
along the country’s vast rail network will also be desirable,
taking pressure off roads.
And speed limits may be coming to the Autobahns, if
European Union rules are imposed.
Eastern Europe/Russia
Russia and eastern Europe must contend with a legacy of sys-
tems built below industry standards and postcommunist
era decline and inattention. These countries’ economies,
while expanding, don’t yet provide the firepower to under-
write a needed wholesale infrastructure revamping. In these
formerly socialist states, energy-related supplies were re-
garded as entitlements and priced artificially low. Gasoline
taxes and tolls were nonexistent. Now, these nations strug-
gle to find resources to rehabilitate their existing road sys-tems to serve more market-based economies. Poland, for
example, has established a national road fund to modernize
its highway networks with revenues raised from fuel sur-
charges. Car ownership had been unaffordable for many
people, who still rely on railways as a primary travel alter-
native. But in Russia, car ownership rapidly expands and
tra≈c around major cities like Moscow can be gridlocked.
Increasing truck tra≈c from trade with western Europe takes
a toll on roads, increasing damage and creating further set-
backs in countries’ ability to keep up with repairs. During
the days of communist rule, most freight had been delivered
by rail. Airports are dated and outmoded. Private invest-
ments have overwhelmingly concentrated in telecommuni-
cations and energy, with only limited participation in trans-
port. Investors will increasingly explore opportunities
mindful of concerns about corruption and lack of trans-
parency in laws and regulations.
Australia and Canada
Australia and Canada are both small-population countries
situated on relatively large, but mostly uninhabited land
masses with populations concentrated in a handful of ma-
jor urban centers. Both countries have relatively mature,
highly developed infrastructure and are following the U.K.
model for financing repairs and funding new projects. They
look to private/public partnerships to help propel new ini-
tiatives, take on risk, and fill voids in direct public funding
from cash-strapped governments that want to temper tax
burdens. Australia, for example, has halved infrastructure
spending from 7.2 percent of gdp in 1970 to 3.6 percent to-
day. Federal, state, and local governments in Australia col-
lectively forecast a need for a$100 billion in new infra-
structure investments over the next ten years. In Canada,
the infrastructure deficit is pegged at can$300 billion
through 2025. Australia, in particular, has been a leader in
developing privatized procurement models, especially for
roads, railways, and airports as well as social infrastructure
for hospitals and schools. More than a$30 billion of Aus-
tralian infrastructure assets are held in publicly traded in-
vestment funds or entities.
Canada’s early public/private partnerships (p3) vary
from province to province, but tend to concentrate on
smaller projects like hospitals, health centers, and water
treatment facilities. A handful of highways, bridge im-
provements, and sports centers have also attracted p3 ven-
tures. Both countries need to provide a more consistent
deal flow pipeline so that private companies gain the in-
centive to staff up and attract the necessary expertise tobid and deliver on projects. The high cost of providing de-
tailed bids and lack of uniformity in bidding/document
processes across jurisdictions deter private players from
entering some markets.

8/2/2019 Infrastructure 2007 - A Global Perspective
http://slidepdf.com/reader/full/infrastructure-2007-a-global-perspective 33/69
Lane closures and road repairs create constant
tra≈c backups, and streets are more potholed. It’s
taking longer to get to work under any circum-
stances. Even on the weekends, highways seem
more congested. You hear stories about water main breaks,
sewage problems, and sinkholes swallowing cars. Katrina
flooded New Orleans and brownouts have been more fre-
quent in the hot summer months. Local property taxes go
up and you hear chatter about higher tolls. Airports have
become a real pain—sometimes getting to the plane takes
longer than the flight time. And except in a few metropoli-
tan areas, trains are quaint memories, not travel options.
Government leaders steer clear of addressing the prob-
lems. No one wants to confront the realities or future needs.
It means raising taxes or finding new revenue sources, and
the politicians have enough problems closing budget gaps
for health care, police, and schools, while trying not to get
thrown out of o≈ce.
In fact, when has a government leader had the inspira-
tion to talk about infrastructure and land use? Has any pres-
idential candidate delivered a policy plank on revamping
and modernizing the country’s roads, rails, airports, and
power grids? Have you heard a bold address lately by a na-
tional leader about securing our economic future and main-
taining our standard of living, based on a grand new vision
for the nation’s infrastructure in the 21st century? Unfortu-
nately, for many congressmen, congresswomen, and sena-
tors, infrastructure policy amounts to securing an earmark,
a few million dollars here and a few million there, for a new
government building or road project back in their home dis-
tricts. Recognition of mounting distress, let alone forthrightinitiative for future action, is sorely lacking.
Looming Crisis
“We’re suffering death by a thousand cuts, and
no one is willing to face up to it,” says an inter-
viewee. “If a crisis isn’t created, then there is no
need for an immediate response.”
So what does it take for a crisis? Another Katrina or 2003
power blackout redux, the pending insolvency of the Fed-
eral Highway Trust Fund in 2009 or the already existing $1.6
trillion deficit in needed infrastructure spending through
2010 just for repairs and maintenance? Or must the Amer-
ican Society of Engineers issue another startling report card
that grades the condition of most U.S. infrastructure seg-
ments as “poor.” (See Figure 6.)
China, our looming global competitor, makes infra-
structure a priority. Other countries in Europe and Asia plan
and implement long-term policies to cope with future
The State of U.S. Infrastructure
L

8/2/2019 Infrastructure 2007 - A Global Perspective
http://slidepdf.com/reader/full/infrastructure-2007-a-global-perspective 34/69
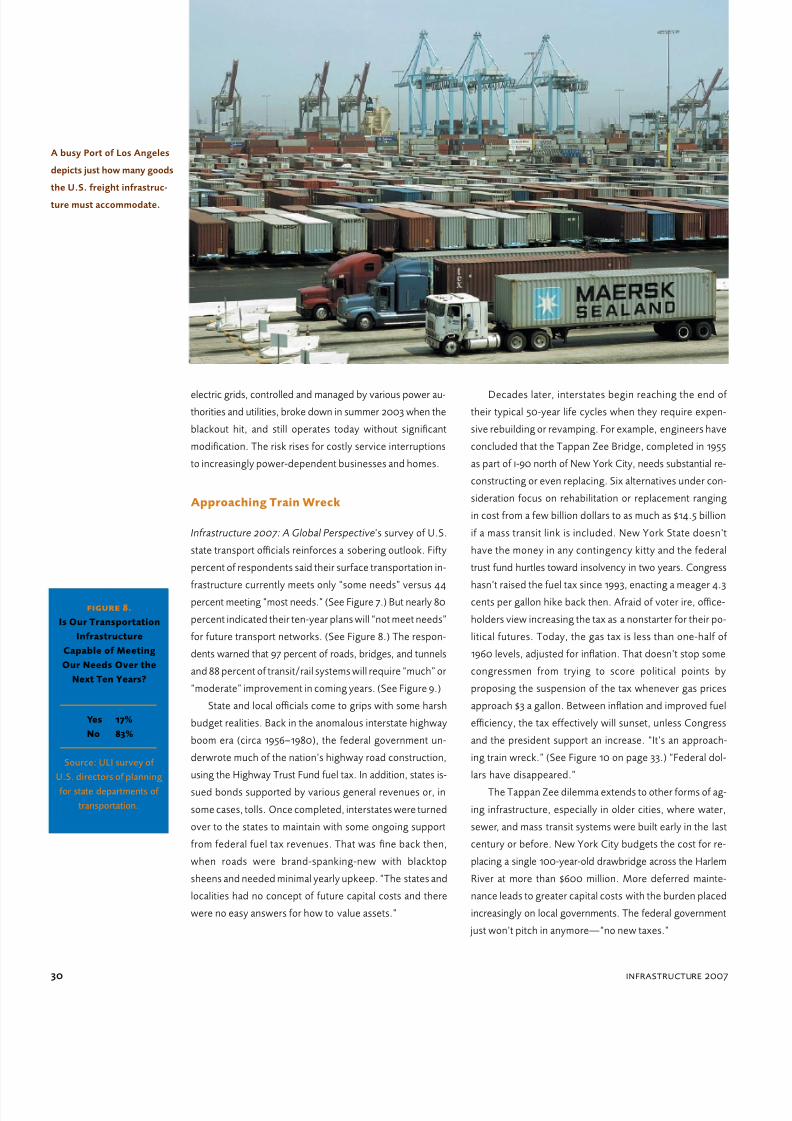
8/2/2019 Infrastructure 2007 - A Global Perspective
http://slidepdf.com/reader/full/infrastructure-2007-a-global-perspective 35/69
30 infrastructure 2007
electric grids, controlled and managed by various power au-
thorities and utilities, broke down in summer 2003 when the
blackout hit, and still operates today without significant
modification. The risk rises for costly service interruptions
to increasingly power-dependent businesses and homes.
Approaching Train Wreck
Infrastructure 2007: A Global Perspective’s survey of U.S.
state transport o≈cials reinforces a sobering outlook. Fifty
percent of respondents said their surface transportation in-
frastructure currently meets only “some needs” versus 44percent meeting “most needs.” (See Figure 7.) But nearly 80
percent indicated their ten-year plans will “not meet needs”
for future transport networks. (See Figure 8.) The respon-
dents warned that 97 percent of roads, bridges, and tunnels
and 88 percent of transit/rail systems will require “much” or
“moderate” improvement in coming years. (See Figure 9.)
State and local o≈cials come to grips with some harsh
budget realities. Back in the anomalous interstate highway
boom era (circa 19561980), the federal government un-
derwrote much of the nation’s highway road construction,
using the Highway Trust Fund fuel tax. In addition, states is-
sued bonds supported by various general revenues or, in
some cases, tolls. Once completed, interstates were turned
over to the states to maintain with some ongoing support
from federal fuel tax revenues. That was fine back then,
when roads were brand-spanking-new with blacktop
sheens and needed minimal yearly upkeep. “The states and
localities had no concept of future capital costs and there
were no easy answers for how to value assets.”
Decades later, interstates begin reaching the end of
their typical 50-year life cycles when they require expen-
sive rebuilding or revamping. For example, engineers have
concluded that the Tappan Zee Bridge, completed in 1955
as part of i-90 north of New York City, needs substantial re-
constructing or even replacing. Six alternatives under con-
sideration focus on rehabilitation or replacement ranging
in cost from a few billion dollars to as much as $14.5 billion
if a mass transit link is included. New York State doesn’t
have the money in any contingency kitty and the federal
trust fund hurtles toward insolvency in two years. Congress
hasn’t raised the fuel tax since 1993, enacting a meager 4.3cents per gallon hike back then. Afraid of voter ire, o≈ce-
holders view increasing the tax as a nonstarter for their po-
litical futures. Today, the gas tax is less than one-half of
1960 levels, adjusted for inflation. That doesn’t stop some
congressmen from trying to score political points by
proposing the suspension of the tax whenever gas prices
approach $3 a gallon. Between inflation and improved fuel
e≈ciency, the tax effectively will sunset, unless Congress
and the president support an increase. “It’s an approach-
ing train wreck.” (See Figure 10 on page 33.) “Federal dol-
lars have disappeared.”
The Tappan Zee dilemma extends to other forms of ag-
ing infrastructure, especially in older cities, where water,
sewer, and mass transit systems were built early in the last
century or before. New York City budgets the cost for re-
placing a single 100-year-old drawbridge across the Harlem
River at more than $600 million. More deferred mainte-
nance leads to greater capital costs with the burden placed
increasingly on local governments. The federal government
just won’t pitch in anymore—“no new taxes.”
A busy Port of Los Angeles
depicts just how many goods
the U.S. freight infrastruc-
ture must accommodate.
figure 8.
Is Our Transportation
Infrastructure
Capable of Meeting
Our Needs Over the
Next Ten Years?
Yes 17%
No 83%
Source: ULI survey of
U.S. directors of planning
for state departments of
transportation.

8/2/2019 Infrastructure 2007 - A Global Perspective
http://slidepdf.com/reader/full/infrastructure-2007-a-global-perspective 36/69
meets all meets most meets some does not
meet most
does not
meet any
50%
40
30
20
10
0
50%
40
30
20
10
0
much
improvement
moderate
improvement
little
improvement
no
improvement
much
improvement
moderate
improvement
little
improvement
no
improvement
60%
50
40
30
20
10
0
figure 7.
Does Transportation
Infrastructure Meet Our
Current Needs?
percentage of
respondents
Source: ULI survey of
directors of planning for
state departments of
transportation.
figure 9.
Impending Crisis for
States? Road and Transit
Improvement Needs
percentage of
respondents
Source: ULI survey of
directors of planning for
state departments of
transportation.
roads, bridges, and highways needs
transit and rail needs
44
62
35
38
50
9
3
3
50
6
the state of u.s. infrastructure 31

8/2/2019 Infrastructure 2007 - A Global Perspective
http://slidepdf.com/reader/full/infrastructure-2007-a-global-perspective 37/69
Was Hurricane Katrina a once-in-a-life-
time cataclysm or a harbinger of
future crises that could befall under-
maintained and obsolescent infrastructure
throughout the United States? Pollyannas can
argue that New Orleans is a special case—a
below-sea-level city in a hurricane zone, which
has always been extremely vulnerable to a mon-
ster storm no matter the manmade protections.
But is it?
When Katrina hit the Louisiana coastline in
August 2005, it became a Category 3 storm, sub-
stantial in fury, but not the worst-case mael-
strom. Even so, levees built and patched over
the past 150 years breached and overflowed.
Outmoded flood control systems failed. For
decades, o≈cials knew that levees had been
slowly sinking and realized protective barrier is-
lands and wetlands along the coast had been de-
stroyed by reengineering the flow of the Missis-
sippi River. Tests had predicted system failures
in the event of a big storm. A patchwork of local
levee districts and the Army Corps of Engineers
undertook ad hoc repairs, but political initiative
was lacking to initiate the expensive steps to
shore up the entire flood protection system and
fend off potential catastrophe. Every layer of
government—federal, state, and municipal—
balked at such a multibillion-dollar proposition.
The price tag for taxpayers was too high, but a
fraction of the $110 billion in federal aid commit-
ted in the storm’s wake. And the future of New
Orleans remains in doubt, clouded in a fiscal
morass and the enduring dilemma of its exposed
location.
More Red Flags
Experts point to the fast-growing Sacramento/
San Joaquin River Delta in California as the next
disaster waiting to happen. Katrina helped en-
ergize state voters to enact a $9.5 billion bond
issue to upgrade sinking, undermined levees
around the low-lying capital district that leave
hundreds of thousands of people at risk and
threaten the viability of the state’s drinking wa-
ter system. Despite obvious erosion and seep-
age throughout the extensive and aging 1,000-
mile (1,609-km) levee network as well as the
occasional breach (Stockton suffered $90 mil-
lion in flood damage in 2004), governmento≈cials in recent decades not only sidestepped
necessary upgrade expenditures, but also en-
couraged widespread tract suburban develop-
ment on farmland and other flood plains di-
rectly in the bull’s eye of disaster scenarios.
Engineers warn that planned enhancements
from the recent bond issue will not shore up
levees enough to sustain damage from pre-
dicted 6.5 earthquakes or worse that could
strike the region at any time. Suburban devel-
opment, meanwhile, continues to mushroom as
people leave expensive communities near the
California coast for more affordable areas in-
land. If the Cassandra warnings ever come true,
$9.5 billion will seem like a drop in the bucket
compared to possible damage.
Unfortunately, New Orleans and Sacramento
may represent the tip of the iceberg when it
comes to vulnerable flood control infrastructure
in the United States. Dam and levee systems
around Lake Okeechobee in Florida are ripe for
disaster in the event of a major hurricane. Katri-nalike breaches could flood once-agricultural
areas, more recently converted into swaths of
suburban subdivisions. In early 2007, the Army
Corps of Engineers identified 120 levees around
the country that could fail in a major flood. Most
of these endangered levees were built genera-
tions ago in underpopulated areas without the
benefit of today’s more state-of-the-art engi-
neering. They are located in and around major
metropolitan areas like Washington, D.C., Seat-
tle, Portland (Oregon), Honolulu, Jacksonville,
and Albuquerque. In one example, the “high risk”
Wolf Creek Dam in Kentucky, which secures a
$150 million local tourist industry, potentially
puts Nashville at risk to major downriver flood-
ing. The Army Corps estimates that the dam will
need more than $300 million in buttressing re-
pairs. Separately, the American Society of Civil
Engineers has identified 3,500 unsafe dams na-
tionwide and more than $10 billion in repairs
over the next decade necessary to address criti-
cal, life-threatening situations. The dangers will
escalate as more development occurs down-
stream from noncompliant structures and other
dams will continue to deteriorate without proper
maintenance. The total investment needed to
bring all 79,000 dams nationwide into safety
compliance totals $30 billion, while the federal
government provides less than $10 million annu-
ally to the states for such programs. Most cash-
strapped states do not give dams and levees
high priority either.
A combination of underfunding, unchecked
development, and a blind eye to obvious dan-
gers suggests taxpayers face a choice of paying
more today or multiples tomorrow for a poten-
tial cascade of predictable, tragic Katrinalike
outcomes.
Hurricane Katrina in 2005 exposed the degree
to which some of the nation’s dams and levees
had deteriorated.
Katrina’s Lessons:Pollyanna v. Cassandra
W
32 infrastructure 2007

8/2/2019 Infrastructure 2007 - A Global Perspective
http://slidepdf.com/reader/full/infrastructure-2007-a-global-perspective 38/69
the state of u.s. infrastructure 33
Searching for Answers
So what is happening to the Tappan Zee? Sections are rust-
ing badly, small concrete slabs fall from road beds exposing
see-through views of the Hudson River below, as 135,000
cars travel this key suburban route every day. Something
has to be done soon: “We’re studying options,” says a state
Thruway o≈cial, who adds the next step is figuring out how
to pay for whatever plan is chosen. Nationwide, countless
other roads, bridges, and tunnels will need extensive recla-
mation in coming years, too. An estimated $185 billion in ad-
ditional funding will be required for road systems over thenext five years alone. “The state of the deferred mainte-
nance is so gargantuan nobody knows where to begin.”
“The gap is so big, people are overwhelmed.” Meanwhile,
annual construction costs ratchet up as China and other
countries compete to buy raw materials for their ongoing
projects.
As the federal government pushes the infrastructure
burden down, states, counties, and cities search for an-
swers. Until now, procrastination has been the favored strat-
agem. “States have been putting off these issues to fund
other needs. It’s not the same economic consequences as
when a landlord puts off building upgrades and tenants
won’t rent. People will still use the roads until they can’t be
used, and as long as the roads work they can put it off.” If
that sounds like the Katrina principle, maybe it is. But the
bridge doesn’t need to collapse for insidious consequences
to hit home. Rough roads and lane closures stall tra≈c and
create delays—productivity declines hurt businesses and
increase costs in lost time, gasoline bills mount, and vehi-
cles suffer more wear and tear. When neighborhood streets
crumble and sidewalks crack, property values eventually
take a hit. Places already struggling to hold their tax base—
particularly inner-ring suburbs and many urban districts—
won’t be able to keep up with repairs and their downward
spiral escalates. Many rural roads just go to seed. “That’s
when the public may wake up and something hits the fan.”
States and localities take baby steps in confronting fund-
ing shortfalls. They patch asphalt to buy time, hike property
taxes, set up special tax districts, impose tax increment
financing schemes, and force developers to pay impact fees
for new roads and sewers. Governors uneasily float ideas
like raising tolls or sales taxes. Bond issues for projects re-main popular by putting off today’s bills until tomorrow, but
1965 1970 1975 1980 1985 1990 1995 2000 2004
figure 10.
Fuel Tax Purchasing
Power Has Decreased
Significantly
2006 cents per mile
Sources: Bureau of
Transportation Statisitics
(average miles per gallon);
American Petroleum Insti-
tute (fuel tax per gallon).
5
4
3
2
1
0
The Tappan Zee Bridge in
New York, here battered
by a frozen Hudson River,
is in dire need of repair orreplacement.

8/2/2019 Infrastructure 2007 - A Global Perspective
http://slidepdf.com/reader/full/infrastructure-2007-a-global-perspective 39/69
34 infrastructure 2007
they can create current problems by lowering state credit
ratings and raising overall borrowing costs, which taxpay-
ers eventually pay. Departments of transportation create
high-occupancy vehicle (HOV) lanes, and some even pon-
der the idea of congestion lane pricing.
An Outmoded Model
But money—or the lack of it—is just part of the enormous
problem. Even if you could repair all existing infrastructure
and make it safe, the transport and land use models devel-
oped for suburbanizing America in the late 20th century al-
ready may no longer work for the future. Unfortunately, dis-
connection and lack of integration characterize the evolution
of recent American land use and infrastructure schemes.
Most of the nation’s fastest-growing areas are diffuse sub-
urban agglomerations built around interstate hubs with mul-
tiple commercial cores held together by serpentine road and
street networks. Neighborhoods end in culs-de-sac. Retail
strips separate from o≈ce parks. Parking decks and lots sur-
round o≈ce buildings and malls. Totally car dependent, peo-
ple need to drive to get anywhere or do anything except
maybe visit their neighbor across the street. Sidewalks usu-
ally are an afterthought and, where they exist, end at sub-
division property lines. Even in metropolitan areas with new
light-rail or subway service, most people need cars to reach
mass transit from home. The average commuter drives 39
miles (62.7 km) in Houston and 31 miles (49.8 km) in Atlanta,
compared with 17 miles (27.3 km) in the New York area.
Poorly conceived without any regional planning, these dis-
jointed areas become even more ine≈cient and costly as
they struggle to accommodate growth.
Rising Driving Costs
Following the experience of southern California, tra≈c con-
gestion and car pollution levels begin to throttle popular
Sunbelt agglomerations like Atlanta, Dallas, Houston, and
Phoenix. Tra≈c along the i-95 corridor in south Florida and
around the northern Virginia suburbs near Washington,
D.C., can turn nightmarish, too. (See Figure 13.) In these
high-growth places, everybody of driving age needs a car
for mobility, and because jobs, homes, and stores are dis-
persed throughout the region, everyone heads in different
directions to get around. More family cars translate into
more car loan payments and insurance premiums. Fuel
costs increase and higher user fees (tolls, congestion pric-
ing schemes) are inevitable. These metropolitan areas,
meanwhile, could double in size over the next generation.
Forecasters predict that current rush-hour trips in Atlanta
could take 70 to 80 percent longer by 2030. Driving be-
comes steadily more expensive and consumes more time,
offsetting more affordable housing prices and affecting
quality of life.
jan. 1999 jan. 2000 jan. 2001 jan. 2002 jan. 2003 jan. 2004 jan. 2005 jan. 2006
150
140
130
120
110
100
figure 11.
Highway ConstructionCosts Have Skyrocketed
indexed january 1999
Source Bureau of Labor
Statistics Producer Price In-
dex for Highway and Street
Construction.

8/2/2019 Infrastructure 2007 - A Global Perspective
http://slidepdf.com/reader/full/infrastructure-2007-a-global-perspective 40/69
the state of u.s. infrastructure 35
Source: bts (vehicle miles traveled) fhwa (roadway lane miles).
figure 12. While the Distances Traveled by Car Have Increased, the Amount of Roadway Has Remained Static.
indexed miles (1990)
1990 1991 1992 1993 1994 1995 1996 1997 1998 19999 2000 2001 2002 2003
135
130
125
120
115
110
105
100
95
90
atlanta
dallas
boston
chicago
washington, d.c.
new york
phoenix
san francisco
0% 50 100 150 200 250 300 350
figure 13.
Congestion Is Spreading:
Percentage Increases in
Travel Delay, 1982–2003
Source: Texas Transportation
Institute, 2005 Urban Mobil-
ity Report.

8/2/2019 Infrastructure 2007 - A Global Perspective
http://slidepdf.com/reader/full/infrastructure-2007-a-global-perspective 41/69
Always in the vanguard, California faces
up to the costly realities of renewing
aging infrastructure by trying to pre-
serve its freeway lifestyle without raising taxes
and resorting to unpopular user fees. Passed in
November 2006, a record $37 billion state public
works bond issue takes a stab at averting a fu-
ture crisis—Governor Arnold Schwarzenegger
had wanted $68 billion and many observers be-
lieve the approved funding will be inadequate tomeet future needs. But unlike many states, Cali-
fornia has made some headway and taken action.
California’s dance over infrastructure bud-
gets informs political calculations across the
United States. For all the red flags about deteri-
orating roads, bridges, and dams, voters and
their elected representatives are not willing yet
to address the true costs of necessary improve-
ments and don’t want to impose on themselves
the higher expenses to pay for them. Somehow,
“no new taxes” means you can still have all the
goodies that the government is supposed to pro-
vide like uncongested highways, extra lanes of
freshly paved blacktop, new schools, sewage
treatment, and levees that won’t breach.
Lifestyles dependent on cars become less at-
tractive and more expensive when user fees
are imposed. And most Americans today live in
suburban places where cars are their lifelines.
Southern California has been the model for
road-based horizontal development, which has
spread across the rapidly expanding Sunbelt.
Significant population growth in these areas will
stress current overloaded facilities even more.
Looming Problems
While newer vintage ring roads and interstate
connectors snake around Atlanta, Dallas, and
Phoenix, many of California’s fabled highways—
including 4,700 freeway miles (7,564 km)—ap-
proach old age. Without constant maintenance,
these roads will deteriorate more quickly and
many experts agree a decline in road quality
could lead to greater congestion, business inter-
ruptions, declining employment growth, and im-
paired property values. In fact, the truck bottle-
necks coming out of Los Angeles/Long Beach
ports have many shippers looking for alternative
harbor destinations. San Francisco offers supe-
rior mass transit, but southern California strug-
gles to find multi-modal solutions in heavily
built-out suburbs to temper the car culture.
Every mile of new subway in Los Angeles is a
multibillion-dollar proposition.
The state’s record public works bond mea-
sure earmarks $20 billion for transport, $10 bil-
lion for school construction, $4 billion for levees,
and $3 billion for affordable housing built near
mass transit. As a result, about 6 percent of the
state’s general fund tax revenues will be needed
to pay debt service. California’s relatively high
level of borrowing has decreased the state’scredit ratings and increased the interest premi-
ums paid on its bonds. One way or another, addi-
tional costs are pushed onto taxpayers.
Avoiding Gas Taxes and Tolls
In going the bond issue route, the governor and
legislature rejected increasing gas taxes and em-
bracing additional toll roads, which charge users
more directly. Only 82 miles (132 km) of Califor-
nia roads are tolled, testament to public anath-
ema for user fees. If other states follow the Cali-
fornia lead, they will push expenses and projects
off to the future, add on debt loads, and rely onfamiliar formulas that subsidize driving, which,
in turn, encourages greater car use, undesirable
congestion, and more rapid road wear and tear.
In its defense, the political consensus fears that
higher driving fees will make the state too costly,
forcing out business and workers, and unac-
ceptably reducing the tax base. Gestures at more
transit-oriented development should be cele-
brated, but resignation to car dependence has
produced an uncomfortable Hobson’s choice over
funding infrastructure improvements. Indeed,
other states wrestle with California’s conun-
drum, too:
† In New Jersey, state o≈cials wrestle with
plugging budget shortfalls by raising turnpike
tolls. Higher gas taxes and user fees generally
get short shrift. In addition to contemplating
selling the turnpike concession to a private op-
erator, the state also considers orchestrating a
takeover by its public pension fund. Selling to
the pension fund could still extend politicos
some political distance from responsibility for
distasteful toll increases, and proponents sug-
gest the pension fund wouldn’t be inclined to
hike the tolls as much as private concessions.
The pension fund solution also retains some
measure of public control over the state’s mostimportant road asset and addresses public con-
cerns about private companies taking advantage
of the state in complex agreements at drivers’
expense.
† Pennsylvania rejected a 12.5-cent gas tax in-
crease to fund road and transit improvements.
O≈cials couldn’t swallow what amounted to a 25
percent increase, fearing voter wrath. The addi-
tional tax would have amounted to about a 5
percent hike on the overall pump price. The
governor, meanwhile, pushes selling a turnpike
toll concession to a private operator, who would
be expected to raise tolls.
† Reflecting the sharp divergence between its
tra≈c-choked northern counties around Wash-
ington, D.C., and rural southern sections, Vir-
ginia’s legislature rebuffed proposals for
statewide taxes and user fees, but adopted laws
allowing localities to levy sales taxes for infra-
structure improvements.
† Texas may break the mold, planning an am-
bitious 4,000-mile (6,437-km) corridor of tolled
road lanes and tracks to shepherd cars, trucks,
and trains through the state to the Mexican bor-
der. The Dallas region also will bank on tolls to
fund new suburban roads. But the state has re-
jected indexing the motor fuel tax to raise infra-
structure monies.
California’s Bond Issue
A
36 infrastructure 2007
8/2/2019 Infrastructure 2007 - A Global Perspective
http://slidepdf.com/reader/full/infrastructure-2007-a-global-perspective 42/69
the state of u.s. infrastructure 37
Without traditional hub-and-spoke configurations of en-
during 24-hour cities (New York, Chicago, San Francisco,
Boston), suburban agglomerations cannot easily accommo-
date mass transit systems. Unlike cities in Europe and Japan,
the new American metropolitan areas do not have the in-
frastructure bones in place to offer alternatives to car trans-
port. The typical European or Asian gateway links airports
to rail and subway service with rapid transport to downtown
commercial and hotel districts. Intercity bullet trains speed
to interior locations. Roads are only part of the equation. In
the United States, roads are more typically the only solution.
“Even if you were able to double current mass transit rider-
ship share in the country from the current 3 percent to 6 per-
cent, the overwhelming population will remain car depen-
dent.”
Confronting the Reality
Without multimodal transport backbones, suburban ag-
glomerations will confront staggering costs to retrofit. In At-
lanta, a government task force recommends an $18 billion
long-range plan for more road capacity and a significant in-
fusion for expanded mass transit. Critics argue that more
road funding is necessary and new subway lines won’t make
a dent in tra≈c congestion. Other planners counter with a
$25 billion road scheme including new connectors, double-
decked tunnels, truck corridors, and variably priced toll
lanes on the entire regional highway system. Whatever the
approach, state and local leaders will need to increase local
fuel, property, income, or sales taxes, and maybe all of the
above. “They’re dreaming if they think the feds will bailthem out.” Even after spending tens of billions of dollars,
Atlanta will not solve its overarching issue of disengaged
land use and car dependence. “Double-decked highways
will still exit into the same bottlenecked local roads.” And
the $10 billion mass transit proposal won’t help much if peo-
ple cannot walk to a station from home or work.
Government leaders and planners begin to turn away
from fixing failing models with more roads in favor of ex-
amining new approaches that also involve infill housing,
mass transit, parks, and mixed-use development. “I’m ad-
vising the governor and local o≈cials in a [large suburban
agglomeration], and they are scared to death of what will
be needed to deal with making over their infrastructure,”
says an interviewee. “There are no ready solutions and all
of them are excessively costly. But at least these leaders are
confronting the issues and trying to understand them.”
Global Warming Impetus
Oil dependence, global warming, and reduced carbon emis-
sions also weigh in on the current state of U.S. infrastruc-
ture and the nation’s car dependence. The roiled Middle
East forces up pump prices. Drivers reconcile themselves
to higher gasoline costs, while fuel tax proponents buttress
arguments by raising national security imperatives—“we
need to wean ourselves from oil.” If the country reacts to
global warming red flags and tamps down on carbon emis-
sions, higher taxes on fuel or cars and trucks would change
the economics of driving and cause people to rethink where
they live and work. Rail and mass transit solutions could gain
support. Infill areas closer to transit and pedestrian-friendly
areas near stores and services would look more attractive.
People might start to reevaluate the relative benefits of tolls
and user fees for funding new infrastructure, and politicians
working with planners might find voice for undertaking
significant changes.
All of these complex issues are interlinked.

8/2/2019 Infrastructure 2007 - A Global Perspective
http://slidepdf.com/reader/full/infrastructure-2007-a-global-perspective 43/69
Part ThreeA Road to the
Future

8/2/2019 Infrastructure 2007 - A Global Perspective
http://slidepdf.com/reader/full/infrastructure-2007-a-global-perspective 44/69

8/2/2019 Infrastructure 2007 - A Global Perspective
http://slidepdf.com/reader/full/infrastructure-2007-a-global-perspective 45/69
In 2007, the United States reaches “an inflection point.”
Money for funding basic infrastructure needs has run
out and systems require substantial repairs. Already
clogged road-based transport networks cannot sustain
future growth. America desperately needs to find the polit-
ical will for a new, long-term action plan to cope with gath-
ering fallout—establishing priorities, identifying revenue
sources, changing behaviors, and adopting more econom-
ically e≈cient models. Change is never easy, but the time
has come by necessity to alter process and strategy:
† For starters, the country could do with a reality check.
“The current level of infrastructure investments cannot sus-
tain current economic activity, let alone allow for growth.”
The United States must find trillions of dollars in coming
years to fix its infrastructure problems. In the end, people
must pay. But if infrastructure expenditures are compre-
hensively planned and integrated with regional land use, the
lasting economic benefits can be enormous, propelling the
nation’s growth for generations. “The government needs to
tie together economic development, land use, and e≈cient
infrastructure planning.”
† The federal government, working with regions and
states, will need to develop a clear vision for policy and in-
tegrate programs that link costs to use and drive e≈cien-
cies. Silos must be broken down between multiple layers of
state and local road departments, transit agencies, planning
boards, and housing authorities. “Stove-piping does not
work anymore,” says an interviewee. “You can’t have every-
body doing their own thing. That’s the height of ine≈ciency,
waste, and poor planning.” Cities, counties, and towns must
stop competing against each other for infrastructure proj-
ects and funds and begin formulating comprehensive plans
that will give them the opportunity to help the country com-
pete globally.
† Users—government, businesses, individuals—“need to
understand the full-cost price of infrastructure—not just the
building, but also the maintenance and repair.” “Costs need
to align with use,” and users need to pay for the privilege.
In the world’s most market-driven economy, people have
no idea how much infrastructure costs them, “masking any
rational decision making” about where they should live and
work.
† Suburban sprawl has been subsidized heavily by infra-
structure spending on roads as well as water, sewer, and
power lines not factored into land costs at the fringe. More
economic, compact development supported by multiple
transportation options has been sacrificed for horizontal,
car-dependent models. When the fully loaded costs of
sprawl development are brought to bear on homeowners
and businesses by user fees and higher car-related ex-
I
Finding a NewModel

8/2/2019 Infrastructure 2007 - A Global Perspective
http://slidepdf.com/reader/full/infrastructure-2007-a-global-perspective 46/69
finding a new model 41
penses, behaviors will adjust to seeking greater conve-
nience in transit-oriented communities and infill areas. “All
that cheap land in Sunbelt areas and the exurbs is not so
cheap when infrastructure costs are properly factored.” In
fact, combined housing and transportation costs are about
equal in high-growth, car-dependent sprawl areas and less
car-dependent, high-density metropolitan areas.
† It’s no coincidence that today’s dominant cities, pros-pering along global economic pathways, feature sophisti-
cated and integrated infrastructure with multiple modes of
transit to accommodate high volumes of activity and con-
centrated populations. “Their infrastructure creates a com-
petitive advantage.” It also leads to higher land values. Over
time, Manhattan and San Francisco property values sky-
rocket, while housing prices in car towns like Atlanta and
Dallas only edge forward comparatively.
† Issues of sprawl-related congestion, overreliance on
cars, and outmoded infrastructure merge with heightened
concerns about fuel costs, dependence on Middle East oil,
and global warming. Dangerous overseas conflicts risk com-
promising energy supplies, while greenhouse gases threaten
future generations. More Americans ponder the viability of
lifestyles where 5 percent of the world’s population uses 25
percent of global energy stocks. If Iraq quiets down and
pump prices edge lower, public apprehensions may allevi-
ate. For now, the weight of unease influences changing at-
titudes and possibly reduces impediments for considering
revised approaches to infrastructure and land use.
† Integrated land use and infrastructure planning should
incorporate the successful models of the world’s enduring
24-hour metropolitan centers, which feature multifaceted
cores, served by interconnected transport and infrastruc-
ture systems. Transit can be only part of the solution. In-
creased infill development in suburban areas must provide
more walkable commercial centers, better-planned street
grids, and especially secondary routes to get people to
stores and schools without using main roads.
Absent Political Will
Freeways are aptly named. We drive them and assume they
are free. It’s the same for all the streets and roads in our
neighborhoods. Well, the cost is covered somewhere in the
taxes we pay, but who has any idea how much that really is.
Most people don’t think about the fuel taxes built into the
pump price and the few toll roads are made to be avoided,
if possible. Roads like tap water are a given, a necessity, a
right. And don’t raise my taxes.
The country needs a
new model for how it plans
and pays for infrastructure,
including how it plans its
communities.
U.S. wastewater plants nationwide are in need of repair.

8/2/2019 Infrastructure 2007 - A Global Perspective
http://slidepdf.com/reader/full/infrastructure-2007-a-global-perspective 47/69
42 infrastructure 2007
Interviewees bemoan the “lack of political will any-
where.” Conservatives, liberals, Republicans, and Democ-
rats “all observe the Holy Grail” (really, the holy trinity):
don’t raise fuel taxes, don’t impose new tolls, and avoid in-
creasing existing tolls. But can you blame them—we’ll vote
them out of o≈ce if they do. “We keep fuel taxes low, pro-
vide free parking everywhere. Not only are we not pricing
auto use to support road infrastructure, we encourage
greater auto use and then spend dollars on alternatives in
ine≈cient ways” like extending mass transit to low-density
areas or insisting that Amtrak run to Duluth.
Overcoming Bureaucratic Myopia
Funding policy suffers from fragmented interests and pork
barrel initiatives. “Nobody takes the long view. Federal
politicians actually distribute a fair bit of money, but have no
collective strategy. Monies are divided by topic or type cat-
egory of transportation—highways, local roads, subways,
buses, or new stations. But nobody thinks about all options
and tries to tie it all together.”
Fragmentation carries down to the state level. “Multiple
turnpike authorities don’t coordinate with each other,” let
alone consider mass transit or housing-related issues. It’s
not their mandate or vested interest.” Expertise and best
practices tend to diminish the further down the food chain.
“What drives me crazy,” says an investment manager, “are
all the unsolicited proposals I receive from state dots. They
basically don’t know what to do.”
At a local level, “[land use] decisions come from all over
the map.” Mayors make housing policy while school boardschoose school locations. Counties plan new roads and tran-
sit authorities consider new lines. Developers scope out
subdivisions. Nobody is thinking through the multidiscipli-
nary aspects and the comprehensive impacts.”
More Centralized Control
The United States has always functioned off government
based on a federation of states with localities controlling
land use. But this balkanized approach has reached dimin-
ishing returns when it comes to infrastructure and related
land use planning. The myriad zoning and planning boards;
overlapping agencies; and layers of village, town, city, and
county governments jostle for state and federal funding and
collectively fashion a patchwork of often ill-conceived land
use on the suburban agglomeration/sprawl archetype.
Parochial interests run counter to forming policy that serves
the greater good. “All thoughts about smart growth melt
away when a local government has a chance to bring Costco
to town.” Ultimately, “localities want the tax revenue from
new york
38%
other metropolitanregions with more
than 5 million in
population
35%
metropolitan regions
with populations of
1 million to 5 million
19%
all other regions
8%
figure 15.
The Vast Majority of
Public Transit Trips Are
Centralized in Relatively
Few American Cities.
Source: Transportation
Research Board, Commuting
in America III.
The notorious Los Angeles
tra≈c could be alleviated
by an expanded subway
network and better down-
town housing.

8/2/2019 Infrastructure 2007 - A Global Perspective
http://slidepdf.com/reader/full/infrastructure-2007-a-global-perspective 48/69
finding a new model 43
commercial development” to offset property tax burdens on
voters, and “don’t care about the bigger picture,” including
their neighboring communities and the region at large.
Interviewees suggest that more centralized control and
planning will be prerequisites for tackling America’s future
infrastructure needs and its ability to compete globally. Re-
gions must be empowered within a national framework to
marshal expertise and impose policy over local control. At
a centralized level, the appropriate research, technology,
and knowledge can be accessed and appropriated to
achieve better, more integrated, interdisciplinary results.
“When it comes to infrastructure, the nation-state model isinstructive—look at Singapore, Hong Kong, and Europe,
which are all doing a much better job.” “China can teach us
about best practices, training people, and using research
and development to develop sound strategy.”
Master Regional Plans
Robert Moses, New York’s infrastructure czar, left a check-
ered legacy in muscling through his regional blueprint for
road building, parks, and housing over 50 years of nearly
autocratic rule. He destroyed healthy neighborhoods and
gave scant attention to subways or rails. But thanks in par t
to Moses’s interdisciplinary approach as well as the city’s
preexisting mass transit networks, New York boasts the na-
tion’s most effective and enduring urban transport model
that incorporates public space and housing.
A Moses-style regional powerbroker would face in-
tractable obstacles to refashioning today’s sprawldoms. In
the short term, improvements can “only occur in greenfield
and transitional communities.” Change can’t be imposed im-
mediately on existing suburban communities—“the public
won’t stand for it.” But federal and state governments can
influence local policies by incentivizing smarter growth
behaviors and forcing regions to adopt long-range master
intermodal transport plans as quid pro quos for funding not
only local roads and transit, but also housing, parks, water,
sewer, and schools.
States shouldn’t get federal grants for one-off connec-
tor roads before developing master plans showing how proj-
ects will integrate with regional mass transit, infill housing,
and local parks and recreation, anticipating future growth.
Particular attention needs to be focused on urbanizing com-mercial districts of suburban agglomerations, bereft of tra-
ditional urban infrastructure to handle increased popula-
tions. “At some point, the quality of life becomes seriously
affected when everyone is riding around just to get a quart
of milk.” Deteriorating inner-ring suburbs need to be reex-
amined and replanned. Local governments must be en-
couraged to come together to chart their collective futures
rather than left to compete to the death in shortsighted bat-
tles over tax base. No plans, no cooperation, no integration
should mean no funding from state and federal sources.
Understanding Costs
Master regional planning must relate intelligently to a ratio-
nal understanding of the true expense of infrastructure—
not only building, but also maintenance and future repair. If
costs are aligned with use through user fees and appropri-
ate taxes, then people will be able to adjust their lifestyle
behaviors to economics that support more e≈cient infra-
structure and help ameliorate congestion. “Our system cur-
Sprawl requires laying
miles of sewer pipes; more
compact development is
more efficient in both con
struction and maintenance
figure 15.
Average Annual Cost
of Car Ownership
Vehicle Purchases(net outlay)
$3,544
Gasoline and Motor Oil$2,013
Other Vehicle Expenses$2,339
Total $7,896
Source: Bureau of
Labor Statistics/Consumer
Expenditure Survey 2005.

8/2/2019 Infrastructure 2007 - A Global Perspective
http://slidepdf.com/reader/full/infrastructure-2007-a-global-perspective 49/69
44 infrastructure 2007
rently finds ways to hide infrastructure costs, so the con-
sumer/taxpayer fails to understand the true cost benefit.”
Even for government planners and leaders, the “cost of
infrastructure is completely opaque” and distorts rational
decision making. “If you know how much a shirt costs, it will
determine how many you buy. But we’ve never figured out
how much roads cost to build and maintain, but we keep
building them.” “The freeway system is like a restaurant that
attracts customers with low prices, but then doesn’t make
enough money to buy food now that customers are lined up
outside the door.” “Demand is not inelastic and behaviors
can be modified. We need instruments like tolls and higher
fuel taxes in place to help modify behaviors.” For their par t,
electric companies will start to install smart meters in homes
and businesses so people will be able to track their electric
usage and monitor cost on a real-time basis. Over time, a
more educated consumer should begin to adjust attitudes
and practices in line with pocketbook realities.
Funding shortfalls will lead to greater reliance on tolls
and user fees, including higher fuel taxes. Federal and state
governments ultimately won’t have a choice. Either they
raise funds or watch roads decay into disuse. Potential High-
way Trust Fund insolvency in 2009 will be the first test—ei-
ther the gas tax increases dramatically or federal grants for
road repairs and improvements disappear. “Higher gas taxes
and fuel taxes will first [affect] car buying oriented to more
fuel-e≈cient cars and eventually [affect] locational behav-
iors.” The inevitability of more toll roads, higher tolls, and
congestion pricing lanes will all start to bite on where peo-
ple choose to live and work.
All these car-related costs will begin to add up moreclearly than potential sticker shock on a dealer’s lot. Many
people don’t realize that transportation already has become
the biggest household expense after housing. “The cost just
to maintain each family car [about $8,000 annually] easily
surpasses the debt service on a $100,000 home mortgage.
Right now, it may cost less to buy a home in certain exurbs.
But when you factor in car expenses [loans, repairs, insur-
ance] and then add in fuel taxes and tolls, you may figure
you can live with fewer cars and get more value moving to
an infill area where housing is more expensive.” Greater
convenience could translate into obvious cost savings, be-
yond time lost in tra≈c delays and long commutes.
The Outsized Cost of Trucks
Freight trucking is the very lifeblood of just-in-time tech-
nologies, which move trillions of tons of goods cross-coun-
try from ports and factories directly to local stores, meeting
real-time customer demand. But truck e≈ciency and flexi-
bility come with considerable hidden costs in outsized road2006 2007 2008 2009 2010
10
0
-10
figure 17. The Highway Trust Fund Is Going Bankrupt:
Projected End-of-Year Balance (billions of dollars)
Source: Congressional Budget Office.
user fees
$11.1 billion
local government
$13.1 billion
federal
government
$6.9 billion
ı total government funds: $27.8 billion
state
government
$7.8 billion
figure 16.
Transit’s Helping Hand:
2004 Transit Revenue
Sources
Source: Federal Highway
Administration, 2006
Conditions and
Performance Report.

8/2/2019 Infrastructure 2007 - A Global Perspective
http://slidepdf.com/reader/full/infrastructure-2007-a-global-perspective 50/69
In February 2007, London doubled the size of
its controversial congestion-charge zone in
the central city to 15 square miles (38.8 sq
km) after the initial four-year program cut tra≈c
by 10 to 15 percent, reduced vehicle delays by
20 to 30 percent, and tempered pollution levels.
The expanded zone is expected to reduce tra≈c
by upwards of 15 percent and collect additional
revenues. Camera and transponder technologies
track license plate numbers and electronicallycharge for entry into the cordoned districts dur-
ing peak workday congestion periods without
cars going through tolls or checkpoint delays.
Drivers incur hefty fines if they don’t pay up
through credit card plans or kiosks set up
around the city.
Singapore inaugurated the concept of con-
gestion zone pricing back in 1975. So far, only
Oslo and Stockholm have followed London’s lead
in Europe, and most American cities have avoided
serious consideration of the option. A proposal
for implementation in New York City, which had
dropped its commuter tax under political pres-
sure from surrounding suburbs, faces tough
political sledding.
Coming Attractions
Despite the general lack of enthusiasm at pre-
sent, various forms of congestion pricing are
touted as the “Holy Grail” by many transporta-
tion engineers and economists and emerging
wireless, satellite, and computer technologies
pave the way for implementation. In fact, these
systems may be coming attractions for many
choking urban areas, confounded by gridlock,
declines in productivity and economic competi-
tiveness, and deterioration in quality of life.
People never want to pay for what has been
free, but at some point saving time and avoiding
frustrating delays has obvious value. As popula-
tions grow and suburban areas become denser,
car congestion will only worsen. Global warming
concerns, meanwhile, have raised more direct
connections between the impacts of idling cars
and tailpipe emissions with undesirable climate
change as well as unhealthy smog.
Road systems and mass transit have never
come free. One way or another, taxpayers have
paid for their construction and maintenance.
Various congestion pricing models place more of
the economic burden on users and can help in-
fluence e≈cient behaviors by putting a more
direct cost on how people choose to get around
as well as where they live and work. Politicians
tend to recoil at congestion pricing schemes,
characterizing them as regressive forms of taxa-
tion that unfairly burden the poor and middle
class. But in many places, government coffers
are empty, transport systems need capital infu-
sions, and street networks are jammed. Car de-
pendence is becoming a more expensive propo-
sition and the rubber is hitting the (crumbling,
jam-packed) road.
Limited Application
Realistically, the London cordon pricing scheme
has limited application to pedestrian-oriented
central business districts with e≈cient mass tran-
sit alternatives to cars. In the United States, only
the familiar 24 hour cities—New York, Boston,
Washington, D.C., Chicago, and San Francisco—
as well as Philadelphia fit this profile, having rail,
subway, bus, and ferry options to make zone
pricing conceptually practical. Charges would be
counterproductive in the business nodes of dif-
fuse, car-dependent suburban agglomerations.
People would stay away from cordoned conges-
tion zones to avoid the added direct cost with
no alternative for access, hurting commercial en-
terprises and eventually the tax base; or they
keep coming out of necessity in their cars, leav-
ing roads perpetually clogged without relief.
In car-dependent areas, congestion pricing
models will focus on ramping up facility pricing
(tolls for specific high-speed lanes, roads,
bridges, tunnels) and regional networks (where
all major thoroughfares are tolled). Some facili-
ties will be operated by increasing numbers of
privately owned concessions. New electronic
tolling technologies can be calibrated to charge
different prices depending on the time of day or
real-time congestion patterns to help adjust
tra≈c flows and orient behaviors to reduce de-
lays, but for a price. “You can buy your way out
of congestion on a Lexus lane.”
Charging by the Mile
Studies are underway to assess the viability of
utilizing gps technologies and electronic tolling
systems to charge drivers simply based on
mileage traveled. Distance-based tolling could
replace or augment the gas tax and more di-
rectly assign the burden of road costs and con-
gestion to users. These high-tech mileage track-
ing systems could be programmed to adjust
charges based on congestion delays, damage to
roadways (based on vehicle weight), and vehicle
emissions. The further you travel, the heavier
your vehicle, and the higher your emissions—
the more you pay. Through a clearinghouse, rev-
enues theoretically can be directed to municipal-
ities, counties, and states linked to actual use of
their roads, providing a new funding source for
maintenance, capital improvements, and mass
transit alternatives. Critics raise alarms that
these satellite information collecting systems are
fraught with “Big Brother” privacy concerns
where drivers’ every move can be followed. Pro-
ponents counter that these systems could be de-
signed not to track motorists.
Insurance premiums could also be priced
more directly on the basis of actual miles trav-
eled, calculated in a formula with a driver’s safety
record and other actuarial assumptions. Intu-itively, it makes sense—the more miles you drive
each year, the greater the risk of accidents and
the more you should pay in premiums. More me-
tered parking and higher parking rates would
also help align cost to actual use.
Congestion pricing and distance-based
tolling could help align infrastructure cost with
vehicle use. Then, politicians, planners, busi-
nesses, and the public at large would be able to
gauge a more accurate cost of using cars and
trucks. It would let everyone make choices
based more on economic realities—do you use
alternative transportation, relocate to drive less,
make fewer trips, or stay the course? “You need
to make users pay and only then will you influ-
ence behaviors,” says an interviewee. But imple-
mentation of these systems and changed behav-
iors will not likely occur until the public cries
uncle—either when congestion becomes un-
bearable or funding essential infrastructure im-
provements through sharply higher property or
income taxes becomes unpalatable. Something
has to give, maybe sooner than later in many
places. It happened in London.
Congestion PricingI
finding a new model 45

8/2/2019 Infrastructure 2007 - A Global Perspective
http://slidepdf.com/reader/full/infrastructure-2007-a-global-perspective 51/69
46 infrastructure 2007
damage, fuel ine≈ciency, and pollution. As a result, the
United States will be forced to adopt more intermodalfreight solutions to reduce reliance on trucks as shipping
needs continue to expand.
At times during the day, trucks can make up 50 percent
of road tra≈c in some key transport corridors—Los Ange-
les/Long Beach, northern New Jersey, and Washington,
D.C. Rigs, meanwhile, become longer and heavier. While
flexible and e≈cient in transporting from point to point,
trucks inflict the lion’s share of damage not only to inter-
states, but also to local roads, which can’t withstand the con-
stant pounding of heavy loads. “The cost of damage to in-
terstates by 18-wheeler semitrailers is six times what they
pay in fees, and they effectively pay no costs for damage to
local streets.” “Taxpayers don’t know it, but they have been
subsidizing truckers.” On a fuel-e≈ciency basis, trucks also
trail rail and boat alternatives and they contribute more pol-
lution than other transport options.
Higher user fees and tolls will begin to affect trucking-
related expenses as states look to fund road repairs, and
those costs may result in higher retail prices for various
goods. Many states and regions will establish tolled truck
corridors to help reduce congestion. But the country will
need more dedicated freight rail lines for goods movementand better connections at shipping origins and destina-
tions—ports, airports, and border crossings. Truck routes
and rail lines must feed out of shipping hubs without im-
pinging on local roads and passenger lines, and greater re-
liance will be placed on regional rail centers for oΩoading
shipments to trucks for more localized deliveries. Conges-
tion pricing schemes will encourage schedules to move
goods through familiar road chokepoints at off hours. Just-
in-time will get ever more sophisticated. “Goods movement
is key to sustaining competitive environments.”
Different Challenges/Modernizing
Aging System
Understanding and addressing infrastructure costs set the
stage for reordering land use priorities and lifestyle choices.
Market forces can begin to take over and help focus politi-
cal action for seeking regional solutions to accommodate
funding realities and growth aspirations.
The nation’s established 24-hour cities face challenges
2000 2005 2010 2015 2020 2025
220
200
180
160
140
120
100
needed to improve
needed to maintain
revenue
figure 18.
Additional Funds Are Needed to Maintain and Improve the U.S. Highway System
(billions of us$)
Source: Cambridge Systematics, Initial Assessment of Freight Bottlenecks on Highways (October, 2005).
year

8/2/2019 Infrastructure 2007 - A Global Perspective
http://slidepdf.com/reader/full/infrastructure-2007-a-global-perspective 52/69
finding a new model 47
different from those faced by faster-growing suburban ag-
glomerations. Cities like New York, Chicago, Boston, Wash-ington, D.C., and San Francisco benefit from multifaceted
transport backbones and e≈cient infrastructure schemes
derived from traditional European models. Their primary
challenge is to repair, maintain, and, where possible, mod-
ernize aging systems. Water mains, bridges, tunnels, and
elevated tracks approach their centenaries and beyond in
some older cities.
† New York looks to add a downtown mass transit hub
near the Ground Zero site, enhancing the financial district’s
accessibility and buoying residential development. A new
water tunnel nears completion and additional subway linesare planned.
† Boston’s “Big Dig” led to egregious cost overruns, but
has improved access to residential and business areas, re-
duced congestion, and created more attractive public space.
† The removal of earthquake-damaged road overpasses
has reinvigorated neighborhoods along San Francisco’s Em-
barcadero, and the Bay Area Rapid Transit (BART) system
continues to expand area subway service.
Reconfiguring Failing Environments
Sunbelt agglomerations confront steeper long-range hur-
dles—they need to convert urbanizing sprawldoms into re-
gions with viable 24-hour environments, including multi-
faceted commercial cores served by mass transit. “It’s
dawning in the Sunbelt what a terrible state of infrastruc-
ture and congestion exists. These places can’t keep up with
the costs.”
† Denver makes progress, creating a light-rail hub in its
downtown LoDo district and infusing the neighborhood
with sports, entertainment, retail, and new residential
space. Light-rail lines link and expand to surrounding sub-urban districts.
† Atlanta’s emerging core begins to form around its Mid-
town and Buckhead districts, which are both ser ved by the
MARTA subway system. High-rise housing springs up
around subway stops and businesses cluster near MARTA
stations.
Los Angeles struggles to
move freight from thePort of Long Beach with-
out further disrupting
commuter tra≈c.

8/2/2019 Infrastructure 2007 - A Global Perspective
http://slidepdf.com/reader/full/infrastructure-2007-a-global-perspective 53/69
48 infrastructure 2007
† Los Angeles slowly expands its subway and builds more
residences in its downtown, which was once lifeless after
dark.
† Houston begins to link commercial districts with light
rail and encourages downtown residential.
“Local leaders have come to realize that without mass tran-
sit systems, you’re in trouble.” While finding rights-of-way
among the developed mazes of subdivisions and commer-
cial strips can be discouraging, replanning areas around
designated stations for pedestrian-friendly mixed-use en-
vironments can border on hopeless. The puzzle is this: how
do people get to stores and stations without driving when
they live miles away in single-family homes? At the same
time, most car-dependent metropolitan areas have sacrifi-
ced large public recreation areas for suburban backyards
and private golf courses. As these suburban places turn
more vertical and dense, they must find places for parks or
risk becoming insufferably claustrophobic, the antithesis
of their original intention. Various communities and their
leaders will battle over which get the spoils of convenience
and which sacrifice for the greater good, as governors and
regional planning authorities wrestle over sensible long-
range visions. Congestion, higher driving costs, and eco-
nomic realities will help form broader consensus for solu-
tions. Failing neighborhoods and malls may offer the best
opportunities for conversion to palatable schemes. Districts
around well-planned transit hubs ultimately will become
more attractive and valuable because of the convenience
they o∑er. Costs and the market will shape the future and
dictate the course of renewal.
Visioning Exercises
Some communities use vision exercises to help tackle long-
range planning and overcome seeming intractable conges-
tion issues. In Los Angeles, 1,300 participants attended a
“growth vision workshop” sponsored by the California As-
sociation of Governments. The planners estimated that 98
percent of the region’s land could be spared the negative
impacts of uncontrolled growth by concentrating new de-
velopment in the remaining 2 percent. The vision empha-
sized infill redevelopment, mixed-use development, and
transit-oriented development in centers and corridors with
existing infrastructure. Although anticipated congestion
would increase as a result of expected population growth,
the plan forecasts 5 percent less driving per capita and a 12
percent reduction in forecast tra≈c levels. This so-called 2
percent strategy would reduce congestion more than ex-
pected improvements from substantial growth in the area’s
freeway system.
Boston’s Big Dig is the na-
tion’s largest transportation
infrastructure improvement
project.

8/2/2019 Infrastructure 2007 - A Global Perspective
http://slidepdf.com/reader/full/infrastructure-2007-a-global-perspective 54/69
Knowledge is power. But most consumers
don’t have a clue about how much it
costs them to run their air conditioner
or washing machine. They have no idea how
much they might save on their electric bills if
they used some appliances less often or turned
the lights off when they leave a room. Most
electric utilities are in the dark, too. Since their
meters don’t monitor time of usage, just kilo-
watts used, utilities still must charge residentialcustomers the same flat rate even though their
energy costs may be ten times higher at peak us-
age, such as on unbearably hot July afternoons.
“Consumers are treated like morons with this
kind of billing,” says an interviewee.
Increasing power demand, meanwhile,
threatens to outstrip supply as utilities grapple
with costs to build controversial new power
plants and add transmission lines in the face of
pollution, global warming, and other environ-
mental concerns. What community wants a coal-
burning power plant or nuclear reactor in their
backyard? Transmission lines raise hackles as
they scar endless miles of countrysides and rural
areas. Without some relief, already stressed
power grids may short-circuit more easily into
brownouts and blackouts. Either users conserve
or costs will escalate and the necessity for more
power infrastructure will become increasingly
obvious.
Reducing Consumption
Finding ways to improve energy e≈ciency and
discourage waste has become an international
priority. In many countries with market-driven
pricing, power companies, prodded by regula-
tors, are turning to smart meter technology as a
way to measure electric consumption in real
time, offering opportunities to control usage and
modify consumers’ sometimes profligate behav-
ior. Most experts estimate that consumption
can be reduced by 5 to 10 percent through use
of the meters, which use wireless technologies
to monitor consumption, calculate current
billing, and register real-time changes in pricing
depending on systemwide demand and genera-
tion costs.
Instead of dials with indecipherable readings
on boxes located in closet corners or basement
nooks, smart meters can provide consumers
with meaningful readouts that appear on kitchen
monitors or can be called up through Internet
connections. Utilities can warn residential con-
sumers of peak usage demands and alert them
to curtail use to save costs and avert outages.
Computer chip technologies also will be avail-
able for utilities to turn off appliances or adjust
thermostats remotely at peak loads. Besides re-
ducing electric use, many experts believe these
“intelligent” systems will help condition people
to restrain bad habits—like cooling empty
homes throughout the day or running appliances
at peak load times—by providing tools for un-
derstanding how to cut their bills. The technol-
ogy will also have application for natural gas and
water meters.
Europe Leads
With more than 27 million devices installed,
Italy is the world’s leading proponent of smart
meter technology. Spain and Sweden also have
mandated smart meter applications and pilot
programs are underway in the United Kingdom.
In Canada, Ontario has committed to installing
smart meters in 800,000 homes by the end of
2007 and throughout the province by 2010.
Smart metering is also catching on in the
United States, boosted by the federal Energy
Policy Act of 2005, which ordered states to in-
vestigate implementation of demand response
programs. In California, where high costs and
rolling brownouts have infuriated consumers,
utilities are undertaking systemwide smart me-
ter installations. Many states have instigatedpilot programs with their power companies.
Still, electric utilities make more money if
people use more power, which creates less in-
centive for power companies to encourage con-
servation among customers, who may balk at the
initial $100-plus cost for meter installation. “The
utility culture is building a franchise around sell-
ing more electricity, not less.” Some regulators
examine ways of decoupling revenues from sales,
providing market incentives to companies that
help their customers become more e≈cient and
less wasteful. “Smart metering is a step in the
right direction.”
Smart Meters
K
finding a new model 49

8/2/2019 Infrastructure 2007 - A Global Perspective
http://slidepdf.com/reader/full/infrastructure-2007-a-global-perspective 55/69
Let’s accept as a given that funding U.S. infrastruc-
ture will cost big bucks—money for which federal,
state, and local governments have not yet ade-
quately planned or budgeted. So where will gov-
ernments find it? The following is a list of familiar revenue
sources: income, sales, and property taxes; user fees such
as tolls, subway fares, and water bills; developer impact fees;
bond issues funded by user fees and general tax revenues;
and various forms of public/private partnerships financed
by all of the above. But no matter the structure or method,
taxpayers, users, and businesses will pay the way and as-
sessments will increase, in some cases substantially. The
payback should devolve to future generations, including im-
proved economic productivity and enhanced lifestyles as the
country accommodates tens of millions of new residents.
Sound vision and integrated planning will be necessary
to help find e≈ciencies and solutions. Increasingly, econo-
mists, academics, and planners argue that users should pay
for the infrastructure from which they benefit to help orient
behaviors to the most cost-effective and sound lifestyle and
business practices. Bond issues remain politically palatable
since costs get pushed into the future, arguably paid for
over time by people who are getting the benefits. General
revenue taxes hold some favor among politicians looking to
spread the pain and limit fallout from large segments of ag-
grieved users, but that may mean cutbacks in favored cate-
gories like schools and police as well as some other tough
policy calculations.
Privatization Wave
Gaining recent traction, U.S. state and local governments
examine using private investors to build, manage, and/or
operate infrastructure assets, particularly toll roads, bridges,
and tunnels. “Privatization models can strengthen city or
state balance sheets in the short run, redeploy equity locked
in assets, access private sector skill sets, and often better
management practices.” Depending on transaction struc-
tures and stipulations, governments gain cash infusions
and/or share in future revenues. In addition, they can trans-
fer project and operating risks over to private entities, which
are incentivized to manage facilities cost effectively within
strictures designed for meeting the public good. If cost
overruns hit the tunnel project or new school construction,
the private companies and or investors—rather than tax-
payers—pick up the tab. They also must maintain the facil-
ity to a certain standard over the life of the contract. “The
major benefit for governments is risk transfer and that can
be huge.”
Private concession operators also tout their incentives
to improve service and increase public use, thereby driving
Infrastructure:Paying the Way
L

8/2/2019 Infrastructure 2007 - A Global Perspective
http://slidepdf.com/reader/full/infrastructure-2007-a-global-perspective 56/69
infrastructure: paying the way 51
up their returns—these e≈ciencies save money for every-
one. “We’re in the service business,” says a toll road in-
vestment manager. “We are in the business of saving time
and making roads run better so more people will use them
and benefit. The public sector is shackled—workers get no
upside bonuses for changing practices, they stick with the
status quo, and so the public doesn’t gain improvements.”
Privatizing infrastructure in the United States is nothing
new—railroads, mass transit, telecommunications, and
power systems traditionally have been developed and op-
erated by publicly regulated private companies. Over the
past two decades, a handful of toll roads have also been pri-
vatized, with about $25 billion worth of projects proposed
or under development. More recently, a small group of air-
ports has entered into retail management contracts with pri-
vate operators, and increasing numbers of publicly owned
water and wastewater systems are contracting with private
providers for system operations and maintenance. But the
United States trails other regions, especially in transport-
related privatization. In Europe, public/private partnerships
have been building and operating toll roads since the 1970s.
More recently, private companies have taken over a irports
and ports as well as school and hospital management. Pub-
lic/private infrastructure transactions have been adopted
widely in Australia, Canada, India, Asia, and South America.
Investment Funds Proliferate
New to the game are a raft of investment funds, sponsored
by global investment banks, private equity firms, and insti-
tutional money managers, looking to place money from pen-
sion funds, insurance company general accounts, and high-
net-worth clients into infrastructure investments. During the
mid-1990s, Australian investment firms established the first
of these funds, looking for new assets to invest in after tap-
ping out on local real estate, stocks, and bonds. The rise of
private infrastructure investing in Australia notably coin-
cided with reduced government spending (from 7.2 percent
of gdp in 1970 to about 3.6 percent in 2006). In 2007, more
than $30 billion of Australian infrastructure assets are held
in publicly traded or listed entities. Various new global in-
frastructure funds have raised about $100 billion to invest
in infrastructure assets with an initial focus on Europe,
where public/private partnerships have been well estab-
lished in many countries whose governments have sought
alternative financing sources.
Fund marketers tout infrastructure as a “new asset class”
offering secure, long-term cash flows, inflation protection,
and opportunities for reducing overall portfolio volatility and
risk. Funds tend to be highly diversified—“a broad basket
of things” investing in economic infrastructure like toll
Sound vision
and integrate
planning will
be necessary
to help find
e≈ciencies
and solutions
The world’s tallest bridge,
the Millau Viaduct in
France, was privately
financed and constructed
by the Eiffage Group in
exchange for 75 years of
toll concessions.

8/2/2019 Infrastructure 2007 - A Global Perspective
http://slidepdf.com/reader/full/infrastructure-2007-a-global-perspective 57/69
52 infrastructure 2007
project name projected value (us$m) countryAbertis Acquisition of sanef 10,000 France
aprr (Autoroutes Paris-Rhine-Rhone) Privatization 9,130 France
Indiana Toll Road 4,823 United States
Madrid Calle 30 PFI 3,709 Spain
Gautrain Rapid Rail Link 3,300 South Africa
Reliance Rail ppp 2,839 Australia
Budapest Airport Privatization 2,133 Hungary
Richmond Airport Vancouver Rapid Transit Project 1,660 Canada
South Korean Incheon Grand Bridge 1,600 South Korea
Bundang Railroad Project pfi 1,580 South Korea
Metro de Madrid ppp 1,470 Spain
Total 42,244
figure 19.
Types of Transactions
in millions us$
acquisitions &
privatization
$25,110
new projects
$33,840
refinancing
$3,463
expansions
$5,661
30,000
25.000
20,000
15,000
10,000
5,000
0
North America Europe Asia Australia South America
figure 21.
Projected Value of All
Transactions in 2005
and 2006
in millions us$
Source: Infrastructure
Journal Database.
figure 20.
Ten Largest Transactions
ı 2005
ı 2006
Breakdown of All Transportation Infrastructure Deals Involving PPPs, January 2005–February 2007

8/2/2019 Infrastructure 2007 - A Global Perspective
http://slidepdf.com/reader/full/infrastructure-2007-a-global-perspective 58/69
infrastructure: paying the way 53
roads, parking lots, power plants, water treatment facilities,
and airports as well as social infrastructure, including hos-
pitals, schools, and affordable housing. Portfolio managers
may balance the known and predictable cash flows of ex-
isting infrastructure investments with investments in higher-
risk/higher-return greenfield construction projects.
Attractive Returns
Mature infrastructure assets compare to core real estate, of-
fering mid- to high-single-digit annualized returns, often
from government-backed income on existing facilities. Pen-
sion funds and insurance companies gravitate to core-
friendly, long-term lease terms with stable returns from toll
roads or government contracts for managing schools and
hospitals. These income flows can match up well to actuar-
ial liabilities for retirees and life policies. Core-oriented port-
folio managers have felt more comfortable operating in
western Europe, Canada, and Australia, where political sta-
bility, transparent regulatory environments, and rule of law
are entrenched. But many of these markets “have been
picked over,” says a consultant. “It’s hard to find deals for
mature, core assets in Europe” and all the competition “has
brought returns down.”
Greenfield investments, meanwhile, match opportunis-
tic real estate on the risk/return spectrum, potentially throw-
ing off annualized gains in the high teens or above from
redevelopment or development-style transactions. Invest-
1
3
4
9
10
11 12
13
14
15
16
17
1821
22
24
2526
231920
567
8
2
1 Tacoma Narrows Bridge
2 I-15 Reconstruction
3 Reno Rail Corridor
4 Las Vegas Monorail
5 Alameda Corridor
6 Foothill Eastern TollRoad
7 San Joaquin Hills TollRoad
8 sr 125 Toll Road
9 az-17
10 nm-44 (us 550)
11 Trans Texas Corridor
12 Central Texas Turnpike
13 Miami IntermodalCenter
14 Osceola Parkway
15 Southern Connector
16 Pocahontas Parkway
17 Dulles Greenway
18 Camden-Trenton LightRail Line
19 Hudson-Bergen LightRail Line
20 Jamaica JFK Airtrain
21 Indiana Toll Road AssetSale
22 Chicago Skyway AssetSale
23 create
24 Hiawatha Light Rail Line
25 Denver e-47026 Northwest Parkway
figure 22.
Recent Public/Private
Partnerships
ı States Using PPPs to Help
Address Transportation
Source: Cambridge
Systematics, July 2006.

8/2/2019 Infrastructure 2007 - A Global Perspective
http://slidepdf.com/reader/full/infrastructure-2007-a-global-perspective 59/69
54 infrastructure 2007
ment banks tend to dominate the greenfield arena. Their
typical game plans follow a private equity/ipo model: lever-
age up equity investments, refinance the assets through
bond issues or securitizations, and either sell stabilized as-
sets as soon as possible to core funds and other investors
or take the entities public. Transaction fees, leverage, and
early sales can translate into big internal rates of return, if
projects work out, and refinancing strategies can reduce risk
for equity investors, if deals sour. China, India, Russia, and
other parts of eastern Europe start to draw more oppor-
tunistic players, who chance problematic political and reg-
ulatory landscapes with histories of corruption. But new
highway construction in North America fits squarely in
greenfield parameters.
Sandwiched between core and opportunistic cate-
gories, core-plus investments favor existing assets, which
can be enhanced through operation improvements to pro-
duce more income—adding new toll lanes, reconfiguring
airport concessions. Private equity firms actively engage in
these investments, looking to provide a value-add through
active management, and sharing in investment gains with
investor and government partners.
Capturing U.S. Opportunities
Now, the global investment pipeline, flush with cash, ea-
gerly and hopefully shifts some flows to the United States
as Americans begin to realize the scope of future infra-
structure requirements and size of funding shortfalls. “The
best opportunities for mature assets are in North America”
and “the U.S. has to do something—they have a need andthere is capital demand.” U.S. legal transparency and polit-
ical stability also attract portfolio managers and investors.
In fact, U.S. markets seem receptive—28 of the 50 states
have passed legislation enabling private market investment
in infrastructure, but the floodgates have not opened yet.
“There’s more dialogue with states and governments,” says
an investment banker looking to score deals. “You see some
vibrancy in the market, lots of smoke, needs are great, but
few bold strokes of action. So far there have been just five
or six recent transport deals in the whole country and it’s a
big country.” Grouses a frustrated investor: “There have
been more deals done in Greece in the past five years than
the U.S.”
Proponents and Critics
Two recent highway concession transactions on existing toll
roads—the sale of long-term leases for the Chicago Skyway
and Indiana East-West Tollway—have attracted attention
and elicited mixed reactions. Both deals scored large one-
time payments to governments, raising questions about ju-
dicious appropriation of the proceeds. “The only reason to
do PPP stuff should be to improve road quality and lower
the cost of operations, not to get a pile of money. Done well,
it could be a boon.” (See sidebar on next page.) Critics ex-
press discomfort over private entities having a monopoly on
public thoroughfares with the right to raise tolls outside tra-
ditional public regulatory channels during lengthy lease
terms (75 to 99 years). “Our studies show that the public is
generally more comfortable with government controlling in-
frastructure assets,” admits a fund manager.
Governors in Pennsylvania and New Jersey dither over
whether to sell outright turnpike concessions to private op-
erators given conflicted reactions to the Chicago and Indi-
ana models. But observers expect that most new highway
construction in many states will be funded by private man-
agers gaining long-term toll concessions. To temper oppo-
sition, contracts will be structured to give states greater con-
trol over toll increases and allow revenue sharing in the
event of windfall gains. States look at compensating private
concessionaires through “availability payments” based on
performance standards, including tra≈c volumes. “Part of
the education process with the public will be to show that
the government still has control to ensure that the asset is
operated for the public good” and, most important, has re-
tained some discretion over toll rates.
Sharks v. Bureaucrats
Political adversaries also raise fears over Wall Street hot-
shots taking government bureaucrats to the cleaners instructuring public/private partnerships. “Wall Street’s best
and brightest make deals happen and collect huge fees, but
who can go toe to toe to protect the public’s interest?”
Counters an investment manager: “Governments can call
on outside advisers and consultants to deal with financial
structuring and best practices.”
Both sides struggle with how to structure deals. The
early-on Dulles Greenway (in suburban northern Virginia)
toll road transaction, completed in 1995, did not protect the
concession operator from new road competition. When al-
ternative free roads were constructed, toll road tra≈c vol-
umes slowed well below operator profit targets. “You need
to protect against competition in concession contracts,” says
a portfolio manager. But such covenants could preclude in-
tegrated regional transport strategies. Private operators
have trouble anticipating tra≈c volumes on new roads with-
out track records. Some deals can sour quickly if debt ser-
vice targets aren’t met. Valuing assets and future cash flows
can be problematic, and crystal balls cloud up when antici-
pating technological changes that could make concessions

8/2/2019 Infrastructure 2007 - A Global Perspective
http://slidepdf.com/reader/full/infrastructure-2007-a-global-perspective 60/69
Was it a great financial coup for the
city of Chicago or a red-handed
“Skyway robbery” by investors? We
may not know for decades who comes out ahead
in the city’s $1.83 billion sale of the Chicago Sky-
way toll concession for 99 years to a private con-
sortium composed of two international infra-
structure market giants—Macquarie (Australia)
and Cintra (Spain). In early 2006, just months
after completing the Skyway deal, a separateMacquarie-Cintra venture acquired similar con-
cession rights over 75 years to Indiana’s 153-mile
(246-km) East-West Toll Road, which connects
at the Illinois state line to the 7.8-mile (12.5-km)
Skyway. The consortium paid $3.85 billion for
the privilege to increase tolls and maintain the
state’s section of I-90, also known as the “Main
Street to the Midwest.” These roadway privati-
zations, the first in the United States, promise to
be the vanguard of a mushrooming trend as
state and local governments look to cash in on
their existing infrastructure assets out of sheer
necessity.
The short-term transaction benefits of these
public/private partnerships (ppps) for the city
and state governments seem clear. With a huge
one-time cash infusion, Chicago’s Mayor Richard
M. Daley paid off existing Skyway debt, boosted
the city’s lagging credit rating, created a rainy-
day fund for general city services, and avoided
the politically unpalatable necessity of raising
taxes in the face of a potential budget crisis. In-
diana Governor Mitch Daniels filled an uncom-
fortable void for an infrastructure fund to
finance new highways and upgrade the state’s
deteriorating transportation system. He side-
stepped the less palatable options of higher gas
taxes, new bond issues, or doing nothing. Both
politicians also skirted the voter wrath that typi-
cally accompanies decisions by government to
boost tolls.
Political Cover
The new private concession owners, insulated
from political consequences, are free to raise tolls
capped to fixed percentages above the higher of
growth in gross domestic product or the Con-
sumer Price Index (cpi). A Federal Reserve study
shows Chicago-area drivers would be paying five
times the current rates had tolls been indexed
previously to the cpi. By 2017, motorists could
be charged $5 for a Skyway trip, up from $2, the
rate in effect for more than 12 years before the
sale. Indiana Toll Road users confront similar
hikes after having paid the same “bargain” toll
rates for almost a quarter-century.
Critics claim the city has given up substan-
tial future revenues from toll collections to plug
gaps in current operating budgets. Indiana’s
strategy appears to have longer-term benefits
and wins more plaudits, funding statewide im-
provements in future infrastructure projects
from the newly created trust fund. But voters
registered displeasure with toll hikes and the
idea of more toll roads, voting out some conces-
sion supporters in recent elections.
Risks and Rewards
The investment consortiums, meanwhile, have
paid substantial upfront costs to lock in steady
and predictably increasing, long-term income
flows that could provide extremely attractive re-
turns, translating into low-double-digit annual-
ized gains over the life of the investments. In
the process, they have paid themselves hand-
some transaction fees for securing and financing
the acquisitions and oΩoaded most of their eq-
uity risk into funds for pensions and insurance
companies (more fees), while retaining asset
management (ongoing fees). The private man-
agers are incentivized to maintain these roads to
attract higher volumes of motorists and are re-
sponsible for expensive capital projects during
their holding periods. Over the lease term, thenow 50-year-old Skyway bridge could need ex-
tensive renovations, even possible replacement.
If the concessionaires don’t maintain standards
and tra≈c volumes, the governments can take
the franchises back. The Skyway consortium
already claims to have reduced travel times for
motorists through installing electronic toll-
scanning technology and by reversing lane flows
at peak travel times. If time is money, drivers
already get a value-add for the higher user fees.
But how will the investment equation turn if
within the next 20 or 30 years some technology
or new competing transport solution makes
these road systems as obsolete as the Erie
Canal? The fund investors will be on the hook,
but may have made enough in the meantime to
gracefully exit without a loss. The tougher case
arises if mounting capital costs force fund man-
agers to make a fiduciary call—do they pony up
on repairs or walk away, leaving the taxpayers
holding the bag? The investors would argue the
concession is a dud no matter what their in-
volvement and the government got the benefit
of their full upfront payment. In all likelihood,
Mayor Daley, Governor Daniels, and the finan-
cial wizards who engineered these seminal pri-
vatizations will have long obtained their re-
wards—the windfalls, fees, and bonuses happily
spent. “It’s really anyone’s guess what will hap-
pen,” says an interviewee.
Caveat Emptor
Buyers beware—infrastructure development
deals can sour quickly when drivers have alter-
natives and balk at high toll concessions and
when private owners overleverage and misjudge
tra≈c volumes. The Cross City Tunnel in Sydney,
Australia, was completed in 2005, costing
a$900 million. In late 2006, the tunnel conces-
sion collapsed into receivership with debts of
a$560 million. Despite schemes to funnel mo-torists by closing some nearby roads, tra≈c flow
through the tunnel is a third of original esti-
mates—high tolls (up to a$5-plus per trip each
way, with increases quarterly indexed to the
cpi) discouraged drivers, who still can take tra-
ditional lower-cost routes. Various tunnel equity
investors and superannuation funds stand to
lose more than a$100 million and bank lenders
considerably more in the “bloody” Cross City
debacle . . . . Private management involved in
toll road construction doesn’t guarantee on bud-
get results either. A private toll road project
scheduled to open in San Diego in summer 2007
has been beset by legal wrangling and cost over-
runs. Its cost, nearly $700 million, is 70 percent
above forecast. . . . Privatized new-launch rail
systems can founder off overly optimistic fore-
casts, too—only three years into operation, the
Las Vegas Monorail Company had its bond rating
dropped to junk status after daily ridership be-
tween various casinos fell to less than half of
projections.
Privatizing TollwaysW
infrastructure: paying the way 55

8/2/2019 Infrastructure 2007 - A Global Perspective
http://slidepdf.com/reader/full/infrastructure-2007-a-global-perspective 61/69
Tax increment financing (tif) started in
California back in 1952. The idea was
to provide an innovative tool for local
governments to self-finance improvements in
blighted areas that wouldn’t otherwise attract
private investment. The increased amount of
property taxes generated by a tif district is used
to pay off bonds sold in municipal securities
markets. When the bonds are paid off, the tif
revenues go directly into local treasuries.Today, every U.S. state except Arizona al-
lows tif with varied (some rather liberal) “but
for” qualification tests for whether projects
would occur without such public financing sup-
port. Many localities use tif bond proceeds as a
primary source to pay for new infrastructure to
attract developers and commercial enterprise.
tif bonds may help fund a new school building
or power plant, or capitalize local road and
sewer improvements around a Wal-Mart Super
Center or regional mall.
Proponents tout tif as a lifeline for local
governments reluctant to raise property and
sales taxes in the face of substantial declines in
federal grants and subsidies. They point to stud-
ies that show how local governments can gain
greater access to bond markets, which in turn al-
lows them to leverage greater amounts of pri-
vate investment to spur economic growth and
strengthen the tax base.
Impact Fees
Not surprisingly, developers typically favor tif
over impact fees, which local governments in-
creasingly require them to pay out of their own
pockets for infrastructure extensions and im-
provements into non-tif projects, especially
greenfield developments. Builders must ratchet
up sales prices to cover impact fee outlays and
are on the hook if projects don’t sell. With tif in
place, owners of properties who benefit directly
from infrastructure improvements pay for them
over time in higher tax assessments. Bond hold-
ers, meanwhile, carry the risk that tax assess-
ments don’t cover debt service, and local gov-
ernments need to be concerned about the impact
of potential defaults on their overall credit rat-
ings.
Neither tax increment financing nor impact
fees touch truckers and other drivers—they pay
nothing to use the new roads running through
these districts. And neither finance structure
pays for maintenance or repairs of infrastructure
systems after they are built. Those increasingly
imposing, ongoing costs typically must be cov-
ered by property and sales tax revenues raised
by the county or municipality, which ever takes
responsibility for the road. In California, so-
called Mello-Roos districts can assess local tax-
payers directly for infrastructure maintenance.
Critics of tif argue that surrounding non-tif
areas suffer in comparison—subsidizing a store
or project in one district often can reduce de-
mand and property values in neighboring areas.
At the extreme, these programs can work against
more e≈cient regional land use planning, foster
destructive competition between municipalities,
and enable sprawl. Tax increment financing, de-
tractors argue, facilitates balkanized infrastruc-
ture development, representative of America’sbottom-up, highly decentralized approach to
managing land use.
Paying for Repairs
For the immediate future, tif and developer im-
pact fees will become more popular and neces-
sary infrastructure funding sources for local
governments, deprived of handouts from Wash-
ington and state capitals. A more ominous prob-
lem will be how these communities pay for
resuscitating aging networks of potholed local
roads and rusting underground sewer and water
mains. Higher taxes of all stripes will be neces-sary, including the formation of special assess-
ment districts. In par ticular, some older subur-
ban areas may be hard hit as tax bills come due
for revamping ine≈cient infrastructure layouts,
symptomatic of sprawl. Once built with hefty
contributions from federal programs, snaking
roads, elongated water district systems, old
dams, and overburdened wastewater plants now
are the responsibility of villages, towns, and
counties. Living in these suburbs promises to
become more expensive. Some rural areas—
with low populations and tax bases—face an
even greater bind.
Tax Incremental FinancingPaying for Local Infrastructure
T
56 infrastructure 2007

8/2/2019 Infrastructure 2007 - A Global Perspective
http://slidepdf.com/reader/full/infrastructure-2007-a-global-perspective 62/69
infrastructure: paying the way 57
obsolete. Toll road operators roll the dice over the potential
introduction of Jetsons-style space cars over the course of
75-year lease terms. “Gas prices could go to the moon, too.”
You never know.
Governments, on the other hand, may undersell assets
or make mistakes in concession agreements that saddle fu-
ture administrations with losses. “But that happens all the
time with public oversight—what about the Big Dig?” In the
U.K. PFI process, the private sector “got knock-down prices
in early transactions, but the public sector became more
savvy and learned, negotiating clawback provisions and
revenue sharing.” France has courts to reopen contracts and
modify terms, based on changed circumstances.
Need for Standards
Negotiating procurement and concession agreements can
result in a tortured process. Private bidders complain about
the lack of standardized forms and procedures across juris-
dictions, which escalates costs in filing proposals and cre-
ate delays. In the U.K., the average tendering period for a
PFI project is almost three years. According to a National
Audit O≈ce (U.K.) audit, government departments under-
estimate the costs for legal and consultant services by an av-
erage of 75 percent. “Negotiating transactions is a work in
progress. Everyone is learning lessons. The technology and
practices are improving, but it’s not perfect.”
No Magic Solution
Investors emphasize that privatization “is not a panacea tothe infrastructure crisis,” rather “it’s a financing tool.” In re-
ality, the nut of the road privatization discussion comes
down to the need for increased user fees to pay infrastruc-
ture costs. Privatization doesn’t create free money—the
public still ends up with the bill. Sums up an investment
manager: “The public needs new infrastructure for eco-
nomic sustainability, the feds won’t pay, locals don’t want to
raise taxes, bond issues are not as attractive, so the best al-
ternative is toll roads and shif ting risk by privatizing.”
For politicians, privatizing roads provides some cover
for instituting tolls or raising them. “They transfer the dirty
work.” Most tolls run by public authorities are “low-balled”
for fear of voter retribution, and private operators can take
the heat better for increases. “Private concessions seek to
find the maximizing point” for expanded volumes at the
highest possible tolls, figuring in congestion pricing mech-
anisms. “The dumbest thing you can do is raise tolls too
high, become a political piñata, and lose volumes.” Most
concession agreements place caps on increases, but private
operators want significant latitude to increase tolls beyond
the typical comfort levels of governors and legislators. “The
price of our inability to raise taxes or user fees for new in-
frastructure is turning responsibility over to the private sec-
tor.” The good news is the pricing system will provide “truer
costs for infrastructure” with prices “the market will bear,
not at prices where politicians think will help them win
votes.”
Blind Eye to the Big Picture
Not surprisingly, the wave of infrastructure fund managers
and investment bankers focuses on finding and negotiating
their next deals, working through encyclopedic agreements
with their government counterparts. Integrated transport
and land use policy remains safely off their radar screens,
unless something might effect a noncompete clause. Some
interviewees from the investment side react quizzically to
the topic of intermodal planning and regional infrastructure
master plans. “Government must remain in the driver’s seat
setting policy—that’s not our job.” But government leaders
do not necessarily connect privatization to broader infra-
structure planning either, seeking money instead for one-
off projects or to fill budget gaps. “It’s discouraging to see
dollars pushed around Wall Street, handing out highway as-
sets to private companies without looking at how these
roads integrate with mass transit and future needs, re-
designing development around interchanges, and building
more high-rise, pedestrian-friendly communities,” says a
planning consultant.
“The privatization process should be wrapped up in
smart growth initiatives. To make it work for more respon-sible land use, funds should be allocated to various inte-
grated transportation projects. Otherwise, privatization just
means more money for more roads for more cars.” “The jury
is out on privatization benefits. Clearly, private owners are
interested in increasing volumes and profits from their as-
sets—they are not focused on integrated solutions or land
use issues.” Government must fill that gap intelligently, de-
voting resources to extensive regional, multimodal planning
incorporating land use and housing.
Narrowed Scope
Public/private partnerships may also have limited applica-
tion in helping finance overall infrastructure needs. “In Eu-
rope, governments have had naïve expectations about what
can be privatized successfully. Railways, waterways, and ur-
ban transport lines have less success in finding private part-
ners” than airports, motorways, hospitals, schools, and
ports. Private operators want to “cherry pick” the prime
high-tra≈cked intercity turnpikes and city-suburban con-

8/2/2019 Infrastructure 2007 - A Global Perspective
http://slidepdf.com/reader/full/infrastructure-2007-a-global-perspective 63/69
58 infrastructure 2007
nectors. Secondary and suburban roads fall off wish lists.
They obviously don’t want to manage vast sections of lightly
traveled rural highways either—“better a New York tunnel
than a prairie road.” “Private investors look for assets with
proven demand and relative monopoly positions that are ca-
pacity constrained and where raising tolls will have limited
impact on volumes.” In the United States, “privatization will
amount to a small piece, a maximum 5 percent of roads.”
Another expert suggests “10 percent.”
More Tolls
Whether managed by private operators or public authori-
ties, the long-term finance trends seem clear for major high-
way arterials, especially around most gridlocked metropol-
itan areas. Governments eventually will impose tolls on
increasing numbers of these roads to raise money for im-
provements and maintenance as well as control tra≈c flows
through congestion pricing schemes. They may start with
new congesting pricing lanes, but will expand from there.
Entire regional road systems ultimately will collect tolls
through transponder technologies, calibrated to tra≈c flows
and rush-hour conditions. Despite initial public distress and
outrage, drivers will swallow electronic tolling and get used
to monthly bills in return for functioning highways. New pri-
vate toll concessions will ease the initiation process, help-
ing “depoliticize tolling and move rates closer to real costs.”
Reality sets in—there won’t be any other viable way to pay
for these roads. “Every urban interstate could make a case
for two additional lanes and each could be tolled.”
Separately tolled, truck-only lanes and corridors will be-come more common to relieve congestion for commuters
and help move freight tra≈c. But truck corridors will require
significant construction funding and impose engineering
challenges, especially related to adding lanes in built-out
suburban areas and through urban environments. Some 24-
hour cities may choose to impose congestion pricing cor-
dons like London’s (see sidebar on page 43).
Higher Taxes
Washington, D.C., will run slam-bang into whether to in-
crease the federal gas tax (currently 18.4 cents per gallon)
in order to maintain solvency of the Highway Trust Fund.
Like the federal government, states will swallow hard be-
fore raising fuel taxes. But when push comes to shove, the
feds and states may have no choice: $50 billion is needed
immediately to fill the gap for basic maintenance of roads
and transit systems, with an additional $50 billion required
for necessary improvements. People gradually will come to
grips with the reality of higher driving costs to pay for in-
frastructure, including tolls and higher fuel taxes.
Global positioning technologies eventually could su-
persede pump-exacted fuel taxes and tolling by charging
fees based on vehicle miles traveled over specific road net-
works. These tracking systems also could impose sur-
charges for congestion pricing, car weight, and vehicle
emissions—all designed to help tra≈c flows and orient be-
haviors around e≈cient vehicle use. In addition, parking
fees and assessments will become more common not only
in cities, but also in many suburban areas. Transit fares will
steadily climb, too.
Other primary infrastructure funding sources will con-
tinue to derive from state income and sales taxes and local
property taxes, including special tax districts for improve-
ments and upkeep of community streets and water/sewer
systems (see sidebar page on 55). Six large states (Califor-
nia, New York, Pennsylvania, Virginia, Massachusetts, and
Indiana) dedicate a portion of sales taxes to transit and other
states earmark sales taxes for highway expenditures. Nearly
30 states have enacted legislation allowing impact fees
charged to developers for funding streets and water/sewer
infrastructure associated with projects. These costs ulti-
mately get passed on to tenants and buyers through higher
rents and sales prices.
States and cities will continue to use bonding authority
to raise funding through securitizations, which can offer in-
vestors attractive tax-free returns.
Equitable Cost Burdens
Regions may need to rethink how to pay for the benefits of
their established 24-hour cores and integrated infrastruc-
tures, which make surrounding suburbs more viable and
cheaper. “Many people have moved out of the center city,
because of high taxes and living costs, but still work there
because of opportunities. Commuters get bargains—they
use the urban core, the transit, the sewers, the sidewalks,
but don’t pay the full costs, which falls on city taxpayers.”
Various forms of commuter taxes would make the costs and
benefits more equitable for taxpayers across regions and
help “avoid a free lunch for discounted use of infrastruc-
ture.” New York State recently forced New York City to drop
its commuter tax in a gesture to suburban residents. But the
infrastructure discussion and higher driving-related costs
may force changes in how people value housing, location,
roads, and transit. . . eventually.

8/2/2019 Infrastructure 2007 - A Global Perspective
http://slidepdf.com/reader/full/infrastructure-2007-a-global-perspective 64/69
infrastructure: paying the way 59
figure 23.
Where Will the Money
Come From?
State Departments of
Transportation Rated the
Likelihood of RaisingFunds from Various
Sources
Source: ULI survey of direc-
tors of planning for state de
partments of transportation
unlikely
34%
likely
63%
indifferent
3%
unlikely
24%
likely
73%
indifferent
3%
unlikely
44%
privatization
increasing
user fees
increasing taxes
likely
37%
indifferent
19%

8/2/2019 Infrastructure 2007 - A Global Perspective
http://slidepdf.com/reader/full/infrastructure-2007-a-global-perspective 65/69
61
The Urban Land Institute conducted
a survey of directors of planning for
state departments of transportation
in February and March of 2007. The
goal of the study was to ascertain
how administrators directly involved
with transportation viewed their
current situation and their future
challenges. Below is a list of states
that responded to the survey:
Alabama
Alaska
Arizona
Arkansas
California
Colorado
Connecticut
Delaware
District of Columbia
Idaho
Illinois
Iowa
Kansas
Maine
Minnesota
Mississippi
Missouri
Nevada
New Hampshire
New JerseyNew Mexico
Ohio
Oklahoma
Oregon
Pennsylvania
Rhode Island
South Carolina
Washington
Wisconsin
Wyoming
*All charts and graphs in this report
were compiled and completed in
March 2007 (unless otherwise noted)
and the data reflect the most current
available at that time.
Interviewees
Thomas Bradshaw, Jr.
Director and Cohead
Transportation Group
Citigroup Global Markets
Robert Cervero
Professor and Chair of Regional
PlanningUniversity of California at Berkeley
James Crutcher
ING Real Estate
James Curtis
Principal
Bristol Group, Inc.
Robert Dove
Infrastructure Investment Team
The Carlyle Group
Mark Florian
Managing Director
Goldman Sachs & Co.
Douglas Foy
DIF Enterprises
Kevin Honey
Partner
Ernst & Young United Kingdom
Gregory Hummel
Partner
Bell, Boyd & Lloyd, llc
Max Johnson
ING Real Estate
Eva Lerner-LamPalisades Consulting Group
John Miller
Patton Boggs, llp
James Neal
Partner
Ernst & Young
Kevin Nelson
Senior Vice President/Managing
Principal
Carter & Burgess, Inc.
Michael Pagano
Great Cities Institute ProfessorUniversity of Illinois at Chicago
David Perry
Associate Chancellor, Great Cities
University of Illinois at Chicago
Tim Philpotts
Senior Vice President
Ernst & Young Canada
Dale Anne Reiss
Global and Americas
Director of Real Estate
Ernst & Young
Arturo Ressi di Cervia
Kiewit Construction
Jack Short
Secretary General
European Conference of Ministers of Transport (ecmt)
Brian Taylor
Director, Institute of Transportation
Studies
University of California at
Los Angeles
Trent Vichie
Macquarie Securities (usa), Inc.
Carl Weisbrod
Chair, ULI Infrastructure Initiative
President, Real Estate Division
Trinity Church
C. Michael Walton
Ernest H. Cockrell Centennial Chair
in Engineering
University of Texas at Austin
Tom Warne
President
Tom Warne and Associates, llc
Mark Weisdorf
JP Morgan

8/2/2019 Infrastructure 2007 - A Global Perspective
http://slidepdf.com/reader/full/infrastructure-2007-a-global-perspective 66/69
62
Forum Participants
New York City: June 13–14, 2006
Washington, D.C.: December 4–5,
2006
Mumbai, India: February 28, 2007
Mahlon Apgar, IV
Director
Boston Consulting Group, Inc.
Jamshed Banaji
Banaji Associates
Richard Baron
Chief Executive O∑er
McCormack Baron Salazar
Thomas Bradshaw, Jr.
Managing Director
Citigroup Global Markets Inc.
Andrea Carpenter
Managing Director
European Centre for Regeneration
and Stability
Robert Cervero
Department of Regional & City
Planning
University of California at Berkeley
Poorvi Chothani
LawQuest
John Crowley
College of Environment and Design
University of Georgia
Cheryl Cummins
President
ULI Americas
James Curtis, III
Principal
Bristol Group, Inc.
Maria Day-Marshall
Senior Business Manager
Fannie Mae
Frederick Dock
Principal
Meyer, Mohaddes Associates
Robert Dove
Infrastructure and Investment Team
The Carlyle Group
Steven Feldman
Managing Director
Goldman, Sachs & Co.
Gary Fenchuk
President
East West Partners of Virginia
Mark Florian
Managing Director
Goldman, Sachs & Co.
Douglas Foy
dif Enterprises
Merrie Frankel
Vice President
Moody's Investors Service
Felicity Gates
Managing Director CIO
rreef Infrastructure
Kumar Gera
Managing Director
Gera Developments
Arthur Guzzetti
Director of Policy and Advocacy
American Public Transportation
Association
Gregory Hummel
Member
Bell, Boyd & Lloyd, llc
Kenneth Jackson
Professor
Columbia University
Roopesh Kaul
President and COO
Maker Development
Services, Pvt. Ltd.
Gary Killian
Managing Director
Lehman Brothers
William Kistler
President
ULI Europe
Sanjaya Kulkarni
IndusInd Bank
Krishna Kumar
Partner
ILXFS Investment Managers
Charles Leitner
Global Head
rreef/db Real Estate
Richard Little
Director, Keston Insitute
University of Southern California
Alex Marshall
Senior Fellow
Regional Plan Association
Laurin McCracken
Chief Marketing O≈cer
Carter & Burgess, Inc.
William Millar
American Public Transportation
Association
John Miller
Of Counsel
Patton Boggs, llp
Deborah Myerson
Deborah Myerson Planning and
Development Consulting
Chetan Narain
Chief Executive O≈cer
Narains Corp.
Sanjeet Narain
Narains Corp.
Kevin Nelson
Senior Vice President
Carter & Burgess, Inc.
Pratap Vijay Padode
Infrastructure Today
Michael Pagano
Fellow
University of Illinois at Chicago
Robert Palmer
HNTB Corporation
David Perry
Associate Chancellor, Great Cities
University of Illinois at Chicago

8/2/2019 Infrastructure 2007 - A Global Perspective
http://slidepdf.com/reader/full/infrastructure-2007-a-global-perspective 67/69
63
Mark Pisano
Executive Director
Southern California Association of
Governments
Robert Puentes
Fellow
Brookings Institution
Shrikant Rao
Infrastructure Today
Dale Anne Reiss
Global and Americas Director
of Real Estate
Ernst & Young
Alex Rose
Vice President
Continental Development
Corporation
Catherine RossDirector
Center for Quality Growth and
Regional Development
Elliott Sander
Senior Vice President
dmjm+Harris
Mark Schneider
Fourth River Development
Sushi Shyamal
Ernst & Young India
Marilyn Taylor
Partner
Skidmore, Owings & Merrill
Jagdish Valecha
Managing Director
Valecha Engineering Ltd.
Rudy Vercelli
COO
Mumbai International
Airport Pvt. Ltd.
Trent Vichie
Associate Director
Macquarie Securities (USA) Inc.
Thomas Wakeman, III
General Manager
Waterways Development Port
Authority of NY & NJ
Angela Watson
Land Use Coordinator
PennDOT Program Center
Richard Weaver
Manager, Planning and Programs
American Public Transportation
Association
Carl Weisbrod
President
Real Estate Division, Trinity Church
Robert Yaro
President
Regional Plan Association

8/2/2019 Infrastructure 2007 - A Global Perspective
http://slidepdf.com/reader/full/infrastructure-2007-a-global-perspective 68/69
64
ULI–the Urban Land Institute is a nonprofit research and ed-
ucation organization that is supported by its members. Its
mission is to provide responsible leadership in the use of
land in order to enhance the total environment.
The Institute maintains a membership representing a
broad spectrum of interests and sponsors a wide variety of
educational programs and forums to encourage an open ex-
change of ideas and sharing of experience. ULI initiates re-
search that anticipates emerging land use trends and issues
and provides advisory services; and publishes a wide vari-
ety of materials to disseminate information on land use de-
velopment.
Established in 1936, the Institute today has more than
34,000 members and associates from some 92 countries,
representing the entire spectrum of the land use and de-
velopment disciplines. Professionals represented include
developers, builders, property owners, investors, architects,
public officials, planners, real estate brokers, appraisers, at-
torneys, engineers, financiers, academics, students, and li-
brarians. ULI relies heavily on the experience of its mem-
bers. It is through member involvement and information
resources that ULI has been able to set standards of excel-
lence in development practice. The Institute is recognized
internationally as one of America’s most respected and
widely quoted sources of objective information on urban
planning, growth, and development.
senior executives
Richard M. Rosan
President, ULI Worldwide
Cheryl Cummins
President, ULI Americas
William Kistler
President, ULI Europe
Maureen McAvey
Executive Vice President, Initiatives
Rachelle L. LevittExecutive Vice President, Information Group
ULI–the Urban Land Institute
1025 Thomas Jefferson Street, N.W.
Suite 500 West
Washington, D.C. 20007
Telephone: 202-624-7000
www.uli.org
Ernst & Young is the largest integrated real estate practice
of any accounting firm, with 5,000 professionals around
the world providing audit, tax, and transaction advisory ser-
vices to real estate owners, investors, lenders, and users—
including many reits, homebuilders, and developers. Our
unique approach combines entrepreneurial thinking and a
working knowledge of real estate issues with broad real
estate experience, vast resources, and diverse network
of clients and contacts. Ernst & Young serves more than
4,000 real estate clients across the country and through-
out the world. For more about Ernst & Young’s Global Real
Estate Center, log on to www.ey.com/realestate.
Ernst & Young, a global leader in professional services,
is committed to restoring the public's trust in professional
services firms and in the quality of financial reporting. Its
114,000 people in 140 countries pursue the highest levels
of integrity, quality, and professionalism in providing a range
of sophisticated services centered on core competencies of
auditing, accounting, tax, and transactions. Further infor-
mation about Ernst & Young and its approach to a variety of
business issues can be found at www.ey.com/perspectives.
Ernst & Young refers to the global organization of member
firms of Ernst & Young Global Limited, each of which is a
separate legal entity. Ernst & Young Global Limited does not
provide services to clients.
global real estate leadership
Dale Anne Reiss: Global & Americas Director of Real
Estate, +1 212 773 4500
Ad Buisman: European Real Estate Coordinator,
+31 55 529 1428
James Neal: Infrastructure, +44 (0) 20 7951 6333
Chris Lawton: Infrastructure, +1 212 773 6020
Dean Hodcroft: Northern Europe, Middle East, India,
and Africa, +44 (0) 20 7951 4870
Michael Hornsby: Continental Western Europe,+352 42 124 8310
Hartmut Fründ: Central Europe, +49 6196 99 62 6351
Soo Hock Teoh: Far East, +60 37495 8717
Tom Brown: Japan, +81 3 3503 2093
Stephen Chubb: Oceania, +61 2 9248 4799
Sponsoring
Organizations

8/2/2019 Infrastructure 2007 - A Global Perspective
http://slidepdf.com/reader/full/infrastructure-2007-a-global-perspective 69/69
Infrastructure 2007 a global perspective
Now more than ever, the ability to construct, maintain, and finance infrastructure has become a
concern of paramount importance for communities worldwide. Infrastructure—the skeleton around
which a city is built—dictates how we move people and goods.
As public funds dwindle and support through taxation becomes less viable, the private sec-tor, awash in investment capital and looking for secure assets, is coming to the rescue. Urban in-
frastructure has begun to emerge as a major investment class, promising both income and capi-
tal returns.
Based on research and expert advice from forums that brought together industry leaders in
development, design, finance, engineering, and the public sector, Infrastructure 2007: A Global
Perspective examines trends in infrastructure and finance and the effect on the built environment.
ı Discover new forms of infrastructure and learn about the creation of capital markets products
to finance them.
ı Gain awareness of public infrastructure and its essential role in communities in the United
States, Europe, India, and China.
ı Explore new forms of infrastructure financing and understand the role played by public finance.
ı Understand the role of infrastructure in the urban form, and the current state of infrastructure
repair and maintenance.
ı Get ideas and information from the success stories of other cities that have achieved their goals.
ı Read about best practices and trends.
ı Reinforce what you learn from the text with abundant full-color illustrations: photographs,
charts, and tables.