Embed Size (px)
Citation preview
Infrared measurements and simulations of metal meshes in a focused beam
K. P. Stewart,1,a) K. D. M€oller,2 and H. Grebel21Naval Research Laboratory, 4555 Overlook Avenue SW, Washington, DC 20375, USA2Electrical Engineering Department, New Jersey Institute of Technology, Electronic Imaging Center, Newark,New Jersey 07102, USA
(Received 6 September 2013; accepted 27 January 2014; published online 6 February 2014)
Infrared transmittance measurements of quasioptical filters are often restricted to a focused beam
due to the optical design of the spectrometer. In contrast, numerical simulations assume an incident
plane wave, which makes it difficult to compare theory with experimental data. We compare
transmittance measurements with numerical simulations of square arrays of circular holes in 3-lm
thick Cu sheets at angles of incidence from 0� to 20� for both s and p polarizations. These simple
structures allow detailed tests of our electromagnetic simulation methods and show excellent
agreement between theory and measurement. Measurements in a focused beam are accurately
simulated by combining plane wave calculations over a range of angles that correspond to the focal
ratio of the incident beam. Similar screens have been used as components of narrow bandpass
filters for far-infrared astronomy, but these results show that the transmittance variations with angle
of incidence and polarization limit their use to collimated beams at near normal incidence. The
simulations are accurate enough to eliminate a costly trial-and-error approach to the design of more
complex and useful quasioptical infrared filters and to predict their in-band performance and
out-of-band blocking in focused beams. VC 2014 AIP Publishing LLC.
[http://dx.doi.org/10.1063/1.4864663]
I. INTRODUCTION
Periodic metal/dielectric structures have been used for
spectral filter applications in the infrared to terahertz region
for many years.1,2 A study of metal screens with a rectangu-
lar periodic array of square-shaped apertures has been pub-
lished in a forgoing paper,3 and will now be extended to the
angular and polarization dependence of metal screens with a
rectangular array of circular apertures.
Filters for astrophysical and remote sensing applications
are often designed by assuming incident plane waves, but
tested in a spectrometer with a focused beam, and used in
an instrument with yet another focal ratio. This can result in
disagreement between predicted and measured optical proper-
ties and unexpected spectral features when used as a compo-
nent of an astronomical sensor. It is possible to accurately
predict the performance by averaging a series of plane wave
simulations over a range of angles corresponding to the f num-
ber or cone angle of the instrument in which the filter will be
used. We tested this averaging process by comparing the calcu-
lations with measurements of thin screens with circular holes
arranged in a square array. Similar structures have been used
as components of bandpass filters and as dichroic reflectors.4
Predicting the performance in a focused beam is impor-
tant because improvements in background-limited detectors
are rapidly moving far-infrared instrumentation to high
throughput, large solid angle systems to improve sensitivity
and mapping speed. It is necessary to control the light incident
on the focal plane over a large range of angles, while simulta-
neously defining the spectral band. In order to capture the full
benefits of such design approaches, when implemented with
quasioptical filters, the out-of-band response as a function of
angle needs to be understood and controlled throughout the
design and implementation process. Failure to account for
filter response at large angles of incidence has required modifi-
cations to several astrophysics research instruments.5–7
At these submillimeter wavelengths, the structure can be
thick enough to be freestanding, which eliminates the com-
plications of dielectric substrates, and to prevent transmis-
sion through the metal film, but thin enough, t/k � 0.03, to
eliminate additional waveguide modes.8–10
II. EXPERIMENT
Metal screens with circular holes in a rectangular array
were made of Cu with high accuracy using commercial electro-
forming equipment. The periodicity of the array g¼ 100 lm,
the hole diameter d¼ 50 lm, and nominal thickness t¼ 5 lm.
The actual thickness was measured with a Tencor Alpha-Step
profilometer to be 3 lm, which is approximately 80 times the
skin depth for Cu at a wavelength of 100lm, assuming the
bulk value of 5.88� 10�8 X m for the resistivity. A thickness
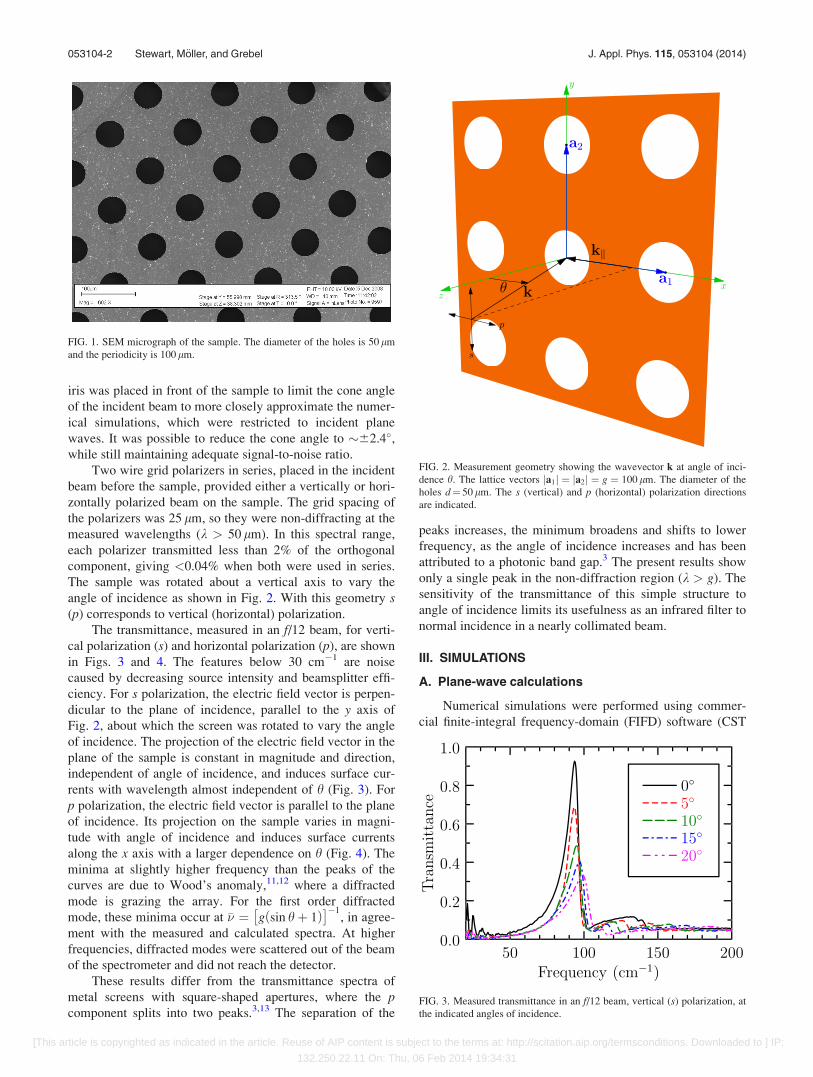
of 3 lm was assumed in the numerical simulations. Fig. 1 is
an image of the sample taken with a scanning electron
microscope.
The transmission spectra were measured at a spectral
resolution of D�� ¼ 1 cm�1 in a vacuum FTIR spectrometer
using a mercury arc source and a liquid-helium-cooled
bolometer. The entrance aperture of the spectrometer was
12 mm. Despite not being a point source, calculations which
assumed a single-mode plane wave incident on the sample
agreed well with the measurements, as shown below.
Because the beam in the sample chamber was focused, ana)[email protected]
0021-8979/2014/115(5)/053104/6/$30.00 VC 2014 AIP Publishing LLC115, 053104-1
JOURNAL OF APPLIED PHYSICS 115, 053104 (2014)
[This article is copyrighted as indicated in the article. Reuse of AIP content is subject to the terms at: http://scitation.aip.org/termsconditions. Downloaded to ] IP:
132.250.22.11 On: Thu, 06 Feb 2014 19:34:31
iris was placed in front of the sample to limit the cone angle
of the incident beam to more closely approximate the numer-
ical simulations, which were restricted to incident plane
waves. It was possible to reduce the cone angle to �62.4�,while still maintaining adequate signal-to-noise ratio.
Two wire grid polarizers in series, placed in the incident
beam before the sample, provided either a vertically or hori-
zontally polarized beam on the sample. The grid spacing of
the polarizers was 25 lm, so they were non-diffracting at the
measured wavelengths (k > 50 lm). In this spectral range,
each polarizer transmitted less than 2% of the orthogonal
component, giving <0.04% when both were used in series.
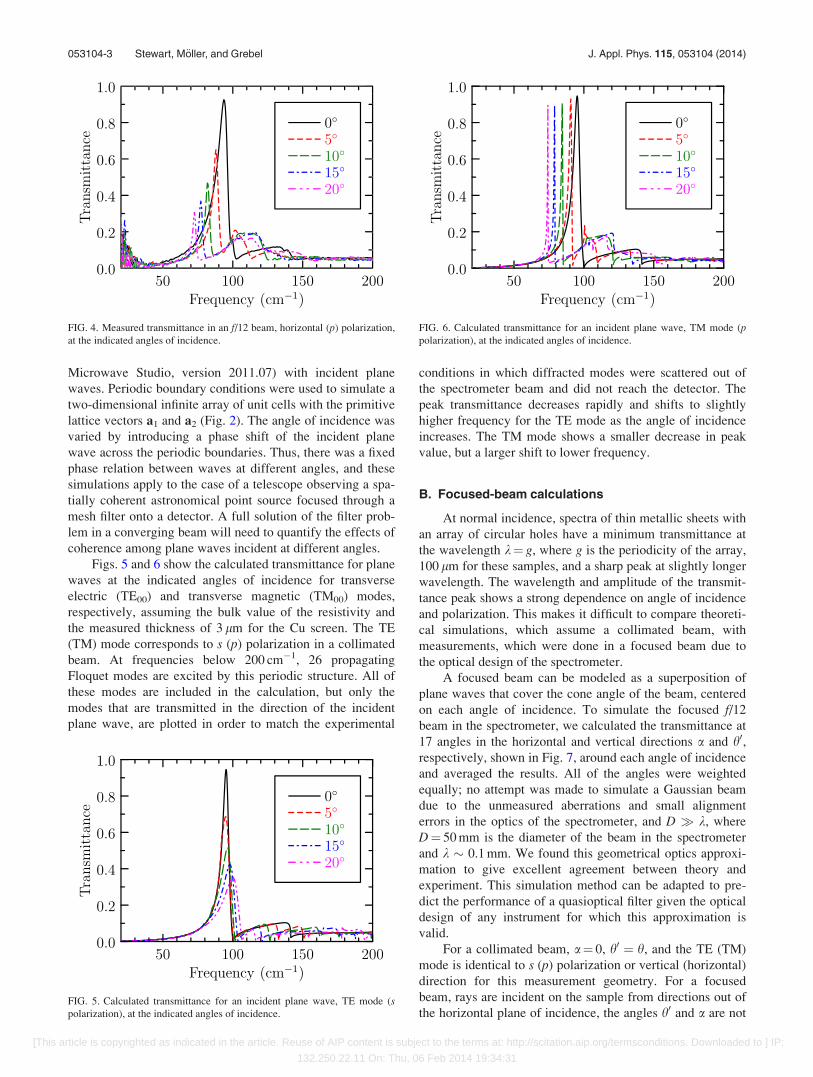
The sample was rotated about a vertical axis to vary the
angle of incidence as shown in Fig. 2. With this geometry s(p) corresponds to vertical (horizontal) polarization.
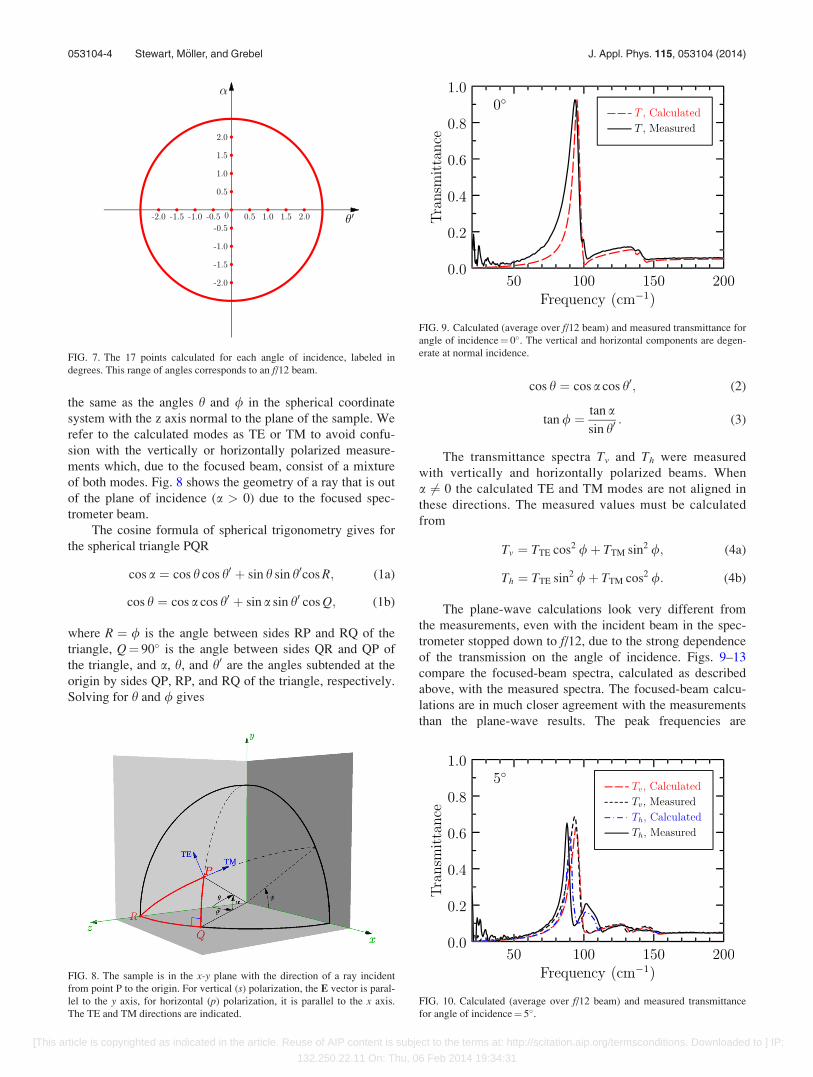
The transmittance, measured in an f/12 beam, for verti-
cal polarization (s) and horizontal polarization (p), are shown
in Figs. 3 and 4. The features below 30 cm�1 are noise
caused by decreasing source intensity and beamsplitter effi-
ciency. For s polarization, the electric field vector is perpen-
dicular to the plane of incidence, parallel to the y axis of
Fig. 2, about which the screen was rotated to vary the angle
of incidence. The projection of the electric field vector in the
plane of the sample is constant in magnitude and direction,
independent of angle of incidence, and induces surface cur-
rents with wavelength almost independent of h (Fig. 3). For
p polarization, the electric field vector is parallel to the plane
of incidence. Its projection on the sample varies in magni-
tude with angle of incidence and induces surface currents
along the x axis with a larger dependence on h (Fig. 4). The
minima at slightly higher frequency than the peaks of the
curves are due to Wood’s anomaly,11,12 where a diffracted
mode is grazing the array. For the first order diffracted
mode, these minima occur at �� ¼ g sin hþ 1ð Þ� ��1
, in agree-
ment with the measured and calculated spectra. At higher
frequencies, diffracted modes were scattered out of the beam
of the spectrometer and did not reach the detector.
These results differ from the transmittance spectra of
metal screens with square-shaped apertures, where the pcomponent splits into two peaks.3,13 The separation of the
peaks increases, the minimum broadens and shifts to lower
frequency, as the angle of incidence increases and has been
attributed to a photonic band gap.3 The present results show
only a single peak in the non-diffraction region (k > g). The
sensitivity of the transmittance of this simple structure to
angle of incidence limits its usefulness as an infrared filter to
normal incidence in a nearly collimated beam.
III. SIMULATIONS
A. Plane-wave calculations
Numerical simulations were performed using commer-
cial finite-integral frequency-domain (FIFD) software (CST
FIG. 1. SEM micrograph of the sample. The diameter of the holes is 50 lm
and the periodicity is 100 lm.
FIG. 2. Measurement geometry showing the wavevector k at angle of inci-
dence h. The lattice vectors ja1j ¼ ja2j ¼ g ¼ 100 lm. The diameter of the
holes d¼ 50 lm. The s (vertical) and p (horizontal) polarization directions
are indicated.
FIG. 3. Measured transmittance in an f/12 beam, vertical (s) polarization, at
the indicated angles of incidence.
053104-2 Stewart, M€oller, and Grebel J. Appl. Phys. 115, 053104 (2014)
[This article is copyrighted as indicated in the article. Reuse of AIP content is subject to the terms at: http://scitation.aip.org/termsconditions. Downloaded to ] IP:
132.250.22.11 On: Thu, 06 Feb 2014 19:34:31
Microwave Studio, version 2011.07) with incident plane
waves. Periodic boundary conditions were used to simulate a
two-dimensional infinite array of unit cells with the primitive
lattice vectors a1 and a2 (Fig. 2). The angle of incidence was
varied by introducing a phase shift of the incident plane
wave across the periodic boundaries. Thus, there was a fixed
phase relation between waves at different angles, and these
simulations apply to the case of a telescope observing a spa-
tially coherent astronomical point source focused through a
mesh filter onto a detector. A full solution of the filter prob-
lem in a converging beam will need to quantify the effects of
coherence among plane waves incident at different angles.
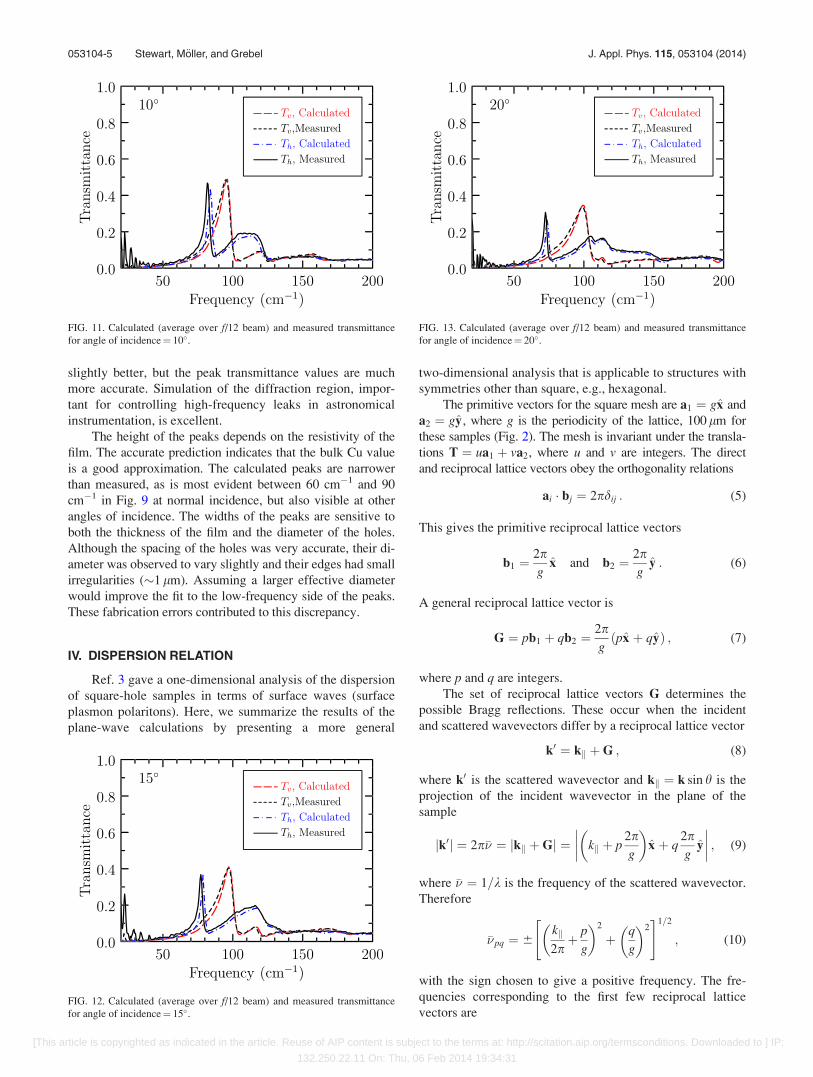
Figs. 5 and 6 show the calculated transmittance for plane
waves at the indicated angles of incidence for transverse
electric (TE00) and transverse magnetic (TM00) modes,
respectively, assuming the bulk value of the resistivity and
the measured thickness of 3 lm for the Cu screen. The TE
(TM) mode corresponds to s (p) polarization in a collimated
beam. At frequencies below 200 cm�1, 26 propagating
Floquet modes are excited by this periodic structure. All of
these modes are included in the calculation, but only the
modes that are transmitted in the direction of the incident
plane wave, are plotted in order to match the experimental
conditions in which diffracted modes were scattered out of
the spectrometer beam and did not reach the detector. The
peak transmittance decreases rapidly and shifts to slightly
higher frequency for the TE mode as the angle of incidence
increases. The TM mode shows a smaller decrease in peak
value, but a larger shift to lower frequency.
B. Focused-beam calculations
At normal incidence, spectra of thin metallic sheets with
an array of circular holes have a minimum transmittance at
the wavelength k¼ g, where g is the periodicity of the array,
100 lm for these samples, and a sharp peak at slightly longer
wavelength. The wavelength and amplitude of the transmit-
tance peak shows a strong dependence on angle of incidence
and polarization. This makes it difficult to compare theoreti-
cal simulations, which assume a collimated beam, with
measurements, which were done in a focused beam due to
the optical design of the spectrometer.
A focused beam can be modeled as a superposition of
plane waves that cover the cone angle of the beam, centered
on each angle of incidence. To simulate the focused f/12
beam in the spectrometer, we calculated the transmittance at
17 angles in the horizontal and vertical directions a and h0,respectively, shown in Fig. 7, around each angle of incidence
and averaged the results. All of the angles were weighted
equally; no attempt was made to simulate a Gaussian beam
due to the unmeasured aberrations and small alignment
errors in the optics of the spectrometer, and D � k, where
D¼ 50 mm is the diameter of the beam in the spectrometer
and k � 0.1 mm. We found this geometrical optics approxi-
mation to give excellent agreement between theory and
experiment. This simulation method can be adapted to pre-
dict the performance of a quasioptical filter given the optical
design of any instrument for which this approximation is
valid.
For a collimated beam, a¼ 0, h0 ¼ h, and the TE (TM)
mode is identical to s (p) polarization or vertical (horizontal)
direction for this measurement geometry. For a focused
beam, rays are incident on the sample from directions out of
the horizontal plane of incidence, the angles h0 and a are notFIG. 5. Calculated transmittance for an incident plane wave, TE mode (spolarization), at the indicated angles of incidence.
FIG. 6. Calculated transmittance for an incident plane wave, TM mode (ppolarization), at the indicated angles of incidence.
FIG. 4. Measured transmittance in an f/12 beam, horizontal (p) polarization,
at the indicated angles of incidence.
053104-3 Stewart, M€oller, and Grebel J. Appl. Phys. 115, 053104 (2014)
[This article is copyrighted as indicated in the article. Reuse of AIP content is subject to the terms at: http://scitation.aip.org/termsconditions. Downloaded to ] IP:
132.250.22.11 On: Thu, 06 Feb 2014 19:34:31
the same as the angles h and / in the spherical coordinate
system with the z axis normal to the plane of the sample. We
refer to the calculated modes as TE or TM to avoid confu-
sion with the vertically or horizontally polarized measure-
ments which, due to the focused beam, consist of a mixture
of both modes. Fig. 8 shows the geometry of a ray that is out
of the plane of incidence (a > 0) due to the focused spec-
trometer beam.
The cosine formula of spherical trigonometry gives for
the spherical triangle PQR
cos a ¼ cos h cos h0 þ sin h sin h0cos R; (1a)
cos h ¼ cos a cos h0 þ sin a sin h0 cos Q; (1b)
where R ¼ / is the angle between sides RP and RQ of the
triangle, Q¼ 90� is the angle between sides QR and QP of
the triangle, and a, h, and h0 are the angles subtended at the
origin by sides QP, RP, and RQ of the triangle, respectively.
Solving for h and / gives
cos h ¼ cos a cos h0; (2)
tan / ¼ tan a
sin h0: (3)
The transmittance spectra Tv and Th were measured
with vertically and horizontally polarized beams. When
a 6¼ 0 the calculated TE and TM modes are not aligned in
these directions. The measured values must be calculated
from
Tv ¼ TTE cos2 /þ TTM sin2 /; (4a)
Th ¼ TTE sin2 /þ TTM cos2 /: (4b)
The plane-wave calculations look very different from
the measurements, even with the incident beam in the spec-
trometer stopped down to f/12, due to the strong dependence
of the transmission on the angle of incidence. Figs. 9–13
compare the focused-beam spectra, calculated as described
above, with the measured spectra. The focused-beam calcu-
lations are in much closer agreement with the measurements
than the plane-wave results. The peak frequencies are
FIG. 8. The sample is in the x-y plane with the direction of a ray incident
from point P to the origin. For vertical (s) polarization, the E vector is paral-
lel to the y axis, for horizontal (p) polarization, it is parallel to the x axis.
The TE and TM directions are indicated.
FIG. 9. Calculated (average over f/12 beam) and measured transmittance for
angle of incidence¼ 0�. The vertical and horizontal components are degen-
erate at normal incidence.FIG. 7. The 17 points calculated for each angle of incidence, labeled in
degrees. This range of angles corresponds to an f/12 beam.
FIG. 10. Calculated (average over f/12 beam) and measured transmittance
for angle of incidence¼ 5�.
053104-4 Stewart, M€oller, and Grebel J. Appl. Phys. 115, 053104 (2014)
[This article is copyrighted as indicated in the article. Reuse of AIP content is subject to the terms at: http://scitation.aip.org/termsconditions. Downloaded to ] IP:
132.250.22.11 On: Thu, 06 Feb 2014 19:34:31
slightly better, but the peak transmittance values are much
more accurate. Simulation of the diffraction region, impor-
tant for controlling high-frequency leaks in astronomical
instrumentation, is excellent.
The height of the peaks depends on the resistivity of the
film. The accurate prediction indicates that the bulk Cu value
is a good approximation. The calculated peaks are narrower
than measured, as is most evident between 60 cm�1 and 90
cm�1 in Fig. 9 at normal incidence, but also visible at other
angles of incidence. The widths of the peaks are sensitive to
both the thickness of the film and the diameter of the holes.
Although the spacing of the holes was very accurate, their di-
ameter was observed to vary slightly and their edges had small
irregularities (�1 lm). Assuming a larger effective diameter
would improve the fit to the low-frequency side of the peaks.
These fabrication errors contributed to this discrepancy.
IV. DISPERSION RELATION
Ref. 3 gave a one-dimensional analysis of the dispersion
of square-hole samples in terms of surface waves (surface
plasmon polaritons). Here, we summarize the results of the
plane-wave calculations by presenting a more general
two-dimensional analysis that is applicable to structures with
symmetries other than square, e.g., hexagonal.
The primitive vectors for the square mesh are a1 ¼ gx and
a2 ¼ gy, where g is the periodicity of the lattice, 100 lm for
these samples (Fig. 2). The mesh is invariant under the transla-
tions T ¼ ua1 þ va2, where u and v are integers. The direct
and reciprocal lattice vectors obey the orthogonality relations
ai � bj ¼ 2pdij : (5)
This gives the primitive reciprocal lattice vectors
b1 ¼2pg
x and b2 ¼2pg
y : (6)
A general reciprocal lattice vector is
G ¼ pb1 þ qb2 ¼2pgðpx þ qyÞ ; (7)
where p and q are integers.
The set of reciprocal lattice vectors G determines the
possible Bragg reflections. These occur when the incident
and scattered wavevectors differ by a reciprocal lattice vector
k0 ¼ kk þG ; (8)
where k0 is the scattered wavevector and kk ¼ k sin h is the
projection of the incident wavevector in the plane of the
sample
jk0j ¼ 2p�� ¼ jkk þGj ¼���� kk þ p
2pg
� �x þ q
2pg
y
���� ; (9)
where �� ¼ 1=k is the frequency of the scattered wavevector.
Therefore
��pq ¼ 6kk2pþ p
g
� �2
þ q
g
� �2" #1=2
; (10)
with the sign chosen to give a positive frequency. The fre-
quencies corresponding to the first few reciprocal lattice
vectors are
FIG. 11. Calculated (average over f/12 beam) and measured transmittance
for angle of incidence¼ 10�.
FIG. 12. Calculated (average over f/12 beam) and measured transmittance
for angle of incidence¼ 15�.
FIG. 13. Calculated (average over f/12 beam) and measured transmittance
for angle of incidence¼ 20�.
053104-5 Stewart, M€oller, and Grebel J. Appl. Phys. 115, 053104 (2014)
[This article is copyrighted as indicated in the article. Reuse of AIP content is subject to the terms at: http://scitation.aip.org/termsconditions. Downloaded to ] IP:
132.250.22.11 On: Thu, 06 Feb 2014 19:34:31

��610 ¼ 6kk2pþ 1
g; (11a)
��061 ¼kk2p
� �2
þ 1
g2
" #1=2
; (11b)
��611 ¼ ��61�1 ¼kk2p
61
g
� �2
þ 1
g2
" #1=2
: (11c)
Figs. 14 and 15 show the calculated transmittance data
of Figs. 5 and 6, respectively, plotted as a function of fre-
quency (cm–1) and the component of the incident wavevector
in the plane of the sample. The reciprocal lattice modes,
Eqs. (11), indicated by the dashed white lines, match features
in the spectra and are listed in Table I. The q¼ 0 modes are
not seen in the TE spectra.
V. CONCLUSIONS
Transmission through a periodic array of circular holes
is accurately described by numerical simulations averaged
over a range of angles that correspond to the focal ratio of
the incident beam. We have demonstrated quantitative agree-
ment between theory and experiment for both polarizations
at various angles of incidence. Because all propagating
modes are calculated, any diffracted energy that is scattered
into the transmitted beam by subsequent layers of multilayer
filters would be included. This method can be used to predict
and understand not only the in-band properties of quasiopti-
cal metal mesh filters, but also the high-frequency region,
where diffraction from the periodic structures can cause
unexpected leaks which, if not accounted for, can degrade
instrument performance.
ACKNOWLEDGMENTS
This material was based upon work supported by the
National Aeronautics and Space Administration under Grant
No. NNH08AI91I issued through the Science Mission
Directorate.
1R. Ulrich, Appl. Opt. 7, 1987 (1968).2S. P. Varma and K. D. M€oller, Appl. Opt. 8, 1663 (1969).3O. Sternberg, K. P. Stewart, Y. Hor, A. Bandyopadhyay, J. F. Federici, M.
Bornefeld, Y.-L. Mathis, D. Sliwinski, K. D. M€oller, and H. Grebel,
J. Appl. Phys. 104, 023103 (2008).4T. Timusk and P. L. Richards, Appl. Opt. 20, 1355 (1981).5C. D. Dowell, C. A. Allen, S. Babu, M. M. Freund, M. B. Gardner, J.
Groseth, M. Jhabvala, A. Kovacs, D. C. Lis, S. H. Moseley, T. G. Phillips,
R. Silvelberg, G. Voellmer, and H. Yoshida, Proc. SPIE 4855, 73 (2003).6E. H. Sharp, D. J. Benford, D. J. Fixsen, S. H. Moseley, J. G. Stagun, and
E. J. Wollack, Proc. SPIE 8452, 845231 (2012).7P. Gallardo, R. D€unner, E. Wollack, F. Henriquez, and C. Jerez-Hanckes,
Proc. SPIE 8452, 845224 (2012).8K. D. M€oller, O. Sternberg, H. Grebel, and P. Lalanne, J. Appl. Phys. 91,
9461 (2002).9A. Roberts, M. L. von Bibra, H.-P. Gem€und, and E. Kreysa, Int. J. Infrared
Milli. Waves 15, 505 (1994).10A. L€uker, H. Hein, J. Schulz, N. Dombrowsky, O. Sternberg, M. J.
Sweetgall, K. Abdijalilov, K. D. M€oller, and H. Grebel, Infrared Phys.
Technol. 51, 178 (2008).11R. W. Wood, Philos. Mag. 4, 396 (1902); Phys. Rev. 48, 928 (1935).12A. Hessel and A. A. Oliner, Appl. Opt. 4, 1275 (1965).13H. M. Pickett, J. Farhoomand, and A. E. Chiou, Appl. Opt. 23, 4228
(1984).
FIG. 14. Calculated dispersion diagram for the TE mode. The reciprocal lat-
tice vectors responsible for the spectral features are labeled and plotted as
dashed white lines. The Brillouin zone boundary is at p/g¼ 314 cm�1.
FIG. 15. Calculated dispersion diagram for the TM mode. The reciprocal
lattice vectors responsible for the spectral features are labeled and plotted as
dashed white lines. The Brillouin zone boundary is at p/g¼ 314 cm�1.
TABLE I. Modes (p, q) that appear in the dispersion graphs in order of
increasing frequency. In each column, modes on the same line are
degenerate.
TE TM
(0,�1) (0,1) (�1,0)
(�1,�1) (�1,1) (0,�1) (0,1)
(1,�1) (1,1) (1,0)
(�1,�1) (�1,1)
(1,�1) (1,1)
053104-6 Stewart, M€oller, and Grebel J. Appl. Phys. 115, 053104 (2014)
[This article is copyrighted as indicated in the article. Reuse of AIP content is subject to the terms at: http://scitation.aip.org/termsconditions. Downloaded to ] IP:
132.250.22.11 On: Thu, 06 Feb 2014 19:34:31