Embed Size (px)
Citation preview
1
Measurements and Simulations of the Acidity Dependence of the
Kinetics of the Iron-Catalyzed Belousov-Zhabotinsky Reaction.
Proton-Catalysis in the Electron Transfer Reaction Involving the
[Fe(phen)3]3+ Species
Ethan Zars,1 Rainer Glaser,1,* Marco Downing,1,2 and Carmen Chicone2,*
1Department of Chemistry, University of Missouri, Columbia, Missouri 65211
2Department of Mathematics, University of Missouri, Columbia, Missouri 65211
2
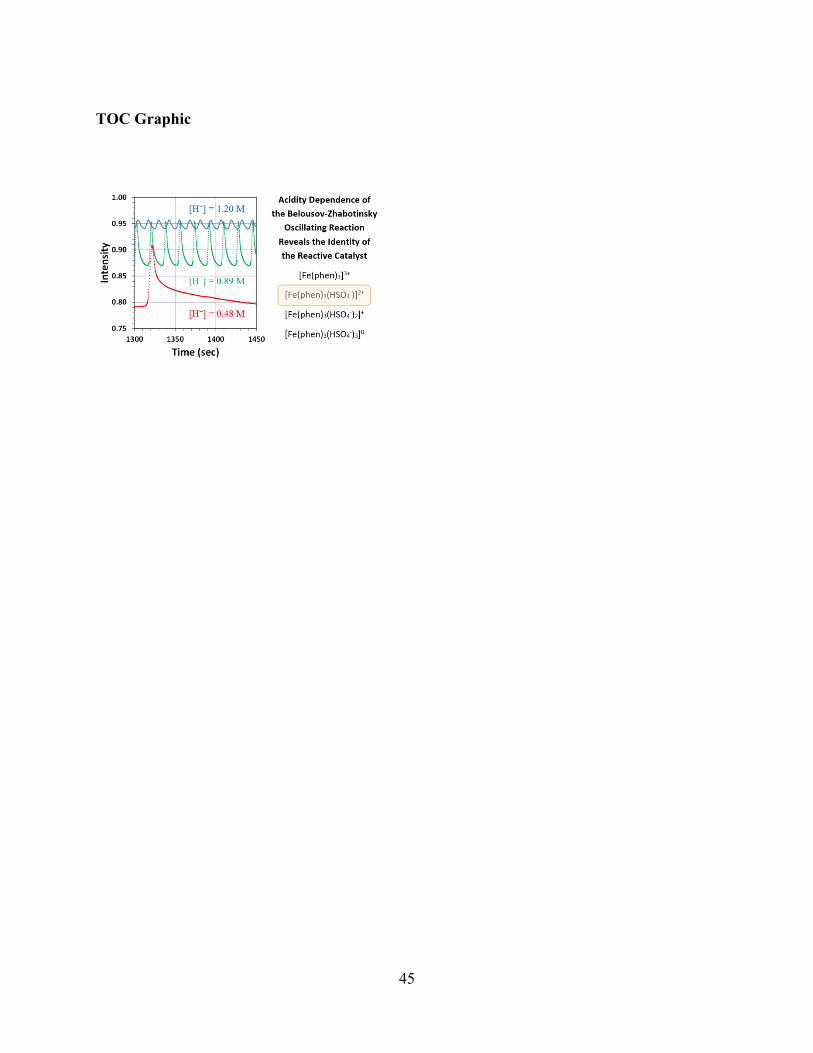
ABSTRACT: The acidity dependence of the iron-catalyzed bromate-malonic acid Belousov-
Zhabotinsky reaction was studied in the range 0.36 M < [H2SO4]0 < 1.20 M and the temporal
evolution of the oscillation patterns were analyzed. The experimental results show that the
period times PTi decrease exponentially with increasing acidity and that the period times parallel
the decrease of the reduction times RT with increasing acidity. Simulations using the reactions
of the commonly accepted core reaction mechanism failed to match the measurements even in a
qualitative fashion. However, we found that compelling agreement between the experiments and
the simulations can be achieved over the entire range with the inclusion of second-order proton-
catalysis of the oxidation of bromomalonic acid (BrMA) by the [Fe(phen)3]3+ species in reaction
9 (R9) and this [H+] dependence informs about the species involved in the outer sphere electron
transfer reaction. The trication [Fe(phen)3]3+ species is stabilized by ion pairing and solvation
and one may anticipate the presence of [Fe(phen)3(HSO4)n(H2O)m)](3-n)+ species (n = 0 – 3). Our
results suggest that the removal of aggregating HSO4- ions by protonation creates a better oxidant
and facilitates the approach of the reductant BrMA and the second-order [H+] dependence further
suggests that BrMA is primarily oxidized by a doubly-charged [Fe(phen)3(HSO4)1(L)k]2+ species.
Considering the complexity of the BZ system and the uncertainties in the many reaction rate
constants, we were somewhat surprised to find this high level of agreement by (just) the
replacement of R9 by R9’. In fact, the near-quantitative agreement presents a powerful
corroboration of the core reaction mechanism of the BrMA-rich BZ reaction and the replacement
of R9 by R9’ extents the validity of this core reaction mechanism to acidities above and below
the typical acidity of BZ reactions ([H+] 1 M).
3
INTRODUCTION
The classical Belousov-Zhabotinsky (BZ) oscillating reaction refers to the oscillatory cerium-
catalyzed bromate oxidation of citric acid.1,2,3 Since the original discovery of the BZ reaction
many similar oscillating chemical reactions have been discovered that use dicarboxylic acids
(malonic acid and malic acid) as the organic substrate and are catalyzed by other metals such as
Fe,4 Ru,5,6,7 Mn8-11 and Cu.12 Oscillating reactions using organic molecules instead of a catalyst
have also been reported.13-18 More recent research on the BZ reaction has focused on oscillating
polymer formation,19,20,21 oscillating reactions inside of micelles,19,22 communication between
such micelles as a model system of neural networks,23-26 and the complex mathematics of
oscillating systems.27,28
Field, Köros, and Noyes (FKN) proposed the core mechanism to explain the oscillations of
metal-catalyzed BZ reactions using three processes.29 This FKN mechanism involves (1)
bromide consumption, (2) autocatalytic formation of an oxidizing intermediate (BrO2∙) and
oxidation of the redox catalyst, and (3) reduction of the redox catalyst by oxidation of the
organic substrate with concomitant releases of bromide back into the system. The classical FKN
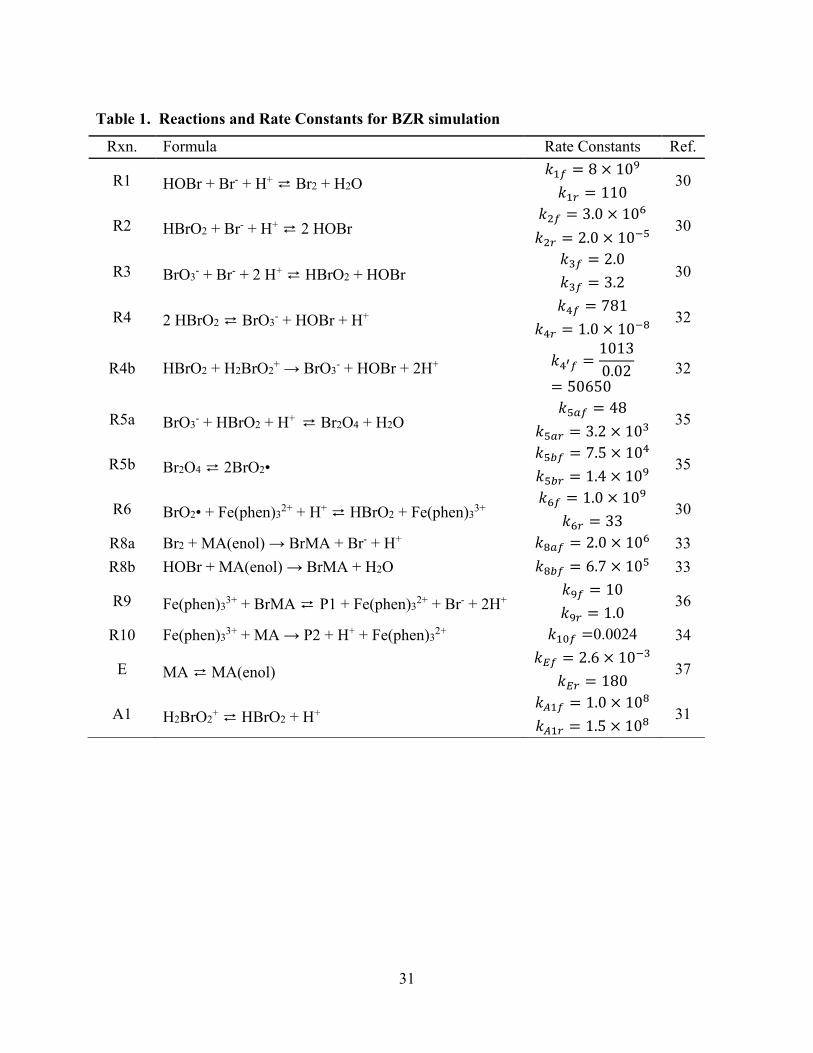
reactions are shown in Table 1 along with a few newer reactions and the best rate constants for
each reaction.30-37
[Table 1 about here]
We wanted to test the validity of the kinetic scheme for the core mechanism of the BZ
reaction against an extensive kinetic data set measured for series with varying initial conditions.
Systematic variations of acidity is an obvious first choice. Smoes first studied the effects of the
initial sulfuric acid concentration on the period time of the iron-catalyzed BZ reaction and
showed that the period time decreases exponentially with increasing acidity in the range 0.3 - 1.4
mol∙L-1 H2SO4.38 A decrease in the period time with increasing acidity was also reported for the
cerium-catalyzed reaction by Misra et al.39 with initial H2SO4 concentrations up to 4.0 mol∙L-1
and by Hsu and Jwo in the acidity range 0.5 - 1.5 mol∙L-1 H2SO4.40 The acid-dependence usually
4
has been associated with the bromine chemistry of reactions R1 - R5. The oxybromine
chemistry described by reactions R1 - R3 has been known to be accelerated by increased acidity
and it was known long before the initial discovery of the BZ reaction that the rate of R3f is
second-order in [H+].41 The disproportionation of bromous acid 2 HOBrO → HOBr + BrO3− +
H+ plays a prominent role as “Reaction 4” (or R4 for short) because it is the determining step for
the onset of the catalyst oxidation with r4 = k4f [HOBrO]2, and this reaction was considered to
involve two neutral HBrO2 molecules. The reaction rate constant k4f was measured under many
conditions by various groups with estimates of k4f ranging over seven magnitudes from 4 × 10+8
M−1s−1 to 39 M−1s−1 and these studies42-44 have been reviewed (cf. Table 1 in ref. 45). Motivated
by this disagreement in the value of the rate constant for R4, Glaser and Jost45 studied the
thermochemistry and the kinetics of the HOBrO disproportionation reaction 2 HOBrO ⇄ HOBr
+ HBrO3 (reaction R4’) in gas phase and in aqueous solution using ab initio theory, and the
computed reaction rate constant k4f = 667.5 M−1 s−1 is in excellent agreement with experimental
measurements of k4f = 781±6 M−1 s−1 in neutral and slightly acidic media. However, Försterling
and Varga discovered a faster mechanism for HBrO2 disproportionation that involves the
reaction of one neutral HBrO2 with a protonated species H2BrO2+, reaction R4b.31 A value of
1.7∙105 M-1 s-1 was assigned to the rate constant of R4b and the adjustable parameter of 0.02 M-1
was used as the equilibrium constant for the protonation reaction HBrO2 + H+ ⇄ H2BrO2+.
Agreda and Field32 showed the overall rate of HBrO2 disproportionation to be consistent with
both reactions R4 and R4b occurring in parallel, and they refined the rate constant for R4b to the
value 1013±16 M-1 s-1.
[Table 2 about here]
In this article, we report the results of an analysis of the acidity dependence of the iron-
catalyzed bromate-malonic acid Belousov-Zhabotinsky reaction by video-based tracing of the
time-dependent concentration of the Fe(III) catalyst and of simulations of the same reaction
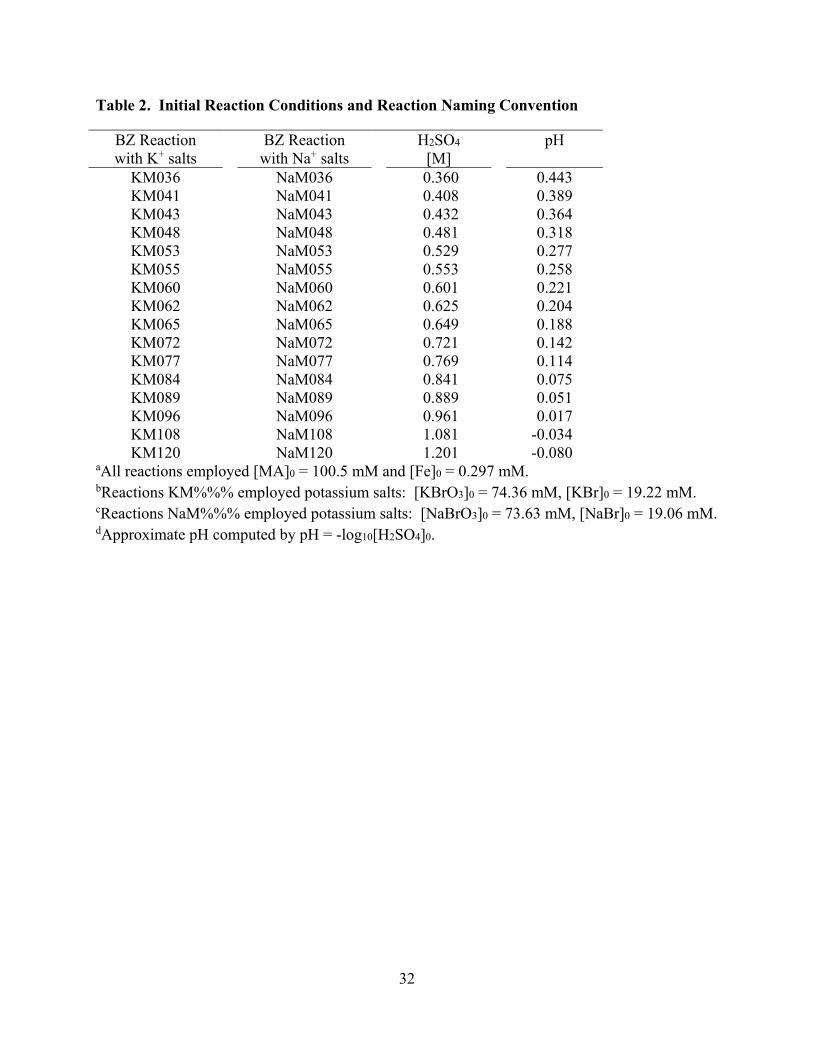
systems using kinetic rate equations. The initial conditions of Shakashiri46 were employed and
5
the sulfuric acid concentration was varied (Table 2). The effects of the acidity on the temporal
evolution of period times, oxidation times, and reduction times as well as of the intensity
variations were quantified. Each reaction was studied with sodium and potassium salts. No
significant differences were observed using Na+ and K+ salts and we report the data for the
potassium series. Our measurements show a very strong inverse dependence of period time on
acidity and the period times decrease exponentially with acidity. While we were motivated by
our interest in the HBrO2 disproportionation chemistry, the numerical simulations showed
relatively quickly that the acid dependence of R4 has only a minor effect on the overall dynamics
of the BZ reaction. Instead, and unexpectedly, we found that agreement between the
experiments and their simulations can only be achieved with the inclusion of proton-catalysis of
the outer shell electron transfer reaction between the oxidized [Fe(phen)3]3+ species and
bromomalonic acid in reaction 9 (R9). The simulation of R9 with a second-order dependence on
[H+] results in compelling agreement with experiment over the entire range of acidities
measured. An explanation is offered of this catalysis based on the acidity dependence of the ion
aggregation of the oxidant and its effect on that rate of electron transfer.
EXPERIMENTAL AND MATHEMATICAL METHODS
Performance and Recording of Oscillating Reactions. We followed the protocol by
Shakashiri46 for the iron- and cerium-catalyzed bromate-malonic acid reaction except we omitted
the cerium. We prepared three solutions. The first beaker contained 250 ml of DI water and 9.5
g (56.886 mmol, MM(KBrO3) = 167.00 g/mol) of potassium bromate (KBrO3, Acros Organics,
99.5%). The second beaker contained 250 ml of DI water, 1.75 g (14.71 mmol, MM(KBr) =
119.00 g/mol) of potassium bromide (KBr, Acros Organics, 99+%), and 8.0 g (0.077 mol,
MM(MA) = 104.06 g/mol) of malonic acid (MA, H2C(COOH)2, Acros Organics, 99%). The
third beaker contained a varied volume of 18.38 M sulfuric acid (H2S04, Fischer Scientific,
96.5%) and enough DI water to make the total volume of the third beaker 250 ml. We varied the
6
concentration of H2SO4 by adding a different volume of acid to a graduated cylinder and adding
enough water to afford 250 ml of the acid solution. All three of these beakers contained 250 ml
of solution. We also made a fresh ferroin solution by mixing 100 ml DI water, 0.23 g (1.51
mmol) of iron(II) sulfate heptahydrate (FeSO4∙(H2O)7, Sigma-Aldrich, 99.999%), and 0.46 g
(1.96 mmol) of 1,10-phenanthroline (Sigma-Aldrich, 99+%).
In a 1 L beaker on a stir plate, we mixed the first two solutions, added the third solution, and
then added 15 ml of the ferroin solution. Final concentrations in the 1 L beaker were 74.36 mM
KBrO3, 0.10 M MA, 19.22 mM KBr, 0.90 M H2SO4, and 0.297 mM in Fe(II). A summary of the
initial reaction conditions is given in Table 2. Reactions are labeled KM%%%, where the “K”
indicates that potassium salts were used and “M%%%” indicates the molarity of H2SO4
multiplied by 100. For example, the reaction KM120 employs an initial H2SO4 concentration of
1.20 M. In analogy, the labels “NaM%%%” refer to reactions with sodium salts.
The reaction was recorded with a Panasonic HC-V110 video camera which was mounted on a
tripod set about five feet away from the reaction beaker. A white poster board was placed behind
the reaction beaker and lighting conditions were kept constant. The zoom on the camera was set
to 5x. The reaction was recorded for approximately 40 minutes. HD Writer 2.0 was used to edit
the video in the form iFrame and produce an mp4 file.
Video Analysis and Generation of Raw Data. The mp4 video is first converted to a series
of JPEG images using the Aoao Video to Picture Converter47,48 using a standard of 5 frames per
second. Next, the images are imported into Mathematica49,50 a software for image analysis. The
images are cropped to isolate the desired region (not obstructed, middle of the beaker, avoid
vortex regions) and converted to matrices of Red-Green-Blue values using the ImageData
command in Mathematica.
The next step is the choice of a metric to integrate all the data points in the cropped image and
compare them to a given target value. For a given image with frame number FN and
7
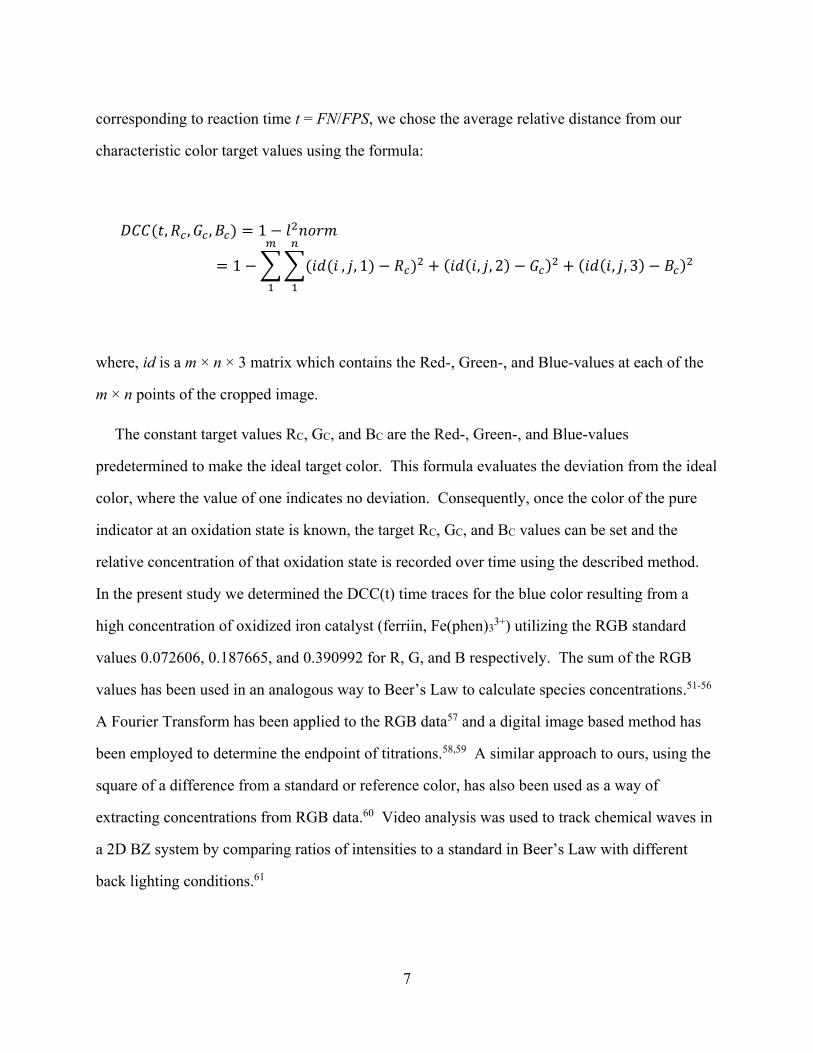
corresponding to reaction time t = FN/FPS, we chose the average relative distance from our
characteristic color target values using the formula:
𝐷𝐶𝐶(𝑡, 𝑅𝑐 , 𝐺𝑐 , 𝐵𝑐) = 1 − 𝑙2𝑛𝑜𝑟𝑚
= 1 −∑∑(𝑖𝑑(𝑖
𝑛
1
, 𝑗, 1) − 𝑅𝑐)2 + (𝑖𝑑(𝑖, 𝑗, 2) − 𝐺𝑐)
2 + (𝑖𝑑(𝑖, 𝑗, 3) − 𝐵𝑐)2
𝑚
1
where, id is a m × n × 3 matrix which contains the Red-, Green-, and Blue-values at each of the
m × n points of the cropped image.
The constant target values RC, GC, and BC are the Red-, Green-, and Blue-values
predetermined to make the ideal target color. This formula evaluates the deviation from the ideal
color, where the value of one indicates no deviation. Consequently, once the color of the pure
indicator at an oxidation state is known, the target RC, GC, and BC values can be set and the
relative concentration of that oxidation state is recorded over time using the described method.
In the present study we determined the DCC(t) time traces for the blue color resulting from a
high concentration of oxidized iron catalyst (ferriin, Fe(phen)33+) utilizing the RGB standard
values 0.072606, 0.187665, and 0.390992 for R, G, and B respectively. The sum of the RGB
values has been used in an analogous way to Beer’s Law to calculate species concentrations.51-56
A Fourier Transform has been applied to the RGB data57 and a digital image based method has
been employed to determine the endpoint of titrations.58,59 A similar approach to ours, using the
square of a difference from a standard or reference color, has also been used as a way of
extracting concentrations from RGB data.60 Video analysis was used to track chemical waves in
a 2D BZ system by comparing ratios of intensities to a standard in Beer’s Law with different
back lighting conditions.61
8
Our approach follows the concept described by Beer’s Law. The basic assumption is made
that one might be able to recover information of the variation of the concentrations of individual
species based on the variation of the color of the solution. For example, one would expect that a
blue color corresponds to a high concentration of Fe(III) whereas a deep red solution would
corresponds to a high concentration of Fe(II).
Oscillation Pattern Analysis. We are interested in quantifying the timing of the oscillations
and the intensity variations over the course of each reaction. Variations in the timing and
intensities of the oscillations and DCC(t) time traces will allow us to construct parameters to
describe the oscillations and elucidate mechanistic details and effects of acidity. The
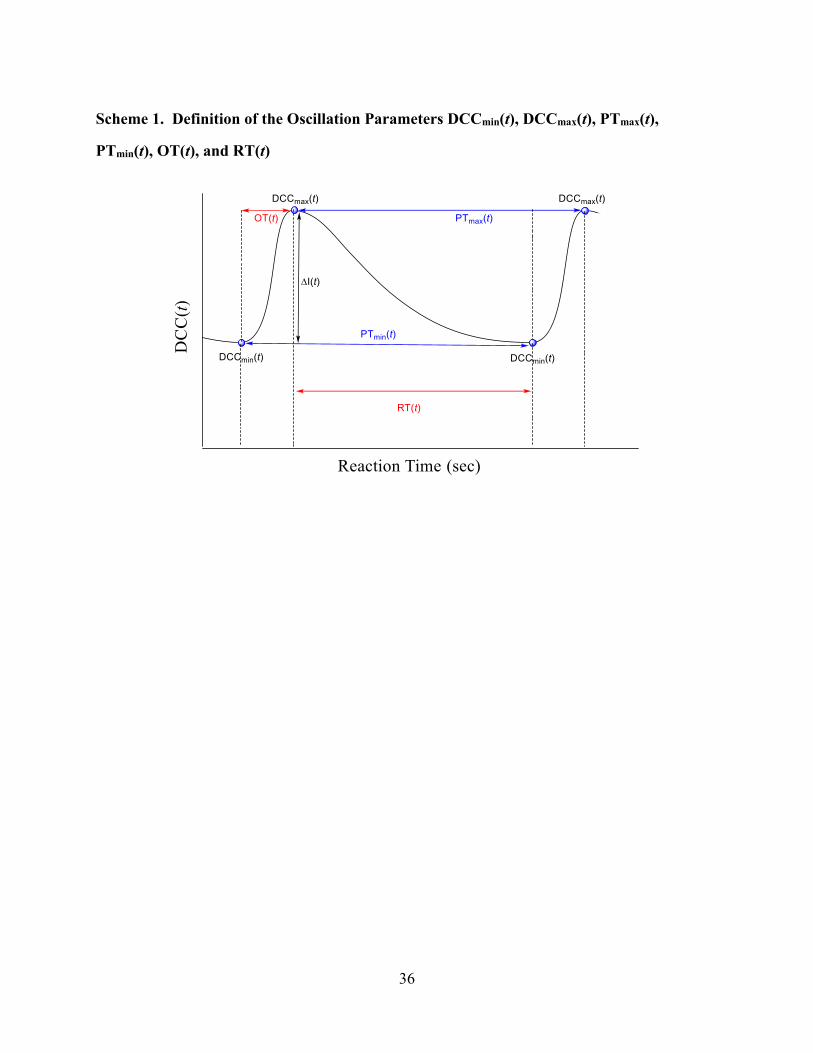
determination of these oscillation parameters requires the knowledge of the minima and maxima
of the DCC(t) time traces (Scheme 1).
[Scheme 1 about here]
In this article we focus on the timing of the oscillations and for completeness we provide a
discussion of acidity effects on intensity variations in Supporting Information. We are studying
the period time as measured using both the maxima (PTmax) and the minima (PTmin), the
oxidation times (OT) as calculated by the time of the maximum minus the time of the preceding
minimum, and the reduction times (RT) as calculated by the time of the minimum minus the time
of the preceding maximum. The selection and calculation of these parameters is shown in
Scheme 1.
The raw discrete DCC(t) data is too noisy to work with and needs to be smoothed. After
smoothing of the DCC(t) data using a moving average filter, local minima and maxima of
DCC(t) can be located with an extrema-point finder function (EPmax(t) and EPmin(t) for
maxima and minima respectively) and a list of minima and maxima points (time, DCC(t) value)
is generated. This method is inadequate for our analysis, however, because the minima and
maxima points extracted by this method don’t represent the true minima and maxima of the
oscillation cycle. In some reactions, especially those with a longer period time the point with the
9
lowest DCC(t) value occurs long before the beginning of the oxidation phase and can show
considerable variation between periods. We define the minimum point as the point at which the
oxidation phase begins and in order to accomplish this we had to develop an additional analysis
method. This method consists of first generating an interpolation function of the smoothed
DCC(t) data and then looking for the minima by starting at the maxima and moving down the
curve in the negative time direction until the derivative became a certain predetermined value
(dDCC(t)/dt = 60).
A slightly different problem occurred in determining the maxima points. The DCC(t) values
come as discrete points at time intervals of 0.2 seconds and for reactions with sharper peaks it is
possible that the actual maximum of the oscillation cycle falls between the measured discrete
points. This would not normally be a very large problem for extracting the timing information of
the oscillations (i.e., 0.2 seconds is a relatively small error for the time scale of the oscillations)
but if accurate DCC(t) values of the maxima are desired simply taking the EPmax(t) values could
result in a relatively large error between the EPmax(t) value and the actual maximum value of
the oscillation cycle. To reduce this error the maxima points were chosen as the maxima of the
interpolation function of the smoothed DCC(t) data.
Mathematical Simulation of the Oscillating Reaction. We have previously described a
dynamical method for the calculation of all species concentrations in multi-equilibria
systems62,63,64 and this method can be used to examine the transient kinetics of the evolution of
the BZ reaction chemistry. The dynamical method has its basis in general mass action kinetics
theory65 and results in the formulation of differential equations representing the derivatives of
species concentrations with respect to time. We solved the resulting system of differential
equations using the NDSolve66 command in Mathematica49a,67 and obtained concentration data
for all chemical species in the system over the entire selected time range.
10
RESULTS AND DISCUSSION
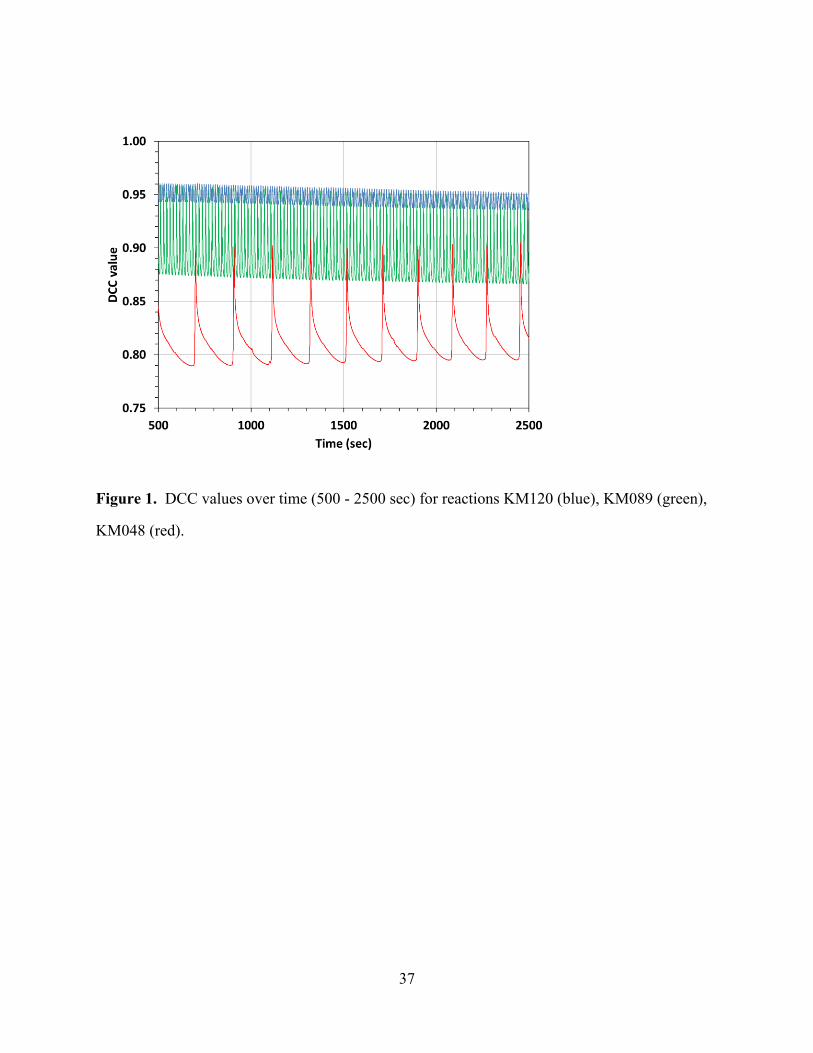
Qualitative Description of the Temporal Evolution of the Oscillation Pattern. Three
representative DCC(t) time traces are shown in Figure 1 for the reactions with initial sulfuric
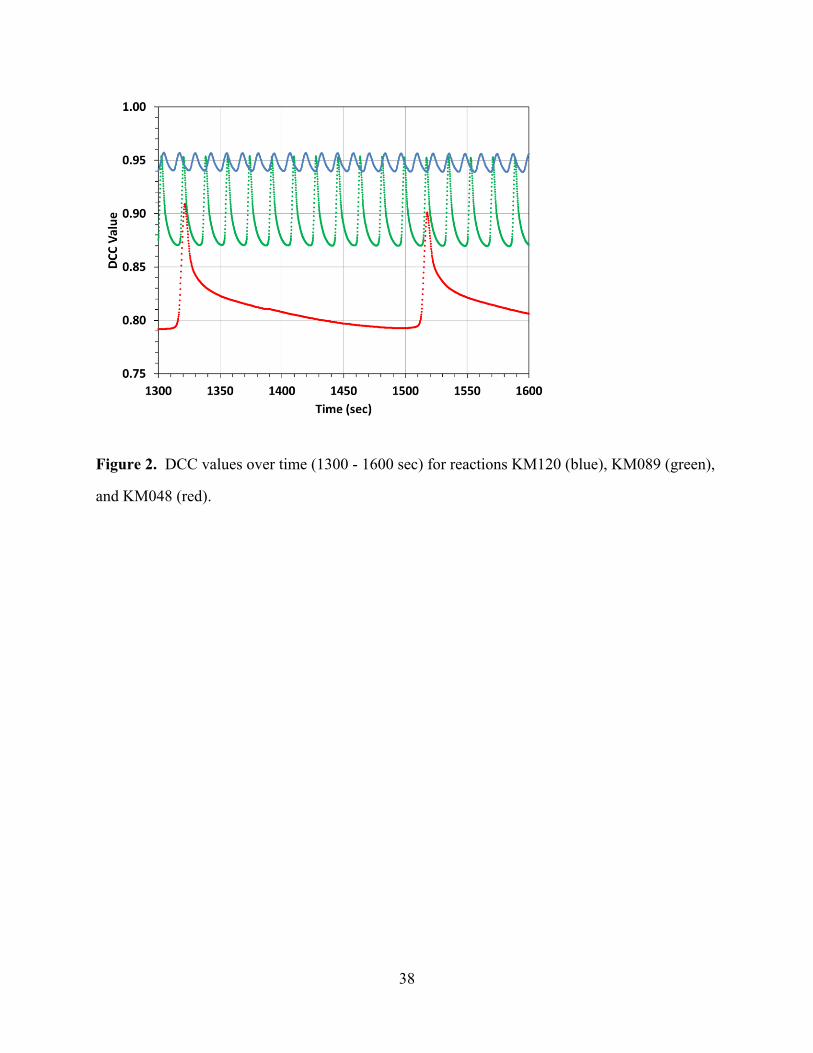
acid concentrations [H2SO4]0 of 1.20, 0.89, and 0.48 mol·L-1, respectively. Figure 2 shows the
same DCC(t) time traces with increased temporal resolution, that is, over a smaller time range of
300 seconds between 1300 and 1600 seconds of reaction time.
[Figures 1 and 2 about here]
Figures 1 and 2 clearly show that the oscillation frequencies increase with the acidities of the
reactions. In addition, Figure 2 shows that in reactions at lower acidities the DCC(t) values
rapidly decrease and stay near the minimum until the next oxidation phase. Another effect that
can be seen in Figure 1 is that the DCC(t) values remain higher at higher acidities whereas the
difference I(t) between the values at the maximum and the minimum is greater at lower
acidities.
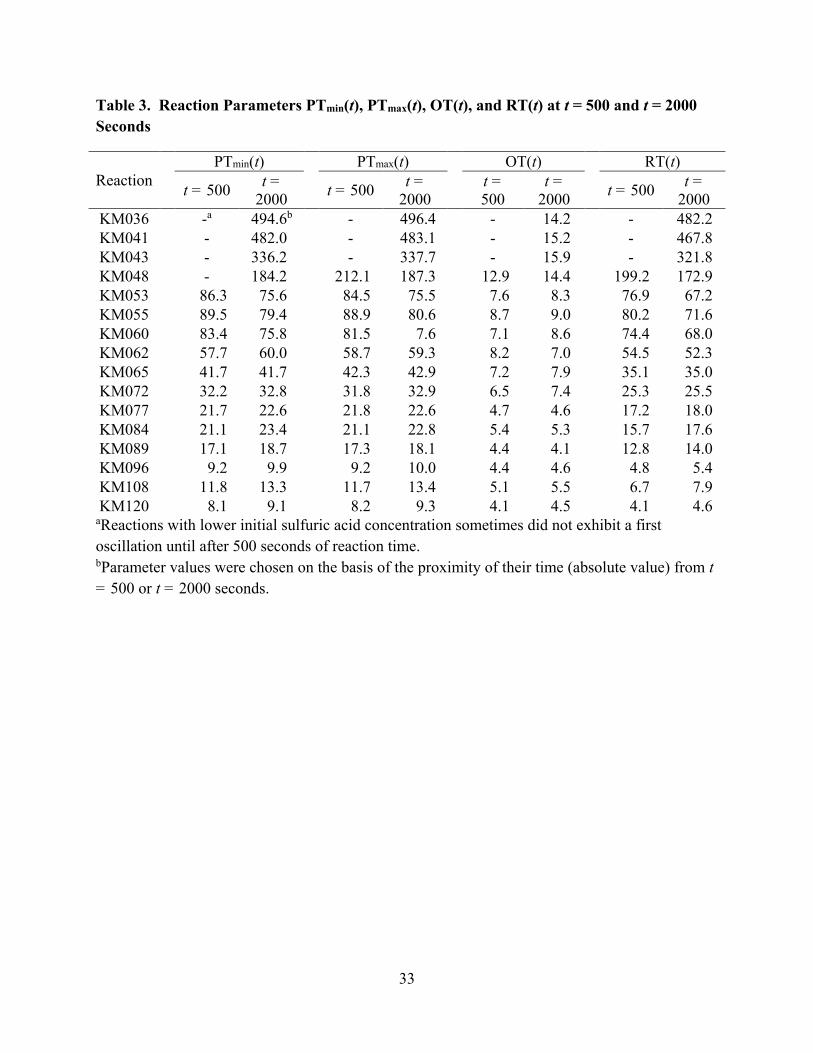
[Table 3 about here]
The change in PTi as well as OT and RT over time is examined further in Table 3 which
shows the parameters PTmin, PTmax, OT, and RT at t = 500 and t = 2000 seconds. For most
reactions the induction period is over by 500 seconds of reaction time and all reactions were
performed for at least 2000 seconds. The PTi(2000) is greatest at the lowest acidity and smallest
at the highest acidity. It can also be seen in Table 3 that the PTi increases over time for reactions
performed at higher acidities and decreases over time for reactions performed at lower acidities.
For the reactions performed at the lowest acidities ([H2SO4]0 ≤ 0.48 mol∙L-1) the first period was
not observed until after 500 seconds of reaction time so the t = 500 cell in Table 3 for those
reactions are left blank. Similar trends were also observed in the OT and RT. A shorter OT is
seen at higher acidities, consistent with the trend in PTi. The difference in OT at low acidities
and high acidities is, however, not very large and the OT does not become smaller as consistently
11
as the PTi. Moreover, the OT does not change significantly or consistently over time.
Additionally, the OT represents a greater proportion of the overall PTi at higher acidities
compared to lower acidities. The RT follows similar trends to the PTi in that it becomes shorter
at higher acidities and the RT(2000) is greater than the RT(500) at higher acidities but this
relation is reversed at lower acidities. The RT represents a greater proportion of the overall PTi
than the OT at lower acidities with the RT and OT becoming closer in value at higher acidities.
Quantification of the Temporal Evolution of Oscillation Timing. The trends suggested in
Figures 1 and 2 regarding period time, the shape of the curves, and the average DCC(t) value as
well as Table 3 motivated us to systematically study different parameters to describe the
oscillations as they are affected by changes in acidity or if perhaps such parameters will change
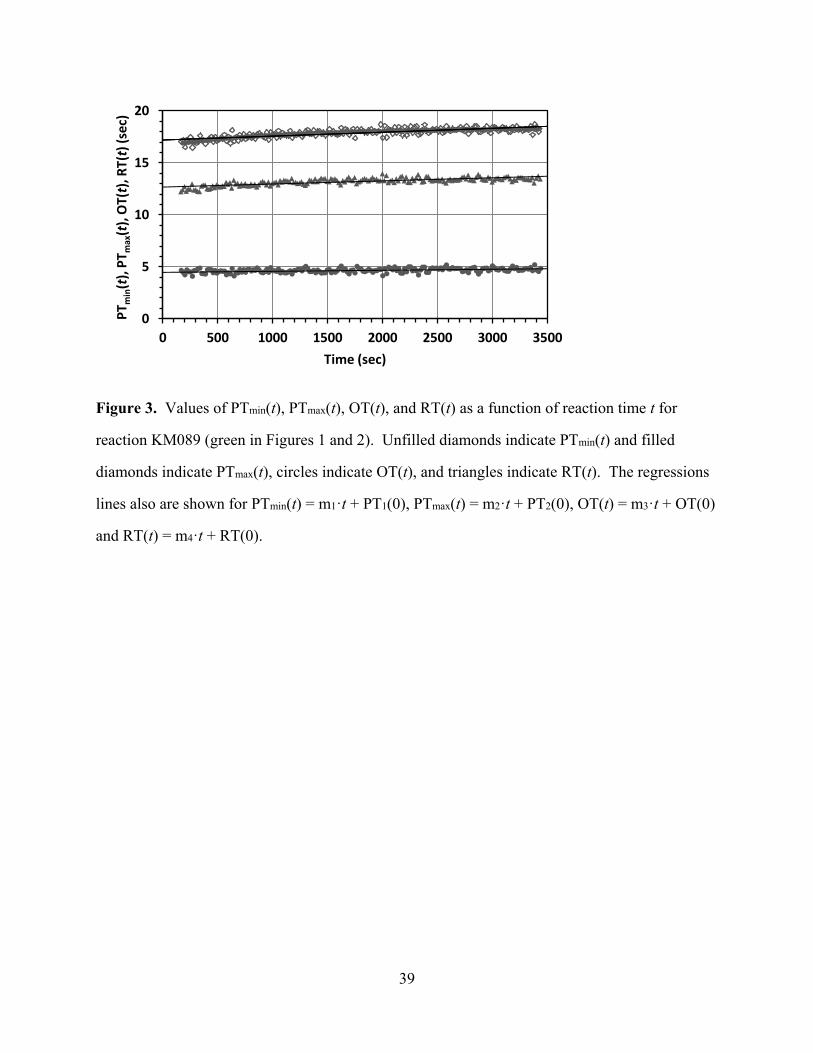
over the course of one reaction. As an example, the PTmax(t), PTmin(t), OT(t), and RT(t) values
with their respective linear regression lines for the reaction KM089 are plotted in Figure 3 as a
function of time. Analogous plots to Figure 3 for all other reactions are given in the supporting
information (Figures S1).
[Figure 3 about here]
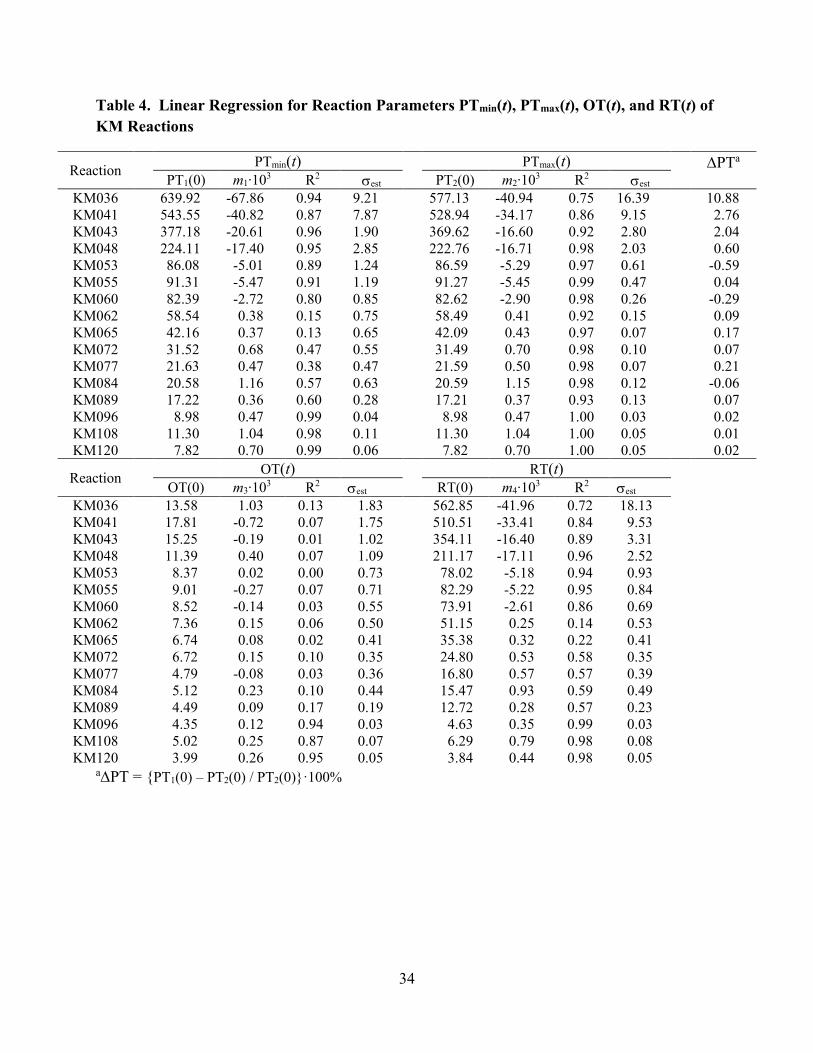
[Table 4 about here]
In Figure 3 it can be seen that the values PTmax(t) and PTmin(t) are about the same at any given
time t and that both values increase slightly but noticeably over the course of the reaction. The
OT(t) values, the lowest curve in Figure 3, remain essentially the same over time. Hence, the
RT(t) values follow the trend for PTmax(t) and PTmin(t) and also increase slightly but noticeably
over time. The temporal evolution of the parameters PTmax(t), PTmin(t), OT(t), and RT(t) can be
modeled by linear regression and the slopes and intercepts of these linear regressions are given in
Table 4 for all reactions. For example, we list the intercept PT1(0) = PTmax(0) and the slope m1
for the regression function PTmax(t) = m1 t + PT1(0). Standard correlation coefficients, R2, and
standard errors of the estimate, est, are included in Table 4.
12
It is an oddity of the definition of R2 that it can become very small when slopes are near zero
even though the data do not exhibit much scatter (cf. Figure S1-KM065 and R2(KM065) = 0.13).
Hence, we also determined the standard error of the estimate, est, which was calculated by the
following formula:
𝜎𝑒𝑠𝑡 = √∑ (𝑝′ − 𝑝)2𝑛
𝑛
where p’ is the estimated parameter value based on the linear regression line, p is the measured
parameter value, and n is the number of values for the parameter. Comparison of the est value
to the intercept PT1(0) for any given reaction shows less than 3% deviation, and the quality of the
fit is equally high for the regressions of the PTmin(t) and RT(t) data. Another approach to
estimate numerical error consists in the pairwise comparison of the intercepts PT1(0) and PT2(0).
In an ideal world, one would expect that the period times determined with the PTmin(t) and
PTmax(t) data, respectively, are exactly the same, i.e., PT1(0) = PT2(0). The data in Table 4 show
that PT1(0) PT2(0) and the difference can become quite large in absolute value. However, the
relative deviation PT = {PT1(0) – PT2(0) / PT2(0)}·100% again remains below 3% with the
single exception of reaction KM036 (only 4 oscillations measured).
[Figure 4 about here]
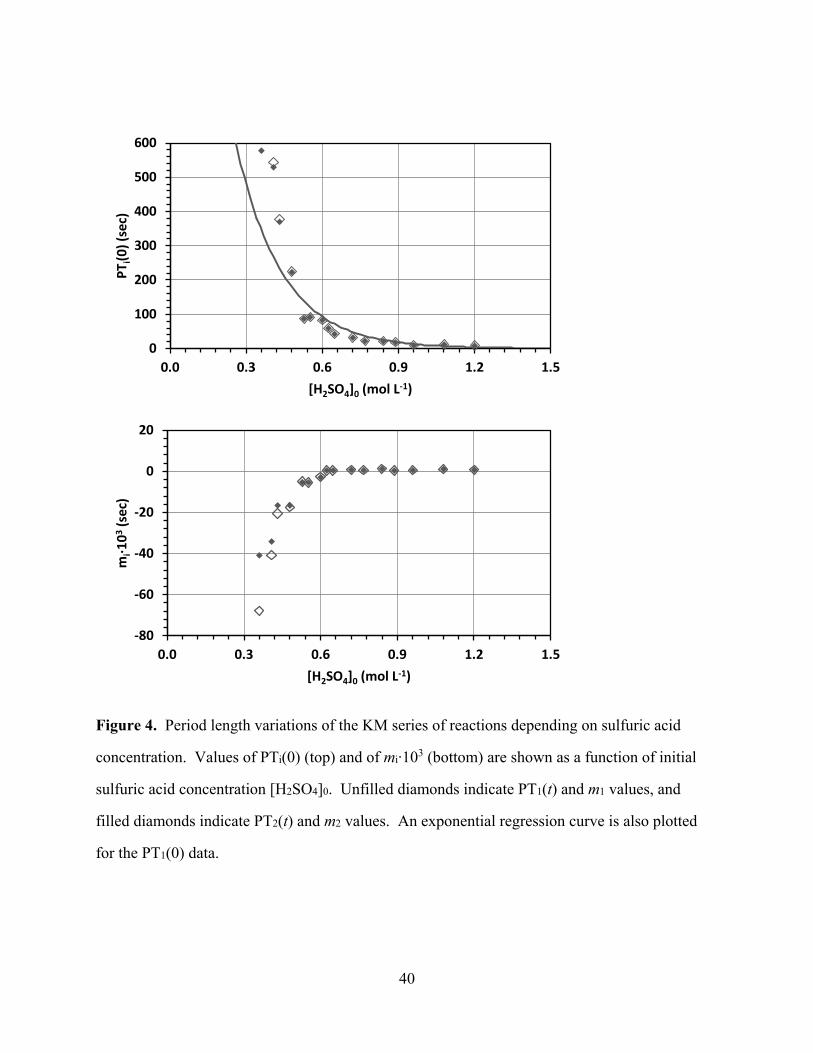
Acidity Dependence of Oscillation Timing. The dependence of the PTi(0) values and of the
associate slopes mi on the initial sulfuric acid concentration [H2SO4]0 is illustrated in Figure 4.
Figure 4 clearly shows that PTi(0) decreases with increasing acidity. There is a steep decrease in
PTi(0) in the region 0.3 < [H2SO4]0 < 0.6 and PTi(0) asymptotically approaches zero in the region
[H2SO4]0 > 0.9. In the bottom plot of Fig. 4, it can be seen that the slopes m1 and m2 increase
with [H2SO4]0. The magnitude of the slopes all are small (< 0.1) but they show significant
features. Interestingly, the sign of the slopes changes from negative to positive in the region
[H2SO4]0 ≈ 0.6. Note that the slopes m1 and m2 increase relatively rapidly in the region [H2SO4]0
< 0.6 (m1 from -0.067 to -0.0027; m2 from -0.041 to -0.0029) while the slope remains essentially
13
constant, very small and slightly positive (m1 < +0.0015) in the high-acidity region [H2SO4]0 >
0.6. Thus, the period times PTi decrease over the course of the reaction at lower acidities and the
decrease is more pronounced at lower acidities. On the other hand, the PTi increases over the
course of a reaction when [H2SO4]0 > 0.6 and this increase in PTi is relatively constant and low
over the remaining range of initial sulfuric acid concentrations. The observed dependence of the
period times reflects the acidity dependence of the reduction phase of the oscillating reaction.
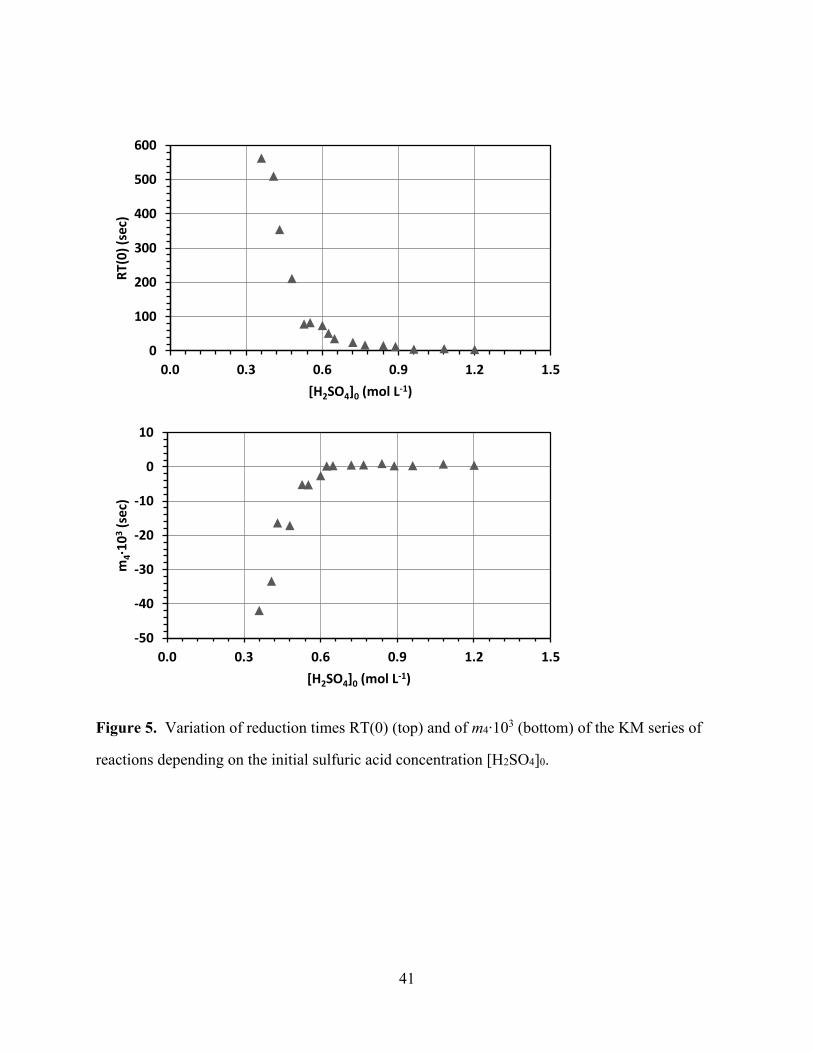
[Figure 5 about here]
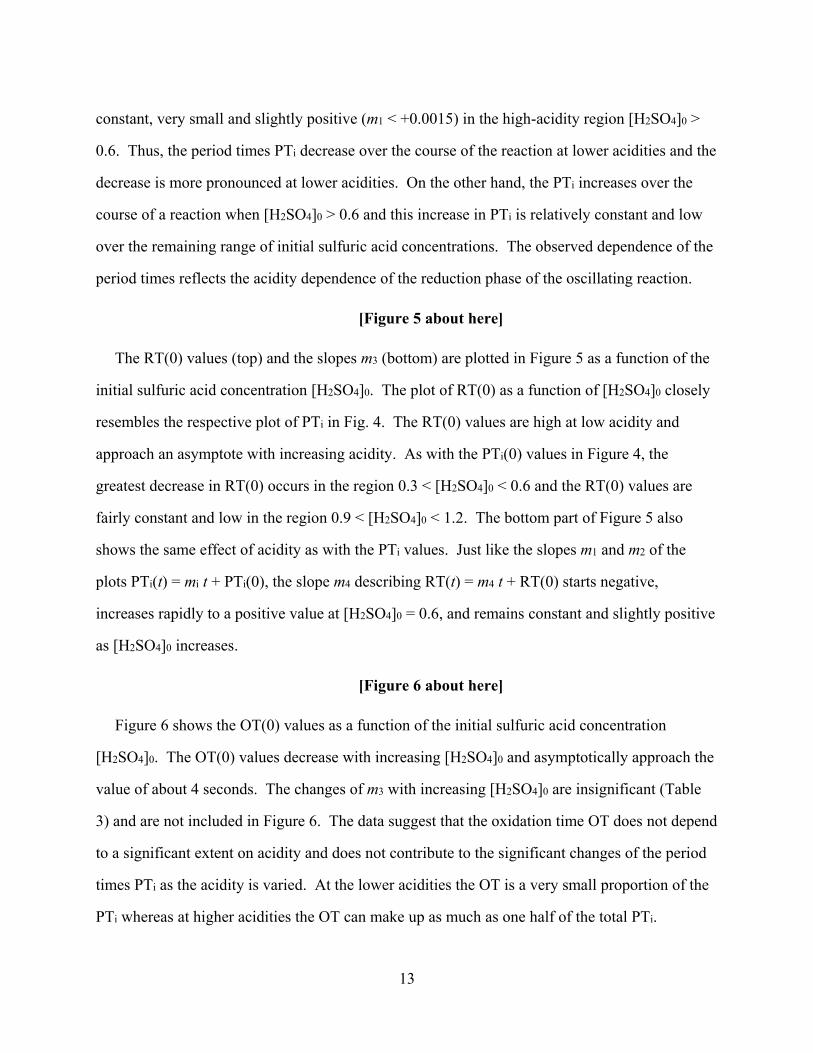
The RT(0) values (top) and the slopes m3 (bottom) are plotted in Figure 5 as a function of the
initial sulfuric acid concentration [H2SO4]0. The plot of RT(0) as a function of [H2SO4]0 closely
resembles the respective plot of PTi in Fig. 4. The RT(0) values are high at low acidity and
approach an asymptote with increasing acidity. As with the PTi(0) values in Figure 4, the
greatest decrease in RT(0) occurs in the region 0.3 < [H2SO4]0 < 0.6 and the RT(0) values are
fairly constant and low in the region 0.9 < [H2SO4]0 < 1.2. The bottom part of Figure 5 also
shows the same effect of acidity as with the PTi values. Just like the slopes m1 and m2 of the
plots PTi(t) = mi t + PTi(0), the slope m4 describing RT(t) = m4 t + RT(0) starts negative,
increases rapidly to a positive value at [H2SO4]0 = 0.6, and remains constant and slightly positive
as [H2SO4]0 increases.
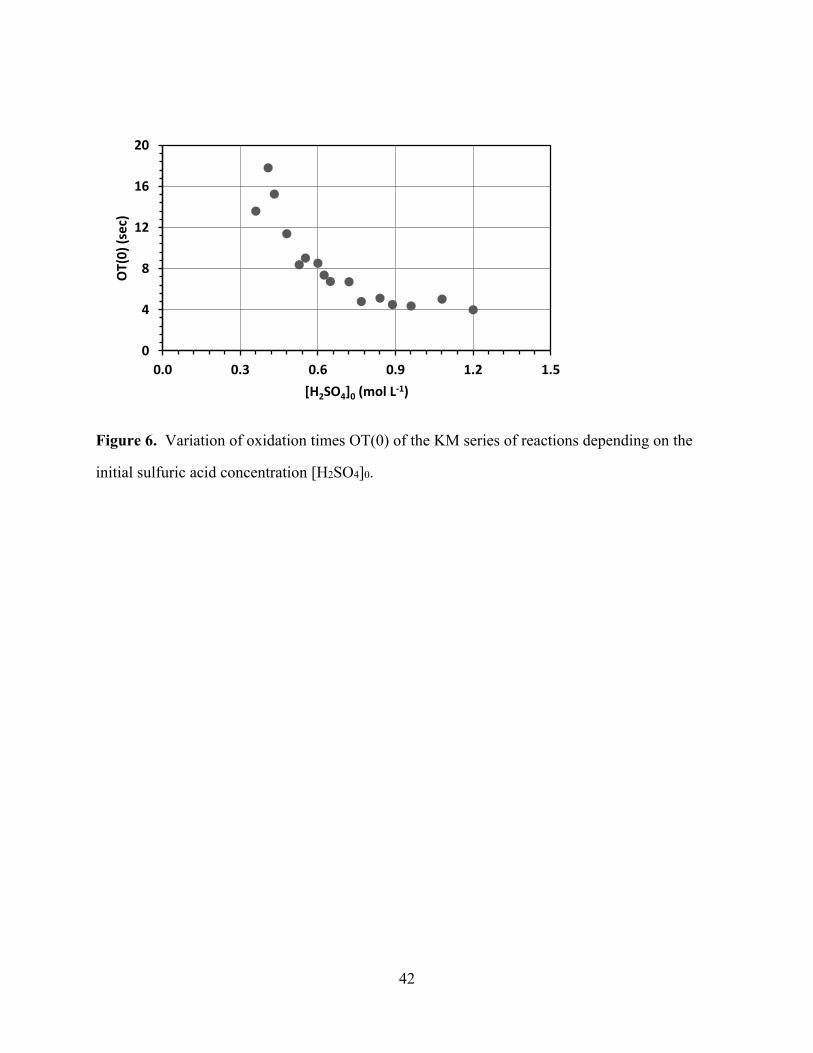
[Figure 6 about here]
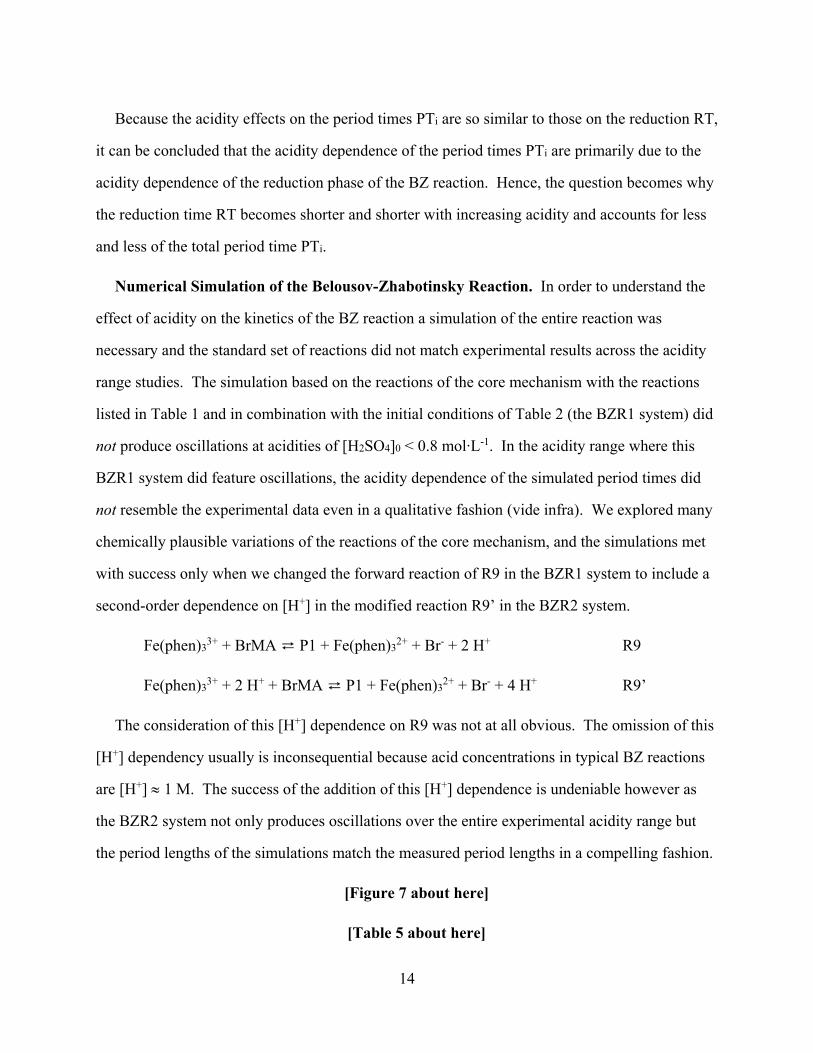
Figure 6 shows the OT(0) values as a function of the initial sulfuric acid concentration
[H2SO4]0. The OT(0) values decrease with increasing [H2SO4]0 and asymptotically approach the
value of about 4 seconds. The changes of m3 with increasing [H2SO4]0 are insignificant (Table
3) and are not included in Figure 6. The data suggest that the oxidation time OT does not depend
to a significant extent on acidity and does not contribute to the significant changes of the period
times PTi as the acidity is varied. At the lower acidities the OT is a very small proportion of the
PTi whereas at higher acidities the OT can make up as much as one half of the total PTi.
14
Because the acidity effects on the period times PTi are so similar to those on the reduction RT,
it can be concluded that the acidity dependence of the period times PTi are primarily due to the
acidity dependence of the reduction phase of the BZ reaction. Hence, the question becomes why
the reduction time RT becomes shorter and shorter with increasing acidity and accounts for less
and less of the total period time PTi.
Numerical Simulation of the Belousov-Zhabotinsky Reaction. In order to understand the
effect of acidity on the kinetics of the BZ reaction a simulation of the entire reaction was
necessary and the standard set of reactions did not match experimental results across the acidity
range studies. The simulation based on the reactions of the core mechanism with the reactions
listed in Table 1 and in combination with the initial conditions of Table 2 (the BZR1 system) did
not produce oscillations at acidities of [H2SO4]0 < 0.8 mol∙L-1. In the acidity range where this
BZR1 system did feature oscillations, the acidity dependence of the simulated period times did
not resemble the experimental data even in a qualitative fashion (vide infra). We explored many
chemically plausible variations of the reactions of the core mechanism, and the simulations met
with success only when we changed the forward reaction of R9 in the BZR1 system to include a
second-order dependence on [H+] in the modified reaction R9’ in the BZR2 system.
Fe(phen)33+ + BrMA ⇄ P1 + Fe(phen)3
2+ + Br- + 2 H+ R9
Fe(phen)33+ + 2 H+ + BrMA ⇄ P1 + Fe(phen)3
2+ + Br- + 4 H+ R9’
The consideration of this [H+] dependence on R9 was not at all obvious. The omission of this
[H+] dependency usually is inconsequential because acid concentrations in typical BZ reactions
are [H+] 1 M. The success of the addition of this [H+] dependence is undeniable however as
the BZR2 system not only produces oscillations over the entire experimental acidity range but
the period lengths of the simulations match the measured period lengths in a compelling fashion.
[Figure 7 about here]
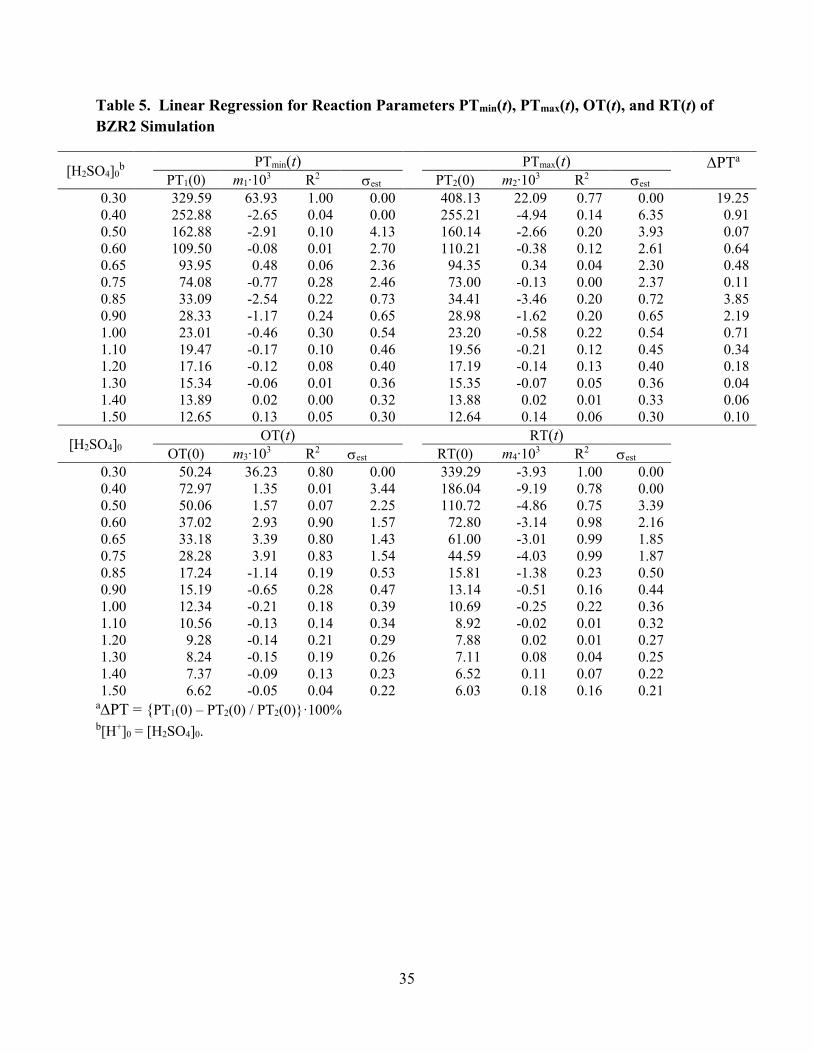
[Table 5 about here]
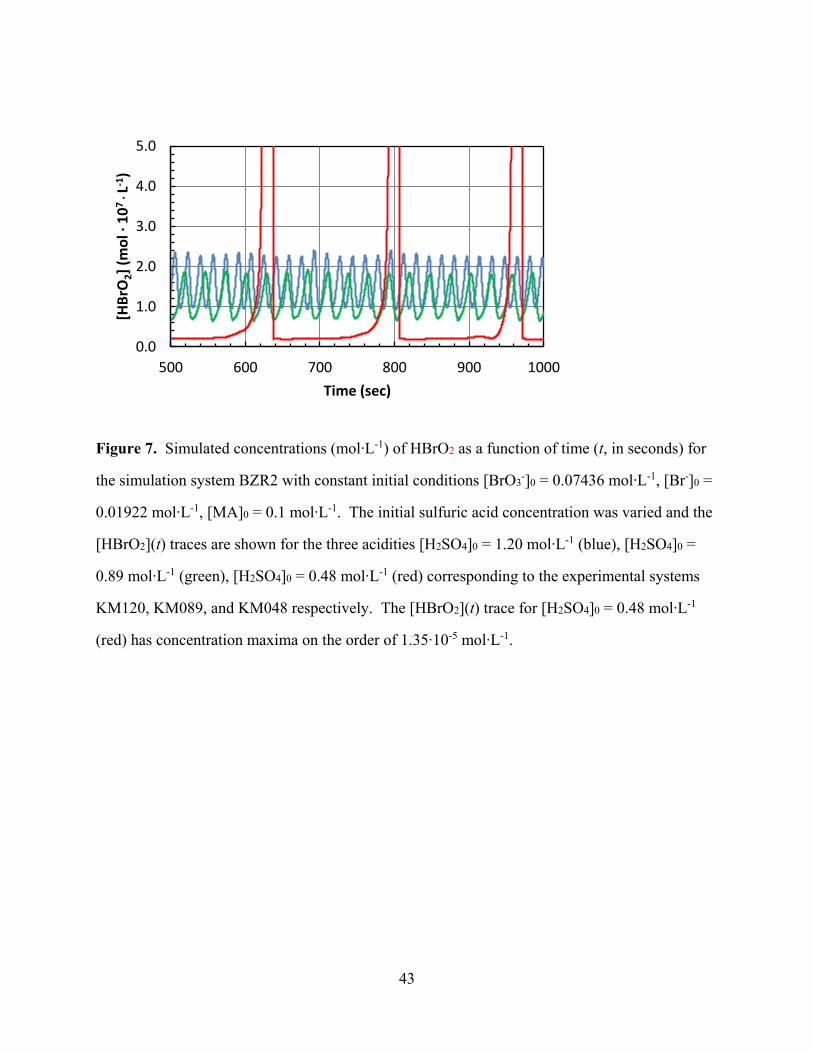
15
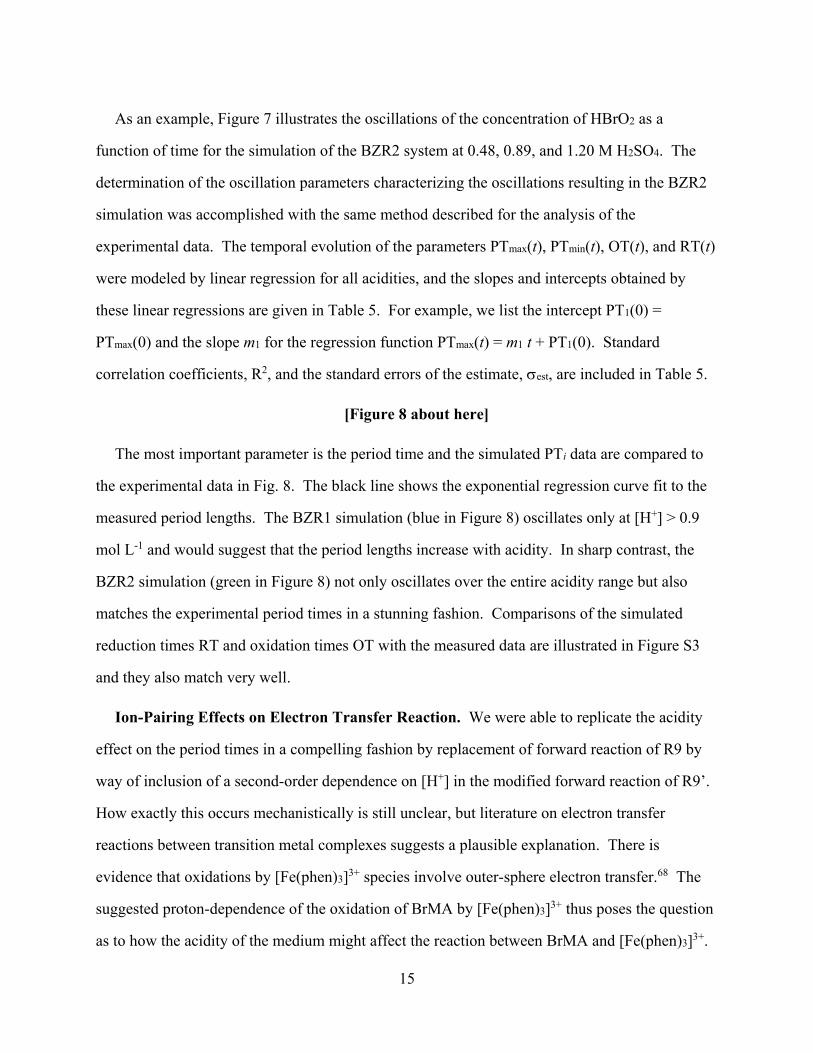
As an example, Figure 7 illustrates the oscillations of the concentration of HBrO2 as a
function of time for the simulation of the BZR2 system at 0.48, 0.89, and 1.20 M H2SO4. The
determination of the oscillation parameters characterizing the oscillations resulting in the BZR2
simulation was accomplished with the same method described for the analysis of the
experimental data. The temporal evolution of the parameters PTmax(t), PTmin(t), OT(t), and RT(t)
were modeled by linear regression for all acidities, and the slopes and intercepts obtained by
these linear regressions are given in Table 5. For example, we list the intercept PT1(0) =
PTmax(0) and the slope m1 for the regression function PTmax(t) = m1 t + PT1(0). Standard
correlation coefficients, R2, and the standard errors of the estimate, est, are included in Table 5.
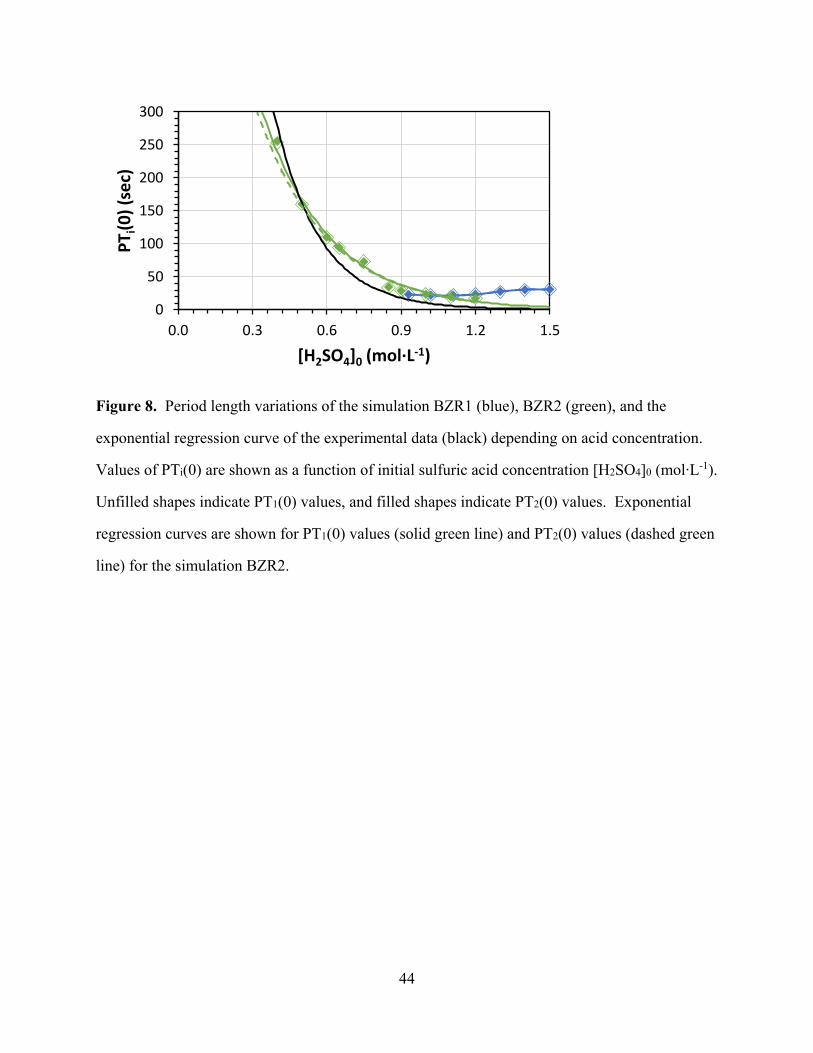
[Figure 8 about here]
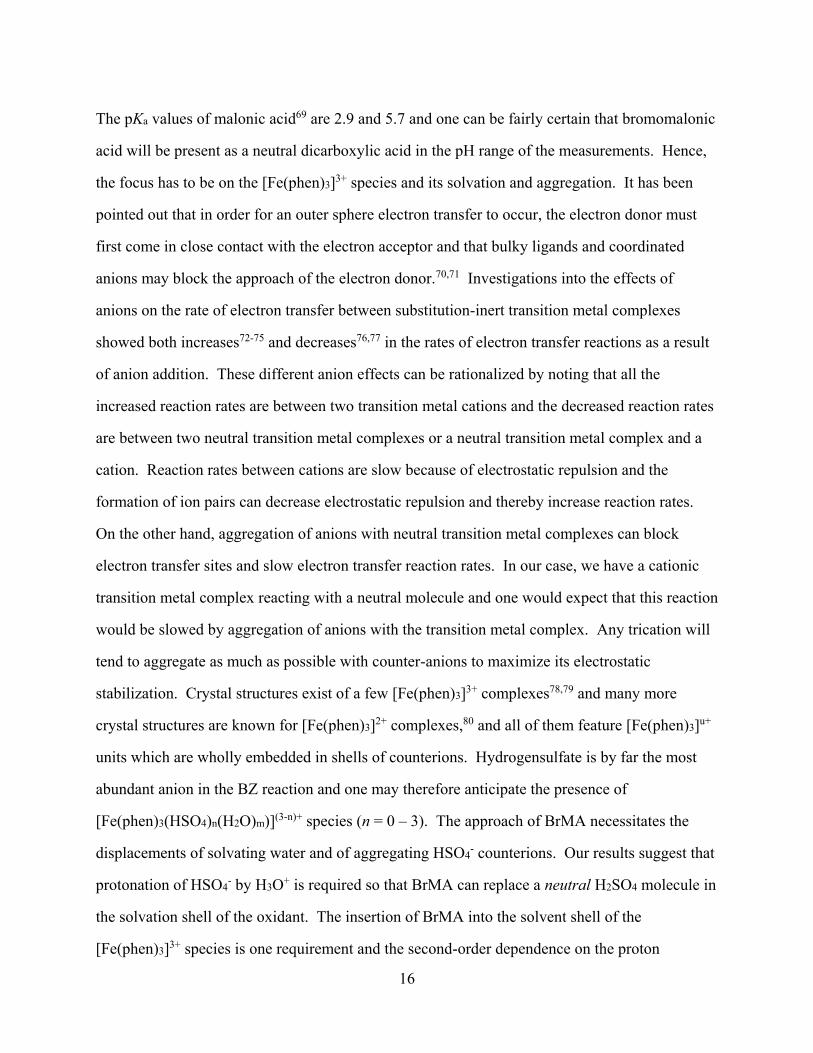
The most important parameter is the period time and the simulated PTi data are compared to
the experimental data in Fig. 8. The black line shows the exponential regression curve fit to the
measured period lengths. The BZR1 simulation (blue in Figure 8) oscillates only at [H+] > 0.9
mol L-1 and would suggest that the period lengths increase with acidity. In sharp contrast, the
BZR2 simulation (green in Figure 8) not only oscillates over the entire acidity range but also
matches the experimental period times in a stunning fashion. Comparisons of the simulated
reduction times RT and oxidation times OT with the measured data are illustrated in Figure S3
and they also match very well.
Ion-Pairing Effects on Electron Transfer Reaction. We were able to replicate the acidity
effect on the period times in a compelling fashion by replacement of forward reaction of R9 by
way of inclusion of a second-order dependence on [H+] in the modified forward reaction of R9’.
How exactly this occurs mechanistically is still unclear, but literature on electron transfer
reactions between transition metal complexes suggests a plausible explanation. There is
evidence that oxidations by [Fe(phen)3]3+ species involve outer-sphere electron transfer.68 The
suggested proton-dependence of the oxidation of BrMA by [Fe(phen)3]3+ thus poses the question
as to how the acidity of the medium might affect the reaction between BrMA and [Fe(phen)3]3+.
16
The pKa values of malonic acid69 are 2.9 and 5.7 and one can be fairly certain that bromomalonic
acid will be present as a neutral dicarboxylic acid in the pH range of the measurements. Hence,
the focus has to be on the [Fe(phen)3]3+ species and its solvation and aggregation. It has been
pointed out that in order for an outer sphere electron transfer to occur, the electron donor must
first come in close contact with the electron acceptor and that bulky ligands and coordinated
anions may block the approach of the electron donor.70,71 Investigations into the effects of
anions on the rate of electron transfer between substitution-inert transition metal complexes
showed both increases72-75 and decreases76,77 in the rates of electron transfer reactions as a result
of anion addition. These different anion effects can be rationalized by noting that all the
increased reaction rates are between two transition metal cations and the decreased reaction rates
are between two neutral transition metal complexes or a neutral transition metal complex and a
cation. Reaction rates between cations are slow because of electrostatic repulsion and the
formation of ion pairs can decrease electrostatic repulsion and thereby increase reaction rates.
On the other hand, aggregation of anions with neutral transition metal complexes can block
electron transfer sites and slow electron transfer reaction rates. In our case, we have a cationic
transition metal complex reacting with a neutral molecule and one would expect that this reaction
would be slowed by aggregation of anions with the transition metal complex. Any trication will
tend to aggregate as much as possible with counter-anions to maximize its electrostatic
stabilization. Crystal structures exist of a few [Fe(phen)3]3+ complexes78,79 and many more
crystal structures are known for [Fe(phen)3]2+ complexes,80 and all of them feature [Fe(phen)3]u+
units which are wholly embedded in shells of counterions. Hydrogensulfate is by far the most
abundant anion in the BZ reaction and one may therefore anticipate the presence of
[Fe(phen)3(HSO4)n(H2O)m)](3-n)+ species (n = 0 – 3). The approach of BrMA necessitates the
displacements of solvating water and of aggregating HSO4- counterions. Our results suggest that
protonation of HSO4- by H3O+ is required so that BrMA can replace a neutral H2SO4 molecule in
the solvation shell of the oxidant. The insertion of BrMA into the solvent shell of the
[Fe(phen)3]3+ species is one requirement and the second-order dependence on the proton
17
concentration further suggests that BrMA is oxidized by a doubly-charged
[Fe(phen)3(HSO4)1(L)k]2+ species, where L stands for any neutral molecule (i.e., H2O, H2SO4,
BrMA). In other words, the electrostatic stabilization of the oxidant by the aggregated anions
reduces the oxidation potential of the Fe3+-system76 and causes a kinetic barrier as it prevents the
approach of BrMA. Vice versa, the removal of these anions by protonation creates a better
oxidant and facilitates the approach of the reductant BrMA.
CONCLUSIONS
The acidity dependence of the iron-catalyzed bromate-malonic acid Belousov-Zhabotinsky
reaction was studied in the range 0.36 M < [H2SO4]0 < 1.20 M for at least 2,500 seconds with all
other initial conditions being equal. Mathematical methods for image analysis of the video-
recordings were developed to analyze the temporal evolution of the oscillation patterns. The
effects were quantified of the initial sulfur acid concentration [H2SO4]0 on the temporal evolution
of period times PTi, oxidation times OT, and reduction times RT as well as of the intensity
variations. Linear regression for the reaction parameters PTmin(t), PTmax(t), OT(t), and RT(t)
shows only very small changes over the measured reaction times and each reaction is well
characterized by the intercepts PTi(0), OT(0), and RT(0). The results show that the period times
PTi decrease exponentially with increasing acidity. Furthermore, the results show similar
oxidation times over the acidity range while the decrease of the period times with increasing
acidity primarily reflects the decrease of the reduction times RT with increasing acidity.
To understand the effect of acidity on the kinetics of the BZ reaction, we simulated the BZ
reactions with the dynamical method using all of the reactions of the core reaction mechanism
listed in Table 1 and the experimental initial concentrations of Table 2 (the BZR1 system). The
simulations of the BZR1 system failed to match the measurements even in a qualitative fashion.
Instead, we found that agreement between the experiments and the simulations can only be
achieved with the inclusion of proton-catalysis of the outer shell electron transfer reaction
18
between the oxidized [Fe(phen)3]3+ species and bromomalonic acid in reaction 9 (R9). The
simulation of R9 with a second-order dependence on [H+] (the BZR2 system) results in
compelling agreement with experiment over the entire range of acidities measured.
The suggested proton-dependence of the oxidation of BrMA by [Fe(phen)3]3+ informs about
the species involved in the outer sphere electron transfer reaction. The trication [Fe(phen)3]3+
species will be stabilized by ion pairing and solvation and one may anticipate the presence of
[Fe(phen)3(HSO4)n(H2O)m)](3-n)+ species (n = 0 – 3). The approach of BrMA necessitates the
displacements of solvating water and of aggregating HSO4- counterions. Our results suggest that
protonation of HSO4- by H3O+ is required so that BrMA can replace a neutral H2SO4 molecule in
the solvation shell of the oxidant and the second-order dependence on the proton concentration
further suggests that BrMA is oxidized by a doubly-charged [Fe(phen)3(HSO4)1(L)k]2+ species,
where L stands for any neutral molecule (i.e., H2O, H2SO4, BrMA). In other words, the
electrostatic stabilization of the oxidant by the aggregated anions reduces the oxidation potential
of the Fe3+-system and causes a kinetic barrier as it prevents the approach of BrMA.
Considering the complexity of the system and the uncertainties in the many reaction rate
constants in the BZR2 system (Table 1 with R9’), we were somewhat surprised to find this high
level of agreement by (just) the replacement of R9 by R9’. In fact, this high level of agreement
presents a powerful corroboration of the core reaction mechanism of the BrMA-rich BZ reaction
and the replacement of R9 by R9’ extents the validity of this core reaction mechanism to
acidities above and below the typical acidity of BZ reactions ([H+] 1 M). There are several
possibilities to optimize the reaction system and some will have higher priority than others. Our
results obviously imply that one ought to include an analogous [H+] dependence on R10, the
oxidation of malonic acid by the oxidized catalyst. For the present case of BrMA-rich BZ
reactions, the reduction of the [Fe(phen)3]3+ species is accomplished essentially in full by BrMA
and hence R10 or any of its proton-catalyzed variants are not competitive. It will be a high
19
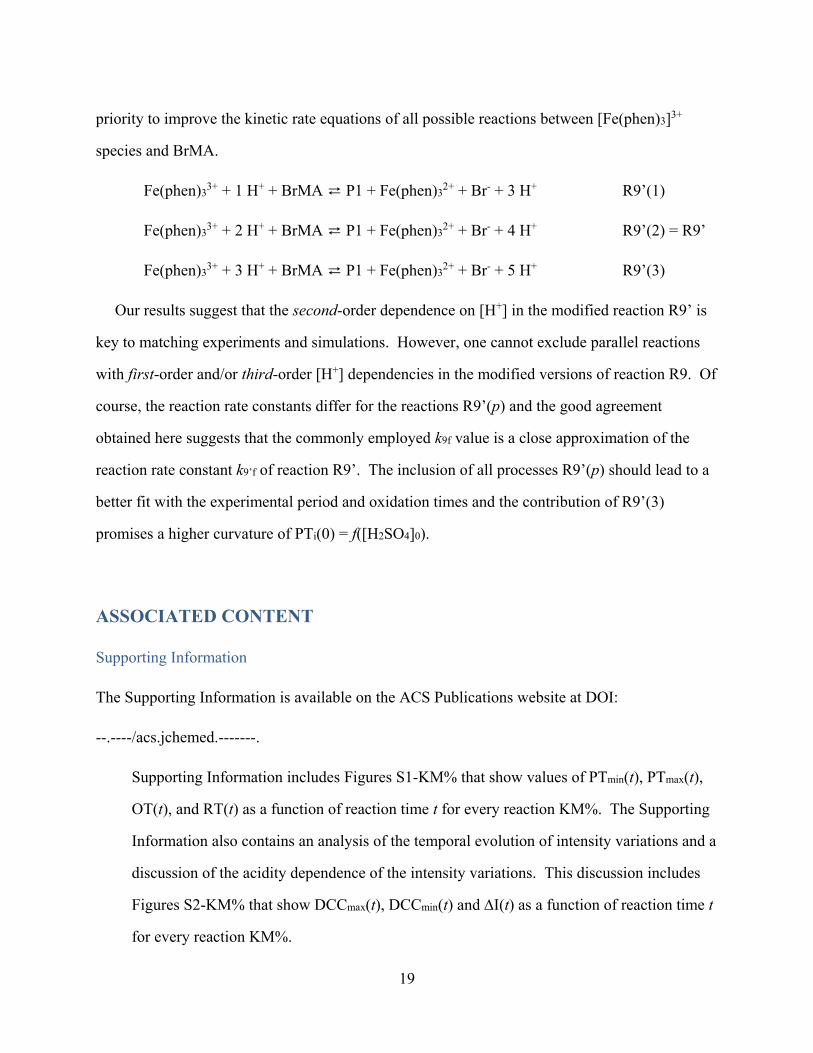
priority to improve the kinetic rate equations of all possible reactions between [Fe(phen)3]3+
species and BrMA.
Fe(phen)33+ + 1 H+ + BrMA ⇄ P1 + Fe(phen)3
2+ + Br- + 3 H+ R9’(1)
Fe(phen)33+ + 2 H+ + BrMA ⇄ P1 + Fe(phen)3
2+ + Br- + 4 H+ R9’(2) = R9’
Fe(phen)33+ + 3 H+ + BrMA ⇄ P1 + Fe(phen)3
2+ + Br- + 5 H+ R9’(3)
Our results suggest that the second-order dependence on [H+] in the modified reaction R9’ is
key to matching experiments and simulations. However, one cannot exclude parallel reactions
with first-order and/or third-order [H+] dependencies in the modified versions of reaction R9. Of
course, the reaction rate constants differ for the reactions R9’(p) and the good agreement
obtained here suggests that the commonly employed k9f value is a close approximation of the
reaction rate constant k9’f of reaction R9’. The inclusion of all processes R9’(p) should lead to a
better fit with the experimental period and oxidation times and the contribution of R9’(3)
promises a higher curvature of PTi(0) = f([H2SO4]0).
ASSOCIATED CONTENT
Supporting Information
The Supporting Information is available on the ACS Publications website at DOI:
--.----/acs.jchemed.-------.
Supporting Information includes Figures S1-KM% that show values of PTmin(t), PTmax(t),
OT(t), and RT(t) as a function of reaction time t for every reaction KM%. The Supporting
Information also contains an analysis of the temporal evolution of intensity variations and a
discussion of the acidity dependence of the intensity variations. This discussion includes
Figures S2-KM% that show DCCmax(t), DCCmin(t) and I(t) as a function of reaction time t
for every reaction KM%.
20
AUTHOR INFORMATION
Corresponding Authors
*E-mail: [email protected], [email protected]
ORCID:
Ethan Zars: 0000-0002-0619-3443
Rainer Glaser: 0000-0003-3673-3858
Marco Downing: 0000-0001-8045-7024
Carmen Chicone: 0000-0002-8692-1411
Notes
The authors declare no competing financial interest.
ACKNOWLEDGMENTS
This research was supported in part by the National Science Foundation (PRISM #0928053;
CHE #0051007) and acknowledgement is made to the donors of the American Chemical Society
Petroleum Research Fund (PRF-53415-ND4) for partial support of this research.
REFERENCES
(1) Zhabotinsky, A. M.; Zaikin, A. N. Concentration Wave Propagations in Two-
Dimensional Liquid-Phase Self-Oscillating System. Nature 1970, 225, 535–537.
(2) Zhabotinskii, A. M. The Early Period of Systematic Studies of Oscillations and Waves in
Chemical Systems. in Oscillations and Traveling Waves in Chemical Systems, Field, R. J.;
Burger, M., eds. Wiley: New York, NY, USA, 1985, pp. 1–6.
21
(3) Belousov, B. P. A Periodic Reaction and its Mechanism. in Oscillations and Traveling
Waves in Chemical Systems, Field, R. J. Burger, M., eds. Wiley: New York, NY, USA, 1985,
pp. 605–660.
(4) Sobel, S. G.; Hastings, H. M.; Field, R. J. Oxidation State of BZ Reaction Mixtures. J.
Phys. Chem. A 2006, 110, 5–7.
(5) Delgado, J.; Zhang, Y.; Xu, B.; Epstein, I. R. Terpyridine- and Bipyridine-Based
Ruthenium Complexes as Catalysts for the Belousov-Zhabotinsky Reaction. J. Phys. Chem. A,
2011, 115, 2208–2215.
(6) Toth, R.; Taylor, A. F. The Tris(2,2'-bipyridyl)ruthenium-Catalyzed Belousov-
Zhabotinsky Reaction. Prog. React. Kinetics Mech. 2006, 31, 59–115.
(7) Ueki, T.; Watanabe, M.; Yoshida, R. Belousov–Zhabotinsky Reaction in Protic Ionic
Liquids. Angew. Chem. Int. Ed. 2012, 51, 11991–11994.
(8) Shakhashiri, B. in Chemical Demonstrations Vol. 2, University of Wisconsin Press,
Madison, WI, USA, 1985, Chapter 7.6, 273–275.
(9) Li, H. Experimental Studies on the Complex Oscillatory Behavior in Gallic Acid - BrO3-
- Mn2+ - H2SO4 System. Ind. J. Chem. A 1997, 36, 823–828.
(10) Lin, H. P.; Jwo, J. J. Kinetic Study of the Belousov-Zhabotinskii Reaction with
Phenylmalonic Acid. J. Phys. Chem. 1995, 99, 6897–6902.
(11) Doona, C. J.; Kustin, K.; Orban, M.; Epstein, I. R. Systematic Design of Chemical
Oscillators. 74. Newly Designed Permanganate-Reductant Chemical Oscillators. J. Am. Chem.
Soc. 1991, 113, 7484–7489.
22
(12) Hu, G.; Chen, L.; Zhang, J.; Chen, P.; Wang, W.; Song, J.; Qiu, L.; Song, J.; Hu, L.
Determination of Alizarin Red S Using a Novel B-Z Oscillation System Catalyzed by a
Tetraazamacrocyclic Complex. Cent. Eur. J. Chem. 2009, 7, 291–297.
(13) Körös, E.; Orbán, M. Uncatalyzed Oscillatory Chemical Reactions. Nature 1978, 273,
371–372.
(14) Orbán, M.; Körös, E. Chemical Oscillations during the Uncatalyzed Reaction of
Aromatic Compounds with Bromate. 1. Search for Chemical Oscillators. J. Phys. Chem. 1978,
82, 1672–1674.
(15) Orbán, M.; Körös, E.; Noyes, R. M. Chemical Oscillations during the Uncatalyzed
Reaction of Aromatic Compounds with Bromate. 2. A Plausible Skeletal Mechanism. J. Phys.
Chem. 1979, 83, 3056–3057.
(16) Liu, J.; Scott, S. K. Hysteresis and Complex Oscillations of the Uncatalysed Belousov-
Zhabotinskii Reaction in a Stirred Flow Reactor. J. Chem. Soc. Faraday Trans. 1991, 87, 2135–
2140.
(17) Liu, J.; Scott, S. K. Mechanism for the Uncatalysed Belousov-Zhabotinskii Reaction in
Open Systems. J. Chem. Soc. Faraday. Trans. 1992, 88, 909–916.
(18) Liu, J.; Scott, S. K. Reduced Models for the Uncatalyzed Belousov-Zhabotinskii
Reaction. J. Phys. Chem. 1992, 96, 9870–9875.
(19) Ren, L.; She, W.; Gao, Q.; Pan, C.; Ji, C.; Epstein, I. R. Retrograde and Direct Wave
Locomotion in a Photosensitive Self-Oscillating Gel. Angew. Chem. Int. Ed. 2016, 55, 14301–
14305.
(20) Cherkashin, A. A.; Vanag, V. K. Self-Organization Induced by Self-Assembly in
Microheterogeneous Reaction-Diffusion System. J. Phys. Chem. B 2017, 121, 2127–2131.
23
(21) Ito, K.; Ezaki, T.; Suzuki, S.; Kobayashi, R.; Hara, Y.; Nakata, S. Synchronization of
Two Self-Oscillating Gels Based on Chemo-Mechanical Coupling. J. Phys. Chem. B 2016, 120,
2997–2983.
(22) Torbensen, K.; Rossi, F.; Pantani, O. L.; Ristori, S.; Abou-Hassan. A. Interaction of the
Belousov-Zhabotinsky Reaction with Phospholipid Engineered Membranes. J. Phys. Chem. B
2015, 119, 10224–10230.
(23) Voorsluijs, V.; Kevrekidis, I. G.; De Decker, Y. Nonlinear Behavior and Fluction-
Induced Dynamics in the Photonsensitive Belousov-Zhabotinsky Reaction. Phys. Chem. Chem.
Phys. 2017, 19, 22528–22537.
(24) Torbensen, K.; Ristori, S.; Rossi, F.; Abou-Hassan, A. Tuning the Chemical
Communication of Oscillating Microdroplets by Means of Membrane Composition. J. Phys.
Chem. C 2017, 121, 13256–13264.
(25) Smelov, P. S.; Vanag, V. K. Experimental Investigation of a Unidirectional Network of
Four Chemical Oscillators Pulse-Coupled through an Inhibitor. Russ. J. Phys. Chem. A 2017, 91,
1015–1020.
(26) Muñuzuri, A. P.; Pérez-Mercader, J. Noise-Induced and Control of Collective Behaviior
in a Population of Coupled Chemical Oscillators. J. Phys. Chem. A 2017, 121, 1855–1860.
(27) Hastings, H. M.; Field, R. J.; Sobel, S. G.; Guralnick, D. Oreganotor Scaling by the
Showalter-Noyes Limit. J. Phys. Chem. A 2016, 120, 8006–8010.
(28) Simakov, D. S. A.; Pérez-Mercader, J. Effect of Noise Correlation on Noise Induced
Oscilaltion Frequency in the Photosensitive Belousov-Zhabotinsky reaction in a Continuous
Stirred Tank Reactor. J. Phys. Chem. A 2013, 117, 13999–14005.
24
(29) Field, R. J.; Köros, E.; Noyes, R. M. Oscillations in Chemical Systems. II. Thorough
Analysis of Temporal Oscillation in the Bromate-Cerium-Malonic Acid System. J. Am. Chem.
Soc. 1972, 94, 8649–8664.
(30) Field. R. J.; Försterling, H. D. On the Oxybromine Chemistry Rate Constants with
Cerium Ions in the Field-Körös-Noyes Mechanism of the Belousov-Zhabotinskii Reaction: The
Equilibrium HBrO2 + BrO3- ↔ 2BrO2• + H2O. J. Phys. Chem. 1986, 90, 5400–5407.
(31) Försterling, H. D.; Varga, M. HBrO2/Ce4+ Reaction and HBrO2 Disproportionation
Measured in Sulfuric Acid Solution at Different Acidities. J. Phys. Chem. 1993, 97, 7932–7938.
(32) Ágreda, J. A. B.; Field, R. J. Activation Energy for the Disproportionation of HBrO2
and Estimated Heats of Formation of HBrO2 and BrO2. J. Phys. Chem. A 2006, 110, 7867–7873.
(33) Hegedüs, L.; Wittmann, M.; Noszticzius, Z.; Yan, S.; Sirimungkala, A.; Försterling, H.
D.; Field, R. J. HPLC Analysis of Complete BZ Systems. Evolution of the Chemical
Composition in Cerium and Ferroin Catalysed Batch Oscillators: Experiments and Model
Calculations. Faraday Discuss. 2001, 120, 21–38.
(34) Chou, Y. C.; Lin, H. P.; Sun, S. S.; Jwo, J. J. Kinetic Study of the Ferriin Oxidation of
Malonic Acid and Its Derivatives. Implication in the Belousov-Zhabotinsky Reaction. J. Phys.
Chem. 1993, 97, 8450–8457.
(35) Szalai, I.; Oslonovitch, J.; Försterling, H. D. Oscillations in the Bromomalonic
Acid/Bromate System Catalyzed by [Ru(phen)3]2+. J. Phys. Chem. A 2000, 104, 1495–1498.
(36) Rovinsky, A. B. Bromomalonic Acid Oxidation by the Fe(phen)33+ Ion as a Part of the
Belousov-Zhabotinsky Oscillatory Process. J. Phys. Chem. 1984, 88, 4–5.
25
(37) Sirimungkala, A.; Försterling, H. D.; Dlask, V.; Field, R. J. Bromination Reactions
Important in the Mechanism of the Belousov-Zhabotinsky System. J. Phys. Chem. A 1999, 103,
1038–1043.
(38) Smoes. M. L. Period of Homogeneous Oscillations in the Ferroin-Catalyzed
Zhabotinskii System. J. Chem. Phys. 1979, 71, 4669–4679.
(39) Misra, G. P.; Washington, R. P.; Pojman, J. A. New Experimental and Computational
Results on the Radical-Controlled Oscillating Belousov-Zhabotinsky Reaction. J. Phys. Chem. A
1998, 102, 612–619.
(40) Hsu, W. T.; Jwo, J. J. Kinetic Study of the Ce(III)-, Mn(II)- or Fe(phen)32+-Catalyzed
Belousov-Zhabotinsky Reaction with Ethyl Hydrogen Malonate. Int. J. Chem. Kinet. 2000, 32,
52–61.
(41) Skrabal, A.; Weberitsch, S. R. Zur Kenntnis der Halogensauerstoffverbindungen. IX.
Die Kinetik der Bromat-Bromidreaktion. Monats. Chem. 1915, 36, 211–235.
(42) Sullivan, J. C; Thompson, R. C. Kinetic Study of the Ce(IV)-Bromous Acid Reaction in
Acid Sulfate Solution. Implications for the Belousov-Zhabotinsky Oscillating Reaction. Inorg.
Chem. 1979, 18, 2375–2379.
(43) Noszticzius, Z.; Noszticzius, E.; Schelly, Z. A. On the Use of Ion-Selective Electrodes
for Monitoring Oscillating Reactions. 2. Potential Response of Bromide- and Iodide-Selective
Electrodes in Slow Corrosive Processes. Disproportionation of Bromous and Iodous Acids. A
Lotka-Volterra Model for the Halate Driven Oscillators. J. Phys. Chem. 1983, 87, 510–524.
(44) Faria, R. d. B.; Epstein, R. I.; Kustin, K. Kinetics of Disproportionation and pKa of
Bromous Acid. J. Phys. Chem. 1994, 98, 1363–1367.
26
(45) Glaser, R.; Jost, M. Disproportionation of Bromous Acid HOBrO by direct O-Transfer
and via Anhydrides O(BrO)2 and BrO-BrO2. An Ab Initio Study of the Mechanism of a Key
Step of the Belousov-Zhabotinsky Oscillating Reaction. J. Phys. Chem. A 2012, 116, 8352–
8365.
(46) Cerium-catalyzed Bromate-Malonic Acid Reaction. In Chemical Demonstrations,
Shakashiri, B. Z., Vol. 2. The University of Wisconsin Press: Madison, WI, p. 257
(47) Aoao Photo, <http://www.aoaophoto.com> (accessed 05/20/2018).
(48) Aoao Video to Picture Converter, < https://www.aoaophoto.com/video-to-picture-
converter/video-to-picture.htm > (accessed 05/20/2018).
(49) Wolfram Research, Inc., Mathematica, Version 10.2, Champaign, IL (2015),
<http://www.wolfram.com/mathematica/> (accessed 05/20/2018).
(50) Aoao Video to Picture Converter, < https://www.aoaophoto.com/video-to-picture-
converter/video-to-picture.htm > (accessed 05/20/2018).
(51) Maleki, N.; Safavi, A.; Sedaghatpour, F. Single-Step Calibration, Prediction and Real
Samples Data Acquisition for Artificial Neural Network Using a CCD Camera. Talanta 2004,
64, 830–835.
(52) Firdaus, M. L.; Alwi, W.; Trinoveldi, F.; Rahayu, I.; Rahmidar, L.; Warsito, K.
Determination of Chromium and Iron Using Digital Image-Based Colorimetry. Procedia
Environmental Sciences 2014, 20, 298–304.
(53) dos Santos Benedetti, L. P.; dos Santos, V. B.; Silva, T. A.; Filho, E. B.; Martins, V. L.;
Fatibello-Filho, O. A Digital Image-Based Method Employing a Spot-Test for Quantification of
Ethanol in Drinks. Anal. Methods 2015, 7, 4138–4144.
27
(54) Kohl, S. K.; Landmark, J. D.; Stickle, D. F. Demonstration of Absorbance Using Digital
Color Image Analysis and Colored Solutions. J. Chem. Educ. 2006, 83, 644–646.
(55) Huang, W. E.; Smith, C. C.; Lerner, D. N.; Thornton, S. F.; Oram, A. Physical
Modelling of Solute Transport in Porous Media: Evaluation of an Imaging Technique using UV
excited Fluorescent Dye. Water Research 2002, 36, 1843–1853.
(56) Li, W.; Zhang, R.; Wang, H.; Jiang, W.; Wang, L.; Li, H.; Wu, T.; Du, Y. Digital Image
Colorimetry Coupled with a Multichannel Membrane Filtration-Enrichment Technique to Detect
Low Concentration Dyes. Anal. Methods 2016, 8, 2888–2894.
(57) Lopez-Molinero, A.; Cubero, V. T.; Irigoyen, R. D.; Piazuelo, D. S. Feasibility of
Digital Image Colorimetry-Application for Water Calcium Hardness Determination. Talanta
2013, 103, 236–244.
(58) da Nobrega Gaiao, E.; Martins, V. L.; da Silva Lyra, W.; de Almeida, L. F.; da Silva, E.
C.; Araújo, M. C. U. Digital Image-Based Titrations. Anal. Chim. Acta 2006, 570, 283–290.
(59) Tôrres, A. R.; da Silva Lyra, W.; de Andrade, S. I. E.; Andrade, R. A. N.; da Silva, E.
C.; Araújo, M. C. U.; da Nóbrega Gaião, E. A Digital Image-Based Method for Determining of
Total Acidity in Red Wines Using Acid–Base Titration without Indicator. Talanta 2011, 84,
601–606.
(60) Dong, W.; Selvadurai. A. P. S. Image Processing Technique for Determining the
Concentration of a Chemical in a Fluid-Saturated Porous Medium. Geotechnical Testing
Journal 2006, 29, 1–7.
(61) Hsieh, K. T.; Urban, P. L. Spectral Imaging of Chemical Reactions Using a Computer
Display and a Digital Camera. RSC Adv. 2014, 4, 31094–31100.
28
(62) Glaser, R. E.; Delarosa, M. A.; Salau, A. O.; Chicone, C. Dynamical Approach to
Multi-Equilibria Problems for Mixtures of Acids and their Conjugate Bases. J. Chem. Educ.
2014, 91, 1009–1016.
(63) Zars, E.; Schell, J.; Delarosa, M. A.; Chicone, C.; Glaser, R. E. Dynamical Approach to
Multi-Equilibria Problems Considering the Debye-Hückel Theory of Electrolyte Solutions:
Concentration Quotients as a Function of Ionic Strength. J. Solution Chem. 2017, 46, 1–20.
(64) Schell, J.; Zars, E.; Chicone, C.; Glaser, R. E. Simultaneous Determination of All
Species Concentrations in Multi-Equilibria for Aqueous Solutions of Dihydrogen Phosphate
Considering Debye-Hückel Theory. J. Chem. Eng. Data 2018, 63, 2151 – 2161.
(65) Horn, F.; Jackson, R. General Mass Action Kinetics. Arch. Ration. Mech. Anal. 1972,
47, 81–116.
(66) Wolfram Mathematica 9.0 Documentation Center, Wolfram Research Inc.
http://reference.wolfram.com/language/ref/NDSolve.html (accessed 05/20/2018)
(67) Smith, W. R.; Missen, R. W. Using Mathematica and Maple to Obtain Chemical
Equations. J. Chem. Educ. 1997, 74, 1369–1371.
(68) Corraine, M. S.; Lai, C. K.; Zhen, Y.; Churchill, M. R.; Buttrey, L. A.; Ziller, J. W.;
Atwood, J. D. Kinetics of the Reduction of Co(o-phen)33+ by the Metal Carbonyl Anions
Re(CO)5-, Mn(CO)4L- (L = CO, PEt3, PBu3, PPh3), Co(CO)4
-, CpMo(CO)3-, and CpFe(CO)2
-
(Cp = 5-C5H5, o-phen = o-Phenanthroline). Structural Determinations of [PPN+][Mn(CO)5-]
and [PPN+][Mn(CO)4(PEt3)-]•THF. Organometallics 1992, 11, 35–40.
(69) Haynes, W. M., Ed. CRC Handbook of Chemistry and Physics, 95th ed.; CRC Press:
Boca Raton, FL, 2014.
29
(70) Ford-Smith, M. H.; Sutin, N. The Kinetics of the Reactions of Substituted 1,10-
Phenanthroline, 2,2’-Dipyridine and 2,2’,2’’-Tripyridene Complexes of Iron(III) with Iron(II)
Ions. J. Am. Chem. Soc. 1961, 83, 1830–1834.
(71) Dickens, J. E.; Basolo, F.; Neumann, H. M. Mechanism of Racemization of Complex
Ions. III. Effect of Added Ions upon the Rates of Dissociation of Tris-(1,10-phenanthroline)-
iron(II) and Tris-(1,10-phenanthroline)-iron(III) and upon the Rate of Racemization of Tris-
(1,10-phenanthroline)-iron(III). J. Am. Chem. Soc. 1957, 79, 1286–1290.
(72) Stalnaker, N. D.; Solenberger, J. C.; Wahl, A. C. Electron-Transfer between Iron,
Ruthenium, and Osmium Complexes Containing 2,2’-Bipyridyl, 1,10-Phenanthroline, or Their
Derivatives. Effects of Electrolytes on Rates. J. Phys. Chem. 1977, 81, 601–604.
(73) Schmid, R.; Kirchner, K.; Dickert, F. L. Redox Kinetics of Metal Complexes in
Nonaqueous Solutions: Reductions of Tris(1,10-phenanthroline)- and Tris(2,2’-
bipyridine)iron(III) by Hexakis(N,N-dimethylformamide)iron(II) in Acetonitrile: Role of First
Coordination Sphere. Inorg. Chem. 1988, 27, 1530–1536.
(74) Wangila, G. W.; Jordan, R. B. Kinetic Studies of Tris(2,2’-bipyridine)iron(III)
Perchlorate with Cobaloxime, [Co(dmgBF2)2(H2O)2]. Inorg. Chim. Acta 2005, 358, 2804–2812.
(75) Du, G.; Espenson, J. H. Kinetics of the Reaction of Chromium(VI) with Tris(1,10-
phenanthroline)iron(II) Ions in Acidic Solutions. Anion and Medium Effects: Perchlorate
versus Triflate. Inorg. Chem. 2006, 45, 1053–1058.
(76) Borchardt, D.; Wherland, S. Solvent, Temperature, and Electrolyte Studies on the
Electron-Transfer Reaction between Ferrocene and a Cobalt Clathrochelate. Inorg. Chem. 1984,
23, 2537–2542.
(77) Borchardt, D.; Wherland, S. Electron-Transfer Studies on a Series of Cobalt
Clathrochelates in Acetonitrile. Inorg. Chem. 1986, 25, 901–905.
30
(78) Baker, L.; Engelhardt, L. M.; Figgis, B. N.; White, A. H. Crystal Structure, Electron
Spin Resonance, and Magnetism of Tris-(o-phenanthroline)iron(III) Percholorate Hydrate. J.
Chem. Soc. Dalton Trans. 1975, 530–534.
(79) Odoko, M.; Okabe, N. Tris(1,10-phenanthroline--2N,N’)iron(III) Trinitrate
Monohydrate. Acta Cryst. 2004, E60, m1822–m1824.
(80) Teramoto, K.; Kawasaki, T.; Nishide, T.; Ikeda, Y. Crystal Structure of Tris(1,10-
phenanthroline-2N,N’)iron(II) Bis[bis(trifluoromethylsulfonyl)imide] Monohydrate. Acta
Cryst. 2015, E71, m8–m9.
31
Table 1. Reactions and Rate Constants for BZR simulation
Rxn. Formula Rate Constants Ref.
R1 HOBr + Br- + H+ ⇄ Br2 + H2O 𝑘1𝑓 = 8 × 10⁹
𝑘1𝑟 = 110 30
R2 HBrO2 + Br- + H+ ⇄ 2 HOBr 𝑘2𝑓 = 3.0 × 10⁶
𝑘2𝑟 = 2.0 × 10⁻⁵ 30
R3 BrO3- + Br- + 2 H+ ⇄ HBrO2 + HOBr
𝑘3𝑓 = 2.0
𝑘3𝑓 = 3.2 30
R4 2 HBrO2 ⇄ BrO3- + HOBr + H+
𝑘4𝑓 = 781
𝑘4𝑟 = 1.0 × 10⁻⁸ 32
R4b HBrO2 + H2BrO2+ → BrO3
- + HOBr + 2H+ 𝑘4′𝑓 =
1013
0.02= 50650
32
R5a BrO3- + HBrO2 + H+ ⇄ Br2O4 + H2O
𝑘5𝑎𝑓 = 48
𝑘5𝑎𝑟 = 3.2 × 10³ 35
R5b Br2O4 ⇄ 2BrO2• 𝑘5𝑏𝑓 = 7.5 × 10⁴
𝑘5𝑏𝑟 = 1.4 × 10⁹ 35
R6 BrO2• + Fe(phen)32+ + H+ ⇄ HBrO2 + Fe(phen)3
3+ 𝑘6𝑓 = 1.0 × 10⁹
𝑘6𝑟 = 33 30
R8a Br2 + MA(enol) → BrMA + Br- + H+ 𝑘8𝑎𝑓 = 2.0 × 10⁶ 33
R8b HOBr + MA(enol) → BrMA + H2O 𝑘8𝑏𝑓 = 6.7 × 10⁵ 33
R9 Fe(phen)33+ + BrMA ⇄ P1 + Fe(phen)3
2+ + Br- + 2H+ 𝑘9𝑓 = 10
𝑘9𝑟 = 1.0 36
R10 Fe(phen)33+ + MA → P2 + H+ + Fe(phen)3
2+ 𝑘10𝑓 =0.0024 34
E MA ⇄ MA(enol) 𝑘𝐸𝑓 = 2.6 × 10⁻³
𝑘𝐸𝑟 = 180 37
A1 H2BrO2+ ⇄ HBrO2 + H+
𝑘𝐴1𝑓 = 1.0 × 10⁸
𝑘𝐴1𝑟 = 1.5 × 10⁸ 31
32
Table 2. Initial Reaction Conditions and Reaction Naming Convention
BZ Reaction
with K+ salts
BZ Reaction
with Na+ salts
H2SO4
[M]
pH
KM036 NaM036 0.360 0.443
KM041 NaM041 0.408 0.389
KM043 NaM043 0.432 0.364
KM048 NaM048 0.481 0.318
KM053 NaM053 0.529 0.277
KM055 NaM055 0.553 0.258
KM060 NaM060 0.601 0.221
KM062 NaM062 0.625 0.204
KM065 NaM065 0.649 0.188
KM072 NaM072 0.721 0.142
KM077 NaM077 0.769 0.114
KM084 NaM084 0.841 0.075
KM089 NaM089 0.889 0.051
KM096 NaM096 0.961 0.017
KM108 NaM108 1.081 -0.034
KM120 NaM120 1.201 -0.080 aAll reactions employed [MA]0 = 100.5 mM and [Fe]0 = 0.297 mM. bReactions KM%%% employed potassium salts: [KBrO3]0 = 74.36 mM, [KBr]0 = 19.22 mM. cReactions NaM%%% employed potassium salts: [NaBrO3]0 = 73.63 mM, [NaBr]0 = 19.06 mM. dApproximate pH computed by pH = -log10[H2SO4]0.
33
Table 3. Reaction Parameters PTmin(t), PTmax(t), OT(t), and RT(t) at t = 500 and t = 2000
Seconds
Reaction
PTmin(t) PTmax(t) OT(t) RT(t)
t = 500
t =
2000
t = 500
t =
2000
t =
500
t =
2000
t = 500
t =
2000
KM036 -a 494.6b - 496.4 - 14.2 - 482.2
KM041 - 482.0 - 483.1 - 15.2 - 467.8
KM043 - 336.2 - 337.7 - 15.9 - 321.8
KM048 - 184.2 212.1 187.3 12.9 14.4 199.2 172.9
KM053 86.3 75.6 84.5 75.5 7.6 8.3 76.9 67.2
KM055 89.5 79.4 88.9 80.6 8.7 9.0 80.2 71.6
KM060 83.4 75.8 81.5 7.6 7.1 8.6 74.4 68.0
KM062 57.7 60.0 58.7 59.3 8.2 7.0 54.5 52.3
KM065 41.7 41.7 42.3 42.9 7.2 7.9 35.1 35.0
KM072 32.2 32.8 31.8 32.9 6.5 7.4 25.3 25.5
KM077 21.7 22.6 21.8 22.6 4.7 4.6 17.2 18.0
KM084 21.1 23.4 21.1 22.8 5.4 5.3 15.7 17.6
KM089 17.1 18.7 17.3 18.1 4.4 4.1 12.8 14.0
KM096 9.2 9.9 9.2 10.0 4.4 4.6 4.8 5.4
KM108 11.8 13.3 11.7 13.4 5.1 5.5 6.7 7.9
KM120 8.1 9.1 8.2 9.3 4.1 4.5 4.1 4.6 aReactions with lower initial sulfuric acid concentration sometimes did not exhibit a first
oscillation until after 500 seconds of reaction time. bParameter values were chosen on the basis of the proximity of their time (absolute value) from t
= 500 or t = 2000 seconds.
34
Table 4. Linear Regression for Reaction Parameters PTmin(t), PTmax(t), OT(t), and RT(t) of
KM Reactions
Reaction PTmin(t) PTmax(t) PTa PT1(0) m1∙103 R2 est PT2(0) m2∙103 R2 est
KM036 639.92 -67.86 0.94 9.21 577.13 -40.94 0.75 16.39 10.88
KM041 543.55 -40.82 0.87 7.87 528.94 -34.17 0.86 9.15 2.76
KM043 377.18 -20.61 0.96 1.90 369.62 -16.60 0.92 2.80 2.04
KM048 224.11 -17.40 0.95 2.85 222.76 -16.71 0.98 2.03 0.60
KM053 86.08 -5.01 0.89 1.24 86.59 -5.29 0.97 0.61 -0.59
KM055 91.31 -5.47 0.91 1.19 91.27 -5.45 0.99 0.47 0.04
KM060 82.39 -2.72 0.80 0.85 82.62 -2.90 0.98 0.26 -0.29
KM062 58.54 0.38 0.15 0.75 58.49 0.41 0.92 0.15 0.09
KM065 42.16 0.37 0.13 0.65 42.09 0.43 0.97 0.07 0.17
KM072 31.52 0.68 0.47 0.55 31.49 0.70 0.98 0.10 0.07
KM077 21.63 0.47 0.38 0.47 21.59 0.50 0.98 0.07 0.21
KM084 20.58 1.16 0.57 0.63 20.59 1.15 0.98 0.12 -0.06
KM089 17.22 0.36 0.60 0.28 17.21 0.37 0.93 0.13 0.07
KM096 8.98 0.47 0.99 0.04 8.98 0.47 1.00 0.03 0.02
KM108 11.30 1.04 0.98 0.11 11.30 1.04 1.00 0.05 0.01
KM120 7.82 0.70 0.99 0.06 7.82 0.70 1.00 0.05 0.02
Reaction OT(t) RT(t)
OT(0) m3∙103 R2 est RT(0) m4∙103 R2 est
KM036 13.58 1.03 0.13 1.83 562.85 -41.96 0.72 18.13
KM041 17.81 -0.72 0.07 1.75 510.51 -33.41 0.84 9.53
KM043 15.25 -0.19 0.01 1.02 354.11 -16.40 0.89 3.31
KM048 11.39 0.40 0.07 1.09 211.17 -17.11 0.96 2.52
KM053 8.37 0.02 0.00 0.73 78.02 -5.18 0.94 0.93
KM055 9.01 -0.27 0.07 0.71 82.29 -5.22 0.95 0.84
KM060 8.52 -0.14 0.03 0.55 73.91 -2.61 0.86 0.69
KM062 7.36 0.15 0.06 0.50 51.15 0.25 0.14 0.53
KM065 6.74 0.08 0.02 0.41 35.38 0.32 0.22 0.41
KM072 6.72 0.15 0.10 0.35 24.80 0.53 0.58 0.35
KM077 4.79 -0.08 0.03 0.36 16.80 0.57 0.57 0.39
KM084 5.12 0.23 0.10 0.44 15.47 0.93 0.59 0.49
KM089 4.49 0.09 0.17 0.19 12.72 0.28 0.57 0.23
KM096 4.35 0.12 0.94 0.03 4.63 0.35 0.99 0.03
KM108 5.02 0.25 0.87 0.07 6.29 0.79 0.98 0.08
KM120 3.99 0.26 0.95 0.05 3.84 0.44 0.98 0.05 aPT = {PT1(0) – PT2(0) / PT2(0)}·100%
35
Table 5. Linear Regression for Reaction Parameters PTmin(t), PTmax(t), OT(t), and RT(t) of
BZR2 Simulation
[H2SO4]0b
PTmin(t) PTmax(t) PTa PT1(0) m1∙103 R2 est PT2(0) m2∙103 R2 est
0.30 329.59 63.93 1.00 0.00 408.13 22.09 0.77 0.00 19.25
0.40 252.88 -2.65 0.04 0.00 255.21 -4.94 0.14 6.35 0.91
0.50 162.88 -2.91 0.10 4.13 160.14 -2.66 0.20 3.93 0.07
0.60 109.50 -0.08 0.01 2.70 110.21 -0.38 0.12 2.61 0.64
0.65 93.95 0.48 0.06 2.36 94.35 0.34 0.04 2.30 0.48
0.75 74.08 -0.77 0.28 2.46 73.00 -0.13 0.00 2.37 0.11
0.85 33.09 -2.54 0.22 0.73 34.41 -3.46 0.20 0.72 3.85
0.90 28.33 -1.17 0.24 0.65 28.98 -1.62 0.20 0.65 2.19
1.00 23.01 -0.46 0.30 0.54 23.20 -0.58 0.22 0.54 0.71
1.10 19.47 -0.17 0.10 0.46 19.56 -0.21 0.12 0.45 0.34
1.20 17.16 -0.12 0.08 0.40 17.19 -0.14 0.13 0.40 0.18
1.30 15.34 -0.06 0.01 0.36 15.35 -0.07 0.05 0.36 0.04
1.40 13.89 0.02 0.00 0.32 13.88 0.02 0.01 0.33 0.06
1.50 12.65 0.13 0.05 0.30 12.64 0.14 0.06 0.30 0.10
[H2SO4]0 OT(t) RT(t)
OT(0) m3∙103 R2 est RT(0) m4∙103 R2 est
0.30 50.24 36.23 0.80 0.00 339.29 -3.93 1.00 0.00
0.40 72.97 1.35 0.01 3.44 186.04 -9.19 0.78 0.00
0.50 50.06 1.57 0.07 2.25 110.72 -4.86 0.75 3.39
0.60 37.02 2.93 0.90 1.57 72.80 -3.14 0.98 2.16
0.65 33.18 3.39 0.80 1.43 61.00 -3.01 0.99 1.85
0.75 28.28 3.91 0.83 1.54 44.59 -4.03 0.99 1.87
0.85 17.24 -1.14 0.19 0.53 15.81 -1.38 0.23 0.50
0.90 15.19 -0.65 0.28 0.47 13.14 -0.51 0.16 0.44
1.00 12.34 -0.21 0.18 0.39 10.69 -0.25 0.22 0.36
1.10 10.56 -0.13 0.14 0.34 8.92 -0.02 0.01 0.32
1.20 9.28 -0.14 0.21 0.29 7.88 0.02 0.01 0.27
1.30 8.24 -0.15 0.19 0.26 7.11 0.08 0.04 0.25
1.40 7.37 -0.09 0.13 0.23 6.52 0.11 0.07 0.22
1.50 6.62 -0.05 0.04 0.22 6.03 0.18 0.16 0.21 aPT = {PT1(0) – PT2(0) / PT2(0)}·100% b[H+]0 = [H2SO4]0.
36
Scheme 1. Definition of the Oscillation Parameters DCCmin(t), DCCmax(t), PTmax(t),
PTmin(t), OT(t), and RT(t)
37
Figure 1. DCC values over time (500 - 2500 sec) for reactions KM120 (blue), KM089 (green),
KM048 (red).
38
Figure 2. DCC values over time (1300 - 1600 sec) for reactions KM120 (blue), KM089 (green),
and KM048 (red).
39
Figure 3. Values of PTmin(t), PTmax(t), OT(t), and RT(t) as a function of reaction time t for
reaction KM089 (green in Figures 1 and 2). Unfilled diamonds indicate PTmin(t) and filled
diamonds indicate PTmax(t), circles indicate OT(t), and triangles indicate RT(t). The regressions
lines also are shown for PTmin(t) = m1·t + PT1(0), PTmax(t) = m2·t + PT2(0), OT(t) = m3·t + OT(0)
and RT(t) = m4·t + RT(0).
0
5
10
15
20
0 500 1000 1500 2000 2500 3000 3500
PT
min
(t),
PT
max
(t),
OT(t)
, RT(t)
(se
c)
Time (sec)
40
Figure 4. Period length variations of the KM series of reactions depending on sulfuric acid
concentration. Values of PTi(0) (top) and of mi∙103 (bottom) are shown as a function of initial
sulfuric acid concentration [H2SO4]0. Unfilled diamonds indicate PT1(t) and m1 values, and
filled diamonds indicate PT2(t) and m2 values. An exponential regression curve is also plotted
for the PT1(0) data.
0
100
200
300
400
500
600
0.0 0.3 0.6 0.9 1.2 1.5
PT i
(0)
(sec
)
[H2SO4]0 (mol L-1)
-80
-60
-40
-20
0
20
0.0 0.3 0.6 0.9 1.2 1.5
mi∙1
03
(sec
)
[H2SO4]0 (mol L-1)
41
Figure 5. Variation of reduction times RT(0) (top) and of m4∙103 (bottom) of the KM series of
reactions depending on the initial sulfuric acid concentration [H2SO4]0.
0
100
200
300
400
500
600
0.0 0.3 0.6 0.9 1.2 1.5
RT(
0)
(sec
)
[H2SO4]0 (mol L-1)
-50
-40
-30
-20
-10
0
10
0.0 0.3 0.6 0.9 1.2 1.5
m4∙1
03
(sec
)
[H2SO4]0 (mol L-1)
42
Figure 6. Variation of oxidation times OT(0) of the KM series of reactions depending on the
initial sulfuric acid concentration [H2SO4]0.
0
4
8
12
16
20
0.0 0.3 0.6 0.9 1.2 1.5
OT(
0)
(sec
)
[H2SO4]0 (mol L-1)
43
Figure 7. Simulated concentrations (mol∙L-1) of HBrO2 as a function of time (t, in seconds) for
the simulation system BZR2 with constant initial conditions [BrO3-]0 = 0.07436 mol∙L-1, [Br-]0 =
0.01922 mol∙L-1, [MA]0 = 0.1 mol∙L-1. The initial sulfuric acid concentration was varied and the
[HBrO2](t) traces are shown for the three acidities [H2SO4]0 = 1.20 mol∙L-1 (blue), [H2SO4]0 =
0.89 mol∙L-1 (green), [H2SO4]0 = 0.48 mol∙L-1 (red) corresponding to the experimental systems
KM120, KM089, and KM048 respectively. The [HBrO2](t) trace for [H2SO4]0 = 0.48 mol∙L-1
(red) has concentration maxima on the order of 1.35∙10-5 mol∙L-1.
0.0
1.0
2.0
3.0
4.0
5.0
500 600 700 800 900 1000
[HB
rO2]
(mo
l ∙ 1
07
∙ L-1
)
Time (sec)
44
Figure 8. Period length variations of the simulation BZR1 (blue), BZR2 (green), and the
exponential regression curve of the experimental data (black) depending on acid concentration.
Values of PTi(0) are shown as a function of initial sulfuric acid concentration [H2SO4]0 (mol∙L-1).
Unfilled shapes indicate PT1(0) values, and filled shapes indicate PT2(0) values. Exponential
regression curves are shown for PT1(0) values (solid green line) and PT2(0) values (dashed green
line) for the simulation BZR2.
0
50
100
150
200
250
300
0.0 0.3 0.6 0.9 1.2 1.5
PT i
(0)
(se
c)
[H2SO4]0 (mol∙L-1)
45
TOC Graphic