Embed Size (px)
Citation preview
Australasian AccountingBusiness and Finance Journal
Volume 7 | Issue 2 Article 2
Informed Trading, Flow Toxicity and the Impact onIntraday Trading FactorsWang Chun WeiUniversity of Sydney, [email protected]
Dionigi GeraceUniversity of Wollongong
Alex FrinoUniversity of Sydney
Follow this and additional works at: http://ro.uow.edu.au/aabfjCopyright ©2013 Australasian Accounting Business and Finance Journal and Authors.
Research Online is the open access institutional repository for theUniversity of Wollongong. For further information contact the UOWLibrary: [email protected]
Recommended CitationWei, Wang Chun; Gerace, Dionigi; and Frino, Alex, Informed Trading, Flow Toxicity and the Impacton Intraday Trading Factors, Australasian Accounting Business and Finance Journal, 7(2), 2013, 3-24.Available at:http://ro.uow.edu.au/aabfj/vol7/iss2/2

Informed Trading, Flow Toxicity and the Impact on Intraday TradingFactors
AbstractThis study involves a detailed discussion on the estimation of intraday time-varying volume synchronisedprobability of informed trading (VPIN), a proxy for levels of informed trading and flow toxicity, followed byintraday analysis on its impact of the behaviour of intraday trading in a limit order book (LOB) market. Thevariation of VPIN used is closely based on the original from Easley, Lopez de Prado and O’Hara (2010), usingtrade volume imbalance information. This study shows that different capitalisation stocks exhibit differentVPIN characteristics. Previous studies on other variations of PIN have looked at its determination on pricemovements, and whether a lead-lag relationship exists. This study examines if VPIN has an effect on several ofintraday trading factors in the Australian market, being a LOB. In particular, it documents if Granger causalityexists between (1) VPIN and quote imbalance, 20(2) VPIN and intraday price volatility and (3) VPIN andintraday trade frequency or similarly in an inverse manner, duration.
For this analysis the Hsiao-Kang methodology for Granger testing has been followed and the posterior oddsratio test used to measure the strength of Granger causality in equity markets as suggested recently byAtukeren (2005). Feedback causality between VPIN and all three intraday factors is apparent.
KeywordsVPIN, flow toxicity, informed trading, quote imbalance, realised volatility, volume bucketing, marketmicrostructure, Granger causality
Cover Page FootnoteThis research is conducted with the guidance and support of Capital Markets CRC
This article is available in Australasian Accounting Business and Finance Journal: http://ro.uow.edu.au/aabfj/vol7/iss2/2

3
Informed Trading, Flow Toxicity and the Impact on Intraday Trading Factors1
Wang Chun Wei2, Dionigi Gerace3 & Alex Frino2
Abstract
This study involves a detailed discussion on the estimation of intraday time-varying volume synchronised probability of informed trading (VPIN), a proxy for levels of informed trading and flow toxicity, followed by intraday analysis on its impact of the behaviour of intraday trading in a limit order book (LOB) market. The variation of VPIN used is closely based on the original from Easley, Lopez de Prado and O’Hara (2010), using trade volume imbalance information. This study shows that different capitalisation stocks exhibit different VPIN characteristics. Previous studies on other variations of PIN have looked at its determination on price movements, and whether a lead-lag relationship exists. This study examines if VPIN has an effect on several of intraday trading factors in the Australian market, being a LOB. In particular, it documents if Granger causality exists between (1) VPIN and quote imbalance, 20(2) VPIN and intraday price volatility and (3) VPIN and intraday trade frequency or similarly in an inverse manner, duration.
For this analysis the Hsiao-Kang methodology for Granger testing has been followed and the posterior odds ratio test used to measure the strength of Granger causality in equity markets as suggested recently by Atukeren (2005). Feedback causality between VPIN and all three intraday factors is apparent.
Keywords: VPIN, flow toxicity, informed trading, quote imbalance, realised volatility, volume bucketing, market microstructure, Granger causality
JEL Classification: C01, C02, G10, G14, G17
1 This research is conducted with the guidance and support of Capital Markets CRC 2 University of Sydney, Business School 3 University of Wollongong Email: [email protected]
AABFJ | Volume 7, no. 2, 2013
4
1. Introduction It is widely recognised in financial markets that price discovery is driven by information flow. It is therefore no surprise that a vast amount of literature in the market microstructure space has been generated in the last few years on the topic of identifying informed traders and how they impact the price discovery process. Most of the current literature divides traders or trades into 'informed' or 'un-informed' classes and analyses the impact of informed trading within financial markets. Most prominently in this field of research has been Easley et al. (1996) who incorporated the use of a Poisson model to estimate the probability of informed trading (PIN) via the number of buys and sells. PIN therefore has been used numerously in the literature as an indicator for the level of informed trading in the market.
In conjunction with levels of informed trading are the levels of order flow toxicity. The concept of flow toxicity is related to adverse selection in the market place. Many market microstructure models focus on when informed traders take liquidity from uninformed traders or market makers. Toxicity, within this framework, refers to cases where uninformed investors have been providing liquidity at a loss due to adverse selection. For example, a limit order in the LOB might be picked off by an informed trader. This occurrence is most likely in times when there is higher probability of informed trading. It is can be summarised that in instances of high informed trading, order flow toxicity in the market is high. In short, focusing on the imbalance between the buy and sell arrival rates to determine the level of informed trading in the market, provides a method of determining flow toxicity, as well as a quantifiable measure on the level of adverse selection in the market place. This paper intends to employ a similar methodology to identify periods of high order flow toxicity and determine its effect on intraday trading behaviours.
This paper begins by discussing a new variation of the probability of informed trading (PIN), based on the volume imbalance between buy and sell initiated trades, to measure flow toxicity and the implicit risk for liquidity holders. This new measure, recently developed by Easley et al. (2010), is called the volume synchronised probability of informed trading (VPIN4). VPIN adds a new dimension to the PIN measure by synchronising itself to intraday traded volume. As suggested by Easley et al. (2010), time is of little relevance in high frequency microstructure and instead the focus should be on “trade time” as captured by volume bucketing (explained in section 4.1). Unlike intraday equally time stamped measures, VPIN is updated matching the speed of the arrival of new information into the market place. Technically, volume synchronised subsampling is a specific form of a more generalised time-deformation technique where the subordinator process in this case for subsampling is the accumulated trade volume. This concept of using subordinators for information flow synchronisation dates back to Clark (1973), and was further generalised by Ané and Geman (2000), Zhang, Mykland & Aït-Sahalia (2005) and Feng, Song and Wirjanto (2008). It is shown in the literature that empirical distributional characteristics on subsampled asset returns no longer suffer from leptokurtic properties which arguably validates claims on a Brownian process after subsampling. This also infers that time-deformed asset prices synchronised for information flow via a subordinator exhibit characteristics are more likely to reflect the efficient price by largely filtering out a lot of microstructure noise caused by market inefficiencies, which as described in Hasbrouck (2006) include factors such as tick size, bid-ask bounce, broker screen fighting, price limits and circuit breakers amongst other things.
Furthermore, uniquely different to earlier variations on PIN, there is no requirement to estimate latent parameters via maximum likelihood procedures for VPIN. This is due to the
4 The authors acknowledge VPIN as a registered trademark of Tudor Investment Corporation.

Wei, Gerace and Frino | Informed Trading, Flow Toxicity
5
fact that VPIN is purely based on the aggregation of the imbalance between buy and sell initiated traded volume (discussed in detail in Section 4) . Easley et al. (2010) argue that it is the unbalanced volume that most accurately infers higher toxicity and adverse selection. Furthermore, they discuss that an increase in VPIN would indicate greater trading on information, with greater adverse selection and increased order flow toxicity, suggesting that liquidity providers have a higher chance of being picked off by informed investors.
This paper focuses on examining the impact of informed trading, or the influx of informed trading and order flow toxicity, on a LOB market. To implement this, the authors leverage off the new technique VPIN, and modify it to test for causal relationships between it and other intraday trade dynamics (namely (1) quote imbalance, (2) price volatility and (3) duration) at the stock level. First (1), high flow toxicity may adversely impact new quotes coming into the market as new investors posting limit orders are afraid of submitting further quotes in the case of being picked off in a period where the probability of informed investors is high. Secondly (2), similar to Easley et al. (2010), the researchers examine if VPIN is able to Granger cause intraday price volatility. Theoretically, periods are expected when informed information has entered the market to be followed by larger absolute price changes. This would suggest that VPIN may possibly Granger cause absolute returns in stocks. Thirdly (3), the authors examine if VPIN affects trade duration or similarly trade intensity. The authors proxity trade duration to be the time difference between the start and end of a volume bucket, which will be explained in the methodology.
In regards to Granger causality, Easley et al. (2010) uses a VAR(1) modelling framework to show that the intraday VPIN measure Granger-caused intraday realised volatility for E-mini S&P 500 futures contracts. However, the VAR specification of lag 1 was ad hoc and unexplained. As discussed in various econometrics literature (see Hsiao (1979), Kang (1989), Thornton and Batten (1984) and Atukeren (2005)), lag specification greatly affects the results from Granger causality testing via a VAR framework. In this paper, existing research is extended by employing a robust measure explained in Atukeren (2005), combining Hsiao's (1979) lag selection procedure and Poskitt and Tremayne's (1987) posterior odds ratio test based on the Bayesian Information Criterion to test for Granger causality rather than conventional Walds tests used in the existing literature. The authors believe this flexible Bayesian approach based on “grades of evidence” provides a sound framework for linear time series identification.
This empirical research focuses on 30 listed stocks in the Australian Stock Exchange (ASX). The Australian market has been selected for analysis as it presents a clean LOB market. Arguably, prices received from a LOB are cleaner than earlier analysis performed on the US market (such as the NASDAQ) as it is not distorted by a market maker quote driven orderbook. In Christie and Schultz (1995), market makers are known to collude to maintain profits at “supracompetitive levels” by creating higher effective spreads (they find that individual market maker quotes were quoted exclusively in even-eighths). In many cases, the market maker has the power to hide orders in a bid to increase the spread for high profits. This research finds these characteristics might arguably impact the empirical analysis as bid ask bounce in such a market would be higher, causing more noise and biased price volatility estimates.
Furthermore extending from Easley et al. (2010), ultra-high frequency tick data is used for estimation rather than high frequency 1 minute time bars. This study uses this data to test whether flow toxicity approximated via the VPIN measure is able to Granger cause intraday realised volatility in the Australian market. The strength of the effect of VPIN on intraday trading factors/characteristics amongst stocks of varying market capitalisation was also investigated. Earlier works by Easley et al. (1996) and Kubota and Takehara (2009) have shown that lower capitalisation stocks tend to have higher PIN. As far as the authors are

AABFJ | Volume 7, no. 2, 2013
6
aware, this paper is first to document if this is the case with Easley et al. (2010)'s VPIN measure and whether the strength of Granger causality is higher to lower capitalisation stocks. This is expected as one would find lower levels of liquidity trading (i.e. a lower trade intensity) in smaller capitalisation stocks, hence increasing the ratio of informed trading.
The remainder of the paper is structured as follows. Sections 2 and 3, illustrate our stock selection process and explain the methodology for handling ultra-high frequency data. Sections 4 & 5 explain the mechanics of the VPIN measure for this analysis. Section 6, presents intraday factors and the contemporaneous relationship between them and VPIN. Results from Granger causality are provided in Section 7, followed by the conclusion.
2. Institutional Detail and Data At the time of writing the Australian Stock Exchange (ASX) is the sole exchange in Australia, therefore it is regarded as a highly unsegmented market unlike that of the US or Europe. The nature of the ASX is a continuous LOB, with no specialist market makers in place. Since 1991, the ASX has been fully automated with the introduction of Stock Exchange Automated Trading System (SEATS). The SEATS implementation allows for continuous matching of orders throughout the normal trading day. Furthermore, it is required to update price indices and disseminate information to data vendors at high frequency. Trading hours are between 10:00am to 4:00pm EST from Monday to Friday excluding public holidays. Opening times for individuals stocks are random and staggered, but it is generally accepted that all stocks are trading by 10:10am. Additionally, it is not uncommon for volume weighted average price (VWAP) trades to occur up to 4:20pm EST.
On 31st March 2000, the S&P/ASX 200 index was introduced as a general institutional capitalisation weighted benchmark consisting of the 200 largest stocks on the ASX. This index is widely used as the underlying asset to the futures contract, SPI200, and also as a benchmarking tool for fund managers to determine tracking error of equity funds. This paper examines 30 stocks from the S&P/ASX 200 index. The three groups were created by ranking stocks in the S&P/ASX 200 universe by their weight in the index. This is used as opposed to taking the pure market capitalisation figure as certain stocks are dual-listed, and may not reflect the stocks actual activity in the ASX. The three groups include stocks ranked 1 to 10 (the largest weights of the index), 96 to 105 and 191 to 200 (the smallest weights in the index).
The microstructure data employed in this paper consists of ultra-high frequency trade-by-trade data sourced from SIRCA/Thomson Reuters Tick History (TRTH) from 1st January 2008 to 31st December 2010 on the 30 listed stocks in Table 1. Each traded price and volume, and quoted bid and ask volume are recorded with a time stamp to the nearest 1/100th of a second for this analysis. This raw data is then cleaned and adjusted, as described in Section 3, prior to analysis.

Wei, Gerace and Frino | Informed Trading, Flow Toxicity
7
Table 1
Stock Groups Below is the list of securities examined for this paper. Stocks from the S&P/ASX 200 universe and Small Ordinaries universe are ranked according to their % weight in the index as at 18th January 2011.
Ticker Name Rank % Weight in the index
Group A
BHP BHP Billiton Ltd 1 13.5366
CBA Commonwealth Bank of Australia 2 7.0513
WBC Westpac Banking Corp 3 5.9334
ANZ Australia & New Zealand Banking Group 4 5.2762
NAB National Australia Bank Ltd 5 4.6435
WES Wesfarmers Ltd 6 3.3439
RIO Rio Tinto Ltd 7 3.3401
WOW Woolworths Ltd 8 3.0147
TLS Telstra Corp Ltd 9 2.8031
NCM Newcrest Mining Ltd 10 2.5555
Group B
DOW Downer EDI Ltd 96 0.1345
AQA Aquila Resources Ltd 97 0.1344
WHC Whitehaven Coal Ltd 98 0.1338
TSE Transfield Services Ltd 99 0.1320
MND Monadelphous Group Ltd 100 0.1315
MGX Mount Gibson Iron Ltd 101 0.1234
IFL IOOF Holdings Ltd 102 0.1233
DUE DUET Group 103 0.1228
FLT Flight Centre Ltd 104 0.1208
PPT Perpetual Ltd 105 0.1205
Group C
OGC OceanaGold Corp 191 0.0325
TRS The Reject Shop Ltd 192 0.0307
MAH Macmahon Holdings Ltd 193 0.0286
AAD Ardent Leisure Group 194 0.0283
PPX PaperlinX Ltd 195 0.0265
CVN Carnarvon Petroleum Ltd 196 0.0265
ROC Roc Oil Co Ltd 197 0.0247
ALS Alesco Corp Ltd 198 0.0226
ELD Elders Ltd 199 0.0193
HST Hastie Group Ltd 200 0.0187

AABFJ | Volume 7, no. 2, 2013
8
3. UHF Data Handling This section is devoted to explain how we have cleaned the data prior to VPIN calculation. Unfortunately, no standard procedures have yet been established for data management at the ultra-high frequency level, hence it is important to provide some detail on the methodology adopted. Unlike Easley et al. (2010) who use 1 minute frequency data for volume bucketing, this study prefers to use raw high frequency tick data which theoretically would capture buy and sell initiated volume imbalances more accurately at a finer granularity.
Several issues are noted with employing raw tick data. First, the structure of the ticks and their behaviour strongly depends on trading rules and the rules of the institutions that collect the data. In many cases, the ticks may contain incorrect records, time-stamped incorrectly, traded outside trading times and exhibit anomalous behaviour possibly due to events such as trading halts, etc. As pointed out by Falkenberry (2002), the higher the trading velocity, the higher the probability that these errors will be committed in reporting the trading information.
For this paper, methodology similar to Brownlees and Gallo (2006) has been chosen for preparing UHF. This has been found to be a simple yet effective measure for removing anomalies.
Let , , , … , be the tick data series of the traded price and , , , … , be the associated volume series for a particular day. Then decide whether to retain or remove a price volume pair , based on the application of a Bollinger band with a 2 standard deviation threshold and a 40 day window. If the condition below holds
| ̅ | 2 ̅ the price volume pair is retained, otherwise it is removed. ̅ and ̅ refer to k-day rolling window price and standard deviations.
The parameter is a multiple of the minimum price variation allowed for the stock analysed, and is used to avoid cases where ̅ 0 produced by a series of k equal prices.
The adjustment of neighbourhood parameter k or alternatively m and is crucial to cleaning the raw tick data and requires adjustment. In this data adjustment of stocks on the ASX, k = 41, =0.0005 ̅ are used to produce the most satisfactory results. In frequently traded stocks, the size of the window k can be set reasonably large, whilst less liquid stocks might require a smaller value. It is also noted that in Brownlees and Gallo's (2006) paper, is a fixed value, rather than a function of average price as has been set here.
As an example, a randomly selected stock, ANZ.AX, that has been cleaned is provided, showing the before and after price series in Figure 1.
Furthermore, prior to conducting analysis, it is necessary for us to adjust the data for any corporate actions. For each stock, the price adjustment is performed by multiplying the stock price by a corporate adjustment factor. This backwards adjustment is trivial. For this study, we have cleaned and adjusted all 30 stocks using the same methodology from the 1st of January to the 31st of December 2010 for use in VPIN estimation.

Wei, Gerace and Frino | Informed Trading, Flow Toxicity
9
Figure 1
Trade by Trade Price Series Example
This displays a sample comparison between dirty and cleaned price tick data for the stock OZL.AX over the period of 2010. This highlights the importance of data handling procedures prior to analysis, as inconsistent methodology could greatly impact results in the microstructure literature. The raw dirty data is obtained from SIRCA. The clean data was post processing using the Brownlees and Gallo (2006) approach.
4. VPIN As mentioned earlier, VPIN - a variant of PIN, is a measure of flow toxicity. This new estimate as described in Easley et al. (2010) measures adverse selection in the market place. Adverse selection occurs when informed traders enter the market and take liquidity from uninformed investors resulting in a transfer of capital. Theoretically at these instances, market makers would increase the bid and ask spread to compensate the occurrence of being “picked off” by an informed investor. Flow toxicity is the case where market makers are providing liquidity at a loss to informed traders.
Clearly flow toxicity is related to new information entering into the market through an increase of informed trading. Therefore VPIN, a measure of this toxicity, is a factor of the price discovery mechanism. This analysis focuses on whether an increase in the probability of informed investors, as derived from VPIN, is predictive of realised volatility in both the intraday and daily space. It is hypothesised that a high VPIN measure would Granger cause larger absolute price movements as flow toxicity is higher and more informed traders have entered that market. It is also hypothesised that smaller capitalisation stocks in the Australian market are more likely to exhibit flow toxicity and higher VPIN, due to higher buy & sell initiated trade imbalance.
First, consider the initial approach raised by Easley et al. (1996). The base model for the original PIN measure is reliant on three independent Poisson processes, ~ ,
~ and ~ , where and represent the uninformed process for buy and sell orders and represents the informed process at one side of the orderbook only (either buy or sell). Clearly for every price sensitive event occurring with probability α, all rational informed investors should react in the same way and enter into the market at the same side of the book. The parameters of the Poisson process are then estimated
AABFJ | Volume 7, no. 2, 2013
10
via maximum likelihood from the observed number of buy and sell orders. As explained in Easley at al. (1996), PIN is expressed as .
VPIN, on the other hand, observes the imbalance of buy and sell initiated trades. It is intuitive that if informed investors are coming into the market with buy orders, then buy initiated trades are going to outweigh any sell initiated trades. This will be further elaborated in Section 4.1 and 4.2 but it is noted that this method is not reliant on maximum likelihood estimates of latent parameters of the Poisson processes. This circumvents some of the problematic aspects of the original PIN measure. For example, most optimisation algorithms to maximise the log-likelihood function generate only local optimum solutions rather than the global optimum. This clearly means estimates on PIN are very reliant and sensitive to user initial value inputs. Furthermore, in many cases, convergence of Poisson parameters may not occur, which directly impacts the accuracy of the estimates. It is noted that in Easley, Hvidkjaer and O'Hara (2002) estimation on NYSE stocks from 1983 to 1998, they found 716 occurrences of non-convergence and 456 corner solutions out of 20,000 runs. Likewise, Brown et al. (2004) had to filter out 14~19% of the sample due to similar reasons.
As discussed in the introduction, VPIN is updated in “stochastic time”, which matches the speed of the information arrival process. This allows for easy implementation in the intraday space. Essentially it focuses on the abnormal difference between buy initiated and sell initiated volume and interprets it as evidence for information-based trading. Quite simply, if the market consisted solely of liquidity providers, the volume of buy and sell orders should be roughly similar, assuming that their arrival rate Poisson process has the same intensity. In cases where there is a large discrepancy between the buy and sell initiated volume, it is suggestive that 'informed' investors have entered into the market. Trades from these people are only coming from one side of the orderbook, causing the high imbalance and increasing order flow toxicity.
In Sections 4.1 and 4.2 a full explanation on the calculation of VPIN5 is provided.
4.1 Volume Bucketing Volume synchronisation in this study is performed by using volume buckets. This is a novel idea, allowing the user to match the frequency with the arrival of the information.
Traditionally, both academics and practitioners alike have used equally spaced time-series data to analyse intraday patterns in market microstructure. Typically, time-weighted time series were calculated using intraday tick data. This converted irregularly spaced trade data into equally time spaced data, which can then be used under a traditional econometric framework. However, time-weighting tick data on traded prices (as performed in many market microstructure pieces) ignores volume traded completely. Volume bucketing, captures not only each traded price but also accounts for the volume associated with the traded price. The authors believe the time and volume of trades is closely associated with the arrival of new information into the market place.
Easley et al. (2010) argue that, unlike with equally spaced time-series, drawing samples on traded price every time the market exchanges a predefined volume level, the arrival and importance of market news would be captured in the new series. From an intuitive perspective, if the traded price p(t) has twice as much volume as traded price p(t-1) then it is reasonable to draw p(t) twice as it contains more information.
5 The authors wish note that the VPIN calculations set here may not fully reflect the exact process used by Easley et al. (2010) and Tudor Investment Corporation in its entirety. The steps explained in this paper are purely based on the Appendix A.1.1. and A.1.2. of Easley et al. (2010).

Wei, Gerace and Frino | Informed Trading, Flow Toxicity
11
Let , , , … , be the tick data series of the traded price and , , , … , be the associated volume series.
1. Let the initial value of the volume bucketed sequence to be 2. Let the next bucketed observation be , where k is defined as below,
k argmin t: v V
Set V as the predefined volume level for each bucket. 3. Similarly, calculate the other bucket , , …
Theoretically, volume bucketing is a subset of a more generalised approach of time deformation via subordinators, raised by Clark (1973) and Ane and Geman (2000). In Feng et al. (2008), a time deformation model is beautifully expressed as
Log P X g t where the parent process X(.) is considered Guassian N μg t , σ g t and g(.) is the
subordinator or directing process. For volume bucketing as raised by Easley et al. (2010), the directing process is defined implicitly as accumulated traded volume. Subordination via volume bucketing reduces the impact of volatility clustering in the sample and reduces heteroskedasticity and results are most distributionally closer to the Guassian. Volume bucketing allows another non-trivial dimension to be added to the analysis as this is not concerned solely on the traded price, but also put the volume traded at that price into consideration.
4.2 VPIN Calculation Fundamentally VPIN is a measure on the volume imbalance between sell initiated trades and buy initiated trades. In order to determine the magnitude of this imbalance a method is needed to determine which trades are sell and which trades are buy initiated. Therefore trade classification is critical in the process of estimating an accurate VPIN. In this paper, a standard approach called the tick test is first discussed and then applied to VPIN.
In the tick test methodology, a transaction is classified as buy, if the current traded price is higher than the previous traded price. Similarly, transactions are classified as sell initiated if the current traded price is lower than the previous traded price. In cases where the transaction price is the same as the previous traded price, then the previous classification is rolled forward. Lee and Ready (1991) state that 92.1% of all buys at the ask and 90.0% of all sells at the bid are correctly classified by this straightforward procedure.
The steps for estimation of VPIN are provided below. 1. Let the time ascending , , , … , be the tick data series of the traded price and
, , , … , be the associated volume series. For ease of calculation, sometimes it is reasonable to replace tick data with high frequency intraday data. Let V be the volume size for volume bucketing and L be the sample of volume
buckets used in the VPIN estimation. Easley et al. (2010) use L = 50. This paper uses L = 5 as it is interested in the short term intraday effects of flow toxicity and informed trading, a larger L would be lagging and less reactive to dynamic changes in intraday trading. Here V is determined as the number of ticks in the series divided by the product of the number of days by 72 (the number of 5 minute intervals in a trading day in Australia is 72). Increasing the size of V reduces the granularity of volume imbalances |v v |. The reduction of granularity would theoretically result in a overall lower VPIN estimate. The authors acknowledge as up to now, there has been no research done on the optimisation of these parameters.

AABFJ | Volume 7, no. 2, 2013
12
2. Expand , , , … , by repeating each price observation a number of times as governed by its respective volume observation , , , … , .
3. Let ∑ be the total number of observations in the expanded series 4. Re-index the new series as where 1,… , 5. Set the bucket counter at one, 1. 6. Do while . This ensures there are sufficient observations for the next volume
bucket. 7. For all cases where ∈ 1 1, , classify the transactions into buy initiated
and sell initiated. This can be approached using the Lee and Ready algorithm, which is common in the literature.
8. For each volume bucket, record to be the number of observations classified as buy initiated and to be the number of observations classified as sell initiated. Note that the sum should equal V for each volume bucket.
9. 1 10. Loop
Now that a series of v and v , has been constructed, it is possible to calculate VPIN, which is based upon the volume imbalance in each bucket. As described in Easley et al. (2010), it is calculated as,
VPIN∑ |v v |
LV
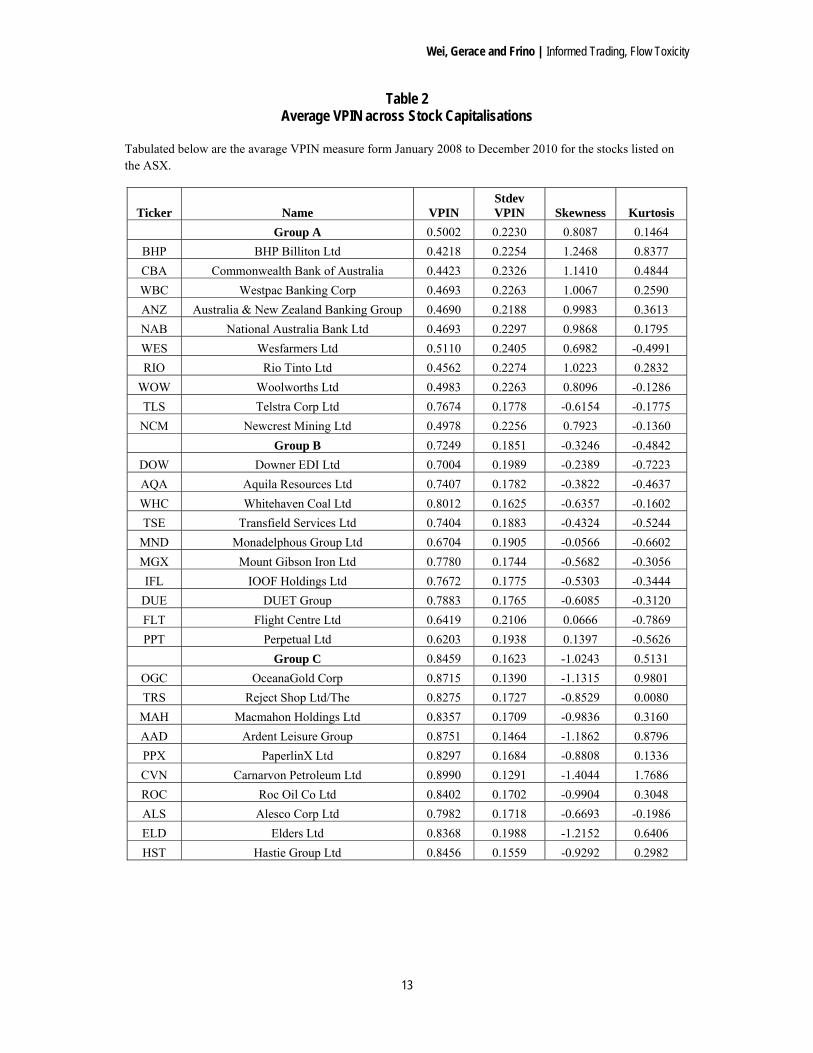
5 VPIN Results Table 2 presents the summary of results for average VPIN over the period of a year. There is strong evidence showing that high VPIN is associated with less liquid and smaller capitalisation stocks whilst low VPIN is generally associated with larger capitalisations and higher liquidity. In the Group A stocks, the average VPIN over 2008 to 2010 is 0.500, compared to Group B stocks' VPIN of 0.725 and the bottom 10 Group C stock's 0.846. This is sensible and consistent with research performed on traditional PIN metrics. Fundamentally, it would be expected that order flow toxicity be higher for less liquid stocks, and the probability of informed trading to be higher as a percentage of total trading in smaller capitalisations. Clearly stocks such as BHP (BHP Billiton Ltd) and RIO (Rio Tinto Ltd) on the ASX attract more liquidity investors than stocks such as ELD (Elders Ltd), and this is well reflected by the VPIN - showing a reading of 0.422 and 0.456 for these large caps and 0.837 for ELD.
Furthermore, the research finds that the intraday time-varying VPIN series exhibits different distributional characteristics across capitalisation groups. For example, the second moment of the VPIN is higher with the top 10 Australian stocks (22.3%) than the bottom 10 stocks in the ASX 200 index (16.2%). It is also noted that large capitalisations have a more positive skew (0.809) than smaller capitalisations that tend to exhibit a slight negative skew (-1.024). These stylised characteristics for VPIN is clearly illustrated in Table [2]. The positive skew in VPIN distribution for large caps such as BHP is due to a small collection of extremely high VPIN readings, much higher than its relatively lower mean. On the other hand, order flow toxicity and high VPIN readings are significantly more persistent and concentrated in smaller capitalisation stocks such as ELD which is reflected in a high mean of 0.837 and a negative skew of -1.215. Furthermore, it is noted that the VPIN distribution is truncated on the right, as the VPIN metric cannot exceed 1. Naturally there is a negative skew in this case, but negligible signs of fat tails or kurtosis in these distributions.
Wei, Gerace and Frino | Informed Trading, Flow Toxicity
13
Table 2 Average VPIN across Stock Capitalisations
Tabulated below are the avarage VPIN measure form January 2008 to December 2010 for the stocks listed on the ASX.
Ticker Name VPIN Stdev VPIN Skewness Kurtosis
Group A 0.5002 0.2230 0.8087 0.1464
BHP BHP Billiton Ltd 0.4218 0.2254 1.2468 0.8377
CBA Commonwealth Bank of Australia 0.4423 0.2326 1.1410 0.4844
WBC Westpac Banking Corp 0.4693 0.2263 1.0067 0.2590
ANZ Australia & New Zealand Banking Group 0.4690 0.2188 0.9983 0.3613
NAB National Australia Bank Ltd 0.4693 0.2297 0.9868 0.1795
WES Wesfarmers Ltd 0.5110 0.2405 0.6982 -0.4991
RIO Rio Tinto Ltd 0.4562 0.2274 1.0223 0.2832
WOW Woolworths Ltd 0.4983 0.2263 0.8096 -0.1286
TLS Telstra Corp Ltd 0.7674 0.1778 -0.6154 -0.1775
NCM Newcrest Mining Ltd 0.4978 0.2256 0.7923 -0.1360
Group B 0.7249 0.1851 -0.3246 -0.4842
DOW Downer EDI Ltd 0.7004 0.1989 -0.2389 -0.7223
AQA Aquila Resources Ltd 0.7407 0.1782 -0.3822 -0.4637
WHC Whitehaven Coal Ltd 0.8012 0.1625 -0.6357 -0.1602
TSE Transfield Services Ltd 0.7404 0.1883 -0.4324 -0.5244
MND Monadelphous Group Ltd 0.6704 0.1905 -0.0566 -0.6602
MGX Mount Gibson Iron Ltd 0.7780 0.1744 -0.5682 -0.3056
IFL IOOF Holdings Ltd 0.7672 0.1775 -0.5303 -0.3444
DUE DUET Group 0.7883 0.1765 -0.6085 -0.3120
FLT Flight Centre Ltd 0.6419 0.2106 0.0666 -0.7869
PPT Perpetual Ltd 0.6203 0.1938 0.1397 -0.5626
Group C 0.8459 0.1623 -1.0243 0.5131
OGC OceanaGold Corp 0.8715 0.1390 -1.1315 0.9801
TRS Reject Shop Ltd/The 0.8275 0.1727 -0.8529 0.0080
MAH Macmahon Holdings Ltd 0.8357 0.1709 -0.9836 0.3160
AAD Ardent Leisure Group 0.8751 0.1464 -1.1862 0.8796
PPX PaperlinX Ltd 0.8297 0.1684 -0.8808 0.1336
CVN Carnarvon Petroleum Ltd 0.8990 0.1291 -1.4044 1.7686
ROC Roc Oil Co Ltd 0.8402 0.1702 -0.9904 0.3048
ALS Alesco Corp Ltd 0.7982 0.1718 -0.6693 -0.1986
ELD Elders Ltd 0.8368 0.1988 -1.2152 0.6406
HST Hastie Group Ltd 0.8456 0.1559 -0.9292 0.2982

AABFJ | Volume 7, no. 2, 2013
14
6 Contemporaneous Relationships with Intraday Trading Factors Prior to testing the effect of VPIN on intraday trading factors, the trading factors are first defined (in Section 6.1) and the contemporaneous relationship between them and flow toxicity is determined as measured by VPIN (in Section 6.2). 6.1 Intraday Factors In particular, this study has concentrated on three intraday measures which we describe below:
1. Quote Imbalance |v v |v v
Where is a particular volume bucket index. v and v refer to the quote inflow of bids and asks in a particular volume bucket. Quote imbalance as defined here is a ratio between zero and one of the difference of incoming quotes volume over total quotes volumes. 2. Price Volatility
| | Price volatility of a particular volume bucket is proxied to be the absolute return of that period. 3. Duration
Duration refers to the time it takes for one volume bucket to fill. For the first and last volume buckets of the day, we replace with 10:00am and with 5:00pm respectively. Obviously, when trading is thin and volumes low, we expect to be large, and in periods when trade volume is high and or trade frequency is high, is small.
6.2 Contemporaneous Relationship The contemporaneous relationship between VPIN and the intraday factors listed in Section 6.1 is examined in Table 3. This is conducted under a linear regression framework,
where this study is interested in documenting how intraday factors, quote imbalance, price volatility and duration, relate to the VPIN metric during the same volume bucket.
From Table 3, it can be seen that all factors are significant at the 5% level, suggesting that contemporaneous relationship between intraday trading proxies and flow toxicity exists at a statistically significant level. Firstly, a positive relationship is documented between quote imbalance and VPIN for Group B and Group C stocks. In lower capitalisation stocks, a significant positive coefficient suggests that in periods of high flow toxicity and adverse selection, the incoming quotes are more likely to be imbalanced. In short, a positive correlation between volume imbalance and quote imbalance is suggestive that in volume buckets where there is a high imbalance between buy and sell initiated trades (as the VPIN metric is essentially an average of this over pre-determined number of volume buckets), there is also high imbalance in the volume of bid quotes and ask quotes. From intuition, it is not surprising that market participants are likely to change their quotes/orders in accordance to higher levels of adverse selection as proxied by VPIN. The positive relationship between

Wei, Gerace and Frino | Informed Trading, Flow Toxicity
15
quote imbalance and VPIN for small capitalisations documents the behaviour of market participants in an environment where orders can easily be 'picked off' by informed investors.
Interestingly for large capitalisation stocks in Group A, a negative coefficient for is noted. This suggests that periods where the probability of informed trading is high do not directly relate to higher quote imbalance. In fact the negative sign implies more balanced inflow of orders from either side of the book. It can therefore be argued that liquidity for the top ten stocks in Australia are significantly high in general so that even in periods where informed trading is high, this does not directly affect quote imbalance.
These findings for price volatility suggest that for higher capitalisation/more liquid stocks, there is a positive relationship between price volatility and VPIN, whilst the opposite is true for smaller capitalisation/less liquid stocks on the ASX. The negative relationship between VPIN and price volatility is attributed to the lack of liquidity in the market at periods where flow toxicity is high. It is plausible that within an interval where VPIN is high, the bid ask spread is reasonably wide as liquidity traders try to avoid from being “picked off” by the informed investors and hence result in very little change movements within a particular volume bucket. It also may be due to the fact that the volume buckets for small capitalisation stocks are “too fine”, and hence several consecutive large trades at the same price would take up several volume buckets and record no price change and hence zero price volatility. These occurrences are, however, less likely for large capitalisations. With large capitalisations, a very strong positive relationship is documented within each volume bucket. This means that in volume buckets where there is high buy-sell trade initiated imbalance also corresponds to larger price movements. As informed investors are coming into the market at one side of the orderbook, they clearly are likely to drive the traded price level up or down in one direction.
Lastly, a strong negative contemporaneous effect of duration on VPIN is noted, consistent across all stock groups. This study documents that the effect is more pronounced for larger capitalisation stocks / more liquid stocks than smaller capitalisation / less liquid stocks. It is not surprising that the shorter volume buckets (implying higher trade frequency) correspond to higher VPIN readings and vice versa. Periods where there are high levels of informed investors entering in the market also infer greater levels of trading in general, which reduces duration. It is reasoned that when the duration of a volume bucket is low, it is suggestive that large individual trades have been made - this would clearly reduce the time it takes to hit the volume threshold for a bucket, as defined by V. Hence, low duration corresponds to higher VPIN. It is also clear that during these periods liquidity providers are trading at a loss.
Therefore, in conclusion a positive contemporaneous relationship between VPIN and quote imbalance is noted for smaller capitalisations and a negative relationship for larger capitalisations; a negative relationship between VPIN and duration, and mixed results for price volatility where large capitalisations exhibit a larger positive relationship and small capitalisations exhibit a negative relationship.

AABFJ | Volume 7, no. 2, 2013
16
Table 3 Contemporaneous Relationship Between Intraday VPIN and Volume Synchronised Intraday Factors
This Table shows results of testing the contemporaneous relationship between VPIN and volume synchronised intraday factors: quote imbalance, price volatility and duration. Below we report the coefficients and significance from our multivariate regression. ** denotes significance at the 5% level.
Quote Imbalance Price Volatility Duration Group
A a b1 T-stat b2 T-stat b3 T-stat R^2
BHP 0.4915 -0.0608 -19.13 ** 8.3267 29.57 ** -25.7476 -88.27 ** 9.3%
CBA 0.5380 -0.1106 -33.86 ** 8.0272 25.84 ** -29.5452 -93.21 ** 11.2%
WBC 0.5538 -0.1157 -35.41 ** 9.6199 29.00 ** -25.4436 -82.09 ** 9.3%
ANZ 0.4512 0.1558 52.10 ** 6.1918 21.32 ** -17.6303 -73.15 ** 10.0%
NAB 0.5491 -0.0980 -29.61 ** 8.0943 27.40 ** -25.1385 -86.77 ** 9.6%
WES 0.5854 -0.0207 -6.45 ** 6.9782 18.74 ** -28.0311 -93.53 ** 10.7%
RIO 0.5204 -0.0602 -20.19 ** 7.5969 35.78 ** -22.6357 -84.96 ** 8.9%
WOW 0.5838 -0.0903 -28.62 ** 9.5589 20.22 ** -25.9111 -86.58 ** 9.5%
TLS 0.8070 0.0083 3.87 ** -3.4791 -11.55 ** -14.7070 -92.83 ** 11.0%
NCM 0.5766 -0.0951 -30.78 ** 6.5695 26.34 ** -22.9954 -87.33 ** 9.9% Group
B a b1 T-stat b2 T-stat b3 T-stat R^2
DOW 0.7375 0.0356 13.70 ** -2.7008 -12.26 ** -16.1157 -83.36 ** 10.0%
AQA 0.7426 0.0390 17.06 ** 0.4395 3.07 ** -6.7278 -49.00 ** 4.2%
WHC 0.7951 0.0373 17.50 ** -0.1780 -1.25 -3.1888 -31.14 ** 2.3%
TSE 0.7704 0.0166 6.85 ** -1.0029 -6.04 ** -12.2342 -66.88 ** 6.5%
MND 0.6940 0.0214 8.91 ** 2.8541 12.59 ** -13.4683 -65.62 ** 6.0%
MGX 0.7947 0.0363 16.53 ** 0.1213 1.05 -11.4208 -68.54 ** 6.9%
IFL 0.7800 0.0279 12.20 ** -1.0747 -6.73 ** -7.1726 -59.67 ** 6.7%
DUE 0.8183 0.0263 11.51 ** -5.2416 -25.38 ** -9.6100 -61.94 ** 7.7%
FLT 0.6499 0.0806 30.43 ** 4.0633 18.39 ** -17.4273 -78.03 ** 9.7%
PPT 0.6448 0.0076 3.06 ** 4.2982 21.11 ** -12.6999 -61.71 ** 5.2% Group
C a b1 T-stat b2 T-stat b3 T-stat R^2
OGC 0.8589 0.0372 18.44 ** 0.3254 3.80 ** -1.7024 -22.06 ** 1.9%
TRS 0.7986 0.0701 28.97 ** 0.6594 2.51 ** -2.1051 -20.44 ** 2.9%
MAH 0.8508 0.0312 14.31 ** -2.2831 -21.50 ** -6.5762 -50.60 ** 5.8%
AAD 0.8927 0.0212 6.87 ** -4.6145 -15.32 ** -4.3203 -31.81 ** 6.7%
PPX 0.8394 0.0307 13.32 ** -2.0341 -18.53 ** -4.4670 -37.17 ** 3.8%
CVN 0.9131 0.0105 6.10 ** -3.1032 -33.84 ** -2.1687 -25.88 ** 4.2%
ROC 0.8619 0.0330 14.86 ** -3.1775 -26.97 ** -7.0087 -56.07 ** 8.1%
ALS 0.8118 0.0299 13.49 ** -1.1958 -7.91 ** -7.3733 -54.59 ** 5.4%
ELD 0.8566 0.0710 24.95 ** -2.4790 -27.50 ** -7.3737 -101.60 ** 8.9%
HST 0.9381 -0.0740 -32.13 ** -3.8548 -24.42 ** -4.6251 -44.29 ** 7.2%

Wei, Gerace and Frino | Informed Trading, Flow Toxicity
17
7. Granger Causality Tests This section addresses the question stated in the Introduction -i.e. is there causality between VPIN, a measure of order flow toxicity, and intraday realised volatility in the equity market?
Table 4 Unit Root Tests via Augmented Dickey Fuller for VPIN and Intraday Factors
Data is tested for stationarity by testing for unit roots on the different sets of time series presented below prior to conducting Granger causality. This is because the vector autoregressions we use for Granger causality assumes that our variables be stationary. The approach conducted here is the augmented Dickey Fuller (1979) test. The number of lags used in the regression is dependent on the length of the series T and is determined as n = (T-1)^{1/3}. We note that VPIN and all three intraday factors are stationary as we reject the null hypothesis of non-stationarity.
VPIN QI Return Duration Group A Lag T-stat p-value T-stat p-value T-stat p-value T-stat p-value
BHP 43 -45.972 <0.01 -36.461 <0.01 -44.365 <0.01 -37.568 <0.01 CBA 43 -47.257 <0.01 -35.002 <0.01 -45.042 <0.01 -36.306 <0.01 WBC 43 -48.036 <0.01 -37.927 <0.01 -42.848 <0.01 -35.26 <0.01 ANZ 43 -44.975 <0.01 -36.999 <0.01 -43.666 <0.01 -36.164 <0.01 NAB 43 -46.059 <0.01 -36.589 <0.01 -43.6 <0.01 -33.972 <0.01 WES 41 -39.502 <0.01 -35.037 <0.01 -42.338 <0.01 -31.239 <0.01 RIO 43 -44.874 <0.01 -34.88 <0.01 -43.764 <0.01 -29.975 <0.01
WOW 42 -44.707 <0.01 -35.512 <0.01 -44.728 <0.01 -32.153 <0.01 TLS 42 -33.16 <0.01 -35.392 <0.01 -42.442 <0.01 -33.067 <0.01
NCM 42 -42.125 <0.01 -37.507 <0.01 -43.202 <0.01 -32.871 <0.01
Group B Lag T-stat p-value T-stat p-value T-stat p-value T-stat p-value DOW 41 -27.113 <0.01 -31.599 <0.01 -42.928 <0.01 -25.571 <0.01 AQA 40 -28.351 <0.01 -32.143 <0.01 -39.822 <0.01 -21.46 <0.01 WHC 39 -29.094 <0.01 -30.751 <0.01 -39.409 <0.01 -20.183 <0.01 TSE 41 27.748 <0.01 -32.752 <0.01 -41.672 <0.01 -23.756 <0.01
MND 41 -28.889 <0.01 -32.58 <0.01 -43.12 <0.01 -28.117 <0.01 MGX 41 -24.292 <0.01 -29.646 <0.01 -41.704 <0.01 -25.941 <0.01 IFL 39 -25.963 <0.01 -31.771 <0.01 -42.772 <0.01 -16.637 <0.01
DUE 39 -28.391 <0.01 -32.633 <0.01 -41.924 <0.01 -27.777 <0.01FLT 41 -27.31 <0.01 -31.154 <0.01 -42.832 <0.01 -28.242 <0.01 PPT 41 -33.225 <0.01 -33.345 <0.01 -43.635 <0.01 -25.188 <0.01
Group C Lag T-stat p-value T-stat p-value T-stat p-value T-stat p-value
OGC 35 -24.085 <0.01 -28.748 <0.01 -36.135 <0.01 -19.453 <0.01 TRS 35 -23.301 <0.01 -27.128 <0.01 -36.864 <0.01 -24.941 <0.01
MAH 39 -24.945 <0.01 -31.902 <0.01 -39.735 <0.01 -22.697 <0.01 AAD 27 -19.635 <0.01 -22.999 <0.01 -29.384 <0.01 -20.766 <0.01 PPX 38 -26.059 <0.01 -30.407 <0.01 -38.035 <0.01 -25.446 <0.01 CVN 36 -27.229 <0.01 -32.893 <0.01 -37.805 <0.01 -21.063 <0.01ROC 37 -23.928 <0.01 -32.364 <0.01 -38.072 <0.01 -22.006 <0.01 ALS 39 -24.73 <0.01 -31.126 <0.01 -39.795 <0.01 -24.172 <0.01 ELD 32 -13.476 <0.01 -23.443 <0.01 -31.774 <0.01 -11.124 <0.01 HST 38 -25.714 <0.01 -35.971 <0.01 -39.326 <0.01 -22.313 <0.01
In Easley et al. (2010), Granger causality of the VPIN metric on volatility is discussed. They state that the purpose of VPIN is not that of a leading indicator to forecast intraday volatility. However, they hypothesise that effects in volatility may be a result of rising flow toxicity. For example, they argue that a withdrawal of high frequency liquidity providers, which would increase VPIN/flow toxicity, is likely to be a contributing factor to
AABFJ | Volume 7, no. 2, 2013
18
greater intraday realised volatility. Flash crashes are usually blamed on this decrease in liquidity and increase in flow toxicity. Unfortunately, the dynamics of VPIN and volatility were measured in a VAR(1) specification without lag justification. This paper extends upon Easley et al. (2010), to look specifically at the individual stock level and to use a more robust Granger causality test.
Prior to any VAR specification, all the VPIN series generated in Section 5 were tested for unit roots. After performing Augmented Dickey Fuller tests on the level series, this study rejects the hypothesis that there are any unit roots, i.e. all the generated VPIN series are stationary. This is presented in Table 4.
Similarly, the proxy for price volatility, | |, is also a stationary process. Below the equation used to test Granger causality for the bivariate case is stated.
As discussed in Thornton and Batten (1984), initial lag selection for p, q, r and s, has
a significant impact on the result of Granger causality tests. They argue that arbitrary lag selection, which is still common in the literature, can produce very misleading results. Hence, the lag selection is based on the Hsiao-Kang methodology which employs flexible lag lengths optimised using a model selection criterion6.
In particular, this study focuses on equation (2) which is used to test VPIN → Y. This would suggest flow toxicity is a leading indicator to absolute intraday price changes or realised volatility. However, equally important is the need to determine if there exists a feedback loop VPIN ↔ Y, the opposite effect Y → VPIN or nothing at all.
The methodology for lag selection for p and q is outlined below. Similarly, this is applied for r and s.
1. Test ∑ for varying lags of p to find the best lag selection for the univariate autoregression. The lag selection process is governed by the minimisation of the Schwarz Bayesian Information Criterion (SBIC) as defined below.
log /
where l is the value of the log likelihood function, T is the sample size and k is the number of parameters estimated, which in this case is p+1. Call the optimised information criterion . 2. Next introduce lags of VPIN over the SBIC optimised model for T, and once
again minimise the new SBIC for ∑ ∑, but by only varying q, as p has already been determined in step 1. Let the new
SBIC be . 3. Clearly if only the bivariate SBIC is less than the univariate SBIC, then there are
grounds for Granger causality to exist. Hence, . As discussed in Atukeren (2005) the question arises as to how confidently it can be
suggested that causality exists when the condition is met. Conventionally, F-tests, likelihood ratios or Walds tests for joint significance testing are applied. However, the
6 Hsiao (1979) and Kang's (1989) flexible lag lengths approach relaxes the original Granger (1969) specification where p=q.
Wei, Gerace and Frino | Informed Trading, Flow Toxicity
19
application of classical statistical significance testing with the use of a Bayesian cost function for lag selection is conceptually problematic. Therefore, in order to consistently apply SBIC throughout Granger causality testing, Atukeren (2005) suggests the employment of the framework by Poskitt and Tremayne (1987). This framework originates from Jefferys’ (1961) concept of ‘grades of evidence’, which questions the uniqueness of the best model.
4. A posterior odds ratio test (Poskitt and Tremayne, 1987) is performed to decide if there is strong evidence in favour of the full model specification.
exp 0.5 ∗ | | if R > 100, there is strong evidence in favour of Granger causality, otherwise there may be competing models where Granger causality does not exist, and the result lacks “decisiveness” as quoted from Jeffreys (1961). However, if the full model was a better fit which minimised the SBIC further than the restricted model, but the difference in magnitude was small enough so that the ratio R < 100, then in these cases the restricted model cannot be completely disregarded, and it is documented that causality is weak. More specifically, Atukeren (2005) points to the case where 10 < R < 100 where the restricted model is still discarded as non-competing, however not unconditionally as in the case where R > 100. In cases where R is less than or equal to 10, there is no substantial evidence supporting Granger causality.
Likewise in cases where a posterior odds ratio test can be used to test if there is strong evidence in favour of no causality under the same logic.
7.1 Results on Quote Imbalance Table 5 documents the two-way Granger causality using a VAR framework as discussed in Section 7. The optimised lag parameters p and q and their respective SBIC are presented. Cases where the condition is met are tabulated. Significance is tested using a posterior odds ration test R, which takes into account the difference between the SBIC of the full and restricted models. A clear case of two way Granger causality is documented between VPIN and quote imbalance for most of the thirty stocks examined. However, for some stocks it is noted that, whilst the full model was a better fit which minimised the SBIC further than the restricted model, the difference in magnitude was small enough so that the ratio R < 100. These include TSE at 24.5, CVN at 1.06 and HST at 10.5, of which Granger causality from VPIN to quote imbalance is still weakly apparent in TSE and HST.
For large capitalisation stocks in Group A and mid-capitalisation stocks in Group B, a feedback two way system is clearly present, where both VPIN and quote imbalance Granger cause each other. This makes intuitive sense, as high levels of flow toxicity and increased adverse selection risk in the market are likely to affect the behaviour of new investors entering quotes into the orderbook. It is realistic to find that market participants will continue to enter into the same side of the book, afraid of being adversely picked off, as the market adjusts to the new equilibrium price. Furthermore, it is also of no surprise that quote imbalance Granger causes VPIN, which is calculated through volume trade imbalance between the buy initiated and the sell initiated transactions. As an example, short term momentum investors are also likely to cause further quote imbalance in volume synchronised periods shortly after a high directional trading - i.e. strong imbalance between buy initiated trades and sell initiated trades. Whilst not presented in Table 5 below, it is noted that the coefficients of the VPIN lags are largely positive.

AABFJ | Volume 7, no. 2, 2013
20
Table 5 Granger Causality between VPIN and Quote Imbalance
7.2 Results on Price Volatility Table 6 documents causality between VPIN and price volatility. Whilst not entirely obvious for Group C stocks, it can be seen that Granger causality from VPIN to price volatility exists for most of the larger capitalisations with R >100 in most instances. This suggests that VPIN does add predictive power to price volatility as discussed in Easley et al. (2010). This study notes that in several Group C stocks, the Schwarz Bayesian Information Criterion is higher for the full model than the restricted model, which suggests adding lagged terms of VPIN did not enhance the regression. This most possibly is due to the construction of volume buckets for VPIN, which might have been too fine for small capitalisation stocks causing the returns in many of these buckets to be too small. It is noted this as a drawback with the VPIN construction methodology where there has so far been no method of optimising the size of the volume bucket V.
Granger causality from price volatility to VPIN is clearly evident, suggesting that for many stocks in this sample, there is a feedback effect between both variables. Large movements in price are likely to predict future flow toxicity suggesting that the volume imbalance between buy initiated and sell initiated, as modelled in VPIN, after price shocks are likely to be continued. Since VPIN is a proxy of the probability of informed investors, it
Group A T p SBIC(0) q SBIC(1) Causality? R p SBIC(0) q SBIC(1) Causality? R
BHP 84,765 10 -0.1469 8 -0.1521 yes >100 27 -2.5426 13 -2.5478 yes >100
CBA 80,317 13 -0.1413 8 -0.1484 yes >100 23 -2.3746 13 -2.3829 yes >100
WBC 79,569 10 -0.1510 8 -0.1580 yes >100 22 -2.2892 13 -2.2975 yes >100
ANZ 82,034 29 -0.3955 6 -0.4051 yes >100 27 -2.3713 7 -2.3740 yes >100
NAB 79,779 10 -0.1552 8 -0.1603 yes >100 22 -2.3290 17 -2.3367 yes >100
WES 73,139 10 0.0484 10 0.0468 yes >100 17 -2.0925 12 -2.0954 yes >100
RIO 82,846 10 -0.0013 8 -0.0051 yes >100 22 -2.3182 14 -2.3232 yes >100
WOW 77,107 9 -0.0692 8 -0.0743 yes >100 17 -2.1678 14 -2.1728 yes >100
TLS 76,991 10 0.2233 7 0.2229 yes >100 22 -2.3022 7 -2.3023 yes >100
NCM 78,216 9 -0.0582 8 -0.0636 yes >100 22 -2.2051 13 -2.2095 yes >100
Group B T p SBIC(0) q SBIC(1) Causality? R p SBIC(0) q SBIC(1) Causality? R
DOW 71,390 14 0.1427 8 0.1421 yes >100 31 -2.1152 7 -2.1158 yes >100
AQA 66,038 13 0.3314 3 0.3306 yes >100 21 -2.1416 7 -2.1423 yes >100
WHC 62,668 29 0.3544 5 0.3542 yes >100 21 -2.2384 7 -2.2390 yes >100
TSE 69,167 15 0.2402 2 0.2401 yes 24.5 30 -2.1652 7 -2.1658 yes >100
MND 70,785 19 0.2797 8 0.2785 yes >100 26 -2.0955 8 -2.0973 yes >100
MGX 71,216 23 0.2657 8 0.2636 yes >100 35 -2.2499 8 -2.2501 yes >100
IFL 63,802 20 0.3240 7 0.3237 yes >100 26 -2.1604 8 -2.1610 yes >100
DUE 62,568 10 0.3270 3 0.3261 yes >100 16 -2.1891 7 -2.1899 yes >100
FLT 71,310 21 0.2221 6 0.2191 yes >100 26 -2.1177 8 -2.1217 yes >100
PPT 71,441 16 0.2562 14 0.2548 yes >100 21 -2.0882 13 -2.0898 yes >100
Group C T p SBIC(0) q SBIC(1) Causality? R p SBIC(0) q SBIC(1) Causality? R
OGC 44,871 12 0.5221 1 0.5211 yes >100 16 -2.4506 3 -2.4505 no 8.65
TRS 46,479 16 0.5050 14 0.5020 yes >100 21 -2.3564 7 -2.3587 yes >100
MAH 59,384 14 0.4324 2 0.4307 yes >100 28 -2.3246 1 -2.3245 no >100
AAD 21,153 6 0.4398 2 0.4384 yes >100 11 -2.4672 3 -2.4680 yes >100
PPX 55,283 11 0.3834 3 0.3821 yes >100 20 -2.3125 7 -2.3133 yes >100
CVN 49,249 8 0.5690 1 0.5690 - 1.06 18 -2.5847 1 -2.5846 no 17.9
ROC 54,302 6 0.4509 6 0.4475 yes >100 40 -2.3429 1 -2.3427 no >100
ALS 60,470 11 0.4087 2 0.4078 yes >100 25 -2.2394 3 -2.2398 yes >100
ELD 34,516 25 0.4666 7 0.4583 yes >100 38 -2.4737 1 -2.4738 yes 7.93
HST 55,575 3 0.0569 2 0.0568 yes 10.5 21 -2.3735 1 -2.3790 yes >100
VPIN -> Quote Imbalance Quote Imbalance -> VPIN

Wei, Gerace and Frino | Informed Trading, Flow Toxicity
21
is realised that the rate of informed investors entering into the market and price discovery are not instantaneous, as whilst VPIN Granger causes price volatility, the reverse is also true.
Table 6
Granger Causality between VPIN and Absolute Price Change
7.3 Results on Volume Bucket Duration Table 7 documents Granger causality between VPIN and the duration of each volume bucket. In Group A and Group B stocks, it is noted that feedback Ganger causality exists. This suggests that VPIN can be used to predict future magnitude in duration and vice versa. Interestingly for small capitalisation stocks in Group C, whilst duration Granger causes VPIN for all stocks, only 4 stocks exhibited VPIN Granger causing duration. Poskitt and Tremayne's (1987) posterior odds ratio is higher for the case where duration → VPIN than VPIN → duration, suggesting that duration may be a better indicator for predicting VPIN than vice versa.
Group A T p SBIC(0) q SBIC(1) Causality? R p SBIC(0) q SBIC(1) Causality? R
BHP 84,765 36 -9.0632 3 -9.0748 yes >100 27 -2.5426 10 -2.5427 yes >100
CBA 80,317 22 -9.1790 3 -9.1867 yes >100 23 -2.3746 10 -2.3752 yes >100
WBC 79,569 25 -9.2921 3 -9.2999 yes >100 22 -2.2892 10 -2.2915 yes >100
ANZ 82,034 30 -9.1789 4 -9.1889 yes >100 27 -2.3713 5 -2.3727 yes >100
NAB 79,779 33 -9.0457 3 -9.0528 yes >100 22 -2.3290 10 -2.3302 yes >100
WES 73,139 28 -9.3384 3 -9.3448 yes >100 17 -2.0925 10 -2.0940 yes >100
RIO 82,846 19 -8.4204 3 -8.4283 yes >100 22 -2.3182 4 -2.3187 yes >100
WOW 77,107 40 -10.0047 5 -10.0124 yes >100 17 -2.1678 10 -2.1689 yes >100
TLS 76,991 6 -9.5608 2 -9.5622 yes >100 22 -2.3022 1 -2.3025 yes >100
NCM 78,216 35 -8.7464 2 -8.7535 yes >100 22 -2.2051 10 -2.2062 yes >100
Group B T p SBIC(0) q SBIC(1) Causality? R p SBIC(0) q SBIC(1) Causality? R
DOW 71,390 40 -8.7286 1 -8.7295 yes >100 31 -2.1152 10 -2.1229 yes >100
AQA 66,038 40 -7.9675 1 -7.9683 yes >100 21 -2.1416 3 -2.1427 yes >100
WHC 62,668 33 -8.0464 1 -8.0465 yes 18.3 21 -2.2384 3 -2.2386 yes >100
TSE 69,167 35 -8.1295 1 -8.1296 - 1.64 30 -2.1652 8 -2.1672 yes >100
MND 70,785 39 -8.8168 1 -8.8188 yes >100 26 -2.0955 5 -2.0972 yes >100
MGX 71,216 36 -7.6140 1 -7.6146 yes >100 35 -2.2499 1 -2.2499 yes 16.7
IFL 63,802 39 -8.2168 1 -8.2171 yes >100 26 -2.1604 4 -2.1627 yes >100
DUE 62,568 40 -8.6736 1 -8.6735 no 31.2 16 -2.1891 8 -2.1967 yes >100
FLT 71,310 20 -8.5894 1 -8.5920 yes >100 26 -2.1177 5 -2.1211 yes >100
PPT 71,441 38 -8.5230 1 -8.5258 yes >100 21 -2.0882 5 -2.0889 yes >100
Group C T p SBIC(0) q SBIC(1) Causality? R p SBIC(0) q SBIC(1) Causality? R
OGC 44,871 34 -6.8318 1 -6.8315 no >100 16 -2.4506 5 -2.4511 yes >100
TRS 46,479 26 -6.9960 2 -6.9960 no 1.53 21 -2.3564 5 -2.3580 yes >100
MAH 59,384 40 -7.8126 1 -7.8124 no 46.6 28 -2.3246 6 -2.3296 yes >100
AAD 21,153 10 -7.0962 1 -7.0960 no 10.6 11 -2.4672 5 -2.4713 yes >100
PPX 55,283 24 -7.5792 1 -7.5790 no >100 20 -2.3125 6 -2.3149 yes >100
CVN 49,249 37 -7.2531 1 -7.2530 no 32.6 18 -2.5847 5 -2.5867 yes >100
ROC 54,302 40 -7.6711 2 -7.6715 yes >100 40 -2.3429 6 -2.3485 yes >100
ALS 60,470 28 -7.8802 2 -7.8805 yes >100 25 -2.2394 6 -2.2431 yes >100
ELD 34,516 36 -6.5569 1 -6.5577 yes >100 38 -2.4737 6 -2.4848 yes >100
HST 55,575 35 -7.5315 1 -7.5314 no >100 21 -2.3735 6 -2.3781 yes >100
VPIN -> Abs(Return) Abs(Return) -> VPIN

AABFJ | Volume 7, no. 2, 2013
22
Table 7 Granger Causality between VPIN and Duration
8 Conclusions In this paper several new ideas and concepts for market microstructure research have been presented. Easley et al. (2010)'s volume synchronised probability of informed trading (VPIN) measure has been introduced as a proxy for flow toxicity and the concept of volume bucketing, a special case of more generalised time deformation modelling, for market microstructure analysis. This study focussed on testing the effect of VPIN, a proxy for informed trading and order flow toxicity, on several intraday trading factors, namely (1) quote imbalance (2) price volatility and (3) duration. Statistically significant contemporaneous relationships were documented between these intraday factors with flow toxicity and it was noted that there is strong evidence in favour of Granger causality from VPIN to all three factors, extending the original research conducted by Easley at el (2010) on price volatility alone. Moreover, this study found that flow toxicity measured through VPIN is able to predict and explain to an extent future quote imbalance, price volatility and volume bucket duration or trade intensity. Similarly, it is not surprising that these intraday factors are also able to explain VPIN to a certain extent and the reverse causality is also true. This study concluded that there was a dynamic feedback system between VPIN, measured through the imbalance between buy initiated and sell initiated volume, to intraday quote imbalance, price volatility and trade duration. The study found the VPIN metric proxying informed trading to be yet another intraday factor, adding further to the rich array of factors present in market microstructure. It is hoped that this study provides future research of the VPIN metric or its variations.
Group A T p SBIC(0) q SBIC(1) Causality? R p SBIC(0) q SBIC(1) Causality? R
BHP 84,765 10 -9.4979 10 -9.5060 yes >100 27 -2.5426 11 -2.5457 yes >100
CBA 80,317 11 -9.5496 2 -9.5589 yes >100 23 -2.3746 35 -2.3792 yes >100
WBC 79,569 10 -9.4695 6 -9.4747 yes >100 22 -2.2892 12 -2.2955 yes >100
ANZ 82,034 11 -9.4828 10 -9.4907 yes >100 27 -2.3713 8 -2.3750 yes >100
NAB 79,779 12 -9.3109 6 -9.3194 yes >100 22 -2.3290 11 -2.3333 yes >100
WES 73,139 12 -9.2294 5 -9.2354 yes >100 17 -2.0925 11 -2.0966 yes >100
RIO 82,846 12 -9.2427 6 -9.2481 yes >100 22 -2.3182 11 -2.3220 yes >100
WOW 77,107 13 -9.3379 6 -9.3433 yes >100 17 -2.1678 13 -2.1744 yes >100
TLS 76,991 12 -8.4720 2 -8.4721 yes 62.5 22 -2.3022 15 -2.3234 yes >100
NCM 78,216 11 -9.1335 7 -9.1384 yes >100 22 -2.2051 11 -2.2089 yes >100
Group B T p SBIC(0) q SBIC(1) Causality? R p SBIC(0) q SBIC(1) Causality? R
DOW 71,390 20 -8.6809 2 -8.6818 yes >100 31 -2.1152 8 -2.1227 yes >100
AQA 66,038 30 -8.0117 2 -8.0120 yes >100 21 -2.1416 5 -2.1438 yes >100
WHC 62,668 38 -7.4923 1 -7.4921 no >100 21 -2.2384 5 -2.2400 yes >100
TSE 69,167 39 -8.5153 1 -8.5154 yes 28 30 -2.1652 7 -2.1694 yes >100
MND 70,785 14 -8.6869 2 -8.6877 yes >100 26 -2.0955 8 -2.0994 yes >100
MGX 71,216 18 -8.5340 1 -8.5341 yes 18.2 35 -2.2499 10 -2.2548 yes >100
IFL 63,802 34 -7.7437 2 -7.7438 yes 10.2 26 -2.1604 7 -2.1652 yes >100
DUE 62,568 12 -8.1712 2 -8.1715 yes >100 16 -2.1891 6 -2.1955 yes >100
FLT 71,310 11 -8.7728 2 -8.7744 yes >100 26 -2.1177 7 -2.1230 yes >100
PPT 71,441 40 -8.6598 2 -8.6606 yes >100 21 -2.0882 8 -2.0903 yes >100
Group C T p SBIC(0) q SBIC(1) Causality? R p SBIC(0) q SBIC(1) Causality? R
OGC 44,871 34 -6.8318 1 -6.8315 no >100 16 -2.4506 5 -2.4511 yes >100
TRS 46,479 26 -6.9960 2 -6.9960 no 1.53 21 -2.3564 5 -2.3580 yes >100
MAH 59,384 40 -7.8126 1 -7.8124 no 46.6 28 -2.3246 6 -2.3296 yes >100
AAD 21,153 10 -7.0962 1 -7.0960 no 10.6 11 -2.4672 5 -2.4713 yes >100
PPX 55,283 24 -7.5792 1 -7.5790 no >100 20 -2.3125 6 -2.3149 yes >100
CVN 49,249 37 -7.2531 1 -7.2530 no 32.6 18 -2.5847 5 -2.5867 yes >100
ROC 54,302 40 -7.6711 2 -7.6715 yes >100 40 -2.3429 6 -2.3485 yes >100
ALS 60,470 28 -7.8802 2 -7.8805 yes >100 25 -2.2394 6 -2.2431 yes >100
ELD 34,516 36 -6.5569 1 -6.5577 yes >100 38 -2.4737 6 -2.4848 yes >100
HST 55,575 35 -7.5315 1 -7.5314 no >100 21 -2.3735 6 -2.3781 yes >100
Duration -> VPINVPIN -> Duration
Wei, Gerace and Frino | Informed Trading, Flow Toxicity
23
References Ané, T & Geman, H.2000, ‘Order flow, transaction clock and normality of asset returns’,
Journal of Finance, vol.55, pp2259-2284. Atukeren, E 2005, ‘Measuring the strength of cointegration and Granger-causality’, Applied
Econometrics, vol.35, pp1607-1614. Brown, S, Hillegeist, SA & Lo, K. 2004, ‘Conference calls and information asymmetry’,
Journal of Accounting and Economics, vol.37, pp343-366. Brownlees, CT & Gallo, GM 2006, ‘Financial econometric analysis at ultra-high frequency:
Data handling concerns’, Computational Statistics & Data Analysis, vol.51, pp2232-2245.
Clark, PK 1973, ‘A subordinated stochastic process with finite variance for speculative prices’, Econometrica, vol.41, pp135-156.
Easley, D, Keifer, NM, O'Hara, M & Paperman, JB 1996, ‘Liquidity, information, and infrequently traded stocks’, Journal of Finance, vol.51, pp1405-1436.
Easley, D, Hvidkjaer, S & O'Hara, M 2002, ‘Is information risk a determinant of asset returns?’, Journal of Finance, vol.57, pp2185-2221.
Easley, D, Lopez de Prado, MM & O'Hara, M 2010, ‘Measuring flow toxicity in a high frequency world’, working paper, Cornell University.
Falkenberry, TN 2002, ‘High frequency data filtering’, technical report, Tick Data. Great Falls, Virginia
Feng, D, Song, PX-K & TS Wirjanto 2008, ‘ Time-deformation modeling of stock returns directed by duration process’, working paper 08010, Department of Economics, University of Waterloo.
Jeffreys, H 1961, Theory of Probability, 3rd edition, Oxford University Press, London Hasbrouck, J 2006, Empirical Market Microstructure, Oxford University Press, New York Hsiao, C 1979, ‘Autoregressive modeling of Canadian money and income data’, Journal of
the American Statistical Association, vol.74, pp553-560. Kang, H 1989, ‘The optimal lag selection and transfer function analysis in Granger-causality
tests’, Journal of Economic Dynamics and Control, vol.13, pp151-169. Kubota, K & Takehara, H 2009, ‘Information based trade, the PIN variable, and portfolio
style differences: Evidence from Tokyo stock exchange firms’, Pacific-Basin Finance Journal, vol.17, pp319-337.
Poskitt, D.D. & Tremayne, AR 1987, ‘Determining a portfolio of linear time series models’, Biometrika, vol.74, pp125-137.
Thornton, DL & Batten, DS 1984, ‘Lag length selection and granger causality’, working paper 1984-001A, Federal Reserve Bank of St. Louis
Zhang, L, Mykland, PA & Aït-Sahalia Y 2005, ‘A tale of two time scales: Determining integrated volatility with noisy high-frequency data’, Journal of the American Statistical Association, vol.100, pp1394-1411.

AABFJ | Volume 7, no. 2, 2013
24