Embed Size (px)
Citation preview

Copyright 0 1992 by the Genetics Society of America
Inference of Horizontal Genetic Transfer From Molecular Data: An Approach Using the Bootstrap
Jeffrey G. Lawrence' and Daniel L. Hart1 Department of Genetics, Washington University School of Medicine, S t . Louis, Missouri 631 10
Manuscript received June 28, 1991 Accepted for publication March 3 1, 1992
ABSTRACT Inconsistencies in taxonomic relationships implicit in different sets of nucleic acid sequences
potentially result from horizontal transfer of genetic material between genomes. A nonparametric method is proposed to determine whether such inconsistencies are statistically significant. A similarity coefficient is calculated from ranked pairwise identities and evaluated against a distribution of similarity coefficients generated from resampled data. Subsequent analyses of partial data sets, obtained by the elimination of individual taxa, identify particular taxa to which the significance may be attributed, and can sometimes help in distinguishing horizontal genetic transfer from inconsistencies due to convergent evolution or variation in evolutionary rate. The method was successfully applied to data sets that were not found to be significantly different with existing methods that use comparisons of phylogenetic trees. The new statistical framework is also applicable to the inference of horizontal transfer from restriction fragment length polymorphism distributions and protein sequences.
T HE accumulation of nucleic acid sequences from diverse taxa has prompted phylogenetic infer-
ence based upon a wide range of molecular relation- ships (FIELD et al. 1988; LAWRENCE, OCHMAN and HARTL 1991; THOMAS et al. 1989; WOESE 1987). Inconsistencies are sometimes found in the taxonomic relationships inferred from the nucleotide sequences of different genes. These differences may result from variation in evolutionary rates within and among genes, high levels of homoplasy due to convergent evolution, or events in which genetic material has been transferred between distantly related taxa. Hor- izontal transfer of genetic material represents a pow- erful mechanism by which organisms may acquire novel metabolic pathways or substantially alter exist- ing pathways. Many cases of possible gene transfers between distantly related organisms or organelle ge- nomes have been suggested, typically motivated by the finding of unusual similarities among homologous sequences from distantly related taxa, or by observing inconsistencies in gene phylogenies from a group of of organisms (e .g . , BANNISTER and PARKER 1985; BRISSON-NOEL, ARTHUR and COURVALIN 1988; CARL- SON and CHELM 1986; DOOLITTLE et al. 1990; Dow- SON et al. 1989; HILDEBRANDT et al.. 1989; IWAASA, TAKAGI and SHIKAMA 1989; LANDAN et al. 1990; LIAUD, ZHANC and CERFF 1990; P E ~ ~ A L V A et al. 1990; PLOS et al. 1989; WAKABAYASHI, MATSUBARA and WEBSTER 1986; WRIGHT and CUMMINCS 1983). Since it has been difficult to provide convincing statistical support for horizontal gene transfer, several cases
' Current address: Department of Biology, University of Utah, Salt Lake City, Utah 84112.
Genetics 131: 753-760 (July, 1992)
have been disputed, often by the same data being interpreted in an alternate manner (e .g . , KOLL 1986; LEUNISSEN and DE JONG 1986; SHATTERS and KAHN 1989). Examination of the evolutionary histories of organelle genomes has also suggested possible genetic transfer between organelle genomes and the nucleus (BALDAUF and PALMER 1990; ELLIS 1982; FARELLY and BUTOW 1983; FUKADA et al. 1985; GELISSEN et al. 1983; LIAUD, ZHANG and CERFF 1990; MAR~CHAL- DROUARD et al. 1990).
To attribute inconsistencies in molecular data to horizontal genetic transfer, one must first determine whether the taxonomic relationships implicit in two data sets are significantly different. Once a significant difference has been established, one must distinguish between differences due to homoplasy or variation in evolutionary rates from differences resulting from horizontal transfer of genetic material. The problem, as Dow and CHEVERUD (1985) noted, is that few formal procedures have been developed to assess the statistical significance of differences in sets of relation.; ships. The test may be accomplished in an indirect fashion by comparing phylogenies inferred from the data. However, existing methods for testing phylog- enies were designed to ascertain which of many pos- sible phylogenies is best supported by a single data set (e .g . , FELSENSTEIN 198 1, 1985, 1988; NEI, STEPHENS and SAITOU 1985; PENNY and HENDY 1986; SNEATH 1986; TEMPLETON 1983a,b, 1985). These tests have also been extended to compare the phylogenies in- ferred from different data sets. However, tests utiliz- ing phylogenies are intimately tied to particular ge- nealogies, and they may be compromised by the ina- bility of particular trees, or tree-making algorithms,

754 J. G . Lawrence and D. L. Hart1
Reference data set Test data set
t Matrix of identity
coefficients 1 A E C D . . N
A ab ac ad .. an ba -- bc bd .. bn E -- A
E C ca cb -- cd .. cn C D da db dc -- .. dn D
na nb nc nd . . -- I;
t t Matrix of identity
coefficients 2 A B C D . . N
ba -- bc bd .. bn ab ac ad .. an
ca cb .- cd . . cn da db dc -- .. dn
I na nb nc nd .. --
"
I t Matrix of ranks 2
A E C D . . N
Similarity coeffiaent of test tree without the putatively transferred taxon.
Similarity coefficient of tes t tree with theentiredataset.
Similarity coeffiaents of tes t hees without legitimate taxa.
1 0 s FIGURE 1 ."Flow chart describing the similarity coefficient and
the generation of the test distribution by resampling.
to embrace the full range of possible relationships implicit in the data.
We have developed a method that tests relationships implicit in nucleotide sequences without the a priori construction of phylogenetic trees. This approach ad- dresses the fundamental issue of whether relationships implicit in two sets of nucleotide sequences are signif- icantly different, independent of issues concerning which, if any, inferred phylogeny best describes each data set. Furthermore, when two sets of nucleotide sequences are found to be significantly different, sub- sequent analyses of subsets of sequences can often identify the taxon to which the difference may be attributed. The phylogeny that best describes each data set then remains a separate issue.
METHODS
Statistical test: Figure 1 illustrates the method for testing potential differences in taxonomic relation- ships implicit in two sets of nucleotide sequences. First, a matrix of identity coefficients is generated for each data set, in which the entry in cell (i, j ) is the propor- tion (or percentage) of sites that are identical between taxa i and j (calculated as the number of identical sites, divided by the average number of sites, between i and j ) . Each row in the matrix of identity coefficients
represents a set of comparisons between a particular taxon and all the other taxa. T o make the matrices commensurate, the magnitudes of the relationships are ranked within each row to create corresponding matrices of ranks; ties are assigned midrank values. The two matrices of ranks are compared row by row using the Spearman rank correlation statistic (SIEGEL 1956). Spearman statistics range from + 1 .O, indicat- ing a perfect positive correlation between the ranks, to -1 .O, indicating a perfect negative correlation be- tween the ranks. The Spearman statistics for all rows in the matrices of ranks are averaged to yield an overall similarity coefficient. Similarity coefficients of + 1 .O indicate identical taxonomic relationships im- plicit in the two sets of data, while those less than +1 .O denote some discrepancy in the relationships.
T o assess the statistical significance of a discrepancy, we employ the bootstrap, a method of resampling data designed to simulate the variability of a particular estimate (EFRON 1979). This approach has been uti- lized to assign confidence limits to particular nodes of phylogenetic trees (FELSENSTEIN 1985). In the boot- strap, individual observations from the original data set (in our case aligned positions in a set of nucleotide sequences) are chosen at random with replacement to create a simulated data set with the same sample size. The parameter of interest is estimated from the sim- ulated data, and the process is repeated numerous times to approximate the sampling distribution of the estimate. In our application, nucleotide positions are sampled at random to generate a simulated data set. Matrices of identity coefficients and matrices of ranks are generated, and a similarity coefficient between the bootstrapped matrix of ranks and the original matrix of ranks is computed. This process is repeated to compile a distribution of similarity coefficients. This distribution is examined to determine if the magni- tude of the similarity coefficient of the two original data sets is statistically significant, that is, if it lies outside the distribution of similarity coefficients gen- erated from the bootstrapped data sets. The propor- tion of bootstrapped simulations with smaller similar- ity coefficients than that of the two original data sets is taken as the significance value in a one-tailed test. In a sense, this application of the bootstrap addresses the question: "Are the genealogical relationships im- plicit in one data set consistent with those implicit in another data set?"
For cases of horizontal genetic transfer, the similar- ity coefficient between two sets of nucleotide se- quences should be significantly smaller than the dis- tribution of similarity coefficients generated from the bootstrapped data sets. However, in the case of hori- zontal transfer, excluding a particular taxon should eliminate the discrepancy, while excluding any other taxon would not. This procedure requires comparing significance levels, and it should therefore be consid-

Horizontal Transfer Test 755
ered as a consistency check when there is an a priori hypothesis of horizontal transfer rather than as a method for detecting horizontal transfer. In contrast to the situation with horizontal transfer, data sets exhibiting high levels of homoplasy may be found to be significantly different, but the elimination of one taxon, or any combination of taxa, would not be expected to eliminate the discrepancy. Moderate lev- els of homoplasy may be accounted for in our method by relaxing the criteria by which ties are assigned for ranking purposes (see below). In some cases it might make a difference which data set is bootstrapped, hence significance should be corroborated by retest- ing after interchange of reference and test data sets. In this manner, levels of homoplasy or variation in evolutionary rate that differ between the data sets will not bias the significance of the test.
It should be emphasized here that interchange of reference and test data sets, or retesting after elimi- nating one or more taxa from the data, always requires adjustment of the significance level in order to com- pensate for the performance of multiple tests.
In principle, using the ranks of the values in each row to compare the matrices of identity coefficients loses statistical power relative to using the identity coefficients themselves. In order to reflect the actual identity coefficients more accurately, it may be advan- tageous in some cases to relax the criteria by which ties in rank are assigned. For example, if the identity Coefficients of taxon A relative to B, C, D, E and F are 91, 90, 70, 32 and 30, respectively, the ranks are 1, 2, 3, 4 and 5. However, because of sampling vari- ation, additional data from the same taxa may lead to identity coefficients of 89, 90, 74, 31 and 33, and in this case the ranks would be 2, I , 3, 5 and 4. Clearly, in a case like this, it would be preferable to assign A- B and A-C as approximately equal in rank, and simi- larly for A-E and A-F, hence the ranking would be 1.5, 1.5, 3, 4.5 and 4.5, respectively.
Data sets: Simulated data sets were derived using the aligned nucleotide sequences of the gap locus, encoding glyceraldehyde-3-phosphate dehydrogen- ase, from enteric bacteria (LAWRENCE, OCHMAN and HARTL 199 1). Alternate 10-nucleotide sections were partitioned into two data sets. In the reference data sets, the taxonomic relationships are those determined from the nucleotide sequences of gap, encoding the glycolytic enzyme glyceraldehyde-3-phosphate dehy- drogenase, and of ompA, encoding an outer mem- brane protein (LAWRENCE, OCHMAN and HARTL 199 I). Simulated horizontal transfer (“transfer data sets”) were derived from the reference data sets by substituting the Escherichia fergusonii (Efe) sequence for the Serratia odorijh-a (Sod) sequence. Data for the Drosophila transposable element mariner and for the Adh locus, encoding alcohol dehydrogenase, were
TABLE 1
Pairwise divergences at nonsynonymous sites within reference data sets (upper diagonal) and transfer data sets (lower
diagonal)
Eco Sty Evu Kpn Sod
Eco - 1.2 3.6 3.3 8.1 - 3.2 3.0 7.5
Evu 3.6 3.2 - 3.0 6.9 3.3 3.0 3.0 - 7.1
Sod 0.8 0.9 3.1 2.7 -
Sty 1.2
KPn
Data from LAWRENCE, OCHMAN and HARTL (1991); pairwise divergences were corrected for multiple substitution by the method of PERLER et e l . (1980). Taxon designations are: Eco, Escherichia coli; Efe, Escherichia fergusonii; Sty, Salmonella typhimurium; Evu, Escherichia vulneris ATCC 33821; Kpn, Klebsiella pneumonia; Sod, Serratia odorijera. Taxon Sod in the transfer set is assigned nucleo- tide sequences derived from Taxon Efe.
True relationships Reference set Transfer set
E a Efe Sty Evu K n Sod Em Evu Kpn Sod E a Sod Sty Evu K n
W Q W - U
FIGURE 2.-Phylogenetic representation of the taxonomic rela- tionships inferred from the reference and transfer data sets of the simulated horizontal transfer, as compared to the true relationships (after LAWRENCE, OCHMAN and HARTL 1991). Taxon designations as in Table 1.
taken from MARUYAMA and HARTL (1 99 1) and JEFFS and ASHBURNER (1 991).
RESULTS
As an initial test of the method, we created simu- lated data sets and introduced aberrations in the nu- cleotide sequences that mimicked a horizontal transfer event. Four sets of nucleotide sequences were derived from sequences of gap genes from enteric bacteria. The taxonomic relationships implicit in the reference and transfer data sets are summarized in Table 1 . These relationships may be represented by the phy- logenies shown in Figure 2. (It should be emphasized that trees are only convenient for representing groups of relationships. The test is independent of trees, and indeed, the matrices of ranks may be significantly different even though tree-making algorithms fail to deduce a unique topology.) While the nucleotide se- quences of the reference data sets define one set of taxonomic relationships [consistent with the gap and ompA loci (LAWRENCE, OCHMAN and HARTL 1991)], the nucleotide sequences of the transfer data sets define a substantially different set of relationships. This discrepancy was introduced by assigning the nucleotide sequence of taxon Efe to taxon Sod in the transfer data set. Each reference data set was then compared to the transfer data set derived from the alternate portions of the gap genes, and similarity coefficients were computed and tested. The two ref-

756 J. G. Lawrence and D. L. Hard
TABLE 2
Data for simulated horizontal transfer event, 1000 bootstrap repetitions
Comparison data set
Taxon eliminatedb
Distribution
P U coefficient Similarity
PC
Ref 1 Ref2 Ref2 Ref 1 Tra 1 Tra2 Trd2 Tra 1
Refl Tra2
Ref2 Tra 1
Refl OmP Ref2 OmP Tra 1 OmP
Tra2 OmP
Eco Sty
KPn Evu
Sod
Eco Sty
KPn Evu
Sod
Sod
Sod
0.948 0.029 0.900 0.100 0.889 0.061 0.863 0.066
0.946 0.031 0.944 0.044 0.957 0.039 0.968 0.033 0.964 0.040 0.913 0.064
0.898 0.061 0.921 0.065 0.900 0.072 0.930 0.067 0.9 18 0.070 0.882 0.085
0.968 0.034 0.957 0.030 0.97 1 0.021 0.985 0.025 0.948 0.038 0.956 0.034
0.96 0.96 0.96 0.96
0.56 0.65 0.65 0.60 0.40 0.95
0.56 0.60 0.65 0.60 0.45 0.95
1 .oo 0.96 0.83 1 .oo 0.75 0.93
0.773 0.900 0.948 0.966
0.000 0.000 0.000 0.000 0.000 0.855
0.000 0.000 0.000 0.000 0.000 0.880
1.000 0.527 0.000 1 .ooo 0.000 0.399
a Refl, Ref2: reference data sets; Tral, Tra2: transfer data sets; all are derived from nucleotide sequences of bacterial gap loci. Omp:
' Taxon designations as in Table 1 . nucleotide sequences of bacterial ompA loci.
Significance estimated as the number of similarity coefficients generated by resampling methods that are smaller than that observed between the reference and transfer data sets.
erence data sets gave compatible matrices of identity coefficients, as did the two transfer data sets, which is expected since the data were derived from portions of the same genes (Table 2). However, when reference data sets were compared to transfer data sets, the similarity coefficient for the comparison was signifi- cantly smaller than the bootstrap distribution (P = 0.000 in 1000 bootstraps, Table 2). Reciprocal tests with resampling from the transfer data sets also yielded highly significant differences (data not shown). These results indicate that the taxonomic relation- ships implicit in the reference and transfer data sets are significantly different.
T o determine the taxon to which this difference may be attributed, the analyses were repeated follow- ing the elimination of individual taxa from the data sets. Only the exclusion of taxon Sod, which was assigned alternate nucleotide sequences in the transfer data sets, results in reference and transfer data sets that describe compatible taxonomic relationships (P = 0.855, P = 0.880, Table 2). The exclusion of any other taxon did not yield data sets with compatible relationships. (As noted earlier, such multiple tests
require appropriate adjustment of the significance levels.) The distribution of bootstrapped similarity coefficients for two cases of the Refl/Tra2 simulation are shown in Figure 3. Considering all taxa (Figure 3A), it is clear that none of the bootstrapped similarity coefficients is smaller than the test statistic, which is more than 12 SD from the mean value of the bootstrap distribution. When taxon Sod is eliminated, the test statistic is not significantly different than the mean of the bootstrapped values. Comparison of the transfer data sets with a second independent set of nucleotide sequences (those from the bacterial ompA locus) also yielded statistically significant similarity coefficients (Table 2). As before, this difference was eliminated upon the removal of taxon Sod. Furthermore, the reference data sets for gap were not significantly dif- ferent from the ompA sequences. These comparisons identify the transfer data sets as those resulting from the simulated horizontal genetic transfer event. Fur- thermore, the significance can be attributed to taxon Sod. Similar results were obtained when the simula- tion was repeated resampling the data using a jack- knifing method (WU 1986a) rather than the boot- strapping method (Table 3).
Mean I
Horizontal Transfer Test
A DISCUSSION
757
Test statistic
1 4 Mean
$gg$$zx 2 2 Similarity coefficient
FIGURE 3.-The distribution of similarity coefficients for the Refl/TraZ simulation (A) using all taxa and (B) eliminating taxon Sod.
We have also analyzed the data of MARUYAMA and HARTL (1991), which suggest that the transposable element mariner was transferred between a Drosoph- ila taxon and an ancestor of another dipteran, Za- prionus tuberculatus. Portions of their data are sum- marized in Table 4. While nucleotide sequences en- coding alcohol dehydrogenase (Adh) suggest that 2. tuberculatus is distantly related to all of the Drosophila taxa investigated, the mariner transposon resident in the genome of 2. tuberculatus is more closely related to the mariner transposons present in Drosophila taxa than was anticipated. Phylogenies approximating these relationships are shown in Figure 4. When com- pared using our methods, the mariner and Adh data sets described taxonomic relationships that are signif- icantly different ( P < 0.01, Table 5). (Reciprocal tests yielded comparable results.) However, when the 2. tuberculatus sequences were eliminated, the data sets described congruent relationships, as evident from the similarity coefficient of 1.0. The elimination of any other taxon did not yield this result. These results indicate that the inconsistency in taxonomic relation- ships described by the Adh and mariner sequences may be attributed to 2. tuberculatus. However, it is not clear from this test alone whether the discrepancy is due to transfer of a Drosophila mariner to Zaprionus or to an accelerated rate of evolution of Adh locus in 2. tuberculatus. Comparison of other genes from the same taxa, or Adh sequences from other Zaprionus species, would resolve the issue.
Several methods exist for discriminating between phylogenetic trees inferred from a single set of data (e.g., FELSENSTEIN 1985; TEMPLETON 1983a). How- ever, statistical frameworks have not been developed for directly testing the congruence of taxonomic re- lationships implicit in different data sets. Determining the robustness of a particular phylogeny to sampling errors in the data is an important issue. However, this problem may be separated from the question of whether the taxonomic relationships implicit in two data sets are significantly different, independent of what those relationships may be. By directly compar- ing the matrices of identity coefficients (or the ma- trices of ranks), the consistency of the taxonomic relationships may be analyzed without reference to phylogenetic inference. In the method we propose, the bootstrap is utilized to estimate the distribution of similarity coefficients resulting from the taxonomic relationships implicit in one data set. This distribution is utilized to assign a significance to comparisons be- tween two data sets. Systematic elimination of individ- ual taxa and reanalysis may reveal particular taxa with anomalous nucleotide sequences.
However, comparisons of additional genes, or al- gorithms that infer phylogenies, must also be em- ployed to determine whether any inconsistencies are due to aberrations in evolutionary rates, homoplasy due to convergent evolution, or horizontal transfer of genetic material between distantly related taxa. If the elimination of anomolous sequences from the data sets also eliminates the significance of the difference, this may strengthen the case for horizontal genetic transfer. Homoplasy will result in the inability of typical algorithms to erect well defined phylogenetic trees, and the elimination of individual taxa from the data sets would not eliminate the inconsistencies. In some cases it may be difficult to distinguish between horizontal transfer of genetic material as opposed to the ad hoc hypothesis of an accelerated rate of evolu- tion restricted to a small sequence of DNA evident in only a single lineage; for example, the discrepancy between the Adh and mariner data could also be ex- plained by a much accelerated rate of evolution of the Zaprionus Adh, and excluding this possibility might require sequencing other genes.
Analyses of simulated data sets, which introduced an artificial horizontal transfer event into otherwise consistent data, provide evidence that the statistical method has the power to discriminate between sets of nucleotide sequences describing inconsistent taxo- nomic relationships. It is also clear from this simula- tion that the source of the aberrant nucleotide se- quence can readily be identified. The statistical signif- icance of the Drosophila Adh and mariner data supports the hypothesis of horizontal transfer of the mariner transposable element between these taxa.

758 J. G . Lawrence and D. L. Hart1
TABLE 3
Data for simulated horizontal transfer event, 1000 jackknife repetitions
Jackknife Comparison data seta
Distribution Taxon
data set eliminatedb II U coefficient PC Similarity
Refl Ref2 Ref2 Refl Tra 1 Tra2 Tra2 Tra 1
Refl Tra2 Eco
Evu
Sod
Sty
KPn
0.945 0.900 0.888 0.870
0.954 0.941 0.957 0.968 0.960 0.9 12
0.031 0.062 0.061 0.068
0.029 0.045 0.038 0.033 0.039 0.065
0.96 0.96 0.96 0.96
0.56 0.65 0.65 0.60 0.40 0.95
0.800 0.897 0.945 0.951
0.000 0.000 0.000 0.000 0.000 0.858
Ref2 Tra 1 0.899 0.061 0.56 0.000 Eco 0.9 15 0.067 0.60 0.000
Evu 0.935 0.066 0.60 0.000
Sod 0.887 0.087 0.95 0.857
Sty 0.899 0.072 0.65 0.000
KPn 0.920 0.07 1 0.45 0.000
a Refl, Ref2: reference data sets; Tral, Tra2: transfer data sets. Taxon designations as in Table 1. Significance estimated as the number of similarity coefficients generated by resampling methods that are smaller than that observed
between the reference and transfer data sets.
TABLE 4
Painvise distances among dipteran taxa at the Adh locus (upper diagonal) and for mariner sequences (lower diagonal)
Dma Dsi Dte Dts Dva Ztu
Dma - 0.0 12 0.051 0.095 0.049 0.184 Dsi 0.008 - 0.044 0.089 0.043 0.187 Dte 0.019 0.018 - 0.091 0.021 0.197 Dts 0.091 0.091 0.080 - 0.097 0.202
- 0.197 Ztu 0.027 0.026 0.023 0.105 0.023 - DYa 0.019 0.017 0.007 0.090
Data from MARUYAMA and HARTL (1991). Taxon designations are: Dma, Drosophila mauritiana; Dsi, D. simulans; Dya, D. yakuba; Dte, D. tessicri; Dts, D. tsacasi; Ztu, Zaprionus tuberculatus. Entries are pairwise distances, calculated as the proportion of unchanged nucleotides between two taxa.
Adh relationships Mariner relationships may be examined to focus upon relationships among particular taxa. Careful selection of subsets, correc- tion for multiple tests, and conservative interpretation of the data should aid in reducing the risk of spurious conclusions of horizontal genetic transfer.
The rationale for our proposed test is based on the assumption that the distribution of similarity coeffi-
FIGURE 4.-Phylogenetic representation of the taxonomic rela- cients generated by the bootstrap is valid. The justi- tionships inferred from the Adh and mariner data sets (MARUYAMA fication for bootstrapping lies in the assumptions that and HARTL 199 1). Taxon designations as in Table 4. all members of the data set (in our case nucleotide
While horizontal transfer was suggested by visual in- positions) are independent and identically distributed, spection of the data, existing ( T ~ ~ ~ ~ ~ ~ ~ ~ and that the original data set is an unbiased sample of 1983~,b; ~ ~ l ~ ~ ~ ~ ~ ~ i ~ 1988) did not attain statistical the underlying distribution. If the sample size is large, significance in support of this hypothesis MARUYAMA the second assumption Justified- Since Polymor- and HARTL, (1 99 1). phisms in nucleotide sequences are usually not inde-
AS is the case in tests comparing phylogenies, sig- pendent and identically distributed, one must propose nificance values obtained from the bootstrap proce- both that the original data set is representative of the dure must be adjusted to account for multiple tests. underlying distribution and that the resampling Not only are reciprocal tests performed, but in many method preserves that structure. However, if this cases partial data sets, comprising a subset of 5-7 taxa, assumption is not valid, the procedure may be biased.
Dma mi Dya Dte D6 Ztu Dma Dsi Dya Dte Ztu Dts w w
Horizontal Transfer Test
TABLE 5
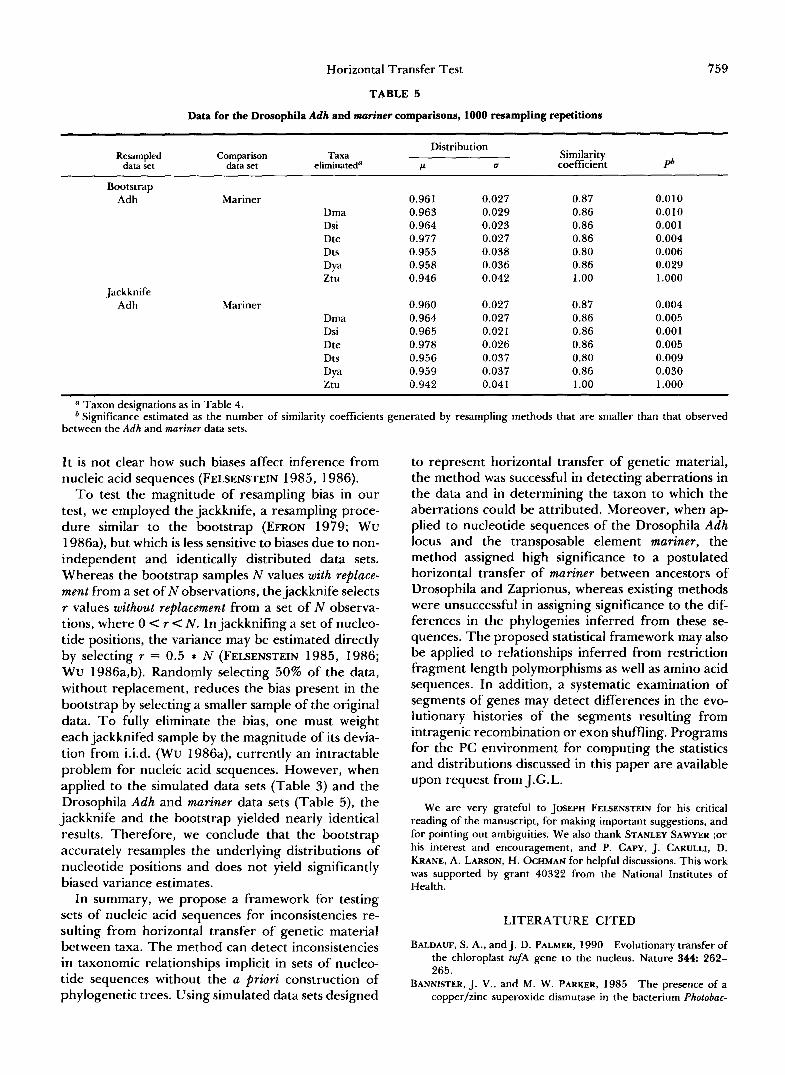
Data for the Drosophila Adh and mariner comparisons, 1000 resampling repetitions
759
Resampled data set
Distribution Comparison
data set eliminated’ Taxa Similarity
P U coeffkient Pb Bootstrap
Adh Mariner Dma Dsi Dte Dts
Ztu DYa
Jackknife Adh Mariner
Drna Dsi Dte Dts
Ztu DYa
0.961 0.027 0.963 0.029 0.964 0.023 0.977 0.027 0.955 0.038 0.958 0.036 0.946 0.042
0.960 0.027 0.964 0.027 0.965 0.021 0.978 0.026 0.956 0.037 0.959 0.037 0.942 0.041
0.87 0.86 0.86 0.86 0.80 0.86 1 .oo
0.87 0.86 0.86 0.86 0.80 0.86 1 .oo
0.010 0.010 0.001 0.004 0.006 0.029 1 .ooo
0.004 0.005 0.001 0.005 0.009 0.030 1 .ooo
Taxon designations as in Table 4. Significance estimated as the number of similarity coefficients
between the Adh and mariner data sets.
It is not clear how such biases affect inference from nucleic acid sequences (FELSENSTEIN 1985, 1986).
To test the magnitude of resampling bias in our test, we employed the jackknife, a resampling proce- dure similar to the bootstrap (EFRON 1979; WU 1986a), but which is less sensitive to biases due to non- independent and identically distributed data sets. Whereas the bootstrap samples N values with replace- ment from a set of N observations, the jackknife selects r values without replacement from a set of N observa- tions, where 0 < r < N . In jackknifing a set of nucleo- tide positions, the variance may be estimated directly by selecting r = 0.5 * N (FELSENSTEIN 1985, 1986; Wu 1986a,b). Randomly selecting 50% of the data, without replacement, reduces the bias present in the bootstrap by selecting a smaller sample of the original data. To fully eliminate the bias, one must weight each jackknifed sample by the magnitude of its devia- tion from i.i.d. (Wu 1986a), currently an intractable problem for nucleic acid sequences. However, when applied to the simulated data sets (Table 3) and the Drosophila Adh and mariner data sets (Table 5), the jackknife and the bootstrap yielded nearly identical results. Therefore, we conclude that the bootstrap accurately resamples the underlying distributions of nucleotide positions and does not yield significantly biased variance estimates.
In summary, we propose a framework for testing sets of nucleic acid sequences for inconsistencies re- sulting from horizontal transfer of genetic material between taxa. The method can detect inconsistencies in taxonomic relationships implicit in sets of nucleo- tide sequences without the a priori construction of phylogenetic trees. Using simulated data sets designed
generated by resampling methods that are smaller than that observed
to represent horizontal transfer of genetic material, the method was successful in detecting aberrations in the data and in determining the taxon to which the aberrations could be attributed. Moreover, when ap- plied to nucleotide sequences of the Drosophila Adh locus and the transposable element mariner, the method assigned high significance to a postulated horizontal transfer of mariner between ancestors of Drosophila and Zaprionus, whereas existing methods were unsuccessful in assigning significance to the dif- ferences in the phylogenies inferred from these se- quences. The proposed statistical framework may also be applied to relationships inferred from restriction fragment length polymorphisms as well as amino acid sequences. In addition, a systematic examination of segments of genes may detect differences in the evo- lutionary histories of the segments resulting from intragenic recombination or exon shuffling. Programs for the PC environment for computing the statistics and distributions discussed in this paper are available upon request from J.G.L.
We are very grateful to JOSEPH FEUENSTEIN for his critical reading of the manuscript, for making important suggestions, and for pointing out ambiguities. We also thank STANLEY SAWYER ;or his interest and encouragement, and P. CAPY, J. CARULLI, D. KRANE, A. LARSON, H. OCHMAN for helpful discussions. This work was supported by grant 40322 from the National Institutes of Health.
LITERATURE CITED
BALDAUF, S. A., and J. D. PALMER, 1990 Evolutionary transfer of the chloroplast tufA gene to the nucleus. Nature 344: 262- 265.
BANNISTER, J. V., and M. W. PARKER, 1985 The presence of a copper/zinc superoxide disrnutase in the bacterium Photobac-
760 J. G. Lawrence and D. L. Hart1
terium leignathi: a likely case of gene transfer from eukaryotes to prokaryotes. Proc. Natl. Acad. Sci. USA 82: 149-152.
BRISSON-NOEL, A,, M. ARTHUR and P. COURVALIN, 1988 Evidence for natural gene transfer from gram-positive cocci to Escherichia coli. J. Bacteriol. 1 7 0 1739-1745.
CARLSON, T. A., and B. K. CHELM, 1986 Apparent eukaryotic origin of glutamine synthetase I1 from the bacterium Brady- rhizobium japonicum. Nature 322: 568-570.
DOOLITTLE, R. F., D. F. FENG, K. L. ANDERSON and M. R. ALBERRO, 1990 A naturally occurring horizontal gene transfer from a eukaryote to a prokaryote. J. Mol. Evol. 31: 383-388.
DOW, M. M., and J. M. CHEVERUD, 1985 Comparison of distances matrices in studies of population structure and genetic micro- differentiation: Quadratic assignment. Am. J. Phys. Anthropol. 68: 367-373.
DOWSON, C. G., A. HUTCHINSON, J. A. BRANNIGAN, R. C. GEORGE, D. HANSMAN, J. LIKJARES, A. TOMASZ, J. MAYNARD SMITH and B. G . SPRA~T, 1989 Horizontal transfer of penicillin-binding protein genes in penicillin-resistant clinical isolates of Strepto- coccus pneumoniae. Proc. Natl. Acad. Sci. USA 86: 8842-8846.
EFRON, B., 1979 Bootstrap methods: Another look at the jack- knife. Ann. Statist. 7: 1-26.
ELLIS, J., 1982 Promiscuous DNA - chloroplast genes inside plant mitochondria. Nature 299: 678-679.
FARELLY, F., and R. A. BUTOW, 1983 Rearranged mitochondrial genes in the yeast nuclear genome. Nature 301: 296-30 1.
FELSENSTEIN, J., 1981 Evolutionary trees from DNA sequences: a maximum likelihood approach. J. Mol. Evol. 17: 368-376.
FELSENSTEIN, J., 1985 Confidence limits on phylogenies: an ap- proach using the bootstrap. Evolution 3 9 783-79 1.
FELSENSTEIN, J., 1986 Response to: jackknife, bootstrap and other resampling methods in regression analysis. Ann. Statist. 14: 1304-1 305.
FELSENSTEIN, J., 1988 Phylogenies from molecular sequences: inference and reliability. Annu. Rev. Genet. 22: 521-565.
FIELD, K. G. , G. J. OLSEN, D. J. LANE, S. J. GIOVANNONI, M. T. GHISELIN, E. C. RAFF, N. R. PACE and R. A. RAFF, 1988 Molecular phylogeny of the animal kingdom. Science
FUKUDA, M., S. WAKASUGI, T. TSUZUKI, H. NOMIYAMA and K. SHIMADA, 1985 Mitochondrial DNA-like sequences in the human nuclear genome. Characterization and implications in the evolution of mitochondrial DNA. J. Mol. Biol. 1 8 6 257- 266.
GELLISSEN, G., J. Y. BRADFIELD, B. N. WHITE and G. R. WYATT, 1983 Mitochondrial DNA sequences in the nuclear genome of a locust. Nature 301: 631-634.
HILDEBRANDT, V., M. RAMEZANI-RAD, U. SWIDA, P. WREDE, S. GRZESIEK, M. PRIMKE and G . BULDT, 1989 Genetic transfer of the pigment bacteriorhodopsin into the eukaryote Schizosac- caromyces pombe. FEBS Lett. 243: 137-140.
IWAASA, H., T. TAKAGI and K. SHIKAMA, 1989 Protozoan myo- globin from Paramecium caudatum. Its unusual amino acid sequence. J. Mol. Biol. 2 0 8 355-358.
JEFFS, P., and M. ASHBURNER, 1991 Processed pseudogenes in Drosophila. Proc. R. SOC. Lond. Ser. B 244: 151-159.
KOLL, F., 1986 Does nuclear integration of mitochondrial se- quences occur during senescence in Podospora? Nature 3 2 4 597-599.
LANDAN, G . , G . COHEN Y. AHARONOWITZ, Y. SHUALI, D. GRAUR and D. SHIFFMAN, 1990 Evolution of isopenicillin N synthase genes may have involved horizontal gene transfer. Mol. Biol.
LAWRENCE, J. G., H. OCHMAN and D. L. HARTL, 1991 Molecular and evolutionary relationships among enteric bacteria. J. Gen. Microbiol. 137: 1911-1921.
239: 748-753.
EvoI. 7: 399-406.
LEUNISSEN, J. A. M., and W. W. DE JONG, 1986 Copper/zinc superoxide dismutase: how likely is gene transfer from ponyfish to Photobacterium leignathi? J. Mol. Evol. 23: 250-258.
LIAUD, M.-F., D. X. ZHANG and R. CERFF, 1990 Differential intron loss and endosymbiotic transfer of chloroplast glyceral- dehyde-3-phosphate dehydrogenase genes to the nucleus. Proc. Natl. Acad. Sci. USA 87: 8918-8922.
MAR~CHAL-DROUARD, L., P. GUILLEMAUT, A. COSSET, M. ARBO- CAST, F. WEBER, J.-H. WEILand A. DIETRICH, 1990 Transfer RNAs of potato (Solanum tuberosum) mitochondria have differ- ent genetic origins. Nucleic Acids Res. 18 3689-3696.
MARUYAMA, K., and D. L. HARTL, 1991 Evidence for interspecific transfer of the transposable element mariner between Drosoph- ila and Zaprionus. J. Mol. Evol. 33: 514-524.
NEI, M., C. STEPHENS and N. SAITOU, 1985 Methods for comput- ing the standard errors of branching points in an evolutionary tree and their application to molecular data from humans and apes. Mol. Biol. Evol. 2 66-85.
PEGALVA, M. A., A. MOYA, J. DOPAZO and D. RAMON, 1990 Sequences of isopenicillin N synthetase genes suggest horizontal gene transfer from prokaryotes to eukaryotes. Proc. R. SOC. Lond. 241: 164-169.
PENNY, D., and M. HENDY, 1986 Estimating the reliability of evolutionary trees. Mol. Biol. Evol. 3: 403-417.
PERLER F., A. EFSTRATIADIS, P. LOMEDICO, W. GILBERT, R. KOLOD- NER and J. DODGSON, 1980 The evolution of genes: the chicken preproinsulin gene. Cell 2 0 555-566.
SVANBORG- ED^, 1989 Distribution of the P-associated pilus ( p a p ) region among Escherichia coli from natural sources: Evi- dence for horizontal gene transfer. Infect. Immun. 57: 1604- 1611.
SHATTERS, R. G., and M. L. KAHN, 1989 Glutamine synthetase 11 in Rhizobium: reexamination of the proposed horizontal trans- fer of DNA from eukaryotes to prokaryotes. J. Mol. Evol. 29:
SIEGEL, S., 1956 Nonparametric Statistics for the Behavioral Sciences. McGraw Hill, New York.
SNEATH, P. H. A., 1986 Estimating uncertainty in evolutionary trees from manhattan-distance triads. Syst. Zool. 35: 470-488.
TEMPLETON, A. R., 1983a Phylogenetic inference from restriction endonuclease cleavage site maps with particular reference to the evolution of humans and the apes. Evolution 37: 221-244.
TEMPLETON, A. R., 1983b Convergent evolution and nonpara- metric inferences from restriction data and DNA sequences, pp 151-1 79 in Statistical Analysis of DNA Sequence Data, edited by B. S. WEIR. Marcel Dekker, New York.
TEMPLETON, A. R., 1985 The phylogeny of the Hominoid pri- mates: a statistical analysis of DNA-DNA hybridization data. Mol. Biol. Evol. 2: 420-433.
THOMAS, R. H., W. SCHAFFNER, A. C. WILSON and S. PAABO, 1989 DNA phylogeny of the extinct marsupial wolf. Nature
WAKABAYASHI, S., H. MATSUBARA, and D. A. WEBSTER, 1986 Primary sequence of a dimeric bacterial hemoglobin from vitreoscilla. Nature 322: 481-483.
WOESE, C. R., 1987 Bacterial evolution. Microbiol. Rev. 51: 221- 271.
WRIGHT, R. M., and D. J. CUMMINGS, 1983 Integration of mito- chondrial gene sequences within the nuclear genome during senescence in a fungus. Nature 302: 86-88.
Wu, C. F. J., 1986a Jackknife, bootstrap and other resampling methods in regression analysis. Ann. Statist. 14: 1261-1295.
Wu, C. F. J., 1986b Rejoinder to: jackknife, bootstrap and other resampling methods in regression analysis. Ann. Statist. 1 4 1343-1350.
PLOS, K., S. I . HULL, B. R. LEVIN, I. ORSKOV, F. ORSKOV and c .
422-428.
3 4 0 465-467.
Communicating editor: B. S. WEIR