Embed Size (px)
Citation preview

November 2016
Le Thuc Duc and Nguyen Thi Thu Hang
Inequality in Educational Opportunities and Outcomes:Evidence From Young Lives Data in Vietnam
Country Report

Inequality in Educational Opportunities and Outcomes: Evidence From Young Lives Data in Vietnam
Le Thuc Duc and Nguyen Thi Thu Hang
© Young Lives 2016 ISBN 978-1-909403-84-0
A catalogue record for this publication is available from the British Library. All rights reserved. Reproduction, copy, transmission, or translation of any part of this publication may be made only under the following conditions:
• with the prior permission of the publisher; or
• with a licence from the Copyright Licensing Agency Ltd., 90 Tottenham Court Road, London W1P 9HE, UK, or from another national licensing agency; or
• under the terms set out below.
This publication is copyright, but may be reproduced by any method without fee for teaching or non-profit purposes, but not for resale. Formal permission is required for all such uses, but normally will be granted immediately. For copying in any other circumstances, or for re-use in other publications, or for translation or adaptation, prior written permission must be obtained from the publisher and a fee may be payable.
Young Lives, Oxford Department of International Development (ODID), University of Oxford,
Queen Elizabeth House, 3 Mansfield Road, Oxford OX1 3TB, UK
Tel: +44 (0)1865 281751 • Email: [email protected]
Core funded by
INEQUALITY IN EDUCATIONAL OPPORTUNITIES AND OUTCOMES: EVIDENCE FROM YOUNG LIVES DATA IN VIETNAM
3
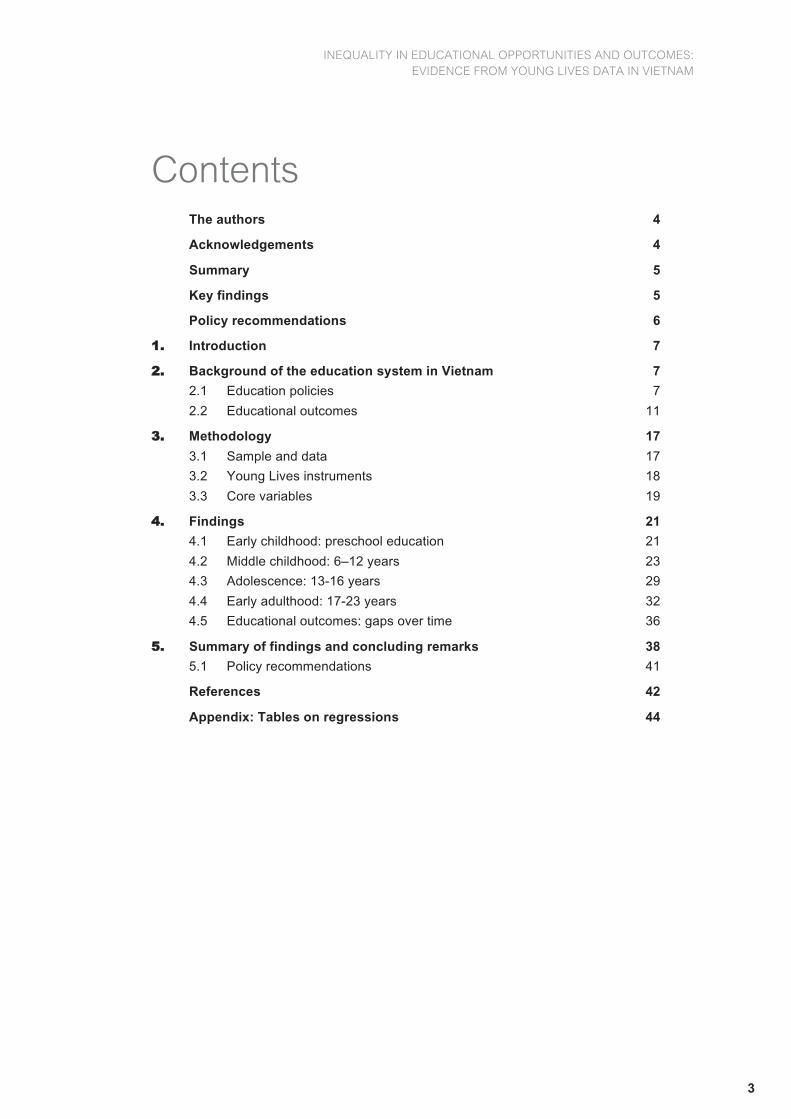
Contents The authors 4 Acknowledgements 4 Summary 5 Key findings 5 Policy recommendations 6 11.. Introduction 7 22.. Background of the education system in Vietnam 7
2.1 Education policies 7 2.2 Educational outcomes 11
33.. Methodology 17 3.1 Sample and data 17 3.2 Young Lives instruments 18 3.3 Core variables 19
44.. Findings 21 4.1 Early childhood: preschool education 21 4.2 Middle childhood: 6–12 years 23 4.3 Adolescence: 13-16 years 29 4.4 Early adulthood: 17-23 years 32 4.5 Educational outcomes: gaps over time 36
55.. Summary of findings and concluding remarks 38 5.1 Policy recommendations 41
References 42 Appendix: Tables on regressions 44

INEQUALITY IN EDUCATIONAL OPPORTUNITIES AND OUTCOMES: EVIDENCE FROM YOUNG LIVES DATA IN VIETNAM
4
The authors Le Thuc Duc is the Principal Investigator of Young Lives Vietnam, based at the Centre for
Analysis and Forecasting, Vietnam Academy of Social Sciences.
Nguyen Thi Thu Hang is Policy Coordinator for Young Lives Vietnam, and a researcher at
the Centre for Analysis and Forecasting (CAF), within the Vietnam Academy of Social Sciences.
Acknowledgements The authors are grateful to Santiago Cueto, Alejandra Miranda and Juan Leon for their
effective cooperation in different stages of producing this paper. We also want thank Padmini Iyer for her comments and Adam Houlbrook for his insightful editing.
About Young Lives
Young Lives is an international study of childhood poverty, following the lives of 12,000 children in four countries (Ethiopia, India, Peru and Vietnam) over 15 years. www.younglives.org.uk
Young Lives is funded by UK aid from the Department for International Development (DFID).
The views expressed are those of the author(s). They are not necessarily those of, or endorsed by, Young Lives, the University of Oxford, DFID or other funders.
INEQUALITY IN EDUCATIONAL OPPORTUNITIES AND OUTCOMES: EVIDENCE FROM YOUNG LIVES DATA IN VIETNAM
5
Summary This paper utilises Young Lives longitudinal data on two cohorts of 3,000 children in Vietnam,
as well as a wealth of official Government data, to present a broad picture of the education sector in the country, focusing on inequality. For most of the period under study, Vietnam
was a low-income country, but people always placed a high value on education. The evidence for the strong commitment includes the fact that the government has made changes in education policy quite frequently over the last 15 years, and public expenditure on
education has increased as a percentage of GDP. From the private sector, the commitment is evident from the significant demand for extra classes, which are an unofficial supplement to the regular classes which occur mostly in public schools. An important achievement is that
the country has reached the goal of universalisation of primary education, and has almost done so for basic education in general. Moreover, the gender gap in education is moderate in Vietnam, compared to other countries.
Key findings • Pre-primary and primary school attendance: Young Lives data show that at age 5,
over 10 per cent of both cohorts never attend preschool or other schools, and less than 10 per cent attend private preschools. With respect to the next level, data show
that 95 per cent of the Younger Cohort (born in 2000-01) started Grade 1 in the year they turned 6, and another four per cent started by age 7. At the primary level, the rate of progress to next grade is close to a 100 per cent, except for first graders. The
rate of overage for primary school students is relatively low for the Younger Cohort.
• Middle childhood and private tuition: Middle childhood covers the years of primary
and lower secondary schools. For basic education, an absolute majority of students go to public schools. However, at ages 8 and 12, nearly two thirds of the Younger
Cohort took extra classes, higher than the rate of slightly over 50 per cent for the Older Cohort children (born in 1994-95) seven years previously. For both cohorts, the children of wealthy households are much more likely than the children of the poor to
attend the extra classes, which are more popular in cities than in the uplands and remote areas. The infrastructure of primary schools varies widely between geographic areas, especially in the availability of libraries, computers, and internet for
student use. However, there are few differences between geographical areas in terms of class teacher characteristics, such as qualifications (having a university degree), teaching experience, and their performance in maths and Vietnamese tests.

INEQUALITY IN EDUCATIONAL OPPORTUNITIES AND OUTCOMES: EVIDENCE FROM YOUNG LIVES DATA IN VIETNAM
6
• Educational outcomes and socio-economic status: The gender gap in education
of Vietnam is quite moderate, and where it exists, it is often that girls perform slightly better than boys. Geography, mother’s level of education, and wealth/poverty all
make a difference in all the educational outcomes considered in this paper. We use these three factors, which have prevailed from the early childhood, to create the most vulnerable and least vulnerable group for each of the cohorts. Across all the
measurements, the overage rates through level of schooling, performance in cognitive tests (receptive vocabulary, maths, and reading), and dropout at different ages (5, 8, 12, 15, and 19 years), we found consistent gaps. In all outcomes, the least
vulnerable group perform better than the most vulnerable.
• Secondary and tertiary education – transition and dropout: At age 15, over 80 per
cent of children have completed lower secondary education, and less than 4 per cent are still in basic education schools. Mother’s level of education is the most powerful
predictor of the outcomes in child’s completion of lower secondary education. At age 19, nearly 60 per cent have completed upper secondary education, 10 per cent are still in general education school, and over 10 per cent drop out before completing
basic education. The gap between the least and the most vulnerable groups is as wide as 64 per cent in completion of upper secondary education. Furthermore, having completed upper secondary, over one third of the Older Cohort went on to a
tertiary education institution, with slightly more going to university than to technical/professional institutes. Wealth, mother’s level of education and the child’s cognitive achievement are the most important determinants of attending schools at
the tertiary level.
Policy recommendations We recommend that the policymakers need to take measures to address the following issues.
• While the majority of the children attended preschool before entering Grade 1, about
half of the children spent less than two years in the preschool programme; this might
contribute to the disadvantage of ethnic minority children.
• The transition from tertiary schools to livelihoods, which has not been an issue to date
because of weak demand for job market entrants with tertiary level qualifications.
• Regional disparities in socio-economic development are a long-term problem that
requires consistent commitment to pursue inclusive growth to keep vulnerable children from lagging further behind.

INEQUALITY IN EDUCATIONAL OPPORTUNITIES AND OUTCOMES: EVIDENCE FROM YOUNG LIVES DATA IN VIETNAM
7
1. Introduction It has been widely documented that people in Vietnam place a high value on education (see,
for example, London 2011). Schooling is believed to be an important route out of poverty, or to improve the family’s socio-economic status. This way of thinking is positive in the sense that it
provides motivation for working hard at schools. In practice though, some people do better and achieve their goals, while others fail. Inequality persists from generation to generation.
The issue of inequality in education has become more imminent than ever because a broad
base of trained labour is necessary for the economy, in which demand for human capital is
higher than ever before. A number of studies using Young Lives data (see, for instance, Glewwe et al. (2014)) made it clear that inequalities have existed even before the children go to schools. Some children have less favourable backgrounds, such as low wealth, low
maternal education, membership of an ethnic minority, or early childhood under-nutrition, than the others, and these will have long-term consequences. The education system can contribute to changes in inequality, in one direction or another. For example, Tran and
Pasquier-Doumer (2015) use Young Lives school survey data to study the impact of the application of a full-day schooling model (as oppose to half-day schooling) on inequality in the performance of fifth graders in Vietnam.
In this paper, we consider a broad picture of inequality in educational outcomes. To do so,
we take a dynamic view of the educational evaluation of two cohorts of children born in 1994-95 (Older Cohort) and 2001-02 (Younger Cohort) in Vietnam. That is possible due to longitudinal nature of the Young Lives dataset. Young Lives follows these cohorts at several
stages of development, which allows for comparison of the outcomes for the two cohorts at the same ages (surveyed in different years). Before presenting the results from the Young Lives data, we look at the national context.
2. Background of the education system in Vietnam The transition to a market economy in Vietnam began in 1986, following the announcement
of Doi Moi. Doi Moi is a major package of economic reforms that led to a series of changes in
socio-economic policies and that gradually led to reforms of the education system. Before this point, the education system had been developed for a centrally planned economy. Since Doi Moi, education laws have changed a number of times.
2.1 Education policies
According to the Education Law (Viet Nam National Assembly 1998), the state will ensure
access to education for everyone, while giving priority to ethnic minorities and other disadvantaged groups. Primary education is compulsory for all children. A child enrols in
Grade 1 at the start of the academic year in the year they turn 6 years old. The 1998 Education Law articulates that ‘[t]he State exerts unified management of the national educational system with regard to the objective, programme, content and plan of education,
the criteria of teachers, the regulations on examinations and the system of diplomas.’ The

INEQUALITY IN EDUCATIONAL OPPORTUNITIES AND OUTCOMES: EVIDENCE FROM YOUNG LIVES DATA IN VIETNAM
8
Law also makes it clear that the state budget holds a key role in the total investment in education. Given the fact that Vietnam was a low-income county in the first decade of the twenty-first century, poverty is a factor of the inequality of opportunity in education. The Law
specifies that the ‘State gives preference to and create conditions for children of ethnic minorities and the families in the areas with exceptionally difficult economic and social conditions, the beneficiaries of preferential policies, the disabled and the beneficiaries of
other social welfare policies, to exercise their right and discharge their obligation of learning.’1 Figure 1 shows the trend of increasing public expenditure for education as a percentage of GDP in the period of this study.
Figure 1. Public expenditure on education as percentage of GDP
Source: MOET 2014
The 2005 Education Law (Viet Nam National Assembly 2005) sets out the goal that ‘Primary
education and lower secondary education are universal education levels’. Following on from this, the 2009 Amendment to the Education Law requires that universal education extends to
5-year-old children in pre-primary school. The government’s commitment to education is reflected in several other legal documents, one of which is the National Action Plan on Education for All, 2003-15. This plan aimed to ensure that by 2015 all children have access
to high quality education and that early childcare and preschool education be expanded and improved, especially for disadvantaged and vulnerable children. Furthermore, the National Plan states that the country shall achieve gender equality in education by 2015.
In the education system of Vietnam, the lowest level is early childhood education, which
includes nurseries and kindergarten (MOET 2014: 7). Children under 3 years old go to nurseries, and children ages 3 to 5 attend kindergarten. The general education consists of primary school, lower secondary, and upper secondary education. The correct ages for
children to be in different schools are presented in Figure 2. Children in Vietnam start Grade 1 at the age of 6,2 and are expected to complete basic or general education at age 15. Following the completion of lower secondary education, most adolescents choose to 1 The 1992 Constitution of Vietnam states that ‘Primary education is compulsory and dispensed free of charge’.
2 The age of enrolment into general education of Vietnam; birth month is not taken into account.
3
4
5
6
1998 2000 2002 2004 2006 2008 2010 2012 2014

INEQUALITY IN EDUCATIONAL OPPORTUNITIES AND OUTCOMES: EVIDENCE FROM YOUNG LIVES DATA IN VIETNAM
9
continue schooling in upper secondary education if they pass admission exams,3 or else move into vocational education. In vocational education, students can choose professional secondary schools, or one of the vocational training institutions. The content taught in these
two parts of vocational education mostly overlap. However, professional secondary schools are the responsibility of Ministry of Education and Training (MOET), while vocational training schools are under the Ministry of Labour, Invalids and Social Affairs (MOLISA). Vocational
training programmes can be short term (less than a year), or long term (up to three years), unlike those of professional secondary schools, which offer programmes ranging from three to four years in length.
Figure 2. National education system in Vietnam
Source: MOET 2014
Centres for continuing education exist in all provinces of Vietnam. This form of informal
education offers a second chance for individuals who are out of formal education for different reasons. Students in continuing education include adults undertaking adult education, and
young people who fail the admission exams for public upper secondary schools and can’t afford private education at an upper secondary school. Those who have dropped out of school can also resume their schooling in the centres for continuing education.
The higher education system of Vietnam consists of colleges and universities. Some of the universities also offer programmes towards college degrees. It takes fewer years to complete
college than university, and the degrees earned in the former are less advanced than those in the latter. Candidates need to have obtained university degrees to enter doctoral or master programmes.
3 For students to be admitted to public upper secondary schools, however, requires that they pass exams in certain subjects
such as maths, Vietnamese literature, and foreign languages.
Doctorate
Vocational trainingProfessional SecondaryUpper Secondary
6
11
15
18
21
24
Age
Continuing education
Lower Secondary
Primary school
Pre-school education
University education
Master
College education

INEQUALITY IN EDUCATIONAL OPPORTUNITIES AND OUTCOMES: EVIDENCE FROM YOUNG LIVES DATA IN VIETNAM
10
The Strategic Plan for Education Development for 2011-20 focuses on fundamental and
comprehensive reform of the education system. It restates the 2009 Education Law’s objective of preschool education universalisation for children under 5 years old by 2015.
Other key objectives include that by 2020, right-age child enrolment in primary education and lower secondary education will increase to 99% and 95%, respectively. The Strategic Plan also set out to deliver a major agenda on reform of education management and development
of teachers and education managers.
Official documents show that the latest major reform of education took place in 1979, before
the socio-economic reform of Doi Moi. By the end of the first decade of the twenty-first century, public debaters voiced concern about a number of shortcomings of the education
system. This is because Vietnam has adopted market economy principles and embarked on global integration, and the modern economy therefore demands greater contribution from the education system. The state of the education system is reflected in an important legal
document in Vietnam that stated:
… the quality and effectiveness of education are still lower than expected, especially
higher education and vocational education. The education system lacks continuity between levels and methods of education, and is rather theoretical than practical. The
training not well associated with scientific research, manufacture, business, and demand of the labor market; education about ethics, lifestyles, and working skills are underestimated. The method of education, testing, and assessment are still obsolete and
imprecise.
A lot of weaknesses in education administration still exist. The quality, quantity, and ratio
of educators and education administrative officers are still unreasonable, some of them fail to meet the requirements for innovation and development of education, lack dedication, and even violate the code of professional ethics.4
In a National Assembly (NA) forum during the 2014 congress session, a NA member
expressed a similar concern when explaining why the productivity of the Vietnamese workforce is very low. One issue that draws public attention is the prevalence of extra classes. These classes are essentially a form of private supplement to public education (Le
and Baulch 2013), which has been debated in the National Assembly as controversial (Tran and Harpham 2005; Bray and Lykins (2012). Likewise, public debaters voiced concern about the school schedule overstretching pupils, and consequently having a negative effect on all-
round development.
Given the dissatisfaction by certain sections of the public, MOET has introduced a number of
partial reforms of the education system over the last decade. In response to public concern, MOET decided to ban private tutoring in the form of extra classes for primary schools. Another
policy is the (gradual) shift to a full-day (six-hour instruction) schooling model.5 It has been argued that demand for extra classes is so high because the current model of half-day (3.5-hour instruction) schooling is not long enough to sufficiently cover the curriculum.
The application of New School model (Escuela Nueva) under the project VNEN is another reform, aiming to remedying some of the existing problems in the general education of
4 Source: National Library of Legal Documents (http://thuvienphapluat.vn/van-ban/Thuong-mai/Nghi-quyet-29-NQ-TW-nam-
2013-doi-moi-can-ban-toan-dien-giao-duc-dao-tao-hoi-nhap-quoc-te-212441.aspx)
5 MOET data show that by 2009, as many as 2.2 million (or 32.9 per cent) of all primary pupils were in full-day schooling every weekday (Tran Dinh Thuan 2014).

INEQUALITY IN EDUCATIONAL OPPORTUNITIES AND OUTCOMES: EVIDENCE FROM YOUNG LIVES DATA IN VIETNAM
11
Vietnam: ‘The VNEN approach of promoting small group peer-learning and problem solving is helping to develop life-long positive attitudes, such as initiative, creativity, self-esteem, self-reliance, responsibility, social and communication skills, and self-confidence’ (Banik 2013).
More recently, a major plan of fundamental reform in curriculum and textbooks for general
education has been approved. That is in response to the National Assembly’s decision in November 2014. The current textbooks and curriculum for primary and secondary have been in place since 2002, and are regarded as outdated for Vietnam in the twenty-first century.
This curriculum reform aims to shift Vietnam’s primary and secondary education system from what has been regarded as an overemphasis on theoretical knowledge, to a new balance with the adoption of experiences from countries with more advanced systems of education.
The results of the application of such programmes will be seen in the future. In the following subsection, we present the broad picture of general education performance over the last decade.
2.2 Educational outcomes
Despite a number of drawbacks, as discussed above, the education system in Vietnam has
been successful in certain areas, including enrolment. This is not necessarily the case for the
preschool part of the education system. As mentioned earlier, mandatory preschool attendance applies to 5-year-old children, but not to younger age groups of preschool children. Figure 3 shows that the rate of the enrolment for 3 to 4-year-olds is clearly below
that for 5-year-olds, even though the rates increase over time for both age groups.
Figure 3. Rate of preschool enrolment
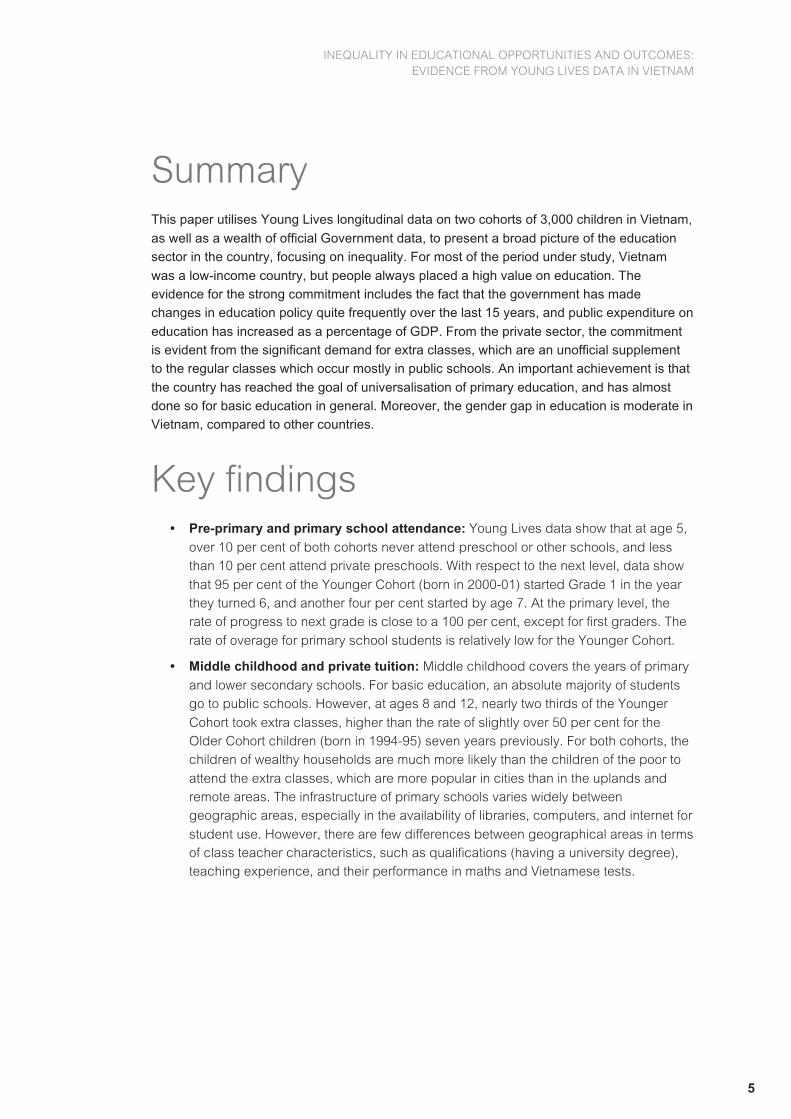
According to MOET, by 2013, as many as 61 out of 63 provinces achieved the target of
universalisation for primary school-age children. At the lower level of administration, 99 per cent of all districts (635/641) achieved the target (MOET 2015). Figure 4 presents the
increasing trend of districts that have achieved universalisation of primary education at right age. It shows that major progress was made in 2005, the year the National Assemble ratified the Education Law.
40
50
60
70
80
90
100
2001 2002 2003 2004 2005 2006 2007 2008 2009 2010 2011 2012 2013
Perc
enta
ge
Academic year end
3-to-5 years 5-year-olds only
INEQUALITY IN EDUCATIONAL OPPORTUNITIES AND OUTCOMES: EVIDENCE FROM YOUNG LIVES DATA IN VIETNAM
12
Figure 4. Percentage of districts having achieved universalisation of primary education at right age
Source: MOET statistics
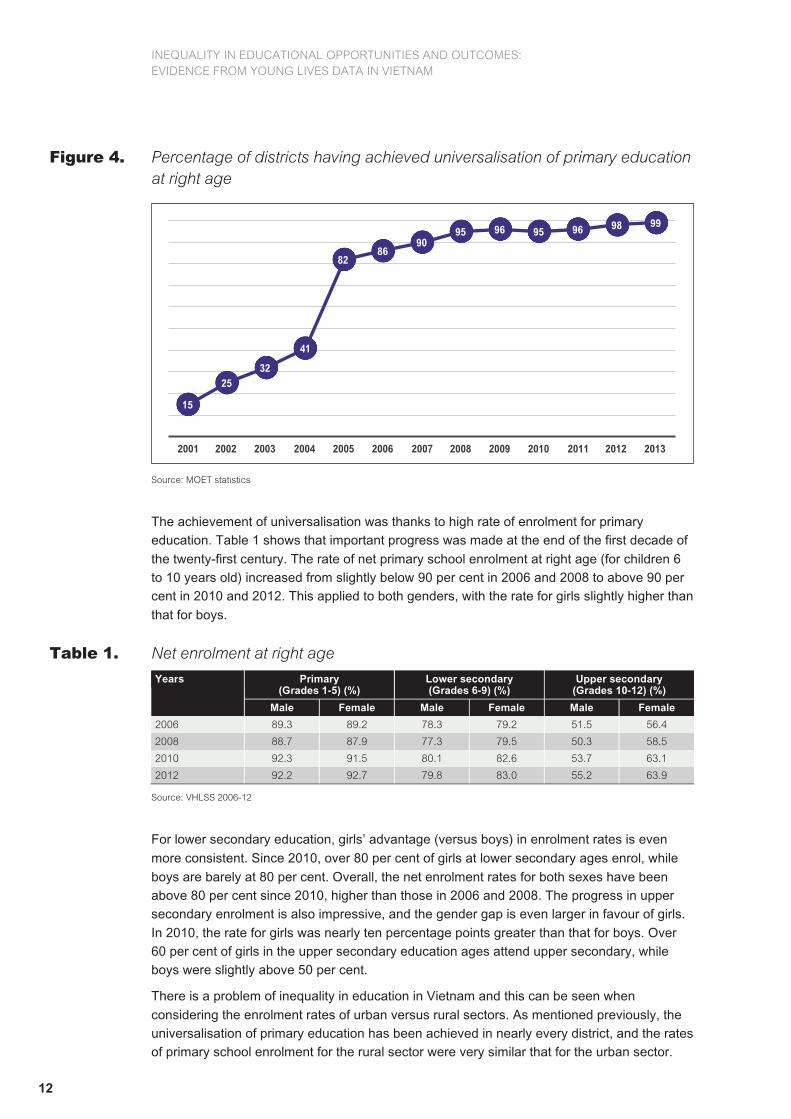
The achievement of universalisation was thanks to high rate of enrolment for primary education. Table 1 shows that important progress was made at the end of the first decade of
the twenty-first century. The rate of net primary school enrolment at right age (for children 6 to 10 years old) increased from slightly below 90 per cent in 2006 and 2008 to above 90 per cent in 2010 and 2012. This applied to both genders, with the rate for girls slightly higher than
that for boys.
Table 1. Net enrolment at right age
Years Primary (Grades 1-5) (%)
Lower secondary (Grades 6-9) (%)
Upper secondary (Grades 10-12) (%)
Male Female Male Female Male Female
2006 89.3 89.2 78.3 79.2 51.5 56.4
2008 88.7 87.9 77.3 79.5 50.3 58.5
2010 92.3 91.5 80.1 82.6 53.7 63.1
2012 92.2 92.7 79.8 83.0 55.2 63.9
Source: VHLSS 2006-12
For lower secondary education, girls’ advantage (versus boys) in enrolment rates is even
more consistent. Since 2010, over 80 per cent of girls at lower secondary ages enrol, while
boys are barely at 80 per cent. Overall, the net enrolment rates for both sexes have been above 80 per cent since 2010, higher than those in 2006 and 2008. The progress in upper secondary enrolment is also impressive, and the gender gap is even larger in favour of girls.
In 2010, the rate for girls was nearly ten percentage points greater than that for boys. Over 60 per cent of girls in the upper secondary education ages attend upper secondary, while boys were slightly above 50 per cent.
There is a problem of inequality in education in Vietnam and this can be seen when
considering the enrolment rates of urban versus rural sectors. As mentioned previously, the universalisation of primary education has been achieved in nearly every district, and the rates of primary school enrolment for the rural sector were very similar that for the urban sector.
15
25 32
41
82 86
90 95 96 95 96 98 99
2001 2002 2003 2004 2005 2006 2007 2008 2009 2010 2011 2012 2013

INEQUALITY IN EDUCATIONAL OPPORTUNITIES AND OUTCOMES: EVIDENCE FROM YOUNG LIVES DATA IN VIETNAM
13
Figure 5 shows thought that, for the higher levels of education, differences in the enrolment rates between urban and rural sectors are clear, and consistent over the years. The urban-rural gap is even bigger for upper secondary education enrolment than for lower secondary.
The average over the years of the urban-rural gap in upper secondary enrolment is 15 percentage points, or three times of that for lower secondary.
Figure 5. Net enrolment rate of children at right age, (urban vs. rural), in per cent
Source: VHLSS 2006-2012
Vietnam has 54 ethnic groups. Each has their own spoken languages, but not all have written
scripts.6 As late as 2008, seven such languages were being taught in general education schools: Bahnar, Chinese, Cham, Khmer, Ede, Hmong Jrai, and Khmer. ‘Except internationally funded bilingual programmes, which were piloted in a number of provinces,
and limited initiatives at the local level, ethnic minority languages were only taught as a subject but not used as a medium of instruction anywhere in the country’ (Truong 2011: 4). Thus, for ethnic minority children in the communities, where kindergartens are unavailable,
the Vietnamese spoken language is taught for two months before entering Grade 1. The variation in readiness for primary education may be a factor behind inequality in education. Gaps between different ethnic groups have always been a major concern for socio-economic
development in Vietnam. Education is one of the important areas in which the government invests to reduce inequalities between ethnic groups.
The net enrolment rates of children in 2012 for the six most populous ethnic groups are
presented in Figure 6. It is clear that there is no significant variation across ethnic groups with
respect to the rates of primary school enrolment. There is, however, significant variation across ethnic groups in the net enrolment rate for both lower and upper secondary education. For instance, the Tay perform very similar to the Kinh majority in the net enrolment rate
overall. The rates for the Khmer and Hmong are clearly lower than that of Kinh in the net enrolment for lower and upper secondary education. For lower secondary enrolment, the net rates of the Khmer and Hmong in 2012 were correspondingly 30 and 38 percentage points
6 The ethnic groups include Chinese, Cham, Khmer, Thai, Tay, Hmong, Nung, Ede, Jrai, Bahnar, and a few more with their own
written scripts.
30 40 50 60 70 80 90 100
Urban
Rural
Urban
Rural
Urban
Rural
Prim
ary
Low
er S
econ
dary
Upp
er S
econ
dary
2006 2008 2010 2012

INEQUALITY IN EDUCATIONAL OPPORTUNITIES AND OUTCOMES: EVIDENCE FROM YOUNG LIVES DATA IN VIETNAM
14
below that of the Kinh. The gaps in enrolment rate of the Kinh were even larger for upper secondary education.
Figure 6. 2012 net enrolment rate of children at right age, by ethnic groups
Source: VHLSS 2012
For the disaggregation of data on school attendance by mothers’ education attainment and
by household wealth, we use data from Viet Nam Multiple Indicator Cluster Survey (MICS 2014). The results in Table 2 show that the net enrolment rates for primary education are high even for disadvantaged groups such as those whose mothers have not competed
primary education, and those in the poorest quintile. Significant gaps are only observed for the enrolment rates in lower and upper secondary education.
Table 2. Net enrolment by socio-economic status
Primary (%) Lower secondary (%) Upper secondary (%)
By mother’s education attainment
None 87.7 65.3 24.6
Primary 98.7 83.2 57.1
Lower secondary 99.2 96.7 80.8
Upper secondary 98.3 97.6 92.1
Tertiary 98.8 98.2 96.9
By household wealth index quintiles
Poorest 94.4 75.1 40.4
Second 98.8 92.9 67.3
Middle 99.3 94.2 74.3
Fourth 99.1 96.1 85.4
Richest 98.7 97.8 93.3
Source: MICS 2014
General education in Vietnam, especially basic education, has been mostly public. This
official description of the current context need not undermine the significance of teaching-learning activities that are unofficial, taking place in the form of extra classes to be addressed below. At the primary level, the share of pupils going to non-public schools has never been
above one per cent, as seen in Table 3. In case of lower secondary education, the figure was slightly above one per cent, but has gradually gone down to half a per cent.
0
20
40
60
80
100
Primary Lower Secondary Upper Secondary
Perc
enta
ge
Kinh Tay Muong Thai Khmer Hmong

INEQUALITY IN EDUCATIONAL OPPORTUNITIES AND OUTCOMES: EVIDENCE FROM YOUNG LIVES DATA IN VIETNAM
15
Table 3. Proportions of student by type of school
Primary (%) Lower secondary (%) Upper secondary (%)
Academic year Public Non-public Public Non-public Public Non-public
2007-8 99.42 0.58 98.83 1.17 72.90 27.10
2008-9 99.40 0.60 98.91 1.09 78.75 21.25
2009-10 99.32 0.68 99.17 0.83 84.22 15.78
2010-11 99.47 0.53 99.42 0.58 88.30 11.70
2011-12 99.45 0.55 99.41 0.59 90.86 9.14
2012-13 99.47 0.53 99.45 0.55 90.87 9.13
Source: MOET statistics
The share of non-public education students has been significant for upper secondary
schools, but the trend is decreasing from nearly 30 per cent in 2007-8 to under 10 per cent in 2011-12 and 2012-13. One reason why there are more students going to private school in the upper secondary level than lower levels of schooling is to do with entrance exams. Public
schools at the upper secondary level only accepting students who pass entrance exams that are administered by the provincial Department of Education and Training. Those students who, having completed lower secondary schools and failed their entrance exams, go to the
private schools as the next available option. At the upper secondary level, public school supply is less than demand.
There is a private education sector in Vietnam, but it functions differently from that in most
other countries. While studying in public school, pupils take private supplement in form of extra classes, which are essentially private tutoring. Some argue that this is partly because
the half-day schooling is insufficient to cover the primary-school syllabus adequately. In fact, following Rolleston et al. (2013), Vietnamese children receive a relatively low number of hours of instruction by international standards, and many continue to only attend morning
classes. With an average of about 23–25 instructional periods per week, Vietnam has some of the lowest formal instructional hours in Asia. This has changed as many schools have moved to the full-day schooling system. The 2009–20 Vietnam Education Development
Strategic Plan includes the target of full transition to 30 instructional periods per week for all pupils by 2020, and 35 instructional periods per week by 2025. Recent MOET data (2014) show that the percentage of primary school students receiving full-day schooling increased
from 49.1 per cent in the academic year 2010-01 to 54.3 per cent in 2011-12, and to 54.7 per cent in the following academic year.
The general education students in Vietnam take many exams, including those at the national
scale. However, the results in such exams cannot be used to identify the national trend in
performance of the general education students, as the level of difficulty varies over the years.7 In 2012, for the first time Vietnam participated in PISA (Program for International Student Assessment). This is for 15-year-olds, who are expected to be in Grade 10 in upper
secondary schools. The results of PISA 2012 show that Vietnam ranked 17th, 19th, and 8th in maths, reading and science respectively. Figure 7 shows the average scores by regions (northern, central and southern) and by the type of school the students attend. For all the
subjects, the average scores of students from public schools are higher than those from private schools. Of the public schools, students in the southern region performed lower than
7 Grade 5 assessments in mathematics and Vietnamese reading have been implemented at a large-scale in 2001, 2007 and
2011. However, only the results for the 2001 assessment were published.

INEQUALITY IN EDUCATIONAL OPPORTUNITIES AND OUTCOMES: EVIDENCE FROM YOUNG LIVES DATA IN VIETNAM
16
the other regions. Public school students in the northern region came top in maths and science, while private schools students from the central performed lower than those of private schools from north and the south.
Figure 7. Student achievement in 2012 PISA, by regions and type of schools
Source: OECD PISA database
Figure 8 breaks down the inequality in student achievement in PISA 2012, and shows the
results of Vietnamese students by gender and by geographic sectors of school (rural, urban and mountainous areas). It shows the clear advantage of urban students and the disadvantage of students in remote areas. Lowland rural children sit in between the
aforementioned categories, and this applies across all the subjects.
Figure 8. Student achievement in 2012 PISA, by gender and geographic sectors
With respect to the gender gap, Figure 8 demonstrates that boys and girls perform about the same in science, but boys achieve slightly better than girls in maths. The gender gap is most
significant in reading scores, where girls perform higher than boys. That is the first time Vietnam participated in PISA, and therefore the results should not be interpreted as long-term, established facts. The PISA 2012 results for students in Vietnam are highly relevant as
400
450
500
550
Public Private Public Private Public Private
Math Science Reading
Northern Central Southern
400
450
500
550
Boys Girls Boys Girls Boys Girls
Math Science Reading
Rural Urban Remote areas

INEQUALITY IN EDUCATIONAL OPPORTUNITIES AND OUTCOMES: EVIDENCE FROM YOUNG LIVES DATA IN VIETNAM
17
the issue of inequality is the focus in this study. Together with the other dimensions in the consideration of inequality, the concept of remote areas is of political importance in Vietnam. Remote areas are often interpreted to include the mountainous areas, some coastal districts
and the islands. These are the areas with underdeveloped infrastructure, and generally poorer services than the average. That is particularly true in education. The mountainous areas are also the districts with a high concentration of ethnic minorities, which is another
important issue in the public debate on inequality in Vietnam.
3. Methodology
3.1 Sample and data
This study analysed data from the Young Lives international longitudinal study, which follows
around 12,000 children over 15 years from India, Ethiopia, Peru and Vietnam. Young Lives
follows two cohorts of children, the Younger Cohort (born in 2001 and 2002) and the Older Cohort (born in 1994 and 1995). The study has collected information about the family and the child from four rounds of surveys carried out in 2002, 2006, 2009 and 2013. Additionally, in
2011-12, school survey data were collected from a subsample of 1,138 Younger Cohort children.8 In this study, we use data collected in four household surveys of both cohorts and the school survey.
The Young Lives study sample consists of 20 sentinel sites in five provinces. The sampling process is pro-poor, but other than that it captures a certain degree of diversity of Vietnam.
First, the sites locate in all three parts: north, central, and south. Second, they cover the urban, delta, coastal and mountainous areas. These geographical divisions have an important difference on socio-economic development. In each of the chosen provinces, there were two
communes from the poor group, one from the average, and one from the above average group (combined better off and rich). Among the 31 communes selected, 15 communes were from the poor group (48 per cent), nine were from the average (29 per cent), and the
remainder (seven communes, 23 per cent) were from the above average (Tran et al. 2003).
Table 4 shows that the initial sample consisted of 2,000 Younger Cohort children and 1,000
children in the Older Cohort. By Round 4, however, the numbers decreased to 1,928 and 886, respectively. Thus, the attrition rates are 3.6% and 11.4% for the Younger Cohort and
Older Cohort respectively. For the presentation in the sections thereafter, we work only with the panel, which consists of subjects who are present in all the rounds of Young Lives surveys to 2013. Note that the sizes of panels are slightly lower than that of corresponding
samples in Round 4.
8 The 2011 school survey in Vietnam collected data on Grade 5 pupils only. The school survey included all the Grade 5 classes that
were attended by one or more Younger Cohort children in September 2011. Following a randomisation procedure, the sample of Younger Cohort children was augmented by adding their class peers to a class-level total of 20 pupils. The final sample consists of 3,284 Grade 5 pupils, with two thirds non-Young Lives children (for more information, see Rolleston et al. 2013).

INEQUALITY IN EDUCATIONAL OPPORTUNITIES AND OUTCOMES: EVIDENCE FROM YOUNG LIVES DATA IN VIETNAM
18
Table 4. Number of children by round and cohort
Round 1 (2002) Round 2 (2006) Round 3 (2009) Round 4 (2013) Panel
Younger Cohort 2000 1970 1961 1928 1912
Older Cohort 1000 990 972 886 877
Source: Young Lives study (2002, 2006, 2009, 2013)
3.2 Young Lives instruments
The analyses in this study rely on the longitudinal survey data and that of school survey. In
each survey, in addition to data collected following the child and household questionnaires,
Young Lives teams apply instruments to measure achievement in mathematics, reading comprehension and receptive vocabulary of all the children. This section explains the main characteristics of the tests used in this paper.9
One of the most important measures of cognitive achievement applied in Young Lives is the
Peabody Picture Vocabulary Test (PPVT). This test measures children´s receptive vocabulary. In the test, the examiner shows four pictures and asks the child to choose the picture that represents the word read by the examiner. This test has been administered to the
Younger Cohort in Rounds 2, 3 and 4. For Young Lives Vietnam, version III (204 items, Dunn and Dunn 1997) has been used in all the rounds since the age of 5. As mentioned in previous section, several ethnic minority languages were only taught as a subject but not
used as a medium of instruction. During the PPVT session, if an ethnic minority child requests, they can be assisted by a local translator, but the PPVT materials were in Vietnamese only. All the children in Vietnam took PPVT in Vietnamese.
At age 5, the quantitative sub-scale of the Cognitive Development Assessment (CDA) test was administered.10 The task for children in this test was to pick an image from a selection of
three or four that best reflected the verbalised concept, such as, few, most, nothing, etc. The maximum score for this CDA test is 15, one for each correct answer (Cueto et al. 2009).
The maths test in Round 3 (for 8-year-olds) consists of two sections administered in eight
minutes. The first section, of nine items, aims to measure basic quantitative and number
concepts. The second section includes 20 items that aim to measure ability to perform basic mathematics operations with numbers (addition, subtraction, multiplication and division).
In Round 4, a maths test was administered again for the Younger Cohort. This test consists
of 34 items that aim to assess skills in basic mathematics operation with numbers (addition,
subtraction, percentages and fractions). In Round 4, the mathematic operations involve both whole numbers and decimals. For the 12-year-olds, it also measures skills in solving mathematics problems.
For the Younger Cohort, in Round 4 a reading test was also administered. This test aimed to measure reading comprehension. The 12-year-old children read three texts from Vietnamese
literature (novel, poetry, or other) with a total length of about 600 words. Achievements are measured by the number of correct answers to 30 questions about the contents of the texts the children read.
9 For psychometric characteristics of tests in Round 3, see Cueto and Leon (2013). The description of school survey data can
be found in Rolleston et al. (2013)
10 The standard test of CDQ consists of three subtests, which are spatial relation, quantity and time.

INEQUALITY IN EDUCATIONAL OPPORTUNITIES AND OUTCOMES: EVIDENCE FROM YOUNG LIVES DATA IN VIETNAM
19
For the Older Cohort, the PPVT test version III (204 items, Dunn and Dunn, 1997) has been
administered in Rounds 2 and 3. A maths test was administered for the Older Cohort in Round 3, which consists of two sections. The first aims to measure ability to perform basic
mathematics operations: addition, subtraction, multiplication, division and square roots, using both whole numbers and fractions. The first section consists of 20 questions. Section 2 for Older Cohort contains 10 items on mathematics problem-solving; all were items that were
publicly available from TIMMS and PISA (Cueto and Leon 2013). The total score for children in mathematics was obtained from adding the correct responses. Furthermore, in Round 3, the Older Cohort children took a reading test (Cloze). This test contains 24 items, where
children were asked to read a sentence and complete it with the one or more words that were missing. This test measures knowledge in vocabulary and comprehension.
The Older Cohort also took maths and reading tests in Round 4. The maths test included 27
items that are used to measure the child’s ability to perform basic mathematics operations
with two or more digits of decimals, fractions and whole numbers. It also measured the ability to solve problems that model real-life situations by applying maths concepts, including in geometry and reading graphs. Finally, the reading test consists of 24 items. The Older
Cohort children were given four texts of a total length close to 1,700 words, or three times as long as for the Younger Cohort. These items aimed to measure reading comprehension by retrieving information and making inferences based on the texts.
3.3 Core variables
We use a core set of variables to present certain important dimensions of inequality among
the children. The dimensions of inequality considered in this study are commonly debated in
international development. Gender gap has always been an important issue in nearly all countries, and highly relevant for low and middle-income countries. As will be seen below, in this study the gender gap is generally beneficial for girls in education in Vietnam.
The concept of remote areas is highly relevant for development policy in Vietnam as districts in remote areas are often among those that are socio-economically underdeveloped. Remote
areas in Vietnam include mountainous areas and some of the coastal districts. For this study, the province of Lao Cai, the coastal district of Binh Dai in Ben Tre, and three sites in Phu Yen (one mountainous and two coastal) are included in the category of remote areas. The
geographical variable is determined as equals 0 if the variable indicates urban. For rural communities, the geographical variable takes value 1 if the site is in delta, and 2 if in the uplands and coastal areas.
It also has been well-documented in general literature on child development that maternal
education and wealth index have been found to be strongly associated with long-term educational outcomes (Glewwe et al. 2014). In this study, the variable on maternal education is given values according to the levels of schooling the child’s mother has completed: 0-
mother not completed the primary level; 1- completed primary, but not lower secondary school; 2- completed lower secondary but not upper secondary education; and 3- completed upper secondary school. The variable on wealth index is the most-used measure of the
socio-economic status for the child’s household. It is a composite score based on assets at home, access to public services and quality of the house infrastructure (see Young Lives (2002) for the method of calculation of wealth index in Round 1). We use the top and the
bottom quintiles in the wealth index of Round 1 to present inequality.

INEQUALITY IN EDUCATIONAL OPPORTUNITIES AND OUTCOMES: EVIDENCE FROM YOUNG LIVES DATA IN VIETNAM
20
In addition to the covariate consideration, we also apply factor analysis to study the
vulnerability of the children. The idea is that certain groups of children, such as those in disadvantageous areas, and with mother having not completed primary school, and in the
bottom quintile of wealth index, are considered more vulnerable than ones with low wealth index but with their mother having upper secondary education. To capture that concept of vulnerability, we create a single common factor, which is a composite score based on the
variables that are important for inequality. First is geographical, as defined above. Second is maternal education with the values from 0 to 3 depending on the mother’s level of schooling. The final one is the wealth index quintiles in Round 1. Factor analysis shows that the
common factor explains 71 per cent of the variance for the Younger Cohort, and 66 per cent for the Older Cohort.11 For our analysis, we divided the common factor in quintiles and presented the top quintile (referred to as the least vulnerable) and the bottom quintile
(referred to as the most vulnerable). These are the extreme groups presented in the analysis below. Table 5 presents the number of boys and girls in each extreme group.
Table 5. Number of children by group and cohort
Younger Cohort Older Cohort
Gender
Boys 984 417
Girls 928 460
Geographical
Urban 358 161
Uplands and remote coastal 870 402
Maternal education
Lower secondary or more 759 371
Incomplete primary or none 465 234
Baseline wealth index
Top quintile 354 159
Bottom quintile 385 179
Extreme groups
Least vulnerable 377 170
Least vulnerable (boys) 187 87
Least vulnerable (girls) 190 83
Most vulnerable 398 180
Most vulnerable (boys) 191 83
Most vulnerable (girls) 207 97
Source: Young Lives study (2002, 2006, 2009, 2013)
The categories of the children in the above table will be used in sections 4-7 to present
different dimensions of inequality among the Young Lives children. The dimensions of inequality are considered in four stages of development of children, from early childhood to early adulthood.
11 We ran “factor var1, var2, var3 if panel == 1, pcf” in STATA 14. The uniqueness is the percentage of variance for the variable
that is not explained by the common factor. The uniqueness for the factor operations performed for both sets of data (Older Cohort and Younger Cohort) are favourable, as the highest value of the uniqueness is 0.36 and 0.45 for the Younger Cohort and Older Cohort, respectively. That can be interpreted as over half of any of the var1, va2, and var3 are explained by the (single) common factor.

INEQUALITY IN EDUCATIONAL OPPORTUNITIES AND OUTCOMES: EVIDENCE FROM YOUNG LIVES DATA IN VIETNAM
21
4. Findings
4.1 Early childhood: preschool education
Over the years of the Young Lives study up to Round 4, many of the children spent two years
in preschool programmes and others enrolled in such programmes for one year only. Both of these cases comply with the government regulation.12 The Younger Cohort children were born in 2001 and 2002. The children born in 2002 may start the preschool programme late in
2007, when the majority of children born in 2001 have already moved to primary schools. To analyse the data on education history, we have to rely on the data for all the academic years up to 2007/08.
For Table 6, we use the data on attending any preschool programme any time up to academic
year 2006-07 for children born in 2001, and up to the academic year 2007-08 for children born in 2002.13 It can be clearly observed that universalisation has not been achieved, as about 12 per cent of the 5-year-old children did not attend any form of preschool or primary education
by the aforementioned academic years, corresponding to years of birth. The non-attendance rate is even higher for the poor, about 21 per cent for the bottom quintile in wealth index, and 19 per cent for the most vulnerable boys. Furthermore our calculations show that only 48 per
cent of the 4-year-old children attend preschool programmes. This implies that a majority of the Younger Cohort did not attend a preschool programme for the whole two years.
Table 6. Attendance at preschool programme at age 5 (Younger Cohort)
Public Private Other type Primary school*
Did not attend
Average (of Younger Cohort) 76.6 9.1 1.4 1.3 11.6
Gender
Boys 78.2 7.7 1.4 1.5 11.2
Girls 74.9 10.5 1.4 1.0 12.2
Gap (%) 3.3 -2.8 0.0 0.5 -1.0
Geographical
Urban 45.4 41.8 2.7 1.2 9.0
Uplands and remote coastal 83.1 0.7 1.1 1.6 13.6
Gap (%) -37.7 41.1 1.6 -0.4 -4.6
Maternal education
Lower secondary or more 72.8 16.2 1.7 0.8 8.4
Incomplete primary or none 76.4 1.6 1.5 1.4 19.1
Gap (%) -3.6 14.6 0.2 -0.6 -10.7
Baseline wealth index
Top quintile 57.6 32.0 2.2 0.59 7.67
Bottom quintile 76.4 0.3 0.7 1.69 20.9
Gap (%) -18.8 31.7 1.5 -1.1 -13.2
12 Prime Minister Decision 239/QĐ-TTg of February 2010 on Universalisation of Pre-schooling for 5-year-old children
13 For the Older Cohort, data on preschool education are only partially available. In the Young Lives data of Vietnam, the earliest data on education history for the Older Cohort are from academic year 2000-01, in which two-thirds of the Older Cohort children were already in primary school, while only 20 per cent were in a preschool programme.

INEQUALITY IN EDUCATIONAL OPPORTUNITIES AND OUTCOMES: EVIDENCE FROM YOUNG LIVES DATA IN VIETNAM
22
Public Private Other type Primary school*
Did not attend
Extreme groups
Least vulnerable 63.2 27.6 1.8 0.6 6.8
Least vulnerable (boys) 65.6 26.5 1.9 0.6 5.4
Least vulnerable (girls) 60.8 28.6 1.8 1.0 8.2
Most vulnerable 79.8 0.0 0.8 1.2 18.1
Most vulnerable (boys) 79.1 0.0 0.5 1.0 19.4
Most vulnerable (girls) 80.6 0.0 1.1 1.5 16.8
Gap (%) -16.7 27.6 1.0 -0.7 -11.3
Note: * the data on children in primary school is based on data for 2006-07
The gender gap in preschool attendance is insignificant in general. However, girls are more
likely to attend the private preschool programme, while boys are more likely to attend the public preschool programme, in such a way that the gender gaps for these types of preschool
programmes offset each other. The pattern of the opposite sites for the gender gap for the private (versus the public) preschool attendance is due to that of the least vulnerable group of children. Thus, it links to the fact that among the well-to-do households (or those with a
well-educated mother, or urban), girls are more likely to attend private preschools, so that the private/public ratio for girls is higher than that for boys. Other than the advantageous groups, private enrolment for preschool education in Vietnam is very fractional and the rate of
participation in the private preschool is zero for the group of the most vulnerable children. The most significant gap in the public attendance is between geographic areas (urban versus uplands and remote coastal). The private preschool programmes are concentrated in the
urban sector. Likewise, the rate of attendance at the private preschool programme is significant for the top wealth index quintile, which overlaps mostly with the urban sector.
With respect to the Older Cohort, in the earliest available data on preschools, we found 20
per cent of the Older Cohort attended preschool in 2001-02.14 In the academic year 2001-02
public preschool goers account for 95 per cent, and the remaining 5 per cent attended private preschool. The implication of this is that the private/public ratio among preschool goers in 2006-07 (for the Younger Cohort) was higher than that in 2001-02 (for the Older Cohort).
Table 7 presents the average scores of in cognitive tests at age 5. Note that all the tests
were administered in Vietnamese.15 Because the numbers of children going to other types of preschool programmes were quite small, we consider the performance for the two biggest types of preschool.16 Even so, the numbers of children going to private preschools are fewer
than ten for certain categories of children, and therefore the average performance figures are not statistically meaningful.
14 The majority of the Older Cohort were in Grades 1-2 in academic year 2001-2.
15 See 2.2 and 3.1 for more information about ethnic minority children.
16 Data in this study show no cases of mixed (private and public) experience.

INEQUALITY IN EDUCATIONAL OPPORTUNITIES AND OUTCOMES: EVIDENCE FROM YOUNG LIVES DATA IN VIETNAM
23
Table 7. Performance in cognitive tests at age 5 (2006)
PPVT (%) CDA (%)
Public Private Public Private
Average (of Younger Cohort) 18.0 25.1 65.7 74.3
Gender
Boys 18.4 26.0 66.1 74.5
Girls 17.6 24.3 65.2 74.2
Geographical
Urban 25.9 26.0 73.9 74.4
Uplands and remote coastal 16.0 NA 63.7 NA
Maternal education
Lower secondary or more 21.2 26.5 69.5 75.5
Incomplete primary or none 13.6 NA 58.2 NA
Baseline wealth index
Top quintile 25.0 26.5 73.4 75.5
Bottom quintile 12.8 NA 54.9 NA
Extreme groups
Least vulnerable 24.4 27.4 72.1 76.7
Least vulnerable (boys) 25.9 27.6 73.1 75.4
Least vulnerable (girls) 22.6 27.2 71.1 78.0
Most vulnerable 13.6 NA 56.2 NA
Most vulnerable (boys) 13.7 NA 56.2 NA
Most vulnerable (girls) 13.6 NA 56.2 NA
Gap 10.7 NA 15.9 NA
Note: Performance shown as percentage of correct answers. Source: Young Lives (2006)
Table 7 consistently shows that children who attend private preschools score higher than
children from the public preschool programme.17 However, the difference is quite small for certain groups, such as urban children and top quintile in wealth index. Moreover, with the
application of OLS regression, and having controlled for a set of characteristics such as gender, wealth index Round 1, mother’s education and urban location, we found the association of private preschooling (versus other types of preschool) statistically significant
on neither PPVT nor CDA scores at age 5 (see Table A1 in Appendix). One way to interpret the results of OLS regression is that the evidence in Table 7 about the higher scores for the children attending private preschools than the children attending public preschools need not
mean that private preschool experience caused an improvement in cognitive achievement at age 5. Instead, it implies that the children who attend private preschools performed better in the test because of the factors (urban, mother competed secondary school, or being wealthy)
that are associated with their parents’ choice of private preschools rather than public ones.
4.2 Middle childhood: 6–12 years
Enrolment at right age is an important indicator. As mentioned in Section 2, the Education Law 2009 (Viet Nam National Assembly 2009) requires that a child enrol in Grade 1 (of
primary school) at the start of the academic year in the year they become 6 years old. As the birth month does not matter, we worked with each of the years of birth and the data on
17 This outcome is different from that on PISA in Figure 7, for which the type of school is at age 15, while the preschool for the
figure in Table 7 is at ages under 6. Thus, it does not imply an inconsistency.

INEQUALITY IN EDUCATIONAL OPPORTUNITIES AND OUTCOMES: EVIDENCE FROM YOUNG LIVES DATA IN VIETNAM
24
education history to produce the figures in Table 8.18 As expected, the figures demonstrate the general trend that the rate of overage for the Younger Cohort is lower than that for the Older Cohort.
The gender gap is consistent, with the average of overage for girls slightly more favourable
than that for boys, except for one group. There is equal overage rate for girls and boys among the Older Cohort’s most vulnerable children. Between the sectors (urban versus upland and coastal), the gap is more significant (than the gender gap), while the overage rate
is small for the urban sector of the Younger Cohort. Similarly, the overage rate is close to zero for the top quintile in wealth index, as well as for the group of least vulnerable children of the Younger Cohort. That is not the case for the Older Cohort, for whom the overage rate is
about 10 per cent or higher. That is consistent with the claim that by 2005-06 Vietnam had not achieved universal primary education at the right age.
Table 8. Overage at ages 8 and 12 by cohort
Younger Cohort (%) Older Cohort (%)
Academic year 2008-09
Academic year 2012-13
Academic year 2001-02
Academic year 2005-06
Average 5.7 7.2 18.5 21.1
Gender
Boys 6.4 8.2 20.0 22.9
Girls 4.9 6.2 17.1 19.5
Gap (%) 1.5 2.1 2.9 3.4
Geographical
Urban 2.8 3.4 9.4 10.6
Uplands and remote coastal 9.3 12.3 24.1 28.3
Gap (%) -6.5 -9.0 -14.7 -17.7
Maternal education
Lower secondary or more 2.5 2.5 9.5 9.8
Incomplete primary or none 12.6 18.1 33.8 40.7
Gap (%) -10.1 -15.6 -24.3 -30.9
Baseline wealth index
Top quintile 3.4 3.1 10.7 11.9
Bottom quintile 14.2 20.3 34.3 42.1
Gap (%) -10.8 -17.2 -23.6 -30.2
Extreme groups
Least vulnerable 1.7 1.7 10.3 10.9
Least vulnerable (boys) 2.9 2.9 12.0 10.8
Least vulnerable (girls) 0.6 0.6 8.2 11.0
Most vulnerable 12.8 18.8 35.6 43.3
Most vulnerable (boys) 13.5 20.7 33.0 43.3
Most vulnerable (girls) 12.2 16.8 38.1 43.3
Gap (%) -11.1 -17.1 -25.3 -32.4
Source: Young Lives (2013)
More details on the enrolment and the progress through primary education for the millennium
children are presented in Table 9. We observe significant dispersal in the grades the Younger Cohort children attend classes. In 2006, when the oldest children of the Younger
18 In Vietnam, the academic year starts in September.

INEQUALITY IN EDUCATIONAL OPPORTUNITIES AND OUTCOMES: EVIDENCE FROM YOUNG LIVES DATA IN VIETNAM
25
Cohort were 5 years old, as many as 251 children were in primary schools, and seven years later one was in Grade 1, while three were in Grade 8 in secondary schools. More detailed analysis indicates that nearly 20 per cent of the children started Grade 1 early (by age 5), 75
per cent started in the year they became 6 years old, 4 per cent started at age 7; therefore, less than 1 per cent started after the age of 7. Furthermore, as close to 100 per cent progress to the next grade (except in 2006-07), the rates of combination of dropout and
grade repetition are relatively low, especially in the academic years 2008-12.
Table 9. Younger Cohort children in basic education schools, by years and grades
2006 2007 2008 2009 2010 2011 2012
Grade 1 (Primary) 246 1303 349 20 5 4 1
Grade 2 5 236 1273 348 23 7 4
Grade 3 5 237 1261 348 26 8
Grade 4 4 236 1259 349 26
Grade 5 (Primary final) 4 233 1254 350
Grade 6 (Secondary) 3 229 1250
Grade 7 3 223
Grade 8 3
Total 251 1544 1863 1869 1871 1872 1865
Progress to next grade (%) 94.8 97.5 98.7 98.8 98.9 98.7 NA
Note: the figures apply to the panel, e.g. only the children present in all four rounds of surveys.
Source: Young Lives study (2013).
The private aspect of the education system in Vietnam functions differently from private
schools in other countries. First, there have been very few private schools in the basic education in Vietnam, as Table 3 indicates clearly. Second, a large proportion of students
enrolled in public schools take extra private classes to complement their learning.
Table 10 shows the rate of participation in extra classes.19 For the Younger Cohort, close to
as many as two out of three students took extra classes at ages 8 and 12. The corresponding figure for the Older Cohort at age 12 is slightly over half, so there has been an increasing trend over time. The gender gap for the rates of taking extra classes is marginal. It is
impressive that even among the most vulnerable children, the rates of taking extra classes for girls and for boys are about equal, as it is for the group of least vulnerable children, even though rate for the latter group is different from that of the former.
19 As the number of hours the students take extra classes vary, the figures in Table 10 do not show the share of the private part in
the total education provision to the students.

INEQUALITY IN EDUCATIONAL OPPORTUNITIES AND OUTCOMES: EVIDENCE FROM YOUNG LIVES DATA IN VIETNAM
26
Table 10. Rate of participation in extra classes
Younger Cohort (%) Older Cohort (%)
Age 8 Age 12 Age 12
Average 64.8 64.4 53.9
Gender
Boys 65.8 63.1 52.4
Girls 63.8 65.8 55.4
Gap (%) 2.0 -2.7 -3.0
Geographical
Urban 70.3 86.9 86.3
Uplands and remote coastal 52.9 41.4 26.3
Gap (%) 17.4 45.4 60.1
Maternal education
Lower secondary or more 78.5 83.3 74.3
Incomplete primary or none 43.7 30.3 29.0
Gap (%) 34.8 53.0 45.3
Baseline wealth index
Top quintile 77.4 86.4 85.5
Bottom quintile 47.0 29.8 20.1
Gap (%) 30.4 56.7 65.4
Extreme groups
Least vulnerable 77.6 88.7 85.8
Least vulnerable (boys) 77.1 88.6 85.5
Least vulnerable (girls) 78.1 88.8 86.1
Most vulnerable 48.9 26.8 17.5
Most vulnerable (boys) 48.8 26.7 18.6
Most vulnerable (girls) 49.0 27.0 16.5
Gap (%) 28.7 61.8 68.3
Source: Young Lives study (2006, 2009, 2013).
The difference between the geographical areas is significant, and the gap between the urban
and the uplands and remote coastal for the Younger Cohort is significantly lower than that for the Older Cohort. This is mostly because the prevalence of extra classes increased in the
rural areas (from when the Older Cohort were age 12 to when the Younger Cohort were) more than in urban areas. As expected, the gap between the upper and the bottom quintiles in wealth index is large, as expenditure is the most important factor for one’s decision in
taking extra classes. With the top quintile, the rate of taking extra classes at age 12 for the Younger Cohort is about the same as that for the Older Cohort, but for the bottom quintile, the rate increased from 20 per cent in 2006 (for the Older Cohort) to 30 per cent in 2013 (for
the Younger Cohort).
The benefit of the extra classes has been under debate. Tran and Harpham (2005) found
that having extra classes was not significantly associated with 8-year-old children improving in writing and numeracy. However, the evidence in that study implied that children taking extra classes after school were more likely to be able to read correctly than children who did
not have the extra classes. Dang and Rogers (2008) reported mixed results on the impact of private tutoring on academic performance in some studies, and a positive impact of private tutoring on students' academic performance in other studies. Furthermore, the findings of Ko
and Xing (2009) suggest that there is a strong relationship between taking extra classes and the subjective well-being of children in Vietnam. Children taking extra classes tend to feel more satisfied about their lives than those who do not. Finally, Le and Baulch (2013) studied
whether participation in extra classes improves children’s cognitive (mathematics and receptive vocabulary) test scores, using Round 2 and 3 data of the Young Lives survey in

INEQUALITY IN EDUCATIONAL OPPORTUNITIES AND OUTCOMES: EVIDENCE FROM YOUNG LIVES DATA IN VIETNAM
27
Vietnam. Their findings suggested that participation in extra classes is generally not associated with higher cognitive test scores for either the Older or the Younger Cohort.
We now look at the inequality around the quality of education services in the communities of
the Young Lives children. As mentioned in Section 2, regional gap, or inequality between
geographical areas, presents an important issue for development in Vietnam. For Table 11, the division into geographical sectors is based on the classification of vulnerable groups in subsection 3.2, with a slight modification. We keep the categories of urban delta, while the
disadvantageous areas (value “2”) are further divided into separate uplands and coastal areas.
The school survey in 2012-13 provides an in-depth dataset on the characteristics of the
schools and teachers of the Young Lives children, who were in Grade 5 in the academic years the school survey was conducted. All the schools are at primary level. Table 11 shows
that the rate of principals having university degrees is higher in urban areas than other areas. For the uplands and coastal areas, less than half of school principals had completed university. Likewise, schools in delta areas own no tap water and only a fraction of the
schools in rural areas own these facilities. Nearly every urban pupil has access to computers and the internet, while only one in eight children in uplands areas (in Lao Cai and a cluster in Phu Yen) has access to such facilities. This is a lost opportunity for rural children.
Furthermore, only one in three children in coastal areas are in schools that offer full-day schooling to every pupil. Full-day schooling is important, because the (standard) half-day schooling model has been considered disadvantageous.
Table 11. School characteristics
Urban Delta Coastal Uplands
Principal with university degree 100 81.8 45.5 48.1
School owns tap water 76.3 0.0 20.0 14.3
Laboratory 97.9 88.0 73.6 59.0
Computer (for student use/learning) 97.5 23.9 41.7 12.7
Internet (used by students) 97.5 19.1 20.2 12.7
Offer full-day schooling to all pupils 61.4 44.2 32.5 62.7
Source: Young Lives school survey 2011-2
For the Grade 5 students, each class has a teacher, and the characteristics of the teacher
may add to the inequality in education services between regions. Table 12 looks at the qualifications of teachers. With respect to the teachers’ degree, the pattern is similar to
principals’ qualifications in Table 11. However, if we look at indicators on experiences, and teacher performance in maths and Vietnamese tests, we found little difference across areas. In fact, teachers in urban schools have almost the same experience as the teachers in
schools in other areas, and the average scores in tests are no higher than those for teachers in schools in delta areas.
Table 12. Class teacher characteristics (2010)
Urban Delta Coastal Uplands
Has completed university (%) 68.2 39.4 22.8 39.2
Teaching experience (years) 17.4 17.7 17.5 17.0
Raw score in maths 12.2 12.5 11.2 11.9
Raw score in Vietnamese 17.4 17.7 16.0 16.4
Does extra work to supplement income (%) 2.1 19.9 35.1 7.8
Meets students’ parents more than three times a year (%) 87.3 66.1 41.6 72.6
Source: Young Lives school survey 2011-2

INEQUALITY IN EDUCATIONAL OPPORTUNITIES AND OUTCOMES: EVIDENCE FROM YOUNG LIVES DATA IN VIETNAM
28
Low salary is one of the most important factors that might lead to not all teachers being fully
dedicated to their professional duties. The implication is that teachers often do other work to supplement incomes, and if that is the case, then this affects their quality of teaching. We
found that only 2 per cent of teachers in urban schools do extra work, while as many as 20 per cent of teachers in delta areas and 35 per cent in coastal areas do extra work to supplement their incomes. Moreover, teachers in urban schools meet students’ parents more
than three times per year in higher numbers than teachers from any other type of area.
Table 13 shows the averages of cognitive scores for certain categories of Younger Cohort
children. The scores are the percentage of correct answers in maths and reading tests. The results on gender gap dismiss any idea of boys performing better than girls. In fact, girls do
as well as boys do, and the average score in reading Vietnamese of girls is slightly higher than that of boys.
Table 13. Achievement in mathematics and reading: Younger Cohort at age 12 (Round 4)
Maths Reading
Average 50.0 49.2
Gender
Boys 49.1 47.2
Girls 50.9 51.4
Gap (%) -1.8 -4.2
Geographical
Urban 54.8 54.4
Uplands and remote coastal 44.6 44.6
Gap (%) 10.2 9.8
Maternal education
Lower secondary or more 57.0 54.9
Less than primary education 38.6 39.6
Gap (%) 18.5 15.4
Baseline wealth index
Top quintile 59.2 56.8
Bottom quintile 38.7 39.4
Gap (%) 20.5 17.3
Extreme groups
Least vulnerable 61.0 58.1
Least vulnerable (boys) 60.9 55.4
Least vulnerable (girls) 61.2 60.9
Most vulnerable 38.3 38.5
Most vulnerable (boys) 37.4 36.7
Most vulnerable (girls) 39.1 40.3
Gap (%) 22.8 19.7
Source: Young Lives study (2006, 2013)
As expected, the difference between the geographical areas (urban versus uplands and
coastal) is significant. However, the inequality is even more noticeable by mother’s level of education or by wealth index quintiles. Children from the poorest quintiles (in wealth index) correctly answered less than 40 per cent of the questions (both in maths and reading tests),
while children in the top quintile correctly answered close to 60 per cent in maths and slightly less than that in reading Vietnamese. The same pattern exists when considering the division

INEQUALITY IN EDUCATIONAL OPPORTUNITIES AND OUTCOMES: EVIDENCE FROM YOUNG LIVES DATA IN VIETNAM
29
into the most vulnerable and the least vulnerable groups. Further breakdown of these groups by gender presents similar results about inequality in cognitive achievement.
4.3 Adolescence: 13-16 years
At the older ages, there are more cases of class repetition and dropouts. For Table 14, the
concept of overage applies only to the adolescents, who currently going to school at Round 3, and does not apply to the dropout rate. The dropout rate is the percentage of children who
have left school by Round 3 not having completed lower secondary education. Furthermore, we define dropout deficit, which measures how far below Grade 9 the person left school. Dropout deficit is defined as: for the individual child, who either enrols in Round 3, or had
completed Grade 9, the deficit is zero. If one dropped by Round 3 completed grade x (x<9), then 9 − 𝑥𝑥 is taken as drop deficit. The figures in the last column in Table 14 are defined as the average of the positive dropout deficits.
Table 14. Overage, dropout and dropout deficit at age 15
Overage* (%) Dropout (%) Dropout deficit (year)†
Average 23.0 13.0 2.9
Gender
Boys 28.8 14.4 2.9
Girls 17.9 11.8 2.9
Gap (%) 10.9 2.6 -0.2
Geographical
Urban 20.0 6.9 2.3
Uplands and remote coastal 25.6 20.2 3.2
Gap (%) -5.6 -13.3 -0.9
Maternal education
Lower secondary or more 13.6 3.0 1.9
Less than primary education 43.1 31.3 3.2
Gap (%) -29.5 -28.4 -1.3
Baseline wealth index
Top quintile 13.5 3.8 NA
Bottom quintile 38.9 35.2 3.4
Gap (%) -25.4 -31.4 NA
Extreme groups
Least vulnerable 12.8 2.6 NA
Least vulnerable (boys) 14.1 2.4 NA
Least vulnerable (girls) 11.3 2.7 NA
Most vulnerable 43.8 31.6 3.3
Most vulnerable (boys) 55.1 36.1 3.3
Most vulnerable (girls) 33.9 27.3 3.3
Gap (%) -31.1 -29.1 NA
Note: * unit: percentage of the enrolling in R3; † we use “NA” for categories with less than ten observations with positive dropout deficits. Source: Young Lives study (2009).
We see some gender gaps in Table 14, and the statistics for girls are at least as good as for boys, with a small exception with respect to rate of dropout among the least vulnerable
children. For the most vulnerable children, more than third of the boys have already left school without completing lower secondary education. For the most vulnerable boys, who enrol in Round 3, over half are overage. Finally, of the children who have left school by

INEQUALITY IN EDUCATIONAL OPPORTUNITIES AND OUTCOMES: EVIDENCE FROM YOUNG LIVES DATA IN VIETNAM
30
Round 3 without completing lower secondary education, we found the average deficit is around three years, with virtually no gender gap in this matter. The largest deficit is for the bottom quintile in wealth index.
We now consider the children with a dropout deficit of zero. These are those who have either
completed lower secondary education, or are still in school to meet that goal. Figures in the first two columns of Table 15 concern the age of the children, who have completed lower secondary education. Children born in 1994 must have completed Grade 9 in the academic
year 2008-09 or earlier to be considered as having completed lower secondary education on age. Similarly, children born in 1995 who complete lower secondary education in summer 2010 are considered to have completed lower secondary education on age. Overall, the rate
of completion of lower secondary education on age is slightly above 70 per cent, but for boys it is lower than 70 per cent. By age 15, slightly over 10 per cent of both girls and boys had completed lower secondary education overage. There remain a few more per cent still
working toward completion of LSE. The girls in the least vulnerable category perform best as nearly 90 per cent of them completed on age and none were in lower secondary education schools at age 15.
Table 15. Completion of lower secondary education by age 15 (Older Cohort)
Completed lower secondary education
on age
Completed lower secondary education
overage
Still in lower secondary education
Average 71.8 11.4 3.8
Gender
Boys 68.8 12.7 4.1
Girls 74.5 10.3 3.5
Gap (%) -5.6 2.4 0.6
Geographical
Urban 78.8 11.9 2.5
Uplands and remote coastal 63.3 11.7 4.7
Gap (%) 15.4 0.2 -2.2
Maternal education
Lower secondary or more 87.3 8.6 1.1
Less than primary education 46.8 13.7 8.2
Gap (%) 40.5 -5.1 -7.1
Baseline wealth index
Top quintile 84.3 10.7 1.3
Bottom quintile 45.8 11.7 7.3
Gap (%) 38.5 -1.0 -6.0
Extreme groups
Least vulnerable 86.5 10.3 0.6
Least vulnerable (boys) 84.3 12.0 1.2
Least vulnerable (girls) 89.0 8.2 0.0
Most vulnerable 45.9 14.3 8.2
Most vulnerable (boys) 43.3 12.4 8.2
Most vulnerable (girls) 48.5 16.2 8.1
Gap (%) 40.6 -4.0 -7.5
Note: the figures in a row do not add up to 100, due to dropout.
Source: Young Lives study (2009).

INEQUALITY IN EDUCATIONAL OPPORTUNITIES AND OUTCOMES: EVIDENCE FROM YOUNG LIVES DATA IN VIETNAM
31
Mother’s education is a good predictor for that of the child. If a mother completed lower
secondary education or more, then with a likelihood of over 95 per cent her child completed lower secondary education at age 15. On the other hand, among the 15-year-olds with a
mother having not completed primary school, we found over 30 per cent of the children have dropped out, not completing lower secondary education. Regional gap, measured by the difference between the urban and the disadvantageous areas of uplands and coastal, is
substantial for the rate in completion on age, but fractional in the rate of completion overage. This pattern applies to the division into the top versus bottom quintiles in wealth index.
Finally, we look at the cognitive achievements of the 15-year-olds. Table 16 presents the
percentage of correct answers in tests on reading and maths. We observe that girls perform
at least as well as boys in both tests and that this is true for the least vulnerable and the most vulnerable children. We also observe that the advantageous groups (urban, mothers have completed lower secondary education, and the top quintile) have better achievements than
the corresponding disadvantageous groups (uplands and coastal, mother have not completed primary school, and the bottom quintile in wealth index). Unsurprisingly, the least vulnerable group score higher than the most vulnerable groups, by 20 per cent and 30 per
cent in reading Vietnamese and maths, respectively.
Table 16. Achievement in maths and reading at age 15 (Older Cohort)
Reading (%) Maths (%)
Average 79.1 60.6
Gender
Boys 76.6 57.9
Girls 81.4 63.0
Gap (%) -4.8 -5.1
Geographical
Urban 84.2 70.4
Uplands and remote coastal 74.6 53.3
Gap (%) 9.7 17.1
Maternal education
Lower secondary or more 85.3 69.6
Less than primary education 68.2 46.6
Gap (%) 17.1 23.0
Baseline wealth index
Top quintile 87.4 74.2
Bottom quintile 66.7 46.6
Gap (%) 20.7 27.7
Extreme groups
Least vulnerable 88.7 76.5
Least vulnerable (boys) 87.8 76.2
Least vulnerable (girls) 89.8 76.8
Most vulnerable 67.4 44.6
Most vulnerable (boys) 63.0 41.8
Most vulnerable (girls) 71.6 47.3
Gap (%) 21.4 31.9
Source: Young Lives study (2009).

INEQUALITY IN EDUCATIONAL OPPORTUNITIES AND OUTCOMES: EVIDENCE FROM YOUNG LIVES DATA IN VIETNAM
32
4.4 Early adulthood: 17-23 years
Secondary education consists of two levels, and universalisation of lower secondary
education is a target set in the 2009 Education Law. A student, if starting school at the right age and making normal progress every year, is expected to complete upper secondary
education at age 18. Table 17 presents the following groups. First is the group of young adults, who have completed upper secondary. These include those who continue their education in tertiary educational institutions, as well as those who stopped schooling. The
second category consists of those, who had not completed upper secondary, but are in general education schools. The third category includes those who are no longer in school, but have completed lower secondary. The final category include dropouts (or have never
enrolled), no longer in school, and have not completed lower secondary education.20
Table 17. Education at age 19 (2013)
Completed upper
secondary
In school Completed lower
secondary, not enrolled
Dropout†
Average 57.7 10.1 26.1 13.1
Gender
Boys 50.6 8.9 31.4 14.4
Girls 64.1 11.3 21.3 12.0
Gap (%) -13.5 -2.4 10.1 2.4
Geographical
Urban 70.8 8.7 19.3 7.5
Uplands and remote coastal 46.0 10.9 29.4 20.2
Gap (%) 24.8 -2.2 -10.1 -12.7
Maternal education
Lower secondary or more 79.8 11.3 15.9 3.2
Less than primary education 24.4 8.5 38.9 31.8
Gap (%) 55.4 2.8 -23.0 -28.5
Baseline wealth index
Top quintile 80.5 11.9 13.8 3.8
Bottom quintile 25.1 8.4 35.2 35.2
Gap (%) 55.4 3.6 -21.4 -31.4
Extreme groups
Least vulnerable 86.5 12.2 9.6 2.6
Least vulnerable (boys) 81.9 13.3 13.3 2.4
Least vulnerable (girls) 91.8 11.0 5.5 2.7
Most vulnerable 22.3 10.2 40.1 32.1
Most vulnerable (boys) 15.5 9.3 43.3 36.1
Most vulnerable (girls) 29.0 11.0 37.0 28.3
Gap (%) 64.2 2.0 -30.5 -29.6
Notes: *Sum of the figures in a row can be greater than 100. Some of the young adults go to secondary technical/professional school after completion of upper secondary education.
†Dropout if child has not finished lower secondary education and not enrolled in 2013.
Source: Young Lives study (2013).
20 There are four cases of never going to school.

INEQUALITY IN EDUCATIONAL OPPORTUNITIES AND OUTCOMES: EVIDENCE FROM YOUNG LIVES DATA IN VIETNAM
33
At age 19, over 84 per cent of the Older Cohort have completed secondary school (either the
upper or the lower level), while 85 per cent of girls have. Girls are more likely to have completed upper secondary education, and less likely to have dropped out, than boys. We
found similar patterns in the advantageous versus disadvantageous categories. For instance, of the 19-year-olds from the least vulnerable category, 96 per cent have completed secondary education (either upper or lower), and under 3 per cent dropped out, while for the
19-year-olds from the most vulnerable category, fewer than two thirds have done with either level of secondary school and nearly a third have dropped out, not having completed lower secondary education.
We ran a Logit regression to consider the important determinants of dropouts (see Table A2
in Appendix). The results show that neither gender nor ethnicity is a factor behind the likelihood of dropping out. On the other hand, the results indicate that other things being equal, children in coastal districts are more likely to drop out of schools. We found the
coefficient for wealth index Round 1 is strongly statistically significant. This is consistent with the claim that poverty is one of the reasons for leaving school before completion of lower secondary education. Furthermore, our estimates are consistent with Le and Tran’s (2013)
finding that the ‘child’s performance is a major factor in explaining dropout’. Our figures suggest that the children who do well in maths test in the Round 2 survey are less likely to drop out (by age 19). While less strong, the association of scores in PPVT Round 2 with the
dropout incidence is also statistically significant (at 10 per cent). If the cognitive achievement in Round 2 is interpreted as a measure of the children’s ability, then the results of Logit regressions imply that both poverty and ability are important factors of school dropout.
We now look at how many of the upper secondary school graduates go on to tertiary
education and what type of school they go to. For our definition, the category of vocational and professional institutions includes colleges of education, vocational colleges, as well as the professional secondary and vocational secondary schools. In practice the applicants to
these professional/vocational schools are graduates from upper secondary schools. Table 18 shows that by age 19, around 35 per cent of children have enrolled in a higher education institution, university or vocational school.

INEQUALITY IN EDUCATIONAL OPPORTUNITIES AND OUTCOMES: EVIDENCE FROM YOUNG LIVES DATA IN VIETNAM
34
Table 18. Type of tertiary education at age 19
University (%) Technical, vocational schools (%)
Average 18.8 16.2
Gender
Boys 16.6 15.4
Girls 20.9 17.0
Gap (%) -4.3 -1.6
Geographical
Urban 25.5 19.9
Uplands and remote coastal 11.4 12.4
Gap (%) 14.0 7.4
Maternal education
Lower secondary or more 34.2 21.0
Less than primary education 3.8 9.0
Gap (%) 30.4 12.0
Baseline wealth index
Top quintile 38.4 18.9
Bottom quintile 2.8 10.1
Gap (%) 35.6 8.8
Extreme groups
Least vulnerable 46.8 19.2
Least vulnerable (boys) 42.2 20.5
Least vulnerable (girls) 52.1 17.8
Most vulnerable 3.0 8.6
Most vulnerable (boys) 1.0 6.2
Most vulnerable (girls) 5.0 11.0
Gap (%) 43.7 10.6
Source: Young Lives study (2013).
Girls are more likely to enrol universities than boys. That is the case overall as well as for the
least vulnerable and the most vulnerable groups. For all the advantageous categories, the 19-year-olds are more likely to enrol in universities than in technical/vocational schools. Of the top quintile, for example, the number of 19-year- olds enrolling in universities is double
that enrolling in tertiary professional schools. On the other hand, from the disadvantageous categories (uplands and remote coastal, mothers having less than primary education, and bottom quintile of wealth index), more students are in tertiary professional schools than in
universities.
Cognitive achievement of the 19-year-olds is assessed by tests in reading Vietnamese and
maths. These cognitive tests were conducted in Round 4, and Table 19 presents the percentages of correct answers for the Older Cohort children. On average, the young men
and women correctly answered over half of the questions in the reading test, but slightly below half of the maths questions. Women performed better than men in the reading test, but not in maths. This is particularly apparent in case of the least vulnerable group. There are
significant gaps between the advantageous and the disadvantageous groups for each of the pairs of categories. The largest gaps, however, are between the extreme groups. For instance, the average reading scores for the most vulnerable boys was half of that for the
least vulnerable boys. In maths, the average score for the least vulnerable children is one and a half of that for the most vulnerable children.

INEQUALITY IN EDUCATIONAL OPPORTUNITIES AND OUTCOMES: EVIDENCE FROM YOUNG LIVES DATA IN VIETNAM
35
Table 19. Cognitive achievement at age 19
Reading (%) Maths (%)
Average 57.9 48.4
Gender
Men 55.5 48.9
Women 60.1 48.0
Gap (%) -4.5 0.8
Geographical
Urban 61.8 51.0
Uplands and remote coastal 54.0 42.9
Gap (%) 7.8 8.1
Maternal education
Lower secondary or more 63.4 55.6
Less than primary education 48.4 36.9
Gap (%) 15.0 18.7
Baseline wealth index
Top quintile 65.6 57.9
Bottom quintile 47.2 37.0
Gap (%) 18.4 20.9
Extreme groups
Least vulnerable 67.7 60.8
Least vulnerable (boys) 66.5 63.6
Least vulnerable (girls) 69.2 57.6
Most vulnerable 45.8 34.9
Most vulnerable (boys) 42.2 33.7
Most vulnerable (girls) 49.1 36.0
Gap (%) 22.0 25.9
Source: Young Lives study (2013).
Finally, we present a larger picture on the whereabouts of the young adults in the education
system or labour market. That is important information about their development. In Figure 9, we can see that the 19-year-olds study, work, and do neither of these (in the ‘other’ block). The biggest group, which is more than one third of all the Older Cohort, are studying in
tertiary education institutions. This group consists of more females than males. To see what other factors are important determinants of tertiary education, we ran an OLS regression (see Table A3 in the Appendix). The figures show clearly that wealth index, mother’s level of
education and the child’s cognitive achievement (maths and receptive vocabulary in Round 2) are the most important factors. Again, the factors for inequality had existed long before the young people started their tertiary education.

INEQUALITY IN EDUCATIONAL OPPORTUNITIES AND OUTCOMES: EVIDENCE FROM YOUNG LIVES DATA IN VIETNAM
36
Figure 9. Occupation at age 19
Note: F for female and M for male.
Source: Young Lives (2013).
Slightly under a third work full time, and there are more males than female in the working only group. Over 10 per cent of the young men and women are still in general education
schools. Either in general education schools or in tertiary education, about one third of students combine working and studying. Of the young adults in the ‘other’ category, there are more females than males. In searching for the answer to whether schools in Vietnam provide
the right education for an industrialising economy, Baulch et al. (2012) provided evidence that suggests that there is currently not a strong demand for workers with either professional training or tertiary education in either low-value or medium-value manufacturing. They found
that labour market entrants with post-secondary qualifications in manufacturing earn wages that are, on average, only 40 to 50 per cent higher than those with primary education. Workers with post-secondary qualifications are likely to gravitate toward better-remunerated
jobs in government, administration and the services.
Our data show that by the age of 19, there are as many as 19 per cent of the women and five
per cent of the men were married (or living with a partner). The young people most likely to have married at a young age came from groups such as those in rural areas, the poorest
households, and from ethnic minority backgrounds (almost half of whom were married). In our sample, only one of the married women continues to study, and none of the married young men is in school.
4.5 Educational outcomes: gaps over time
Up to this point, we have considered the gaps between certain groups of Young Lives
children mostly at a specific point of time. In other contexts, we compared indicators between
two cohorts at a time of equal age, such as in Tables 8 and 10. In this section, we take advantage of the longitudinal study to present how the gaps are changing over time. Table 20 contains the figures on overage schooling at specific ages and dropout rates. Overage
schooling is the consequence of either late enrolment in Grade 1, or of grade repetition. For 8-year-olds the former is the main reason, but the latter becomes more important for the overage at older ages. Table 20 shows significant progress for education in Vietnam. The
Older Cohort enrolled in Grade 1 in 2000-01 and 2001-02, while the Young Cohort enrolled in
Education and work
Tertiary education (35%)
M:15.2% F:19.9%
University (18.8%) M:7.9% F:11.0%
Also work (6.3%) M:3.3% F:3.0%
Profesional (16.2%) M:7.3% F:8.9%
Also work (7.3%) M:3.9% F:3.4%
Only work (31.7%)
M:18.6% F:13.1% In school (10.1%) M:4.2% F:5.9%
Also work (2.9%) M:1.4% F:1.6%
Other (11.6%) M:4.7% F:7.0%
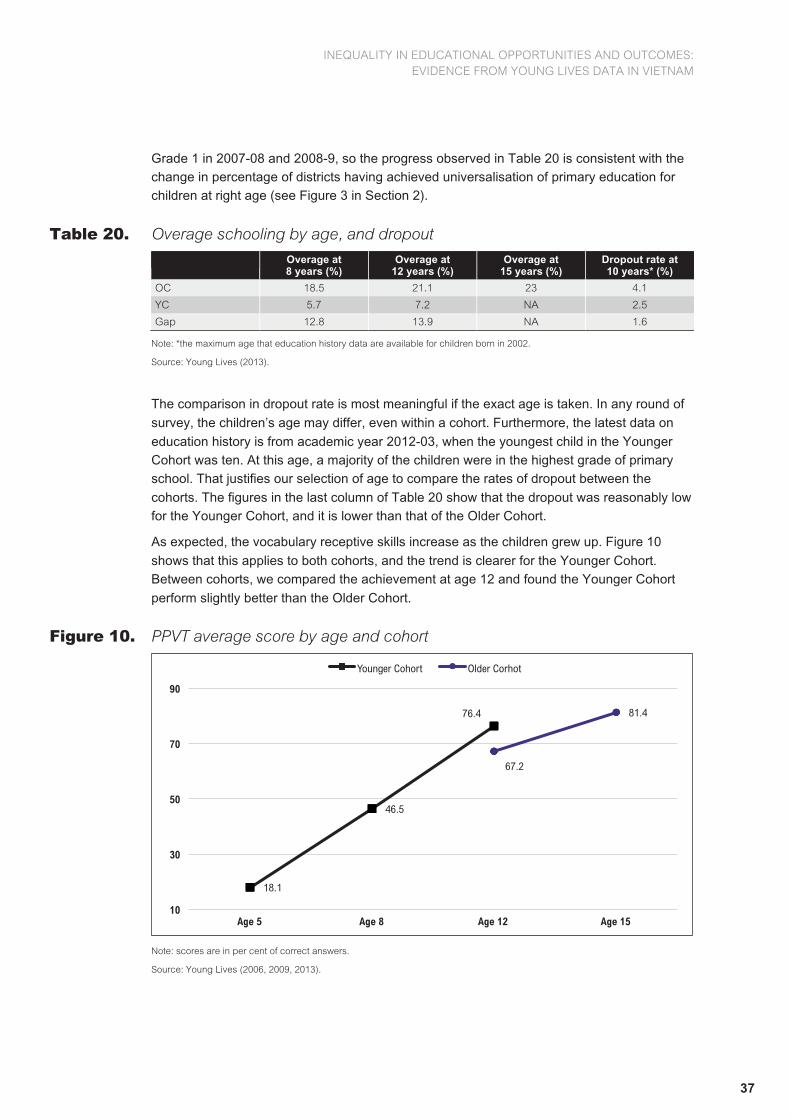
INEQUALITY IN EDUCATIONAL OPPORTUNITIES AND OUTCOMES: EVIDENCE FROM YOUNG LIVES DATA IN VIETNAM
37
Grade 1 in 2007-08 and 2008-9, so the progress observed in Table 20 is consistent with the change in percentage of districts having achieved universalisation of primary education for children at right age (see Figure 3 in Section 2).
Table 20. Overage schooling by age, and dropout
Overage at 8 years (%)
Overage at 12 years (%)
Overage at 15 years (%)
Dropout rate at 10 years* (%)
OC 18.5 21.1 23 4.1
YC 5.7 7.2 NA 2.5
Gap 12.8 13.9 NA 1.6
Note: *the maximum age that education history data are available for children born in 2002.
Source: Young Lives (2013).
The comparison in dropout rate is most meaningful if the exact age is taken. In any round of
survey, the children’s age may differ, even within a cohort. Furthermore, the latest data on
education history is from academic year 2012-03, when the youngest child in the Younger Cohort was ten. At this age, a majority of the children were in the highest grade of primary school. That justifies our selection of age to compare the rates of dropout between the
cohorts. The figures in the last column of Table 20 show that the dropout was reasonably low for the Younger Cohort, and it is lower than that of the Older Cohort.
As expected, the vocabulary receptive skills increase as the children grew up. Figure 10
shows that this applies to both cohorts, and the trend is clearer for the Younger Cohort. Between cohorts, we compared the achievement at age 12 and found the Younger Cohort
perform slightly better than the Older Cohort.
Figure 10. PPVT average score by age and cohort
Note: scores are in per cent of correct answers.
Source: Young Lives (2006, 2009, 2013).
18.1
46.5
76.4
67.2
81.4
10
30
50
70
90
Age 5 Age 8 Age 12 Age 15
Younger Cohort Older Corhot

INEQUALITY IN EDUCATIONAL OPPORTUNITIES AND OUTCOMES: EVIDENCE FROM YOUNG LIVES DATA IN VIETNAM
38
Furthermore, we consider some measure of performance by the extreme groups, which have
been feature throughout this study. It is clear in Figure 11 that the vocabulary receptive skills of the Younger Cohort children in both the least vulnerable and the most vulnerable groups
increased with age. However, the achievement gap between advantageous group and the disadvantageous group is consistently there in all the surveys.
Figure 11. PPVT score by age of Younger Cohort
Note: scores are in per cent of correct answers.
Source: Young Lives (2006, 2009, 2013).
5. Summary of findings and concluding remarks Since the start of the transition to a market economy, there have been many changes in the
education system. There are certain areas where the education system of Vietnam performed well and made progress. The achievement in universalisation of primary education
in over 95 per cent of districts by the end of the first decade of the twenty-first century is impressive. Recently, progress has been made so that preschool coverage has been close to 100 per cent, if we count only the 5-year-olds. Gender equality in schooling opportunity is
another important success. There is other evidence on well-performing students from Vietnam, such as in international Olympiad, and recent PISA. These are encouraging for a country that recently had a low-income economy.
There have also been arguments suggesting that there are a number of issues with the
education system, and that the government needs to take action to tackle these problems. One of the important issues that needs government intervention is inequality. Inequality in education can be seen in more than one dimension. First, the inequality between
geographical regions. Second, the gap between ethnic groups, with ethnic minorities often in the vulnerable groups. Finally, inequality in education links to that in socio-economic status (parental educational attainment and wealth). As the factors that link closely to inequality in
25
56.5
81.1
12.7
36.6
69.3
10
30
50
70
90
Age 5 Age 8 Age 12
Least vulnerable Most vulnerable

INEQUALITY IN EDUCATIONAL OPPORTUNITIES AND OUTCOMES: EVIDENCE FROM YOUNG LIVES DATA IN VIETNAM
39
education are themselves correlated strongly, we used Young Lives data on geographic sectors, mother’s education, and wealth index to create a single composite factor that is used to identify the least vulnerable group and the most vulnerable group in each of the Younger
and Older Cohorts. Pairing the least vulnerable and the most vulnerable groups is useful in analysing the education system.
Among the important education outcomes related to inequality are the shortage of private
preschools, and the almost absence of private schools for basic education. At the preschool
level, while as many as 42 per cent of urban 5-year-olds attend preschool programmes at private facilities, less than 1 per cent of the same age in the uplands and remote coastal areas do so. Almost none from the bottom quintile in wealth index attend preschool
programmes. One can observe the children with private preschool experience generally perform better in cognitive tests at age 5 than children who when to public preschool. Analysis, however, implies that the most important determinants of cognitive achievement
are ethnicity, wealth and mother’s education. For the receptive vocabulary, urban factors are also important. At the age of 5, the gender gap in cognitive achievement is insignificant.
For most of the middle childhood years, children go to primary schools. We found that 95 per
cent of the Younger Cohort children started primary school by age 6, and 4 per cent started
at age 7. Furthermore, the rate of grade repetition is relatively low as the percentage progressing to the next grade is quite close to 100 per cent. Even though the rate of overage is low generally, there is inequality here, and the biggest gap is between the least vulnerable
and the most vulnerable groups. We found significant progress in reducing the rate of overage over the seven years from the time the Older Cohort started school in 2001 to the time the Younger Cohort entered primary school. Surprisingly, we found close similarity in
teachers’ qualifications in primary schools across all geographical areas of Vietnam. This included the rate of the Grade 5 teachers having university degrees, teaching experience, and the teacher scores in tests in maths and Vietnamese reading. On the other hand, the
biggest inequality between geographical areas relates to the school infrastructure, particularly in access to computers, the internet, and tap water.
The adolescence years started while most of the children were in lower secondary schools.
At age 15, over 10 per cent have left school, not having completed lower secondary education, and for the most vulnerable group, over 36 per cent of boys and 27 per cent of
girls have left school before completion of Grade 9). The adolescents who have dropped out without lower secondary education, on average, have completed less than Grade 6 before leaving school. For those still in school, nearly three in ten boys and two in ten girls are
overage. The corresponding figures for the most vulnerable group are over half of boys and a slightly over a third of girls. On the other hand, the figures for the least vulnerable group are 14 per cent of boys and 11 per cent of girls.
By age 15, over 80 per cent of children have completed lower secondary education, mostly
on age. Mother’s level of education is found the best predictor. If a child’s mother had nine years of schooling, then the child will be 95% sure to have completed lower secondary education at age 15, with fewer than 10 per cent overage. With the disadvantageous groups
(with mother having no primary education, the bottom wealth index quintile, and the most vulnerable) on the other hand, only about 60 per cent of children completed lower secondary education by age 15, on age or overage. By age 15, there remain as many as 4 per cent of
children still in basic education school, and the figure for the most vulnerable groups is as high as 8 per cent.

INEQUALITY IN EDUCATIONAL OPPORTUNITIES AND OUTCOMES: EVIDENCE FROM YOUNG LIVES DATA IN VIETNAM
40
The gaps between the pairs of advantageous versus disadvantageous groups become even
larger for data on the completion of upper secondary education. The difference between the least vulnerable group and the most vulnerable group is as large as 64 percentage points.
Only 15.5 per cent of boys (22 per cent of girls) in the most vulnerable groups completed upper secondary education, while 82 per cent of boys (and 92 per cent of girls) in the least vulnerable groups have done so at age 19. Having completed upper secondary school, over
one third of the young adults went on to a tertiary education institution, with slightly more to university than to technical/professional institutes, which include the pedagogical colleges. Again, the universities are mostly for the advantageous groups, with only few per cent of the
students from the bottom wealth index quintile and from the most vulnerable group. More students (10 per cent or so) from the poor and vulnerable groups attend the other types of tertiary education institution, but not as many as students from the advantageous groups.
Private education in Vietnam should be considered differently from that in many other
countries. At the level of basic education, the proportion of students going to private schools in Vietnam is close to zero. At the upper secondary level, there are more students, but some of the upper secondary students are there because of failing the entrance exams to the
public upper secondary schools. The other form of private education service, which is private tutoring, involves more students. Private tutoring takes place in extra classes, which are the private supplement to public education. The reports on the merits of the extra classes have
been mixed. One of the important issues related to the extra classes is inequality related to attendance. The government of Vietnam has applied some measures to restrict them, for instance prohibiting teachers from giving extra classes to students with a full-day (versus a
half-day) curriculum.
Inequality in cognitive achievement exists between the groups of children and adolescents in
this dataset. Urban children performed better than their counterparts from uplands and coastal areas, children in the top quintiles of wealth index score higher than children from the
bottom wealth index quintile, and children of mothers with lower secondary schooling did better than children of mothers having no primary education. This evidence is mostly consistent across cohorts, through the stages of development, at ages 8, 12, 15 and 19. The
aforementioned factors (geographical region, mother’s level of education, and household wealth) were there in the early childhood, so the inequality prevailed even before the children started school. However, where a comparison is possible, such as receptive vocabulary, rate
of overage, or dropout, we found the cognitive/educational outcomes for the Younger Cohort are generally more favourable than that for the Older Cohort.
The gender gap slightly in favour of girls is also observed in tertiary education in Vietnam. More than one third of the Older Cohort are studying in tertiary education institutions. In
contrast, more males than females are in the ‘working only’ group, which counts for a slightly under a third of the 19-year-olds in this study. As a result of the economic integration, manufacturing enterprises in Vietnam are of either low-value or medium-value in the global
economy’s value chains, and for that reason, the demand for workers with either professional training or tertiary education is not a strong. This presents a challenge for young people in the transition from tertiary school to labour market.
Ethnic gap is always important issue in reports on the socio-economic development of Vietnam. The evidence shows the significance of an ethnic gap in education. In the findings based on the Young Lives survey, however, we do not focus on the division into categories by ethnicity. There are two main reasons for this approach. The first is related to a technical
matter, and the second to the correct interpretation of intervention. For the first, receptive

INEQUALITY IN EDUCATIONAL OPPORTUNITIES AND OUTCOMES: EVIDENCE FROM YOUNG LIVES DATA IN VIETNAM
41
vocabulary is among the most important outcomes, and for this particular outcome the ethnic gap is not meaningful. With respect to the second reason, we look at ethnic groups through their socio-economic characteristics that matter for the educational outcomes of the young
members in their community. The top three characteristics are the ones that are used as the determinants of vulnerability. Of course, there are other factors that are strongly correlated to ethnic minority groups. One such factor is mentioned, that the medium of instruction in
classes is not the mother tongue of ethnic minorities. Furthermore, according to Baulch et al. (2010), returning to education is more likely for Vietnamese or Chinese households than ethnic minority-headed households in most cases. A report by World Bank (2009) concluded
that the government’s policies on education for ethnic minority pupils have not been able to close the gap between the ethnic majority and ethnic minorities.
Our pictures of performance for the two cohorts in this paper may suffer from certain unbalances, and this presents a weakness of this study. Because of limitations in data at both
ends of the period of data collection over the longitudinal study, while the data used in presenting the performance in early and middle childhood are of the Younger Cohort, that for adolescence and early adulthood are of the Older Cohort. When some comparisons are
possible, such as when both cohorts were age 12, we found differences between the cohorts. In most of the cases, the performance of the Younger Cohort is more favourable than that of the Older Cohort. Being aware of the cohort gap is useful for readers of this paper.
5.1 Policy recommendations
We bring the following issues to the attention of policymakers:
• About half of the 6-year-old children enter Grade 1 having attended a preschool
programme for less than two years. This is a concern, especially for ethnic minorities,
who need enough time to learn Vietnamese, which is the only medium of instruction, but not their mother tongue.
• The demand for jobs that require with tertiary education qualifications is thin and
highly uncertain. There is a large mismatch between the education aspirations the children had at age 12, and the real economy that they may enter at age 19.
• The significant gap between the least and most vulnerable groups implies a serious
danger of the disparity translating into the next generation. This should add to the motivation for the government to maintain the course of inclusive growth that keeps vulnerable children from lagging further behind.

INEQUALITY IN EDUCATIONAL OPPORTUNITIES AND OUTCOMES: EVIDENCE FROM YOUNG LIVES DATA IN VIETNAM
42
References Banik, C. 2013. ‘From Colombia to Vietnam: The Success of an Innovative School Model.’
http://www.globalpartnership.org/blog/colombia-vietnam-success-innovative-school-model (accessed 5 July 2016).
Baulch, B., H.D. Vu, and T. Nguyen (2012) Do Vietnamese Schools Provide the Right
Education for an Industrialising Country? Young Lives Working Paper 81, Oxford: Young Lives.
Bray, M., and C. Lykins (2012) Shadow Education: Private Supplementary Tutoring and Its
Implications for Policy Makers in Asia, Mandaluyong City: Asian Development Bank.
Cueto, S., and J. Leon (2013) Psychometric Characteristics of Cognitive Development and Achievement Instruments in Round 3 of Young Lives, Young Lives Technical Note 25,
Oxford: Young Lives.
Cueto, S., J. Leon, G. Guerrero, and I. Munoz (2009) Psychometric characteristics of
cognitive development and achievement instruments in Round 2 of Young Lives, Young Lives Technical Note 15, Oxford: Young Lives.
Dang, H.A. (2007) ‘The determinants and impact of private tutoring classes in Vietnam’,
Economics of Education Review 26.6: 684-699.
Dunn, L. and L. Dunn (1997) Examiner’s Manual for the PPVT-III. From IIIA and IIIB,
Minnesota: AGS.
Glewwe, P., S. Krutikova, and C. Rolleston (2014) Do Schools Reinforce or Reduce Learning
Gaps between Advantaged and Disadvantaged Students? Evidence from Vietnam and Peru, Young Lives Working Paper 133, Oxford: Young Lives.
Ko, I., and J. Xing (2009) Subjective well-being: empirical evidence from Vietnamese children, Young Lives Working Paper 49, Oxford: Young Lives.
Le Thuc Duc and B. Baulch (2013) Do Extra Classes Improve Cognitive Test Scores?
Evidence from Vietnam, Young Lives Working Paper 87, Oxford: Young Lives.
Le Thuc Duc and Tran Ngo Minh Tam (2013) Why Children in Vietnam Drop out of School
and What They Do After That, Young Lives Working Paper 102, Oxford: Young Lives.
London, J.D. (2011. ‘Historical welfare regimes and education in Vietnam’ in J.D. London
(ed.) Education in Vietnam, 57-103, Singapore: Institute of Southeast Asian Studies.
MOET (2014). Vietnam Education for All National Review 2015. Ha Noi.
Rolleston, C., Z. James, L. Pasquier-Doumer, and N.M.T. Tran (2013) Making Progress:
Report of the Young Lives School Survey in Vietnam, Young Lives Working Paper 100,
Oxford: Young Lives.
Tran Dinh Thuan (2014). Kết quả khảo sát bước đầu về bố trí sử dụng giáo viên của các
trường tiểu học khi chuyển sang học cả ngày. Tạp chí khoa học ĐHQGHN: Nghiên cứu Giáo dục, Tập 30, Số 3: 31-40.
Tran, N.M.T., and L. Pasquier-Doumer (2015) Does full-day schooling reduce educational
inequality in Vietnam? PERI ESP Working Paper Series 2015, 72, Oxford: Young
Lives/PERI.

INEQUALITY IN EDUCATIONAL OPPORTUNITIES AND OUTCOMES: EVIDENCE FROM YOUNG LIVES DATA IN VIETNAM
43
Tran T. H., and T. Harpham (2005) ‘Primary education in Vietnam: Extra classes and
outcomes.’ International Education Journal 6.5: 626-34.
Tran, T., T. L. Pham, T. Harpham, T.H. Nguyen, D.T. Tran, B. Tod, T.D. Tong, and T.V.H.
Nguyen (2003) Young Lives Preliminary Country Report: Vietnam, Oxford: Young Lives.
Truong Huyen Chi (2011) Eliminating Inter-Ethnic Inequalities? Assessing Impacts of
Education Policies on Ethnic Minority Children in Vietnam, Young Lives Working Paper 69, Oxford: Young Lives.
UNESCO (2007) ‘Secondary Education Regional Information Base: Country profile –
Vietnam’, Paris: UNESCO.
Viet Nam National Assembly (1998) ‘Education Law’, http://moj.gov.vn/vbpq/en/Lists/
Vn%20bn%20php%20lut/ View_Detail.aspx?ItemID=1263 (accessed 5 July 2016)
Viet Nam National Assembly (2005) ‘Education Law’, http://www.moj.gov.vn/vbpq/en/
Lists/Vn%20bn%20php%20lut/View_Detail.aspx?ItemID=5484 (accessed 5 July 2016)
Viet Nam National Assembly (2009) ‘Education Law’, http://moj.gov.vn/vbpq/en/Lists/
Vn%20bn%20php%20lut/View_Detail.aspx?ItemID= 10475 (accessed 5 July 2016)
World Bank (2009) Country Social Analysis: Ethnicity and Development in Vietnam,
Washington, DC: The World Bank.
World Bank (2012) Well begun, not yet done: Vietnam’s remarkable progress on Poverty
Reduction and the Emerging Challenges, Washington, DC: The World Bank.
Young Lives (2002) ‘UK Data Archive Study Number 5307, Young Lives: an International
Study of Childhood Poverty: Methodology Round 1’,
http://doc.ukdataservice.ac.uk/doc/5307/mrdoc/pdf/5307methodology_r1.pdf (accessed 5
July 2016)

INEQUALITY IN EDUCATIONAL OPPORTUNITIES AND OUTCOMES: EVIDENCE FROM YOUNG LIVES DATA IN VIETNAM
44
Appendix: Tables on regressions
Table A1. OLS regressions of cognitive test score at age 5
PPVT CDA
Private preschool 0.000 0.011
(0.009) (0.016)
Sex -0.005 -0.001
(0.004) (0.007)
Ethnicity -0.010*** -0.056***
(0.004) (0.007)
Wealth index 0.082*** 0.153***
(0.015) (0.027)
Mother’s education 0.017*** 0.012**
(0.003) (0.005)
Urban 0.040*** 0.012
(0.008) (0.014)
Notes: Number of observations: 1395; R-squared: 0.24 for PPVT, Number of observations: 1508; R-squared: 0.19 for CDA. The variables on CDA and PPVT are in percentage of correct answers; *** p<0.01, ** p<0.05, * p<0.1.
Table A2. Logit estimation for likelihood of dropping out: Older Cohort by Round 4 (age 19)
Coefficients p-values
Boys 0.29 0.243
Maths Round 2 -0.79*** 0.000
Receptive vocabulary Round 2 -0.22* 0.097
Mother ethnic minority -0.26 0.525
Wealth index Round 1 -0.59*** 0.000
Coastal 0.80*** 0.007
Notes: Number of observations: 830; Pseudo-R-squared: 0.27. The variables on maths and PPVT are in percentage of correct answers; *** p<0.01, ** p<0.05, * p<0.1.
Table A3. Determinants of enrolment in tertiary education
Coefficients p-value
Male -0.070** 0.019
Maths Round 0.381*** 0.000
PPVT Round 2 0.465*** 0.005
Mother completed LSE 0.211*** 0.000
Mother ethnic minority 0.061 0.320
Wealth index Round 1 0.432*** 0.000
Urban -0.087* 0.063
Northern uplands 0.055 0.221
Notes: Number of observations: 823; R-squared: 0.21. The variables on maths and PPVT are in percentage of correct answers; *** p<0.01, ** p<0.05, * p<0.1.


Inequality in Educational Opportunities and Outcomes: Evidence From Young Lives Data in VietnamThis paper utilises Young Lives longitudinal data on two cohorts of 3,000 children in Vietnam, as well as a wealth of official Government data, to present a broad picture of the education sector in the country, focusing on inequality. The paper’s key findings are:
• Pre-primary and primary school attendance: at age 5, over 10 per cent of both cohorts never attend preschool or other schools, and less than 10 per cent attend private preschools. Over 95 per cent of the Younger Cohort started Grade 1 in the year they turned 6, and another 4 per cent started by age 7. At the primary level, the rate of progress to next grade is close to a hundred per cent, except the first graders. The rate of overage for primary school students is relatively low for the Younger Cohort.
• Middle childhood and private tuition: For basic education, an absolute majority of students go to public schools. However, at ages 8 and 12, nearly two thirds of the Younger Cohort took extra classes, compared to slightly over 50 per cent of the Older Cohort seven years previously. For both cohorts, the children of wealthy households are much more likely than the children of the poor to attend extra classes, which are more popular in cities than in the uplands and remote areas. The infrastructure of primary schools varies widely between geographic areas, especially in the availability of libraries, computers, and internet access. However, there are few differences in terms of class teacher characteristics, such as qualifications (having a university degree), teaching experience, and their performance in maths and Vietnamese tests.
• Educational outcomes and socio-economic status: The gender gap in education of Vietnam is quite moderate, and where it exists, it is often that girls perform slightly better than boys. Geography, mother’s level of education, and wealth/poverty all make a difference in all the educational outcomes, where the least vulnerable group perform better than the most vulnerable.
• Secondary and tertiary education – transition and dropout: At age 15, over 80 per cent of children have completed lower secondary education, and less than 4 per cent are still in basic education schools. Mother’s level of education is the most powerful predictor of the outcomes in child’s completion of lower secondary education. At age 19, nearly 60 per cent have completed upper secondary education, 10 per cent are still in general education school, and over 10 per cent drop out before completing basic education. The gap between the least and the most vulnerable groups is as wide as 64 per cent in completion of upper secondary education. Having completed upper secondary, over one third of the Older Cohort went on to a tertiary education institution, with slightly more going to university than to technical/professional institutes. Wealth, mother’s level of education and the child’s cognitive achievement are the most important determinants of attending schools at the tertiary level.
The findings suggest that policymakers need to address the following issues.
• While the majority of the children attended preschool before entering Grade 1, about half of the children spent less than two years in the preschool programme; this might contribute to the disadvantage of ethnic minority children, as these children need enough time to learn Vietnamese, which is the only medium of instruction, but not their mother tongue.
• The demand for jobs that require with tertiary education qualifications is thin and highly uncertain. There is a large mismatch between the education aspirations the children had at age 12, and the real economy that they may enter at age 19.
• The significant gap between the least and most vulnerable groups implies a serious danger of regional disparities in socio-economic development translating into the next generation. This requires consistent commitment to pursue inclusive growth to keep vulnerable children from lagging further behind.
About Young Lives
Young Lives is an international study of childhood poverty, involving 12,000 children in 4 countries over 15 years. It is led by a team in the Department of International Development at the University of Oxford in association with research and policy partners in the 4 study countries: Ethiopia, India, Peru and Vietnam.
Through researching different aspects of children’s lives, we seek to improve policies and programmes for children.
Young Lives Partners
Young Lives is coordinated by a small team based at the University of Oxford, led by Professor Jo Boyden.
• Ethiopian Development Research Institute, Ethiopia
• Pankhurst Development Research and Consulting plc, Ethiopia
• Centre for Economic and Social Studies, Hyderabad, India
• Save the Children India
• Sri Padmavathi Mahila Visvavidyalayam (Women’s University), Andhra Pradesh, India
• Grupo de Análisis para el Desarollo (GRADE), Peru
• Instituto de Investigación Nutricional, Peru
• Centre for Analysis and Forecasting, Vietnamese Academy of Social Sciences, Vietnam
• General Statistics Office, Vietnam
• Oxford Department of International Development, University of Oxford, UK
Contact:Young LivesOxford Department of International Development,University of Oxford,3 Mansfield Road,Oxford OX1 3TB, UKTel: +44 (0)1865 281751Email: [email protected]: www.younglives.org.uk
www.younglives.org.uk