Embed Size (px)
Citation preview
EDUCATIONAL INEQUALITY IN
SOUTH KOREA: THE WIDENING
SOCIOECONOMIC GAP IN
STUDENT ACHIEVEMENT
Soo-yong Byun and Kyung-keun Kim
ABSTRACT
Increasing income inequality particularly since the economic crisis of 1997has called attention to the issue of growing educational inequality in SouthKorea. Although much recent research has been directed at understandingthe socioeconomic gap in academic achievement, few studies haveempirically examined how this gap has changed over time during the pastdecade in South Korea. Using nationally representative data for the mostrecent three cohorts (1999, 2003, and 2007) of eighth-grade South Koreanstudents from Trends in International Mathematics and Science Study(TIMSS), this study examines trends in the relationship betweensocioeconomic background and student achievement. The eighth-gradeTIMSS data demonstrate that the influence of socioeconomic backgroundon student achievement has increased over time during the past decade,offering evidence of growing educational inequality in South Korea.Various factors may contribute to higher educational inequality, includingthe widening income gap and recent educational transformations gearedtoward school choice and tracking.
Globalization, Changing Demographics, and Educational Challenges in East Asia
Research in Sociology of Education, Volume 17, 155–182
Copyright r 2010 by Emerald Group Publishing Limited
All rights of reproduction in any form reserved
ISSN: 1479-3539/doi:10.1108/S1479-3539(2010)0000017008
155
INTRODUCTION
Over the half century from 1950 to 2000, the Republic of Korea (hereafterSouth Korea) has achieved remarkable economic and educational develop-ment. From an economic perspective, it has achieved rapid economicgrowth, with per capita income rising from under US$100 in the 1950s tomore than US$16,000 in 2000 (Organisation for Economic Co-operationand Development [OECD], 2009). From an educational perspective, it hasexperienced dramatic expansion, with the participation rate of young peoplein secondary education rising from approximately 20% in 1945 to almost100% in 2000 (Ministry of Education, Science, and Technology [MEST],2009a). In this process of dramatic economic and educational transforma-tion, many South Koreans have benefited significantly from the expansionof educational opportunities. As a result, the majority of South Koreansbelieve that they and their children will achieve upward mobility througheducation if they work hard (Seth, 2002).
However, increasingly, this meritocratic belief has been threatened bythe emerging inequality in income distribution, particularly since theeconomic crisis of 1997. Increasing social polarization has called attentionto the issue of growing educational inequality in academic achievementamong South Korean children (Kim, 2005). Although much recent researchin the sociology of education in South Korea has been directed atunderstanding the socioeconomic gap in academic achievement, few studieshave empirically examined how this gap has changed over time duringthe past decade. Accordingly, the purpose of this study is to investigate theissue of the growing educational inequality in South Korea during thepast decade.
One useful way of assessing inequalities in learning opportunities is toexamine the extent to which socioeconomic background relates to studentsand their school performance (OECD, 2007; Willms, 2003a, 2003b, 2006). Ifstudent and school performance were to strongly depend on socioeconomicbackground, large inequalities in the distribution of learning opportunitiesmight remain. In contrast, if students and schools were to perform wellirrespective of socioeconomic background, learning opportunities might bemore equally distributed. Employing this analytic strategy, we examine thetrends in the relationship between socioeconomic background and studentachievement in South Korea in the past 10 years, using nationallyrepresentative data for the most recent three cohorts (i.e., 1999, 2003, and2007) of eighth-grade South Korean students from the Trends inInternational Mathematics and Science Study (TIMSS) database.
SOO-YONG BYUN AND KYUNG-KEUN KIM156
The international TIMSS database is especially useful for our studybecause it allows us to compare the observed trends in the relationshipbetween socioeconomic background and student achievement in SouthKorea to those of other world regions, including the United States. The U.S.case is particularly interesting because its recent educational efforts such asNo Child Left Behind (NCLB) have focused on boosting studentachievement of low performing, poor, and minority students (Loveless,Parkas, & Duffett, 2008). This effort contrasts with South Korea’s recenteducational reforms focusing on raising student achievement of high-achieving students in the name of promoting excellence (Kim, Cho, Na,Cha, & Gim, 2004; Kim, Lee, & Cheong, 2008; Ministry of Education[MOE], 2004). Therefore, although this study aims to inform South Koreanpolicymakers and scholars about educational inequality, findings can alsoinform U.S. educational researchers and policymakers, as well as thoseworldwide.
It is important to note that this study does not examine the causal linkbetween specific educational reform strategies (e.g., tracking) and thewidening socioeconomic gap in student achievement. Rather, we aim tooffer empirical evidence on the growing educational inequality in SouthKorea. The next section provides a brief description of recent socioeconomicand educational changes in South Korea and discusses their implications forthe growing educational inequality. Next, we describe the methodologiesof this study. We then examine the changes in the estimated effects ofsocioeconomic background on student achievement over time by using theTIMSS data. Finally, the chapter concludes with a discussion of the results.
BACKGROUND
Recent Socioeconomic and Demographic Changes in South Korea
Before 1997, South Korea had enjoyed a period of rapid gross domesticproduct (GDP) growth, which had increased by an average of 9% perannum between 1970 and 1996 (Fig. 1). From a comparative perspective,this growth is striking, given that, during the same period, the averageannual GDP growth rate among OECD countries was only 2.4% (OECD,2009). However, the Asian financial crisis in mid-1997 had disrupted theeconomy of South Korea. From 1997 to 1998, South Korea’s GDP markedits first negative growth of �5.8% since the 1960s. Although the SouthKorean economy has made a remarkable recovery since then, it has shown a
Growing Educational Inequality in South Korea 157
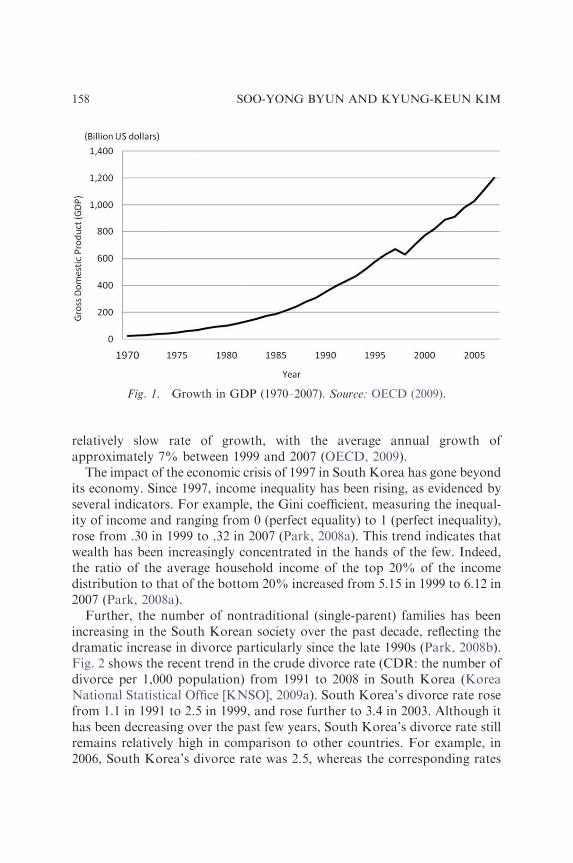
relatively slow rate of growth, with the average annual growth ofapproximately 7% between 1999 and 2007 (OECD, 2009).
The impact of the economic crisis of 1997 in South Korea has gone beyondits economy. Since 1997, income inequality has been rising, as evidenced byseveral indicators. For example, the Gini coefficient, measuring the inequal-ity of income and ranging from 0 (perfect equality) to 1 (perfect inequality),rose from .30 in 1999 to .32 in 2007 (Park, 2008a). This trend indicates thatwealth has been increasingly concentrated in the hands of the few. Indeed,the ratio of the average household income of the top 20% of the incomedistribution to that of the bottom 20% increased from 5.15 in 1999 to 6.12 in2007 (Park, 2008a).
Further, the number of nontraditional (single-parent) families has beenincreasing in the South Korean society over the past decade, reflecting thedramatic increase in divorce particularly since the late 1990s (Park, 2008b).Fig. 2 shows the recent trend in the crude divorce rate (CDR: the number ofdivorce per 1,000 population) from 1991 to 2008 in South Korea (KoreaNational Statistical Office [KNSO], 2009a). South Korea’s divorce rate rosefrom 1.1 in 1991 to 2.5 in 1999, and rose further to 3.4 in 2003. Although ithas been decreasing over the past few years, South Korea’s divorce rate stillremains relatively high in comparison to other countries. For example, in2006, South Korea’s divorce rate was 2.5, whereas the corresponding rates
Fig. 1. Growth in GDP (1970–2007). Source: OECD (2009).
SOO-YONG BYUN AND KYUNG-KEUN KIM158

in Japan and Germany were 2.0 and 2.3, respectively (United NationsStatistics Division [UNSD], 2008).
In addition to these transformations, another important demographicchange in the past few decades is the dramatic decline in the fertility rate.Fig. 3 shows the recent trends in the total fertility rate of South Korea(Korea National Statistical Office [KNSO], 2009b). South Korea’s fertilityrate declined sharply between the 1970s and the 1980s, showing a 66% dropfrom 4.5 in 1970 to 1.56 in 1989. It fell further to 1.25 in 2007. In fact, SouthKorea showed the second largest change in the total fertility rates between1970–1975 and 2005–2010, following Mongolia (UN, Department ofEconomic and Social Affairs, Population Division, 2007).
Finally, the population of South Korea, once self-portrayed as anethnically homogeneous nation, has been becoming more racially, ethnically,and culturally diverse as a result of a dramatic increase in immigration andinternational marriages. The number of migrant workers in South Korea hasdramatically increased over the past two decades. Fig. 4 shows the growthin the number of migrant workers in South Korea from 1981 to 2008
Fig. 2. Crude Divorce Rates in South Korea (1991–2007), Japan (2001–2006), and
Germany (2001–2006). Sources: For South Korea, KNSO (2009a); For Japan and
Germany, UNSD (2008).
Growing Educational Inequality in South Korea 159

Fig. 3. The Trends in the Total Fertile Rate of South Korea (1970–2007). Source:
KNSO (2009b).
Fig. 4. Growth of the Number of Immgrant Wokers in South Korea (1987–2008).
Sources: Seol (2005) and Yoon (2008).
SOO-YONG BYUN AND KYUNG-KEUN KIM160
(Seol, 2005; Yoon, 2008). In 1981, there were less than 10,000 migrantworkers in South Korea; two decades later in 2008, there were more than540,000 migrant workers. Likewise, international marriages have rapidlygrown in South Korea particularly since the late 1990s. Internationalmarriages had accounted for only 3.2% of the total number of marriages in1997; they constituted more than 10% of the total number of marriages adecade later (Yoon, 2008).
Recent Trends in South Korea’s Secondary Schooling
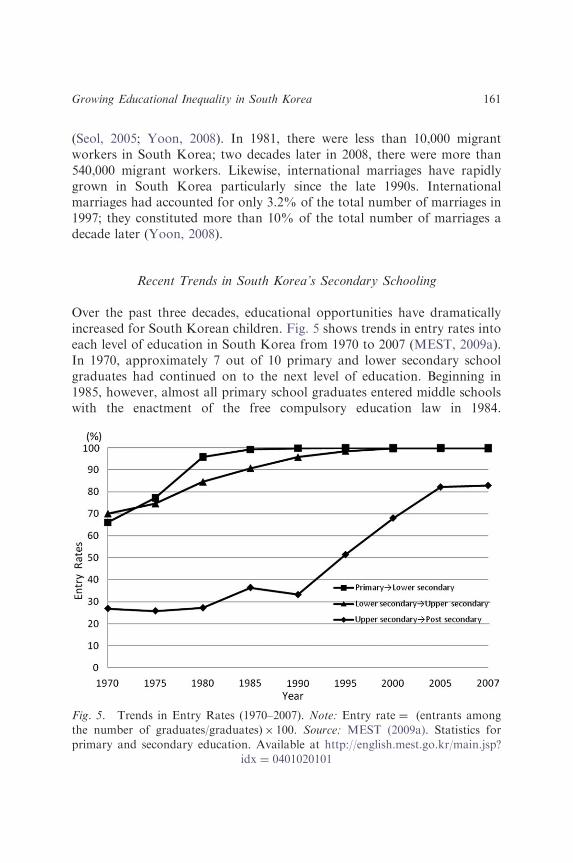
Over the past three decades, educational opportunities have dramaticallyincreased for South Korean children. Fig. 5 shows trends in entry rates intoeach level of education in South Korea from 1970 to 2007 (MEST, 2009a).In 1970, approximately 7 out of 10 primary and lower secondary schoolgraduates had continued on to the next level of education. Beginning in1985, however, almost all primary school graduates entered middle schoolswith the enactment of the free compulsory education law in 1984.
Fig. 5. Trends in Entry Rates (1970–2007). Note: Entry rate ¼ (entrants among
the number of graduates/graduates)� 100. Source: MEST (2009a). Statistics for
primary and secondary education. Available at http://english.mest.go.kr/main.jsp?
idx ¼ 0401020101
Growing Educational Inequality in South Korea 161

Nonetheless, not all middle school graduates were able to continue onto upper secondary education until the early 2000s in part because lowersecondary education did not become free nationwide until 2004, owing tolimited public resources1 (Ministry of Education, Science, and Technology[MEST], 2009b).
The growth of postsecondary education has been more dramatic inproportional terms than that of primary and secondary education over therecent decades. The advancement rate from upper secondary to post-secondary education was less than 30% in 1970, but it went up to more than80% in 2005. In other words, these days, 8 out of 10 South Korean highschool graduates go on to college. This dramatic expansion has resulted in alarge gap in higher education attainment between the young and the oldgenerations in South Korea. In fact, South Korea currently shows thelargest generation gap in high educational attainment among OECDcountries (Organisation for Economic Co-operation and Development[OECD], 2008).
In general, South Korean secondary education is organized alongegalitarian educational policies (Kim & Lee, 2003). South Korea’s egalitarianapproach to education can be best described by its randomized schoolassignment policy in which (with a few exceptions2) most secondary schoolstudents are assigned to schools within their residential areas by a randomlottery system. Because this policy applies to both public and private schools,there has been little variation between the two sectors in terms of students’academic abilities. In addition, because South Korean private schools are toa large extent subsidized and controlled by the government, there has beenrelatively little variation between private and public schools in terms ofschool resources and curriculum (Ministry of Education [MOE], 1998).
However, since the mid-1990s when educational excellence emerged inSouth Korea as a key issue regarding national competitiveness in the globalmarket, there has been an important shift from this egalitarian approach tothe market-oriented one in South Korean secondary education. In particular,South Korea’s random school allocation policy in upper secondaryeducation, known as the High School Equalization Policy3 (HSEP), hasbeen heavily criticized as being a representative regulatory policy that wouldundermine excellence in education (Kim & Lee, 2003). The HSEP was firstintroduced in 1974 to address social and educational problems that werecaused by the excessive competition to enter elite high schools (MOE, 1998).
Before 1974, upper secondary education in South Korea was based on anational free competition system. Students were allowed to choose theirschools, and individual high schools were allowed to select their students
SOO-YONG BYUN AND KYUNG-KEUN KIM162
through their own entrance exams. In those days, a few elite high schools,most of which were public and located in large cities such as Seoul(the capital and the largest city) and Busan (the second largest city), selectedonly those students in the upper tier, leading to serious inequalities betweenthe elite high schools and the remaining schools in terms of the academicability of students, parental support, and the quality of teachers (MOE,1998). The result was severe competition for students wanting to enter theseelite high schools.
The intensive competition in turn caused many educational problems,including a competition-oriented school climate, heavy workloads, anda cram-based, memorization approach to education (Park, 1988). Underthese circumstances, the MOE proposed in 1972 the HSEP, where the mainprovisions were the elimination of the high school entrance exam and theintroduction of random school assignment (MOE, 1998). The HSEP wasfirst implemented in 1974 in Seoul and Busan, where educational and socialproblems that were caused by the intense competition had been the mostsevere. Since its introduction, the HSEP has been gradually expanded tomany cities across the country.4
Advocates of the HSEP argued that the policy would promote theequality of opportunity because it would create schools that would be lesspolarized in terms of the ability of students, school resources, and thequality of teachers. However, critics of the HSEP argued that this randomschool assignment policy would deprive students and parents of their rightto choose schools and restrict the operational autonomy of private schools,consistent with the arguments for school choice (Moe & Chubb, 1990).Furthermore, opponents claimed that the equalization policy would leadto a decline in student achievement, especially for high performing students,a phenomenon referred to as the ‘‘downward leveling effect’’. Theopponents argued that this policy would result in a heterogeneous classroomsetting in which both high achievers and low achievers would be mixed,resulting in difficulties for teachers with respect to individual differences instudents’ academic abilities (Kim, Lee, Lee, & Lee, 2004).
As the neoliberal alternatives supporting the idea of the introduction ofmarket competition into the school system began to dominate the process ofpolicy making in the mid-1990s and early 2000s, the combination of themarket metaphor and criticism of the ‘‘downward leveling effect’’ became amore serious challenge to the HSEP. The result was a revision of the originalHSEP. In 1996, limited school choice was permitted in Seoul by creating theso-called common catchment area schools, where students were allowed toapply to schools of their own choosing (MOE, 1998). In 2002, a limited
Growing Educational Inequality in South Korea 163
number of private schools that meet certain criteria such as financial resourceswere allowed to be transformed into independent private schools with greaterautonomy, including school choice. Most recently, a new type of high schoolwas established. Referred to as autonomous private high schools, theseschools had greater autonomy in terms of curricula and financial manage-ment (Ministry of Education, Science, and Technology [MEST], 2008).
Although the randomized school assignment system has remained largelyintact at the lower secondary level, the criticisms with respect to the hetero-geneous (untracked) classroom setting have led to an increase in tracking(i.e., the separation of students by their abilities and sometimes by curricula)in the South Korean lower secondary schooling (MOE, 2004). Untilrecently, regardless of whether they are private or public, most SouthKorean middle schools had offered six 45-minute-long lessons a day5 andtaught Korean language, English, math, social studies, and science as coresubjects. In addition, regardless of their learning abilities, most middle schoolstudents were taught the same curricular content at the same pace andpromoted at the same time from grade to grade with their same-age peers. Inother words, neither ability grouping nor grade retention were common atthe lower secondary level in South Korea until very recently, which contraststhe school system in Western societies such as the United States where abilitygrouping and grade retention have long been practiced (Hoffer, 1992;Jimerson, 2001).
However, with the implementation of the 7th National Curriculum in2000, which mainly aimed at curriculum differentiation, grouping practiceshave dramatically increased across the nation. The proportion of middleschools implementing tracking rose from approximately 5% in 2003 to 17%in 2004, and increased to more than 54% in 2008 (Kim et al., 2004, 2008).The following section discusses the impact of these recent demographicand educational changes on the growing educational inequality in thecontemporary South Korean society.
Implications for Growing Educational Inequality in South Korea
Recent socioeconomic and demographic transformations, including thewidening income gap, a growing proportion of single-parent families, anda reduced number of offspring, have an important implication for achieve-ment gap, given that studies investigating the sources of the unequalachievement in the South Korean context have identified a number of familybackground factors, including parental education, household income,
SOO-YONG BYUN AND KYUNG-KEUN KIM164
family structure, family size, and parental involvement (Byun & Kim, 2008a,2008b; Chang & Sohn, 2005; Kim, 2005, 2006; Park, Kim, & Byun, 2009),that are consistent with evidence from other countries such as theUnited States (Baker & Stevenson, 1986; Coleman et al., 1966; Lareau,1987). The increasing diversity in South Korea’s population also has animplication for achievement gap. Although evidence from South Koreais limited because of insufficient data, prior research conducted elsewherehas suggested that the immigrant status of an individual is another sourceof unequal achievement (Kao, 2004; Kao & Turney, 2009; see Zhou, 1997for a literature review).
In the context of South Korean secondary education, the widening incomegap is especially important because of its relationship with ‘‘shadow education’’or supplementary private tutoring opportunities (Byun, 2009). In South Korea,high-stakes assessments play a crucial gatekeeper role to adolescents’ futureeducational and economic opportunities. Therefore, hundreds of thousands ofSouth Korean youth have used various forms of shadow education, includingcram schools (hagwon), to prepare for a series of the high-stakes exams. Forexample, almost 8 out of 10 students had participated in at least one or moreforms of private tutoring in 2008 (Korea National Statistical Office [KNSO],2009c). Because parents must pay for various types of shadow education fortheir children, children from low-income families are often disadvantagedbecause poor parents generally cannot afford the high cost of shadoweducation. Indeed, there has been a significant gap in shadow educationopportunities between children from high- and low-income families. In 2008, 9out of 10 students whose monthly average family income was more than7,000,000 South Korean Won (KRW) (approximately 6,300 U.S. dollar)received at least one or more forms of private tutoring, whereas only 4 out of10 students whose monthly average family income was less than 1,000,000KRW (approximately 900 U.S. dollar) did so (KNSO, 2009c).
The opportunity gap in shadow education between high-income and low-income children is likely to lead to a gap in student achievement between thetwo groups. Recent studies (Byun, 2009; Byun & Kim, 2006) have providedsome evidence supporting this notion. In their structural equation analysesof 12th-grade general high school students in South Korea, Byun and Kim(2006) found that although financial resources (measured by family incomeand other financial resources such as assets) did not have a significant directeffect on student achievement, they did have a significant indirect effect onstudent achievement through shadow education (which had a decisive effecton student achievement). Their finding suggests that a family’s financialresources play an important role in student achievement through the
Growing Educational Inequality in South Korea 165
investment in shadow education. In short, the widening income gap maylead to a growing gap in shadow education opportunities, increasingachievement gap between high- and low-income students.
Recent South Korean educational movements in the direction ofexpanding school choice and grouping practices have another importantimplication for the widening achievement gap between children fromadvantageous and disadvantageous backgrounds. Critics have argued thatincreasing school choice and grouping would lead to the greater socio-economic polarization of students among schools and classes becausedisadvantaged students would more likely be placed in less desirable schoolsand classes (Brown, 1990; Gamoran, 1987). The result could be a reductionin educational benefits for disadvantaged students because of a decrease incontextual effects of heterogeneous schools and classrooms (i.e., wherediverse students are mixed in terms of their family backgrounds and learningabilities) that favor disadvantaged students (Willms & Echols, 1993).
Indeed, a good deal of research conducted in other countries has suggestedthat increasing school choice (Lee, Croninger, & Smith, 1994; Wells, 1993;Willms & Echols, 1993) and ability grouping (Alexander & McDill, 1976;Hoffer, 1992; Kerckhoff, 1986) would reduce student achievement amongdisadvantaged students. Although limited, emerging evidence from SouthKorea also has suggested that expanded school choice (Byun & Kim, 2009)and increased curriculum differentiation (Park, 2009) would have negativeeffects on student achievement, particularly for disadvantageous and low-achieving students. In fact, many empirical studies on the impact of SouthKorea’s randomized school assignment policy (i.e., the HSEP) have suggestedthat the government intervention in school assignment would not lead to adecline in student achievement, rejecting arguments for the downward levelingeffect (Kang et al., 2005; Sung, 2002, 2004). In summary, along with itsdemographic changes, South Korea’s market-based educational transforma-tion may contribute to a widening socioeconomic gap in student achievementby reducing educational benefits for students with a lower socioeconomicbackground. The following section presents the study methodology.
METHODOLOGY
Data and Sample
To examine the trends in the relationship between socioeconomic back-ground and student achievement during the past decade, we used data from
SOO-YONG BYUN AND KYUNG-KEUN KIM166

the international TIMSS database. TIMSS has been the source of one of themost extensive, large-scale international assessments of student achievementsince 1995, with more than 60 countries around the world participating as of2007 (Mullis, Martin, & Foy, 2008).TIMSS is conducted on a four-yearcycle, measuring student performance in math and science among fourth-and eighth-grade students. Because we are interested in how the influence ofsocioeconomic background on student achievement has changed over timesince the financial crisis of 1997–1998 in South Korea, we restrict our analysisto the most recent three cycles (i.e., 1999, 2003, and 2007) of TIMSS. Inaddition, because there has been no fourth-grade TIMSS assessment in SouthKorea since 1995, we focus only on eighth-grade students.
TIMSS employs a stratified sampling design in which each participatingcountry randomly samples the schools to be tested; one class is randomlychosen for each of these schools, and all students within the randomly selectedclass are tested in both math and science, yielding a nationally representativesample of students for each country (Olson, Martin, & Mullis, 2008). Inaddition to math and science achievement scores, TIMSS offers a variety ofinformation on the background of students, teachers, and school principals.Given the rigorous procedures taken to ensure high-quality sampling andtesting in all countries and the standardized procedures to ensure compar-ability across countries, the TIMSS student performance and backgrounddata are comparable across countries and all TIMSS assessments (Mulliset al., 2008; Olson et al., 2008).
As noted earlier, we included the U.S. data for comparison purposes becauseits school system has been known to have one of the highest levels of between-school differentiation. Further, the United States has been making effortsrecently to reduce disparities between schools, offering an interesting contrastwith South Korea’s recent educational reforms (Lee, 2001). The number ofsampled schools that participated in the TIMSS test in South Korea wasapproximately 150 (except in 2003, where the number was 149). The samplingprocedure yielded a sample size of 6,114, 5,309, and 4,240 South Koreanstudents in 1999, 2003, and 2007, respectively. In the United States, the numberof sampled schools varied across cohort groups, ranging from 182 in 1999 to238 in 2007, with the sample size being 10,973 in 1999 and 7,377 in 2007.
Measures
This study examines trends in the relationship between socioeconomicbackground and student achievement. Accordingly, the variables of interest
Growing Educational Inequality in South Korea 167

are (1) socioeconomic background of students and (2) student achievement.Each variable was measured as follows.
Socioeconomic StatusTIMSS provides information that can be used as a proxy for familysocioeconomic status (SES), including (1) father’s education, (2) mother’seducation, (3) the number of books in the home, and (4) home educationalresources. In each cycle, TIMSS measures these variables by using the samescale, with the exception of parental education. In 1999, TIMSS askedparental education in seven categories: (1) some primary school, (2) finishedprimary school, (3) finished some secondary school, (4) finished secondaryschool, (5) some vocational education, (6) some university, and (7) finisheduniversity. In 2003 and 2007, TIMSS measured parental education by usingthe International Standard Classification of Education (ISCED) ofUNESCO, including (1) did not finish ISCED 1 (primary education),(2) ISECD 1, (3) ISCED 2 (lower secondary), (4) ISCED 3 (uppersecondary), (5) ISCED 4 (non-tertiary postsecondary), (6) ISCED 5B(vocational tertiary), (7) ISCED 5A (theoretically oriented tertiary andpostgraduate) first degree, and (8) beyond ISCED 5A. We recoded father’sand mother’s highest levels of education into estimated years of schooling(e.g., finished primary or ISECD 1 ¼ 6 and finished university or ISCED 5A¼ 16). The number of books in the home was categorized as follows:(1) 1 ¼ 0�10, (2) 2 ¼ 11�25, (3) 3 ¼ 26�100, (4) 4 ¼ 101�200, and(5) 5 ¼ more than 200 books. Finally, an index of home educationalresources (i.e., the sum total) was constructed by using information onwhether the respondent had the following items at home: (1) calculator,(2) computer, (3) student desk, and (4) dictionary. Using these fourvariables, we created an index of family SES to easily interpret the results,following the methods proposed by Willms (2003a, 2003b, 2006). The indexwas scaled to have a mean of zero and a standard deviation of one (i.e., stan-dardized) for each cohort and country, not across cohorts and countries, toavoid capturing differences in this measure between cohort groups andcountries. Missing values were substituted by the mean of each factor.
Student AchievementTIMSS assesses students’ knowledge of a wide array of content dimensionsin math and science. In this study, we restrict our analysis to mathperformance because math skills in lower secondary education represent animportant foundation for future learning at the upper level of education aswell as future opportunities for employment and income (Mullis et al., 2008).
SOO-YONG BYUN AND KYUNG-KEUN KIM168
Math performance was measured by five plausible values of math achieve-ment with a scale having an international mean of 500 and an internationalstandard deviation of 100. Following the recommendations of TIMSS(e.g., Olson et al., 2008), the five values were simultaneously used to generatecorrect standard errors.
Table 1 presents the descriptive statistics on student achievement andfamily background data for South Korea and the United States. The datawere weighted by the sampling probabilities of each student to generaterepresentative means and standard deviations for each cohort and country.With respect to the family background variable, two interesting trendsemerged: The average years of both father’s and mother’s education amongthe South Korean eighth-grade TIMSS cohorts followed the expected trend ofincreasing schooling. For example, the average years of father’s education forSouth Korean students rose from 12.0 in 1999 to 13.3 in 2003 and14.14 in2007, reflecting the educational expansion in South Korea. On the contrary,the trend of increasing parental education was less evident for the UnitedStates: The average years of father’s education was 12.2 in 1999 and 14.2 in2003, and fell to 14.0 in 2007. Another interesting trend is the average numberof books in students’ homes, which is another proxy for the educational andsocial background of the students’ families; the number had decreased overtime in the United States, whereas that was not the case in South Korea.
Analytic Strategies
To examine the trends in the relationship between SES and student achieve-ment, we used a series of multilevel models, often referred to as hierarchicallinear models (HLM). HLM was chosen over ordinary least squares (OLS)regression to address the nature of nested data in TIMSS (Raudenbush &Bryk, 2002). For the HLM analysis, we first estimated the fully uncondi-tional model separately for each cohort and country, which containedonly the dependent variable (i.e., math achievement) with no covariates.This unconditional model allowed us to partition the total variance inthe dependent variable into the individual and between-school levels(Raudenbush & Bryk, 2002). Next, we estimated the model to investigatethe relationship between family SES and student achievement, which wasspecified for each cohort group and country as follows:
Level 1 model:
ðMath achievementÞij ¼ b0j þ b1jðSESÞij þ rij ,
Growing Educational Inequality in South Korea 169
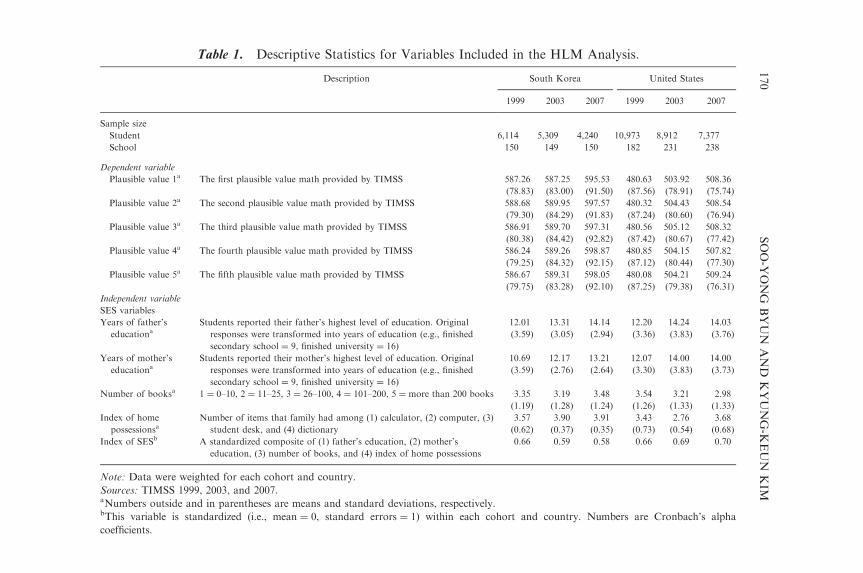
Table 1. Descriptive Statistics for Variables Included in the HLM Analysis.
Description South Korea United States
1999 2003 2007 1999 2003 2007
Sample size
Student 6,114 5,309 4,240 10,973 8,912 7,377
School 150 149 150 182 231 238
Dependent variable
Plausible value 1a The first plausible value math provided by TIMSS 587.26 587.25 595.53 480.63 503.92 508.36
(78.83) (83.00) (91.50) (87.56) (78.91) (75.74)
Plausible value 2a The second plausible value math provided by TIMSS 588.68 589.95 597.57 480.32 504.43 508.54
(79.30) (84.29) (91.83) (87.24) (80.60) (76.94)
Plausible value 3a The third plausible value math provided by TIMSS 586.91 589.70 597.31 480.56 505.12 508.32
(80.38) (84.42) (92.82) (87.42) (80.67) (77.42)
Plausible value 4a The fourth plausible value math provided by TIMSS 586.24 589.26 598.87 480.85 504.15 507.82
(79.25) (84.32) (92.15) (87.12) (80.44) (77.30)
Plausible value 5a The fifth plausible value math provided by TIMSS 586.67 589.31 598.05 480.08 504.21 509.24
(79.75) (83.28) (92.10) (87.25) (79.38) (76.31)
Independent variable
SES variables
Years of father’s
educationaStudents reported their father’s highest level of education. Original
responses were transformed into years of education (e.g., finished
secondary school ¼ 9, finished university ¼ 16)
12.01 13.31 14.14 12.20 14.24 14.03
(3.59) (3.05) (2.94) (3.36) (3.83) (3.76)
Years of mother’s
educationaStudents reported their mother’s highest level of education. Original
responses were transformed into years of education (e.g., finished
secondary school ¼ 9, finished university ¼ 16)
10.69 12.17 13.21 12.07 14.00 14.00
(3.59) (2.76) (2.64) (3.30) (3.83) (3.73)
Number of booksa 1 ¼ 0–10, 2 ¼ 11–25, 3 ¼ 26–100, 4 ¼ 101–200, 5 ¼ more than 200 books 3.35 3.19 3.48 3.54 3.21 2.98
(1.19) (1.28) (1.24) (1.26) (1.33) (1.33)
Index of home
possessionsaNumber of items that family had among (1) calculator, (2) computer, (3)
student desk, and (4) dictionary
3.57 3.90 3.91 3.43 2.76 3.68
(0.62) (0.37) (0.35) (0.73) (0.54) (0.68)
Index of SESb A standardized composite of (1) father’s education, (2) mother’s
education, (3) number of books, and (4) index of home possessions
0.66 0.59 0.58 0.66 0.69 0.70
Note: Data were weighted for each cohort and country.
Sources: TIMSS 1999, 2003, and 2007.aNumbers outside and in parentheses are means and standard deviations, respectively.bThis variable is standardized (i.e., mean ¼ 0, standard errors ¼ 1) within each cohort and country. Numbers are Cronbach’s alpha
coefficients.
SOO-Y
ONG
BYUN
AND
KYUNG-K
EUN
KIM
170
where j refers to the schools and i refers to the students sampled from schoolj; b0j is the average math achievement in school j; b1 is the effect of familySES on math achievement in school j; and r1j B N (0, s2) is the variability ofstudents within school j. The SES variable was centered on the grand mean.
Level 2 model:
b0j ¼ w00 þ u0j,
where w00 is the grand mean of math achievement and u0jBN (0, t00) is theerror term with t representing the variance between schools. Subsequent tothe application of the recommendations of TIMSS (e.g., Olson et al., 2008),the final student weights (TOTWGT) supplied by TIMSS were used tocorrect for design effects after the normalization for each cohort group andcountry; this allowed the results to be generalized to the target population(i.e., Grade 8) in each cohort and country. The following section presentsthe results.
RESULTS
Variance among Schools
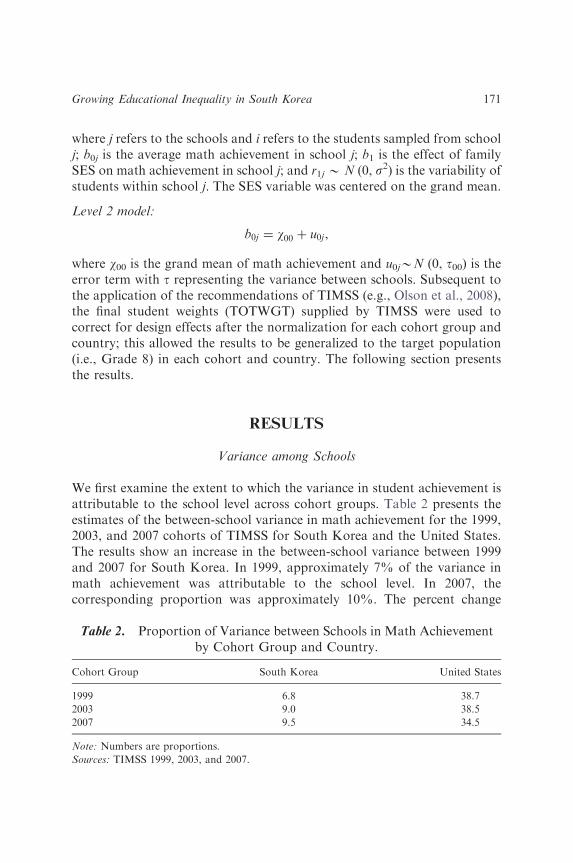
We first examine the extent to which the variance in student achievement isattributable to the school level across cohort groups. Table 2 presents theestimates of the between-school variance in math achievement for the 1999,2003, and 2007 cohorts of TIMSS for South Korea and the United States.The results show an increase in the between-school variance between 1999and 2007 for South Korea. In 1999, approximately 7% of the variance inmath achievement was attributable to the school level. In 2007, thecorresponding proportion was approximately 10%. The percent change
Table 2. Proportion of Variance between Schools in Math Achievementby Cohort Group and Country.
Cohort Group South Korea United States
1999 6.8 38.7
2003 9.0 38.5
2007 9.5 34.5
Note: Numbers are proportions.
Sources: TIMSS 1999, 2003, and 2007.
Growing Educational Inequality in South Korea 171
between 1999 and 2003 was more dramatic than that between 2003 and2007. The proportion of the national variation in student performanceattributable to the between-school variance increased by approximately2%age points between 1999 and 2003 (6.8 to 9.0), whereas it increased by.5%age points between 2003 and 2007 (9.0 to 9.5).
Contrasting trends emerged from the United States, which showed agradual decrease in the between-school variance. In 1999, differences instudent performance between schools accounted for approximately 39% ofthe total variance in math achievement in the United States. In 2007, theproportion of the between-school variance was approximately 35%,a decrease of 4%age points. Unlike South Korea, the percent changebetween 2003 and 2007 was more dramatic than that between 1999 and2003 for the United States. The proportion of the national variation in thestudent performance attributable to the between-school variance decreasedby .2%age points between 1999 and 2003 (38.7 to 38.5), whereas it droppedby 4%age points between 2003 and 2007 (38.5 to 34.5). Nonetheless,the variance among the U.S. schools remained considerably larger across thecohort groups in comparison to those in South Korea.
Trends in the Relationship between SES and Student Achievement
Next, we examine to what extent the influence of family SES has changedsince 1999, 2003, and 2007 in South Korea in comparison to that in theUnited States. We expected a greater impact of family SES on studentachievement among the more recent cohort students (e.g., 2007) than amongthe earlier cohort students (e.g., 1999) in South Korea, given the socio-economic and educational transformations that took place over the decade.Table 3 presents the changes in the relationship between socioeconomicbackground and the student performance in South Korea and the UnitedStates.
The first two columns of Table 3 show the unadjusted and adjusted meanscores in math achievement across cohorts in South Korea and the UnitedStates. Looking at the changes in the unadjusted mean scores, we found thatthe average math scores tended to increase in South Korea as well as theUnited States, with the South Korean eighth-grade students outperformingtheir counterparts in the United States across cohorts. For example, in 1999,the average math score among the South Korean students was approxi-mately 587, whereas the corresponding average score among the U.S.students was approximately 481, showing more than a 100-point difference
SOO-YONG BYUN AND KYUNG-KEUN KIM172
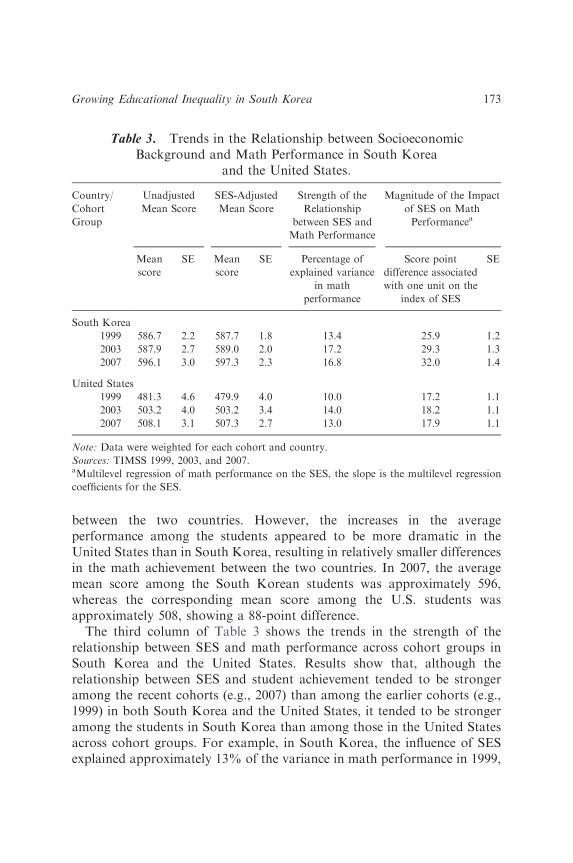
between the two countries. However, the increases in the averageperformance among the students appeared to be more dramatic in theUnited States than in South Korea, resulting in relatively smaller differencesin the math achievement between the two countries. In 2007, the averagemean score among the South Korean students was approximately 596,whereas the corresponding mean score among the U.S. students wasapproximately 508, showing a 88-point difference.
The third column of Table 3 shows the trends in the strength of therelationship between SES and math performance across cohort groups inSouth Korea and the United States. Results show that, although therelationship between SES and student achievement tended to be strongeramong the recent cohorts (e.g., 2007) than among the earlier cohorts (e.g.,1999) in both South Korea and the United States, it tended to be strongeramong the students in South Korea than among those in the United Statesacross cohort groups. For example, in South Korea, the influence of SESexplained approximately 13% of the variance in math performance in 1999,
Table 3. Trends in the Relationship between SocioeconomicBackground and Math Performance in South Korea
and the United States.
Country/
Cohort
Group
Unadjusted
Mean Score
SES-Adjusted
Mean Score
Strength of the
Relationship
between SES and
Math Performance
Magnitude of the Impact
of SES on Math
Performancea
Mean
score
SE Mean
score
SE Percentage of
explained variance
in math
performance
Score point
difference associated
with one unit on the
index of SES
SE
South Korea
1999 586.7 2.2 587.7 1.8 13.4 25.9 1.2
2003 587.9 2.7 589.0 2.0 17.2 29.3 1.3
2007 596.1 3.0 597.3 2.3 16.8 32.0 1.4
United States
1999 481.3 4.6 479.9 4.0 10.0 17.2 1.1
2003 503.2 4.0 503.2 3.4 14.0 18.2 1.1
2007 508.1 3.1 507.3 2.7 13.0 17.9 1.1
Note: Data were weighted for each cohort and country.
Sources: TIMSS 1999, 2003, and 2007.aMultilevel regression of math performance on the SES, the slope is the multilevel regression
coefficients for the SES.
Growing Educational Inequality in South Korea 173
whereas it explained approximately 17% in 2003 and 2007. In the UnitedStates, the corresponding proportions were 10%, 14% and 13% in 1999,2003, and 2007, respectively.
The last column of Table 3 displays the changes in the magnitude ofthe impact of SES since 1999, 2003, and 2007 in South Korea and theUnited States. The results clearly show that the influence of SES on studentachievement has increased over time in South Korea. In 1999, one standarddeviation difference in the index of SES was associated with an averageperformance difference of approximately 25 score points. In 2003, it wasassociated with an average performance difference of approximately 29score points. In 2007, an average score difference was 32 score points. Thistendency was less evident for the United States. The corresponding averagescore differences remained in the range of 17–18 score points. The followingsection discusses these results.
DISCUSSION
Education has long been seen as a powerful instrument of social mobilityin South Korean society (Oh, 2000). In recent years, however, educationhas been increasingly recognized as playing a role in reproducing classconditions rather than promoting social mobility in contemporary SouthKorean society, with many South Korean scholars documenting the gap instudent achievement among students with differing socioeconomic back-grounds (Byun, 2009; Byun & Kim, 2006, 2008a, 2008b; Chang & Sohn,2005; Kim, 2005, 2006; Park et al., 2009). There have been growing concernswith regard to whether this socioeconomic gap will continue to widen inSouth Korea. However, little is known about whether achievement gapbetween children from advantageous and disadvantageous home back-grounds has indeed grown over time during the past decade, when incomeinequality began to rise and market-based educational alternatives alsobegan to reshape South Korean secondary schooling. This study addressesthis gap in empirical knowledge by investigating the trends betweensocioeconomic background and student achievement in South Korea, usingdata from the three most recent assessment cycles (i.e., 1999, 2003, and2007) of TIMSS and comparing the results of South Korea with those of theUnited States.
The TIMSS data revealed several contrasting trends between SouthKorea and the United States with respect to the variance in studentachievement among schools and the relationship between socioeconomic
SOO-YONG BYUN AND KYUNG-KEUN KIM174
background and student achievement. First, the between-school variance instudent achievement has increased during the past decade in South Korea,whereas it has decreased over time in the United States. Yet, South Korea’sbetween-school variance has remained much smaller than that of the UnitedStates. Second, although South Korean students have consistently showedhigher math performance than their counterparts in the United States, theextent to which socioeconomic background relates to student achievementhas remained much stronger in South Korea than in the United Statesacross different cohort groups. This finding is somewhat surprising, giventhat the United States has been known to produce relatively largeperformance differences between students of different backgrounds.However, prior research found similar evidence (WoXmann, 2000). Last,but not least, the influence of socioeconomic background on studentachievement has increased over time during the past decade in South Korea,suggesting growing educational inequality. On the contrary, the impact ofsocioeconomic background has remained relatively stable across cohortgroups in the United States.
To facilitate a more meaningful interpretation, Fig. 6 graphically depictsthe contrasting trends in the relationship between socioeconomic back-ground and student achievement in South Korea and the United States. Thelevel of the socioeconomic gradient line in Fig. 6 indicates the average mathachievement score reached by those students having similar SES for eachcohort and country (see column 2 of Table 3). The slope indicates the extentof the inequality in math performance attributable to SES and is measuredin terms of the difference that one unit on the SES scale makes on thestudent performance in math (see column 4 of Table 3). Higher levels of thegradients indicate higher math performance (i.e., greater excellence),whereas steeper gradients indicate the greater impact of SES on studentperformance (i.e., greater inequality).
Fig. 6 clearly shows that South Korean students outperformed their U.S.counterparts across cohort groups. Noteworthy is that the South Koreanstudents at the bottom of the SES distribution performed as well as theirU.S. counterparts at the top of the SES distribution, suggesting excellence inlower South Korean education in terms of relatively high performance inmath. However, the steeper gradient line slope among the recent cohortstudents (i.e., 2007) in comparison to that among the earliest cohort students(i.e., 1999) in South Korea suggests a widening socioeconomic gap in studentachievement. For the United States, the slope of the gradient line acrosscohort groups has remained relatively stable across different cohort students,showing a relatively less clear trend in the widening socioeconomic gap.
Growing Educational Inequality in South Korea 175

Taking a closer look at Fig. 6 reveals another important trend. Althoughthere has been a tendency toward improvement in average mathperformance between 1999 and 2007 in both South Korea and the UnitedStates, South Korea’s improvement appears to largely reflect the gainsamong the students from higher SES families (e.g., þ2 standard deviationsabove mean SES), whereas the United States’s improvement appears toequally reflect the gains across students of varying socioeconomic back-grounds. In fact, the average math performance of the South Koreanstudents at the bottom of the SES distribution (e.g., �2 standard deviationsbelow mean SES) appears to have worsened. The strong positive correla-tion between socioeconomic background and student achievement isconsistent with a recent study that found a widening gap between high-and low-achieving students in South Korea (Park, 2009). Together, thefindings suggest that the trend of growing educational inequality is moreevident in South Korea than in the United States.
The contrasting trends between South Korea and the United States couldbe attributable to various differences between the two countries, reflecting
Fig. 6. Trends in the Relationship between Socioeconomic Background and
Student Achievement in South Korea and the United States. Sources: TIMSS 1999,
2003, and 2007.
SOO-YONG BYUN AND KYUNG-KEUN KIM176
the consequences of the different educational reform strategies employed(as discussed in the ‘‘Background’’ section above). On the one hand, therelatively low level of variance in student achievement among schools inSouth Korea may be attributable to certain structural features of SouthKorea’s egalitarian approach to lower secondary education. On the otherhand, the trend of the increasing between-variance and influence ofsocioeconomic background may be the result of the recent educationaltransformation that has been increasingly geared toward school choice andcurriculum differentiation in South Korea’s secondary schooling. Likewise,the relatively high level of between-school variance in student achievementin the United States may reflect the high degree of heterogeneity amongschools, whereas the decreasing between-school variance may be attributableto the greater effort that the United States has been making toward thereduction of inequality between schools over the recent decades.
This study has important policy implications for the reduction ofeducational inequality in South Korea as well as other countries. A growingbody of cross-national research of student achievement (e.g., Buchmann &Parrado, 2006; Park, 2008c; Pong, Dronkers, & Hampden-Thompson, 2003;Xu, 2008) has shown that institutional and policy arrangements matter inthe process of educational stratification and inequality, offering evidencein support of institutional theory arguments (Kerckhoff, 1995, 2001). Ourcomparative analysis adds more evidence to demonstrate that differenteducational approaches lead to different results with respect to educationalequality. In South Korea, the recent shift from the egalitarian approach tothe market-oriented approach (e.g., increasing school choice and curriculumdifferentiation) to education may lead to higher educational inequality unlessother policy interventions are also considered. Indeed, a recent study (Green,2009) found that countries with the most comprehensive education systems(e.g., the Nordics) have the most equal outcomes, whereas countries withschool choice and diversity (e.g., the United Kingdom) have a high degree ofeducational inequality. Taken together, the findings suggest that institutionaleducational changes can make a difference in educational inequality.
NOTES
1. Free compulsory education at the lower secondary level began in 1985 withremote mountainous and island areas; it expanded to rural areas in the early 1990sand to all cities across the nation in 2004 (MEST, 2009b).
Growing Educational Inequality in South Korea 177
2. The high school–bound students in the non-HSEP region are exceptional. In aregion that has not implemented the HSEP, general high schools are allowed to selecttheir students mainly on the basis of their middle school academic records. Specialpurpose high schools such as foreign language and science schools are also allowedto select their students on the basis of their middle school academic records and othercriteria (e.g., written essays and in-depth interviews).3. Although varying from region to region, general assignment procedures under
the HSEP are as follows: (1) high school–bound students are screened on the basisof their middle school records (e.g., school performance), (2) screened studentsare allowed to apply to three general high schools within their school district, and(3) they are assigned to one of those schools by a computerized lottery system. In aregion that has not adopted the HSEP, students are allowed to apply to high schoolsthat they wish to enter, and individual general high schools select their students onthe basis of students’ middle school performance. Decisions with respect to theadoption of the HSEP are made by the local education office based on an agreementamong the members of the community (e.g., parents and teachers).4. As of 2009, 28 cities had adopted the HSEP, affecting approximately 75% of
the total general high school student population (MEST, 2009b).5. Extra lessons are often provided before and after regular lessons.
ACKNOWLEDGMENTS
The authors are indebted to Hyunjoon Park for his thoughtful commentsand suggestions on an earlier version of this manuscript. The authors alsothank several anonymous reviewers for their helpful advice.
REFERENCES
Alexander, K. L., & McDill, E. L. (1976). Selection and allocation within schools: Some causes
and consequences of curriculum placement. American Sociological Review, 41, 963–980.
Baker, D., & Stevenson, D. (1986). Mother’s strategies for children’s school achievement:
Managing the transition to high school. Sociology of Education, 59(3), 156–167.
Brown, P. (1990). The third wave: Education and the ideology of parentocracy. British Journal
of Sociology of Education, 11(1), 65–85.
Buchmann, C., & Parrado, A. E. (2006). Educational achievement of immigrant-origin and
native students: A comparative analysis informed by institutional theory. International
Perspectives on Education and Society, 7, 345–377.
Byun, S. (2009). Assessing the role of shadow education in social reproduction: The case of
South Korea. Paper presented at the workshop for The Contours of South Korean
Education: Educational Challenges of Recent Economic and Demographic Changes,
University of Pennsylvania, Philadelphia.
Byun, S., & Kim, K. (2006). The impact of cultural and economic capital on student
achievement in South Korea. Paper presented at the annual meeting of the American
Sociological Association, Montreal.
SOO-YONG BYUN AND KYUNG-KEUN KIM178
Byun, S., & Kim, K. (2008a). Parental involvement and student achievement: Focusing on
differential effects by family socioeconomic status. Korean Journal of Sociology of
Education, 18(1), 39–66.
Byun, S., & Kim, K. (2008b). The impact of cultural capital on educational outcomes of high
school students in South Korea. Korean Journal of Sociology of Education, 18(2), 53–82.
Byun, S., & Kim, K. (2009). Revisiting the effects of the high school equalization policy:
A propensity score matching approach. Paper presented at the fourth conference of the
Korean Education and Employment Panel, Seoul.
Chang, S., & Sohn, B. (2005). The effects of family background on academic achievement.
Korean Journal of Sociology, 39(4), 198–230.
Coleman, J., Campbell, E. Q., Hobson, C., McPartland, J., Mood, A., Weinfeld, F., & York, R.
(1966). Equality of educational opportunity. Washington, DC: U.S. Government Printing
Office.
Gamoran, A. (1987). The stratification of high school learning opportunities. Sociology of
Education, 60, 135–155.
Green, A. (2009). Education, inequality, and erosion of social cohesion. Forum: For Promoting
3-19 Comprehensive Education, 51(1), 5–8.
Hoffer, T. (1992). Middle school ability grouping and student achievement in science and
mathematics. Educational Evaluation and Policy Analysis, 14, 205–227.
Jimerson, S. R. (2001). Meta-analysis of grade retention research: Implications for practice in
the 21st century. School Psychology Review, 30(3), 420–437.
Kang, S., Jang, W., Kim, J., Jang, J., Kim, Y., Yoon, J., Ryu, H., Namgoong, J., & Nam, M.
(2005). An empirical study on the effect of the high school equalization policy on student
achievement. Seoul: Korean Educational Development Institute.
Kao, G. (2004). Parental influences on the educational outcomes of immigrant youth.
International Migration Review, 38(2), 427–449.
Kao, G., & Turney, K. (2009). Barriers to school involvement: Are immigrant parents
disadvantaged? Journal of Educational Research, 102, 257–271.
Kerckhoff, A. C. (1986). Effects of ability grouping in British secondary schools. American
Sociological Review, 51, 842–858.
Kerckhoff, A. C. (1995). Institutional arrangements and stratification processes in industrial
societies. Annual Review of Sociology, 15, 323–347.
Kerckhoff, A. C. (2001). Education and social stratification processes in comparative
perspective. Sociology of Education, 74(Extra issue), 3–18.
Kim, H., Cho, I., Na, J., Cha, D., & Gim, J. (2004). A study on the implementation strategies of
ability grouping between classes in the secondary schools. Seoul: Korean Educational
Development Institute.
Kim, K. (2005). Educational gap in Korea and determinant factors. Korean Journal of Sociology
of Education, 15(3), 1–27.
Kim, K. (2006). The effects of family disruption on academic achievement. Korean Journal of
Sociology of Education, 16(1), 27–29.
Kim, M., Lee, H., & Cheong, G. (2008). A study on the expansion of ability grouping between
classes for promoting excellence. Seoul: Korean Educational Development Institute.
Kim, S., & Lee, J. (2003). The secondary school equalization policy in South Korea. Unpub-
lished manuscript. Available at http://www.kdischool.ac.kr/download/Faculty_resume/
Equalization3.pdf
Kim, T., Lee, M., Lee, Y., & Lee, J. (2004). Empirical analysis of the effects of the high school
equalization policy on student achievement. Seoul: Korean Development Institute.
Growing Educational Inequality in South Korea 179
Korea National Statistical Office. (2009a). Divorces and crude divorce rates for provinces
(Available at http://ups.kosis.kr/.). Seoul: KNSO.
Korea National Statistical Office. (2009b). Age-specific fertility rate and total fertility rate
(Available at http://ups.kosis.kr/.). Seoul: KNSO.
Korea National Statistical Office. (2009c). The survey of private education expenditures in 2008.
Seoul: KNSO.
Lareau, A. (1987). Home advantage. New York, NY: Falmer.
Lee, E. V., Croninger, G. R., & Smith, B. J. (1994). Parental choice of schools and social
stratification in education: The paradox of Detroit. Educational Evaluation and Policy
Analysis, 16(4), 434–457.
Lee, J. (2001). School reform initiative as balancing acts: Policy variation and educational
convergence among Japan, Korea, England, and the United States. Journal of Education
Policy Analysis Archives, 9(13), 1–16.
Loveless, T., Parkas, S., & Duffett, A. (2008). High-achieving students in the era of no child left
behind (Available at http://www.edexcellence.net/doc/20080618_high_achievers.pdf ).
Washington, DC: Thomas B. Fordham Foundation and Institute.
Ministry of Education. (1998). Fifty years of history of Korean education. Seoul: MOE.
Ministry of Education. (2004). Comprehensive plans for excellence in education. Seoul: MOE.
Ministry of Education, Science, and Technology. (2008). Major policies and plans for 2009
(Available at http://english.mest.go.kr). Seoul: MEST.
Ministry of Education, Science, and Technology. (2009a). Statistics for primary and secondary
education (Available at http://english.mest.go.kr/main.jsp?idx ¼ 0401020101). Seoul:
MEST.
Ministry of Education, Science, and Technology. (2009b). Introduction for secondary education
(Available at http://english.mest.go.kr/main.jsp?idx ¼ 0201040101). Seoul: MEST.
Moe, M. T., & Chubb, E. J. (1990). Politics, markets, and America’s schools. Washington, DC:
Brookings Institution.
Mullis, I. V. S., Martin, M. O., & Foy, P. (2008). TIMSS 2007 International mathematics
report. TIMSS & PIRLS International Study Center, Boston College, Chestnut
Hill, MA. Available at http://timss.bc.edu/timss2007/PDF/TIMSS2007_International
MathematicsReport.pdf
Oh, O. (2000). Educational fever in South Korea: Its origins and deepening. Seoul: Gyoyook
Gwahaksa.
Olson, J. F., Martin, M. O., & Mullis, I. V. S. (2008). TIMSS 2007 technical report. TIMSS &
PIRLS International Study Center, Boston College, Chestnut Hill, MA. Available at
http://timss.bc.edu/timss2007/PDF/TIMSS2007_TechnicalReport.pdf
Organisation for Economic Co-operation and Development. (2007). PISA 2006: Science
competencies for tomorrow’s world, Vol. 1. OECD, Paris. Available at http://www.oecd.
org/dataoecd/30/17/39703267.pdf
Organisation for Economic Co-operation and Development. (2008). Education at glance 2008
(Available at http://www.oecd.org/dataoecd/23/46/41284038.pdf ). Paris: OECD.
Organisation for Economic Co-operation and Development. (2009). OECD factbook 2009:
Economic, environmental and social statistic (Available at http://puck.sourceoecd.org/
vl ¼ 2151324/cl ¼ 40/nw ¼ 1/rpsv/factbook2009/index.htm). Paris: OECD.
Park, B. (1988). The state, class and educational policy: A case study of South Korea’s high school
equalization policy. Unpublished doctorate dissertation, University of Wisconsin-
Madison, WI.
SOO-YONG BYUN AND KYUNG-KEUN KIM180
Park, H. (2008b). Effects of single parenthood on educational aspiration and student
disengagement in Korea. Demographic Research, 18(13), 337–408.
Park, H. (2008c). The varied educational effects of parent-child communication: A comparative
study of fourteen countries. Comparative Education Review, 52, 219–243.
Park, H. (2009). Growing curriculum differentiation and its implications for inequality in
Korea. Paper presented at the annual meeting of Association of Asian Studies, Chicago.
Park, H., Kim, K., & Byun, S. (2009). Private tutoring as a form of parental involvement:
parental involvement and students’ cognitive outcomes in South Korea. Paper presented
at the annual meeting of the American Sociological Association, San Francisco.
Park, K. (2008a). Population change in South Korea. In: H. Seok (Ed.), Korean social trends
2008 (pp. 5–16). Seoul: Korea Social Science Data Archive Esquire Foundation.
Pong, S., Dronkers, J., & Hampden-Thompson, G. (2003). Family policies and children’s
school achievement in single- versus two-parent families. Journal of Marriage and
Family, 65, 681–699.
Raudenbush, W. S., & Bryk, S. A. (2002). Hierarchical linear models: Applications and data
analysis methods. Thousand Oaks: Sage.
Seol, D. (2005). Optimum population of undocumented foreigners in Korea. Seoul: Ministry of
Justice.
Seth, J. M. (2002). Education fever: Society, politics, and the pursuit of schooling in South Korea.
Honolulu: University of Hawaii Press.
Sung, K. (2002). The analysis of the relationship between high school equalization policy and
the general low-achievement phenomenon of the students. Korean Journal of Sociology
of Education, 12(3), 121–135.
Sung, K. (2004). A hierarchical linear modeling on the effects of high school equalization policy
on high school students’ achievement. Korean Journal of Sociology of Education, 14(3),
87–106.
United Nations, Department of Economic and Social Affairs, Population Division. (2007).
World population prospects: The 2006 revision, highlights. Working Paper no. ESA/
P/WP.202. UN, New York, NY. Available at http://www.un.org/esa/population/
publications/wpp2006/WPP2006_Highlights_rev.pdf
United Nations Statistics Division. (2008). Table 25. Divorce and crude divorce rates by urban/
rural residence: 2002–2006. UNSD, New York, NY. Available at http://unstats.un.org/
unsd/demographic/products/dyb/dyb2006/Table25.pdf
Wells, A. S. (1993). The sociology of school choice: Why some win and others lose in the
educational marketplace. In: E. Rasell & R. Rothstein (Eds), School choice: Examining
the evidence (pp. 29–48). Washington, DC: Economic Policy Institute.
Willms, J. D. (2003a). Ten hypotheses about socioeconomic gradients and community differences in
children’s developmental outcomes (Available at http://www.unb.ca/crisp/pdf/0305.pdf ).
Quebec: Human Resources Development Canada Publications Centre.
Willms, J. D. (2003b). Literacy proficiency of youth: Evidence of converging socioeconomic
gradients. International Journal of Educational Research, 39, 247–252.
Willms, J. D. (2006). Variation in socioeconomic gradients among Cantons in French- and
Italian-speaking Switzerland: Findings from the OECD PISA. Educational Research and
Evaluation, 12(2), 129–154.
Willms, J. D., & Echols, F. H. (1993). The Scottish experience of parental school choice. In:
E. Rasell & R. Rothstein (Eds), School choice: Examining the evidence (pp. 49–68).
Washington, DC: Economic Policy Institute.
Growing Educational Inequality in South Korea 181
WoXmann, L. (2000). Schooling resources, educational Institutions, and student performance: The
international evidence. Kiel Working Paper no. 983. Kiel Institute of World Economics,
Kiel, Germany. Available at http://www.uni-kiel.de/ifw/pub/kap/2000/kap983.pdf
Xu, J. (2008). Sibship size and educational achievement: The role of welfare regimes cross-
nationally. Comparative Education Review, 52(3), 414–436.
Yoon, I. (2008). An increase in international immigration. In: H. Seok (Ed.), Korean social
trends 2008 (pp. 24–29). Seoul: Korea Social Science Data Archive Esquire Foundation.
Zhou, M. (1997). Growing up American: The challenge confronting immigrant children and
children of immigrants. Annual Review of Sociology, 23, 63–95.
SOO-YONG BYUN AND KYUNG-KEUN KIM182