Embed Size (px)
Citation preview

Industries, �rms and brands:
a view on Multinationals
Vanessa Alviarez
Sauder Business School
University of British Columbia
OECD workshopNovember, 2018
Alviarez (UBC) Multinationals

Multinationals shape:
I Countries' comparative advantage.
I Cross-country propagation of aggregate shocks.
I Market concentration.
Alviarez (UBC) Multinationals

Multinational Production and
Comparative Advantage
Alviarez (UBC) Multinationals

Multinational Production (MP) shapes
countries' patterns of production
I Oftentimes, countries host large foreign multinationals in sectorswhere they lack major local �rms.
I In other sectors, large local companies dominate, deterring the
operations of foreign a�liates in their market.
I Spain is the world's 8th-largest producer of cars under theleadership of foreign a�liates of Daimler AG, Ford,Peugeot, GM, Nissan, Renault, and Volkswagen.
I In Italy, however, prominent home-based companies, suchas Ferrari or Fiat, capture a dominant share of the market.
=⇒ Country's comparative advantage is jointly determined bythe productivities of local producers and MP in the economy.
=⇒ By altering sectoral productivities, MP shapes thecross-country trade and cross-border patterns of production.
Alviarez (UBC) Multinationals

Relevance for Policy
I Undertanding this relationship help us to asses the responses of
trade and multinational production (MP) to shocks a�ecting the
level of cross borders production frictions
I Policies strengthening investor-state dispute settlementprovisions and fortify intellectually property rights.
I Role of MP frictions and the sectoral structure of local
producers' capabilities in explaining cross-country di�erences in:
I Industrial composition of inward MP.I Pool of investing countries that each economy hosts.
Alviarez (UBC) Multinationals
Stylized Fact
I Sectoral di�erences in MP shares are stronglycorrelated with Ricardian productivitydi�erences.
I Observed shares of inward MP are larger in sectorswhere local producers are relatively less productive
I Productivity enhancement is uneven and biasedtowards sectors in which locals exhibit comparativedisadvantage.
Alviarez (UBC) Multinationals
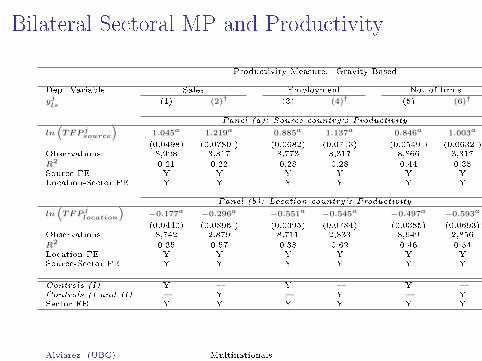
Bilateral Sectoral MP and Productivity
Productivity Measure: Gravity Based
Dep. Variable Sales Employment No. of �rms
yjls
(1) (2)† (3) (4)† (5) (6)†
Panel (a): Source country's Productivity
ln(TFP jsource
)1.045a 1.219a 0.885a 1.137a 0.846a 1.003a
(0.0498) (0.0780 ) (0.0682) (0.0713) (0.0549 ) (0.0632 )Observations 8,928 3,317 8,773 3,317 8,866 3,317
R2 0.21 0.22 0.28 0.28 0.44 0.35Source FE Y Y Y Y Y YLocation-Sector FE Y Y Y Y Y Y
Panel (b): Location country's Productivity
ln(TFP
jlocation
)−0.177a −0.296a −0.551a −0.545a −0.497a −0.593a
(0.0440) (0.0896 ) (0.0395) (0.0784) (0.0385) (0.0693)Observations 8,742 2,879 8,711 2,833 8,649 2,856
R2 0.35 0.57 0.38 0.62 0.46 0.54Location FE Y Y Y Y Y YSource-Sector FE Y Y Y Y Y Y
Controls (I) Y � Y � Y �Controls (I and II) � Y � Y � YSector FE Y Y Y Y Y Y
Alviarez (UBC) Multinationals
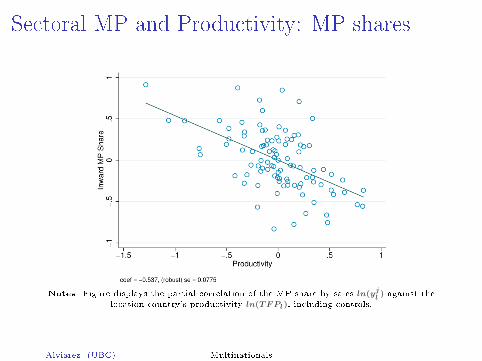
Sectoral MP and Productivity: MP shares
Notes: Figure displays the partial correlation of the MP share by sales ln(yjl) against the
location country's productivity ln(TFPl), including controls.
Alviarez (UBC) Multinationals
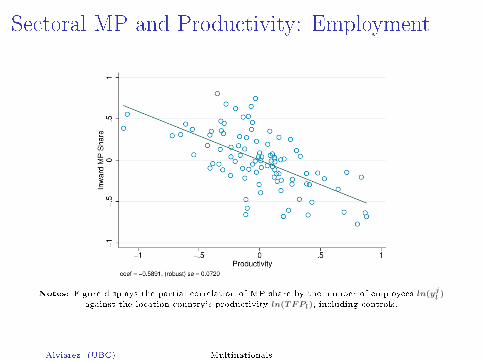
Sectoral MP and Productivity: Employment
Notes: Figure displays the partial correlation of MP share by the number of employees ln(yjl)
against the location country's productivity ln(TFPl), including controls.
Alviarez (UBC) Multinationals
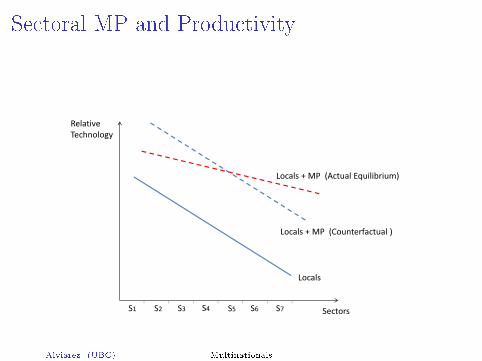
Sectoral MP and Productivity
��������
������ �
�������������������������������
�������� �� �� �� �� �� ��
�����
����������� �������� �������
Alviarez (UBC) Multinationals

Gains from trade GT
I GT can be decomposed into two multiplicative terms:
I Aggregate domestic trade shareI Dispersion of domestic trade shares across sectors.
GTl =W lg>0,d>0
W lg>0,d→∞
= (πll)− 1θ︸ ︷︷ ︸
aggregate domestictrade share
× (1−Aπll)− 1θ︸ ︷︷ ︸
dispersion ofdomestic trade shares
I GT increase with the dispersion of domestic trade shares, Aπll ,and decrease in aggregate domestic shares, πll.
Alviarez (UBC) Multinationals

A Multi-Sector Model of Trade and MP
I Develops a multi-sector extension of the benchmarkRicardian model of trade and multinational production(Ramondo & Rodríguez-Clare, 2013).
I Model nests fundamental and e�ective comparativeadvantage in a uni�ed framework
I Incorporating multiple sectors and multiple factors ofproduction (Levchenko & Zhang, 2016);
I Allows for export platformsI Asymmetric and sector speci�c MP barriers;I Heterogeneous preferences;I Di�erences in factor and intermediate input intensities
across sectors: input-output inter-linkages, inter- andintra-sectoral trade; and
I A non-tradable sector.
Alviarez (UBC) Multinationals

E�ective and Fundamental Productivities
Alviarez (UBC) Multinationals
MP Liberalization: Total and Adjusted
I Counterfactual exercise in which MP costs are reducedgradually and uniformly from their initial value up to a30% discount.
I Decompose the total e�ects on welfare into twocomponents: total e�ect and adjusted e�ect.
I Adjusted isolate the e�ects due to changes in thesectoral dispersion of MP and trade shares.
I GMP increase on average by 5 percentage points whenMP barriers are 30% lower.
I Around 1.3 percentage points (26%) are explained bychanges in the dispersion of sectoral trade and MPshares.
Alviarez (UBC) Multinationals

Counterfactuals: Removing Fundamental
Comparative Advantage
Alviarez (UBC) Multinationals

Impact of MP on E�ective Productivities
I Scenario in which MP only a�ects the average productivity ofthe economy, while keeping the same comparative advantage oflocal producers.
I GT are 12% higher if MP only enhances aggregate productivitywithout eroding host country's comparative advantage.
Alviarez (UBC) Multinationals
Welfare Gains and Non-tradable Sector
I When MP in non-tradables becomes prohibitivelycostly, real income decreases by 4.7% and GO declineby 24.7%.
I Increase of 1.54% and 3.35% in price index ofmanufacturing goods and overall price index, respectively.
Alviarez (UBC) Multinationals

The growth of multinational �rms in the
Great Recession (with Javier Cravino
and Andrei A. Levchenko)
Alviarez (UBC) Multinationals

MotivationI Rapid economic integration between 1980-2007
I Trade, FDI, capital �ows
I Pattern reversed during the Great Recession
1. 'Great Trade Collapse'2. Large drop in �nancial �ows
I Large literature on two related questions
1. Why did cross-border capital and trade �ows declined?2. Did this contribute to the crisis?
I Not much attention to multinational �rms'performance
What happened to multinationals during the crisis?
Alviarez (UBC) Multinationals

Imports and manufacturing FMN sales relative
to GDP.7
.8.9
1
.85
.9.9
51
1.05
.81
1.2
.8.9
11.
1
.8.9
11.
11.
2
.9.9
51
1.05
1.1
.8.9
11.
11.
2
.8.9
11.
1
.6.7
.8.9
12005 2007 2009 2011 2005 2007 2009 2011 2005 2007 2009 2011
United States Austria France
Germany Netherlands United Kingdom
Spain Italy Japan
Imports/GDP Foreign Affiliate Sales/GDP
Source: OECD statisticsAlviarez (UBC) Multinationals
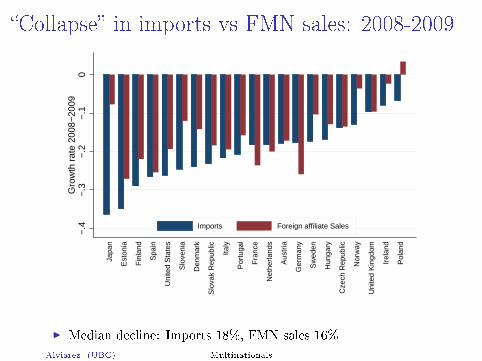
�Collapse� in imports vs FMN sales: 2008-2009
−.4
−.3
−.2
−.1
0G
row
th r
ate
2008
−20
09
Japa
n
Est
onia
Fin
land
Spa
in
Uni
ted
Sta
tes
Slo
veni
a
Den
mar
k
Slo
vak
Rep
ublic
Italy
Por
tuga
l
Fra
nce
Net
herla
nds
Aus
tria
Ger
man
y
Sw
eden
Hun
gary
Cze
ch R
epub
lic
Nor
way
Uni
ted
Kin
gdom
Irel
and
Pol
and
Imports Foreign affiliate Sales
I Median decline: Imports 18%, FMN sales 16%
Alviarez (UBC) Multinationals

Preview of results
I Sectoral and size di�erences account for most of theFMN decline
I FMNs performance varies widely depending on FMNssource country
I Implication: Multinationals will have a di�erentialimpact on aggregate output across destinationcountries hosting FMNs from di�erent sources
I Model: Multinationals contributed 0.24 percent to thedecline in growth in the median country
I Composition across sources is important for individualcountries, decline in growth ranges from 0 to 0.5 pctpoints
Alviarez (UBC) Multinationals

Firm level Data
I ORBIS (Bureau van Dijk)
I Data from business registries and annual reports
I Both publicly listed and private �rms
I Manufacturing and non-manufacturing
I 2004-2012
I Cross-�rm ownership data
I Multinationals >50% ownership
I Sample: 34 countries with good coverage sample
I Europe (Euro Area and periphery) + AUS, JPN,KOR, MEX, SGP
I Average country: 180K �rms
Alviarez (UBC) Multinationals
Observation 1
The a�liates of foreign multinationals grew faster than
domestic �rms in every year between 2004-2008 and
2009-2012. This pattern was reversed in 2008-2009.
Alviarez (UBC) Multinationals

FMN vs. domestic �rms growthFirm level evidence
(1) (2)Dep. Var.: γin,t(f)I{f∈FMN} 0.0207 0.0184
(0.0042) (0.0009)
I{f∈FMN} × I{t=2009} -0.0326 -0.0297(0.0093) (0.0023)
No. of Observations 31,521,858 31,521,858No. of Firms 6,639,262 6,639,262No. of Multinationals 214,851 214,851R2 0.0110 0.0240
Year Yes No
Dest×Year No Yes
Notes: Standard errors clustered at the source-destination level.
Alviarez (UBC) Multinationals

FMN vs. domestic �rms growth
−.0
20
.02
.04
For
eign
Affi
liate
Gro
wth
Diff
eren
tial
2005 2006 2007 2008 2009 2010 2011 2012Year
Alviarez (UBC) Multinationals

Observation 2
Within sectors, the a�liates of foreign multinational �rms
grew faster than similarly-sized domestic �rms in every
year between 2004-2012.
Much of the aggregate relative slowdown of multinational
�rms in 2008-2009 is accounted for by observable
di�erences in �rm size and by di�erences in the sectors in
which multinational �rms operate.
Alviarez (UBC) Multinationals

Understanding the collapse in multinationals
sales(1) (2) (3) (4)
Dep. Var.: γin,t(f)I{f∈FMN} 0.0207 0.0184 0.0177 0.0205
(0.0042) (0.0009) (0.0009) (0.0010)
I{f∈FMN} × I{t=2009} -0.0326 -0.0297 -0.0177 -0.0012(0.0093) (0.0023) (0.0020) (0.0017)
No. of Observations 31,521,858 31,521,858 31,302,684 31,302,216No. of Firms 6,639,262 6,639,262 6,563,480 6,563,408No. of Multinationals 214,851 214,851 212,988 212,981R2 0.0110 0.0240 0.0333 0.0422
Year Yes No No No
Dest×Year No Yes No No
Dest×Sect×Year No No Yes No
Dest×Sect×Quart×Year No No No Yes
Notes: Standard errors clustered at the source-destination level.
Alviarez (UBC) Multinationals

Propensity Score Matching
Alviarez (UBC) Multinationals

Observation 3
Multinationals from di�erent source countries fared
di�erently in the crisis
Implication: Impact of FMN decline will di�er acrosscountries hosting FMN from di�erent source countries
Alviarez (UBC) Multinationals
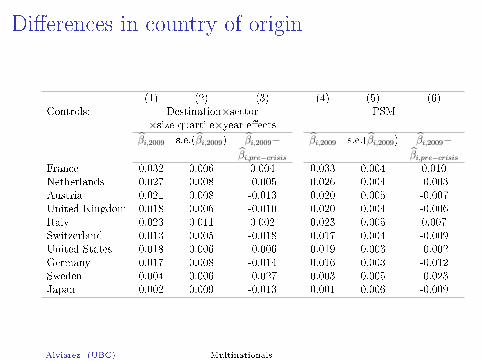
Di�erences in country of origin
(1) (2) (3) (4) (5) (6)Controls: Destination×sector PSM
×size quartile×year e�ectsβ̂i,2009 s.e.(β̂i,2009) β̂i,2009− β̂i,2009 s.e.(β̂i,2009) β̂i,2009−
β̂i,pre−crisis β̂i,pre−crisisFrance 0.032 0.006 0.004 0.033 0.004 0.010Netherlands 0.027 0.008 -0.005 0.026 0.004 -0.003Austria 0.021 0.008 -0.013 0.020 0.005 -0.007United Kingdom 0.018 0.006 -0.010 0.020 0.004 -0.006Italy 0.023 0.011 0.002 0.023 0.005 0.007Switzerland 0.013 0.005 -0.018 0.017 0.004 -0.009United States 0.018 0.006 -0.006 0.019 0.003 -0.002Germany 0.017 0.008 -0.014 0.016 0.003 -0.012Sweden 0.004 0.006 -0.027 0.003 0.005 -0.023Japan 0.002 0.009 -0.013 0.001 0.006 -0.009
Alviarez (UBC) Multinationals
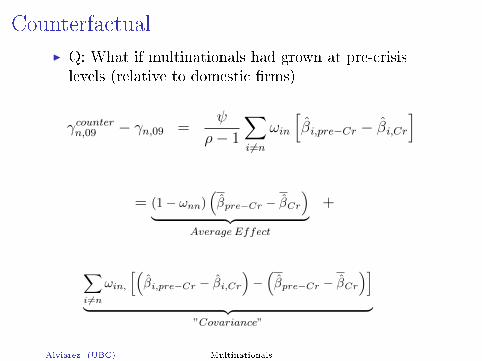
Counterfactual
I Q: What if multinationals had grown at pre-crisislevels (relative to domestic �rms)
γcountern,09 − γn,09 =ψ
ρ− 1
∑i 6=n
ωin
[β̂i,pre−Cr − β̂i,Cr
]
= (1− ωnn)(β̂pre−Cr − β̂Cr
)︸ ︷︷ ︸
Average Effect
+
∑i 6=n
ωin,
[(β̂i,pre−Cr − β̂i,Cr
)−(β̂pre−Cr − β̂Cr
)]︸ ︷︷ ︸
”Covariance”
Alviarez (UBC) Multinationals

Counterfactual
I Growth rates would have been 0.12 pp higher for the meancountry in the sample.
I And 0.18 pp on average in the top 10 destination countries
I MNCs contributed 0.5 pp s to the reduction in output inLithuania. The largest single source of foreignmulti-nationals in Lithuania is Poland, whose foreigna�liates did quite poorly in the crisis, with the growthdi�erential of -4.3% relative to the pre-crisis times.
I Estonia and Latvia were also among the countries mostnegatively a�ected. Sweden and Finland are the largestsources of foreign a�liates in these countries.
Alviarez (UBC) Multinationals
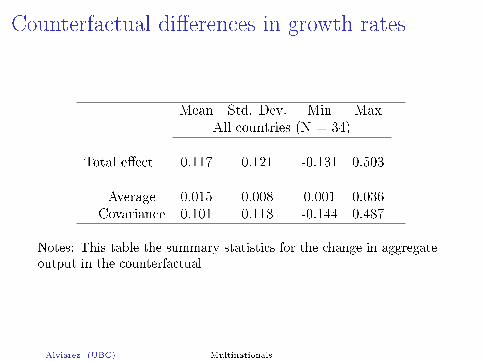
Counterfactual di�erences in growth rates
Mean Std. Dev. Min MaxAll countries (N = 34)
Total e�ect 0.117 0.121 -0.131 0.503
Average 0.015 0.008 0.001 0.036Covariance 0.101 0.118 -0.144 0.487
Notes: This table the summary statistics for the change in aggregateoutput in the counterfactual
Alviarez (UBC) Multinationals

Local Origin, Foreign Ownership:
Multinational amalgamation of brands
(with Thierry Mayer and Keith Head)
(Preliminary)
Alviarez (UBC) Multinationals
Rising concentration and brand amalgamation
I A feature of modern market economies is the dominance ofenormous multinational corporations (MNCs).
I Under the traditional view MNCs become so large byachieving economies of scale in a set of core productsdeveloped at headquarters.
I A lesser discussed route is the amalgamation of brandsdeveloped in multiple countries through cross-borderacquisitions.
Alviarez (UBC) Multinationals

Brand amalgamation: Beer
Alviarez (UBC) Multinationals

Why MNCs acquire foreign brands
I What the MNC wants:I Bypass the home bias that limits MNCs ability to sellit's existing roster of (foreign) brands.
I Acquire superstar brands that have multi-marketpotential.
I Why the MNC can outbid local owners:I The MNC has other brands that it can sell throughthe local target's distribution channels.
I The MNC has distribution assets in other marketsthat can be exploited to sell the targeted brand morewidely.
Alviarez (UBC) Multinationals

Examples of brand amalgamation
I US-based snack foods maker Mondelez (spun o� fromKraft), is the 2nd largest chocolate seller in the world.
I 81% of its chocolate sales via brands originating in Britain(Cadbury), Belgium (Cote d'Or), Switzerland (Toblerone,Milka), Norway (Freia, Marabou), and Greece (Lacta).
I Flagship brands are important, but represent a smallershare of big brewers' world sales:
I AB-Inbev: Budweiser 12.3%, Stella 4.2%.I Heineken brand: 27.3%.I Carlsberg brand: 17.8%
I Diageo, owner of Johnnie Walker, Smirno�,Tanqueray.I Had a market share of less than two percent in India before
it bought the local Group United Breweries, and now it hasa 39% market share.
Alviarez (UBC) Multinationals

This paper
I Documents the international expansion of MNCs throughthe acquisition of brands created in other countries.
I Quanti�es the impact of acquired brands on brand and�rm size heterogeneity.
I Uses a CES oligopoly multi-product model in order to inferbrand's appeal and delivered marginal cost, and estimatehow changes in brand's corporate headquarters a�ectconsumers' demand and �rms' costs.
I Constructs a counterfactual evaluating the impact ofchanges in brands' ownership matrix across countries onmarket concentration.
Alviarez (UBC) Multinationals

Dataset
I Unique dataset of sales value and/or volume for over83,000 brands owned by 46,000 companies, across 153product categories, in 79 countries (Global MarketInformation Dataset (GMID))
I Track national and cross-border changes in ownershipat the brand level occurred over 2006�2016.
I Apply classi�cation algorithm using Wikipedia, USPTO,and WIPO, to identify each brand's country of origin.
I Separate headquarter country of current owner from thecountry in which the brand was originally created.
I The headquarter country of each company in the dataset isobtained by name matching Orbis, Lexis Nexis and SDCplatinum database
Alviarez (UBC) Multinationals
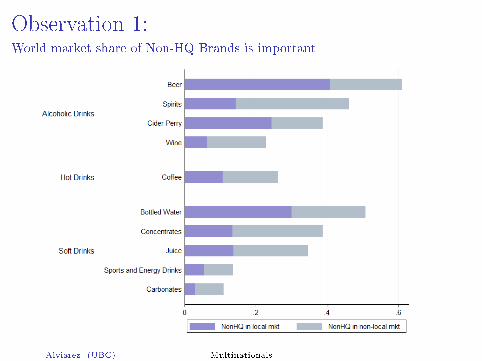
Observation 1:World market share of Non-HQ Brands is important
Alviarez (UBC) Multinationals

10 largest companies: Beer
Alviarez (UBC) Multinationals

Observation 2:NonHQ brands signi�cantly contribute to market concentration
Category CR4 CR4 (Non HQ)
Beer 0.86 0.56Bottled Water 0.71 0.37Carbonates 0.89 0.13Cider Perry 0.82 0.34Co�ee 0.82 0.25Concentrates 0.71 0.32Juice 0.63 0.35Spirits 0.60 0.32Sports and Energy Drinks 0.83 0.17Wine 0.55 0.19
Alviarez (UBC) Multinationals

Observation 3-5
I Observation 3: HQ brands�on average�are available inmore markets compare to NonHQ brands.
I Observation 4: Acquisition of NonHq brands is 18.5% morelikely the lower the market share of �agship brands.
I Observation 5: On average the price of acquired brandsincreases by 1.7%, and market share decreases by 2.3%after acquisition takes place.
Alviarez (UBC) Multinationals

A quantitative framework
We interpret the data from the lens of a quantitative frameworkin order to:
I Understand the role of the acquired portfolio of brands inexplaining the observed level of �rm heterogeneity.
I Quantify the impact of �acquired appeal�.I Quantify the cost e�ect of acquired brands.
Alviarez (UBC) Multinationals

Contribution of �original� and �acquired� brands
∆c lnYft =
Firm's Appeal︷ ︸︸ ︷(σ − 1)
[∆c
(NOfb
NfblnϕOft
)]︸ ︷︷ ︸
Appeal of Original Brands
+ (σ − 1)
[∆c
(NAfb
NfblnϕAft
)]︸ ︷︷ ︸
Appeal of Acquired Brands
+ ∆c lnNft︸ ︷︷ ︸Scope
+
Firm's Marginal Cost︷ ︸︸ ︷(σ − 1)∆c ln
(1
c̃Oft
)︸ ︷︷ ︸MC Original Brands
+ (σ − 1)∆c ln
(1
c̃Aft
)︸ ︷︷ ︸MC Acquired Brands
+ ∆c ln
[1
Nft
∑b∈B
(c̃ftcbt
ϕbt
)σ−1]︸ ︷︷ ︸
Cost-appeal covariance
− (σ − 1)∆c lnµft︸ ︷︷ ︸Markup
Alviarez (UBC) Multinationals

Contribution of acquired brands to appeal
Alviarez (UBC) Multinationals

Decomposing e�ects of frictionsln sbn lnAbn ln cbn lnµbn
mkt. share Appeal Bertrand Cournot Bertrand Cournot
Brand originshome 0.980a 0.315a -0.179a -0.260a 0.051a 0.128a
(0.097) (0.068) (0.028) (0.031) (0.008) (0.017)ln dist -0.178a -0.052a 0.051a 0.058a -0.006b -0.014a
(0.027) (0.020) (0.011) (0.011) (0.003) (0.005)lang 0.163a 0.010 -0.071a -0.081a 0.005 0.011
(0.063) (0.051) (0.025) (0.026) (0.006) (0.011)Corporate Headquartershome 0.136c 0.024 -0.040 -0.065b 0.015b 0.040b
(0.077) (0.053) (0.026) (0.029) (0.007) (0.016)ln dist -0.033 -0.026 -0.000 0.003 -0.003 -0.008c
(0.022) (0.016) (0.009) (0.009) (0.002) (0.005)lang 0.066 0.062 0.021 0.028 -0.007 -0.012
(0.052) (0.042) (0.022) (0.024) (0.006) (0.012)Observations 142413 138153 138139 138139 144579 144579R2 0.717 0.642 0.986 0.984 0.888 0.846
Alviarez (UBC) Multinationals

Discussion of results
I While the pooled regressions hide cross-categoryheterogeneity, on average, home-origin brands have hugeadvantages: Since exp(0.98) ≈ 2.66, home increases marketshare by 166%.
I The largest impact comes on the taste side (home bias):Being a home brand raises demand equivalent to a 37%price change.
I Cost advantages of home brands are also substantial,especially under Cournot.
I Brands from nearby countries also have appeal and costadvantages.
I Brands sell somewhat better in their HQ country, evenholding brand origin constant, mainly a cost e�ect (4�7%advantage).
Alviarez (UBC) Multinationals

Forced divestiture of foreign-owned,
domestic-origin brandsCounterfactual
I What is the cumulative impact on concentration andconsumer surplus from all the brand acquisitions of MNCs?
I One way to answer this is to start from the status quo andimagine a policy compelling each foreign-owned �rm to sello� the brand it owns that originate in the local market.
I We do this by creating counterfactual owners for thesebrands.
I Then, we use the Bertrand and Cournot versions of theCES oligopoly model to predict market shares andmarkups in this counterfactual.
Alviarez (UBC) Multinationals

Divestitures of acquired local brands
Bertrand
0.0 0.2 0.4 0.6 0.8
010
0020
0030
0040
0050
0060
0070
00
Share of foreign−owned, domestic origin
Mar
ket c
once
ntra
tion
(Her
finda
hl in
dex)
US
CN
JP
BR
GB
DE
MXKR
ESAU
RU
CA
FR
ZA
IT
2016 dataCF divestment
(#) %change in price index
high concentration (EU guidelines)(−1)
(−1)
(0)
(−18)
(−1)
(0)
(−5)(−6)
(−3)(−5)
(−3)
(−9)(−4)
(−38)
(−1)
Alviarez (UBC) Multinationals