Embed Size (px)
Citation preview
1
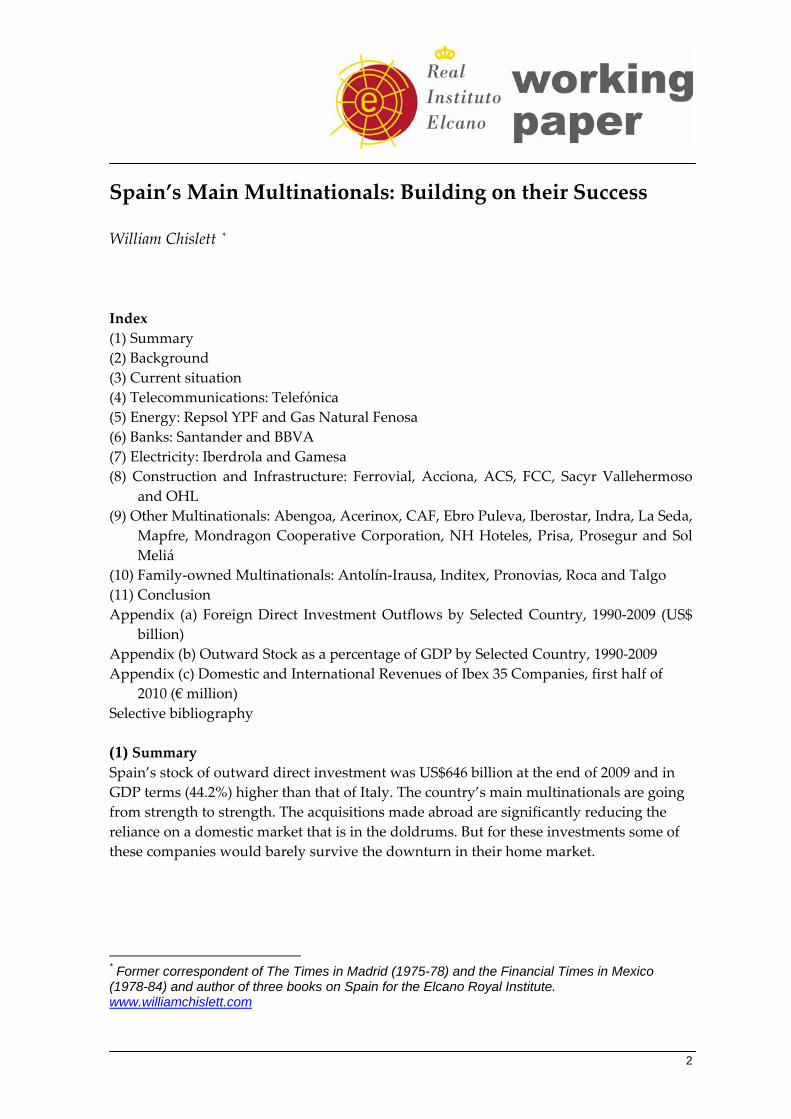
Spain’s Main Multinationals: Building on their Success
William Chislett
Area: International Economy and Trade Working Paper 29/2010
31/08/2009
Elcano Royal Institute Madrid – Spain
www.realinstitutoelcano.org
2
Spain’s Main Multinationals: Building on their Success William Chislett * Index (1) Summary (2) Background (3) Current situation (4) Telecommunications: Telefónica (5) Energy: Repsol YPF and Gas Natural Fenosa (6) Banks: Santander and BBVA (7) Electricity: Iberdrola and Gamesa (8) Construction and Infrastructure: Ferrovial, Acciona, ACS, FCC, Sacyr Vallehermoso
and OHL (9) Other Multinationals: Abengoa, Acerinox, CAF, Ebro Puleva, Iberostar, Indra, La Seda,
Mapfre, Mondragon Cooperative Corporation, NH Hoteles, Prisa, Prosegur and Sol Meliá
(10) Family‐owned Multinationals: Antolín‐Irausa, Inditex, Pronovias, Roca and Talgo (11) Conclusion Appendix (a) Foreign Direct Investment Outflows by Selected Country, 1990‐2009 (US$
billion) Appendix (b) Outward Stock as a percentage of GDP by Selected Country, 1990‐2009 Appendix (c) Domestic and International Revenues of Ibex 35 Companies, first half of
2010 (€ million) Selective bibliography (1) Summary Spain’s stock of outward direct investment was US$646 billion at the end of 2009 and in GDP terms (44.2%) higher than that of Italy. The country’s main multinationals are going from strength to strength. The acquisitions made abroad are significantly reducing the reliance on a domestic market that is in the doldrums. But for these investments some of these companies would barely survive the downturn in their home market.
* Former correspondent of The Times in Madrid (1975-78) and the Financial Times in Mexico (1978-84) and author of three books on Spain for the Elcano Royal Institute. www.williamchislett.com
3
(2) Background1 The first wave of outward foreign direct investment (FDI) in the 1960s and early 1970s was very modest, accounting for a mere 0.1% of international FDI flows. It occurred at a time when Spain took its first timid steps to open up its economy and relaxed controls on capital outflows, moving away from the autarky that followed the country’s 1936‐39 Civil War. The bulk of this investment went to European Community (EC) countries, followed by Latin America. Spain’s share in international flows increased to 0.3% in the 1970s when investment in Latin American and Caribbean countries accounted for more than half of the country’s total outflows, while that to EC countries and the US lost relative share. Financial and commercial activities accounted for around three‐quarters of Spanish FDI in Latin America and there was also some investment in manufacturing. Outward flows averaged US$260 million during the 1970s. Latin America’s external debt crisis, triggered by Mexico’s default in 1982, plunged many countries into recession and changed the course of Spain’s FDI. By 1985, the region’s share of Spain’s outward FDI had fallen from more than 50% to 20%. The 1980s were a ‘lost decade’ for Latin America. The big change and the catalyst for a much stronger drive in outward FDI came from joining the EC in 1986 and the adoption of the euro as the currency in 1998, which enabled Spanish companies to raise funds for their acquisitions at rates unimaginable just a few years back. The strategic focus of corporate Spain changed from one of defending the relatively mature home market to aggressively expanding abroad. The liberalisation of the domestic market as European single market directives began to unfold made the big Spanish companies, especially the state‐run companies in oligopolistic sectors such as telecommunications (Telefónica), oil and natural gas (Repsol and Gas Natural) and electricity (Endesa)2 –all of which were to be privatised and become cash rich– and the big banks conscious of the need to reposition themselves in the more competitive environment. The tougher environment was underscored by an inward FDI boom in the first years after EU entry when hardly a week passed without an acquisition and it seemed that Spain was up for sale. The strategic response to the threat of acquisition was to become bigger and go on the offensive. Liberalisation at home gave Spanish companies the opportunity to do this. And they seized it. Outward FDI surged from an average of US$2.3 billion in 1985‐95 to US$18.9 billion in 1998 and a peak of US$137 billion in 2007 when it accounted for 10.6% of the EU total investment abroad (see Appendix A). In 1999 the stock of outward investment almost reached the level of inward investment and that same year Spain overtook the average developed country in the world in terms of its cumulative
1 I would like to thank the following for helping me prepare this Paper: Alfredo Arahuetes, Leslie Crawford, Maite Nuñez Diez, Domingo García, Ferdi Grafe, Mauro Guillén, Beatriz Rose Losada, Francisco Luzón, Mariano Morcate, Kristian Rix, José Juan Ruiz and José Luis del Valle. 2 Endesa has been more than 90% owned by Italy’s Enel since 2009.
4
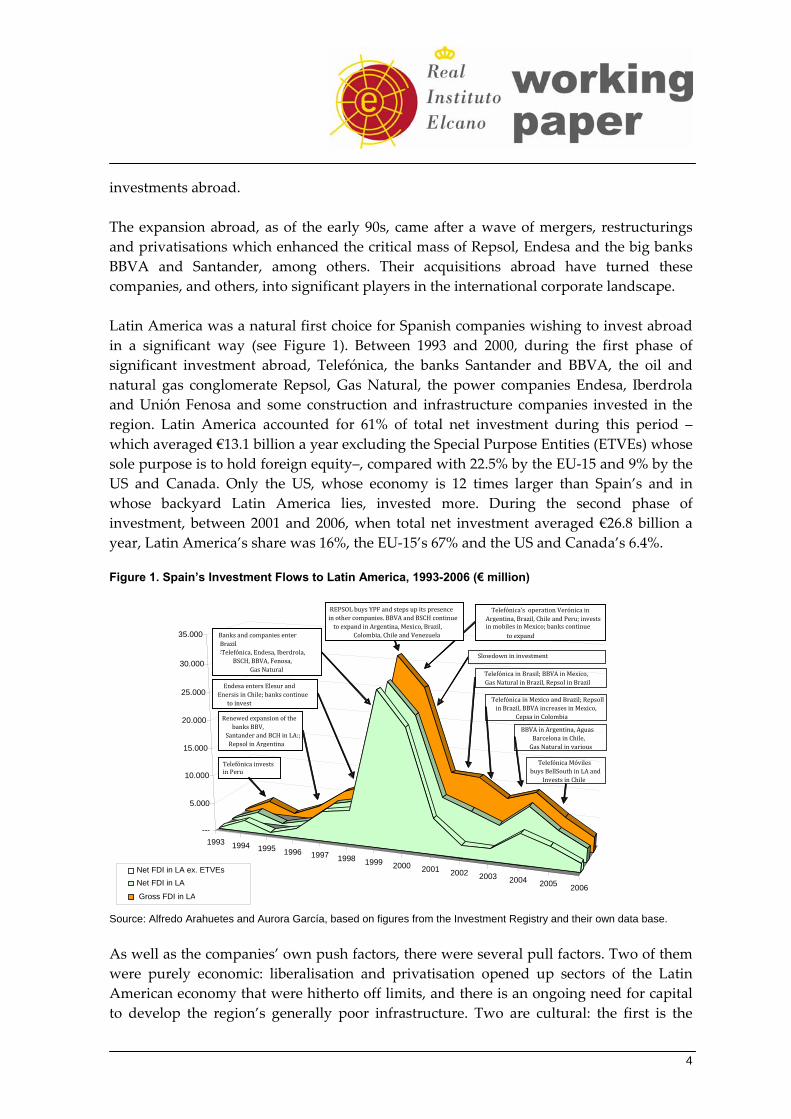
investments abroad. The expansion abroad, as of the early 90s, came after a wave of mergers, restructurings and privatisations which enhanced the critical mass of Repsol, Endesa and the big banks BBVA and Santander, among others. Their acquisitions abroad have turned these companies, and others, into significant players in the international corporate landscape. Latin America was a natural first choice for Spanish companies wishing to invest abroad in a significant way (see Figure 1). Between 1993 and 2000, during the first phase of significant investment abroad, Telefónica, the banks Santander and BBVA, the oil and natural gas conglomerate Repsol, Gas Natural, the power companies Endesa, Iberdrola and Unión Fenosa and some construction and infrastructure companies invested in the region. Latin America accounted for 61% of total net investment during this period –which averaged €13.1 billion a year excluding the Special Purpose Entities (ETVEs) whose sole purpose is to hold foreign equity–, compared with 22.5% by the EU‐15 and 9% by the US and Canada. Only the US, whose economy is 12 times larger than Spain’s and in whose backyard Latin America lies, invested more. During the second phase of investment, between 2001 and 2006, when total net investment averaged €26.8 billion a year, Latin America’s share was 16%, the EU‐15’s 67% and the US and Canada’s 6.4%. Figure 1. Spain’s Investment Flows to Latin America, 1993-2006 (€ million)
Source: Alfredo Arahuetes and Aurora García, based on figures from the Investment Registry and their own data base. As well as the companies’ own push factors, there were several pull factors. Two of them were purely economic: liberalisation and privatisation opened up sectors of the Latin American economy that were hitherto off limits, and there is an ongoing need for capital to develop the region’s generally poor infrastructure. Two are cultural: the first is the
1993 1994 1995 1996 1997 1998 1999 2000 2001 2002 2003 2004 2005 2006
---
5.000
10.000
15.000
20.000
25.000
30.000
35.000
Net FDI in LA ex. ETVEsNet FDI in LA
Gross FDI in LA
Telefónica invests in Peru
Renewed expansion of the banks BBV,
Santander and BCH in LA:; Repsol in Argentina
Endesa enters Elesur and Enersis in Chile; banks continue
to invest
Telefónica in Brasil; BBVA in Mexico, Gas Natural in Brazil, Repsol in Brazil
Telefónica’s operation Verónica in Argentina, Brazil, Chile and Peru; invests in mobiles in Mexico; banks continue to expand
Slowdown in investment
Banks and companies enter Brazil: Telefónica, Endesa, Iberdrola,
BSCH, BBVA, Fenosa, Gas Natural
REPSOL buys YPF and steps up its presence in other companies. BBVA and BSCH continue to expand in Argentina, Mexico, Brazil,
Colombia, Chile and Venezuela
Telefónica in Mexico and Brazil; Repsoll in Brazil, BBVA increases in Mexico,
Cepsa in Colombia BBVA in Argentina, Aguas
Barcelona in Chile, Gas Natural in various
Telefónica Móviles buys BellSouth in LA and
Invests in Chile
5
common language and the ease, therefore, with which management styles can be transferred. Another attraction is the sheer size of the Latin American market and its degree of underdevelopment. The macroeconomic fundamentals of Latin America as a whole and some countries in particular, such as Mexico and Brazil, had also become sounder as a result of major reforms, making the region a less risky place to invest. Mexico, Chile and Brazil have achieved investment‐grade status, which means the risk of debt default is minimal and institutional investors are less hesitant about investing in their financial markets. Lastly, democracy has been gradually taking root in an increasing number of countries. Another factor behind the expansion is that Spanish companies were able to deduct the goodwill –the value ascribed to some of a business’s intangible assets– arising from foreign acquisitions against tax over a period of 20 years. Goodwill is the difference between the book value of assets and the actual price paid. Neelie Kroes, the EU Competition Commissioner, opened a formal investigation in October 2007 into this tax scheme after receiving complaints from European companies that said the tax treatment gave Spanish companies an unfair advantage and enabled them to outbid their rivals. The European Commission said the tax amortisation scheme distorted competition within the Single Market and constituted state aid and Madrid had to abolish it. Most of the outward FDI in Latin America has taken place in public utilities, telecommunications, financial services and infrastructure, sectors protected like Spain’s once were and which began to liberalised and privatised. The initial move into Latin America was, as Mauro Guillén has pointed out, the ‘path of least resistance’ for Spanish companies facing deregulation and take‐over threats on their home ground.3 Spanish executives were ideally suited to handling new businesses in Latin America as they had gained a lot of experience of how to compete in industries under deregulation in their own country. By the early 2000s, Spanish companies had become among the largest operators in telecommunications, electricity, water and financial services throughout Latin America and the region a major contributor to the bottom line of a significant number of Spanish companies and banks. The international revenues of the companies comprising the Ibex 35 index on the Madrid stock market accounted for 53.3% of total revenues in the first half of 2010, up from 23.8% in the whole of 1997 (see Appendix C). Domestic revenues declined 0.88% and international ones rose 10.5%. While the 1980s were a ‘lost decade’ for Latin America, the first decade of the 21st century has seen the continuation of a profound transformation that began in the 1990s and which can only benefit Spanish investments in the region. Indeed, Latin America is helping to lead a global economic recovery along with Asia. According to Luis Alberto Moreno, the President of the Inter‐American Development Bank, economic growth in Latin America and the Caribbean is forecast to average 4.5% in 2010, twice the estimated US rate and 3 See his The Rise of Spanish Multinationals, Cambridge University Press, 2005.
6
four times faster than the euro zone.4 Fiscal deficits in the region are expected to average 2.3% of GDP compared with 6.8% in the euro area and 10.6% in the US. The region’s total public debt is roughly only half the level of Europe and the US. The shift away from Latin America as of the early 2000s, after Argentina’s financial meltdown, which hit the banks and companies there but hardly affected the Spanish economy as whole,5 and into Europe, particularly the UK, and the US and Asia, to a lesser extent, was marked by several emblematic investments –Santander’s €12.5 billion purchase of the UK bank Abbey in 2004, the acquisition by Banco Bilbao Vizcaya Argentaria (BBVA) of two small banks in California and Texas and Telefónica’s purchase in 2005 of a stake in China Netcom and in 2006 its €26 billion acquisition of the O2 mobile telephony operator in the UK, Germany and Ireland, the biggest‐ever Spanish acquisition of a foreign company so far. Lastly, there is the often overlooked factor of Spain’s three main business schools –Iese, Esade and IE– which have enabled Spanish companies to create a managerial class to lead expansions abroad. The three schools are regularly ranked among the top 20 executive education providers in the main league tables such as those of the Financial Times (see Figure 2). Figure 2. Top Executive Education Providers, Selected Rankings, 2010 (1) Rank and School Country1. Harvard Business School US2. HEC Paris France3. IMD Switzerland5. Iese Business School Spain7. Esade Business School Spain8. Insead France13. IE Business School Spain15. University of Oxford: Saïd UK21. Columbia Business School US(1) Ranking out of 50. Source: Financial Times. (3) Current Situation The stock of Spain’s outward investment stood at US$645.9 billion at the end of 2009 (see Figure 3), compared with a stock of inward investment of US$670.5 billion. In GDP terms, Spain’s stock of outward investment soared from 3.0% in 1990 to 44.2% in 2009, higher than Italy, while that of inward investment over the same period increased from 12.7% to 45.9% (see Appendix B). Outflows of FDI have exceeded inward FDI every year since 1997 (with the exception of 2002), although those in 2009 were not much higher (US$16.3 billion and US$15.0 billion,
4 See Luis Alberto Moreno, ‘Welcome to the Latin American Decade’, Financial Times, 7/VII/2010. 5 The Bank of Spain prudently monitors Latin America more closely than any other European central bank.
7
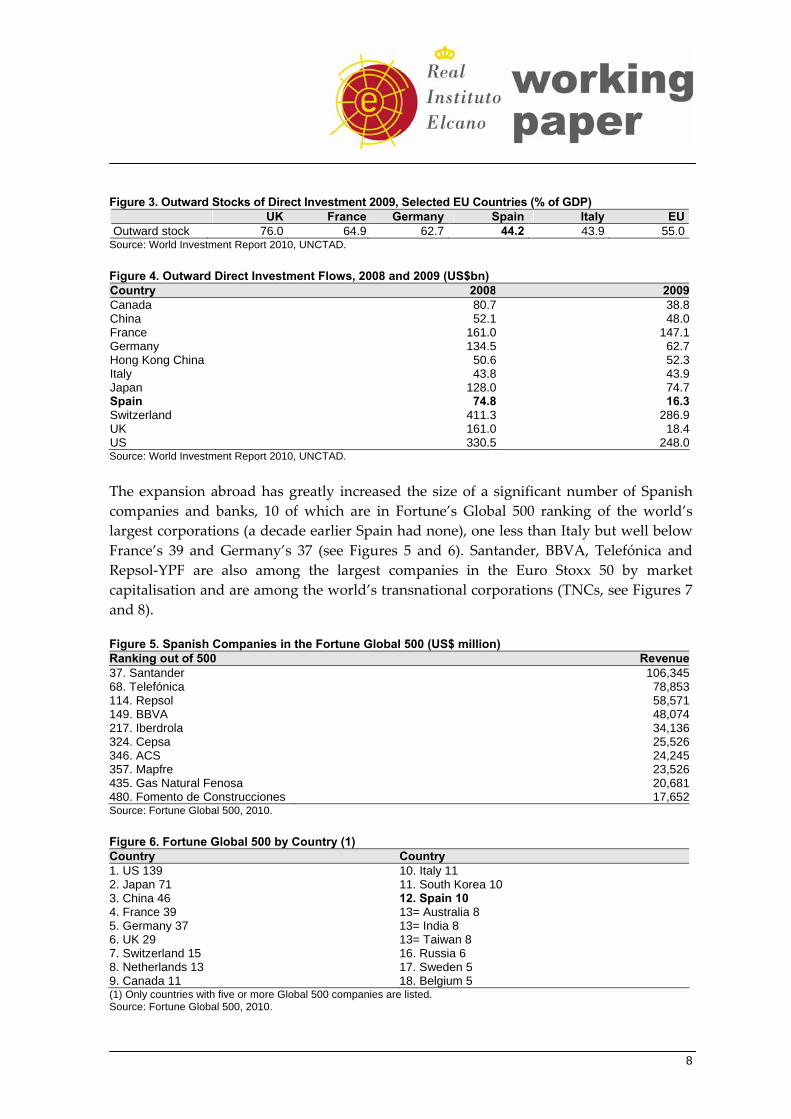
respectively). Outward investment plummeted in 2009, as it did in almost all countries, mainly due to the global economic crisis (see Figure 4 and Appendix A).
8
Figure 3. Outward Stocks of Direct Investment 2009, Selected EU Countries (% of GDP) UK France Germany Spain Italy EU Outward stock 76.0 64.9 62.7 44.2 43.9 55.0
Source: World Investment Report 2010, UNCTAD. Figure 4. Outward Direct Investment Flows, 2008 and 2009 (US$bn) Country 2008 2009Canada 80.7 38.8China 52.1 48.0France 161.0 147.1Germany 134.5 62.7Hong Kong China 50.6 52.3Italy 43.8 43.9Japan 128.0 74.7Spain 74.8 16.3Switzerland 411.3 286.9UK 161.0 18.4US 330.5 248.0Source: World Investment Report 2010, UNCTAD. The expansion abroad has greatly increased the size of a significant number of Spanish companies and banks, 10 of which are in Fortune’s Global 500 ranking of the world’s largest corporations (a decade earlier Spain had none), one less than Italy but well below France’s 39 and Germany’s 37 (see Figures 5 and 6). Santander, BBVA, Telefónica and Repsol‐YPF are also among the largest companies in the Euro Stoxx 50 by market capitalisation and are among the world’s transnational corporations (TNCs, see Figures 7 and 8). Figure 5. Spanish Companies in the Fortune Global 500 (US$ million) Ranking out of 500 Revenue37. Santander 106,34568. Telefónica 78,853114. Repsol 58,571149. BBVA 48,074217. Iberdrola 34,136324. Cepsa 25,526346. ACS 24,245357. Mapfre 23,526435. Gas Natural Fenosa 20,681480. Fomento de Construcciones 17,652Source: Fortune Global 500, 2010. Figure 6. Fortune Global 500 by Country (1) Country Country 1. US 139 10. Italy 11 2. Japan 71 11. South Korea 10 3. China 46 12. Spain 10 4. France 39 13= Australia 8 5. Germany 37 13= India 8 6. UK 29 13= Taiwan 8 7. Switzerland 15 16. Russia 6 8. Netherlands 13 17. Sweden 5 9. Canada 11 18. Belgium 5 (1) Only countries with five or more Global 500 companies are listed. Source: Fortune Global 500, 2010.
9
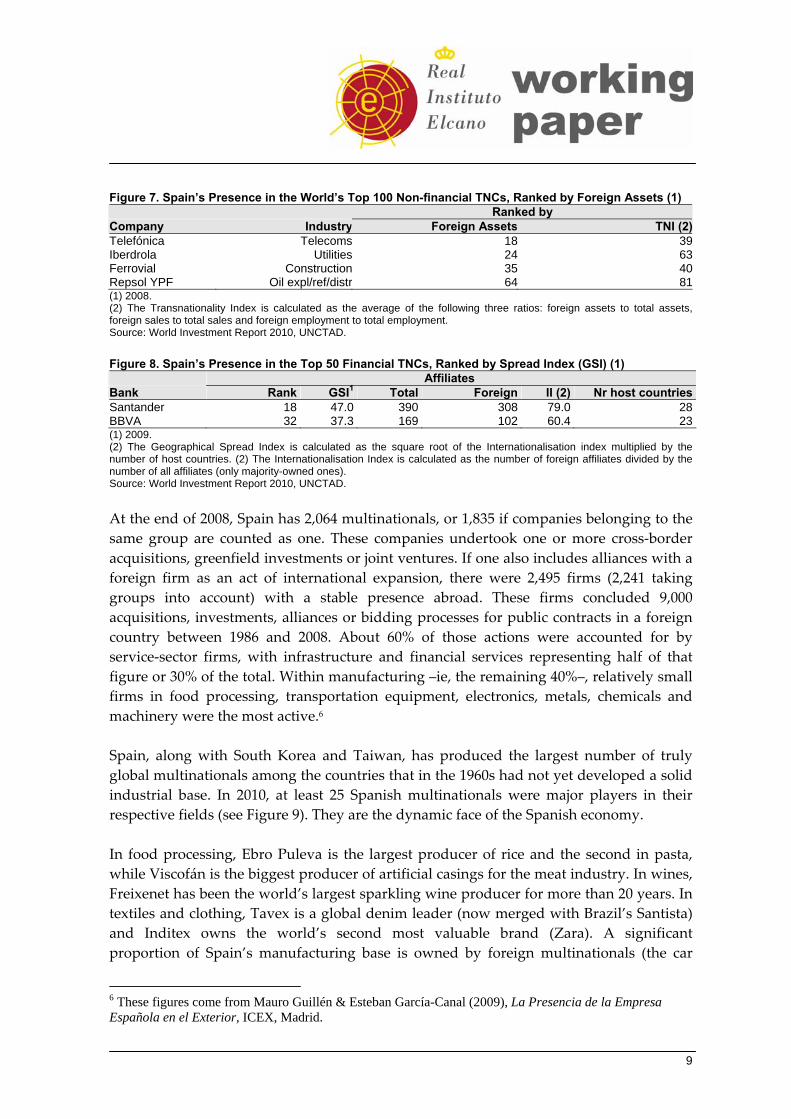
Figure 7. Spain’s Presence in the World’s Top 100 Non-financial TNCs, Ranked by Foreign Assets (1) Ranked by
Company Industry Foreign Assets TNI (2)Telefónica Telecoms 18 39Iberdrola Utilities 24 63Ferrovial Construction 35 40Repsol YPF Oil expl/ref/distr 64 81(1) 2008. (2) The Transnationality Index is calculated as the average of the following three ratios: foreign assets to total assets, foreign sales to total sales and foreign employment to total employment. Source: World Investment Report 2010, UNCTAD. Figure 8. Spain’s Presence in the Top 50 Financial TNCs, Ranked by Spread Index (GSI) (1) Affiliates Bank Rank GSI1 Total Foreign II (2) Nr host countriesSantander 18 47.0 390 308 79.0 28BBVA 32 37.3 169 102 60.4 23(1) 2009. (2) The Geographical Spread Index is calculated as the square root of the Internationalisation index multiplied by the number of host countries. (2) The Internationalisation Index is calculated as the number of foreign affiliates divided by the number of all affiliates (only majority-owned ones). Source: World Investment Report 2010, UNCTAD. At the end of 2008, Spain has 2,064 multinationals, or 1,835 if companies belonging to the same group are counted as one. These companies undertook one or more cross‐border acquisitions, greenfield investments or joint ventures. If one also includes alliances with a foreign firm as an act of international expansion, there were 2,495 firms (2,241 taking groups into account) with a stable presence abroad. These firms concluded 9,000 acquisitions, investments, alliances or bidding processes for public contracts in a foreign country between 1986 and 2008. About 60% of those actions were accounted for by service‐sector firms, with infrastructure and financial services representing half of that figure or 30% of the total. Within manufacturing –ie, the remaining 40%–, relatively small firms in food processing, transportation equipment, electronics, metals, chemicals and machinery were the most active.6 Spain, along with South Korea and Taiwan, has produced the largest number of truly global multinationals among the countries that in the 1960s had not yet developed a solid industrial base. In 2010, at least 25 Spanish multinationals were major players in their respective fields (see Figure 9). They are the dynamic face of the Spanish economy. In food processing, Ebro Puleva is the largest producer of rice and the second in pasta, while Viscofán is the biggest producer of artificial casings for the meat industry. In wines, Freixenet has been the world’s largest sparkling wine producer for more than 20 years. In textiles and clothing, Tavex is a global denim leader (now merged with Brazil’s Santista) and Inditex owns the world’s second most valuable brand (Zara). A significant proportion of Spain’s manufacturing base is owned by foreign multinationals (the car
6 These figures come from Mauro Guillén & Esteban García-Canal (2009), La Presencia de la Empresa Española en el Exterior, ICEX, Madrid.
10
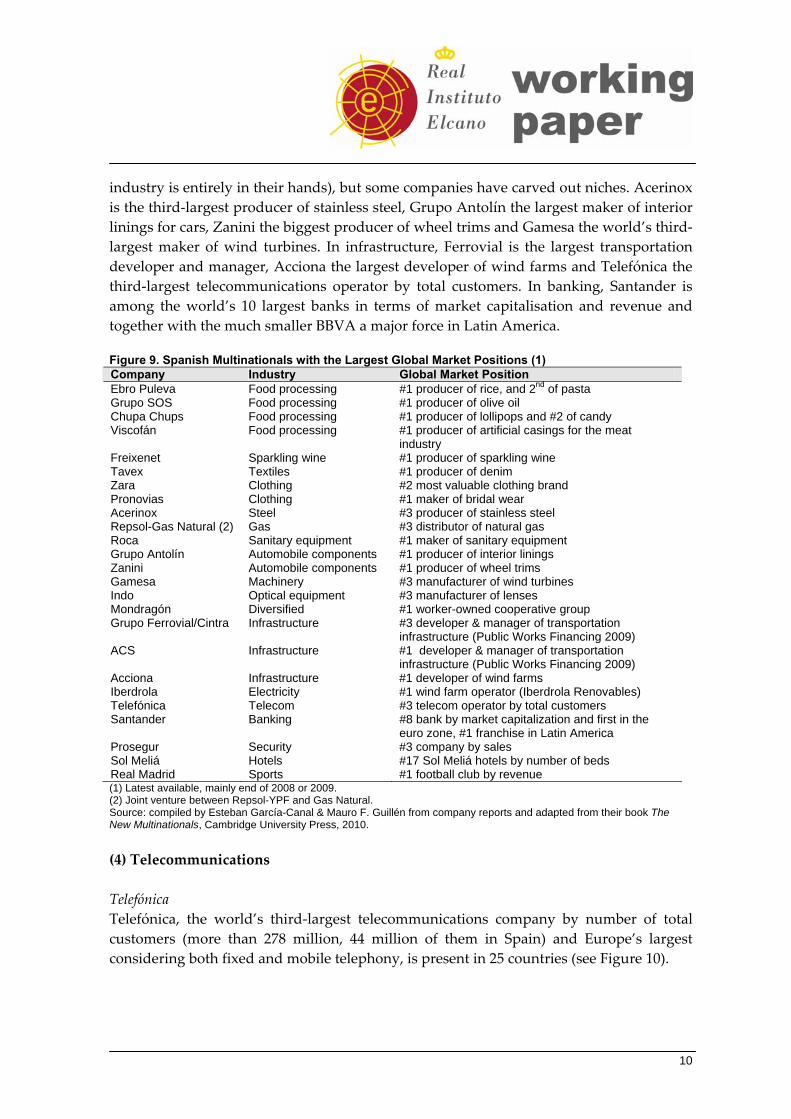
industry is entirely in their hands), but some companies have carved out niches. Acerinox is the third‐largest producer of stainless steel, Grupo Antolín the largest maker of interior linings for cars, Zanini the biggest producer of wheel trims and Gamesa the world’s third‐largest maker of wind turbines. In infrastructure, Ferrovial is the largest transportation developer and manager, Acciona the largest developer of wind farms and Telefónica the third‐largest telecommunications operator by total customers. In banking, Santander is among the world’s 10 largest banks in terms of market capitalisation and revenue and together with the much smaller BBVA a major force in Latin America. Figure 9. Spanish Multinationals with the Largest Global Market Positions (1) Company Industry Global Market Position Ebro Puleva Food processing #1 producer of rice, and 2nd of pasta Grupo SOS Food processing #1 producer of olive oil Chupa Chups Food processing #1 producer of lollipops and #2 of candy Viscofán Food processing #1 producer of artificial casings for the meat
industry Freixenet Sparkling wine #1 producer of sparkling wine Tavex Textiles #1 producer of denim Zara Clothing #2 most valuable clothing brand Pronovias Clothing #1 maker of bridal wear Acerinox Steel #3 producer of stainless steel Repsol-Gas Natural (2) Gas #3 distributor of natural gas Roca Sanitary equipment #1 maker of sanitary equipment Grupo Antolín Automobile components #1 producer of interior linings Zanini Automobile components #1 producer of wheel trims Gamesa Machinery #3 manufacturer of wind turbines Indo Optical equipment #3 manufacturer of lenses Mondragón Diversified #1 worker-owned cooperative group Grupo Ferrovial/Cintra Infrastructure #3 developer & manager of transportation
infrastructure (Public Works Financing 2009) ACS Infrastructure #1 developer & manager of transportation
infrastructure (Public Works Financing 2009) Acciona Infrastructure #1 developer of wind farms Iberdrola Electricity #1 wind farm operator (Iberdrola Renovables) Telefónica Telecom #3 telecom operator by total customers Santander Banking #8 bank by market capitalization and first in the
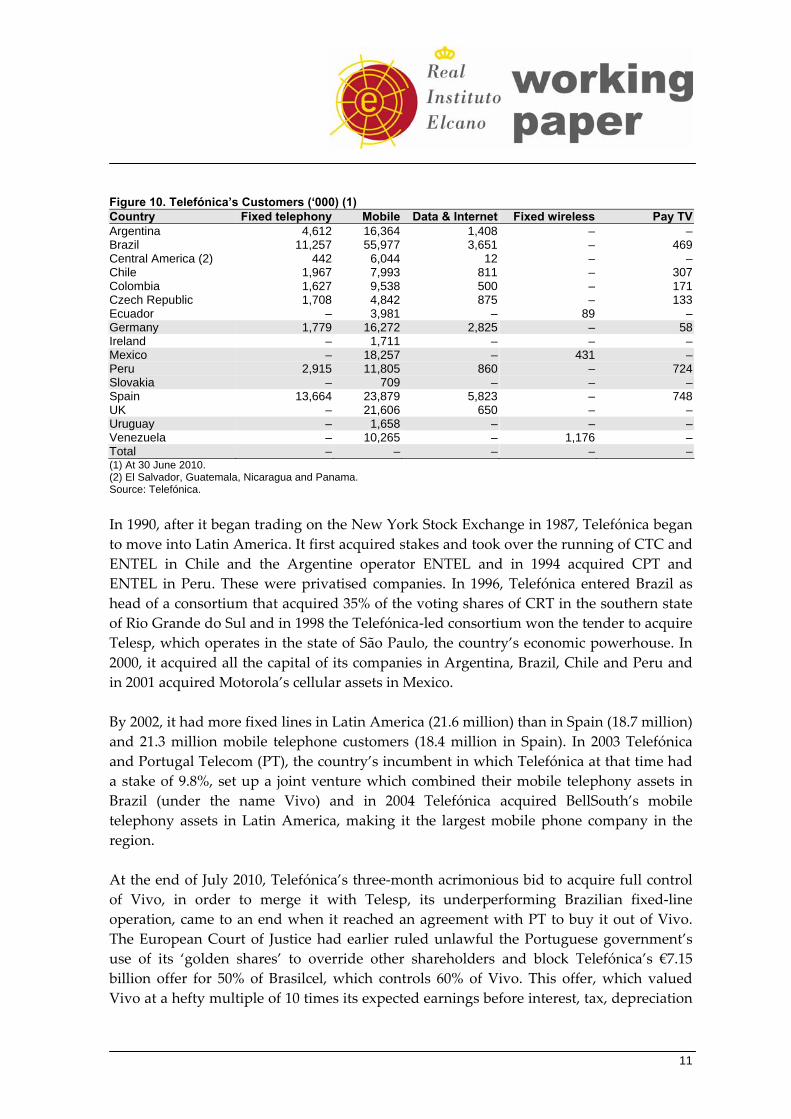
euro zone, #1 franchise in Latin America Prosegur Security #3 company by sales Sol Meliá Hotels #17 Sol Meliá hotels by number of beds Real Madrid Sports #1 football club by revenue (1) Latest available, mainly end of 2008 or 2009. (2) Joint venture between Repsol-YPF and Gas Natural. Source: compiled by Esteban García-Canal & Mauro F. Guillén from company reports and adapted from their book The New Multinationals, Cambridge University Press, 2010. (4) Telecommunications Telefónica Telefónica, the world’s third‐largest telecommunications company by number of total customers (more than 278 million, 44 million of them in Spain) and Europe’s largest considering both fixed and mobile telephony, is present in 25 countries (see Figure 10).
11
Figure 10. Telefónica’s Customers (‘000) (1) Country Fixed telephony Mobile Data & Internet Fixed wireless Pay TVArgentina 4,612 16,364 1,408 – –Brazil 11,257 55,977 3,651 – 469Central America (2) 442 6,044 12 – –Chile 1,967 7,993 811 – 307Colombia 1,627 9,538 500 – 171Czech Republic 1,708 4,842 875 – 133Ecuador – 3,981 – 89 –Germany 1,779 16,272 2,825 – 58Ireland – 1,711 – – –Mexico – 18,257 – 431 –Peru 2,915 11,805 860 – 724Slovakia – 709 – – –Spain 13,664 23,879 5,823 – 748UK – 21,606 650 – –Uruguay – 1,658 – – –Venezuela – 10,265 – 1,176 –Total – – – – –(1) At 30 June 2010. (2) El Salvador, Guatemala, Nicaragua and Panama. Source: Telefónica. In 1990, after it began trading on the New York Stock Exchange in 1987, Telefónica began to move into Latin America. It first acquired stakes and took over the running of CTC and ENTEL in Chile and the Argentine operator ENTEL and in 1994 acquired CPT and ENTEL in Peru. These were privatised companies. In 1996, Telefónica entered Brazil as head of a consortium that acquired 35% of the voting shares of CRT in the southern state of Rio Grande do Sul and in 1998 the Telefónica‐led consortium won the tender to acquire Telesp, which operates in the state of São Paulo, the country’s economic powerhouse. In 2000, it acquired all the capital of its companies in Argentina, Brazil, Chile and Peru and in 2001 acquired Motorola’s cellular assets in Mexico. By 2002, it had more fixed lines in Latin America (21.6 million) than in Spain (18.7 million) and 21.3 million mobile telephone customers (18.4 million in Spain). In 2003 Telefónica and Portugal Telecom (PT), the country’s incumbent in which Telefónica at that time had a stake of 9.8%, set up a joint venture which combined their mobile telephony assets in Brazil (under the name Vivo) and in 2004 Telefónica acquired BellSouth’s mobile telephony assets in Latin America, making it the largest mobile phone company in the region. At the end of July 2010, Telefónica’s three‐month acrimonious bid to acquire full control of Vivo, in order to merge it with Telesp, its underperforming Brazilian fixed‐line operation, came to an end when it reached an agreement with PT to buy it out of Vivo. The European Court of Justice had earlier ruled unlawful the Portuguese government’s use of its ‘golden shares’ to override other shareholders and block Telefónica’s €7.15 billion offer for 50% of Brasilcel, which controls 60% of Vivo. This offer, which valued Vivo at a hefty multiple of 10 times its expected earnings before interest, tax, depreciation
12
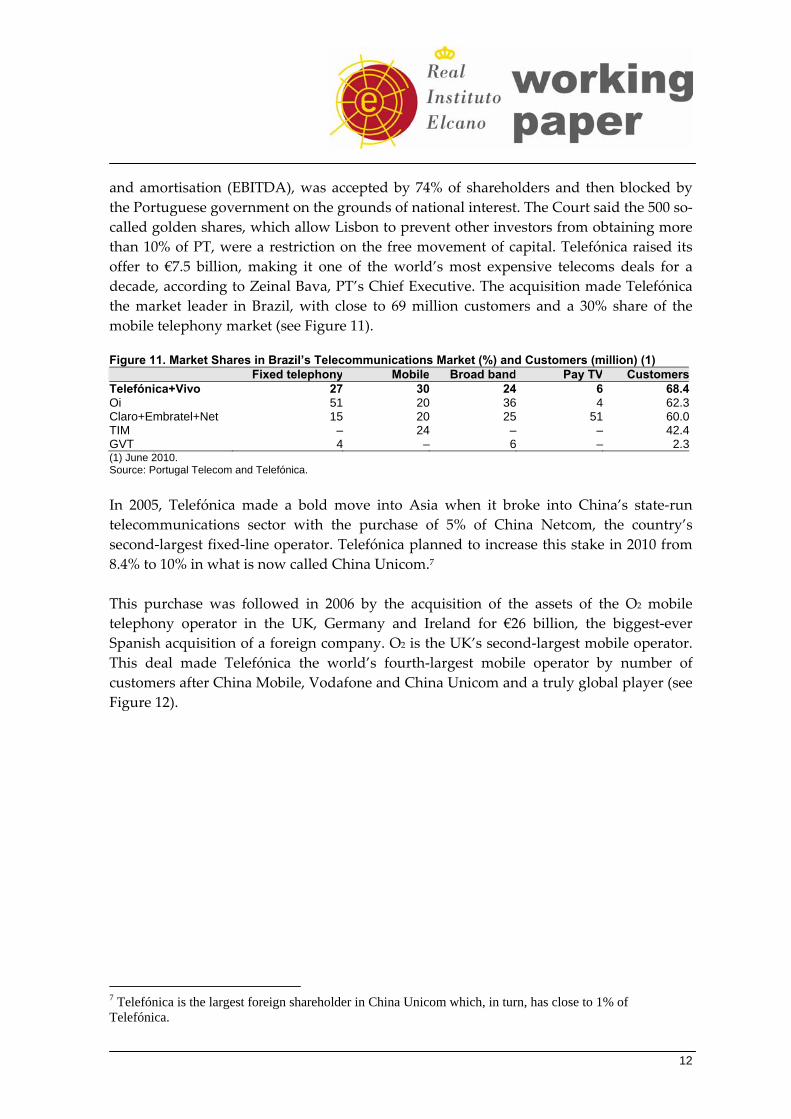
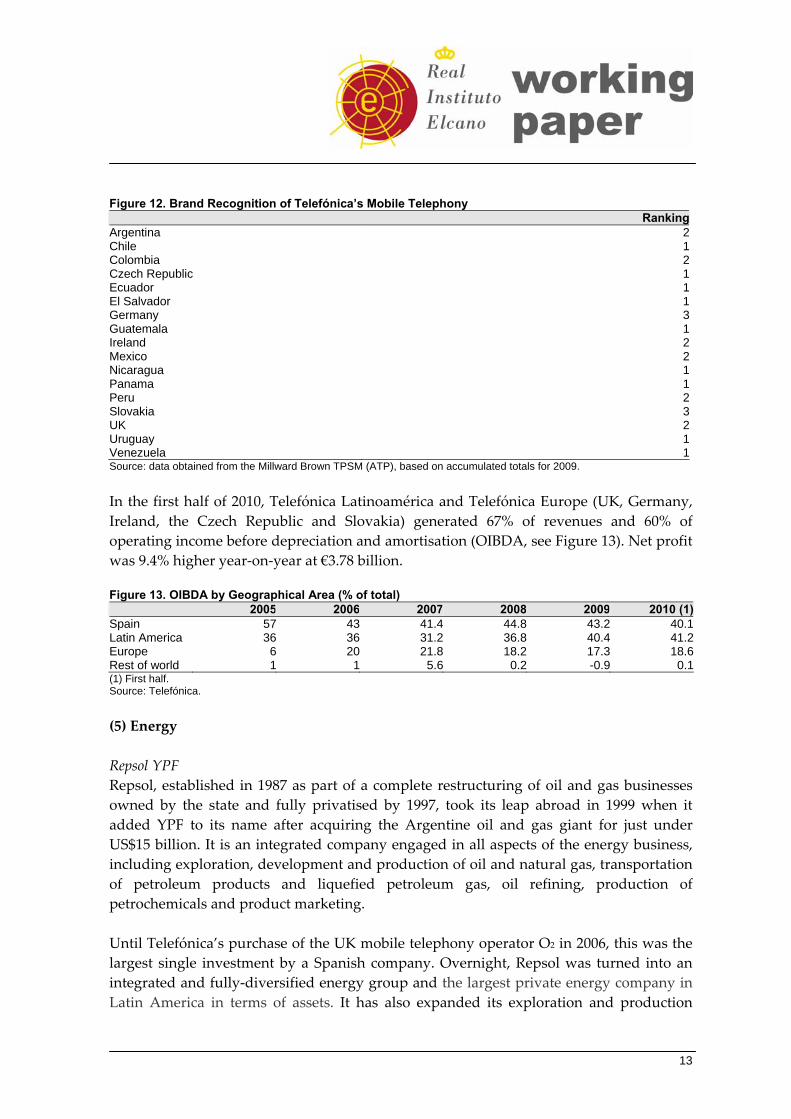
and amortisation (EBITDA), was accepted by 74% of shareholders and then blocked by the Portuguese government on the grounds of national interest. The Court said the 500 so‐called golden shares, which allow Lisbon to prevent other investors from obtaining more than 10% of PT, were a restriction on the free movement of capital. Telefónica raised its offer to €7.5 billion, making it one of the world’s most expensive telecoms deals for a decade, according to Zeinal Bava, PT’s Chief Executive. The acquisition made Telefónica the market leader in Brazil, with close to 69 million customers and a 30% share of the mobile telephony market (see Figure 11). Figure 11. Market Shares in Brazil’s Telecommunications Market (%) and Customers (million) (1) Fixed telephony Mobile Broad band Pay TV CustomersTelefónica+Vivo 27 30 24 6 68.4Oi 51 20 36 4 62.3Claro+Embratel+Net 15 20 25 51 60.0TIM – 24 – – 42.4GVT 4 – 6 – 2.3(1) June 2010. Source: Portugal Telecom and Telefónica. In 2005, Telefónica made a bold move into Asia when it broke into China’s state‐run telecommunications sector with the purchase of 5% of China Netcom, the country’s second‐largest fixed‐line operator. Telefónica planned to increase this stake in 2010 from 8.4% to 10% in what is now called China Unicom.7 This purchase was followed in 2006 by the acquisition of the assets of the O2 mobile telephony operator in the UK, Germany and Ireland for €26 billion, the biggest‐ever Spanish acquisition of a foreign company. O2 is the UK’s second‐largest mobile operator. This deal made Telefónica the world’s fourth‐largest mobile operator by number of customers after China Mobile, Vodafone and China Unicom and a truly global player (see Figure 12).
7 Telefónica is the largest foreign shareholder in China Unicom which, in turn, has close to 1% of Telefónica.
13
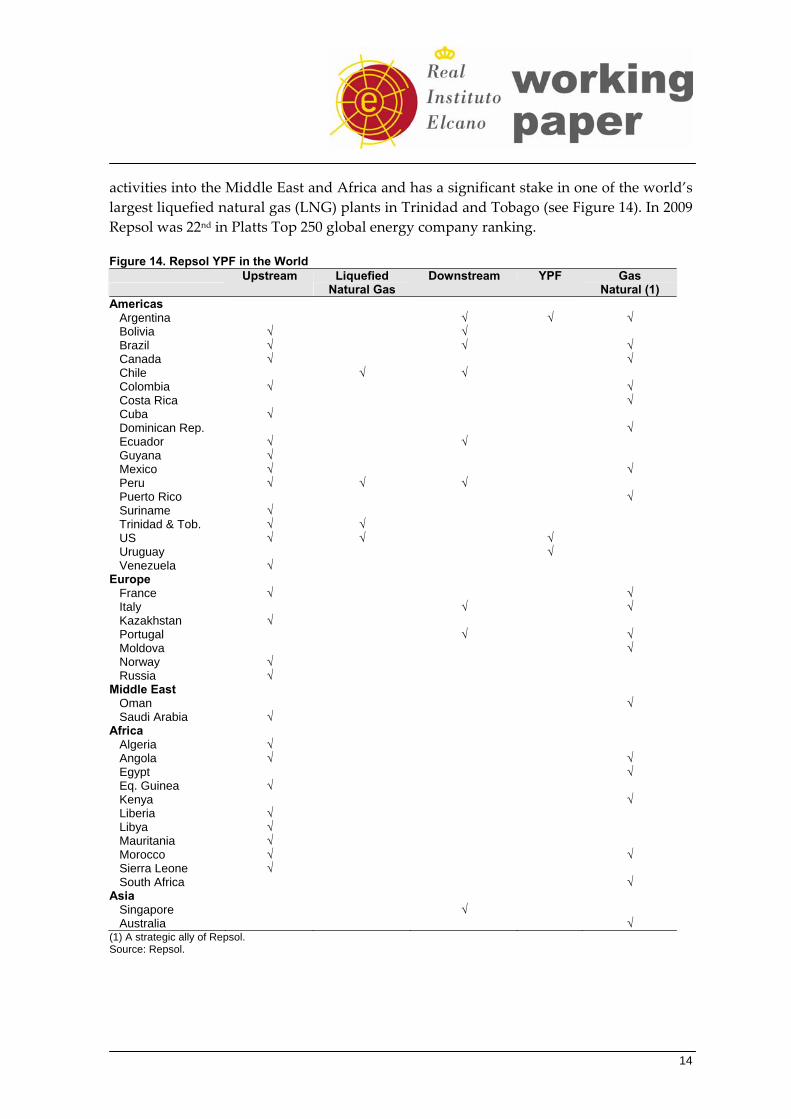
Figure 12. Brand Recognition of Telefónica’s Mobile Telephony RankingArgentina 2Chile 1Colombia 2Czech Republic 1Ecuador 1El Salvador 1Germany 3Guatemala 1Ireland 2Mexico 2Nicaragua 1Panama 1Peru 2Slovakia 3UK 2Uruguay 1Venezuela 1Source: data obtained from the Millward Brown TPSM (ATP), based on accumulated totals for 2009. In the first half of 2010, Telefónica Latinoamérica and Telefónica Europe (UK, Germany, Ireland, the Czech Republic and Slovakia) generated 67% of revenues and 60% of operating income before depreciation and amortisation (OIBDA, see Figure 13). Net profit was 9.4% higher year‐on‐year at €3.78 billion. Figure 13. OIBDA by Geographical Area (% of total) 2005 2006 2007 2008 2009 2010 (1)Spain 57 43 41.4 44.8 43.2 40.1Latin America 36 36 31.2 36.8 40.4 41.2Europe 6 20 21.8 18.2 17.3 18.6Rest of world 1 1 5.6 0.2 -0.9 0.1(1) First half. Source: Telefónica. (5) Energy Repsol YPF Repsol, established in 1987 as part of a complete restructuring of oil and gas businesses owned by the state and fully privatised by 1997, took its leap abroad in 1999 when it added YPF to its name after acquiring the Argentine oil and gas giant for just under US$15 billion. It is an integrated company engaged in all aspects of the energy business, including exploration, development and production of oil and natural gas, transportation of petroleum products and liquefied petroleum gas, oil refining, production of petrochemicals and product marketing. Until Telefónica’s purchase of the UK mobile telephony operator O2 in 2006, this was the largest single investment by a Spanish company. Overnight, Repsol was turned into an integrated and fully‐diversified energy group and the largest private energy company in Latin America in terms of assets. It has also expanded its exploration and production
14
activities into the Middle East and Africa and has a significant stake in one of the world’s largest liquefied natural gas (LNG) plants in Trinidad and Tobago (see Figure 14). In 2009 Repsol was 22nd in Platts Top 250 global energy company ranking. Figure 14. Repsol YPF in the World
Upstream Liquefied
Natural Gas Downstream YPF Gas
Natural (1)
Americas Argentina √ √ √ Bolivia √ √ Brazil √ √ √ Canada √ √ Chile √ √ Colombia √ √ Costa Rica √ Cuba √ Dominican Rep. √ Ecuador √ √ Guyana √ Mexico √ √ Peru √ √ √ Puerto Rico √ Suriname √ Trinidad & Tob. √ √ US √ √ √ Uruguay √ Venezuela √ Europe France √ √ Italy √ √ Kazakhstan √ Portugal √ √ Moldova √ Norway √ Russia √ Middle East Oman √ Saudi Arabia √ Africa Algeria √ Angola √ √ Egypt √ Eq. Guinea √ Kenya √ Liberia √ Libya √ Mauritania √ Morocco √ √ Sierra Leone √ South Africa √ Asia Singapore √ Australia √ (1) A strategic ally of Repsol. Source: Repsol.
15
Investment abroad in developing oil and gas fields, after the mega purchase of YPF, has been more modest but still significant and increasingly closer to home in Algeria, Libya and the US as Repsol had become heavily exposed to Latin America, particularly in Argentina and Bolivia.8 In 2009 Repsol made a huge gas discovery in Venezuela (Perla 1x), its largest ever and one of the five biggest worldwide last year. The field could contain recoverable gas reserves of between 1 and 1.4 billion barrels of oil equivalent. Excellent prospecting results were also obtained in Brazilian waters with four finds, and oil was discovered in US waters in the Gulf of Mexico. In the first half of 2010, international activity generated 55% of Repsol’s revenues. Figure 15. Geographic Distribution of Repsol YPF’s Revenues (% of total) 2005 2006 2007 2008 2009Spain 44.3 49.3 48.9 47.9 51.2Rest of the world 39.9 36.4 32.1 34.0 34.6EU – – – 10.3 9.4OECD countries – – – 7.8 4.8Argentina, Brazil & Bolivia 15.8 14.3 19.0 – –Source: Bloomberg. Cepsa Petresa, a subsidiary of Cepsa with plants in Canada, Brazil and Spain, is the world leader in the production of linear alkylbenzene (LAB), a raw material for detergents. Interquisa, another subsidiary in Canada, produces raw materials for the polyester industry. Cepsa (48.8% owned by the French oil company Total) also has oil exploration and production activities in Algeria and Colombia and oil product marketing companies in various countries. In July 2007 it entered Asia by investing €700 million in building an aromatics plant in South Korea and acquired another already existing plant with Hyundai Oilbank. Production will be earmarked for China. Gas Natural Fenosa Gas Natural Fenosa was created in 2009 after Gas Natural, Spain’s former gas monopoly, acquired Unión Fenosa, Spain’s third‐biggest power company, and integrated their gas and electricity businesses into a single company. It operates in 23 countries and has more than 20 million customers around the world. Gas Natural entered Argentina in 1992 and in 1997 teamed up with other companies to win the tender for the privatisation of Brazil’s CEG and CEG Río, which distribute piped gas to the metropolitan area of Río de Janeiro and the rest of the state. Gas Natural also has interests in Colombia, Mexico, Puerto Rico, Italy, Algeria, Morocco and Angola. Unión Fenosa’s international expansion dates from 1998 when it was awarded the contract to construct a 250 MW combined cycle gas turbine plant in Hermosillo (Mexico) and power distribution systems in Panama. The Hermosillo plant was the first one to start 8 In 2008, Repsol sold a 14.9% stake in YPF to Grupo Petersen. The deal included an option allowing Petersen to raise that stake to 25%.
16
operating in 2001 as a result of the opening‐up of electricity production in Mexico to the international private sector. In Colombia, Unión Fenosa acquired a controlling interest in the year 2000 in Energía del Pacífico (EPSA), with 1000MW of installed capacity, and electricity generation, transport, distribution and sales activities in the Cauca valley. In the same year a 70% holding was acquired in Electrocosta and Electricaribe, which distribute and sell power in the Colombian Caribbean area. Unión Fenosa also acquired interests in the Dominican Republic, Nicaragua, Costa Rica, Egypt, Oman and South Africa. (6) Banks Santander Santander’s rise from a local note‐issuing bank founded in 1857 in the then province of the same name (now the autonomous region of Cantabria) to its position today as the euro zone’s leading retail bank, the largest by market capitalisation and with the biggest financial franchise in Latin America is a remarkable one. The product of the merger of three banks (Santander, Central and Hispano Americano) between 1991 and 1999, Santander is present in various European countries, particularly the UK, where it owns three banks, and Germany, Latin America and the US (see Figure 16). Figure 16. Santander’s Main Banking Presence in the World (1) Customers (million) Branches Market share (%) RankingAmericas Argentina 2.0 298 10 1 (2) (3) Brazil 22.4 3,593 10 3 (2) (3) Chile 3.2 498 19 1 (2) Mexico 8.7 1,093 25 3 (2) US 1.7 722 3 (4)Europe Germany 6.0 144 15 4 (5) Portugal 1.9 763 10 4 (2) (3) UK 25.6 1,322 10 5 (6)(1) 2009. (2) Loans, deposits and mutual funds. (3) Excluding state banks. (4) In its area of influence. (5) Leader in financing of durable goods and first independent finance company. (6) By deposits. Source: Santander. Long before its marriage to Central Hispano in 1999 (Hispano Americano, founded in 1900, and Central, established in 1919, merged in 1991), Santander was internationally‐minded. One of its earliest functions was to finance foreign trade between the port city of Santander and Latin America. In 1947 it opened a representative office in Cuba, a Spanish colony until 1898, and in 1963 acquired its first bank in the Americas (Banco del Hogar Argentino). The big push into Latin America, a zone with a low level of ‘bankarisation’ and thus plenty of scope to develop business, took place between 1999 and 2001 when Mexico’s Serfin and Brazil’s Banespa were bought. Today, Grupo Santander Brazil is the country’s third‐largest private sector bank, following the acquisition in 2008 of Banco Real
17
from ABN Amro, while Serfin, which Santander regained full control of in 2010 after buying back from Bank of America the 25% stake sold to it in 2003, is Mexico’s third‐biggest bank. Santander raised €7 billion in 2009 with the stock market flotation of its Brazilian business, making it the world’s largest initial public offering. Santander has 5,757 branches in Latin America, up from just one in 1947 (Cuba). At the end of 2009, Santander and BBVA, Spain’s second‐largest bank and also a major player in Latin America (see below), had invested between them US$56 billion in the region since the mid 1990s. Santander had invested US$41 billion in its seven core countries and BBVA around US$15 billion. If the reinvestment of at least 50% of the two banks’ profits is added to the direct investments, total investment was US$85 billion.9 The two banks’ combined market shares were 17.5% in Argentina, 9.1% in Brazil, 25.8% in Chile, 12.2% in Colombia, 44.8% in Mexico, 23.1% in Peru and 22.3% in Uruguay. Santander’s overall market share in the seven countries was 10.2%. The Latin American experience has been very beneficial for the two banks and for the region’s banking systems. According to Francisco Luzón, Santander’s Chief Executive for Latin America, without the experience, institutional maturity and balance sheet size that the region has given the two large Spanish banks, it would have been unthinkable for BBVA to have designed its strategy for a presence in the southern US, or to have ventured into Asia, and if Santander’s ambition to become Latin America’s leader in commercial banking had not been a resounding success, it would not have been able to make the leap to the British or German markets or to buy Sovereign Bank in the US:10 ‘Latin America made us grow. It made us mature. It has taken away the label of local banks and given us our stripes as multi‐local or global, international banks’. At the same time, Santander and BBVA have played a fundamental role in building the region’s banking systems that today are regarded as the best among emerging markets. This change is just one of many that is transforming Latin America and making it increasingly attractive for business; others include greater investment in human capital, higher life expectancy, the emergence of a middle class and much better macroeconomic fundamentals (for example, the public debt/GDP ratio of 42% is 10 percentage points less than it was 10 years ago). Santander will continue to invest in Latin America, particularly in Colombia and Peru where its presence is not very significant. The region could account for about 45% of profits by the end of 2011 (37% in the first half of 2010), according to Luzón.
9 These figures and others mentioned in this section come from the long presentation given by Francisco Luzón, Santander’s Chief Executive for Latin America, at the Menéndez Pelayo International University in Santander in July 2010. 10 Ibid.
18
The depth of the Latin American banking system is still abnormally low. With a credit/GDP ratio of 29% in 2010 in the seven core countries, the region as a whole is 30 percentage points below the rate that would correspond to it at its current level of per capita income. The gap for countries like Argentina (with a ratio of 13%), México (13%) and Uruguay (17%) is even higher. Santander’s base estimate is that between 2010 and 2015 the seven core countries will increase their credit/GDP ratio to 41%. Santander opened its first office in London in 1954 and in 1988 established an alliance with Royal Bank of Scotland (RBS) which lasted 16 years until Santander acquired Abbey in 2004 for €12.5 billion, its largest single investment. Santander also owns two smaller banks, Bradford & Bingley and Alliance & Leicester. The purchase of Abbey gave Santander a better geographic diversification among emerging, mature and stable economies and a major presence in one of Europe’s most attractive and profitable banking markets. This presence was greatly enhanced in August 2010 when Santander agreed to acquire 318 branches from the majority state‐controlled RBS. This gave it a total of 1,641 branches in the UK, the fourth‐largest network after Lloyds, RBS and Barclays. The deal gives Santander an additional 244,000 small and medium‐sized business customers, or a 5% market share, to supplement its existing 3%, as well as 1.8 million retail customers. Far from retrenching as a result of the global financial crisis, Santander, since 2008, has taken advantage of opportunities to enter new markets and strengthen positions (see Figure 17) and not just in Latin America. It is constantly shopping for deals. In July 2010 Santander agreed to buy the German retail bank business of Sweden’s Skandinaviska Enskilda Banken (SEB), enhancing its position in a market where it is already a leading provider of car finance and consumer loans via Santander Consumer Finance. The purchase of SEB’s 173 branches almost doubled the size of Santander’s German branch network. Santander renewed talks in August 2010 with M&T Bank over a merger of its US unit, known as Sovereign, with the regional bank based in Buffalo, New York. Talks had collapsed in May over which bank would control the merged business. M&T has $68 billion in assets and 750 branches in New York, Pennsylvania and Maryland. Santander took a 25% stake in Sovereign in 2006 and bought the remainder of the troubled bank in 2008.

19
Figure 17. Santander’s International Deals since 2008 Country Deal Value (US$ mn)Argentina BNP Paribas NABrazil ABN Amro Asset Management 310Germany SEB (retail banking business) 701Italy Banca Monte del Paschi de Siena (1%) Mexico Grupo Financiero Santander Mexicano (24.9%) 2,500Poland AIG Bank Polanska (99.92%) NAUK Bradford & Bingley (retail deposits, branches & agencies) 1,100 Alliance & Leicester 2,000 Property portfolio (London headquarters of Abbey National) 168 318 branches of Royal Bank of Scotland US Sovereign Bancorp (75.65%) 1,400
HSBC Finance (vehicle loan servicing operations and US$1 bn in vehicle loans
904
Citigroup (US$3.2 bn of CitiFinancial’s auto loan portfolio) 256 Santander Bancorp (9.4%) 54 Road Loans NA €3.3 bn of car loans from HSBC Dundon DFS NASource: Dealogic. This continued expansion is the fruit of Santander’s traditional balance sheet strength (a relatively low level of non‐performing loans and high coverage) and sound capital ratios (see Figure 18). The stress test results released in July 2010 among 91 European banks showed that Santander is able to withstand an adverse scenario very well and in such an event would keep intact its Tier 1 ratio of 10%, well above the 6% reference. According to the Committee of European Banking Supervisors (CEBS), Santander is the European bank which would obtain the highest pre‐tax profit, have the best return on risk‐weighted assets and on Tier I capital among the 25 largest banks analysed. Figure 18. Top 10 World Banks Ranked by Tier 1 Capital (1)
Tier 1 Capital
(US$ mn)BIS Total Capital Ratio
(%) Non-performing Loans
(%)1. Bank of America 160,388 14.7 7.62. JP Morgan Chase 132,971 14.8 8.13. Citigroup 127,034 15.3 7.64. Royal Bank of Scotland 123,859 16.1 N.A.5. HSBC Holdings 122,157 13.7 N.A.6. Wells Fargo 93,795 13.3 8.37. Industrial Commercial Bank of China
91,111 12.4 1.5
8. BNP Paribas 90,648 14.2 09. Banco Santander 81,578 14.2 3.210. Barclays 80,448 16.6 0(1) Figures at the end of 2009. Source: The Banker. At the end of June 2010, Santander had 8,814 branches abroad (compared with 4,857 in Spain), making it the bank with the largest international network. International activity is generating an increasingly large share of profits (almost 70% in the first half of 2010) and offsetting the downturn in the domestic market (see Figure 19). Santander’s earnings in the UK were higher than those generated by the Santander Branch Network in Spain.
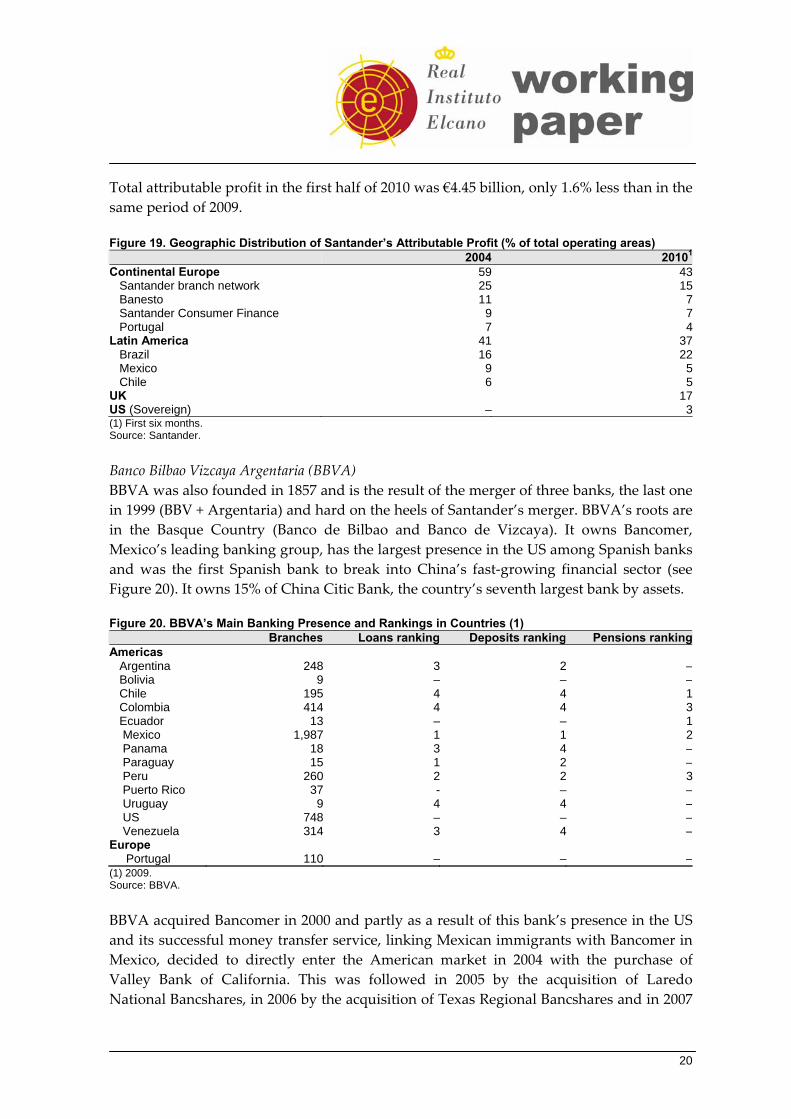
20
Total attributable profit in the first half of 2010 was €4.45 billion, only 1.6% less than in the same period of 2009. Figure 19. Geographic Distribution of Santander’s Attributable Profit (% of total operating areas) 2004 20101
Continental Europe 59 43 Santander branch network 25 15 Banesto 11 7 Santander Consumer Finance 9 7 Portugal 7 4Latin America 41 37 Brazil 16 22 Mexico 9 5 Chile 6 5UK 17US (Sovereign) – 3(1) First six months. Source: Santander. Banco Bilbao Vizcaya Argentaria (BBVA) BBVA was also founded in 1857 and is the result of the merger of three banks, the last one in 1999 (BBV + Argentaria) and hard on the heels of Santander’s merger. BBVA’s roots are in the Basque Country (Banco de Bilbao and Banco de Vizcaya). It owns Bancomer, Mexico’s leading banking group, has the largest presence in the US among Spanish banks and was the first Spanish bank to break into China’s fast‐growing financial sector (see Figure 20). It owns 15% of China Citic Bank, the country’s seventh largest bank by assets. Figure 20. BBVA’s Main Banking Presence and Rankings in Countries (1) Branches Loans ranking Deposits ranking Pensions rankingAmericas Argentina 248 3 2 – Bolivia 9 – – – Chile 195 4 4 1 Colombia 414 4 4 3 Ecuador 13 – – 1 Mexico 1,987 1 1 2 Panama 18 3 4 – Paraguay 15 1 2 – Peru 260 2 2 3 Puerto Rico 37 - – – Uruguay 9 4 4 – US 748 – – – Venezuela 314 3 4 –Europe Portugal 110 – – –(1) 2009. Source: BBVA. BBVA acquired Bancomer in 2000 and partly as a result of this bank’s presence in the US and its successful money transfer service, linking Mexican immigrants with Bancomer in Mexico, decided to directly enter the American market in 2004 with the purchase of Valley Bank of California. This was followed in 2005 by the acquisition of Laredo National Bancshares, in 2006 by the acquisition of Texas Regional Bancshares and in 2007
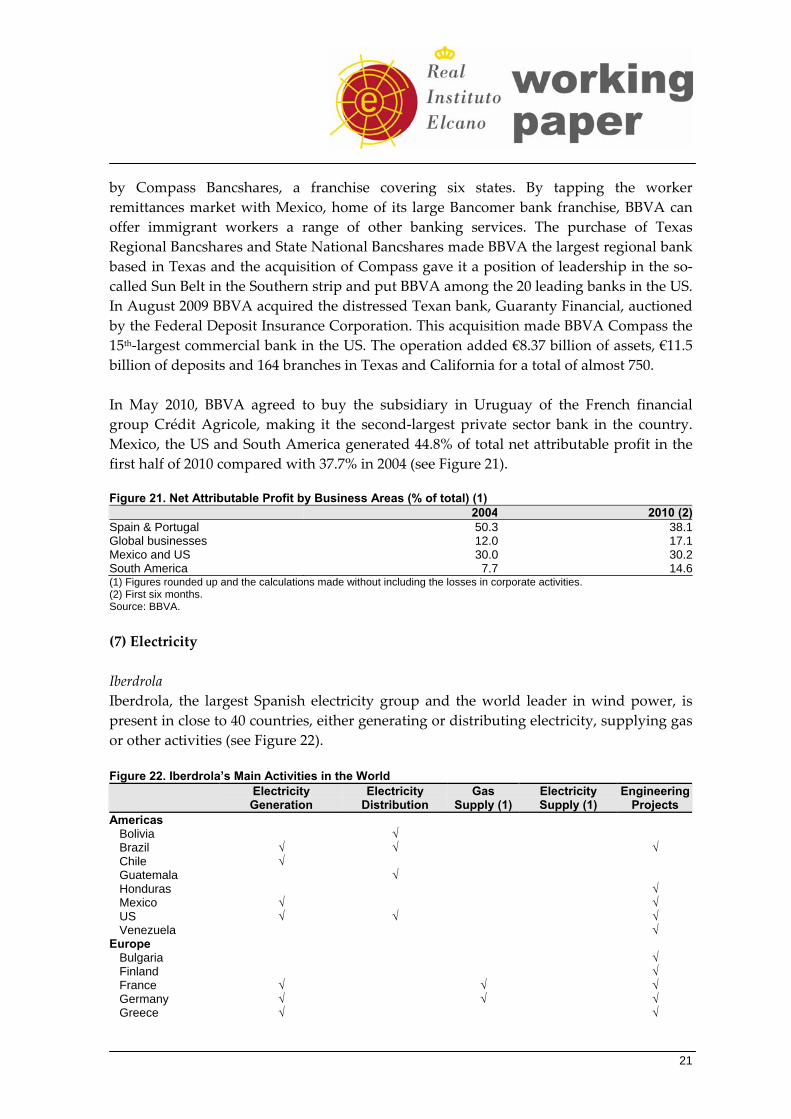
21
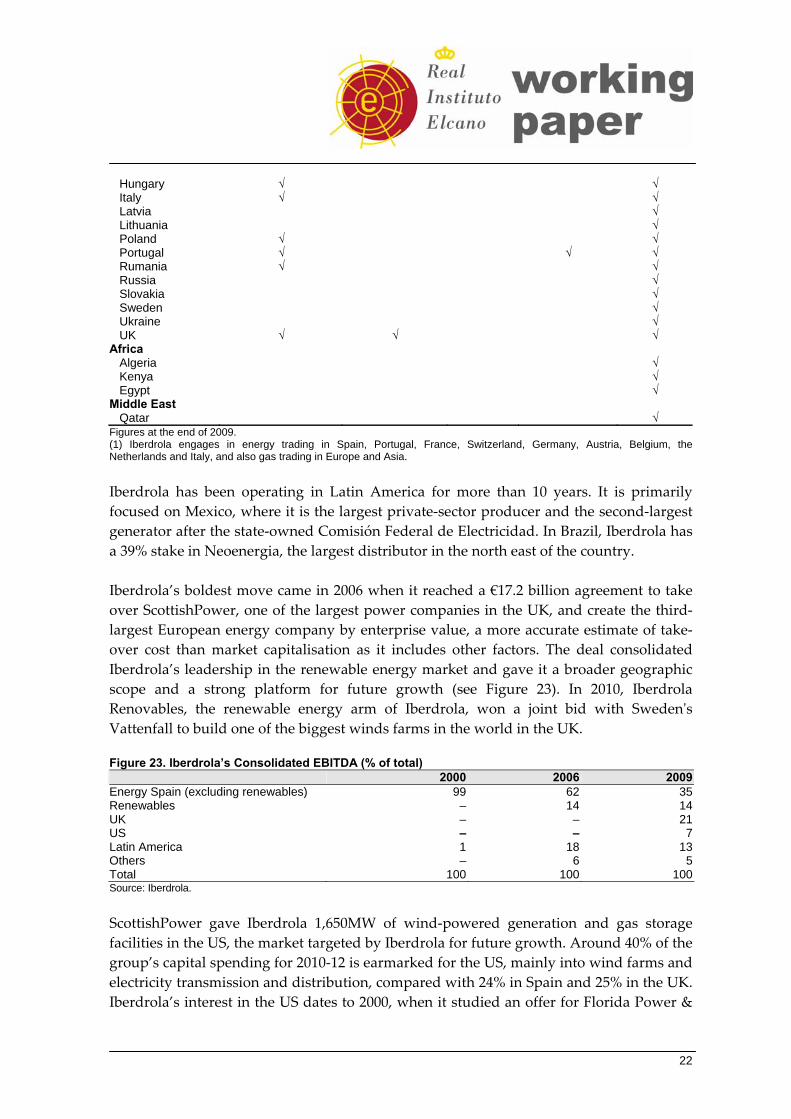
by Compass Bancshares, a franchise covering six states. By tapping the worker remittances market with Mexico, home of its large Bancomer bank franchise, BBVA can offer immigrant workers a range of other banking services. The purchase of Texas Regional Bancshares and State National Bancshares made BBVA the largest regional bank based in Texas and the acquisition of Compass gave it a position of leadership in the so‐called Sun Belt in the Southern strip and put BBVA among the 20 leading banks in the US. In August 2009 BBVA acquired the distressed Texan bank, Guaranty Financial, auctioned by the Federal Deposit Insurance Corporation. This acquisition made BBVA Compass the 15th‐largest commercial bank in the US. The operation added €8.37 billion of assets, €11.5 billion of deposits and 164 branches in Texas and California for a total of almost 750. In May 2010, BBVA agreed to buy the subsidiary in Uruguay of the French financial group Crédit Agricole, making it the second‐largest private sector bank in the country. Mexico, the US and South America generated 44.8% of total net attributable profit in the first half of 2010 compared with 37.7% in 2004 (see Figure 21). Figure 21. Net Attributable Profit by Business Areas (% of total) (1) 2004 2010 (2)Spain & Portugal 50.3 38.1Global businesses 12.0 17.1Mexico and US 30.0 30.2South America 7.7 14.6(1) Figures rounded up and the calculations made without including the losses in corporate activities. (2) First six months. Source: BBVA. (7) Electricity Iberdrola Iberdrola, the largest Spanish electricity group and the world leader in wind power, is present in close to 40 countries, either generating or distributing electricity, supplying gas or other activities (see Figure 22). Figure 22. Iberdrola’s Main Activities in the World
Electricity Generation
Electricity Distribution
Gas Supply (1)
Electricity Supply (1)
EngineeringProjects
Americas Bolivia √ Brazil √ √ √ Chile √ Guatemala √ Honduras √ Mexico √ √ US √ √ √ Venezuela √ Europe Bulgaria √ Finland √ France √ √ √ Germany √ √ √ Greece √ √
22
Hungary √ √ Italy √ √ Latvia √ Lithuania √ Poland √ √ Portugal √ √ √ Rumania √ √ Russia √ Slovakia √ Sweden √ Ukraine √ UK √ √ √ Africa Algeria √ Kenya √ Egypt √ Middle East Qatar √ Figures at the end of 2009. (1) Iberdrola engages in energy trading in Spain, Portugal, France, Switzerland, Germany, Austria, Belgium, the Netherlands and Italy, and also gas trading in Europe and Asia. Iberdrola has been operating in Latin America for more than 10 years. It is primarily focused on Mexico, where it is the largest private‐sector producer and the second‐largest generator after the state‐owned Comisión Federal de Electricidad. In Brazil, Iberdrola has a 39% stake in Neoenergia, the largest distributor in the north east of the country. Iberdrola’s boldest move came in 2006 when it reached a €17.2 billion agreement to take over ScottishPower, one of the largest power companies in the UK, and create the third‐largest European energy company by enterprise value, a more accurate estimate of take‐over cost than market capitalisation as it includes other factors. The deal consolidated Iberdrola’s leadership in the renewable energy market and gave it a broader geographic scope and a strong platform for future growth (see Figure 23). In 2010, Iberdrola Renovables, the renewable energy arm of Iberdrola, won a joint bid with Swedenʹs Vattenfall to build one of the biggest winds farms in the world in the UK. Figure 23. Iberdrola’s Consolidated EBITDA (% of total) 2000 2006 2009Energy Spain (excluding renewables) 99 62 35Renewables – 14 14UK – – 21US – – 7Latin America 1 18 13Others – 6 5Total 100 100 100Source: Iberdrola. ScottishPower gave Iberdrola 1,650MW of wind‐powered generation and gas storage facilities in the US, the market targeted by Iberdrola for future growth. Around 40% of the group’s capital spending for 2010‐12 is earmarked for the US, mainly into wind farms and electricity transmission and distribution, compared with 24% in Spain and 25% in the UK. Iberdrola’s interest in the US dates to 2000, when it studied an offer for Florida Power &
23
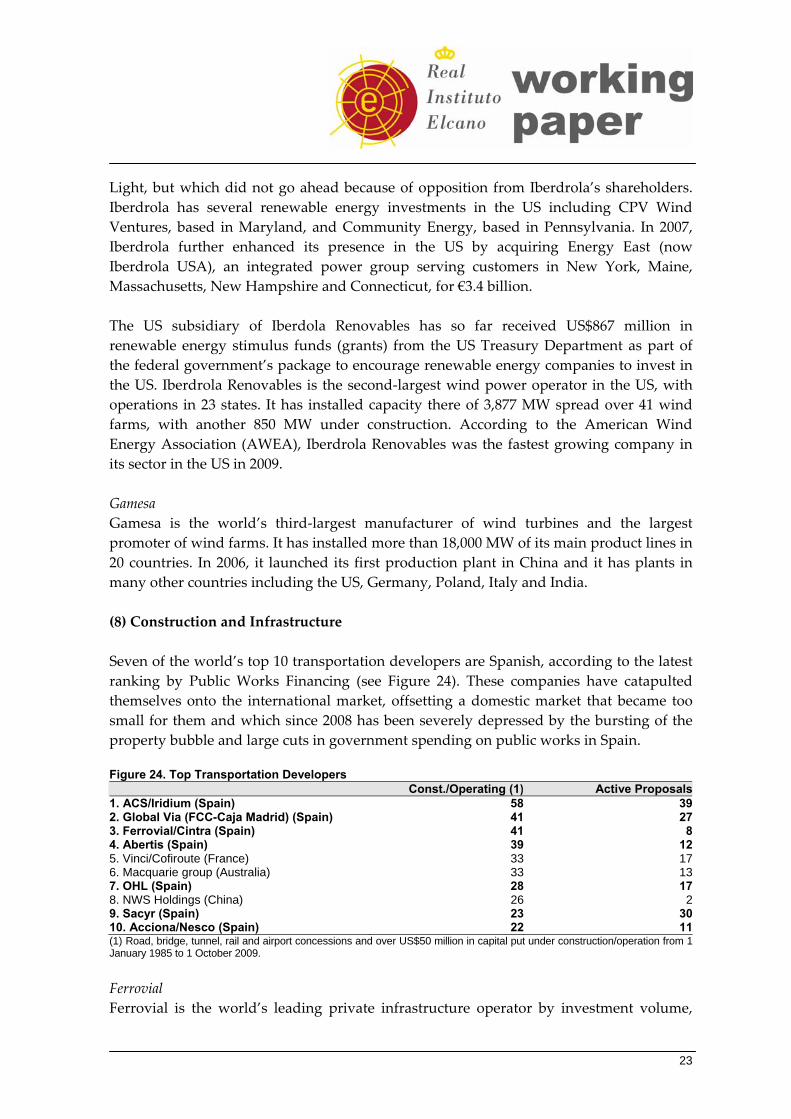
Light, but which did not go ahead because of opposition from Iberdrola’s shareholders. Iberdrola has several renewable energy investments in the US including CPV Wind Ventures, based in Maryland, and Community Energy, based in Pennsylvania. In 2007, Iberdrola further enhanced its presence in the US by acquiring Energy East (now Iberdrola USA), an integrated power group serving customers in New York, Maine, Massachusetts, New Hampshire and Connecticut, for €3.4 billion. The US subsidiary of Iberdola Renovables has so far received US$867 million in renewable energy stimulus funds (grants) from the US Treasury Department as part of the federal government’s package to encourage renewable energy companies to invest in the US. Iberdrola Renovables is the second‐largest wind power operator in the US, with operations in 23 states. It has installed capacity there of 3,877 MW spread over 41 wind farms, with another 850 MW under construction. According to the American Wind Energy Association (AWEA), Iberdrola Renovables was the fastest growing company in its sector in the US in 2009. Gamesa Gamesa is the world’s third‐largest manufacturer of wind turbines and the largest promoter of wind farms. It has installed more than 18,000 MW of its main product lines in 20 countries. In 2006, it launched its first production plant in China and it has plants in many other countries including the US, Germany, Poland, Italy and India. (8) Construction and Infrastructure Seven of the world’s top 10 transportation developers are Spanish, according to the latest ranking by Public Works Financing (see Figure 24). These companies have catapulted themselves onto the international market, offsetting a domestic market that became too small for them and which since 2008 has been severely depressed by the bursting of the property bubble and large cuts in government spending on public works in Spain. Figure 24. Top Transportation Developers Const./Operating (1) Active Proposals1. ACS/Iridium (Spain) 58 392. Global Via (FCC-Caja Madrid) (Spain) 41 273. Ferrovial/Cintra (Spain) 41 84. Abertis (Spain) 39 125. Vinci/Cofiroute (France) 33 176. Macquarie group (Australia) 33 137. OHL (Spain) 28 178. NWS Holdings (China) 26 29. Sacyr (Spain) 23 3010. Acciona/Nesco (Spain) 22 11(1) Road, bridge, tunnel, rail and airport concessions and over US$50 million in capital put under construction/operation from 1 January 1985 to 1 October 2009. Ferrovial Ferrovial is the world’s leading private infrastructure operator by investment volume,
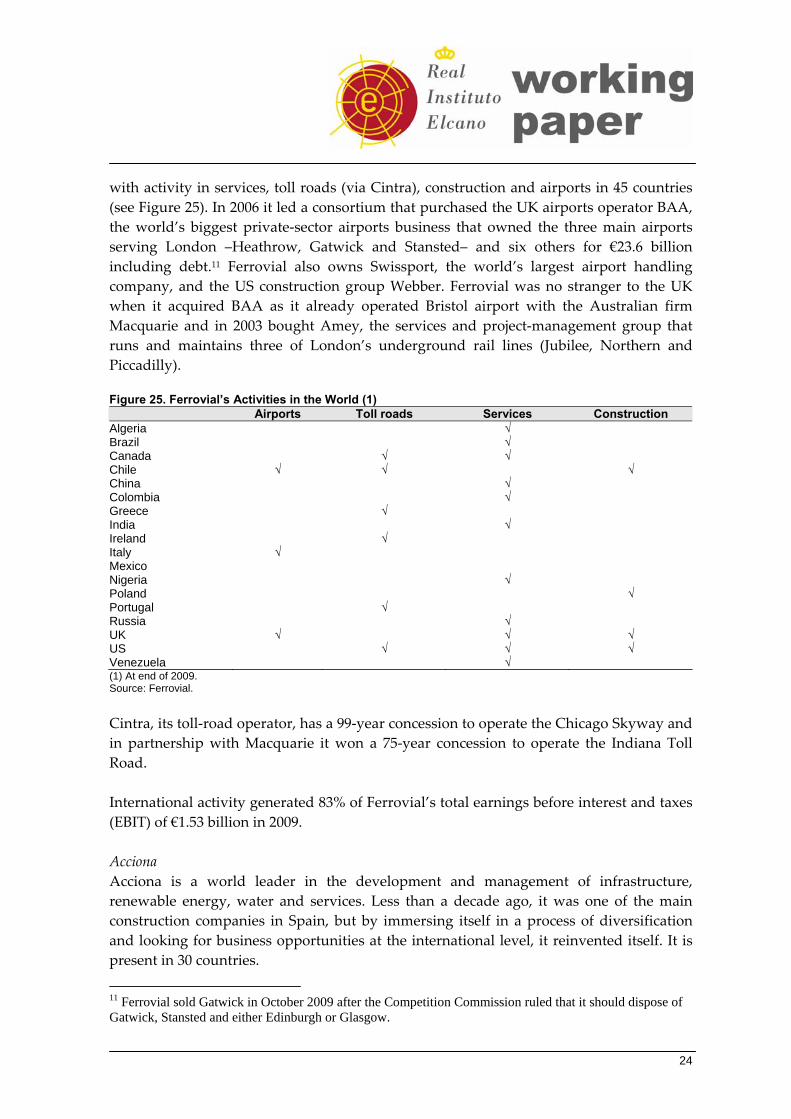
24
with activity in services, toll roads (via Cintra), construction and airports in 45 countries (see Figure 25). In 2006 it led a consortium that purchased the UK airports operator BAA, the world’s biggest private‐sector airports business that owned the three main airports serving London –Heathrow, Gatwick and Stansted– and six others for €23.6 billion including debt.11 Ferrovial also owns Swissport, the world’s largest airport handling company, and the US construction group Webber. Ferrovial was no stranger to the UK when it acquired BAA as it already operated Bristol airport with the Australian firm Macquarie and in 2003 bought Amey, the services and project‐management group that runs and maintains three of London’s underground rail lines (Jubilee, Northern and Piccadilly). Figure 25. Ferrovial’s Activities in the World (1) Airports Toll roads Services Construction Algeria √ Brazil √ Canada √ √ Chile √ √ √ China √ Colombia √ Greece √ India √ Ireland √ Italy √ Mexico Nigeria √ Poland √ Portugal √ Russia √ UK √ √ √ US √ √ √ Venezuela √ (1) At end of 2009. Source: Ferrovial. Cintra, its toll‐road operator, has a 99‐year concession to operate the Chicago Skyway and in partnership with Macquarie it won a 75‐year concession to operate the Indiana Toll Road. International activity generated 83% of Ferrovial’s total earnings before interest and taxes (EBIT) of €1.53 billion in 2009. Acciona Acciona is a world leader in the development and management of infrastructure, renewable energy, water and services. Less than a decade ago, it was one of the main construction companies in Spain, but by immersing itself in a process of diversification and looking for business opportunities at the international level, it reinvented itself. It is present in 30 countries.
11 Ferrovial sold Gatwick in October 2009 after the Competition Commission ruled that it should dispose of Gatwick, Stansted and either Edinburgh or Glasgow.
25
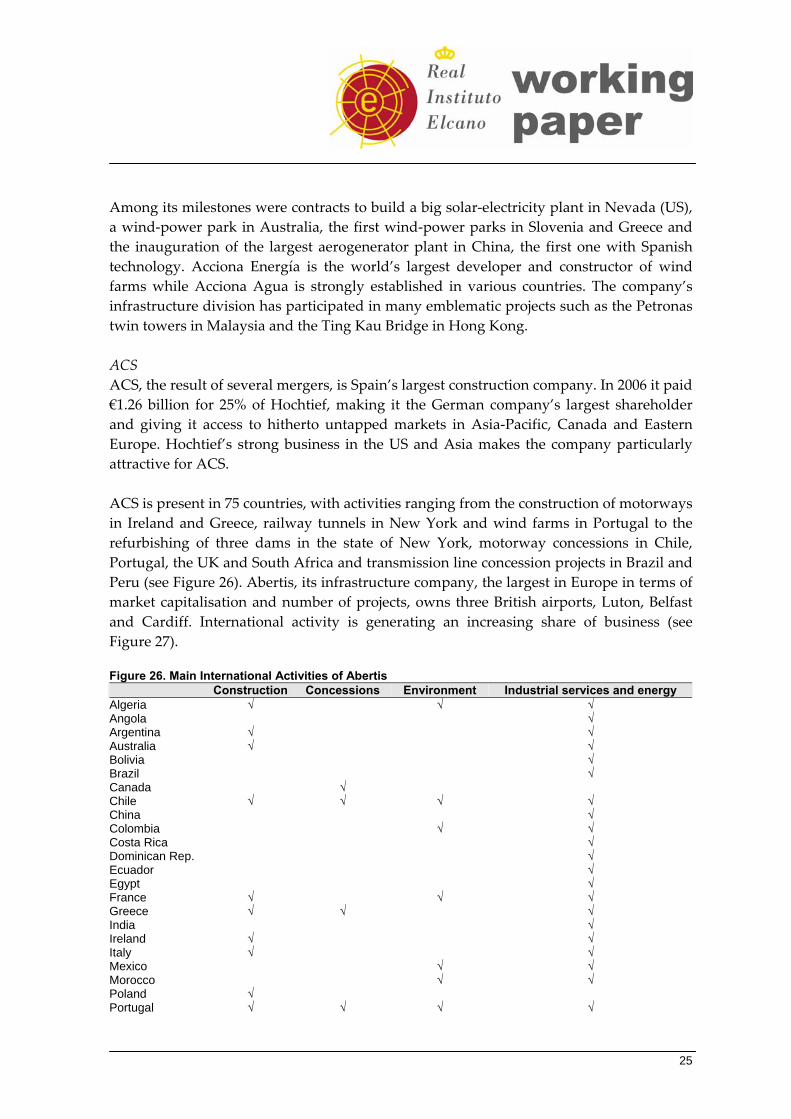
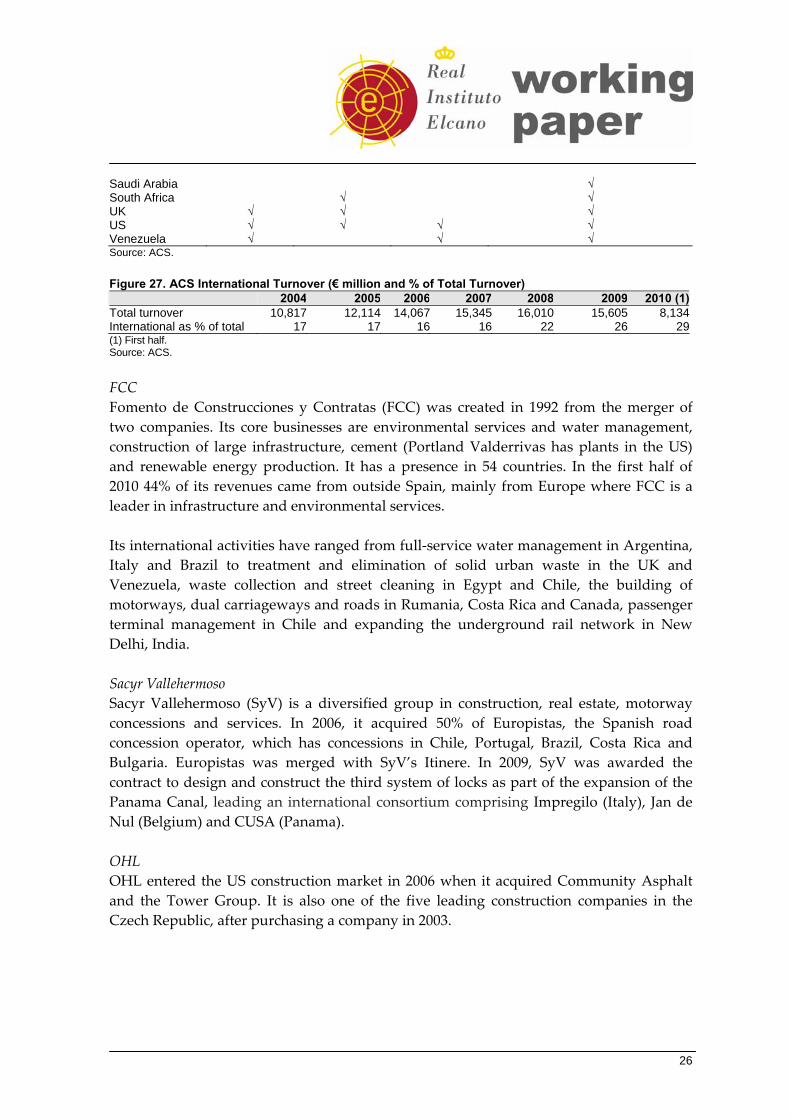
Among its milestones were contracts to build a big solar‐electricity plant in Nevada (US), a wind‐power park in Australia, the first wind‐power parks in Slovenia and Greece and the inauguration of the largest aerogenerator plant in China, the first one with Spanish technology. Acciona Energía is the world’s largest developer and constructor of wind farms while Acciona Agua is strongly established in various countries. The company’s infrastructure division has participated in many emblematic projects such as the Petronas twin towers in Malaysia and the Ting Kau Bridge in Hong Kong. ACS ACS, the result of several mergers, is Spain’s largest construction company. In 2006 it paid €1.26 billion for 25% of Hochtief, making it the German company’s largest shareholder and giving it access to hitherto untapped markets in Asia‐Pacific, Canada and Eastern Europe. Hochtief’s strong business in the US and Asia makes the company particularly attractive for ACS. ACS is present in 75 countries, with activities ranging from the construction of motorways in Ireland and Greece, railway tunnels in New York and wind farms in Portugal to the refurbishing of three dams in the state of New York, motorway concessions in Chile, Portugal, the UK and South Africa and transmission line concession projects in Brazil and Peru (see Figure 26). Abertis, its infrastructure company, the largest in Europe in terms of market capitalisation and number of projects, owns three British airports, Luton, Belfast and Cardiff. International activity is generating an increasing share of business (see Figure 27). Figure 26. Main International Activities of Abertis Construction Concessions Environment Industrial services and energy Algeria √ √ √ Angola √ Argentina √ √ Australia √ √ Bolivia √ Brazil √ Canada √ Chile √ √ √ √ China √ Colombia √ √ Costa Rica √ Dominican Rep. √ Ecuador √ Egypt √ France √ √ √ Greece √ √ √ India √ Ireland √ √ Italy √ √ Mexico √ √ Morocco √ √ Poland √ Portugal √ √ √ √
26
Saudi Arabia √ South Africa √ √ UK √ √ √ US √ √ √ √ Venezuela √ √ √ Source: ACS. Figure 27. ACS International Turnover (€ million and % of Total Turnover) 2004 2005 2006 2007 2008 2009 2010 (1)Total turnover 10,817 12,114 14,067 15,345 16,010 15,605 8,134International as % of total 17 17 16 16 22 26 29(1) First half. Source: ACS. FCC Fomento de Construcciones y Contratas (FCC) was created in 1992 from the merger of two companies. Its core businesses are environmental services and water management, construction of large infrastructure, cement (Portland Valderrivas has plants in the US) and renewable energy production. It has a presence in 54 countries. In the first half of 2010 44% of its revenues came from outside Spain, mainly from Europe where FCC is a leader in infrastructure and environmental services. Its international activities have ranged from full‐service water management in Argentina, Italy and Brazil to treatment and elimination of solid urban waste in the UK and Venezuela, waste collection and street cleaning in Egypt and Chile, the building of motorways, dual carriageways and roads in Rumania, Costa Rica and Canada, passenger terminal management in Chile and expanding the underground rail network in New Delhi, India. Sacyr Vallehermoso Sacyr Vallehermoso (SyV) is a diversified group in construction, real estate, motorway concessions and services. In 2006, it acquired 50% of Europistas, the Spanish road concession operator, which has concessions in Chile, Portugal, Brazil, Costa Rica and Bulgaria. Europistas was merged with SyV’s Itinere. In 2009, SyV was awarded the contract to design and construct the third system of locks as part of the expansion of the Panama Canal, leading an international consortium comprising Impregilo (Italy), Jan de Nul (Belgium) and CUSA (Panama). OHL OHL entered the US construction market in 2006 when it acquired Community Asphalt and the Tower Group. It is also one of the five leading construction companies in the Czech Republic, after purchasing a company in 2003.
27
(8) Other multinationals Abengoa The diversified group Abengoa, with interests in solar energy, biofuels, environmental services, information technology and industrial engineering and construction, operates in more than 70 countries. It is Europe’s largest bioethanol producer and the fifth in the US. International activity generated 61.3% of total consolidated sales in 2009. Acerinox Acerinox’s acquisition in 2002 of 64% of Columbus Stainless in South Africa made the company the world’s third‐largest stainless steel producer. Since 2001 it has also been the sole owner of North American Stainless (NAS) in Kentucky and in 2002 Columbus Stainless (South Africa) became part of the Acerinox Group. In Malaysia, Acerinox is building its first plant in Asia with Japan’s Nisshin Steel. Acerinox sells to more than 80 countries. CAF CAF is one of the international market leaders in the design, manufacture, maintenance and supply of equipment and components for railway systems. It worked on the Heathrow Express in the UK, the Hong Kong airport rail link and in Turkey won contracts for the high speed train link between Istanbul and Ankara and a tram network in Antalya. Ebro Puleva Ebro Puleva is the world leader in the rice sector and the second‐largest pasta manufacturer. It acquired Houston’s Riviana Foods, the US’s largest rice processor, in 2004 and with it Riviana’s subsidiaries in Central America, Belgium and the UK. Riviana and Ebro Puleva had been partners for many years. In 2006, it purchased Kraft Foods’ Minute Rice brand in the US and Canada, and New World Pasta, the US pasta company. Iberostar This is big tourism business group has hotels in 16 countries including Brazil, Bulgaria, Cuba, Jamaica and Turkey. Indra Indra is Spain’s leading information technologies and defence‐systems company and is the only non‐American company selected as a prime contractor for the US Navy. In Latin America it is one of the top‐five IT service suppliers. It operates in more than 100 countries and is the European company that most invests in R&D in its sector (see Figure 28). In 2009, 46% of its total revenues were generated abroad.
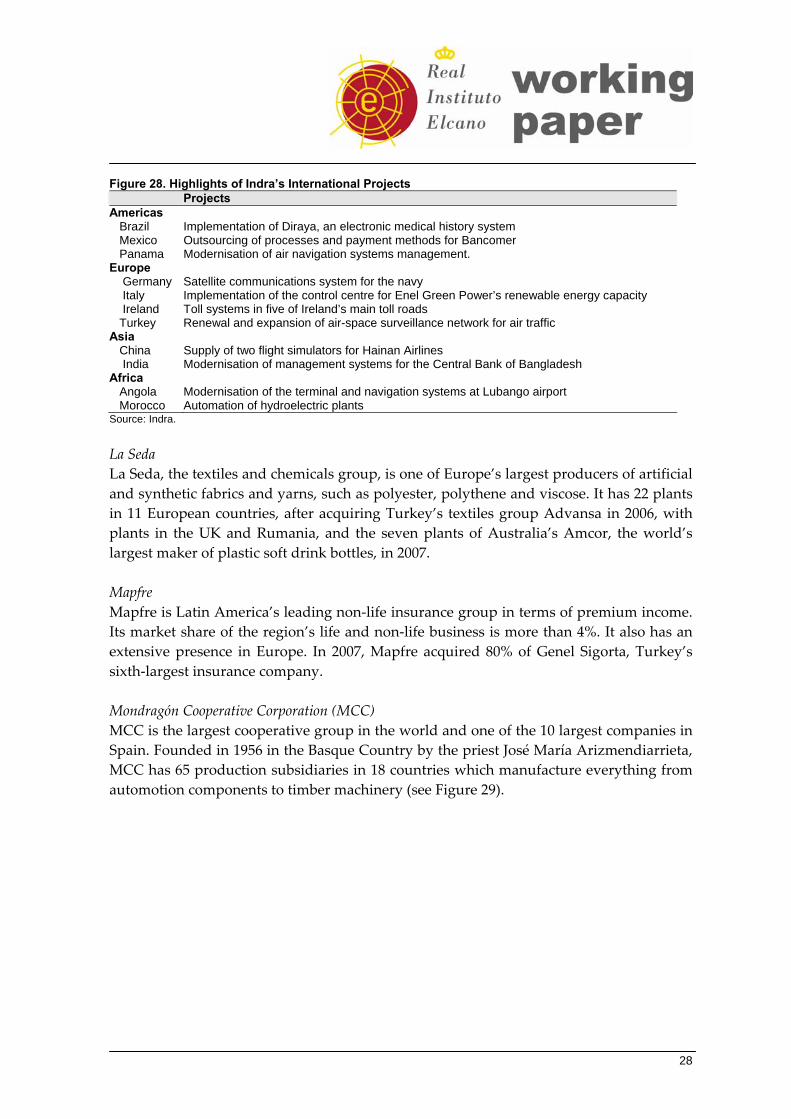
28
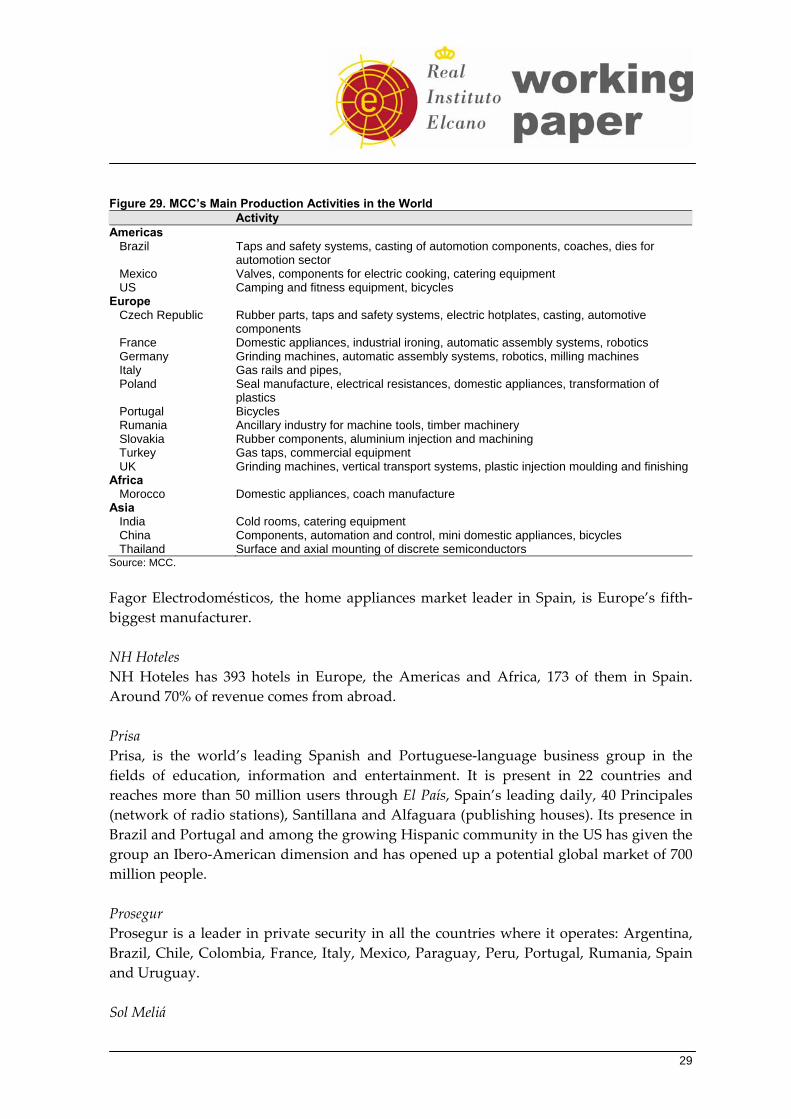
Figure 28. Highlights of Indra’s International Projects Projects Americas Brazil Implementation of Diraya, an electronic medical history system Mexico Outsourcing of processes and payment methods for Bancomer Panama Modernisation of air navigation systems management. Europe Germany Satellite communications system for the navy Italy Implementation of the control centre for Enel Green Power’s renewable energy capacity Ireland Toll systems in five of Ireland’s main toll roads Turkey Renewal and expansion of air-space surveillance network for air traffic Asia China Supply of two flight simulators for Hainan Airlines India Modernisation of management systems for the Central Bank of Bangladesh Africa Angola Modernisation of the terminal and navigation systems at Lubango airport Morocco Automation of hydroelectric plants Source: Indra. La Seda La Seda, the textiles and chemicals group, is one of Europe’s largest producers of artificial and synthetic fabrics and yarns, such as polyester, polythene and viscose. It has 22 plants in 11 European countries, after acquiring Turkey’s textiles group Advansa in 2006, with plants in the UK and Rumania, and the seven plants of Australia’s Amcor, the world’s largest maker of plastic soft drink bottles, in 2007. Mapfre Mapfre is Latin America’s leading non‐life insurance group in terms of premium income. Its market share of the region’s life and non‐life business is more than 4%. It also has an extensive presence in Europe. In 2007, Mapfre acquired 80% of Genel Sigorta, Turkey’s sixth‐largest insurance company. Mondragón Cooperative Corporation (MCC) MCC is the largest cooperative group in the world and one of the 10 largest companies in Spain. Founded in 1956 in the Basque Country by the priest José María Arizmendiarrieta, MCC has 65 production subsidiaries in 18 countries which manufacture everything from automotion components to timber machinery (see Figure 29).
29
Figure 29. MCC’s Main Production Activities in the World Activity Americas Brazil Taps and safety systems, casting of automotion components, coaches, dies for
automotion sector Mexico Valves, components for electric cooking, catering equipment US Camping and fitness equipment, bicycles Europe Czech Republic Rubber parts, taps and safety systems, electric hotplates, casting, automotive
components France Domestic appliances, industrial ironing, automatic assembly systems, robotics Germany Grinding machines, automatic assembly systems, robotics, milling machines Italy Gas rails and pipes, Poland Seal manufacture, electrical resistances, domestic appliances, transformation of
plastics Portugal Bicycles Rumania Ancillary industry for machine tools, timber machinery Slovakia Rubber components, aluminium injection and machining Turkey Gas taps, commercial equipment UK Grinding machines, vertical transport systems, plastic injection moulding and finishingAfrica Morocco Domestic appliances, coach manufacture Asia India Cold rooms, catering equipment China Components, automation and control, mini domestic appliances, bicycles Thailand Surface and axial mounting of discrete semiconductors Source: MCC. Fagor Electrodomésticos, the home appliances market leader in Spain, is Europe’s fifth‐biggest manufacturer. NH Hoteles NH Hoteles has 393 hotels in Europe, the Americas and Africa, 173 of them in Spain. Around 70% of revenue comes from abroad. Prisa Prisa, is the world’s leading Spanish and Portuguese‐language business group in the fields of education, information and entertainment. It is present in 22 countries and reaches more than 50 million users through El País, Spain’s leading daily, 40 Principales (network of radio stations), Santillana and Alfaguara (publishing houses). Its presence in Brazil and Portugal and among the growing Hispanic community in the US has given the group an Ibero‐American dimension and has opened up a potential global market of 700 million people. Prosegur Prosegur is a leader in private security in all the countries where it operates: Argentina, Brazil, Chile, Colombia, France, Italy, Mexico, Paraguay, Peru, Portugal, Rumania, Spain and Uruguay. Sol Meliá
30
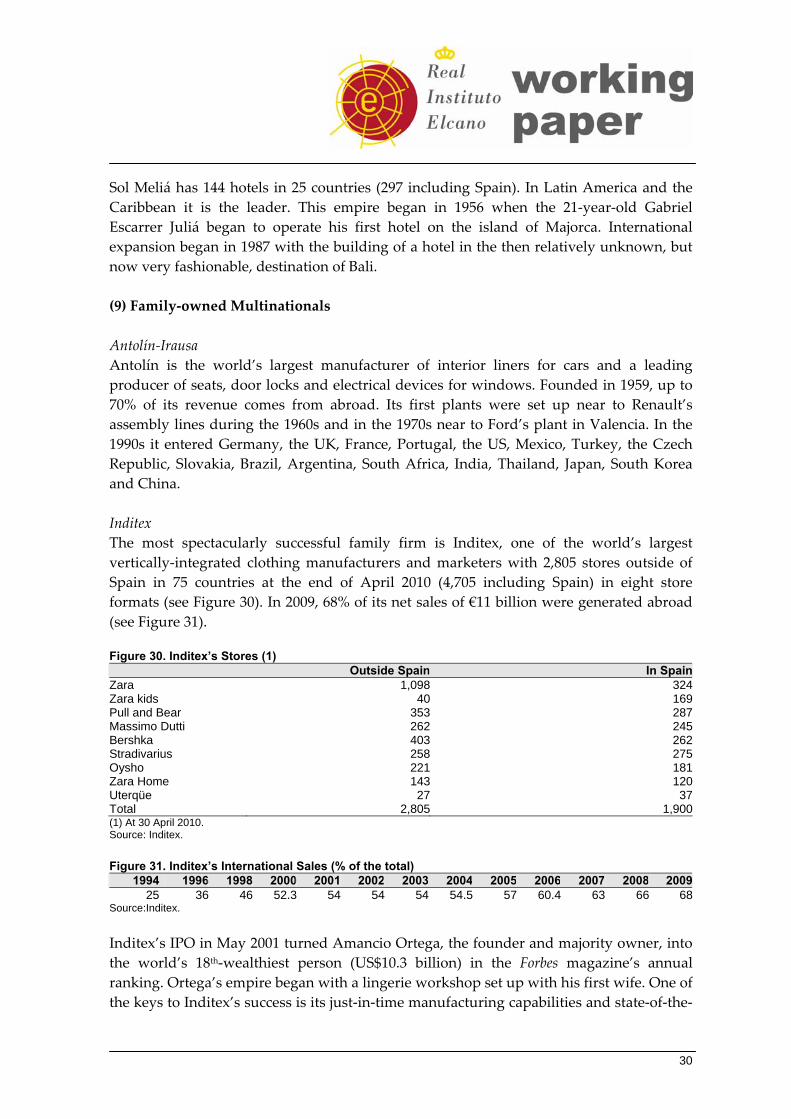
Sol Meliá has 144 hotels in 25 countries (297 including Spain). In Latin America and the Caribbean it is the leader. This empire began in 1956 when the 21‐year‐old Gabriel Escarrer Juliá began to operate his first hotel on the island of Majorca. International expansion began in 1987 with the building of a hotel in the then relatively unknown, but now very fashionable, destination of Bali. (9) Family‐owned Multinationals Antolín‐Irausa Antolín is the world’s largest manufacturer of interior liners for cars and a leading producer of seats, door locks and electrical devices for windows. Founded in 1959, up to 70% of its revenue comes from abroad. Its first plants were set up near to Renault’s assembly lines during the 1960s and in the 1970s near to Ford’s plant in Valencia. In the 1990s it entered Germany, the UK, France, Portugal, the US, Mexico, Turkey, the Czech Republic, Slovakia, Brazil, Argentina, South Africa, India, Thailand, Japan, South Korea and China. Inditex The most spectacularly successful family firm is Inditex, one of the world’s largest vertically‐integrated clothing manufacturers and marketers with 2,805 stores outside of Spain in 75 countries at the end of April 2010 (4,705 including Spain) in eight store formats (see Figure 30). In 2009, 68% of its net sales of €11 billion were generated abroad (see Figure 31). Figure 30. Inditex’s Stores (1) Outside Spain In SpainZara 1,098 324Zara kids 40 169Pull and Bear 353 287Massimo Dutti 262 245Bershka 403 262Stradivarius 258 275Oysho 221 181Zara Home 143 120Uterqüe 27 37Total 2,805 1,900(1) At 30 April 2010. Source: Inditex. Figure 31. Inditex’s International Sales (% of the total) 1994 1996 1998 2000 2001 2002 2003 2004 2005 2006 2007 2008 2009 25 36 46 52.3 54 54 54 54.5 57 60.4 63 66 68Source:Inditex. Inditex’s IPO in May 2001 turned Amancio Ortega, the founder and majority owner, into the world’s 18th‐wealthiest person (US$10.3 billion) in the Forbes magazine’s annual ranking. Ortega’s empire began with a lingerie workshop set up with his first wife. One of the keys to Inditex’s success is its just‐in‐time manufacturing capabilities and state‐of‐the‐
31
art information systems which enable it to keep low stocks in stores and respond very quickly to market trends and needs. Pronovias Pronovias is the world’s largest maker and seller of bridal wear, with a global market share of 5%. It started in 1922 and distributes through a network of more than 2,500 points‐of‐sale. Like Inditex, it is able to quickly meet the needs of each market. Roca This bathroom installations company has 64 production plants in 17 countries and is the world’s biggest in its sector. In 2006 it acquired Switzerland’s JohnsonSuisse, a company with plants in Malaysia, the Croatian and Rumanian subsidiaries of Austrian group Lasselsberger and a 50% stake in the Indian firm Parryware. In 2007 it bought Russia’s Keramkia, making it the country’s largest producer of ceramic bathroom equipment. Talgo The innovative Talgo began in the 1920s when a Basque railway engineer, Alejandro Goicoechea, pioneered a new method for building railway cars. Instead of making railway cars heavy enough to allow them to make turns at relatively high speeds, Goicoechea sought to minimise the equipment’s weight by using lighter materials and reducing the cars’ height. In addition, the wheels are mounted in pairs but not joined by an axle and are between rather than underneath the individual coaches The first prototype was launched in 1943 at a time when Spain was internationally isolated and its people starving. In 1974 the Talgo became the first high‐speed sleeper train in the world (covering the Barcelona‐Paris route). Another later feature is the suspension, which makes carriages tilt as they enter a curve and allows for higher speeds without passenger discomfort. Talgo sold coaches to Germany in 1993 and in 1994 became the first European train with a regular commercial service in the US (between Seattle and Portland). This was followed in 1995 by Seattle‐Vancouver. It entered Finland via an acquisition in 1999, where it designs, builds and maintains various types of trains and in 2003 began a service on the line between Almaty and Astana, the old and new Kazakh capitals. (10) Conclusion The direct investment abroad over the past 15 years has made parts of corporate Spain significant actors on the global stage and enabled them to weather much better any downturn in their domestic market. This has been particularly evident since 2009 when the Spanish economy took a nosedive. Today, some of these multinationals such as Santander, the banking group, earn more than two‐thirds of their profits from their international activity.
32
Until a few years ago, it looked as if some of the big players had tied a disproportionate share of their future wellbeing to Latin America, a region not known for sustained stability. But they have diversified their investments more, moving to a greater extent into Europe and in a few cases into Asia, while Latin America itself is emerging as economically much stronger and politically more democratic (with a few exceptions), most notably the region’s powerhouse, Brazil. That said, six of the main investors in Latin America and also the largest Spanish multinationals –Santander, BBVA, Telefónica, Repsol YPF, Iberdrola and Gas Natural Fenosa– account for around 70% of the Ibex‐35 index of the Spanish stock exchange, a greater degree of concentration than that of other European indices such as Germany’s DAX, France’s CAC and the UK’s FTSE 100 (see Figure 32). Figure 32. Main Weightings in the Ibex-35 (% of total) (1) %Santander 22.5Telefónica 21.8BBVA 10.6Iberdrola 8.0Repsol YPF 6.0Gas Natural 1.4(1) At 31 July 2010. Source: National Securities Market Commission. A really big crisis in Latin America would send their shares tumbling and hence the stock market as a whole, and have an impact on the bottom line of the most exposed companies and banks to varying degrees. However, while Latin America remains unpredictable, the chances of this happening are much less now than in the past, and these companies, in particular, and many other Spanish multinationals are in a stronger position to face any turbulence. All in all, the move abroad, with very few exceptions, has been a resounding success.
33
Appendix (a) Figure 33. Foreign Direct Investment Outflows by Selected Country, 1990-2009 (US$ billion) (1)
France Germany Italy UK Spain Spain
(% of EU total)1990 36.2 24.2 7.6 17.9 3.3 2.51991 25.1 22.9 7.3 16.4 4.1 3.81992 30.4 18.6 5.9 17.7 2.4 2.31993 19.5 17.1 7.2 26.0 3.1 3.31994 24.3 18.8 5.1 32.2 4.1 6.71995 15.7 39.0 5.7 43.6 4.6 2.91996 30.4 50.8 6.5 34.0 7.0 3.81997 35.5 41.8 12.2 61.6 14.4 6.41998 48.6 88.8 16.0 122.8 20.2 4.91999 126.8 108.7 6.7 201.4 44.4 6.22000 177.4 56.5 12.3 233.4 58.2 7.12001 86.7 39.7 21.4 58.8 33.1 7.62002 50.4 18.9 17.1 50.3 32.7 12.32003 53.1 5.8 9.0 62.2 28.7 10.02004 56.7 20.5 19.2 91.0 60.5 16.42005 114.9 75.9 41.8 80.8 41.8 6.82006 110.6 118.7 42.0 86.3 104.2 15.02007 164.3 162.5 90.7 318.4 137.0 10.62008 161.0 134.6 43.8 161.0 74.8 8.12009 147.1 62.7 43.9 18.4 16.3 4.2(1) Figures rounded up to nearest decimal. Source: World Investment Report 2010, UNCTAD. Appendix (b) Figure 34. Outward Stock of Direct Investment as a % of GDP by Selected Country, 1990-2009 France Germany Italy UK Spain1990 9.0 8.8 5.3 23.1 3.01991 10.6 9.6 5.9 22.4 3.71992 11.4 8.6 5.6 20.6 4.51993 12.3 9.3 7.9 25.5 5.91994 13.4 10.5 8.5 26.6 5.61995 13.0 10.6 9.4 26.8 5.81996 14.7 11.9 9.3 27.7 7.21997 16.7 14.3 11.7 27.2 9.31998 19.6 17.1 14.5 34.3 12.31999 22.9 19.3 15.1 46.8 19.12000 69.7 28.5 16.4 62.3 22.22001 59.6 32.7 16.3 60.6 23.62002 43.8 34.5 16.0 63.2 23.82003 52.6 34.0 15.9 63.8 25.02004 56.1 33.7 16.2 56.6 27.02005 57.5 33.2 16.5 52.6 27.02006 71.0 37.1 20.3 59.6 35.32007 69.6 40.1 24.6 65.6 40.82008 45.9 36.0 22.3 57.5 37.42009 64.9 41.2 27.4 76.0 44.2Source: World Investment Report 2010, UNCTAD.
34
Appendix (c) Figure 35. Domestic and International Revenues of Ibex 35 Companies, 1st Half of 2010 (€million) (1) Company Domestic International International as % of Total Revenues Abertis 939.8 (+3.1%) 958.1 (+9.9%) 50.5 Acciona 2,165 (-3.9%) 850.3 (+25.1) 28.1 Acerinox 218.8 (+39.4%) 1,953.4 (+72.1%) 89.9 ACS 5,771.4 (-8.8%) 2,362 (+31.3) 29.0 Arcelor Mittal NA NA – Banco Popular 1,905.2 (-25.0%) 157.8 (-28.9%) 7.6 Banco Sabadell 1,221.4 (-29.9%) 65.2 (+47.2%) 5.0 Banco Santander 5,611.7 (-34.7%) 19,611.3 (+2.1%) 77.7 Banesto 1,387.8 (+33.9) 64.9 (+53.6%) 4.5 Bankinter 569.6 (-41.1%) 3.4 (-26.5%) 0.6 BBVA 4,494 (-28.7%) 5,962 (-9.6%) 57 BME 163.5 (+11.6%) – – Criteria 2,719.3 (+13.1%) 1.22 (-5-6%) 0.04 Ebro Foods 55.4 (-12.5%) 793.5 (-5.6%) 93.5 Enagás 474.5 (+15.5%) – – Endesa 9,204 (+66.7%) 5,058 (+3.4%) 35.5 FCC 3,210 (-6.1%) 2,505.7 (-3.4%) 67.8 Ferrovial 1,887.7 (-14.1%) 3,878.3 (+4.4%) 67.2 Gamesa 204.4 (59.3%) 824.3 (-33.7%) 80.1 Gas Natural 5,624.5 (+38.4%) 3,806.4 (+61.2%) 40.3 Grifols 119.5 (+2.2%) 368.3 (+4.1%) 75.5 Iberdrola 7,633 (+39.6% 7,685 (+0.5%) 50.2 Iber. Renovables 515.6 (+31.3%) 607.3 (+9.4%) 54.1 Indra 825.4 (-5.1%) 503.2 (+8.5%) 37.9 Mapfre 4,028.6 (+6.4%) 3,544 (+18.4%) 65.8 OHL 727.6 (-16.7%) 1,385.5 (+27%) 65.5 Red Eléctrica 634.3 (+11.3%) 15.8 (+16.5%) 2.3 Repsol 12,125 (+8.6%) 14,738 (33.4%) 54.8 Sacyr 1,623.7 (-40%) 751.6 (+22.4%) 30.7 Telecinco 438 (+45.8%) 10.7 (+24.3%) 2.2 Telefónica 9,424.1 (-4.0%) 19,628 (+10.6%) 67.5 Total 85,923 (-0.88%) 98,093 (+10.5%) 53.3 (1) First half of 2010 and percentage change over the first half of 2009 in brackets. Figures rounded up to nearest decimal. Four companies (Abengoa, Iberia, Técnicas Reunidas and Inditex) had not published their results at the time when this table was prepared. Source: National Securities Market Commission.
35
Bibliography Antonio Nebrija University (2006), La internacionalización de la empresa española:
aprendizaje y experiencia, Universidad Antonio Nebrija, Cátedra Nebrija-Grupo Santander, Madrid.
Arahuetes, Alfredo, & Aurora Garcia (2007), ‘¿Qué ha sucedido con las inversiones directas de las empresas españolas en América Latina tras el boom de los años noventa y la incertidumbre de los primeros años 2000?’, Elcano Royal Institute, Madrid.
Casilda Béjar, Ramón (2002), La década dorada. Economía e inversiones españolas en América Latina, 1990-2000, Universidad de Alcalá, Madrid.
Casilda Béjar, Ramón (2008), La Gran Apuesta: Globalización y Multinacionales Españolas en América Latina, Granica, Madrid.
Chislett, William (2002), The Internationalisation of the Spanish Economy, Elcano Royal Institute, Madrid, www.realinstitutoelcano.org/publicaciones/libros/wchislett.pdf.
Chislett, William (2003), Spanish Direct Investment in Latin America: Challenges and Opportunities, Elcano Royal Institute, Madrid, www.realinstitutoelcano.org/publicaciones/libros/SpanishDirect.pdf.
Chislett, William (2005), Spain and the United States: The Quest for Mutual Rediscovery, Elcano Royal Institute, Madrid, www.realinstitutoelcano.org/publicaciones/libros/ChislettEsp-EEUU-ingles.pdf.
Chislett, William (2007), Spain’s Main Multinationals: An Increasing Force in the Economy, http://www.realinstitutoelcano.org/wps/portal/rielcano_eng/Content?WCM_GLOBAL_CONTEXT=/elcano/elcano_in/zonas_in/dt+32-2007.
Chislett, William (2008), Spain: Going Places. Economic, Social and Political Progress, 1975-2008, Telefónica, Madrid.
Guillén, Mauro (2005), The Rise of Spanish Multinationals, Cambridge University Press, Cambridge, UK. Guillén, Mauro, & Adrián Tschoegl (2007), Santander, El Banco, LID Editorial, Madrid. Guillén, Mauro, & Esteban García-Canal (2010), The New Multinationals: Spanish Firms
in a Global Context, Cambridge University Press, Cambridge. UNCTAD (2010), World Investment Report, United Nations, New York.