Embed Size (px)
Citation preview
Comparisons of Foreign Multinationals and Local
Firms in Asian Manufacturing Over Time
Eric D. Ramstetter Coordinator, Research Division, ICSEAD
Working Paper Series Vol. 98-18 November 1998
The views expressed in this publication are those of the author(s) and
do not necessarily reflect those of the Institute.
No part of this article may be used reproduced in any manner
whatsoever without written permission except in the case of brief
quotations embodied in articles and reviews. For information, please
write to the Centre.
The International Centre for the Study of East Asian Development, Kitakyushu
Comparisons of Foreign Multinationals and Local Firms
in Asian Manufacturing Over Time
Eric D. Ramstetter, Revised and Corrected July 1999
The International Centre for the Study of East Asian Development
11-4 Otemachi, Kitakyushu, 803-0813, Japan; email [email protected]
Abstract
This paper first shows that shares of foreign multinational corporations (MNCs) in the manufacturing
sectors of five Asian host economies (Hong Kong, Indonesia, Malaysia, Singapore, and Taiwan) were generally
large in terms of exports, small in terms of employment, and moderate in terms of production. Correspondingly,
the average product of labor and export propensities were often significantly higher in foreign MNCs than in
local firms. In addition, foreign MNCs tended to be relatively large and to have relatively high average capital
productivity, capital intensity, skilled-labor intensity, R&D intensity, profit rates, and import propensities, but
relatively low shares of labor compensation in value added, and these differences were also statistically
significant in many cases. Differences between wholly- or heavily-foreign plants and foreign plants with lower
foreign ownership shares were also significant in many cases and generally in the same direction as the
differences between MNCs and local plants noted above. Differences among MNCs by foreign source were
generally small and insignificant in Hong Kong. In Singapore, European and U.S. firms tended to be larger and
characterized by relatively high average labor productivity, capital intensity, profitability, and export
propensities, but relatively low shares of labor compensation in value added compared to Japanese and Other
Asian firms.
1This paper is an updated, revised, and corrected version of a paper presented at the Sixth Conventionof the East Asian Economic Association (Kitakyushu, Japan, 4-5 September 1998). That version also appeared as the first version of this ICSEAD (International Centre for the Study of East Asian Development) WorkingPaper 98-18 in November 1998. The paper is also related to Ramstetter (1994b) and more detailed studies ofMalaysia and Singapore (Ramstetter 1995, 1996). Accordingly, I wish to thank those who offered assistancewith and comments on those papers, particularly Laurel A. Adams, Hal Hill, Denise Eby Konan, Robert E.Lipsey, Linda Low, Atsushi Murakami, Yumiko Okamoto, and Mitsuru Toida. I also wish to extend my specialgratitude for comments from an anonymous referee for the Asian Economic Journal that pointed out animportant error in the previous version of this paper. All remaining errors and all opinions expressed in thispaper are the sole responsibility of the author.
1
Comparisons of Foreign Multinationals and Local Firms
in Asian Manufacturing Over Time
Eric D. Ramstetter1, Revised and Corrected July 1999
1. Introduction
Since the rapid increases in inward (and outward) foreign direct investment (FDI) that began in Asia in
the late 1980s, the roles of foreign multinational corporations (MNCs) have attracted increasing attention
among economists, businessmen, and policy makers. Unfortunately, many studies of trends in activities of
MNCs over time are severely limited because the data used are often very poor indicators of economic
performance in MNCs (e.g., data on actual FDI flows compiled in the balance of payments). Indeed, some of
the data are so misleading (e.g., data on approved or reported FDI) that it is hard to understand why
governments continue to publish such data or why responsible researchers continue to use them. Due in large
part to the lack of reliable data, there are even fewer studies that attempt to test whether observed differences
between foreign MNCs and local firms, or among groups of foreign MNCs, are in some sense statistically
significant in a time series context.
This study tries to take a small step toward filling this gap in the literature by analyzing trends in the
shares of foreign MNCs in selected Asian host economies, and then performing simple tests to see whether
observed differences between foreign MNCs and local firms, or among groups of foreign MNCs, are
statistically significant in a time series context. Due primarily to data constraints and the desire to cover as
many host economies as possible, the focus is limited to aggregate manufacturing in five Asian economies,
2On the theoretical point, Buckley and Casson (1991), Casson (1987), Rugman (1980, 1985), forexample, argue that the possession of such ownership advantages is a sufficient, but not necessary, condition fora firm to become a multinational. For reviews of both the theoretical and empirical literature see, for example,Caves (1996), Dunning (1993), and Markusen (1991).
2
Hong Kong, Indonesia, Malaysia, Singapore, and Taiwan. The paper proceeds in six steps. First, the
theoretical rationale for examining differences between foreign MNCs and local firms, as well as for examining
differences among groups of MNCs (e.g. distinguished by foreign ownership share or by foreign source) is
briefly reviewed (section 2). Second, trends in the shares of foreign MNCs in employment, production, and
exports of the host economies studied are examined (section 3). Third, to the extent that data availability
permits, five types of economic characteristics (size, factor productivity, factor intensity, functional income
distribution, and trade propensities) are compared between foreign MNCs and local firms in the five economies
(section 4). Fourth, in the economies where data are available (Hong Kong, Indonesia, and Singapore), the
economic characteristics are compared among groups of foreign MNCs distinguished by foreign ownership
share. Fifth, again in the economies where data are available (Hong Kong and Singapore), the economic
characteristics are compared among groups of foreign MNCs distinguished by foreign source (section 6).
Finally, important results are summarized (section 7).
2. Theoretical and Methodological Issues
There is a very simple and powerful theoretical logic suggesting that MNCs will differ from non-MNC
s in important respects. Namely, compared to non-MNCs, foreign MNCs are often asserted to possess
relatively large amounts of proprietary, knowledge-based, generally intangible assets related to production
technology, marketing, and management. Indeed, some theoreticians (e.g., Dunning 1993) go so far as to
suggest that the possession of these ownership-based advantages is a necessary condition for a firm to become a
MNC. Although there is an extensive debate over this theoretical point, the general empirical agreement that
MNCs tend to possess relatively large amounts of production-technology-related intangible assets, as well as
relatively large amounts of marketing-related intangible assets, is the point of importance in this context.2
The possession of such assets is important because it first suggests that MNCs will tend to be more
efficient than non-MNCs. This greater efficiency may be reflected in a number of ways, for example, larger
3For related literature, see, Chao and Yu (1996), Dunning (1993, ch 7-9, 11), Caves (1996, ch. 3, 7, 9).
3
firm or plant size, higher factor productivity (and thus higher factor returns), and/or higher capital or technology
intensity, in MNCs. Second, marketing-related assets in MNCs are often concentrated in international
marketing, implying that MNCs may be more able to exploit opportunities in foreign markets than non-MNCs,
and will therefore be more dependent on exports and/or imports than non-MNCs. Third, foreign MNCs are also
likely to be larger than non-MNCs in the host economies studied here because MNCs are generally large firms
that operate on a worldwide or region-wide basis and because most foreign MNCs come from home economies
where average firm or plant size is likely to be relatively large compared to the host economies studied here.
Since foreign firms investing in the economies studied are by definition MNCs and, at least until
relatively recently, there have been relatively few local MNCs in these economies, comparisons of foreign MN
Cs and local firms in these economies may generally be considered comparisons of MNCs and non-MNCs.
Accordingly, section 4 examines differences between foreign MNCs and local firms under the assumption that
this is essentially a comparison of MNCs and non-MNCs. It should be noted, however, that outward FDI has
grown rapidly from Hong Kong, Singapore, and Taiwan in the last decade and that comparisons of foreign
MNCs and local firms in these economies are not strictly comparisons of MNCs and non-MNCs. For example,
it may be that differences between foreign MNCs and local firms in these economies have diminished
somewhat in recent years, precisely because an increasing number of local firms have become MNCs and
developed many of the intangible assets that foreign MNCs are thought to possess. Moreover, given that the
hypothesized differences between MNCs and non-MNCs are among the most important theoretical principles
underlying this study, the failure to distinguish local MNCs and local non-MNCs, in addition to foreign MNCs,
is clearly a major limitation that mandates particular caution when interpreting results for Hong Kong,
Singapore, and Taiwan after the mid-1980s.
A second set of issues examined here is the extent to which characteristics of MNCs differ depending
on foreign ownership shares. In this respect, it is often suggested that MNC parents are not likely to allow
foreign affiliates access to their knowledge-based, intangible assets (e.g., technology-related assets such as
patents, as well as marketing-related assets such as international trade networks) unless the MNC parent can
control how those assets are used.3 The reason for this is that, if foreign affiliates use these assets in a manner
inconsistent with parent goals (e.g., selling technology to third parties or trying to sell in markets where they
4In this respect, it is important to note that many Asian economies have limited foreign ownershipshares during the last few decades and offered incentive packages which relax foreign ownership restrictions ifthe foreign MNC meets certain performance requirements (e.g., invests a sufficiently large amount, employs alarge number of workers, exports a large percentage of output). In such cases it is a very tricky issue to sort outwhether observed differences among groups of MNCs are due to intrinsic differences in firm behavior or due topolicy distortions. A good example of this is the strong correlation between foreign ownership shares andexport propensities observed in cross sections for Thailand in 1990 and Indonesia in 1990, 1992, and 1994, andin time series for Singapore (see Ramstetter 1994a, 1998b, 1998c, evidence from this paper). On the one hand,Thailand and Indonesia have had policies of loosening foreign ownership restrictions for firms that export largeshares of output, suggesting that the differences observed may due to policy distortions. On the other hand,Singapore has never had such a policy and the fact that a seemingly consistent result obtains across economiessuggests that the pattern may be a result of systematic behavior by MNCs.
4
compete with the parent), then the MNC as a whole may be less profitable or competitive. On the other hand,
an important way in which parents can help foreign affiliates (and the MNC as a whole) become profitable is to
share the pool of intangible assets. Moreover, even if control matters, high foreign ownership shares are not the
only means through which the parent can exercise control. Thus, a priori, it is not clear (1) how much parents
will seek to limit the access of foreign affiliates to intangible assets developed by the MNC, (2) to what extent
such limits will be correlated with foreign ownership shares, or (3) what effects these limits might have on
affiliate performance. In addition, there is relatively little empirical evidence on this point. Correspondingly, as
a step toward clarifying this issue, section 5 examines differences among 3 categories of foreign MNCs,
minority-foreign MNCs, majority-foreign MNCs, and heavily- or wholly-foreign MNCs.4
Perhaps an even more complicated issue is whether there are observable differences among groups of
MNCs when distinguished by foreign source. One of the first researchers to offer hypotheses in this regard was
Kojima (e.g., 1978, 1990), who argued that Japanese MNCs were more trade oriented than U.S. and European
MNCs. Although the empirical evidence does not appear to support this particular hypothesis (e.g., Hill and
Johns 1985; evidence for Singapore from this paper), Kojima’s arguments are interesting in part because his
theoretical arguments focus on differences in MNCs from less capital-abundant and more capital-abundant
economies (e.g., Japan and the United States in the early 1970s). If such an approach is valid it might also
suggest that there are systematic differences between MNCs from the so-called newly industrialized economies
(e.g., Hong Kong, Singapore, and Taiwan) and MNCs from more advanced industrialized economies (e.g.,
Europe, Japan, the United States) in recent years. Interestingly, numerous studies of MNCs from developing
economies (e.g., Lall 1983; United Nations-ESCAP/UNCTC 1988; Kumar 1995) appear to be implicitly based
on a similar logic. In addition, the general impression that Japanese MNCs may be different from other MNCs
5For example, if one allows for the fact that sample variances often differ between MNCs and non-MNCs, while recognizing that sample size is equal for MNCs and non-MNCs, then the following is theappropriate t-statistic to test the hypothesis that the difference between the means for these two groups of firmsis zero (Sachs 1984, p. 270):t=(MEAN(Xm)-MEAN(Xn))/SQRT((VAR(Xm)+VAR(Xn))/N)where MEAN=mean operator, N=number of observations, SQRT=square root operator, VAR=sample varianceoperator, Xm=value of variable X for MNCs in year t, Xn=value of variable X for non-MNCs in year t. This t-statistic then has degrees of freedom, (=DF):DF=N-1+((2N-2)/((VAR(X1)/VAR(X2))+(VAR(X2)/VAR(X1)))
Note that the t-statistic I used in previous studies was incorrect and biased toward zero compared tothis correct statistic. I am grateful to an anonymous referee for pointing out this error.
5
persists in the literature (e.g., Encarnation 1993; Encarnation and Mason 1993) and there is empirical evidence
that Japanese MNCs in the United States do differ in important respects from other foreign MNCs in the United
States (Howenstine and Shannon 1996; Zeile 1998). Another important strand of the literature does not limit its
focus to MNCs but focuses more on the more general differences between the behavior of Japanese firms and
U.S. and/or European firms (e.g., Aoki 1988, 1990). Accordingly, section 6 below tries to ascertain whether
there are differences among four major groups of MNCs, U.S. MNCs, European MNCs, Japanese MNCs, and
other Asian MNCs.
In view of the foregoing discussion, the primary purpose of this study is to investigate the nature of
differences between foreign MNCs and local firms, as well as differences among between groups of foreign
MNCs distinguished by foreign ownership share or by foreign source. To this end, variables falling into five
categories of economic characteristics are examined as follows:
1. Firm or plant size1a. Employees per firm or Employees per plant1b. Value added per firm or Value added per plant2. Factor productivity2a. Average product of labor2b. Compensation per employee2c. Average product of capital3. Factor intensity3a. Fixed assets per employee3b. Non-production workers/all employees or Salaried workers/all employees3c. R&D Expenditures/sales4. Functional income distribution4a. Compensation/value added4b. Profits/sales5. Trade propensities5a. Exports/sales5b. Imports/sales
The mean of each available variable is calculated for the two groups being compared, and then a t-statistic is
calculated to test the hypothesis that difference between these two means is zero.5 This procedure is a useful
6For an example of modeling with the time series data used here see Ramstetter (1991). Note also thatthere are some large cross sectional data sets that allow for much more sophisticated and reliable modelestimation for Indonesia (e.g., Hill 1988, pp. 107-117; Ramstetter 1998b) and Thailand (e.g., Khanthachai, etal., 1987; Ramstetter 1994a; Tambunlertchai and Ramstetter 1991).
6
first step in identifying the direction and size of mean differences between two groups of firms, and how
consistent those differences are in a time series context. However, the methodology has one very important
drawback. Namely, it does not allow one to account for other factors that might be relevant to explaining
observed differences. For example, if one observes that foreign MNCs have a higher average product of labor
than local firms, that difference may simply be due a combination of higher labor productivity in firms with
higher capital intensity and higher capital intensity in foreign MNCs. In other words, the difference in labor
productivity between foreign MNCs and local firms might disappear if differences in capital intensity could be
accounted for. Continuing with the same example, a preferable alternative would be to build and estimate a
model of production that accounts for these and other influences that are known to affect labor productivity, and
then test for differences between foreign MNCs and local firms in that context. Unfortunately, given the short
length of the time series available and the high probability of unit roots in a number of the relevant series, the
results of estimating such models in the annual time series that are available would be highly unreliable.6
Another problem encountered in the analysis below has to do with the focus on aggregate
manufacturing. The high degree of aggregation is beneficial in that it facilitates the widest possible coverage of
host economies as more disaggregated data are not available for Malaysia and Singapore, and often unavailable
for Hong Kong and Taiwan, depending on the industry. However, the high degree of aggregation means that,
for example, relatively high labor productivity in foreign MNCs may simply be a result of the concentration of
foreign MNCs in industries characterized by relatively high labor productivity. Thus, care must be taken to
identify results that are related to the concentration of MNCs in specific industries.
3. Shares of Foreign Multinationals in Employment, Production, and Exports of Host Economies
Table 1 provides an overview of how large foreign MNCs are relative to the manufacturing sectors of
the five economies studied. Before beginning the analysis, however, some characteristics of the data should be
noted (see Appendix A for more details). Data for Hong Kong and Singapore are perhaps the most reliable
7For example, in all years the ratio of the standard deviation to the mean was employment=0.15, valueadded=0.20, exports=0.16 in Hong Kong; employment=0.16, value added=0.18 in Malaysia-2; andemployment=0.22, value added=0.23, exports=0.25 in Taiwan. Singapore is the notable exception in thisrespect with employment=0.052, value added=0.054, exports=0.013 (from Table 1).
7
here, as they usually come from consistent industrial censuses or surveys that have been tagged by ownership
(data on exports in Hong Kong are the one exception, see Appendix A). Data for Malaysia are also internally
consistent and thought to be relatively reliable. However, there are two distinct sources of data for Malaysia,
financial surveys of relatively large limited companies and more comprehensive industrial censuses or surveys.
Data for Indonesia also come from a single set of industry survey data tagged by ownership and are thus
internally consistent in many respects. However, the Indonesian data are also known to vary in coverage over
time, with coverage generally improving in more recent years. This mandates extreme caution when using these
data in a time series context. The Taiwanese data are problematic for two reasons. First, as in Indonesia, the
surveys of foreign firms that are the source of foreign MNC data apparently vary in coverage over time,
suggesting that some of the changes observed are due to changes in survey coverage, not just changes in
economic activity. Second, data for local firms are estimated by calculating the differences between economy-
wide estimates and foreign MNC estimates. In other words, data for foreign MNCs and local firms do not come
from a single source as in the other economies studied here, creating the possibility of internal inconsistencies
in the data. A final problem in all countries is the lack of good deflators for fixed assets and exports. In this
study the deflator for manufacturing GDP (or total GDP in Hong Kong) is used in all real calculations, though
this is obviously a very imperfect solution. Despite difficulties with the data that are thought to be most severe
in Taiwan and Indonesia, I still believe that these data are in general the best available indicators of trends in the
economic activities of foreign MNCs in the manufacturing sectors of these economies.
As stressed in previous studies (e.g., Ramstetter 1998a), it is also important to note that trends in shares
of foreign MNCs in host economy production often display markedly different trends over time than FDI-based
indicators, and are in general much more stable over time. A related observation from Table 1 is that shares of
foreign MNCs are generally more stable in terms of employment than in terms of value added or exports.7
Table 1 also reveals that shares of MNCs in host economies tended to decline in from the mid-1970s to the mid-
1980s and increase thereafter. Accordingly, the sample period, which extends from 1970 at the earliest to 1996
at the latest, has been divided into two subperiods, the early period through 1986 and the late period from 1987
8In this section, the term "local firms" is used refer both to local firms or to local plants. Note thatmost of the data utilized here are compiled and classified at the plant level (e.g., most data for Hong Kong,Indonesia, Malaysia’s industrial censuses/surveys, Singapore). Only two of the data sets used (Malaysia’sfinancial surveys of limited companies and Taiwan’s surveys of foreign MNCs) were compiled and classified atthe firm level.
8
forward. Interestingly, despite a well documented FDI boom in Asia in the late period (e.g., United Nations,
various years), shares of foreign MNCs in host economies were often smaller in the mid-1990s than in the mid-
1970s. Indeed, Singapore was the only economy where all shares were consistently higher in the mid-1990s
than in the mid 1970s. There was also a wide variation in shares of foreign MNCs across host economies that is
very difficult to explain. On the one hand, foreign MNCs clearly dominate manufacturing in Singapore, and
have also dominated in Malaysia for a number of years in the sample. In contrast, despite being perhaps the
most open economy to inward FDI in Asia, foreign MNC shares were generally much lower in Hong Kong than
in the other economies studied here. The most important pattern in the context of this study is that MNCs
tended to be largest relative to the host economy in terms of exports, second largest in terms of production, and
smallest in terms of employment. This pattern is important because it suggests that foreign MNCs are generally
characterized by relatively high production per worker and relatively high export propensities (i.e., export-
production ratios).
4. Major Economic Differences between Foreign Multinationals and Local Firms
The paper now turns to a more detailed comparison of foreign MNCs and local firms.8 For each
variable and period considered, Table 2 presents (1) the percentage difference between the mean value of a
variable for foreign MNCs and the mean value of the variable for local firms, (2) a t-statistic used to test the
null hypothesis that the difference in absolute means between foreign MNCs and local firms is zero, and (3) the
two-tailed significance level of this t-statistic. As in Table 1, calculations are done for three periods, all years in
the sample, years through 1986, and years from 1987 forward.
One of the strongest and most consistent results obtained is that foreign MNCs were generally much
larger than local firms in Hong Kong, Indonesia, Malaysia, and Singapore, and these differences were always
highly significant statistically. This is true whether size is measured in terms of employees per firm or plant or
in terms of real production per firm or plant. This result is also consistent with perceptions that MNCs are
9Note that this result in particular contrasts with the results presented in the previous version of thispaper and in Ramstetter (1994b, 1995, 1996), the differences being the result of using an incorrect t-statistic inthe previous papers. Again, I am very grateful to an anonymous referee for pointing out this mistake.
9
generally big firms and that firms in major home economies (e.g., the United States, Japan, Europe) tend to be
larger than in the host economies studied here.
Average labor productivity (measured as value added or net production per employee) was
significantly higher in foreign MNCs in all countries except Malaysia.9 In Malaysia, the results differ somewha
t between the two sources. The limited company data, which include mainly larger firms, reveal no significant
differences for the 1972-1986 or 1972-1989 periods, but negative and significant differences in the small
sample for 1987-1989. The industrial survey data, which contain a more comprehensive sample of plants,
indicate positive and significant differences for the period through 1986, but small and insignificant differences
in the period after 1987. Thus, although the two data sets differ in important respects, they both show a marked
decline in average labor productivity in foreign MNCs relative to local firms after 1987. As detailed in
Ramstetter (1995), the decline of the labor productivity differential in Malaysia over time is thought to be
related to the increasing concentration of foreign MNCs in the electric machinery industry, an industry
characterized by relatively low labor productivity in Malaysia.
Differences in terms of compensation per employee were also positive, but smaller than differences in
labor productivity in most samples, and observed differences were not statistically significant at the 5 percent
level or better in Singapore and Taiwan, or in Malaysia after 1987. The relative lack of significant differences
here is somewhat surprising because economic theory suggests that labor productivity and wages are highly
correlated and there were numerous large and significant differences in labor productivity as noted above.
Differences in average capital productivity (value added per unit of fixed assets) were positive and generally
significant in Malaysia, though the industrial survey data suggest that the differences became much smaller and
insignificant after 1987. In Singapore, differences in average capital productivity were small and insignificant.
As might be expected given combination of significantly higher average labor productivity and
insignificant differences in average capital productivity, foreign MNCs were more capital intensive (i.e., they
had higher fixed assets per employee) than local firms in Singapore, with observed differences being highly
significant. In contrast, foreign MNCs in Malaysia were characterized by significantly lower capital intensity
after 1987, again probably reflecting the growing importance of foreign MNCs in Malaysia’s electronics sector,
10For example, analysis of plant-level Indonesian data reveal evidence that labor productivity and otherindicators related to production technology are significantly higher in foreign MNCs than in local plants (e.g.,Hill 1988, pp. 107-117; Sjöholm 1998) as well as evidence of significantly higher trade (both export andimport) propensities in foreign MNCs (Ramstetter 1998b, 1998c). For Thailand, there is also evidence thatexport propensities are significantly higher in foreign MNCs than in local firms in Thailand (Ramstetter 1994a)and labor productivity and other indicators related to production technology also tend to be higher in foreign MNCs, but differences in production technology are often found to be insignificant statistically (e.g., Khanthachaiet al. 1987; Ramstetter 1994a; Tambunlertchai and Ramstetter 1991).
10
which is rather labor intensive. Data for Indonesia and Taiwan indicate that differences in skilled-labor
intensity (measured as non-production workers or salaried workers as a share of total employment) were also
positive, with these differences being significant in Taiwan in both periods and in Indonesia in the early period.
Data for Singapore and Taiwan also suggest that foreign MNCs had a higher degree of R&D intensity
(measured as the ratio of R&D expenditures to total sales) but that differences were not statistically significant
in Singapore in both periods or in Taiwan in the late period.
On the distribution side, the share of labor compensation in value added (or labor share) was generally
lower in foreign MNCs than in local firms in Hong Kong, Malaysia, Singapore, and Taiwan. These differences
were again significant in most cases, Malaysia in the late period being the exception. In Singapore, profit rates
(measured as the profit-sales ratio) were higher in foreign MNCs than in local firms and these differences were
significant statistically in all periods. In Malaysia, foreign MNCs also had significantly higher profitability in
the early period, but this was reversed in the late period. Trade propensities (ratios of trade flows to total sales
or production) were always higher in foreign MNCs than in local firms and these differences were almost
always significant statistically. The one exception was in Taiwan’s exports in the late period, where differences
became very small.
In short, with a few notable exceptions, these results suggest that foreign MNCs tended to be relatively
large and to have relatively high average labor productivity, average capital productivity, capital intensity,
skilled-labor intensity, R&D-intensity, profit rates, and trade propensities, but relatively low labor shares of
value added. Moreover, these differences were often highly significant statistically. The small number of
economies examined here makes generalizing difficult, but these results are largely consistent with the view that
foreign MNCs have relatively large endowments of firm-specific assets such as production technology and
marketing networks. The results are also more or less consistent with more sophisticated cross sectional studies
for Thailand and Indonesia.10
11The definition is also not strictly consistent across variables in Hong Kong either, where exports havehad to be proxied using data from another source (see Appendix A for details).
12In this and the following section, all data are compiled at the plant level. Hence the text refers toplants instead of firms.
11
5. Major Economic Differences Among Foreign Multinationals by Foreign Ownership Share
Another problem that exists with the data in Tables 1 and 2 is that the definition of foreign MNCs is
not consistent across host economies. Foreign MNCs are defined as firms with foreign ownership shares of 50
percent or more in all economies but Taiwan, where foreign MNCs are firms with any degree of foreign
ownership.11 In this respect, data for Hong Kong, Indonesia, and Singapore are helpful because they allow a
clearer disaggregation by foreign ownership share. Accordingly, the first step in Tables 3-5 is to compare local
plants and three groups of foreign MNCs, minority-foreign MNCs (foreign shares of 1-49 percent in Hong
Kong and Singapore or 10-49 percent in Indonesia), majority-foreign MNCs (foreign shares of 50-99 percent in
Hong Kong and Singapore or 50-89 percent in Indonesia), and wholly- or heavily-foreign (foreign shares of 100
percent in Hong Kong and Singapore or 90 percent or more in Indonesia).12 As might be expected, the
differences between the three groups of MNCs and local plants were generally similar to the differences
observed in Table 2. Given the space constraint, more detailed observations in this respect are left for the
reader to make.
Of more concern here is whether there are differences among groups of foreign MNCs themselves
depending on the foreign ownership share. In Hong Kong (Table 3), plant size and average labor productivity
tended to be larger the larger the foreign ownership share. In terms of plant size, these differences were always
statistically significant at the 5 percent level or better. Differences in average labor productivity were
significant if wholly-foreign and minority-foreign plants are compared, but differences between the other two
pairs of foreign plants (majority-foreign and minority-foreign, wholly-foreign and majority-foreign) were not
significant. In contrast, differences in compensation per employee were generally very small in absolute value
and never statistically significant. Shares of labor compensation in value added were smaller in groups with
larger foreign ownership shares, and these differences were generally significant statistically.
In Indonesia (Table 4), differences in plant size contrast markedly with Hong Kong and Singapore.
Specifically, differences were relatively small and insignificant if measured in terms of employment per plant,
13Note that this pattern is consistent with the Heckscher-Ohlin notion that Indonesia, an economy thatis likely to be labor abundant by any measure, should have a comparative advantage in labor-intensiveindustries.
12
while heavily-foreign plants were significantly smaller than the other two groups of foreign plants if measured
in terms of net production per plant. Heavily-foreign plants also had significantly lower average labor
productivity and significantly higher export propensities than the other two groups. This pattern is thought to be
related to the concentration of heavily-foreign plants in industries which are highly export-oriented but are
likely to have low labor productivity and low capital intensity (e.g., apparel, footwear, assembly of non-electric
and electric machinery, see Ramstetter 1998b).13 It is also interesting that differences among groups of foreign
MNCs distinguished by foreign ownership share changed markedly between the early and the late period, with
net production per plant and net production per worker in heavily-foreign plants falling relative to the other two
groups of foreign plants. The fact that there was a large policy shift in 1986, with a marked liberalization of
international trade and subsequent relaxation of foreign ownership regulations, leads one to speculate that these
shifts were policy related, but there is no hard evidence of this correlation. A final observation is that import-
sales ratios were significantly lower in minority-foreign plants than the other two groups and differences in
skilled-labor intensity were generally insignificant.
In Singapore (Table 5), as in Hong Kong, plant size was positively related to foreign ownership shares,
with many of these differences being significant statistically. Export propensities were also larger the larger the
foreign ownership share is and all of these differences were statistically significant. Wholly-foreign plants also
had significantly higher average labor productivity, R&D-sales ratios, and profitability, as well as significantly
lower labor shares of value added compared to the other two groups. Average capital productivity also tended
to be significantly higher in wholly-foreign plants, the comparison with minority-foreign plants in the early
period being the one exception. Differences in capital intensity and compensation per employee were less often
significant. In addition, differences between minority-foreign and majority-foreign plants were often
insignificant statistically, a finding that is similar to Hong Kong and Indonesia.
To summarize, differences between wholly-foreign plants and other groups of foreign plants were
often significant and generally in the same direction as differences between MNCs and local plants. The major
exception here was with respect to plant size and average labor productivity in Indonesia. In contrast,
differences between majority- and minority-foreign MNCs were generally smaller and less often significant. A
14Note also that this results is consistent with the results of more sophisticated micro studies forIndonesia and Thailand (e.g., Ramstetter 1994a, 1998b, 1998c).
13
notable exception is the finding for Singapore and to a lesser extent Indonesia, that export propensities were
largest for wholly- or largely-foreign plants, followed by majority-foreign plants and then minority-foreign
plants.14
6. Major Economic Differences Among Foreign Multinationals by Foreign Source
When comparing foreign MNCs by foreign source, four groups of MNCs are identified, U.S. MNCs,
European MNCs, Japanese MNCs, and Other Asian MNCs. These data are available for Hong Kong and
Singapore, though it should be noted that definitions of Europe and Other Asia differ somewhat in the two host
economies (see notes to Tables 6-7). In Hong Kong (Table 6), differences among these groups of MNCs are
relatively small and seldom statistically significant. There are two major exceptions. Japanese plants and Other
Asian plants were significantly smaller than European or U.S. plants and Other Asian plants had significantly
higher labor shares of value added in the late period than other groups. In the late period, average labor
productivity in Other Asian plants was also significantly lower than in Japanese and European plants and almost
significantly lower (at the 7 percent level) than in U.S. plants as well.
The data for Singapore contrast markedly, revealing several significant differences. First, if measured
in terms of employment per plant, U.S. plants were the largest, followed by Japanese plants, European plants,
and Other Asian plants, with all these differences being statistically significant at the 5 percent level or better.
Differences in terms of production per plant were also consistently significant with U.S. plants again the largest,
but with the Europeans second, followed by the Japanese and Other Asians. The ordering for average labor
productivity was Europe, U.S., Japan, and Other Asia and again differences are usually significant, the
exceptions being the Europe-U.S. comparison in the late period and the Other Asia-Japan comparison in the
early period. The ordering for compensation per employee was the same but differences were less often
significant. Average capital productivity was significantly higher in U.S. plants, but the ordering of the three
other groups of MNCs was not consistent over time and differences were not always significant. European
plants were the most capital intensive and differences between European plants and other plants were
15Unfortunately, such are not yet available for Singapore and corresponding data for Hong Kongcontain a large number of suppressed observations (to avoid revealing data for individual plants) so it is verydifficult to do these calculations with existing data.
14
significant, perhaps reflecting the fact that highly capital-intensive oil refining plants are an important
component of European activity in Singapore. Other Asian plants were the least capital intensive and U.S.
plants were significantly more capital intensive than Japanese plants in the early period, but the differences
between U.S. and Japanese plants disappeared in the late period. U.S. and European plants also tended to be
significantly more R&D intensive than Japanese and Other Asian plants. Labor shares were the highest in
Other Asian plants, followed by plants from Japan, Europe, and the United States, with this order reversed in
for profit rates, and these differences were often significant. Finally, export propensities were highest in
European (early) or U.S. (late) plants, followed by Japanese and Other Asian plants. This is interesting
because, although Japanese plants tended to be relatively small and labor-intensive compared to European and
U.S. plants as conjectured by Kojima (1978, 1990), these data would seem to contradict his other prediction that
these differences would make Japanese MNCs more trade oriented.
Here again, it is important to reemphasize the fact that many of the differences observed above can be
explained by differences in the industrial distributions of different groups of firms. For example, the dominanc
e of the oil refining industry by U.S. and European plants and the large share of oil refining in the activities of
European plants are thought to be particularly important reasons for the high levels of average labor
productivity and capital intensity observed in these groups (see Ramstetter 1996 for more details). Accordingly,
it would be interesting to see if the differences observed above persist if similar calculations are done at a more
disaggregate level.15 In sum, the two cases studied here contrast markedly, with evidence from Hong Kong
suggesting that differences among MNCs distinguished by foreign source are generally insignificant and
evidence from Singapore indicating large and significant differences in this respect.
7. Conclusions
The crude analytical tools employed in this study make any conclusions tentative at best. Nonetheless,
there are few studies that have taken similar care to comprehensively examine trends in the real economic
activities of foreign MNCs in Asia or to carefully compare foreign MNCs and local firms, as well as groups of
15
foreign MNCs, in a time series context. This fact alone makes the results of this study of some interest.
Shares of foreign MNCs in manufacturing sectors of the host economies studied tended to decline
through the mid-1980s and increase thereafter. Foreign MNC shares tended to be lower in the mid-1990s than
in the 1970s in Malaysia and Taiwan. Singapore was the only economy in the sample where all measures of
foreign MNC shares increased in this period. It was also noted that shares of production tended to be more
stable over time than FDI-related measures, and that shares of foreign MNCs tended to be more stable in terms
of employment than in terms of production or exports. There was a wide variation in shares of foreign MNCs
across host economies, with shares being quite large in Singapore and Malaysia but much smaller in Hong
Kong, Indonesia, and Taiwan. Shares of foreign MNCs tended to be largest in terms of exports, smallest in
terms of employment, and intermediate in terms of production, implying relatively high average labor
productivity and export propensities in foreign MNCs compared to local firms.
Direct comparisons of these and other indicators for foreign MNCs and local firms generally
confirmed this last observation. Foreign MNCs tended to be relatively large and to have relatively high average
labor productivity, average capital productivity, capital intensity, skilled-labor intensity, R&D intensity, profit
rates, and trade propensities, but relatively low labor shares of value added. Moreover, these differences were
often highly significant statistically, though there were some notable exceptions (e.g., comparisons of labor
productivity and capital intensity in Malaysia for the late period). In addition, differences in compensation per
employee were relatively small and less often significant, a result that is perhaps surprising given the relatively
large and significant differences in labor productivity and the theoretical prediction of a strong relationship
between productivity and wages.
Comparisons among MNCs classified by foreign ownership share indicated that differences between
wholly- or heavily-foreign plants and other groups of foreign plants were often significant and generally in the
same direction as the differences between MNCs and local plants noted above. The major exception here was
with respect to plant size and average labor productivity in Indonesia. In addition, differences between majorit
y- and minority-foreign MNCs were generally smaller and less often significant, though there was a notable
tendency for export propensities to be largest in wholly- or heavily-foreign plants, followed by majority-foreign
plants and then minority-foreign plants.
Comparisons of groups MNCs classified by foreign source revealed few significant differences in
16
Hong Kong, but there were a number of large and significant differences in Singapore. For example, in
Singapore, European and U.S. firms tended to be larger and characterized by relatively high labor productivity,
capital intensity, profitability, and export propensities, but relatively low shares of labor compensation in value
added compared to Japanese and Other Asian firms.
As noted in numerous places in this study, there are several important drawbacks to the methodology
employed here, some of which could be addressed in future research. One of the most important ways in which
the study could be extended would be to further disaggregate the data and examine trends in specific industries.
This is possible in Indonesia and for some industries in Hong Kong and Taiwan. Moreover, if compilations of
unpublished data could be arranged, underlying data bases could also facilitate similar calculations for Malaysia
and Singapore. A second improvement that can be made is with respect to the Indonesian data, where use of a b
ackcast data set that accounts for some of the coverage problems in the raw data used here would be highly
desirable. Third, it would also be helpful to add host economies to the analysis as possible. A notable
possibility in this respect would be to add data for China in recent years, though many of the necessary series
are still quite short. It may also be possible to assemble relevant time series from private sources of firm-level
information in Thailand which I am presently compiling, but no such data are available from official sources.
Fourth, as emphasized in section 2 above, it would be very desirable to distinguish local MNCs, in addition to
foreign MNCs and local non-MNCs, in the analysis. However, this would be a very costly exercise and would
require access to the firm or plant level data that underlie the industry-level data used in this study, as well as
additional data indicating whether the firms owned affiliates abroad or not.
Finally, even if one could make all four of the improvements mentioned above, it still remains that this
type of analysis is only a one small step toward ascertaining how ownership is related to firm performance. As
explained above, the fundamental problem is that one cannot reliably estimate models facilitating comparisons
of groups of firms, while at the same time controlling for other relevant influences, in short time series such as
those examined this study. As such time series studies of this nature, while of potential interest from a policy
perspective in particular, are in many respects only a weak complement to more rigorous comparisons of foreign
MNCs and local firms in large cross sections or panels.
17
References
Aoki, Masahiko, 1988. Information, Incentives, and Bargaining in the Japanese Economy. Cambridge, UK: Cambridge University Press.
__________, 1990. "Toward an Economic Model of the Japanese Firm," Journal of Economic Literature, Vol28, No. 1 (March), pp. 1-27.
Asian Development Bank, various years a. Key Indicators of Developing Member Countries, Vol 15-16 (Aprilissues, 1984-1985), Vol. 17-21 (July issues, 1986-1990). Manila: Asian Development Bank.
__________, various years b. Key Indicators of Developing Asian and Pacific Countries, Vol. 22-28 (1991-1998 issues). Manila: Asian Development Bank.
Aswicahyono, H.H., Kelly Bird, and Hal Hill, 1995. "What Happens to Industrial Structure When CountriesLiberalize? Indonesia Since the Mid-1980s," Economics Division Working Paper SEA 95/2, Research Schoolof Pacific Studies, Australian National University.
Australian National University, 1997. Commodity trade data classified by International Standard IndustrialClassification (ISIC), computer files provided by the International Economic Data Bank. Canberra: AustralianNational University.
Buckley, Peter J. and Mark Casson, 1991. The Future of the Multinational Enterprise, 2nd Edition. London: Macmillan.
Casson, Mark, 1987. The Firm and the Market: Studies on the Multinational and the Scope of the Firm. Cambridge, MA: MIT Press.
Caves, Richard E., 1996. Multinational Enterprise and Economic Analysis, second edition. Cambridge, UK: Cambridge University Press.
Chao, C.-C. and Eden Yu, 1996. “Are wholly foreign-owned enterprises better than joint ventures?” Journal ofInternational Economics, vol. 40, no. 1/2, pp. 225-237.
Dunning, John H., 1993. Multinational Enterprises and the Global Economy. Workingham, U.K.: Addison-Wesley Publishing Co.
Encarnation, Dennis J., 1993. A Common Evolution? A Comparison of United States and JapaneseTransnational Corporations. Transnational Corporations, Vol. 2, No. 1, pp. 7-31.
Encarnation, Dennis J. and Mark Mason, eds., 1993. Does Ownership Matter? Japanese Multinationals inEurope. London: Oxford University Press.
Hill, Hal, 1988. Foreign Investment and Industrialization in Indonesia. Singapore: Oxford University Press.
Hill, Hal, and Brian Johns, 1985. "The Role of Foreign Investment in Developing East Asian Countries,"Weltwirtschaftliches Archiv, Band 121, Heft 2, pp. 355-381.
Hong Kong, Census and Statistics Department, various years a. Computer printouts with data from 19__Survey of Industrial Production, 1983-1996 issues. Hong Kong: Census and Statistics Department.
__________, various years b. Mimeos with data on direct exports by industrial origin for 1986-1997. HongKong: Census and Statistics Department.
Hong Kong, Industry Department, various years, Report on the Survey of Overseas Investment in Hong Kong'sManufacturing Industry (1983, 1985-1996 issues). Hong Kong: Industry Department.
18
Howenstine, Ned G. and Shannon, Dale P., 1996. "Differences in Foreign-Owned U.S. ManufacturingEstablishments by Country of Owner", Survey of Current Business, vol. 76, no. 3 (March), pp. 43-60.
Indonesia, Biro Pusat Statistik, various years. Diskettes containing factory-level data from Statistik Industri,raw data for 1975-1995, data for 1975-1994 obtained from the Ministry of Industry and Trade, for 1995 fromBiro Pusat Statistik. Jakarta: Biro Pusat Statistik.
Khanthachai, Nathabhol, Kanchana Tanmavad, Tawatchai Boonsiri, Chantana Nisaisook, and AnuchaArttanuchit, 1987. Technology and Skills in Thailand. Singapore: Institute of Southeast Asian Studies.
Kojima, Kiyoshi, 1978. Direct Foreign Investment: A Japanese Model of Multinational Business Operations. London: Croom Helm; New York: Praeger; Tokyo: Tuttle.
__________, 1990. Japanese Direct Investment Abroad. Mitaka, Tokyo: International Christian University,Social Science Research Institute, Monograph Series 1.
Kumar, Nagesh, 1995. "Changing Character of Foreign Direct Investment from Developing Economies: CaseStudies from Asia," UNU/INTECH Working Paper 9516, Maastricht: The United Nations University, Instituteof New Technologies.
Lall, Sanjaya, et al., 1983. The New Multinationals: The Spread of Third World Enterprises. Chicester, UK:John Wiley.
Low, Linda, Eric D. Ramstetter, and Henry Wai-Chung Yeung, 1998. "Accounting for Outward DirectInvestment from Hong Kong and Singapore: Who Owns What?", in Robert E. Baldwin, Robert E., Robert E.Lipsey, and J. David Richardson, eds., 1998. Geography and Ownership as Bases for Economic Accounting,Chicago: University of Chicago Press, pp. 139-168 (this also appeared in 1996 as NBER Working Paper5858).
Malaysia, Department of Statistics, no date a. Survey of Manufacturing Industries West Malaysia, 1970 issue.Kuala Lumpur: Department of Statistics.
__________, no date b. Census of Manufacturing Industries Peninsular Malaysia, 1973 issue. Kuala Lumpur: Department of Statistics.
__________, 1996. Annual Statistics of Manufacturing Industries, Part A, 1993 issue. Kuala Lumpur: Department of Statistics.
__________, various years a. Survey of Manufacturing Industries Peninsular Malaysia, 1971, 1972, and 1974issues.
__________, various years b. Industrial Surveys Peninsular Malaysia, 1975-1979 issues. Kuala Lumpur: Department of Statistics.
__________, various years c. Industrial Surveys Malaysia, 1981-1991 issues. Kuala Lumpur: Department ofStatistics (published two years after date of issue).
__________, various years d. Annual Survey of Manufacturing Industries, 1992, 1994, and 1996 issues. KualaLumpur: Department of Statistics (published two years after date of issue; note that the 1996 issue includes1995 data and that there is no 1995 issue).
__________, Department of Statistics, various years e. Report on the Survey of Limited Companies, 1972-1995issues. Kuala Lumpur: Department of Statistics.
Markusen, James R., 1991. "The Theory of the Multinational Enterprise: A Common Analytical Framework,"in Eric D. Ramstetter, ed., Direct Foreign Investment in Asia's Developing Economies and Structural Change
19
in the Asia-Pacific Region, Boulder, Co: Westview Press, pp. 11-32.Ramstetter, Eric D., 1991. "The Macroeconomic Effects of Direct Foreign Investment in SingaporeanManufacturing: A Macroeconometric Study," in Mitsuru Toida, ed., ASEAN, Ajia NIEs no Keizai Yosoku to Bunseki (III)--Heisei Ninendo ELSA Hokokusho-- [Economic Forecasts and Analyses for ASEAN and the AsiaNIEs (III)--1990 ELSA Annual Report--], Tokyo: Institute of Developing Economies, pp. 49-138.
__________, 1994a. "Comparisons of Japanese Multinationals and Other Firms in Thailand's NonoilManufacturing Industries," ASEAN Economic Bulletin, vol 11, no. 1, pp. 36-58.
__________, 1994b. "Characteristics of Foreign Multinationals in Selected Asian Economies" paper presentedat the Fourth Convention of the East Asian Economic Association (Taipei, 26-27August) .
__________, 1995. "Characteristics of Multinational Firms in Malaysia: A Time Series Perspective" inMitsuru Toida and Daisuke Hiratsuka, eds., Ajia Kogyoken no Keizai Bunseki to Yosoku (IV) [Projections forAsian Industrializing Region (IV)], Tokyo: Institute of Developing Economies, pp. 95-171.
__________, 1996. "Characteristics of Singapore's Manufacturing Establishments by Nationality ofOwnership", in Mitsuru Toida and Daisuke Hiratsuka, eds., Ajia Kogyoken no Keizai Bunseki to Yosoku (V)[Projections for Asian Industrializing Region (V)], Tokyo: Institute of Developing Economies, pp. 179-225).
__________, 1998a. "Measuring the Size of Foreign Multinationals in the Asia-Pacific", in GrahameThompson, ed., Economic Dynamism in the Asia-Pacific, London: Routledge, pp. 185-212.
__________, 1998b. "Trade Propensities and Foreign Ownership Shares in Indonesian Manufacturing in theEarly 1990s,” Working Paper Series Vol. 98-7, Kitakyushu, Japan: International Centre for the Study of EastAsian Development (revised version forthcoming in the Bulletin of Indonesian Economic Studies).
__________, 1998c. "Export Propensities and Foreign Ownership Shares in Southeast Asian Manufacturing",in F. Gerard Adams and Shinichi Ichimura, eds., East Asian Development: Will the East Asian MiracleSurvive? Westport, CN: Praeger, pp. 171-192.
Republic of China, Directorate-General of Budget, Accounting and Statistics, 1978. The Report of 1976Industrial and Commercial Census of Taiwan-Fukien District of the Republic of China, Volume 1, GeneralReport. Taipei: Directorate-General of Budget, Accounting and Statistics.
__________, 1983. The Report on 1981 Industrial and Commercial Census of Taiwan-Fukien District of theRepublic of China, Volume 1, General Report. Taipei: Directorate-General of Budget, Accounting andStatistics.
__________, 1997. National Income Statistics on diskette. Taipei: Directorate-General of Budget, Accounting& Statistics.
__________, various years a. National Income of the Republic of China, 1974-1981 issues. Taipei: Directorate-General of Budget, Accounting & Statistics.
__________, various years b. Statistical Yearbook, Republic of China, 1988-1997 issues. Taipei: Directorate-General of Budget and Statistics.
__________, various years c. Yearbook of Earnings and Productivity Statistics, Taiwan Area, Republic ofChina, 1989-1996 issues. Taipei: Directorate-General of Budget and Statistics.
Republic of China, Executive Yuan, various years. Indicators of Science and Technology Republic of China,1991 and 1996 issues. Taipei: Executive Yuan.
Republic of China, Investment Commission, various years. A Survey of Overseas Chinese and Foreign Firmsand Their Effects on National Economic Development, 1974-1995 issues. Taipei: Investment Commission (in
20
Chinese).
Rugman, Alan M., 1980. Internalization as a General Theory of Foreign Direct Investment: A Re-Appraisal ofthe Literature," Weltwirtschaftliches Archiv, Band 116, Heft 2, pp. 365-379.
Rugman, Alan M., 1985. "Internalization is Still a General Theory of Foreign Direct Investment,"Weltwirtschaftliches Archiv, Band 121, Heft 3, pp. 570-575.
Sachs, Lothar, 1984. Applied Statistics: A Handbook of Techniques, Second Edition. New York: Springer-Verlag (translated by Zenon Reynarowych).
Singapore, Department of Statistics, various years. Report on the Census of Industrial Production, 1975-1986issues. Singapore: Singapore National Printers Ltd.
Singapore, Economic Development Board, various years a. Report on the Census of Industrial Production,1987-1996 issues. Singapore: Singapore National Printers Ltd.
__________, various years b. Mimeos with unpublished compilations of data from the Report on the Census ofIndustrial Production, 1980-1994 issues, December 1993, April 1994, December 1994, September 1996 andDecember 1996.
Sjöholm, Frederik, 1998. "Joint Ventures, Technology Transfer and Spillovers: Evidence from IndonesianEstablishment Data", International Symposium on Foreign Direct Investment in East Asia, Economic ResearchInstitute, Economic Planning Agency, Tokyo, 26-27 March.
Tambunlertchai, Somsak and Eric D. Ramstetter, 1991. "Foreign Firms in Promoted Industries and StructuralChange in Thailand," in Eric D. Ramstetter, ed., Direct Foreign Investment in Asia's Developing Economiesand Structural Change in the Asia-Pacific Region, Boulder, CO: Westview Press, pp. 65-102.
United Nations, various years. World Investment Report, 1995, 1996, 1997 issues. New York: United Nations.
United Nations-ESCAP/UNCTC, 1988. Transnational Corporations from Developing Asian Economies. Bangkok: United Nations-ESCAP/UNCTC (Joint Unit on Transnational Corporations, Economic and SocialCommission for Asia and the Pacific.
World Bank, 1999. World Development Indicators, 1999 CD-ROM. Washington, D.C.: World Bank.
Zeile, William J., 1998. "The Domestic Orientation of Production and Sales by U.S. Manufacturing Affiliatesof Foreign Companies", Survey of Current Business, vol. 78, no. 4 (April), pp. 29-50
21
Appendix A: The Data and Their Sources
This appendix summarizes the sources of the data used and the methodology used for estimating the
indicators analyzed in Tables 1-7. Appendix Table A1 summarizes the sources and major characteristics of the
data while this write up emphasizes major concerns with the data and summarizes additional details that could
not easily fit in the table.
For Hong Kong, data from industrial surveys were the primary source. These surveys are thought to be
rather consistent over time and relatively comprehensive in coverage. Surveys of foreign firms in
manufacturing were the source of exports-sales ratios for foreign firms (minority-owned firms included) in
manufacturing and exports were proxied as the product of this ratio and total sales of majority-foreign firms
from the industrial surveys. Thus, this estimate includes errors caused by differences in coverage and
classification between the industrial surveys and the foreign firm surveys. Total manufacturing exports for
1986-1996 come from an industrial classification of domestic exports (i.e., entrepôt exports are excluded)
supplied by the Hong Kong, Census and Statistics Department (various years b). Figures for 1983-1985
estimated as 99.4 percent of total domestic exports (the average ratio of manufacturing exports to total domestic
exports for 1986-1991). For 1983-1990, these estimates are very close to estimates from Australian National
University (1997). In Hong Kong there is no series on real GDP by industrial origin and hence all real variables
are estimated by dividing the relevant nominal variable by the GDP deflator.
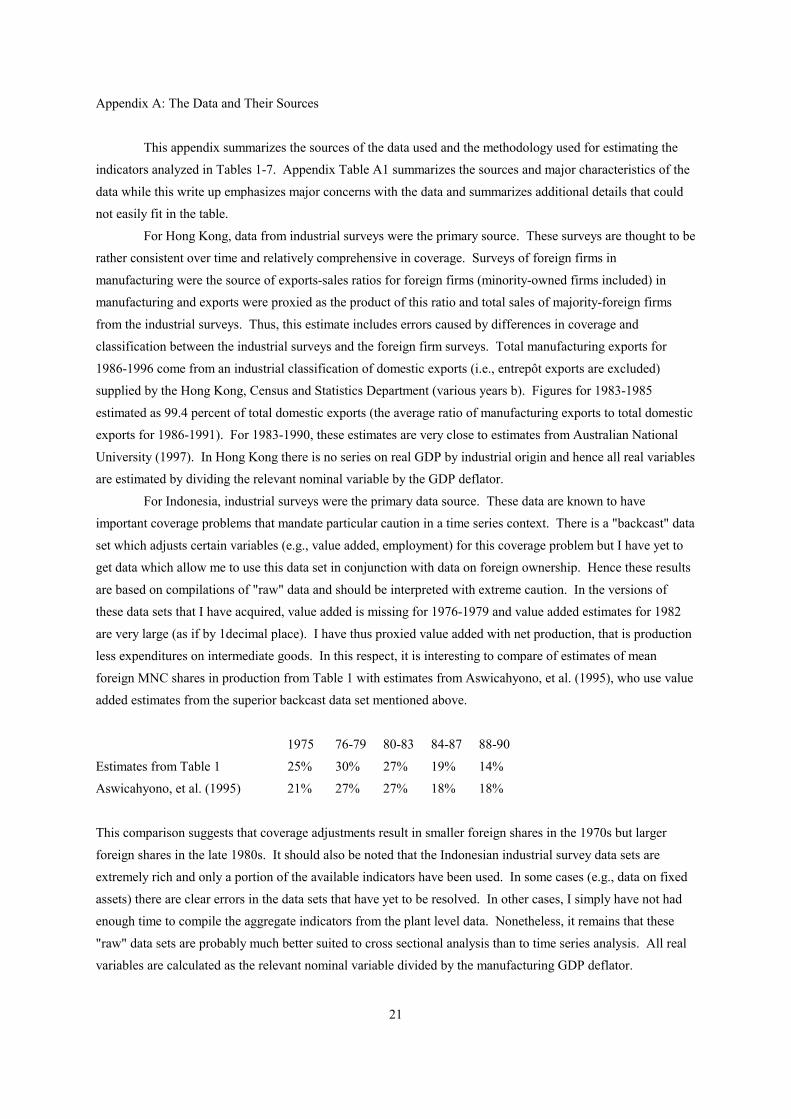
For Indonesia, industrial surveys were the primary data source. These data are known to have
important coverage problems that mandate particular caution in a time series context. There is a "backcast" data
set which adjusts certain variables (e.g., value added, employment) for this coverage problem but I have yet to
get data which allow me to use this data set in conjunction with data on foreign ownership. Hence these results
are based on compilations of "raw" data and should be interpreted with extreme caution. In the versions of
these data sets that I have acquired, value added is missing for 1976-1979 and value added estimates for 1982
are very large (as if by 1decimal place). I have thus proxied value added with net production, that is production
less expenditures on intermediate goods. In this respect, it is interesting to compare of estimates of mean
foreign MNC shares in production from Table 1 with estimates from Aswicahyono, et al. (1995), who use value
added estimates from the superior backcast data set mentioned above.
1975 76-79 80-83 84-87 88-90
Estimates from Table 1 25% 30% 27% 19% 14%
Aswicahyono, et al. (1995) 21% 27% 27% 18% 18%
This comparison suggests that coverage adjustments result in smaller foreign shares in the 1970s but larger
foreign shares in the late 1980s. It should also be noted that the Indonesian industrial survey data sets are
extremely rich and only a portion of the available indicators have been used. In some cases (e.g., data on fixed
assets) there are clear errors in the data sets that have yet to be resolved. In other cases, I simply have not had
enough time to compile the aggregate indicators from the plant level data. Nonetheless, it remains that these
"raw" data sets are probably much better suited to cross sectional analysis than to time series analysis. All real
variables are calculated as the relevant nominal variable divided by the manufacturing GDP deflator.
22
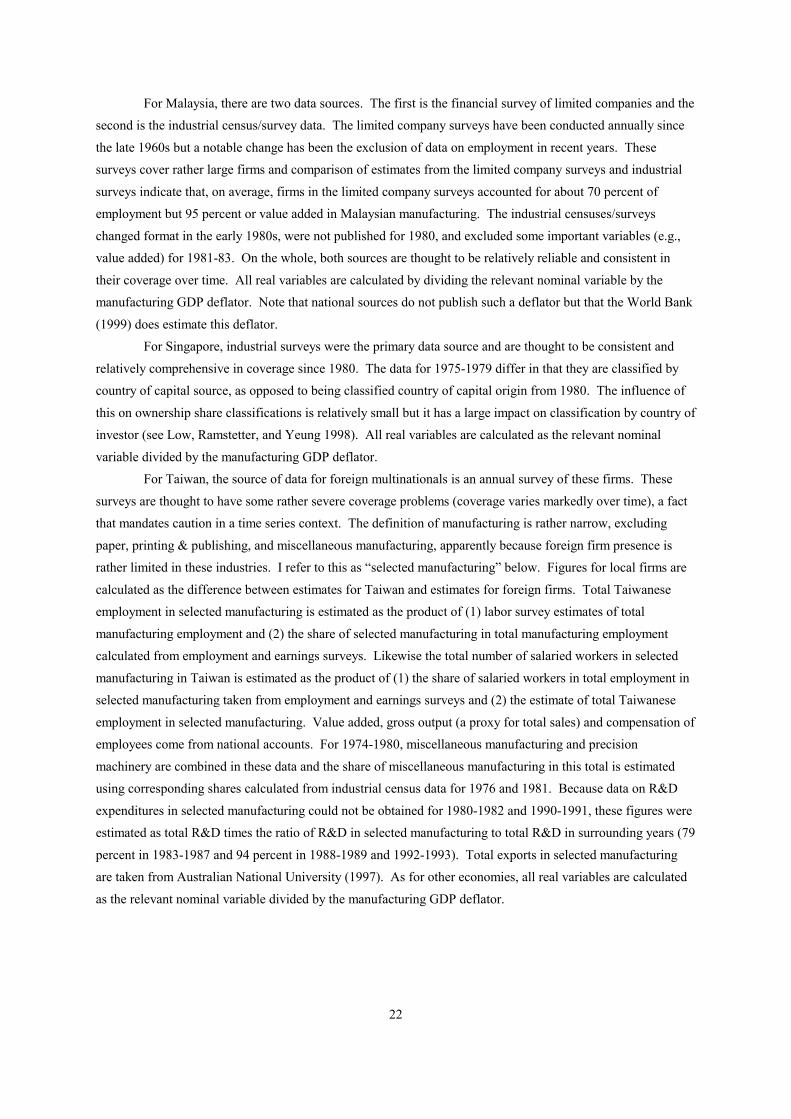
For Malaysia, there are two data sources. The first is the financial survey of limited companies and the
second is the industrial census/survey data. The limited company surveys have been conducted annually since
the late 1960s but a notable change has been the exclusion of data on employment in recent years. These
surveys cover rather large firms and comparison of estimates from the limited company surveys and industrial
surveys indicate that, on average, firms in the limited company surveys accounted for about 70 percent of
employment but 95 percent or value added in Malaysian manufacturing. The industrial censuses/surveys
changed format in the early 1980s, were not published for 1980, and excluded some important variables (e.g.,
value added) for 1981-83. On the whole, both sources are thought to be relatively reliable and consistent in
their coverage over time. All real variables are calculated by dividing the relevant nominal variable by the
manufacturing GDP deflator. Note that national sources do not publish such a deflator but that the World Bank
(1999) does estimate this deflator.
For Singapore, industrial surveys were the primary data source and are thought to be consistent and
relatively comprehensive in coverage since 1980. The data for 1975-1979 differ in that they are classified by
country of capital source, as opposed to being classified country of capital origin from 1980. The influence of
this on ownership share classifications is relatively small but it has a large impact on classification by country of
investor (see Low, Ramstetter, and Yeung 1998). All real variables are calculated as the relevant nominal
variable divided by the manufacturing GDP deflator.
For Taiwan, the source of data for foreign multinationals is an annual survey of these firms. These
surveys are thought to have some rather severe coverage problems (coverage varies markedly over time), a fact
that mandates caution in a time series context. The definition of manufacturing is rather narrow, excluding
paper, printing & publishing, and miscellaneous manufacturing, apparently because foreign firm presence is
rather limited in these industries. I refer to this as “selected manufacturing” below. Figures for local firms are
calculated as the difference between estimates for Taiwan and estimates for foreign firms. Total Taiwanese
employment in selected manufacturing is estimated as the product of (1) labor survey estimates of total
manufacturing employment and (2) the share of selected manufacturing in total manufacturing employment
calculated from employment and earnings surveys. Likewise the total number of salaried workers in selected
manufacturing in Taiwan is estimated as the product of (1) the share of salaried workers in total employment in
selected manufacturing taken from employment and earnings surveys and (2) the estimate of total Taiwanese
employment in selected manufacturing. Value added, gross output (a proxy for total sales) and compensation of
employees come from national accounts. For 1974-1980, miscellaneous manufacturing and precision
machinery are combined in these data and the share of miscellaneous manufacturing in this total is estimated
using corresponding shares calculated from industrial census data for 1976 and 1981. Because data on R&D
expenditures in selected manufacturing could not be obtained for 1980-1982 and 1990-1991, these figures were
estimated as total R&D times the ratio of R&D in selected manufacturing to total R&D in surrounding years (79
percent in 1983-1987 and 94 percent in 1988-1989 and 1992-1993). Total exports in selected manufacturing
are taken from Australian National University (1997). As for other economies, all real variables are calculated
as the relevant nominal variable divided by the manufacturing GDP deflator.
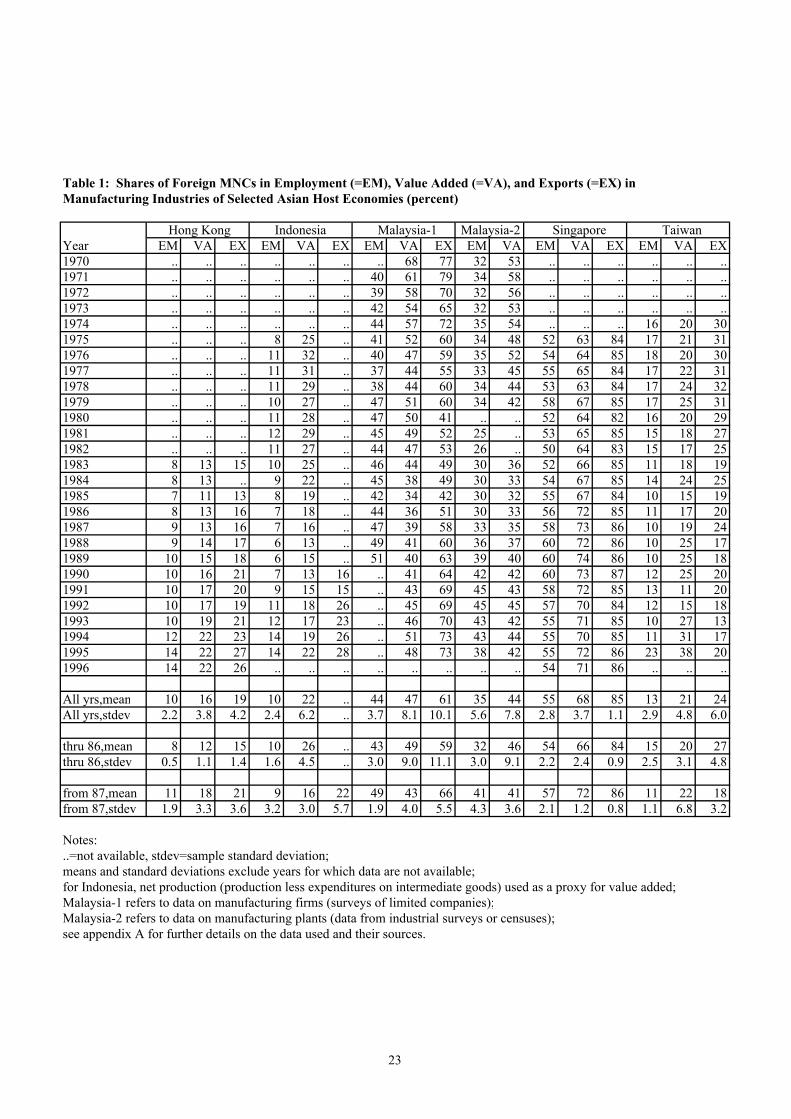
Table 1: Shares of Foreign MNCs in Employment (=EM), Value Added (=VA), and Exports (=EX) in Manufacturing Industries of Selected Asian Host Economies (percent)
Hong Kong Indonesia Malaysia-1 Malaysia-2 Singapore Taiwan Year EM VA EX EM VA EX EM VA EX EM VA EM VA EX EM VA EX1970 .. .. .. .. .. .. .. 68 77 32 53 .. .. .. .. .. ..1971 .. .. .. .. .. .. 40 61 79 34 58 .. .. .. .. .. ..1972 .. .. .. .. .. .. 39 58 70 32 56 .. .. .. .. .. ..1973 .. .. .. .. .. .. 42 54 65 32 53 .. .. .. .. .. ..1974 .. .. .. .. .. .. 44 57 72 35 54 .. .. .. 16 20 301975 .. .. .. 8 25 .. 41 52 60 34 48 52 63 84 17 21 311976 .. .. .. 11 32 .. 40 47 59 35 52 54 64 85 18 20 301977 .. .. .. 11 31 .. 37 44 55 33 45 55 65 84 17 22 311978 .. .. .. 11 29 .. 38 44 60 34 44 53 63 84 17 24 321979 .. .. .. 10 27 .. 47 51 60 34 42 58 67 85 17 25 311980 .. .. .. 11 28 .. 47 50 41 .. .. 52 64 82 16 20 291981 .. .. .. 12 29 .. 45 49 52 25 .. 53 65 85 15 18 271982 .. .. .. 11 27 .. 44 47 53 26 .. 50 64 83 15 17 251983 8 13 15 10 25 .. 46 44 49 30 36 52 66 85 11 18 191984 8 13 .. 9 22 .. 45 38 49 30 33 54 67 85 14 24 251985 7 11 13 8 19 .. 42 34 42 30 32 55 67 84 10 15 191986 8 13 16 7 18 .. 44 36 51 30 33 56 72 85 11 17 201987 9 13 16 7 16 .. 47 39 58 33 35 58 73 86 10 19 241988 9 14 17 6 13 .. 49 41 60 36 37 60 72 86 10 25 171989 10 15 18 6 15 .. 51 40 63 39 40 60 74 86 10 25 181990 10 16 21 7 13 16 .. 41 64 42 42 60 73 87 12 25 201991 10 17 20 9 15 15 .. 43 69 45 43 58 72 85 13 11 201992 10 17 19 11 18 26 .. 45 69 45 45 57 70 84 12 15 181993 10 19 21 12 17 23 .. 46 70 43 42 55 71 85 10 27 131994 12 22 23 14 19 26 .. 51 73 43 44 55 70 85 11 31 171995 14 22 27 14 22 28 .. 48 73 38 42 55 72 86 23 38 201996 14 22 26 .. .. .. .. .. .. .. .. 54 71 86 .. .. ..
All yrs,mean 10 16 19 10 22 .. 44 47 61 35 44 55 68 85 13 21 24All yrs,stdev 2.2 3.8 4.2 2.4 6.2 .. 3.7 8.1 10.1 5.6 7.8 2.8 3.7 1.1 2.9 4.8 6.0
thru 86,mean 8 12 15 10 26 .. 43 49 59 32 46 54 66 84 15 20 27thru 86,stdev 0.5 1.1 1.4 1.6 4.5 .. 3.0 9.0 11.1 3.0 9.1 2.2 2.4 0.9 2.5 3.1 4.8
from 87,mean 11 18 21 9 16 22 49 43 66 41 41 57 72 86 11 22 18from 87,stdev 1.9 3.3 3.6 3.2 3.0 5.7 1.9 4.0 5.5 4.3 3.6 2.1 1.2 0.8 1.1 6.8 3.2
Notes:..=not available, stdev=sample standard deviation;means and standard deviations exclude years for which data are not available; for Indonesia, net production (production less expenditures on intermediate goods) used as a proxy for value added; Malaysia-1 refers to data on manufacturing firms (surveys of limited companies);Malaysia-2 refers to data on manufacturing plants (data from industrial surveys or censuses);see appendix A for further details on the data used and their sources.
23
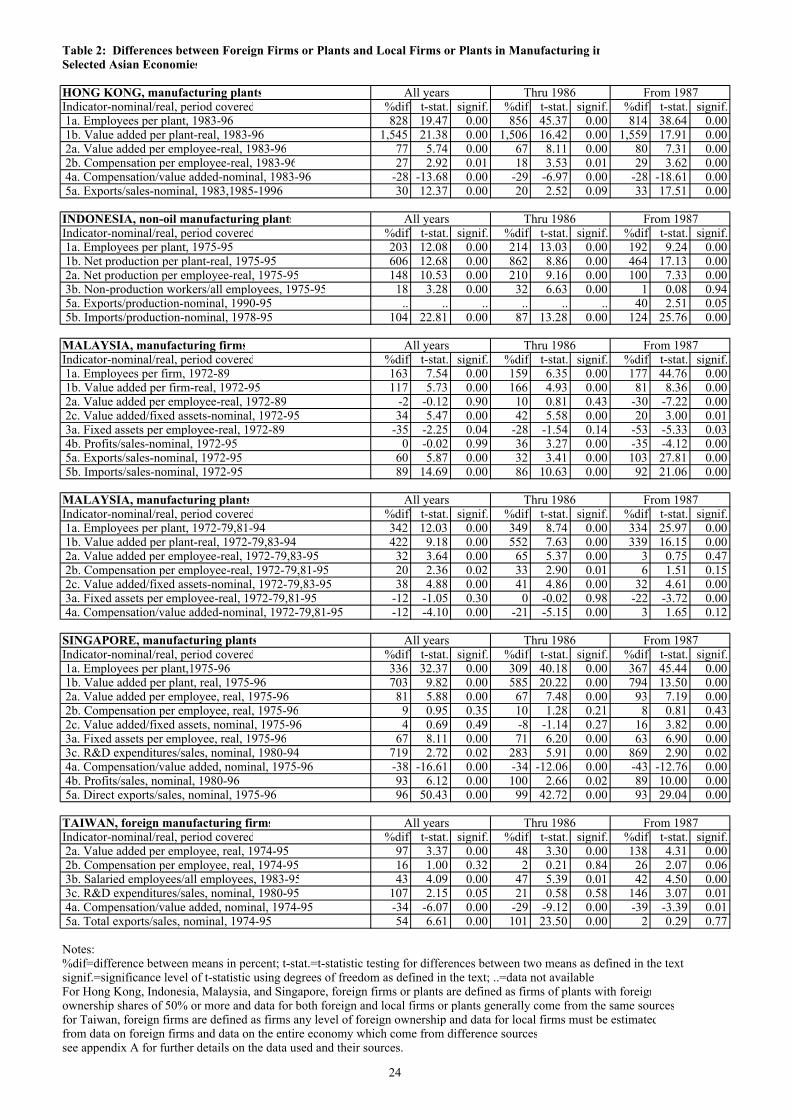
Table 2: Differences between Foreign Firms or Plants and Local Firms or Plants in Manufacturing inSelected Asian Economies
HONG KONG, manufacturing plants All years Thru 1986 From 1987Indicator-nominal/real, period covered %dif t-stat. signif. %dif t-stat. signif. %dif t-stat. signif. 1a. Employees per plant, 1983-96 828 19.47 0.00 856 45.37 0.00 814 38.64 0.00 1b. Value added per plant-real, 1983-96 1,545 21.38 0.00 1,506 16.42 0.00 1,559 17.91 0.00 2a. Value added per employee-real, 1983-96 77 5.74 0.00 67 8.11 0.00 80 7.31 0.00 2b. Compensation per employee-real, 1983-96 27 2.92 0.01 18 3.53 0.01 29 3.62 0.00 4a. Compensation/value added-nominal, 1983-96 -28 -13.68 0.00 -29 -6.97 0.00 -28 -18.61 0.00 5a. Exports/sales-nominal, 1983,1985-1996 30 12.37 0.00 20 2.52 0.09 33 17.51 0.00
INDONESIA, non-oil manufacturing plants All years Thru 1986 From 1987Indicator-nominal/real, period covered %dif t-stat. signif. %dif t-stat. signif. %dif t-stat. signif. 1a. Employees per plant, 1975-95 203 12.08 0.00 214 13.03 0.00 192 9.24 0.00 1b. Net production per plant-real, 1975-95 606 12.68 0.00 862 8.86 0.00 464 17.13 0.00 2a. Net production per employee-real, 1975-95 148 10.53 0.00 210 9.16 0.00 100 7.33 0.00 3b. Non-production workers/all employees, 1975-95 18 3.28 0.00 32 6.63 0.00 1 0.08 0.94 5a. Exports/production-nominal, 1990-95 .. .. .. .. .. .. 40 2.51 0.05 5b. Imports/production-nominal, 1978-95 104 22.81 0.00 87 13.28 0.00 124 25.76 0.00
MALAYSIA, manufacturing firms All years Thru 1986 From 1987Indicator-nominal/real, period covered %dif t-stat. signif. %dif t-stat. signif. %dif t-stat. signif. 1a. Employees per firm, 1972-89 163 7.54 0.00 159 6.35 0.00 177 44.76 0.00 1b. Value added per firm-real, 1972-95 117 5.73 0.00 166 4.93 0.00 81 8.36 0.00 2a. Value added per employee-real, 1972-89 -2 -0.12 0.90 10 0.81 0.43 -30 -7.22 0.00 2c. Value added/fixed assets-nominal, 1972-95 34 5.47 0.00 42 5.58 0.00 20 3.00 0.01 3a. Fixed assets per employee-real, 1972-89 -35 -2.25 0.04 -28 -1.54 0.14 -53 -5.33 0.03 4b. Profits/sales-nominal, 1972-95 0 -0.02 0.99 36 3.27 0.00 -35 -4.12 0.00 5a. Exports/sales-nominal, 1972-95 60 5.87 0.00 32 3.41 0.00 103 27.81 0.00 5b. Imports/sales-nominal, 1972-95 89 14.69 0.00 86 10.63 0.00 92 21.06 0.00
MALAYSIA, manufacturing plants All years Thru 1986 From 1987Indicator-nominal/real, period covered %dif t-stat. signif. %dif t-stat. signif. %dif t-stat. signif. 1a. Employees per plant, 1972-79,81-94 342 12.03 0.00 349 8.74 0.00 334 25.97 0.00 1b. Value added per plant-real, 1972-79,83-94 422 9.18 0.00 552 7.63 0.00 339 16.15 0.00 2a. Value added per employee-real, 1972-79,83-95 32 3.64 0.00 65 5.37 0.00 3 0.75 0.47 2b. Compensation per employee-real, 1972-79,81-95 20 2.36 0.02 33 2.90 0.01 6 1.51 0.15 2c. Value added/fixed assets-nominal, 1972-79,83-95 38 4.88 0.00 41 4.86 0.00 32 4.61 0.00 3a. Fixed assets per employee-real, 1972-79,81-95 -12 -1.05 0.30 0 -0.02 0.98 -22 -3.72 0.00 4a. Compensation/value added-nominal, 1972-79,81-95 -12 -4.10 0.00 -21 -5.15 0.00 3 1.65 0.12
SINGAPORE, manufacturing plants All years Thru 1986 From 1987Indicator-nominal/real, period covered %dif t-stat. signif. %dif t-stat. signif. %dif t-stat. signif. 1a. Employees per plant,1975-96 336 32.37 0.00 309 40.18 0.00 367 45.44 0.00 1b. Value added per plant, real, 1975-96 703 9.82 0.00 585 20.22 0.00 794 13.50 0.00 2a. Value added per employee, real, 1975-96 81 5.88 0.00 67 7.48 0.00 93 7.19 0.00 2b. Compensation per employee, real, 1975-96 9 0.95 0.35 10 1.28 0.21 8 0.81 0.43 2c. Value added/fixed assets, nominal, 1975-96 4 0.69 0.49 -8 -1.14 0.27 16 3.82 0.00 3a. Fixed assets per employee, real, 1975-96 67 8.11 0.00 71 6.20 0.00 63 6.90 0.00 3c. R&D expenditures/sales, nominal, 1980-94 719 2.72 0.02 283 5.91 0.00 869 2.90 0.02 4a. Compensation/value added, nominal, 1975-96 -38 -16.61 0.00 -34 -12.06 0.00 -43 -12.76 0.00 4b. Profits/sales, nominal, 1980-96 93 6.12 0.00 100 2.66 0.02 89 10.00 0.00 5a. Direct exports/sales, nominal, 1975-96 96 50.43 0.00 99 42.72 0.00 93 29.04 0.00
TAIWAN, foreign manufacturing firms All years Thru 1986 From 1987Indicator-nominal/real, period covered %dif t-stat. signif. %dif t-stat. signif. %dif t-stat. signif. 2a. Value added per employee, real, 1974-95 97 3.37 0.00 48 3.30 0.00 138 4.31 0.00 2b. Compensation per employee, real, 1974-95 16 1.00 0.32 2 0.21 0.84 26 2.07 0.06 3b. Salaried employees/all employees, 1983-95 43 4.09 0.00 47 5.39 0.01 42 4.50 0.00 3c. R&D expenditures/sales, nominal, 1980-95 107 2.15 0.05 21 0.58 0.58 146 3.07 0.01 4a. Compensation/value added, nominal, 1974-95 -34 -6.07 0.00 -29 -9.12 0.00 -39 -3.39 0.01 5a. Total exports/sales, nominal, 1974-95 54 6.61 0.00 101 23.50 0.00 2 0.29 0.77
Notes: %dif=difference between means in percent; t-stat.=t-statistic testing for differences between two means as defined in the textsignif.=significance level of t-statistic using degrees of freedom as defined in the text; ..=data not availableFor Hong Kong, Indonesia, Malaysia, and Singapore, foreign firms or plants are defined as firms of plants with foreignownership shares of 50% or more and data for both foreign and local firms or plants generally come from the same sourcesfor Taiwan, foreign firms are defined as firms any level of foreign ownership and data for local firms must be estimatedfrom data on foreign firms and data on the entire economy which come from difference sourcessee appendix A for further details on the data used and their sources.
24
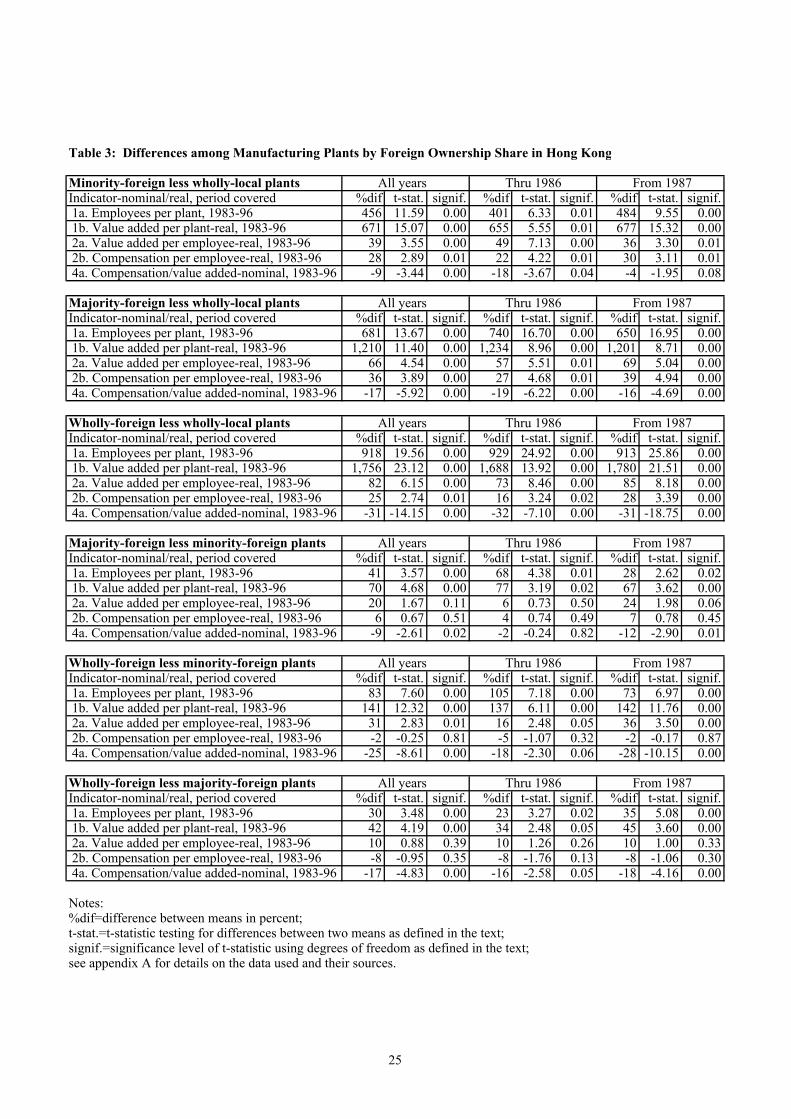
Table 3: Differences among Manufacturing Plants by Foreign Ownership Share in Hong Kong
Minority-foreign less wholly-local plants All years Thru 1986 From 1987Indicator-nominal/real, period covered %dif t-stat. signif. %dif t-stat. signif. %dif t-stat. signif. 1a. Employees per plant, 1983-96 456 11.59 0.00 401 6.33 0.01 484 9.55 0.00 1b. Value added per plant-real, 1983-96 671 15.07 0.00 655 5.55 0.01 677 15.32 0.00 2a. Value added per employee-real, 1983-96 39 3.55 0.00 49 7.13 0.00 36 3.30 0.01 2b. Compensation per employee-real, 1983-96 28 2.89 0.01 22 4.22 0.01 30 3.11 0.01 4a. Compensation/value added-nominal, 1983-96 -9 -3.44 0.00 -18 -3.67 0.04 -4 -1.95 0.08
Majority-foreign less wholly-local plants All years Thru 1986 From 1987Indicator-nominal/real, period covered %dif t-stat. signif. %dif t-stat. signif. %dif t-stat. signif. 1a. Employees per plant, 1983-96 681 13.67 0.00 740 16.70 0.00 650 16.95 0.00 1b. Value added per plant-real, 1983-96 1,210 11.40 0.00 1,234 8.96 0.00 1,201 8.71 0.00 2a. Value added per employee-real, 1983-96 66 4.54 0.00 57 5.51 0.01 69 5.04 0.00 2b. Compensation per employee-real, 1983-96 36 3.89 0.00 27 4.68 0.01 39 4.94 0.00 4a. Compensation/value added-nominal, 1983-96 -17 -5.92 0.00 -19 -6.22 0.00 -16 -4.69 0.00
Wholly-foreign less wholly-local plants All years Thru 1986 From 1987Indicator-nominal/real, period covered %dif t-stat. signif. %dif t-stat. signif. %dif t-stat. signif. 1a. Employees per plant, 1983-96 918 19.56 0.00 929 24.92 0.00 913 25.86 0.00 1b. Value added per plant-real, 1983-96 1,756 23.12 0.00 1,688 13.92 0.00 1,780 21.51 0.00 2a. Value added per employee-real, 1983-96 82 6.15 0.00 73 8.46 0.00 85 8.18 0.00 2b. Compensation per employee-real, 1983-96 25 2.74 0.01 16 3.24 0.02 28 3.39 0.00 4a. Compensation/value added-nominal, 1983-96 -31 -14.15 0.00 -32 -7.10 0.00 -31 -18.75 0.00
Majority-foreign less minority-foreign plants All years Thru 1986 From 1987Indicator-nominal/real, period covered %dif t-stat. signif. %dif t-stat. signif. %dif t-stat. signif. 1a. Employees per plant, 1983-96 41 3.57 0.00 68 4.38 0.01 28 2.62 0.02 1b. Value added per plant-real, 1983-96 70 4.68 0.00 77 3.19 0.02 67 3.62 0.00 2a. Value added per employee-real, 1983-96 20 1.67 0.11 6 0.73 0.50 24 1.98 0.06 2b. Compensation per employee-real, 1983-96 6 0.67 0.51 4 0.74 0.49 7 0.78 0.45 4a. Compensation/value added-nominal, 1983-96 -9 -2.61 0.02 -2 -0.24 0.82 -12 -2.90 0.01
Wholly-foreign less minority-foreign plants All years Thru 1986 From 1987Indicator-nominal/real, period covered %dif t-stat. signif. %dif t-stat. signif. %dif t-stat. signif. 1a. Employees per plant, 1983-96 83 7.60 0.00 105 7.18 0.00 73 6.97 0.00 1b. Value added per plant-real, 1983-96 141 12.32 0.00 137 6.11 0.00 142 11.76 0.00 2a. Value added per employee-real, 1983-96 31 2.83 0.01 16 2.48 0.05 36 3.50 0.00 2b. Compensation per employee-real, 1983-96 -2 -0.25 0.81 -5 -1.07 0.32 -2 -0.17 0.87 4a. Compensation/value added-nominal, 1983-96 -25 -8.61 0.00 -18 -2.30 0.06 -28 -10.15 0.00
Wholly-foreign less majority-foreign plants All years Thru 1986 From 1987Indicator-nominal/real, period covered %dif t-stat. signif. %dif t-stat. signif. %dif t-stat. signif. 1a. Employees per plant, 1983-96 30 3.48 0.00 23 3.27 0.02 35 5.08 0.00 1b. Value added per plant-real, 1983-96 42 4.19 0.00 34 2.48 0.05 45 3.60 0.00 2a. Value added per employee-real, 1983-96 10 0.88 0.39 10 1.26 0.26 10 1.00 0.33 2b. Compensation per employee-real, 1983-96 -8 -0.95 0.35 -8 -1.76 0.13 -8 -1.06 0.30 4a. Compensation/value added-nominal, 1983-96 -17 -4.83 0.00 -16 -2.58 0.05 -18 -4.16 0.00
Notes:%dif=difference between means in percent; t-stat.=t-statistic testing for differences between two means as defined in the text; signif.=significance level of t-statistic using degrees of freedom as defined in the text; see appendix A for details on the data used and their sources.
25
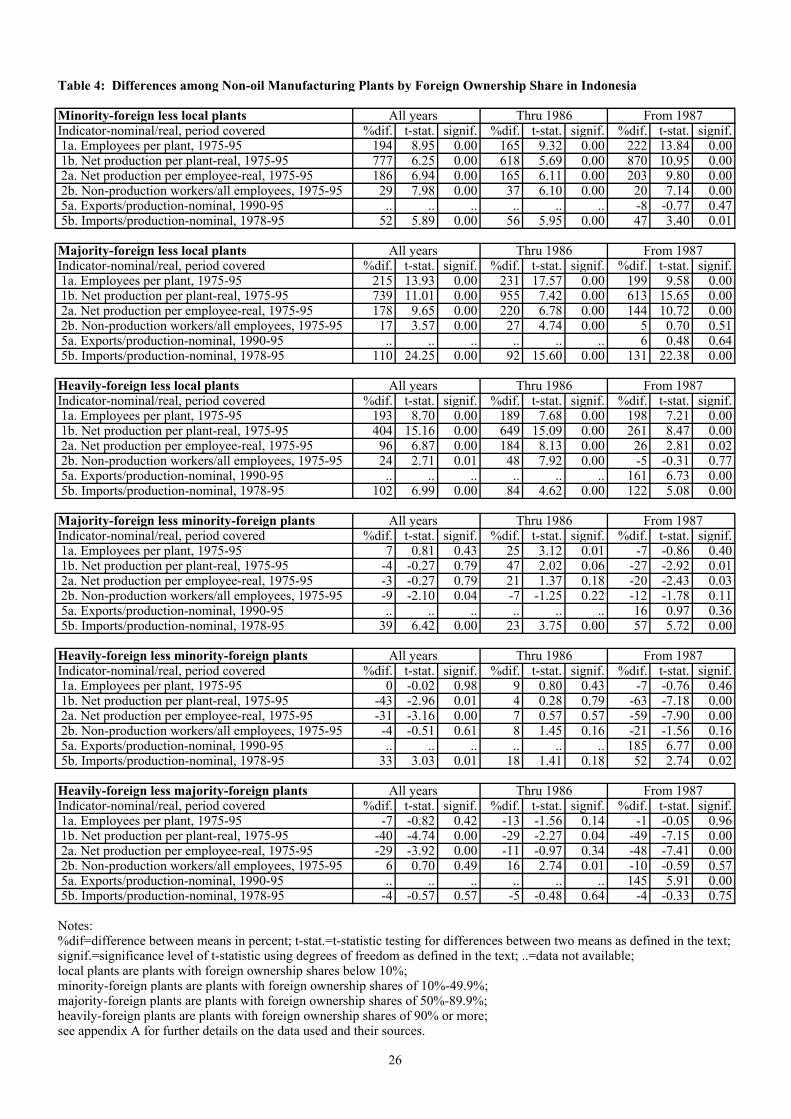
Table 4: Differences among Non-oil Manufacturing Plants by Foreign Ownership Share in Indonesia
Minority-foreign less local plants All years Thru 1986 From 1987Indicator-nominal/real, period covered %dif. t-stat. signif. %dif. t-stat. signif. %dif. t-stat. signif. 1a. Employees per plant, 1975-95 194 8.95 0.00 165 9.32 0.00 222 13.84 0.00 1b. Net production per plant-real, 1975-95 777 6.25 0.00 618 5.69 0.00 870 10.95 0.00 2a. Net production per employee-real, 1975-95 186 6.94 0.00 165 6.11 0.00 203 9.80 0.00 2b. Non-production workers/all employees, 1975-95 29 7.98 0.00 37 6.10 0.00 20 7.14 0.00 5a. Exports/production-nominal, 1990-95 .. .. .. .. .. .. -8 -0.77 0.47 5b. Imports/production-nominal, 1978-95 52 5.89 0.00 56 5.95 0.00 47 3.40 0.01
Majority-foreign less local plants All years Thru 1986 From 1987Indicator-nominal/real, period covered %dif. t-stat. signif. %dif. t-stat. signif. %dif. t-stat. signif. 1a. Employees per plant, 1975-95 215 13.93 0.00 231 17.57 0.00 199 9.58 0.00 1b. Net production per plant-real, 1975-95 739 11.01 0.00 955 7.42 0.00 613 15.65 0.00 2a. Net production per employee-real, 1975-95 178 9.65 0.00 220 6.78 0.00 144 10.72 0.00 2b. Non-production workers/all employees, 1975-95 17 3.57 0.00 27 4.74 0.00 5 0.70 0.51 5a. Exports/production-nominal, 1990-95 .. .. .. .. .. .. 6 0.48 0.64 5b. Imports/production-nominal, 1978-95 110 24.25 0.00 92 15.60 0.00 131 22.38 0.00
Heavily-foreign less local plants All years Thru 1986 From 1987Indicator-nominal/real, period covered %dif. t-stat. signif. %dif. t-stat. signif. %dif. t-stat. signif. 1a. Employees per plant, 1975-95 193 8.70 0.00 189 7.68 0.00 198 7.21 0.00 1b. Net production per plant-real, 1975-95 404 15.16 0.00 649 15.09 0.00 261 8.47 0.00 2a. Net production per employee-real, 1975-95 96 6.87 0.00 184 8.13 0.00 26 2.81 0.02 2b. Non-production workers/all employees, 1975-95 24 2.71 0.01 48 7.92 0.00 -5 -0.31 0.77 5a. Exports/production-nominal, 1990-95 .. .. .. .. .. .. 161 6.73 0.00 5b. Imports/production-nominal, 1978-95 102 6.99 0.00 84 4.62 0.00 122 5.08 0.00
Majority-foreign less minority-foreign plants All years Thru 1986 From 1987Indicator-nominal/real, period covered %dif. t-stat. signif. %dif. t-stat. signif. %dif. t-stat. signif. 1a. Employees per plant, 1975-95 7 0.81 0.43 25 3.12 0.01 -7 -0.86 0.40 1b. Net production per plant-real, 1975-95 -4 -0.27 0.79 47 2.02 0.06 -27 -2.92 0.01 2a. Net production per employee-real, 1975-95 -3 -0.27 0.79 21 1.37 0.18 -20 -2.43 0.03 2b. Non-production workers/all employees, 1975-95 -9 -2.10 0.04 -7 -1.25 0.22 -12 -1.78 0.11 5a. Exports/production-nominal, 1990-95 .. .. .. .. .. .. 16 0.97 0.36 5b. Imports/production-nominal, 1978-95 39 6.42 0.00 23 3.75 0.00 57 5.72 0.00
Heavily-foreign less minority-foreign plants All years Thru 1986 From 1987Indicator-nominal/real, period covered %dif. t-stat. signif. %dif. t-stat. signif. %dif. t-stat. signif. 1a. Employees per plant, 1975-95 0 -0.02 0.98 9 0.80 0.43 -7 -0.76 0.46 1b. Net production per plant-real, 1975-95 -43 -2.96 0.01 4 0.28 0.79 -63 -7.18 0.00 2a. Net production per employee-real, 1975-95 -31 -3.16 0.00 7 0.57 0.57 -59 -7.90 0.00 2b. Non-production workers/all employees, 1975-95 -4 -0.51 0.61 8 1.45 0.16 -21 -1.56 0.16 5a. Exports/production-nominal, 1990-95 .. .. .. .. .. .. 185 6.77 0.00 5b. Imports/production-nominal, 1978-95 33 3.03 0.01 18 1.41 0.18 52 2.74 0.02
Heavily-foreign less majority-foreign plants All years Thru 1986 From 1987Indicator-nominal/real, period covered %dif. t-stat. signif. %dif. t-stat. signif. %dif. t-stat. signif. 1a. Employees per plant, 1975-95 -7 -0.82 0.42 -13 -1.56 0.14 -1 -0.05 0.96 1b. Net production per plant-real, 1975-95 -40 -4.74 0.00 -29 -2.27 0.04 -49 -7.15 0.00 2a. Net production per employee-real, 1975-95 -29 -3.92 0.00 -11 -0.97 0.34 -48 -7.41 0.00 2b. Non-production workers/all employees, 1975-95 6 0.70 0.49 16 2.74 0.01 -10 -0.59 0.57 5a. Exports/production-nominal, 1990-95 .. .. .. .. .. .. 145 5.91 0.00 5b. Imports/production-nominal, 1978-95 -4 -0.57 0.57 -5 -0.48 0.64 -4 -0.33 0.75
Notes:%dif=difference between means in percent; t-stat.=t-statistic testing for differences between two means as defined in the text;signif.=significance level of t-statistic using degrees of freedom as defined in the text; ..=data not available;local plants are plants with foreign ownership shares below 10%;minority-foreign plants are plants with foreign ownership shares of 10%-49.9%;majority-foreign plants are plants with foreign ownership shares of 50%-89.9%;heavily-foreign plants are plants with foreign ownership shares of 90% or more;see appendix A for further details on the data used and their sources.
26
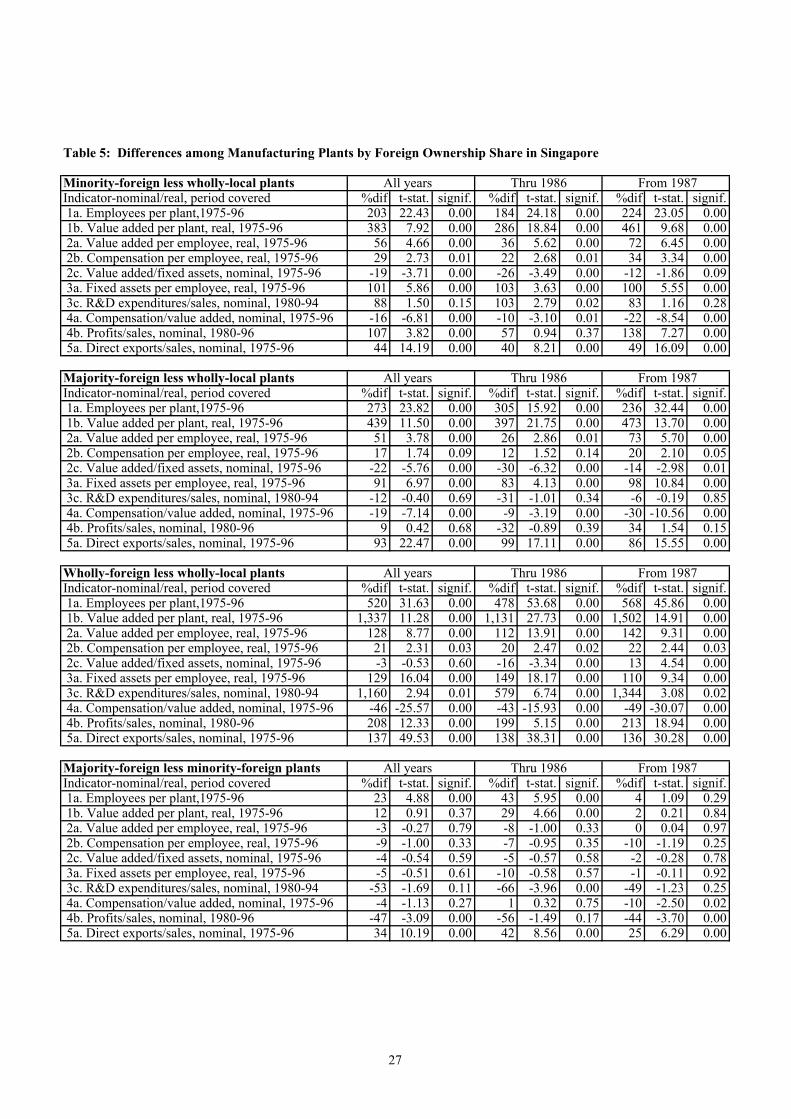
Table 5: Differences among Manufacturing Plants by Foreign Ownership Share in Singapore
Minority-foreign less wholly-local plants All years Thru 1986 From 1987Indicator-nominal/real, period covered %dif t-stat. signif. %dif t-stat. signif. %dif t-stat. signif. 1a. Employees per plant,1975-96 203 22.43 0.00 184 24.18 0.00 224 23.05 0.00 1b. Value added per plant, real, 1975-96 383 7.92 0.00 286 18.84 0.00 461 9.68 0.00 2a. Value added per employee, real, 1975-96 56 4.66 0.00 36 5.62 0.00 72 6.45 0.00 2b. Compensation per employee, real, 1975-96 29 2.73 0.01 22 2.68 0.01 34 3.34 0.00 2c. Value added/fixed assets, nominal, 1975-96 -19 -3.71 0.00 -26 -3.49 0.00 -12 -1.86 0.09 3a. Fixed assets per employee, real, 1975-96 101 5.86 0.00 103 3.63 0.00 100 5.55 0.00 3c. R&D expenditures/sales, nominal, 1980-94 88 1.50 0.15 103 2.79 0.02 83 1.16 0.28 4a. Compensation/value added, nominal, 1975-96 -16 -6.81 0.00 -10 -3.10 0.01 -22 -8.54 0.00 4b. Profits/sales, nominal, 1980-96 107 3.82 0.00 57 0.94 0.37 138 7.27 0.00 5a. Direct exports/sales, nominal, 1975-96 44 14.19 0.00 40 8.21 0.00 49 16.09 0.00
Majority-foreign less wholly-local plants All years Thru 1986 From 1987Indicator-nominal/real, period covered %dif t-stat. signif. %dif t-stat. signif. %dif t-stat. signif. 1a. Employees per plant,1975-96 273 23.82 0.00 305 15.92 0.00 236 32.44 0.00 1b. Value added per plant, real, 1975-96 439 11.50 0.00 397 21.75 0.00 473 13.70 0.00 2a. Value added per employee, real, 1975-96 51 3.78 0.00 26 2.86 0.01 73 5.70 0.00 2b. Compensation per employee, real, 1975-96 17 1.74 0.09 12 1.52 0.14 20 2.10 0.05 2c. Value added/fixed assets, nominal, 1975-96 -22 -5.76 0.00 -30 -6.32 0.00 -14 -2.98 0.01 3a. Fixed assets per employee, real, 1975-96 91 6.97 0.00 83 4.13 0.00 98 10.84 0.00 3c. R&D expenditures/sales, nominal, 1980-94 -12 -0.40 0.69 -31 -1.01 0.34 -6 -0.19 0.85 4a. Compensation/value added, nominal, 1975-96 -19 -7.14 0.00 -9 -3.19 0.00 -30 -10.56 0.00 4b. Profits/sales, nominal, 1980-96 9 0.42 0.68 -32 -0.89 0.39 34 1.54 0.15 5a. Direct exports/sales, nominal, 1975-96 93 22.47 0.00 99 17.11 0.00 86 15.55 0.00
Wholly-foreign less wholly-local plants All years Thru 1986 From 1987Indicator-nominal/real, period covered %dif t-stat. signif. %dif t-stat. signif. %dif t-stat. signif. 1a. Employees per plant,1975-96 520 31.63 0.00 478 53.68 0.00 568 45.86 0.00 1b. Value added per plant, real, 1975-96 1,337 11.28 0.00 1,131 27.73 0.00 1,502 14.91 0.00 2a. Value added per employee, real, 1975-96 128 8.77 0.00 112 13.91 0.00 142 9.31 0.00 2b. Compensation per employee, real, 1975-96 21 2.31 0.03 20 2.47 0.02 22 2.44 0.03 2c. Value added/fixed assets, nominal, 1975-96 -3 -0.53 0.60 -16 -3.34 0.00 13 4.54 0.00 3a. Fixed assets per employee, real, 1975-96 129 16.04 0.00 149 18.17 0.00 110 9.34 0.00 3c. R&D expenditures/sales, nominal, 1980-94 1,160 2.94 0.01 579 6.74 0.00 1,344 3.08 0.02 4a. Compensation/value added, nominal, 1975-96 -46 -25.57 0.00 -43 -15.93 0.00 -49 -30.07 0.00 4b. Profits/sales, nominal, 1980-96 208 12.33 0.00 199 5.15 0.00 213 18.94 0.00 5a. Direct exports/sales, nominal, 1975-96 137 49.53 0.00 138 38.31 0.00 136 30.28 0.00
Majority-foreign less minority-foreign plants All years Thru 1986 From 1987Indicator-nominal/real, period covered %dif t-stat. signif. %dif t-stat. signif. %dif t-stat. signif. 1a. Employees per plant,1975-96 23 4.88 0.00 43 5.95 0.00 4 1.09 0.29 1b. Value added per plant, real, 1975-96 12 0.91 0.37 29 4.66 0.00 2 0.21 0.84 2a. Value added per employee, real, 1975-96 -3 -0.27 0.79 -8 -1.00 0.33 0 0.04 0.97 2b. Compensation per employee, real, 1975-96 -9 -1.00 0.33 -7 -0.95 0.35 -10 -1.19 0.25 2c. Value added/fixed assets, nominal, 1975-96 -4 -0.54 0.59 -5 -0.57 0.58 -2 -0.28 0.78 3a. Fixed assets per employee, real, 1975-96 -5 -0.51 0.61 -10 -0.58 0.57 -1 -0.11 0.92 3c. R&D expenditures/sales, nominal, 1980-94 -53 -1.69 0.11 -66 -3.96 0.00 -49 -1.23 0.25 4a. Compensation/value added, nominal, 1975-96 -4 -1.13 0.27 1 0.32 0.75 -10 -2.50 0.02 4b. Profits/sales, nominal, 1980-96 -47 -3.09 0.00 -56 -1.49 0.17 -44 -3.70 0.00 5a. Direct exports/sales, nominal, 1975-96 34 10.19 0.00 42 8.56 0.00 25 6.29 0.00
27
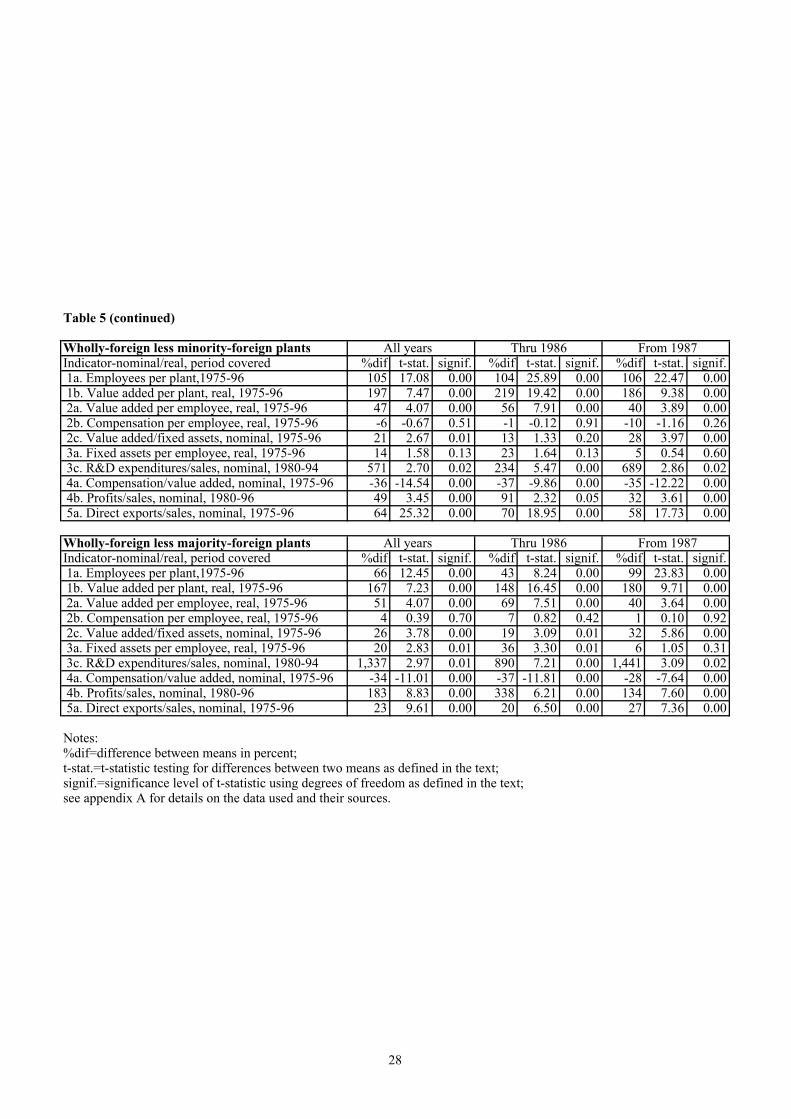
Table 5 (continued)
Wholly-foreign less minority-foreign plants All years Thru 1986 From 1987Indicator-nominal/real, period covered %dif t-stat. signif. %dif t-stat. signif. %dif t-stat. signif. 1a. Employees per plant,1975-96 105 17.08 0.00 104 25.89 0.00 106 22.47 0.00 1b. Value added per plant, real, 1975-96 197 7.47 0.00 219 19.42 0.00 186 9.38 0.00 2a. Value added per employee, real, 1975-96 47 4.07 0.00 56 7.91 0.00 40 3.89 0.00 2b. Compensation per employee, real, 1975-96 -6 -0.67 0.51 -1 -0.12 0.91 -10 -1.16 0.26 2c. Value added/fixed assets, nominal, 1975-96 21 2.67 0.01 13 1.33 0.20 28 3.97 0.00 3a. Fixed assets per employee, real, 1975-96 14 1.58 0.13 23 1.64 0.13 5 0.54 0.60 3c. R&D expenditures/sales, nominal, 1980-94 571 2.70 0.02 234 5.47 0.00 689 2.86 0.02 4a. Compensation/value added, nominal, 1975-96 -36 -14.54 0.00 -37 -9.86 0.00 -35 -12.22 0.00 4b. Profits/sales, nominal, 1980-96 49 3.45 0.00 91 2.32 0.05 32 3.61 0.00 5a. Direct exports/sales, nominal, 1975-96 64 25.32 0.00 70 18.95 0.00 58 17.73 0.00
Wholly-foreign less majority-foreign plants All years Thru 1986 From 1987Indicator-nominal/real, period covered %dif t-stat. signif. %dif t-stat. signif. %dif t-stat. signif. 1a. Employees per plant,1975-96 66 12.45 0.00 43 8.24 0.00 99 23.83 0.00 1b. Value added per plant, real, 1975-96 167 7.23 0.00 148 16.45 0.00 180 9.71 0.00 2a. Value added per employee, real, 1975-96 51 4.07 0.00 69 7.51 0.00 40 3.64 0.00 2b. Compensation per employee, real, 1975-96 4 0.39 0.70 7 0.82 0.42 1 0.10 0.92 2c. Value added/fixed assets, nominal, 1975-96 26 3.78 0.00 19 3.09 0.01 32 5.86 0.00 3a. Fixed assets per employee, real, 1975-96 20 2.83 0.01 36 3.30 0.01 6 1.05 0.31 3c. R&D expenditures/sales, nominal, 1980-94 1,337 2.97 0.01 890 7.21 0.00 1,441 3.09 0.02 4a. Compensation/value added, nominal, 1975-96 -34 -11.01 0.00 -37 -11.81 0.00 -28 -7.64 0.00 4b. Profits/sales, nominal, 1980-96 183 8.83 0.00 338 6.21 0.00 134 7.60 0.00 5a. Direct exports/sales, nominal, 1975-96 23 9.61 0.00 20 6.50 0.00 27 7.36 0.00
Notes:%dif=difference between means in percent; t-stat.=t-statistic testing for differences between two means as defined in the text; signif.=significance level of t-statistic using degrees of freedom as defined in the text; see appendix A for details on the data used and their sources.
28
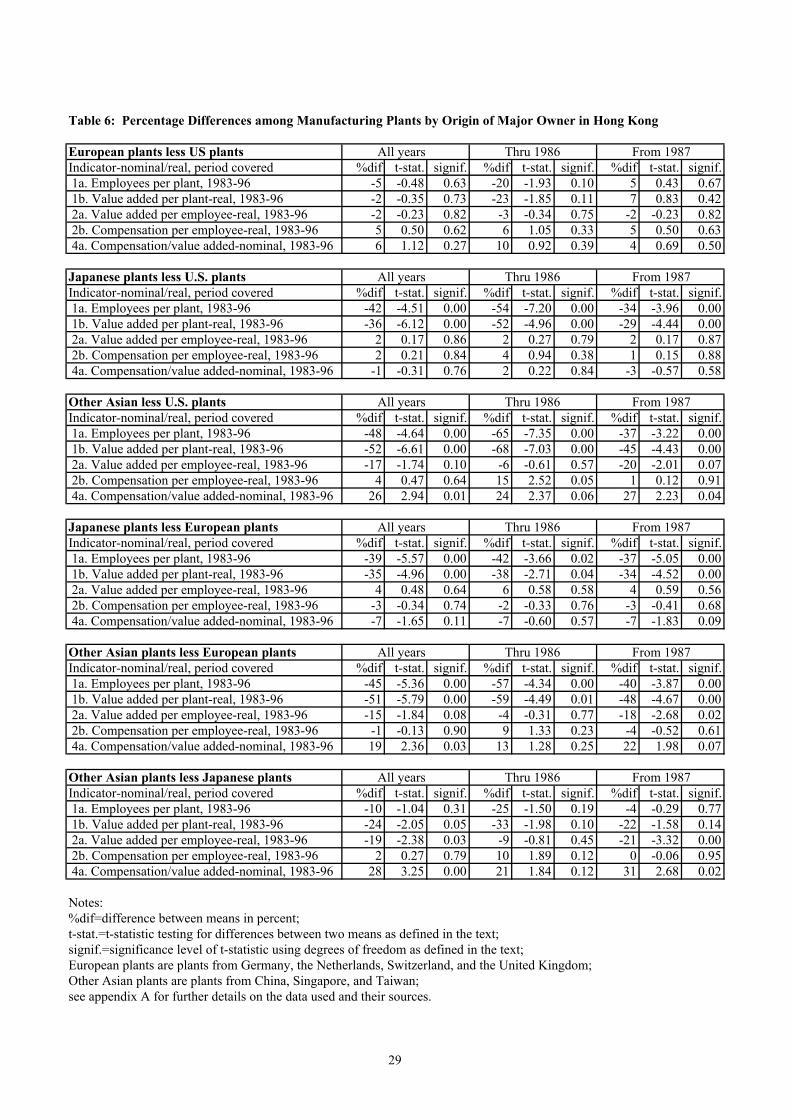
Table 6: Percentage Differences among Manufacturing Plants by Origin of Major Owner in Hong Kong
European plants less US plants All years Thru 1986 From 1987Indicator-nominal/real, period covered %dif t-stat. signif. %dif t-stat. signif. %dif t-stat. signif. 1a. Employees per plant, 1983-96 -5 -0.48 0.63 -20 -1.93 0.10 5 0.43 0.67 1b. Value added per plant-real, 1983-96 -2 -0.35 0.73 -23 -1.85 0.11 7 0.83 0.42 2a. Value added per employee-real, 1983-96 -2 -0.23 0.82 -3 -0.34 0.75 -2 -0.23 0.82 2b. Compensation per employee-real, 1983-96 5 0.50 0.62 6 1.05 0.33 5 0.50 0.63 4a. Compensation/value added-nominal, 1983-96 6 1.12 0.27 10 0.92 0.39 4 0.69 0.50
Japanese plants less U.S. plants All years Thru 1986 From 1987Indicator-nominal/real, period covered %dif t-stat. signif. %dif t-stat. signif. %dif t-stat. signif. 1a. Employees per plant, 1983-96 -42 -4.51 0.00 -54 -7.20 0.00 -34 -3.96 0.00 1b. Value added per plant-real, 1983-96 -36 -6.12 0.00 -52 -4.96 0.00 -29 -4.44 0.00 2a. Value added per employee-real, 1983-96 2 0.17 0.86 2 0.27 0.79 2 0.17 0.87 2b. Compensation per employee-real, 1983-96 2 0.21 0.84 4 0.94 0.38 1 0.15 0.88 4a. Compensation/value added-nominal, 1983-96 -1 -0.31 0.76 2 0.22 0.84 -3 -0.57 0.58
Other Asian less U.S. plants All years Thru 1986 From 1987Indicator-nominal/real, period covered %dif t-stat. signif. %dif t-stat. signif. %dif t-stat. signif. 1a. Employees per plant, 1983-96 -48 -4.64 0.00 -65 -7.35 0.00 -37 -3.22 0.00 1b. Value added per plant-real, 1983-96 -52 -6.61 0.00 -68 -7.03 0.00 -45 -4.43 0.00 2a. Value added per employee-real, 1983-96 -17 -1.74 0.10 -6 -0.61 0.57 -20 -2.01 0.07 2b. Compensation per employee-real, 1983-96 4 0.47 0.64 15 2.52 0.05 1 0.12 0.91 4a. Compensation/value added-nominal, 1983-96 26 2.94 0.01 24 2.37 0.06 27 2.23 0.04
Japanese plants less European plants All years Thru 1986 From 1987Indicator-nominal/real, period covered %dif t-stat. signif. %dif t-stat. signif. %dif t-stat. signif. 1a. Employees per plant, 1983-96 -39 -5.57 0.00 -42 -3.66 0.02 -37 -5.05 0.00 1b. Value added per plant-real, 1983-96 -35 -4.96 0.00 -38 -2.71 0.04 -34 -4.52 0.00 2a. Value added per employee-real, 1983-96 4 0.48 0.64 6 0.58 0.58 4 0.59 0.56 2b. Compensation per employee-real, 1983-96 -3 -0.34 0.74 -2 -0.33 0.76 -3 -0.41 0.68 4a. Compensation/value added-nominal, 1983-96 -7 -1.65 0.11 -7 -0.60 0.57 -7 -1.83 0.09
Other Asian plants less European plants All years Thru 1986 From 1987Indicator-nominal/real, period covered %dif t-stat. signif. %dif t-stat. signif. %dif t-stat. signif. 1a. Employees per plant, 1983-96 -45 -5.36 0.00 -57 -4.34 0.00 -40 -3.87 0.00 1b. Value added per plant-real, 1983-96 -51 -5.79 0.00 -59 -4.49 0.01 -48 -4.67 0.00 2a. Value added per employee-real, 1983-96 -15 -1.84 0.08 -4 -0.31 0.77 -18 -2.68 0.02 2b. Compensation per employee-real, 1983-96 -1 -0.13 0.90 9 1.33 0.23 -4 -0.52 0.61 4a. Compensation/value added-nominal, 1983-96 19 2.36 0.03 13 1.28 0.25 22 1.98 0.07
Other Asian plants less Japanese plants All years Thru 1986 From 1987Indicator-nominal/real, period covered %dif t-stat. signif. %dif t-stat. signif. %dif t-stat. signif. 1a. Employees per plant, 1983-96 -10 -1.04 0.31 -25 -1.50 0.19 -4 -0.29 0.77 1b. Value added per plant-real, 1983-96 -24 -2.05 0.05 -33 -1.98 0.10 -22 -1.58 0.14 2a. Value added per employee-real, 1983-96 -19 -2.38 0.03 -9 -0.81 0.45 -21 -3.32 0.00 2b. Compensation per employee-real, 1983-96 2 0.27 0.79 10 1.89 0.12 0 -0.06 0.95 4a. Compensation/value added-nominal, 1983-96 28 3.25 0.00 21 1.84 0.12 31 2.68 0.02
Notes:%dif=difference between means in percent; t-stat.=t-statistic testing for differences between two means as defined in the text; signif.=significance level of t-statistic using degrees of freedom as defined in the text; European plants are plants from Germany, the Netherlands, Switzerland, and the United Kingdom;Other Asian plants are plants from China, Singapore, and Taiwan;see appendix A for further details on the data used and their sources.
29
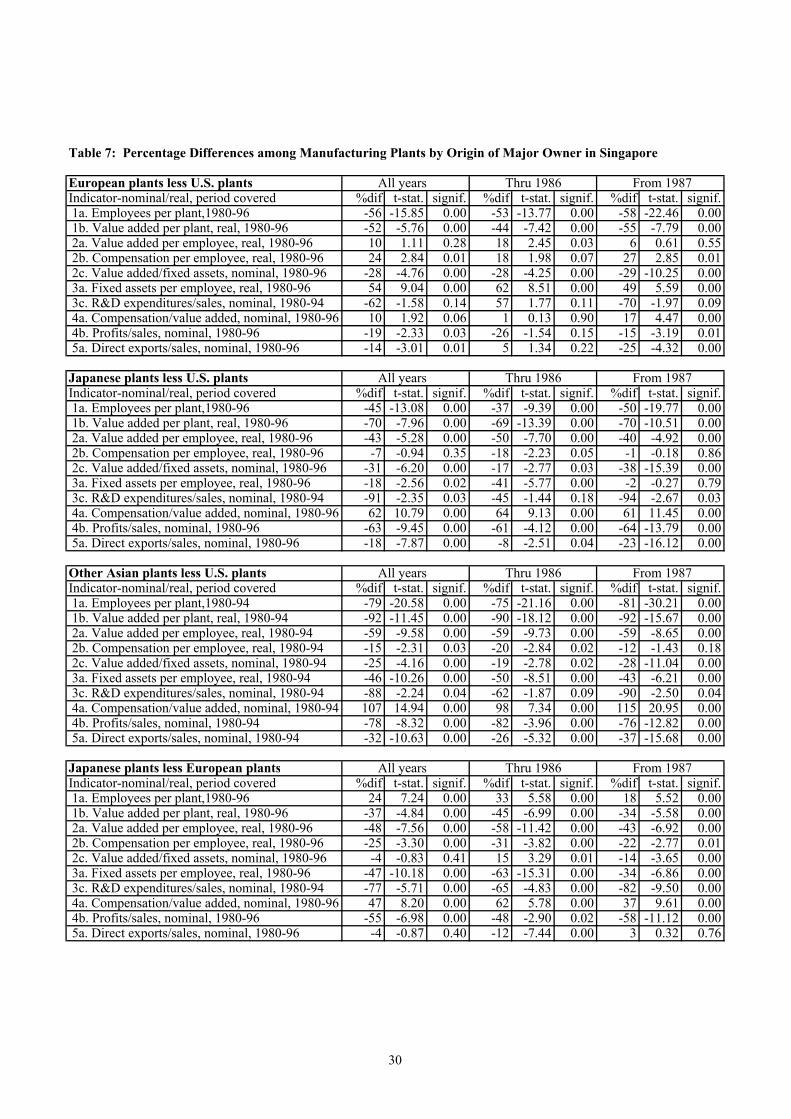
Table 7: Percentage Differences among Manufacturing Plants by Origin of Major Owner in Singapore
European plants less U.S. plants All years Thru 1986 From 1987Indicator-nominal/real, period covered %dif t-stat. signif. %dif t-stat. signif. %dif t-stat. signif. 1a. Employees per plant,1980-96 -56 -15.85 0.00 -53 -13.77 0.00 -58 -22.46 0.00 1b. Value added per plant, real, 1980-96 -52 -5.76 0.00 -44 -7.42 0.00 -55 -7.79 0.00 2a. Value added per employee, real, 1980-96 10 1.11 0.28 18 2.45 0.03 6 0.61 0.55 2b. Compensation per employee, real, 1980-96 24 2.84 0.01 18 1.98 0.07 27 2.85 0.01 2c. Value added/fixed assets, nominal, 1980-96 -28 -4.76 0.00 -28 -4.25 0.00 -29 -10.25 0.00 3a. Fixed assets per employee, real, 1980-96 54 9.04 0.00 62 8.51 0.00 49 5.59 0.00 3c. R&D expenditures/sales, nominal, 1980-94 -62 -1.58 0.14 57 1.77 0.11 -70 -1.97 0.09 4a. Compensation/value added, nominal, 1980-96 10 1.92 0.06 1 0.13 0.90 17 4.47 0.00 4b. Profits/sales, nominal, 1980-96 -19 -2.33 0.03 -26 -1.54 0.15 -15 -3.19 0.01 5a. Direct exports/sales, nominal, 1980-96 -14 -3.01 0.01 5 1.34 0.22 -25 -4.32 0.00
Japanese plants less U.S. plants All years Thru 1986 From 1987Indicator-nominal/real, period covered %dif t-stat. signif. %dif t-stat. signif. %dif t-stat. signif. 1a. Employees per plant,1980-96 -45 -13.08 0.00 -37 -9.39 0.00 -50 -19.77 0.00 1b. Value added per plant, real, 1980-96 -70 -7.96 0.00 -69 -13.39 0.00 -70 -10.51 0.00 2a. Value added per employee, real, 1980-96 -43 -5.28 0.00 -50 -7.70 0.00 -40 -4.92 0.00 2b. Compensation per employee, real, 1980-96 -7 -0.94 0.35 -18 -2.23 0.05 -1 -0.18 0.86 2c. Value added/fixed assets, nominal, 1980-96 -31 -6.20 0.00 -17 -2.77 0.03 -38 -15.39 0.00 3a. Fixed assets per employee, real, 1980-96 -18 -2.56 0.02 -41 -5.77 0.00 -2 -0.27 0.79 3c. R&D expenditures/sales, nominal, 1980-94 -91 -2.35 0.03 -45 -1.44 0.18 -94 -2.67 0.03 4a. Compensation/value added, nominal, 1980-96 62 10.79 0.00 64 9.13 0.00 61 11.45 0.00 4b. Profits/sales, nominal, 1980-96 -63 -9.45 0.00 -61 -4.12 0.00 -64 -13.79 0.00 5a. Direct exports/sales, nominal, 1980-96 -18 -7.87 0.00 -8 -2.51 0.04 -23 -16.12 0.00
Other Asian plants less U.S. plants All years Thru 1986 From 1987Indicator-nominal/real, period covered %dif t-stat. signif. %dif t-stat. signif. %dif t-stat. signif. 1a. Employees per plant,1980-94 -79 -20.58 0.00 -75 -21.16 0.00 -81 -30.21 0.00 1b. Value added per plant, real, 1980-94 -92 -11.45 0.00 -90 -18.12 0.00 -92 -15.67 0.00 2a. Value added per employee, real, 1980-94 -59 -9.58 0.00 -59 -9.73 0.00 -59 -8.65 0.00 2b. Compensation per employee, real, 1980-94 -15 -2.31 0.03 -20 -2.84 0.02 -12 -1.43 0.18 2c. Value added/fixed assets, nominal, 1980-94 -25 -4.16 0.00 -19 -2.78 0.02 -28 -11.04 0.00 3a. Fixed assets per employee, real, 1980-94 -46 -10.26 0.00 -50 -8.51 0.00 -43 -6.21 0.00 3c. R&D expenditures/sales, nominal, 1980-94 -88 -2.24 0.04 -62 -1.87 0.09 -90 -2.50 0.04 4a. Compensation/value added, nominal, 1980-94 107 14.94 0.00 98 7.34 0.00 115 20.95 0.00 4b. Profits/sales, nominal, 1980-94 -78 -8.32 0.00 -82 -3.96 0.00 -76 -12.82 0.00 5a. Direct exports/sales, nominal, 1980-94 -32 -10.63 0.00 -26 -5.32 0.00 -37 -15.68 0.00
Japanese plants less European plants All years Thru 1986 From 1987Indicator-nominal/real, period covered %dif t-stat. signif. %dif t-stat. signif. %dif t-stat. signif. 1a. Employees per plant,1980-96 24 7.24 0.00 33 5.58 0.00 18 5.52 0.00 1b. Value added per plant, real, 1980-96 -37 -4.84 0.00 -45 -6.99 0.00 -34 -5.58 0.00 2a. Value added per employee, real, 1980-96 -48 -7.56 0.00 -58 -11.42 0.00 -43 -6.92 0.00 2b. Compensation per employee, real, 1980-96 -25 -3.30 0.00 -31 -3.82 0.00 -22 -2.77 0.01 2c. Value added/fixed assets, nominal, 1980-96 -4 -0.83 0.41 15 3.29 0.01 -14 -3.65 0.00 3a. Fixed assets per employee, real, 1980-96 -47 -10.18 0.00 -63 -15.31 0.00 -34 -6.86 0.00 3c. R&D expenditures/sales, nominal, 1980-94 -77 -5.71 0.00 -65 -4.83 0.00 -82 -9.50 0.00 4a. Compensation/value added, nominal, 1980-96 47 8.20 0.00 62 5.78 0.00 37 9.61 0.00 4b. Profits/sales, nominal, 1980-96 -55 -6.98 0.00 -48 -2.90 0.02 -58 -11.12 0.00 5a. Direct exports/sales, nominal, 1980-96 -4 -0.87 0.40 -12 -7.44 0.00 3 0.32 0.76
30
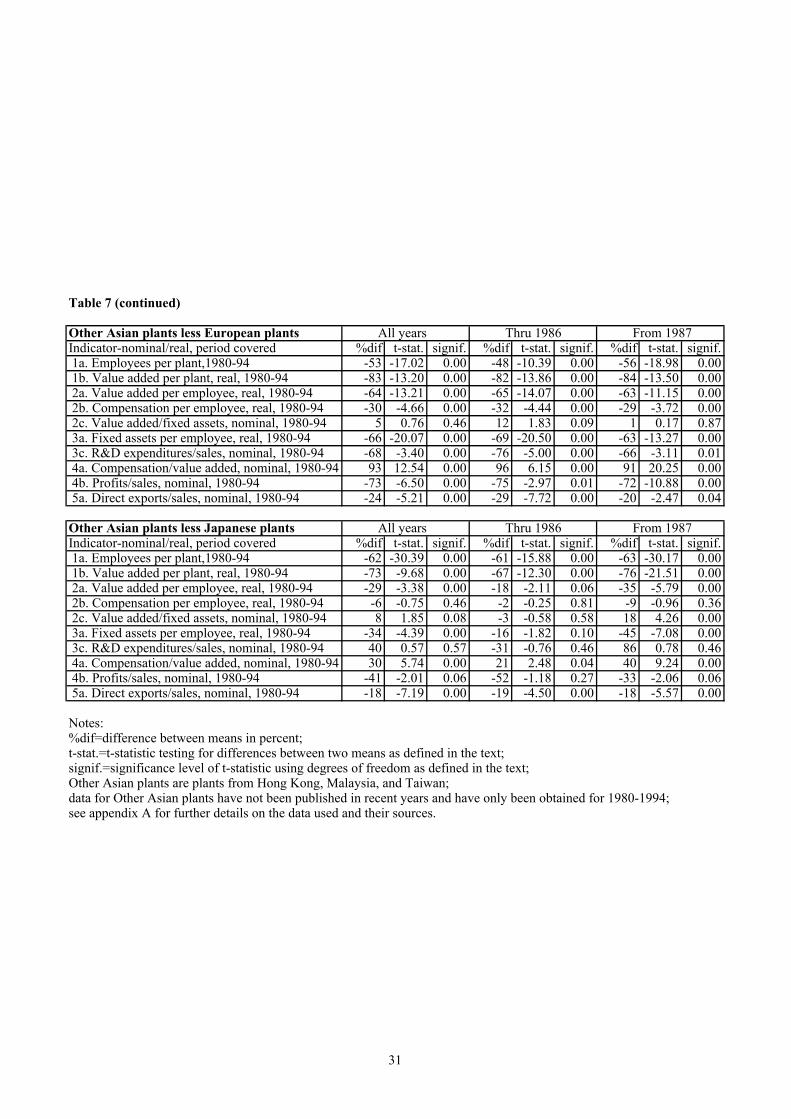
Table 7 (continued)
Other Asian plants less European plants All years Thru 1986 From 1987Indicator-nominal/real, period covered %dif t-stat. signif. %dif t-stat. signif. %dif t-stat. signif. 1a. Employees per plant,1980-94 -53 -17.02 0.00 -48 -10.39 0.00 -56 -18.98 0.00 1b. Value added per plant, real, 1980-94 -83 -13.20 0.00 -82 -13.86 0.00 -84 -13.50 0.00 2a. Value added per employee, real, 1980-94 -64 -13.21 0.00 -65 -14.07 0.00 -63 -11.15 0.00 2b. Compensation per employee, real, 1980-94 -30 -4.66 0.00 -32 -4.44 0.00 -29 -3.72 0.00 2c. Value added/fixed assets, nominal, 1980-94 5 0.76 0.46 12 1.83 0.09 1 0.17 0.87 3a. Fixed assets per employee, real, 1980-94 -66 -20.07 0.00 -69 -20.50 0.00 -63 -13.27 0.00 3c. R&D expenditures/sales, nominal, 1980-94 -68 -3.40 0.00 -76 -5.00 0.00 -66 -3.11 0.01 4a. Compensation/value added, nominal, 1980-94 93 12.54 0.00 96 6.15 0.00 91 20.25 0.00 4b. Profits/sales, nominal, 1980-94 -73 -6.50 0.00 -75 -2.97 0.01 -72 -10.88 0.00 5a. Direct exports/sales, nominal, 1980-94 -24 -5.21 0.00 -29 -7.72 0.00 -20 -2.47 0.04
Other Asian plants less Japanese plants All years Thru 1986 From 1987Indicator-nominal/real, period covered %dif t-stat. signif. %dif t-stat. signif. %dif t-stat. signif. 1a. Employees per plant,1980-94 -62 -30.39 0.00 -61 -15.88 0.00 -63 -30.17 0.00 1b. Value added per plant, real, 1980-94 -73 -9.68 0.00 -67 -12.30 0.00 -76 -21.51 0.00 2a. Value added per employee, real, 1980-94 -29 -3.38 0.00 -18 -2.11 0.06 -35 -5.79 0.00 2b. Compensation per employee, real, 1980-94 -6 -0.75 0.46 -2 -0.25 0.81 -9 -0.96 0.36 2c. Value added/fixed assets, nominal, 1980-94 8 1.85 0.08 -3 -0.58 0.58 18 4.26 0.00 3a. Fixed assets per employee, real, 1980-94 -34 -4.39 0.00 -16 -1.82 0.10 -45 -7.08 0.00 3c. R&D expenditures/sales, nominal, 1980-94 40 0.57 0.57 -31 -0.76 0.46 86 0.78 0.46 4a. Compensation/value added, nominal, 1980-94 30 5.74 0.00 21 2.48 0.04 40 9.24 0.00 4b. Profits/sales, nominal, 1980-94 -41 -2.01 0.06 -52 -1.18 0.27 -33 -2.06 0.06 5a. Direct exports/sales, nominal, 1980-94 -18 -7.19 0.00 -19 -4.50 0.00 -18 -5.57 0.00
Notes:%dif=difference between means in percent; t-stat.=t-statistic testing for differences between two means as defined in the text; signif.=significance level of t-statistic using degrees of freedom as defined in the text; Other Asian plants are plants from Hong Kong, Malaysia, and Taiwan; data for Other Asian plants have not been published in recent years and have only been obtained for 1980-1994;see appendix A for further details on the data used and their sources.
31
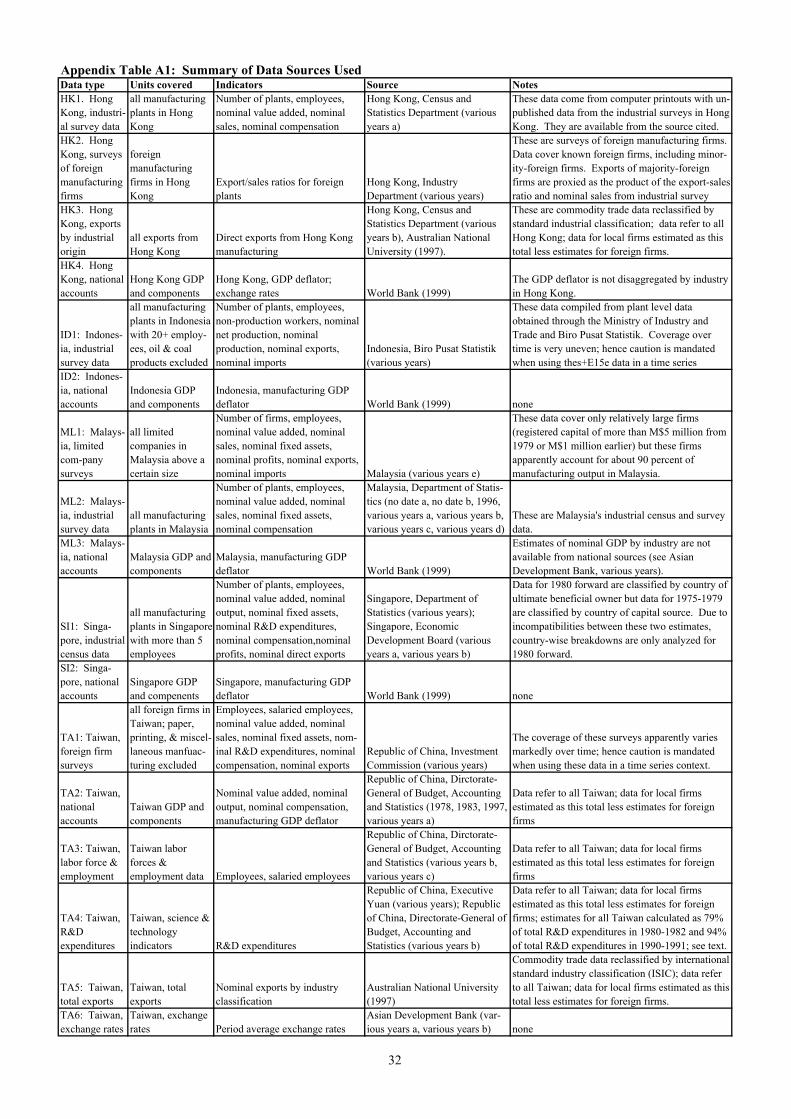
Appendix Table A1: Summary of Data Sources UsedData type Units covered Indicators Source NotesHK1. HongKong, industri-al survey data
all manufacturingplants in HongKong
Number of plants, employees,nominal value added, nominalsales, nominal compensation
Hong Kong, Census andStatistics Department (variousyears a)
These data come from computer printouts with un-published data from the industrial surveys in HongKong. They are available from the source cited.
HK2. HongKong, surveysof foreignmanufacturingfirms
foreignmanufacturingfirms in HongKong
Export/sales ratios for foreignplants
Hong Kong, IndustryDepartment (various years)
These are surveys of foreign manufacturing firms.Data cover known foreign firms, including minor-ity-foreign firms. Exports of majority-foreignfirms are proxied as the product of the export-salesratio and nominal sales from industrial survey
HK3. HongKong, exportsby industrialorigin
all exports fromHong Kong
Direct exports from Hong Kongmanufacturing
Hong Kong, Census andStatistics Department (variousyears b), Australian NationalUniversity (1997).
These are commodity trade data reclassified bystandard industrial classification; data refer to allHong Kong; data for local firms estimated as thistotal less estimates for foreign firms.
HK4. HongKong, nationalaccounts
Hong Kong GDPand components
Hong Kong, GDP deflator;exchange rates World Bank (1999)
The GDP deflator is not disaggregated by industryin Hong Kong.
ID1: Indones-ia, industrialsurvey data
all manufacturingplants in Indonesiawith 20+ employ-ees, oil & coalproducts excluded
Number of plants, employees,non-production workers, nominalnet production, nominalproduction, nominal exports,nominal imports
Indonesia, Biro Pusat Statistik(various years)
These data compiled from plant level dataobtained through the Ministry of Industry andTrade and Biro Pusat Statistik. Coverage overtime is very uneven; hence caution is mandatedwhen using thes+E15e data in a time series
ID2: Indones-ia, nationalaccounts
Indonesia GDPand components
Indonesia, manufacturing GDPdeflator World Bank (1999) none
ML1: Malays-ia, limitedcom-panysurveys
all limitedcompanies inMalaysia above acertain size
Number of firms, employees,nominal value added, nominalsales, nominal fixed assets,nominal profits, nominal exports,nominal imports Malaysia (various years e)
These data cover only relatively large firms(registered capital of more than M$5 million from1979 or M$1 million earlier) but these firmsapparently account for about 90 percent ofmanufacturing output in Malaysia.
ML2: Malays-ia, industrialsurvey data
all manufacturingplants in Malaysia
Number of plants, employees,nominal value added, nominalsales, nominal fixed assets,nominal compensation
Malaysia, Department of Statis-tics (no date a, no date b, 1996,various years a, various years b,various years c, various years d)
These are Malaysia's industrial census and surveydata.
ML3: Malays-ia, nationalaccounts
Malaysia GDP andcomponents
Malaysia, manufacturing GDPdeflator World Bank (1999)
Estimates of nominal GDP by industry are notavailable from national sources (see AsianDevelopment Bank, various years).
SI1: Singa-pore, industrialcensus data
all manufacturingplants in Singaporewith more than 5employees
Number of plants, employees,nominal value added, nominaloutput, nominal fixed assets,nominal R&D expenditures,nominal compensation,nominalprofits, nominal direct exports
Singapore, Department ofStatistics (various years);Singapore, EconomicDevelopment Board (variousyears a, various years b)
Data for 1980 forward are classified by country ofultimate beneficial owner but data for 1975-1979are classified by country of capital source. Due toincompatibilities between these two estimates,country-wise breakdowns are only analyzed for1980 forward.
SI2: Singa-pore, nationalaccounts
Singapore GDPand compenents
Singapore, manufacturing GDPdeflator World Bank (1999) none
TA1: Taiwan,foreign firmsurveys
all foreign firms inTaiwan; paper,printing, & miscel-laneous manfuac-turing excluded
Employees, salaried employees,nominal value added, nominalsales, nominal fixed assets, nom-inal R&D expenditures, nominalcompensation, nominal exports
Republic of China, InvestmentCommission (various years)
The coverage of these surveys apparently variesmarkedly over time; hence caution is mandatedwhen using these data in a time series context.
TA2: Taiwan,nationalaccounts
Taiwan GDP andcomponents
Nominal value added, nominaloutput, nominal compensation,manufacturing GDP deflator
Republic of China, Dirctorate-General of Budget, Accountingand Statistics (1978, 1983, 1997,various years a)
Data refer to all Taiwan; data for local firmsestimated as this total less estimates for foreignfirms
TA3: Taiwan,labor force &employment
Taiwan laborforces &employment data Employees, salaried employees
Republic of China, Dirctorate-General of Budget, Accountingand Statistics (various years b,various years c)
Data refer to all Taiwan; data for local firmsestimated as this total less estimates for foreignfirms
TA4: Taiwan,R&Dexpenditures
Taiwan, science &technologyindicators R&D expenditures
Republic of China, ExecutiveYuan (various years); Republicof China, Directorate-General ofBudget, Accounting andStatistics (various years b)
Data refer to all Taiwan; data for local firmsestimated as this total less estimates for foreignfirms; estimates for all Taiwan calculated as 79%of total R&D expenditures in 1980-1982 and 94%of total R&D expenditures in 1990-1991; see text.
TA5: Taiwan,total exports
Taiwan, totalexports
Nominal exports by industryclassification
Australian National University(1997)
Commodity trade data reclassified by internationalstandard industry classification (ISIC); data referto all Taiwan; data for local firms estimated as thistotal less estimates for foreign firms.
TA6: Taiwan,exchange rates
Taiwan, exchangerates Period average exchange rates
Asian Development Bank (var-ious years a, various years b) none
32