Embed Size (px)
Citation preview
Indonesia’s Challenges toward Industrial Upgrading
11 August 2017
Yuri Sato
Executive Vice President
Institute of Developing Economies
Japan External Trade Organization
(IDE-JETRO)
Indonesia = Japan 2nd Industrial DialogueJICA mission @ Bappenas
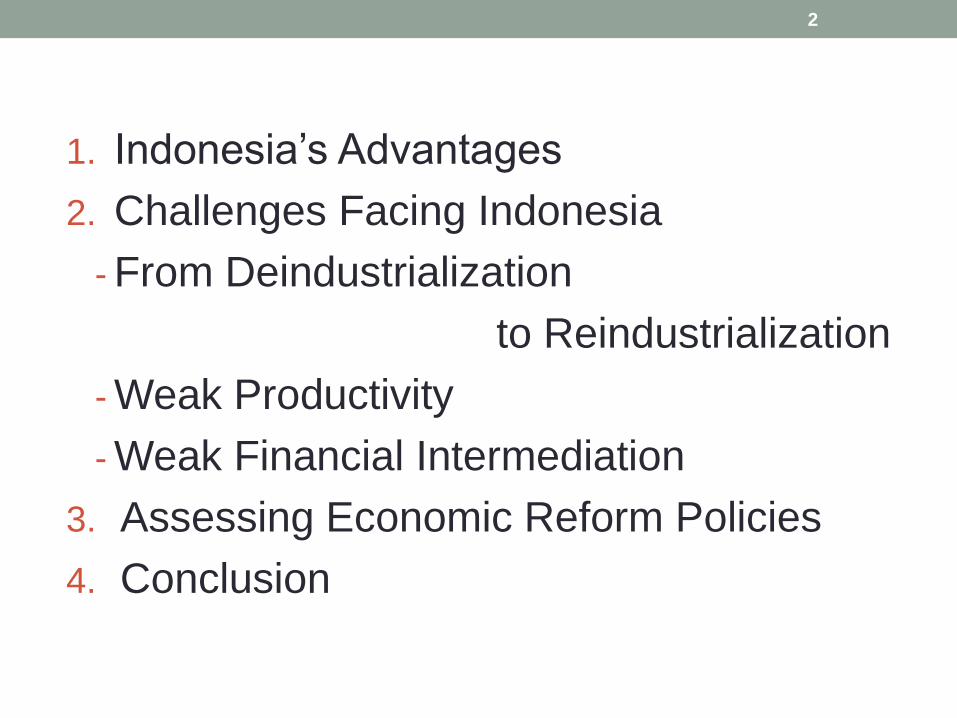
1. Indonesia’s Advantages
2. Challenges Facing Indonesia
- From Deindustrialization
to Reindustrialization
- Weak Productivity
- Weak Financial Intermediation
3. Assessing Economic Reform Policies
4. Conclusion
2
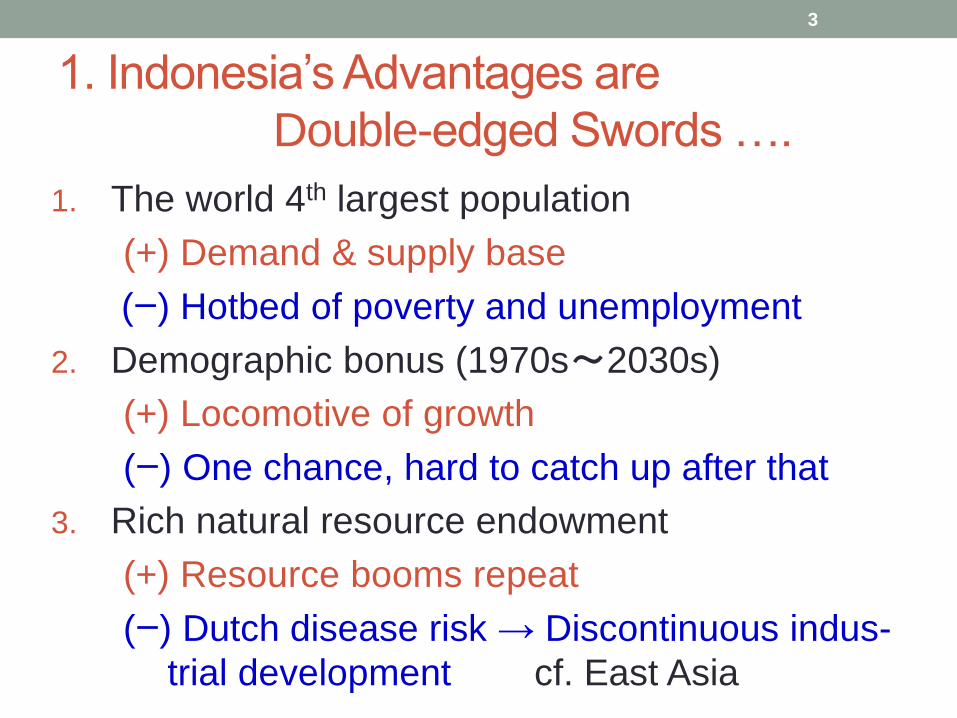
1. Indonesia’s Advantages are
Double-edged Swords ….
1. The world 4th largest population
(+) Demand & supply base
(ー) Hotbed of poverty and unemployment
2. Demographic bonus (1970s~2030s)
(+) Locomotive of growth
(ー) One chance, hard to catch up after that
3. Rich natural resource endowment
(+) Resource booms repeat
(ー) Dutch disease risk → Discontinuous indus-
trial development cf. East Asia
3
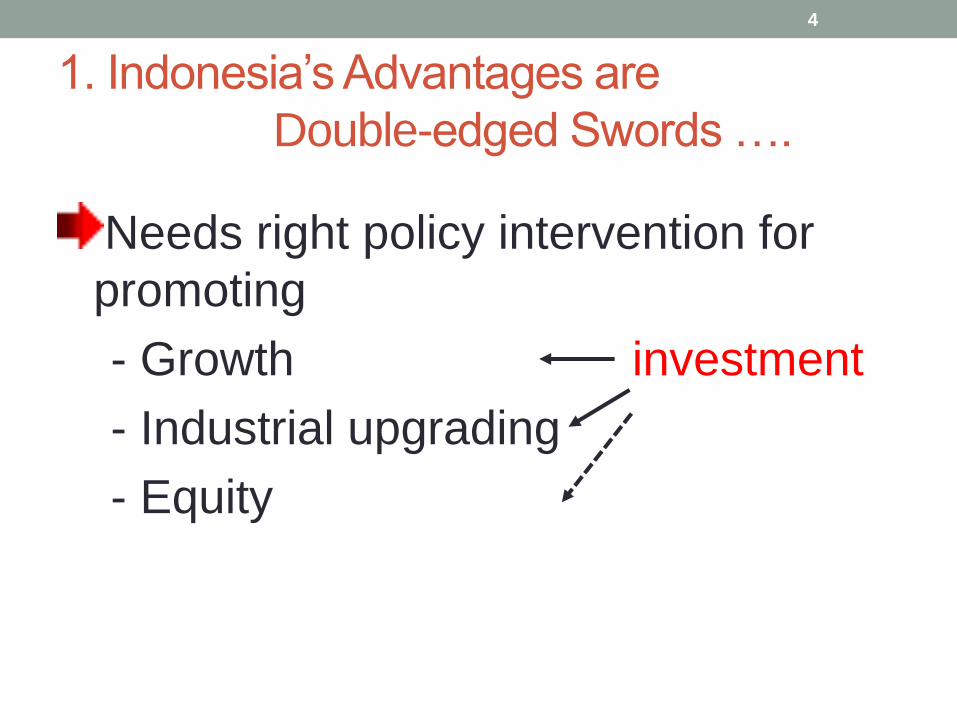
1. Indonesia’s Advantages are
Double-edged Swords ….
Needs right policy intervention for
promoting
- Growth investment
- Industrial upgrading
- Equity
4
0
10
20
30
40
50
19
70
19
73
19
76
19
79
19
82
19
85
19
88
19
91
19
94
19
97
20
00
20
03
20
06
20
09
20
12
20
15
Authoritarian Developmental Regime (Soeharto Regime)
(%)
Agriculture, Fishery, Forestry
Mining
Manufacturing
Democracy
Service industries
Transition period
Commodity boomOil boom
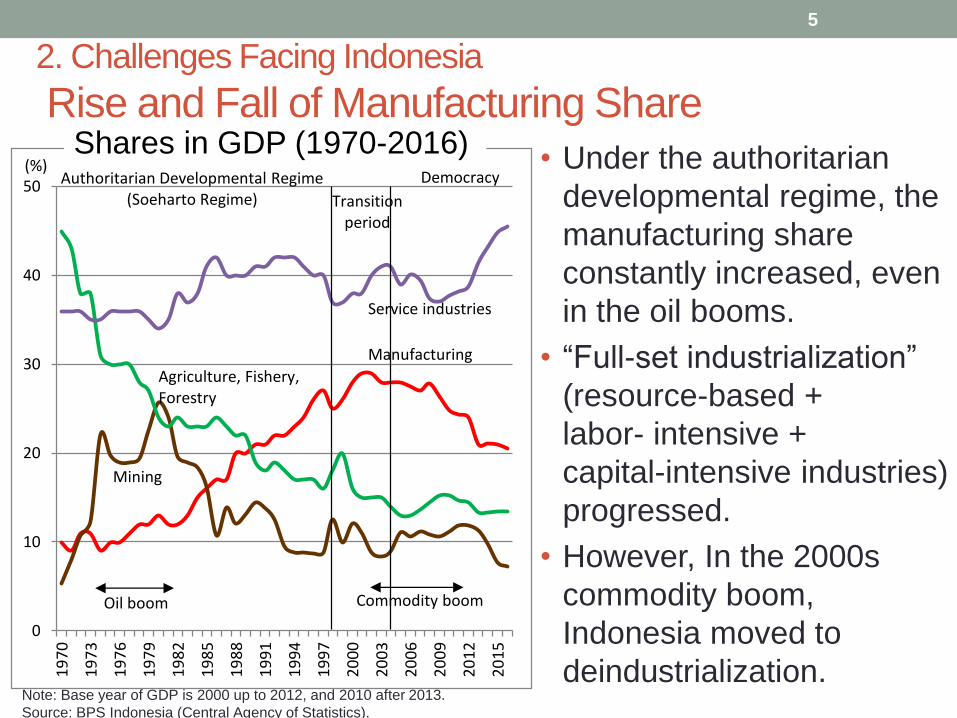
2. Challenges Facing Indonesia
Rise and Fall of Manufacturing Share
5
• Under the authoritarian
developmental regime, the
manufacturing share
constantly increased, even
in the oil booms.
• “Full-set industrialization”
(resource-based +
labor- intensive +
capital-intensive industries)
progressed.
• However, In the 2000s
commodity boom,
Indonesia moved to
deindustrialization.Note: Base year of GDP is 2000 up to 2012, and 2010 after 2013.
Source: BPS Indonesia (Central Agency of Statistics).
Shares in GDP (1970-2016)
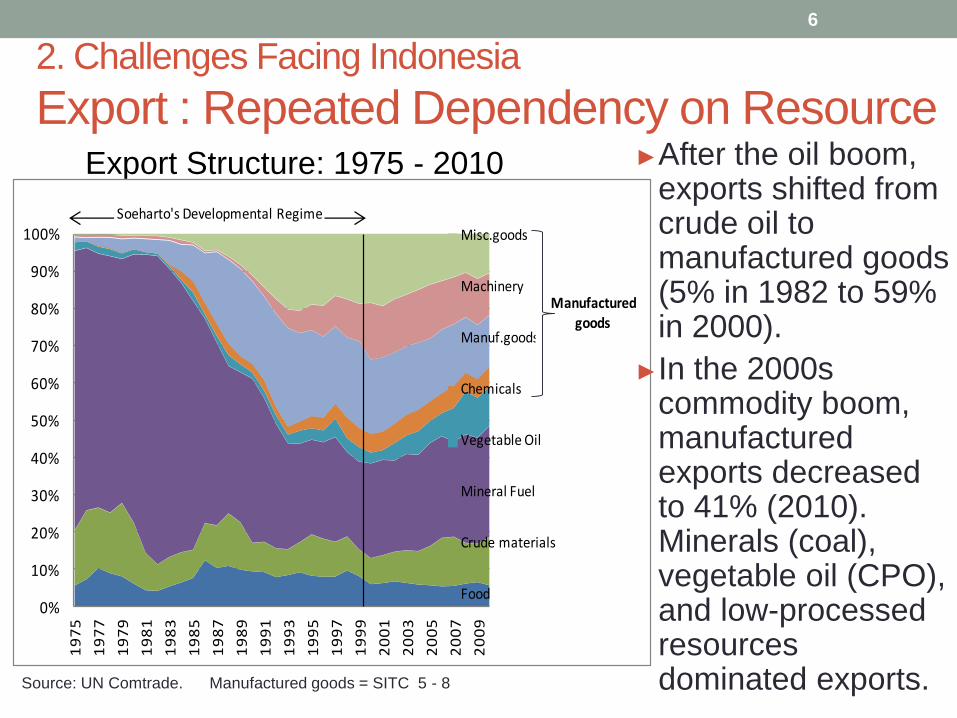
2. Challenges Facing Indonesia
Export : Repeated Dependency on Resource
6
Export Structure: 1975 - 2010
0%
10%
20%
30%
40%
50%
60%
70%
80%
90%
100%
19
75
19
77
19
79
19
81
19
83
19
85
19
87
19
89
19
91
19
93
19
95
19
97
19
99
20
01
20
03
20
05
20
07
20
09
Misc.goods
Machinery
Manuf.goods
Chemicals
Vegetable Oil
Mineral Fuel
Crude materials
Food
Soeharto's Developmental Regime
Manufactured goods
Source: UN Comtrade. Manufactured goods = SITC 5 - 8
►After the oil boom, exports shifted from crude oil to manufactured goods (5% in 1982 to 59% in 2000).
►In the 2000s commodity boom, manufactured exports decreased to 41% (2010). Minerals (coal), vegetable oil (CPO), and low-processed resources dominated exports.
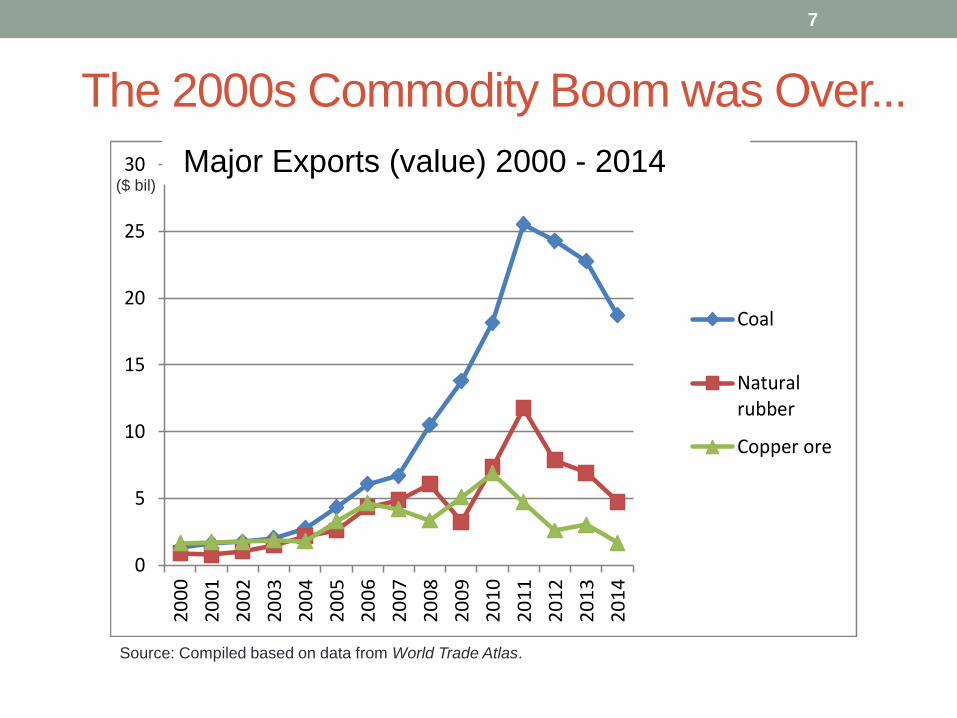
The 2000s Commodity Boom was Over...
0
5
10
15
20
25
302
00
0
20
01
20
02
20
03
20
04
20
05
20
06
20
07
20
08
20
09
20
10
20
11
20
12
20
13
20
14
Coal
Naturalrubber
Copper ore
7
Source: Compiled based on data from World Trade Atlas.
($ bil)Major Exports (value) 2000 - 2014

Some Manufactured Exports Picking Up
0.0
0.5
1.0
1.5
2.0
2.5
3.02
00
0
20
01
20
02
20
03
20
04
20
05
20
06
20
07
20
08
20
09
20
10
20
11
20
12
20
13
20
14
Motor cars
Plywood
Fattyacid/alcoholFootwear
8
Source: Compiled based on data from World Trade Atlas.
($ bil)
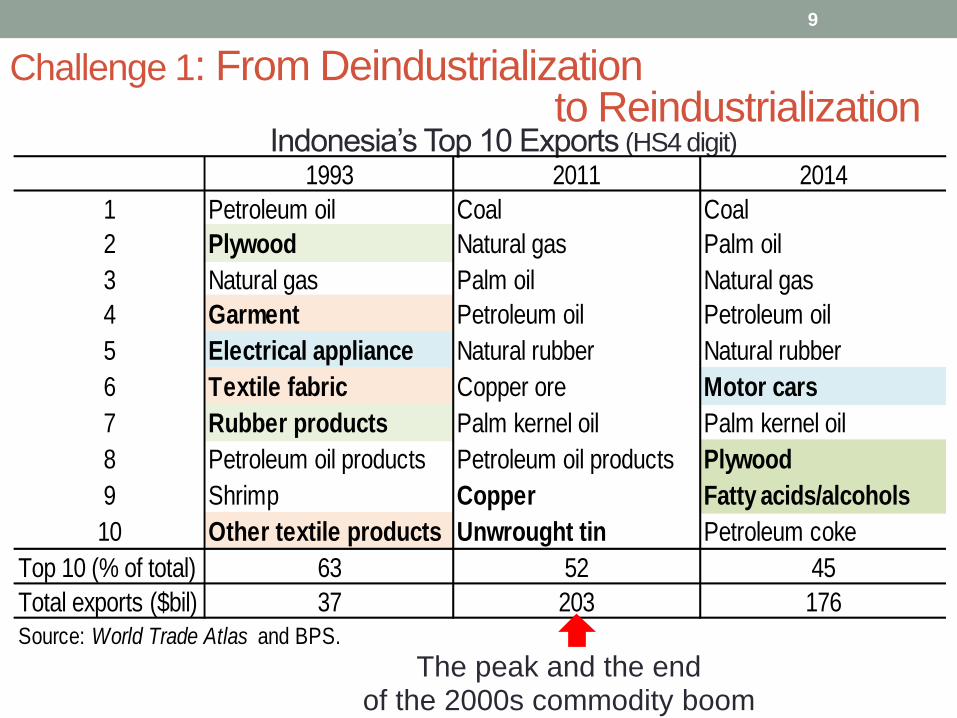
The peak and the end of the 2000s commodity boom
Indonesia’s Top 10 Exports (HS4 digit)
9
1993 2011 2014
1 Petroleum oil Coal Coal
2 Plywood Natural gas Palm oil
3 Natural gas Palm oil Natural gas
4 Garment Petroleum oil Petroleum oil
5 Electrical appliance Natural rubber Natural rubber
6 Textile fabric Copper ore Motor cars
7 Rubber products Palm kernel oil Palm kernel oil
8 Petroleum oil products Petroleum oil products Plywood
9 Shrimp Copper Fatty acids/alcohols
10 Other textile products Unwrought tin Petroleum coke
Top 10 (% of total) 63 52 45
Total exports ($bil) 37 203 176
Source: World Trade Atlas and BPS.
Challenge 1: From Deindustrialization to Reindustrialization
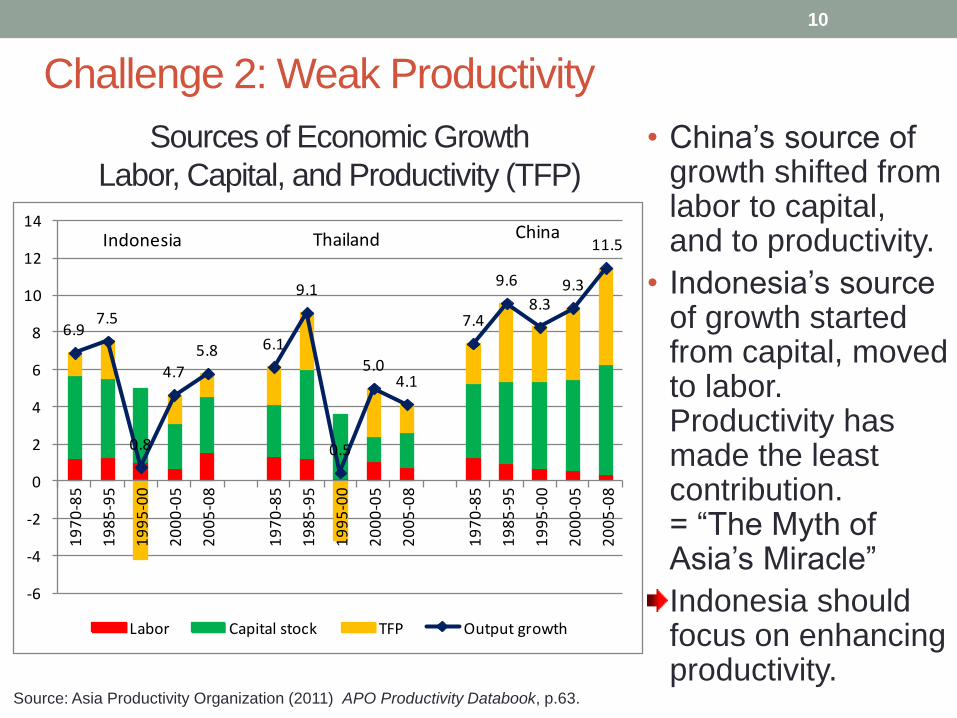
Sources of Economic Growth
Labor, Capital, and Productivity (TFP)
10
• China’s source of growth shifted from labor to capital, and to productivity.
• Indonesia’s source of growth started from capital, moved to labor. Productivity has made the least contribution. = “The Myth of Asia’s Miracle”
Indonesia shouldfocus on enhancing productivity.
Source: Asia Productivity Organization (2011) APO Productivity Databook, p.63.
6.97.5
0.8
4.7
5.8 6.1
9.1
0.5
5.04.1
7.4
9.6
8.39.3
11.5
-6
-4
-2
0
2
4
6
8
10
12
14
19
70
-85
19
85
-95
19
95
-00
20
00
-05
20
05
-08
19
70
-85
19
85
-95
19
95
-00
20
00
-05
20
05
-08
19
70
-85
19
85
-95
19
95
-00
20
00
-05
20
05
-08
Labor Capital stock TFP Output growth
Indonesia Thailand China
Challenge 2: Weak Productivity
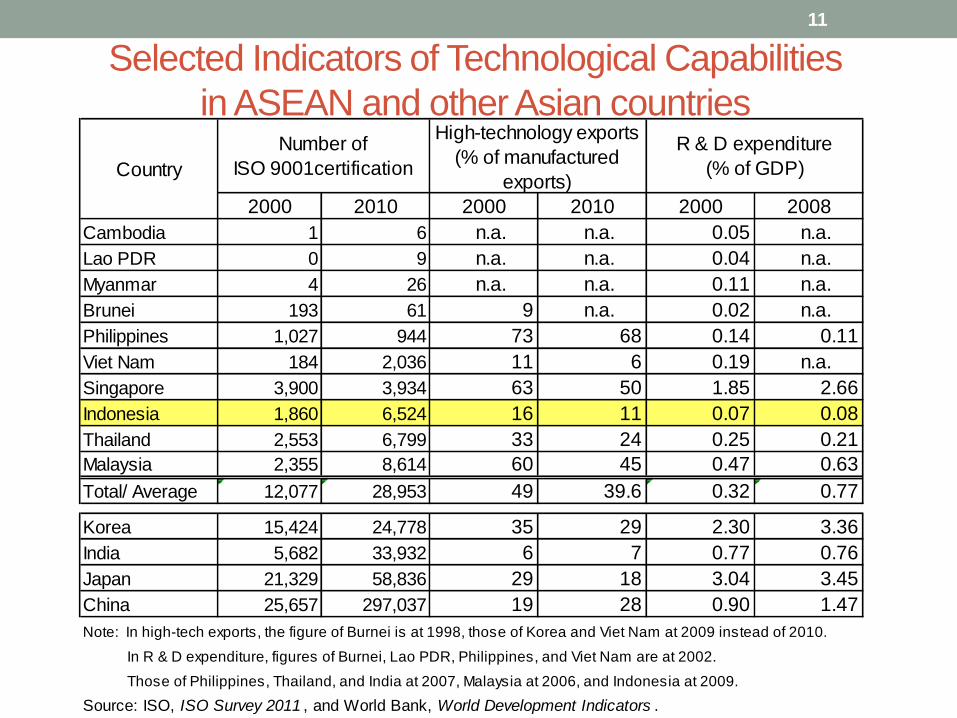
Selected Indicators of Technological Capabilities
in ASEAN and other Asian countries
11
2000 2010 2000 2010 2000 2008
Cambodia 1 6 n.a. n.a. 0.05 n.a.
Lao PDR 0 9 n.a. n.a. 0.04 n.a.
Myanmar 4 26 n.a. n.a. 0.11 n.a.
Brunei 193 61 9 n.a. 0.02 n.a.
Philippines 1,027 944 73 68 0.14 0.11
Viet Nam 184 2,036 11 6 0.19 n.a.
Singapore 3,900 3,934 63 50 1.85 2.66
Indonesia 1,860 6,524 16 11 0.07 0.08
Thailand 2,553 6,799 33 24 0.25 0.21
Malaysia 2,355 8,614 60 45 0.47 0.63
Total/ Average 12,077 28,953 49 39.6 0.32 0.77
Korea 15,424 24,778 35 29 2.30 3.36
India 5,682 33,932 6 7 0.77 0.76
Japan 21,329 58,836 29 18 3.04 3.45
China 25,657 297,037 19 28 0.90 1.47
Note: In high-tech exports, the figure of Burnei is at 1998, those of Korea and Viet Nam at 2009 instead of 2010.
In R & D expenditure, figures of Burnei, Lao PDR, Philippines, and Viet Nam are at 2002.
Those of Philippines, Thailand, and India at 2007, Malaysia at 2006, and Indonesia at 2009.
Source: ISO, ISO Survey 2011 , and World Bank, World Development Indicators .
Country
Number of
ISO 9001certification
High-technology exports
(% of manufactured
exports)
R & D expenditure
(% of GDP)
0
20
40
60
80
100
120
140
160
180
200
19
95
19
97
19
99
20
01
20
03
20
05
20
07
20
09
20
11
20
13
China
Malaysia
Thailand
Vietnam
India
Indonesia
(%)
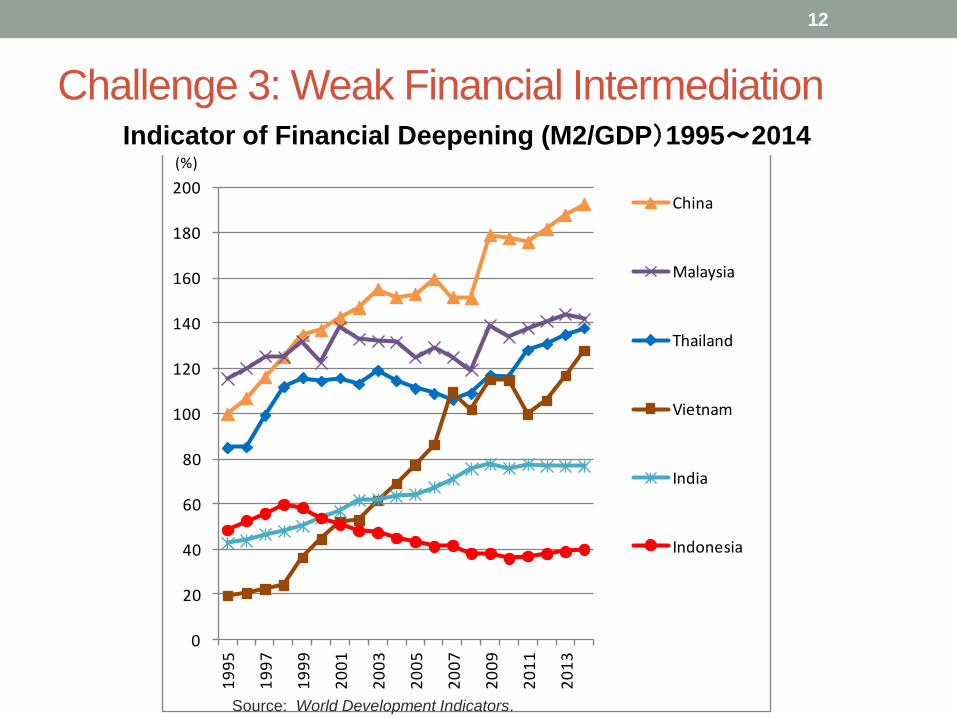
Challenge 3: Weak Financial Intermediation
12
Indicator of Financial Deepening (M2/GDP)1995~2014
Source: World Development Indicators.
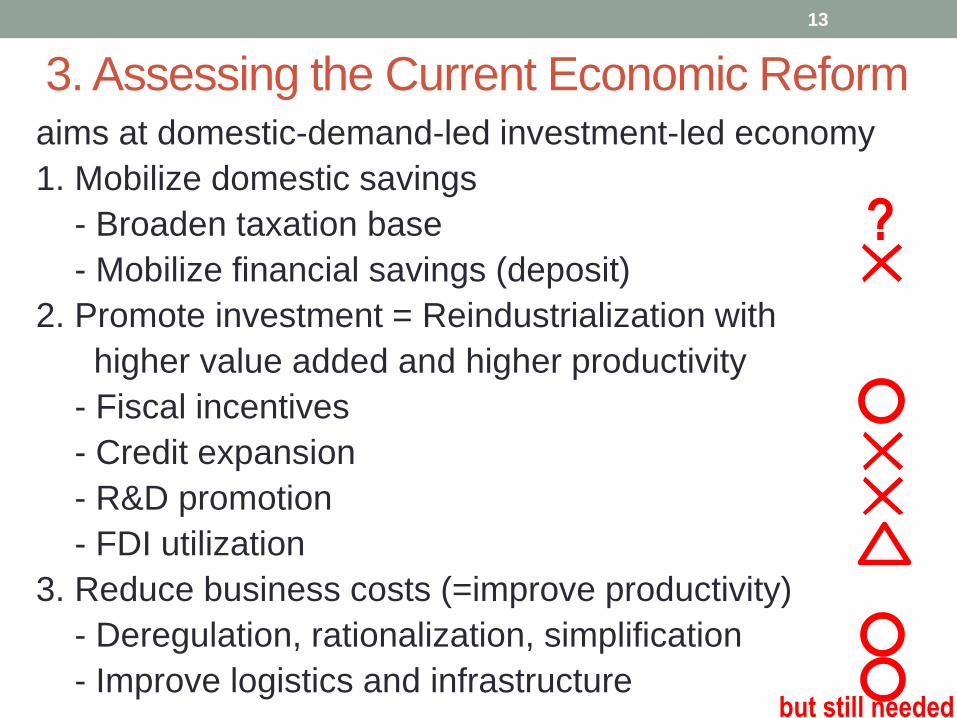
aims at domestic-demand-led investment-led economy
1. Mobilize domestic savings
- Broaden taxation base
- Mobilize financial savings (deposit)
2. Promote investment = Reindustrialization with
higher value added and higher productivity
- Fiscal incentives
- Credit expansion
- R&D promotion
- FDI utilization
3. Reduce business costs (=improve productivity)
- Deregulation, rationalization, simplification
- Improve logistics and infrastructure
3. Assessing the Current Economic Reform
13
but still needed
?
Conclusion
► Indonesia is amid the phase of critical importance,
an unrepeatable chance of demographic bonus.
► Higher growth accompanied with industrial
upgrading should be pursued. Reindustrialization
with higher value added and higher productivity
would be the key indicator.
► It is crucial to make smart policy intervention in
order to boost domestic-demand-led growth by
mobilizing savings, investing them toward
industrial upgrading, and reducing business costs.
Government efforts of economic reform need to be
more intensified.
14