Embed Size (px)
Citation preview

1 Indonesia Merry Lidya and Satrio Adhi Wibowo I. Introduction
The name of “Indonesia” has already been existed far before Indonesia’s sovereignty, known since
the eighteenth century. It originally derives from the Latin word Indus, meaning “India”, and the Greek word Nesos, meaning “Island”. As the meaning of its name, Indonesia consists of 17,508 islands that make Indonesia as the largest archipelagic state in the world. The Indonesian archipelago has been an important trade region since the seventh century, when the Sriwijaya Kingdom traded with China and India. This was the beginning of the influence of Buddhism and Hinduism to Indonesian culture. In the thirteenth century, Moslem traders arrived in northern Sumatra that further its influences spread over Indonesian areas adopted Islam. Islam overlaid and mixed with existing cultural and religious influences, particularly in Java area. In 1512, the first Europeans arrived in Indonesia; Portuguese traders came to Maluku and monopolized the sources of nutmeg, cloves, and cubed pepper. It followed by Dutch and British traders. The Dutch colonial era was started by establishing Dutch East India Company (VOC) in 1602. After the bankruptcy of VOC in 1800, the government of Netherlands took over VOC and Indonesia became a nationalized colony. The Japanese invasion and short term occupation during World War II ended Dutch rule, and encouraged Indonesian leaders to proclaim Indonesia’s Independence on August 17, 1945, three days after Japan surrendered. Geography, Climate, and Natural Resources
Indonesia is located in Southeastern Asia, which stretches between the Indian Ocean and the Pacific Ocean, and bridges two continents, Asia and Australia. It has land boundaries on the north with Malaysia (1,782 km), on the south with East Timor (228 km), and on the west with Papua New Guinea (820 km). The total area is 1,919,440 sq km that consists of land 1,826,440 sq km and water 93,000 sq km. The five big islands take place of the total area are Sumatra, Java, Kalimantan, Sulawesi, and Irian Jaya (also called West Papua). Among of them, Kalimantan is the biggest island that takes 539,460 sq km. Of the total 17,508 islands, 6,000 islands have already been inhabited. In addition, Indonesia is located in the Pacific Ring of Fire that makes some areas in Indonesia are vulnerable to mountain eruption, earthquake, and tsunami. The latest mountain eruption occurred at Mount Merapi in 2006, shortly before the Yogyakarta earthquake and the latest tsunami attacked Aceh and some areas of West Coast of Sumatra in 2004.
The climate in Indonesia is tropical because its location is near the equator line. There are only dry and wet seasons that take turn in a year. The East Monsoon, from June to September, brings dry weather while the West Monsoon, from December to March, brings rain. The transitional period between these two seasons is interspersed by the occasional heavy rain shower, but even in the midst of the West Monsoon season, temperatures range from 21C (70F) to 33C (190F) except at higher altitudes which can be much cooler. Heaviest rainfalls are usually recorded in December and January and humidity is generally between 75% and 100%.
Indonesia is rich in minerals although only less than half the country's geology has been explored. Oil and gas accounts for a major part of the nation's foreign exchange earnings. Apart from oil and gas, exploitation of geothermal reserves are being accelerated, coal production is increasing. Copper is found throughout the archipelago. There are also large deposits of nickel oxide, bauxite, gold, lead, manganese, silver, titanium, uranium, zinc, etc. In the case of agriculture resources, major agricultural products for domestic consumption and export include rice, corn, cassava, soybeans, timber, rubber, palm oil and various spices for which it has for centuries been famed. While in the field of fishery, shrimp has also become a major foreign exchange earner.
1
People and Culture The population in Indonesia is estimated around 237 million by July 2008, the world’s sixth most
populous country. The growth of population is 1.175% where the birth rate is 19.24 births/1,000 populations and the death rate is 6.24 deaths/1,000 populations. The majority of populations inhabit Java Island. The structure of population based on age consists of age 0-14 years old is 28.4%, age 15-64 years old is 65.7%, and age 65 – over is 5.8%.
The literacy level in Indonesia recorded at 87.9% of the total population. The improvement of literacy level is influenced by 9 years compulsory education i.e. from elementary school until junior high school. Although about 92% of eligible children are enrolled in primary school, a much smaller percentage attends full time. About 44% of secondary school-age children attend junior high school, and some others of this age group attend vocational schools.
Indonesia consists of different ethnic, linguistic, and religious groups. The largest ethnic is Javanese (40.6%) which is followed by Sundanese (15%), Madurese (3.3%), Minangkabau (2.7%), Betawi (2.4%), Bugis (2.4%), Banten (2%), Banjar (1.7%). The remaining of 29.9%, small but significant, are ethnic Chinese, Indians, Europeans and Arabs concentrated mostly in urban areas. Each ethnic group has their own language or dialect nevertheless Indonesia has an official language i.e. Bahasa Indonesia and also a national motto "Bhinneka tunggal ika" ("Unity in Diversity", "many, yet one"), expresses the diversity that shapes the country. The religion of majority population is Islam (86.1%), followed consecutively by Protestant (5.7%), Roman Catholic (3%), Hindu (1.8%), and other (3.4%).
Indonesia is rich in art and culture which are mixed with religion and age-old traditions from the time of early migrants with Western thoughts brought by Portuguese traders and Dutch colonists. The basic principles which guide life include the concepts of mutual assistance or "gotong royong" and consultations or "musyawarah" to arrive at a consensus or "mufakat" derived from rural life, this system is still very much in use in community life throughout the country. Though the legal system is based on the Old Dutch penal code, social life as well as the rites of passage is founded on customary or "adat" law which differs from area to area. "Adat" law has a binding impact on Indonesian life and it may be concluded that this law has been instrumental in maintaining equal rights for women in the community. Religious influences on the community are variously evident from island to island. Government and Current Political Situation
Regarding to 1945 Constitution of Indonesia, Indonesia is a republic country with presidential system. The president has role as head of state, armed forces chief commander, the director of domestic governance, policy making and foreign affairs. Before reformation era 1998, the President elected by general election in five years through People Consultative Assembly. However, in the last general election 2004, the president has been elected by people directly. Through general election, people elect 550 People Representative Council members and 128 members of Regional Representatives Council. Both of this representative’s council is part of People Consultative Assembly which is the highest power holder in Indonesia. This political process is taking place in local government as well such in provincial and regency level.
As the impact of reformation process in Indonesia, the political situation changes. Before, there are only 3 political parties such as Golongan Karya, Partai Persatuan Pembangunan and Partai Demokrasi Indonesia. Currently, there are more than 40 parties involved in general election. However, there are only 5 parties with high voter percentage and none from those parties as single majority. This fact makes a coalition between parties as a reasonable consideration in government control.
In 2004, for the first time in Indonesian history, people elected Susilo Bambang Yudhoyono (SBY) as a president directly. As a head of state, the president appointed his ministers by composed professionals and politician representatives. As a candidate president from minority political party, SBY involved ministers from other political parties to support his government. Nevertheless, it is difficult for president to gain full support from legislative to support his policies. This situation often makes this government working ineffective in implementing policies.
2

Since old era government up to now, the corruption in government is an unsolved big problem in Indonesia. During SBY government period, corruption eradication is one of focus his policies. By supporting the president, the Corruption Eradication Commission is working effectively to investigate corruption cases in his government. As a result this commission has successful handle various corruption cases in legislative body, state ministry, and central bank.
II. Overview of Macroeconomic Activity and Fiscal Position During 2007, Indonesia economy was stable and maintained although it was influenced by many external pressures. It was happened due to government’s effort in restraining the fluctuation of world crude oil and the hike trend of price commodities. While external factor such as fluctuation of world financial market as a consequent of sub-prime mortgage crisis in America hasn’t impacted significantly to Indonesia’s macro economy yet because there was no underlying factors that influenced it directly. Another external factor like the increase of crude palm oil and other world commodities was encountered by giving controlled subsidy, among other is vegetable oil subsidy. The stability of Indonesia’s economy was also due to government policy in delivering gasoline and kerosene subsidy in 2007. This policy has already encouraged economy activity to reaching the determined target. Moreover, the government was able to gain benefit from the momentum of rupiah strengthening against US dollar and the decline trend of the Fed rate for inducing more qualified economy growth.
From domestic side, growth was marked by dominant public consumption, the hike of government budget volume, and the increase of direct investment, and surplus of trade balance that showed higher trend from year to year, mainly in 2006 and 2007. One of growth dominant factor that became main stimulator of economy is increased public purchasing power as an impact of subsidies. Government’s commitment appeared clearly on budget’s allocation that aimed to stimulate economy and to improve policies especially on taxation in reaching fiscal stability. Meanwhile, policy for reducing barrier on trade and investment was able to foster direct investment that flowed into Indonesia. In addition, the increased price of export commodities in foreign countries boosted Indonesia’s total export. All sorts of factors indicated the improvements of Indonesia macro economy during 2007 significantly.
In general, economic indicators were better than those of in 2006. Economic growth reached the target; controlled inflation, stability of rupiah, and the decline trend of Bank Indonesia Certificate (SBI) have already assigned positive influence to economy aggregately. The positive influence was proven by the increase of social welfare; income per capita was increase from Rp 15,000,000 in 2006 to Rp 17,600,000 in 2007, the decrease percentage of poor people who lived under the poverty line, and the improvement of fiscal condition. Government has been keeping continue its effort in improving fiscal condition by reducing subsidy program that burden the budget, among other through energy conversion from oil and kerosene to liquid propane gas (LPG).
The better fiscal condition supported by domestic financial resources has facilitated the government to create autonomy in economy. It was proven by acceleration of foreign debt payment so that debt ratio to GDP has declined significantly. In 2005, debt ratio to GDP was 47% then in 2006 it was decline to 39%, and in 2007 it was around 35%. As one indicator of fiscal sustainability, the decline of debt ratio to GDP showed that the budget was healthier so that there was more possibility for bigger allocation of the budget on many development sectors especially for improving Indonesian people welfare.
The government has been keeping encourage the existence of domestic financing sources because it is more safe than foreign financing and it minimize budget risk from fluctuation of exchange rate, interest rate, and due date extension risk. The domestic financing sources consist of government bond (SUN), dividend from state owned companies, and others. In addition, the reverse capital flows in short term and long term that kept flow into Indonesia also supported better performance of balance of payment.
Further, the government needs to keep watch and anticipate various possibilities of fiscal problems in the future concerning to the implementation of all economic policy in taxation, trading, and the risk of government bond issuance for domestic financing, the increase of interest payment in the next three years. The government also need to put more concern on employment sector in order to solve unemployment
3

problem. Therefore creating good climate for investor both domestic and foreign is quite important to absorb more work forces.
Macroeconomic Activity International Environment
During 2007 Indonesia’s balance of payment showed positive performance. The surplus US$ 12.5 billion of balance of payment created increase in foreign exchange reserve to $ 56.9 billion equivalent to 5.7 months of imports and repayment of government foreign debt. It recorded a surplus 2.5% of GDP came from current account while from capital account recorded 1.3% of GDP. The higher commodity prices in international market and strong global demand driven the surplus of current account. Meanwhile, the more attractive return on rupiah in domestic financial market and the stability of domestic macro economy supported the surplus in capital and financial account.
The impact of slowing the US economy on global economy was compensated by significant growth in developing countries like China and India. Yet global economic expansion that showed good performance in first semester 2007 was halted due to fluctuation in global financial market as a result of US sub-prime mortgage crisis in the second semester of 2007. It caused reversal of private capital flow from developing countries. But the strength of emerging market countries economy pulled back foreign investor’s interest so that induced positive atmosphere of Indonesia financial markets.
Table 1: Indonesia Balance of Payment millions of US$
Description 2005 2006 2007 I. Current Account 278 10,836 11,009 A. Goods, net (Balance of Trade) 17,534 29,660 33,083 - Exports, fob 86,995 103,528 118,014 - Imports, fob -69,462 -73,868 -84,930 1. Non-Oil & Gas 13,321 22,875 27,048 - Exports 66,753 80,578 93,142 - Imports -53,431 -57,703 -66,094 2. Oil & Gas 4,212 6,785 6,036 - Exports 20,243 22,950 24,872 - Imports -16,030 -16,165 -18,836 B. Services, net -9,122 -9,888 -11,103 C. Income, net -12,927 -13,800 -15,875 D. Current Transfer, net 4,793 4,863 4,903 II. Capital & Financial Account 345 2,944 2,753 A. Capital Account 333 350 530 B. Financial Account 12 2,594 2,223 1. Direct Investment 5,271 2,211 1,164 2. Portfolio Investment 4,190 4,174 6,981 3. Other Investment -9,449 -3,792 -5,922 III. Total (I+II) 623 13,780 13,726 IV. Net Errors and Omissions -179 729 -1,220 V. Overall Balance (III+IV) 444 14,510 12,543 VI. Reserved and Related Items -444 -14,510 -12,543 A. Reserve Assets Changes 663 -6,902 -12,543 B. IMF Purchases -1,107 -7,608 0 1. Withdrawal 0 0 0 2. Payment -1,107 -7,608 0 Memorandum : Reserve Asset Changes 34,724 42,586 56,920 (In months of imports and official 4.0 4.5 5.7 foreign debt repayment) 1) (-) surplus; (+) deficit
4

Table 2: Indicators of External Vulnerability (percent)
Description 1996 1997 2005 2006 2007 Current Account / GDP -3.4 -2.3 0.1 2.9 2.5Exports of goods & services / GDP 25.7 29.1 37.5 33.5 32.0Non-Oil & Gas Exports / GDP 16.7 19.7 23.1 21.8 21.2Foreign Debt Interest / GDP 2.7 3.0 1.0 1.3 1.2Foreign Debt Payments / Exports of goods & services 35.9 44.5 17.3 24.8 19.2Capital Flow / GDP 4.8 1.1 0.1 0.7 1.3Foreign Debt / Exports of goods & services 188.7 207.3 120.7 104.1 97.3Foreign Debt / GDP 48.5 60.3 45.3 34.9 31.2International Reserves / Debt Services 91.2 73.4 185.6 138.8 210.8International Reserves / Foreign Debt 17.4 15.7 26.6 33.1 41.7International Reserves / Imports & Government Foreign
Debt Payments (months) 5.0 5.5 4.3 4.5 5.7
Foreign Debt (billions $) 110,171 136,088 130,652 128,736 136,640 International Reserves (billions $) 19,215 21,418 34,724 42,586 56,920
Source: Bank Indonesia and BPS-Statistics Indonesia 1) Debt Service Ratio (DSR) increase in 2006 due to IMF debt repayment. 2) Foreign debt repayments including principal and interest. 3) In 1996 and 1997, the international reserves division did not include payments on government foreign debt. 4) In 1996, the concept of official reserve was used. In 1997-1999 based on Gross Foreign Assets, and beginning of 2000, the
International Reserves and Foreign Currency Liquidity (RFCL) concept was used.
(1) Current Account In 2007 the current account increased US$ 0.2 billion to US$ 11.0 billion compared to 2006 or 2.5%
of GDP. Indonesia’s export recorded fairly large increase because of the rising prices of commodities in international market and strong external demand. The increase of non-oil and gas export was pushed by greater production capacity. Oil and gas export also contributed increase volume of crude oil exports although the production has been declined each year due to limited natural resources. In the part of imports, the amount of imports was also increase because of higher demand for economic activities and the stability of rupiah exchange rate. Oil and gas import especially crude oil was increase in order to fulfill the needs of domestic refinery.
The service account and the income account recorded a higher deficit compared to 2006. The increase deficit in service account was related to the increase number of Indonesian people going abroad, while for the income account was related to the increase in profit transfer from foreign company in Indonesia to their head office. For current transfer account, the surplus was relatively similar to the previous year. It was increase slightly compared to 2006. (2) Export Table 3: Exports
2006 2007 2007 Share Description
Changes (%) Value Millions of US$ (%)
Non-Oil and Gas Exports 20.7 15.6 93,142 78.9 Agriculture 255.4 14.7 11,704 9.9 Mining 130.1 17.2 21,609 18.3 Industry -7.0 15.2 59,829 50.7Oil and Gas Exports 13.4 8.4 24,872 21.1Total 19.0 14.0 118,014 100.0
Source: Bank Indonesia and BPS-Statistics Indonesia
5

During 2007 in general Indonesia’s export experienced increase 14% to US$ 118.0 billion because the
price commodities in international market were increase. The increase was driven mainly by non-oil and gas exports that took 78.9% of total exports.
Export destination countries are still dominated by five main countries i.e. Japan (14.3%), the US (12.0%), Singapore (9.6%), China (7.3%), and India (5.3%). The share of non-oil and gas export to the US, Japan, and the European region are currently around 40% of the total, or down from 50% in 2000. The decline trend is favorable for Indonesia’s export performance in anticipating the economic slowdown in the developed countries. Table 4: Major Non-Oil and Gas Export Commodities Share by Country of Destination
Japan United States Singapore China India Commodities Share Commodities Share Commodities Share Commodities Share Commodities ShareMetal Ores & Metal Residual
4.22% Garments 3.84% Electrical Machines, Tools & Fittings
1.35% Fixed Vegetable Oil & Fats
1.33% Fixed Vegetable Oil & Fats
2.36%
Coal, Coke & Briquettes
1.40% Crude Rubber 1.29% Office Machinery & Automatic Data Processing
1.05% Metal Ores & Metal Residual
0.82% Coal, Coke & Briquettes
0.93%
Nonferrous Metal
1.23% Fish & Crust 0.81% Nonferrous Metal
0.98% Crude Rubber 0.78% Metal Ores & Metal Residual
0.57%
Electrical Machines, Tools & Fittings
0.93% Manufacturing Goods
0.62% Telecommunication & Rep App
0.64% Organic Chemicals
0.59% Fixed Animal Oil, Vegetable & Fats
0.12%
The types of non-oil and gas export commodities were quite mixed. Major commodities exported to
Japan and the US was metal ores and garments, respectively. Exports to Singapore were electrical machines, tools and fitting. Meanwhile exports to China and India were dominated by vegetable oil and fats.
(3) Import
In 2007, import growth was quite significant in line with the increase of domestic economic growth. Non-oil and gas import grew 14.6% and oil and gas import grew 16.7%. Overall, total imports grew by 15.0% to US$ 92.4 billion.
In part of non-oil and gas import, consumption goods took the highest changes which rose 46.8% driven by the stability of rupiah. Nevertheless it might indicate the decline of domestic product competitiveness. Meanwhile, raw material and capital goods that rose 12% and 11% respectively showed the expansion of domestic economy. Table 5: Imports
2006 2007 2007 Value ShareDescription
Changes (%) Millions of US$ (%)
Non-Oil and Gas Imports 8.0 14.6 71,907 78.2 Consumer Goods 18.4 46.8 7,241 6.1 Raw Material 7.8 12.0 50,502 56.1 Capital Goods 5.4 11.0 14,164 15.9Oil and Gas Imports 3.0 16.7 20,474 21.8Total 6.9 15.0 92,381 100.0
6

The origin countries of the import commodities were relatively remain the same as in 2006. They were
Singapore, Japan, China, the US and Thailand. In recent years, import from China is increase due to competitive price of its products. The proportion of goods imported from China is already as large as the proportion of imported from Japan. While imports from the US and Japan tend to decline. Table 6: Major Non-Oil and Gas Import Commodities Share by Country of Origin
Singapore Japan China United States Thailand
Commodities Share (%) Commodities Share
(%) Commodities Share (%) Commodities Share
(%) Commodities Share(%)
Electrical Machines, Tools & Fittings
2.24 Motor Vehicles
1.92 Iron & Steel 1.65 Other Transportation Equipment
0.89 Motor Vehicles
1.53
Telecommunication & Rep. App
1.44 Iron & Steel 1.56 Telecommunication & Rep. App
1.23 Industrial Machinery & Fitting
0.54 Sugar & Honey
0.49
Organic Chemicals
1.43 Specialized Industrial Machinery
1.25 Electrical Machines, Tools & Fittings
0.96 Textile Fiber & their waste
0.53 Industrial Machinery & Fittings
0.43
Office Machines& Automatic Data Processing
1.10 Industrial Machinery & Fittings
1.23 Textile, Textile Yarn & Textile Products
0.93 Oil Ores, Nuts & Seed Oil
0.52 Electrical Machines, Tools & Fittings
0.38
(4) Services, Income, and Current Transfer
Services accounts recorded higher deficit compare to previous year, from US$ 9.8 billion to US$ 11.1 billion or rose around 13%. The increase deficit was driven by the hike of transportation cost and the increase number of Indonesian tourists who going abroad, including travel for Hajj and Umroh.
The same situation was also happened to income account which experienced deficit US$ 15.9 billion or rose 15% compared to the previous year. The deficit was resulted by an increase in the profits transferred and the reinvested earnings of multinational companies in Indonesia. It reflected the better business climate in Indonesia.
Meanwhile, the current transfer account showed a surplus amount US$ 4.9 billion. The surplus increased by 7% compared to 2006. The main source of current transfer account was money transfers made by Indonesian overseas workers. In 2007, the wage of Indonesian overseas workers was increase in a number of countries and especially in the Middle East.
(5) The Capital and Financial Account Table 7: Portfolio Investment (Liabilities Side) million of US$
Description 2005 2006 2007 Public Sector, net 4,826 4,514 5,270Foreign Exchange Bond 2,095 1,930 1,425Government Securities 2,054 2,209 2,612SBIs 677 375 1,233Private Sector, net 444 1,593 4,711Stocks -165 1,898 3,559Corporation Securities 609 -305 1,152Total 5,270 6,107 9,981
7

The capital and financial account recorded a lower surplus of US$ 2.8 billion compared to the previous
year. Based on its composition, the net inflow of portfolio investment was still quite dominant, foreign direct investment showed positive developments, and other investment account recorded higher deficit. During 2007, the total surplus of the portfolio investment transactions reached US$ 7.0 billion or higher than in the previous year. From the external side, the increases in portfolio capital inflows were still supported by significant liquidity in the global financial market. From the domestic side, the increased surplus stemmed from improved confidence in macroeconomic condition and economic prospect. Based on each component, portfolio investment on the liabilities side recorded higher surplus of US$ 10.0 billion. In the public sector, the increased surplus was contributed by rupiah denominated SUN and SBI, while the contribution from foreign currency denominated SUN declined. In the private sector, the increased surplus was contributed by foreign purchase of stocks and bonds issued by domestic companies. Table 8: Other Investment Transaction
Description 2005 2006 2007 Other Investment, net (Public Sector) -848 -2,497 -2,363 Assets 0 0 0 Liabilities -848 -2,497 -2,363Other Investment, net (Private Sector) -8,601 -1,296 -3,559 Assets -8,646 -1,588 -5,633 Liabilities 45 292 2,075Total -9,449 -3,793 -5,922
In the case of other investment account, it recorded a higher deficit than in the previous year, which is
of US$ 5.9 billion. In the public sector, other investment transaction recorded lower deficit of US$ 2.4 billion. This reflects government policy in reducing the burden of foreign debts by adopting a strategy that withdrawals should be lower than debt repayments. At the beginning of 2007, CGI forum was scrapped in order to create flexibility in the management of government foreign debt conducting on a bilateral basis. The scrapping of CGI did not immediately bring a drastic decline in draw-downs of government debts. Although the draw-down of project loans declined, draw-down of program loans increased. In the private sector, the other investment transaction recorded a higher deficit to US$ 3.6 billion. One factor causing the increase in deficit was capital outflows recorded on the asset side in the form of savings owned by residents living overseas. Based on experience, these capital outflows can become a source of supply of foreign currencies if there is a shock which results in increased demand for foreign currencies in the domestic market. This phenomenon is also one factor which can explain the relative stability in the movement of the rupiah exchange rate amidst uncertainty in global financial markets. (6) Exchange Rate and Exchange System
The rupiah exchange rate was quite stable in 2007 although it faced downturn in late of July. Average value of the rupiah reached to Rp 9,140 per US dollar which appreciated 0.3% compared to Rp 9,167 per US dollar in the preceding year. The stability of rupiah was also reflected by decreasing volatility from 3.9% in 2006 to 1.4% in 2007. The favorable situation of rupiah was supported by well-controlled inflation, consistent and prudent macroeconomic policies, and improvement in risks and continued attractiveness of yield on rupiah that helped boost market confidence in rupiah. Nevertheless by the end of 2007 the value of rupiah weakened by 4.2% to level of Rp 9,393 per US dollar. It was triggered by the unfolding of sub-prime mortgage crisis and the hike of oil price.
8

Figure 1: Average Rupiah Exchange Rate
8,400
8,600
8,800
9,000
9,200
9,400
9,600
Jan
Mar Mei Jul
Sep Nov Jan
Mar Mei Jul
Sep Nov
2006 2007
Rp/
$Monthly Average Quarterly Average Annual Average
(7) Foreign Direct Investment
The inflow foreign direct investment (FDI) was increase to US$ 5.6 million in 2007, nevertheless it was offset by an increase in the outflow FDI amounted US$ 4.4 million. As a result the surplus of net FDI in 2007 was decrease to US$ 1.2 million compared to the preceding year it reached surplus US$ 2.2 million. The largest portion of inflow FDI was contributed by non-oil and gas investment reaching US$ 4.6 million. The sources of inflow FDI are from overseas parent company’s loan withdrawals, increasing capital by parent company, and reinvested earnings. FDI in oil and gas sector was also increase to US$ 0.9 million. As the price of crude oil has soared, government has been trying to raise oil production through direct bidding of a number oil and gas blocks since 2006. During 2007, there were 35 upstream projects and 26 oil and gas blocks with total commitment reaching US$ 13.0 billion that could be obtained by the government. Table 9: Foreign Direct Investment millions of US$
Description 2005 2006 2007 FDI (net) 5,271 2,211 1,164 Abroad (net) -3,065 -2,703 -4,407 In Indonesia (net) 8,336 4,914 5,571 Non-Oil and Gas 7,282 4,122 4,633 Oil and Gas 1,054 793 938
The government has already made various efforts to attract foreign investors to invest in Indonesia.
The objective of the effort is to improve business certainty. Through Law no. 25/2007 of foreign investment and Presidential Instruction no. 6/2007 of policies to accelerate the development of the real sector and the empowerment of micro, small and medium size businesses, government guarantees the certainty of foreign business in Indonesia from the risk of nationalization, the determined of open and closed business sectors, and integrated services of better structured bureaucracy. In 2007 many rating
9

agencies raised their sovereign rating for Indonesia, Moody’s, Rating and Investment, and Japan Credit Rating Agency raised Indonesia Investment’s rating to Ba3, BB+, and BB, respectively.
(8) Borrowing From Abroad
The position of foreign debt rose to US$ 136.6 billion in 2007. Nevertheless the ratio of foreign debt toward GDP continued to decline to 31.2%, while in 2006 the ratio was 34.9%. The ratio of foreign debts toward exports was also decrease to 97.3%. These two indicators show a continued improvement from the critical level as defined by the World Bank. Meanwhile the ratio of foreign debt payment to exports of goods and services was below the critical level of 20% i.e. 19.2%. Table 10: Indonesia’s Foreign Debt Position
millions of US$ 2007 Notes 2005 2006 March June September December
Government 75,406 67,722 69,085 66,155 68,088 69,340 Private 48,601 50,983 51,127 52,073 53,641 53,909 a Financial Institution 6,371 6,560 6,992 6,900 6,948 7,465 Bank 4,042 4,544 4,963 4,935 4,837 5,351 Non-Bank 2,329 2,017 2,029 1,965 2,111 2,114 b Non-financial Institution 42,229 44,423 44,135 45,173 46,693 46,444 Securities 6,646 10,031 11,071 15,253 15,218 13,391 - Government 4,666 8,087 9,105 13,233 13,147 11,269 - Bank 15 30 47 75 52 50 - Non-financial Institution 1,965 1,914 1,919 1,944 2,019 2,073 Total 130,652 128,736 131,283 133,482 136,947 136,640
* Provisional figures Domestic Environment (1) Economic Growth Rate (GDP)
After slipping to 5.5% (yoy) in 2006, economic growth mounted significantly in 2007 to 6.3% (yoy). It reached the highest level since the outbreak of the economic crisis. The economic growth was marked by stronger public purchasing power, relatively strong export on the demand side, and higher level of growth of all economic sectors on the supply side.
10

Table 11: GDP Growth and GDP Components Distribution on Demand Side 2007 Items 2004 2005 2006 I II III IV 2007
Total Consumption 4.9 4.3 3.9 4.6 4.6 5.3 5.1 4.9 Private Consumption 5.0 4.0 3.2 4.7 4.7 5.1 5.6 5 Government Consumption 4.0 6.6 9.6 3.7 3.8 6.5 2 4Investment 14.2 10.8 2.9 7 6.9 10.4 12.1 9.1Domestic Demand 9.1 5.3 3.3 -0.8 3.4 4.4 9.6 4.2
Net Export -
23.1 13.6 15.6 6.8 25 6.7 -14.2 6.1 Exports of Goods and Services 11.1 16.4 9.2 8.1 9.8 6.9 7.3 8 Imports of Goods and Services 25.2 17.1 7.6 8.5 6.5 7 13.6 8.9GDP 4.9 5.7 5.5 6.1 6.4 6.5 6.3 6.3Distribution of GDP (%) Total Consumption 68.2 67.3 66.3 64.4 65.2 63.8 68.2 65.4 Private Consumption 60.6 59.6 58.3 57.8 57.3 56.3 58.9 57.6 Government Consumption 7.6 7.7 8.0 6.5 7.9 7.4 9.3 7.8Investment 21.4 22.5 21.9 21.5 22 22.5 23.6 22.4 Exports of Goods and Services 41.1 45.2 46.8 47 48 46.9 49.1 47.8 Imports of Goods and Services 32.8 36.3 37.0 36.8 38.2 38.8 40.2 38.5
Source: BPS-Statistics of Indonesia (2) Consumption
Growth on private consumption expanded at the rate of 5% in 2007 that was stimulated by renewed public purchasing power. It was influenced by rising salaries around 13% in formal sector and improving wages on a modest scale in informal sector. The improved purchasing power was also supported by the increase of consumption credit and non-bank financing.
Based on by component, growth in both food and non-food consumption mounted higher in comparison to 2006. Increased non-food consumption was reflected in the significant rise in sales of motor vehicle and electronic products. Meanwhile government consumption experienced 4% of growth, which reflected a slowing growth trend as compared to the 9.6% recorded in the previous year. The slowdown expenditures took place mainly due to increased caution in carrying out government auctions for the procurement of goods and services and also economized Ministry/Institution spending in anticipation of increased needs for payments of energy subsidies.
(3) Investment
Investment grew with more robust expansion compared to the preceding year. In 2007, it expanded to 9.2% (yoy), a significant improvement over the 2.5% growth in 2006. Accelerated investment growth was driven mainly by 10.1% rise in non-construction investment. In contrast, construction investment was stable with growth at 8.6% (yoy). Also contributing to investment performance was improved efficiency in use of capital as more investment flowed into technology-intensive sectors.
11

Figure 2: Incremental Capital Output Ratio (ICOR)
3.5
3.6
3.7
3.8
3.9
4
4.1
4.2
4.3
2003 2004 2005 2006 2007
Year
Perc
enta
ge
The incremental capital output ratio (ICOR) was 3.8 in 2007 that reflected improvement as compared to 4.2 in 2006 and the average for the past four years. The share of investment to real GDP slightly increased to 22.4%, despite still bellow the all-time 29% high during the pre-crisis period. (4) Net Exports
Exports of goods and services forged ahead, driven by high world demand. Export recorded 8.0% growth (yoy) in 2007, despite some slowing compared to the preceding year. The major factor fuelling export growth was robust world demand in the first half of 2007. Towards the end of 2007, external factors began to deteriorate global demand from the effects of the ongoing US sub-prime mortgage crisis. However, the crisis had brought no significantly impact on export growth.
With economic activity gathering pace, imports of goods and services also grew more vigorously than in 2006. The 8.9% (yoy) growth in these imports was attributable largely to robust expansion in imports of consumer goods and raw materials. The upswing in consumer goods imports came in response to invigorated private consumption fuelled by rising purchasing power. Import of raw materials and capital goods also mounted in support of rising levels of production and investment. Import growth was especially strong during the second half of 2007, in line with the upward trend in domestic demand.
12

Table 12: GDP Growth and GDP components Distribution on Supply Side 2007 Items 2004 2005 2006
I II III IV 2007
Growth (%) Agriculture 2.8 2.7 3.4 -1.7 4.7 7.6 3.1 3.5Mining and Quarrying -4.5 3.2 1.7 6.2 3.2 1.0 -2.1 2.0Manufacturing 6.4 4.6 4.6 5.2 5.1 4.5 3.8 4.7Electricity, Gas and Water Supply 5.3 6.3 5.8 8.2 10.2 11.3 11.8 10.4Construction 7.5 7.5 8.3 8.4 7.7 8.3 9.9 8.6Trade, Hotel and Restaurant 5.7 8.3 6.4 9.2 7.6 7.9 9.1 8.5Transportation and Communication 13.4 12.8 14.4 13 12.7 14.1 17.4 14.4Finance, Rental and Business Services 7.7 6.7 5.5 8.1 7.6 7.6 8.7 8.0Services 5.4 5.2 6.2 7.0 7.0 5.2 7.2 6.6GDP 5 5.7 5.5 6.1 6.4 6.5 6.3 6.3
Distribution of GDP (%) Agriculture 14.9 14.5 14.2 13.8 14.4 15.1 11.9 13.8Mining and Quarrying 9.7 9.4 9.1 9.1 8.8 8.4 8.6 8.7Manufacturing 28.4 28.1 27.8 27.5 27.3 27.1 27.6 27.4Electricity, Gas and Water Supply 0.7 0.7 0.7 0.7 0.7 0.7 0.7 0.7Construction 5.8 5.9 6.1 6.1 6.1 6.1 6.5 6.2Trade, Hotel and Restaurant 16.4 16.8 16.9 17.1 17.1 17.2 17.7 17.3Transportation and Communication 5.8 6.2 6.8 6.9 7.1 7.2 7.9 7.3Finance, Rental and Business Services 9.1 9.2 9.2 9.4 9.3 9.1 9.6 9.4Services 9.2 9.2 9.2 9.3 9.3 9.0 9.5 9.3
On the supply side, almost all sectors recorded improved growth compared to 2006, except for the
transportation and communication that was constant. The leading growth sectors in 2007 were transportation and communication, electricity, gas and water supply, construction, and trade, hotel and restaurant sector. At the same time, manufacturing and agriculture, the major pillars of the economy reported improved growth compared to 2006.
Rising domestic demand and strong exports stimulated growth in manufacturing. Manufacturing growth in 2007 reached 4.7%, slightly ahead of 4.6% growth in 2006. Key to this growth was performance in the transportation equipment, machinery and tools sub-sector and the food, beverages and tobacco sub-sector. Nevertheless, this sector recorded slowing trend of growth near the end of the year, with flagging growth reported in textile industry. Factors contributing to flagging performance were market penetration by low-priced imports, especially from China, and slow progress in the textile industry machinery restructuring program supported by subsidized bank credit.
The trade, hotels and restaurants sector reached 8.5% growth in 2007, up from the 2006 level of 6.4%. The higher growth was explained mainly by mounting performance in the trade sub-sector, with growth up from 6.6% in 2006 to 8.9% in 2007. The upswing of trading activity derived from strengthening public consumption. The hotels and restaurants sub-sector also forged ahead with growth reflected in higher hotel occupancy rates and tourist arrivals.
In agricultural sector, growth reached 3.5%, up slightly from the 2006 growth of 3.4%. The increase came largely from stronger performance in the food crop sub-sector, and especially the paddy crop, a major factor in agricultural sector growth. Paddy production was up in response to improved productivity in Java and expansion of agricultural land outside Java.
The mining and quarrying sector registered increased growth at 2.0% in 2007, mainly on the strength of non-oil and gas sector. The major growth commodities in this sub-sector were coal and nickel ore. Oil and gas sub-sector growth was negative due to falling productivity, closure of some oil wells, and low levels of investment in this sector.
13

The transport and communication sector grew by a robust 14.4%, as in the previous year. Growth in the communication sub-sector was driven by strong competition among telephone operators. This has led to more aggressive innovation and business expansion that has in turn fuelled growth in numbers of telephone subscribers, with cellular telephones in the lead. The transportation sector, however, experienced decline growth because of the spate of accidents involving various modes of transportation at the beginning of the year.
Growth was also recorded by construction sector at 8.6% compared to 8.3% in 2006. Key to resurgent construction was investor confidence in rising public purchasing power and the various measures taken by the government for implementation of infrastructure projects. Expansion in the construction sector was reflected in high growth in commercial properties, including shopping centers, apartments and condominiums. (5) Inflation
The Consumer Price Index (CPI) got hold of 6.59% corresponding to the target range set by the government at 6.0% +/- 1.0%. The index was relatively stable compare to the preceding year i.e. 6.60%. The stability of CPI was induced by betterments in non-fundamental factors as well as controlled fundamental factors. The two main reasons on the side of non-fundamental factors were lower volatile food inflation and unvarying government policies in administered prices of strategic goods such as fuel and electricity tariffs. Volatility food inflation contributed a decline from 2.75% in 2006 to 2.09% in 2007. The lower volatile food inflation was able to offset the increased inflation contribution from core inflation and administered prices.
Table 13: Contribution of Core Inflation
percent (yoy) Core Volatile Foods Administered Prices CPI
Year Inflation Contribution Inflation Contribution Inflation Contribution Inflation
2006 6.03 3.48 15.27 2.75 1.84 0.37 6.602007 6.29 3.75 11.41 2.09 3.30 0.75 6.59
Even though the administered price inflation was relatively low, it increased slightly from 1.84% in
the previous year to 3.30% in 2007. It was affected by the implementation of non-strategic administered price such as the increase of retail price of cigarette at 7% in March 2007, the imposition of custom tariff on cigarette since July 1, 2007, the increase of water price in some cities, the increase of highway tariff, and the increase of non-subsidy gasoline. In addition, administered prices inflation was also influenced by, among others, the policy of energy conversion, from kerosene to LPG. The implementation of this policy stimulated the increase price of kerosene. Further, the scarcity of LPG in some regions contributed to higher inflation as well.
From the fundamental side, core inflation recorded 6.29%, increase slightly compared to the previous year 6.03%. The higher of the inflation was due to the pressure of imported inflation. It correlated with the increase of international commodities prices such as crude oil, crude palm oil, gold, and grain/wheat. Fortunately, the pressure could be reduced barely by the stability of rupiah exchange rate.
14

Figure 3: CPI Inflation by Category of Goods Percent (yoy)
1.02
8.13
5.87
6.84
4.88
6.36
12.94
1.25
8.83
4.31
8.42
4.83
6.41
11.6
0 2 4 6 8 10 12 14
Transport at ion, Communicat ion, & Financial Services
Educat ion, Ent ert ainment , & Sport
Healt h
Clot hing
Housing
Food, Beverages, & Cigaret t es
Foodst uf f s
2006 2007
Source: BPS-Statistics Indonesia (6) Money Supply
Narrow money (M1) and broad money (M2) that reflected the economic liquidity expanded significantly in 2007. By the end of December, M1 recorded growth 27.6%, to Rp 460.8 trillion and M2 grew 18.9%, to Rp 1,643.2 trillion. The expansion of economic liquidity was influenced mainly by domestic factors. In December 2007, claims on business sector increased by Rp 208.0 trillion. Of this total, Rp 154.0 trillion comprised credit extended in rupiah, while the remaining Rp 54 trillion, equivalent to US$ 5 billion, was loans extended in foreign currencies.
External factors reflected in net foreign assets, recorded growth 27.0% or representing an increase of Rp 111.4 trillion. The increase took place in net foreign assets held by Bank Indonesia in line with the hefty rise international reserves from oil and gas revenues generated by soaring world oil price. Meanwhile, net foreign asset of banking system recorded a decline, particularly in foreign assets held in call money and demand deposits at overseas banks.
15

Table 14: Changes in Money Supply and Its Affecting Factors 2006 2007 2006 2007 Items
Billions Rp Growth (%) Money Supply M2 1,382,074 1,643,203 14.87 18.89 M1 361,073 460,842 28.08 27.63 Currency 151,009 183,419 21.47 21.46 Demand Deposits 210,064 277,423 33.3 32.07 Quasi Money 1,021,001 1,182,361 10.82 15.8 Affecting Factors Net Foreign Assets 413,265 524,703 32 26.97 Net Domestic Assets 968,809 1,118,500 8.84 15.45 Net Claims on Central Government 506,488 497,478 1.52 -1.78 Net Claims on IBRA 0 0 Claims on Private Sector 787,136 995,111 14.13 26.42 Other Claims 49,936 45,885 1.55 -8.11 Net Other Items -374,751 -419,974 7.81 12.07
(7) Employment Figure 4: Labor Force, Working, and Unemployment
0
20
40
60
80
100
120
Feb-05 Nov-05 Feb-06 Aug-06 Feb-07 Aug-07
milli
ons
of p
eopl
e
0
2
4
6
8
10
12
perc
ent
Labor Force Working Unemployed Open Unemployment (Right Axis)
The number of Indonesia’s workforce in August 2007 was recorded at 109.9 million. It was increased
by 3.6 million compared to August 2006. Fortunately, this situation was also accompanied with higher number of workers in employment. In August 2007, total employed population was increased by 4.5 million. Of this working population, 69.1% was employed in the informal sector and the remaining was in the formal sector. The increased absorption of labor contributed to a decline in the percentage of open unemployment to 9.1% in August 2007 compared to 10.3% in August 2006.
16

Table 15: Employment by Sectors
2006 2007 Growth of Labor Force (%) Sectors
February August February August 2005-2006 2006-2007Agriculture 42,323.2 40136.2 42,608.8 41,206.5 -2.84 2.67Mining 947.1 923.6 1,020.8 994.6 2.14 7.69Manufacturing 11578.1 11890.2 12,094.1 12,368.7 -0.53 4.02Electricity, Gas and Water 207.1 228.0 247.1 174.9 17.17 -23.3Supply 4374.0 4697.4 4,397.1 5,252.6 2.89 11.82Construction 18555.1 19215.7 19,425.3 20,554.7 7.3 6.97Trade 5467.3 5664.0 5,575.5 5,958.8 0.2 5.21Transportation 1153.3 1346.0 1,252.2 1,399.5 17.88 3.97Finance 10572.0 11355.9 10,962.4 12,020.0 9.96 5.85Services 95177.1 95456.9 97,583.1 99,930.2 1.59 4.69
Source: BPS-Statistics Indonesia
In regard to the sectors, Indonesian workforces mostly work in agriculture sector (41%), trade (20.6%), and manufacturing (12.4%). During 2007, these sectors were able to absorb new workers at the rate of 2.7%, 7%, and 4%, respectively. Figure 5: Workers Population Aged 15 and Above Based on Education Level
0
5
10
15
20
25
30
35
40
Nov 2005 Aug 2006 Aug 2007
Perc
ent
Not Attending Formal Education Not Finished Elementary School Elementary
Junior High School High School Diploma
University
Source: BPS – Statistics Indonesia
17

Based on educational background, over 35% of Indonesian workers have only elementary education, followed by workers with junior high school, senior high school, no formal education, not finished elementary school, university, and diploma. As a consequence, the number of less educated unemployment was decrease in contrast the number of more highly educated unemployment of the workforce was increase.
Table 16: Unemployment by Education
(Percentage of total unemployment) Education August 2006 August 2007
Not Attending Formal Education 1.6 0.9Not Finished Elementary School 5.6 4.4Elementary 23.7 21.8Junior High School 25.0 22.6High School 38.0 40.7Diploma 2.5 4.0University 3.6 5.7Total 100 100
Source: BPS – Statistics Indonesia
18

Fiscal Position Table 17: Summary of Government Finance and Operation
Realization in 2006 Budget 2007 Revised Budget 2007 Realization in 20071
Description Trillion
Rp %
GDP %
yoy
% of Revised Budget
Trillion Rp
% GDP
Trillion Rp
% GDP
Trillion Rp
% GDP
% yoy
% of Revised Budget
A. Total Revenues and Grants 638.0 19.1 28.8 96.8 723.1 20.5 694.1 18.5 708.5 18.7 11 102.1 I. Domestic Revenues 636.2 19.1 28.8 97.1 720.4 20.4 690.3 18.4 706.8 18.7 11 102.4 1. Tax Revenues 409.2 12.3 17.9 96.3 509.5 14.4 492 13.1 491.8 13 20 100 2. Non-Tax Revenues 227 6.8 54.5 98.7 210.9 6 198.3 5.3 215 5.7 -5.3 108.4 – Oil and Gas 158.1 4.7 52.4 98.9 139.9 4 107.7 2.9 124.8 3.3 -21 115.9 II. Grants 1.8 0.1 40.6 43.3 2.7 0.1 3.8 0.1 1.7 0 -7.6 44.3B. Total Expenditures 667.1 20 30.9 95.4 763.6 21.6 752.4 20 757.2 20 14 100.6 I. Central Government 440.9 13.2 22.8 92.2 504.8 14.3 498.2 13.2 504 13.3 14 101.2 Expenditures a. Personnel Expenditures 73.3 2.2 35 92.6 98.5 2.8 98 2.6 90.4 2.4 23 92.3 b. Goods Expenditures 47.2 1.4 61.7 84.3 71.9 2 61.8 1.6 54.2 1.4 15 87.7 c. Debt Interest Payment 79.1 2.4 21.3 95.9 85.1 2.4 83.6 2.2 79.6 2.1 0.6 95.2 d. Subsidies 107.4 3.2 -11 99.8 103 2.9 105.1 2.8 150.2 4 40 142.9 e. Capital Expenditures 55 1.6 67.1 78.8 76.9 2.2 71.7 1.9 64.4 1.7 17 89.8 f. Grants Expenditures 0 0 0 0 0 0 0 0 0 0 0 0 g. Social Assistance 40.7 1.2 63.5 99.2 50.7 1.4 52.3 1.4 50.7 1.3 25 97.1 h. Other Expenditures 38.3 1.1 19.9 90.7 18.8 0.5 25.8 0.7 14.6 0.4 -62 56.4 II. Regional Budget 226.2 6.8 50.3 102.4 258.8 7.3 254.2 6.8 253.3 6.7 12 99.6C. Primary Balance 49.9 1.5 --- 117.5 44.6 1.3 25.3 0.7 30.8 0.8 --- 121.9D. Budget Surplus/(Deficit) -29.1 -0.9 --- 72.9 -40.5 -1.1 -58.3 -1.5 -48.8 -1.3 --- 83.7E. Financing 29.1 0.9 --- --- 40.5 1.1 58.3 1.5 48.8 1.3 --- --- I. Domestic Financing 55.7 1.7 --- --- 55.1 1.6 70.8 1.9 72.7 1.9 --- --- 1. Domestic Bank 18.6 0.6 --- 103.9 13 0.4 10.6 0.3 14.9 0.4 --- 140.3 2. Domestic Non-Bank 37.1 1.1 54.9 99.3 42.1 1.2 60.2 1.6 57.8 1.5 56 96.1 a. Privatization (net) 0.4 0 40 2 0.1 2 0.1 0.3 0 -25 15 b. Sales of Banking 2.7 0.1 -59 104.7 1.5 0 1.7 0 2.4 0.1 --- 144.8 Restructuring Program c. Government Bond 36 1.1 59.4 100.6 40.6 1.1 58.5 1.6 57.1 1.5 59 97.6 Sales, net d. GovernmentInvestment -2 -0.1 -62 100 -2 -0.1 -2 -0.1 -2 -0.1 --- 100
Funds II. Foreign Financing (net) -26.6 -0.8 159 173.9 -14.6 -0.4 -12.5 -0.3 -23.9 -0.6 -10 190.6 1. Foreign Withdrawal (gross) 26.1 0.8 -2.7 69.5 40.3 1.1 42.2 1.1 34 0.9 30 80.5 2. Amortization -52.7 -1.6 42 99.7 -54.8 -1.6 -54.8 -1.5 -57.9 -1.5 9.9 105.8Assumptions: Economic Growth (%) 5.5 --- --- --- --- 6.3 --- 6.3 --- 6.3 --- --- Inflation (%) 6.6 --- --- --- --- 6.5 --- 6 --- 6.59 --- --- Average Exchange Rate (Rp/$) 9.063 --- --- --- --- 9.300 --- 9.050 --- 9.140 --- --- Average 3-months SBI Rate (%) 11.7 --- --- --- --- 8.5 --- 8 --- 8 --- --- International Oil Prices ($/barrel) 63.8 --- --- --- --- 63 --- 60 --- 69.7 --- --- Indonesian Oil Lifting 0.959 --- --- --- --- 1.000 --- 0.959 --- 0.899 --- --- (million barrel/day)
Source: Ministry of Finance 1 Provisional Figure, January 2008
19

Government Expenditure
In 2007, government expenditure recorded at 18.7% of GDP, slightly decrease compared to 2006. The portion of the total expenditure was divided into 66% for central government spending and 34% for regional spending. Of the total central government spending, the biggest portion went to Subsidies and Social aid, around 40%, which was followed by Goods and Capital Goods Spending at 23%, Salaries Spending at 18%, Interest Debt Payment at 16%, and Other Spending at 3%.
From the components of government expenditures, only Salary Spending, Subsidies, Social Aid, and Capital Goods Spending experienced an increased share of GDP compared to 2006. The decrease components from the share of GDP were Interest Debt Payment and Other Spending, while the Goods Spending was constant. Figure 6: Development of Total Expenditure Component
2.3 2.1 2.3 2.3 1.9 2.2 2.40.6 0.7 0.7 0.7 1 1.4 1.42 3.4 2.7 1.2 1.6 1.7
2.12.2 4
4.3 3.2 4
0.3
0.40.7 0.6 2 2.4 1.7
4.8
5.35.9 5.7 5.4
6.8 6.7
5.2
4.73.2 2.7 2.3
2.4 2.1
2.5
4.6
20.3
17.318.5 18.6 18.3
20 20
0
5
10
15
20
25
2001 2002 2003 2004 2005 2006 2007
Perc
ent G
DP
Personnel GoodsCapital SubsidiesOther include Social Assistance Regional ExpenditureInterest Debt Total Expenditure
20

Figure 7: Total Expenditure 2007 Composition
Personnel, 12%Goods, 7%
Capital, 8%
Interest Debt, 11%
Subsidies, 20%
Other (include Social Assistance), 9%
- Revenue Sharing Fund, 8%
- General A llocation Fund, 22%
- Social A llocation Fund, 2%
- Special Autonomy Fund, 1%
Regional Expenditure, 33%)
Personnel Goods CapitalInterest Debt Subsidies Other (include Social Assistance)Regional Expenditure - Revenue Sharing Fund - General Allocation Fund - Social Allocation Fund - Special Autonomy Fund
The increase on Salaries Spending was influenced by the main policies included adjustments to the
basic salary of civil servants by around 15%, payment of the thirteen-month salary, and adjustment of structural allowance along with functional allowance. In regard to subsidies, the increase was mainly dominated by fuel and electricity subsidies. The increase in fuel subsidies was driven by greater disparities between the prices of fuel fixed by the government with its economic price along with the realization of subsidized fuel consumption which exceeded the quota. It also was related to the slow progress made in the energy conversion program from kerosene to LPG which only reached around 6% of the target. While the increase in electricity subsidies was influenced by the increasing disparities between basic electricity tariff as set by the government and production cost which have continued to increase.
In general, efforts to increase the fiscal stimulus were still hampered. As targeted in the 2007 revised State Budget, the achievement of government expenditure of 18.7% of GDP was attributable to slower growth in government expenditure than that in 2006, either from Central Government Expenditure or Regional Spending. In the last two years following the reform of government finances in 2005, absorption of a number of components in Central Government Expenditure were always below target, although various efforts to improve regulations concerning the procurement of government goods or services had already been carried out. This condition was related to the increased caution in carrying out government auctions for the procurement of goods and services as well as steps to economize ministry/Institution spending in anticipation of increased needs for payments of energy subsidies. At the regional level, the realization of expenditures for the regions was relatively in line with the target although overshadowed by payments for Special Allocation Funds and Special Autonomy Funds and Adjustments that were below target.
21

Public Borrowing Figure 8: Ratio of Government Debt to GDP
30 25
42 45 45 4639 36 32 28 24 21 19
00
00
41 42
3831
2925
2318
1630
25
4245
86 88
77
6761
5347
3935
0
10
20
30
40
50
60
70
80
90
100
1995 1996 1997 1998 1999 2000 2001 2002 2003 2004 2005 2006 2007
Perc
ent G
DP
Foreign Debt Domestic Debt Total Debt
Source: Ministry of Finance
In financing 2007 State Budget deficit, government took three strategic steps i.e. increasing the use of domestic source of financing, reducing outstanding debts and reducing ratio of debts toward GDP progressively, and fulfilling debt repayment on time. In regard domestic source financing, government bond sales contributed the highest amount Rp 57.1 trillion, which was slightly below the target of Rp 58.5 trillion. From privatization of the state owned company (SOE), government obtained net funds around Rp 0.3 trillion, or below the target Rp 2 trillion. Meanwhile, from the bank restructuring program, the State Asset Management Company contributed Rp 2.4 trillion, exceeding the target of Rp 1.7 trillion. Similar to the two previous years, there was policy to fund infrastructure by using domestic source financing funds, amounted to Rp 2 trillion through Public Private Partnership (PPP).
From the side of external resources, the withdrawal of foreign loans only reached 81% of the target due to the policy matrix was not met. Nevertheless the withdrawal amount of foreign loans in 2007 was increase to Rp 34 trillion compared to 2006 only Rp 26.1 trillion. The main source of foreign loans originated from the World Bank and Asian Development Bank (ADB).
The ratio of government debt to GDP was decline to around 35%, from 39% of GDP in 2006. This decline stemmed from the drop in the amount of foreign loans from 18% of GDP in 2006 to around 16% of GDP in 2007 and the decline of domestic debts from 21% of GDP in 2006 to 19% of GDP in 2007. The proportion of domestic and foreign loans was 53% and 47%. This condition was in line with the government’s debt strategy, minimizing exchange rate risk. Government Revenue
The performance of government revenue recorded growth 11% (yoy) which was lower than the previous year that reached growth 29%. The significant slowdown was mainly due to the decline in the revenues from the oil and gas sector. Fortunately, the performance of the tax sector was quite satisfied. Tax revenue increased by 20% compared to the growth in 2006 of 18%. Therefore government revenues
22

could reach around 19% of GDP which was changed slightly from the level of 2006. Tax revenue took 69% of total government revenue with a tax ratio 13% of GDP, while the rest derived from non tax revenue amounting to 5.7% of GDP. Figure 9: Total Revenues and Grants Component
11.0 11.3 11.9 12.2 12.5 12.3 13.0
5.1 3.2 3.04.0 4.0 4.7 3.3
1.71.5 1.8
1.4 1.32.1 2.417.9
16.016.8 17.6 17.8
19.1 18.7
0.0
5.0
10.0
15.0
20.0
25.0
2001 2002 2003 2004 2005 2006 2007
Tax Oil and Gas Non-Tax Revenue
Other Non-Tax Revenue Total Revenue and Grants
Source: Ministry of Finance
The oil lifting that only reached 899,000 barrels per day, lower than the assumption of 950,000 barrels per day, was one of trigger factors of decline non tax revenues. The decline of domestic oil lifting was related to high natural declining rate of oil wells that reached around 5%-11% per year due to its mature age, while new wells haven’t produced yet.
The better performance of tax sector was due to the impact of more conducive macroeconomic conditions and sound tax policies. Continuation of tax policies from previous year, such as extension program through widening tax base, intensification towards tax subjects and objects, tax administration improvement and increased monitoring, combined with better macroeconomic conditions resulted in better performance of tax collection. The increase of tax revenue occurred in all components of tax revenues with the largest increase stemming from export tax. The upswing of export tax was mainly due to the increase of exports of crude palm oil, mineral fuels and mining product, and rubber and rubber made goods. In regard of domestic taxes, the main increase occurred in Value Added Tax (VAT), other taxes, and excise taxes in line with private consumption growth which has continued to rise since the first quarter of 2007.
23
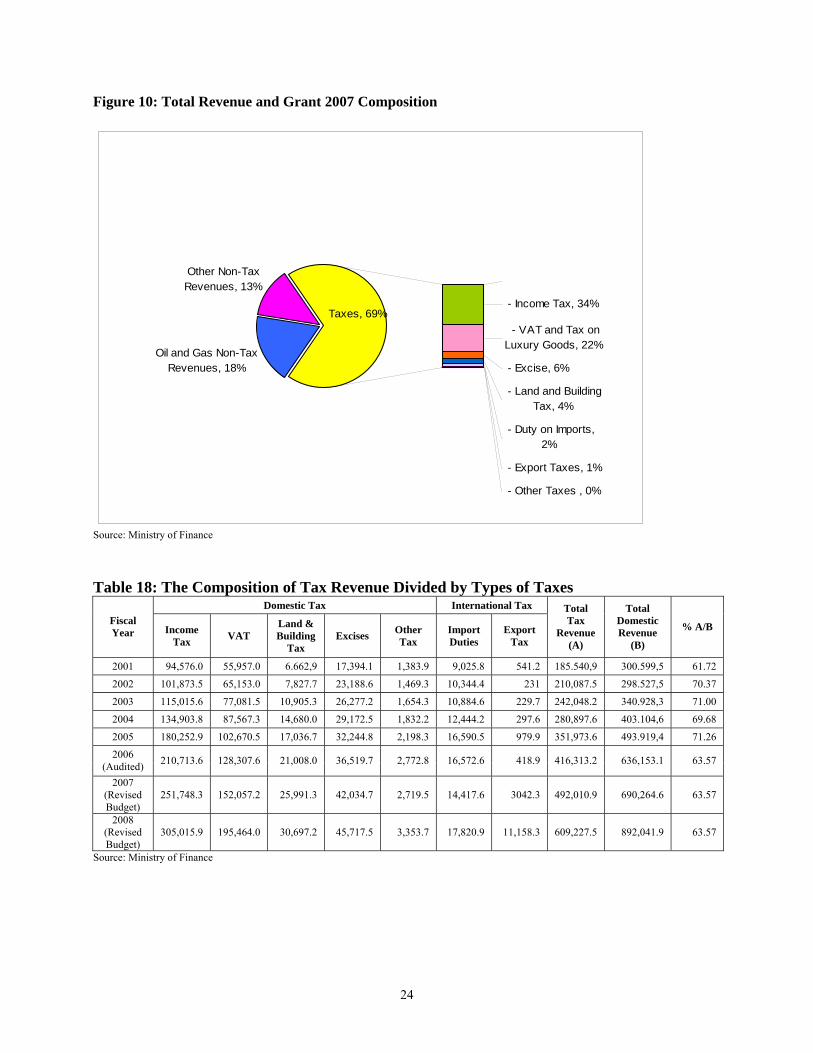
Figure 10: Total Revenue and Grant 2007 Composition
Oil and Gas Non-Tax Revenues, 18%
Other Non-Tax Revenues, 13%
- Income Tax, 34%
- VAT and Tax on Luxury Goods, 22%
- Excise, 6%
- Land and Building Tax, 4%
- Duty on Imports, 2%
- Export Taxes, 1%
- Other Taxes , 0%
Taxes, 69%
Source: Ministry of Finance Table 18: The Composition of Tax Revenue Divided by Types of Taxes
Domestic Tax International Tax Fiscal Year Income
Tax VAT Land & Building
Tax Excises Other
Tax Import Duties
Export Tax
Total Tax
Revenue (A)
Total Domestic Revenue
(B)
% A/B
2001 94,576.0 55,957.0 6.662,9 17,394.1 1,383.9 9,025.8 541.2 185.540,9 300.599,5 61.72
2002 101,873.5 65,153.0 7,827.7 23,188.6 1,469.3 10,344.4 231 210,087.5 298.527,5 70.37
2003 115,015.6 77,081.5 10,905.3 26,277.2 1,654.3 10,884.6 229.7 242,048.2 340.928,3 71.00
2004 134,903.8 87,567.3 14,680.0 29,172.5 1,832.2 12,444.2 297.6 280,897.6 403.104,6 69.68
2005 180,252.9 102,670.5 17,036.7 32,244.8 2,198.3 16,590.5 979.9 351,973.6 493.919,4 71.26
2006 (Audited) 210,713.6 128,307.6 21,008.0 36,519.7 2,772.8 16,572.6 418.9 416,313.2 636,153.1 63.57
2007 (Revised Budget)
251,748.3 152,057.2 25,991.3 42,034.7 2,719.5 14,417.6 3042.3 492,010.9 690,264.6 63.57
2008 (Revised Budget)
305,015.9 195,464.0 30,697.2 45,717.5 3,353.7 17,820.9 11,158.3 609,227.5 892,041.9 63.57
Source: Ministry of Finance
24

III. Tax Structure: Institutions and the Reality III.1 Overview of the Role of Taxation in Indonesia
Based on Indonesian Tax Law, tax is the payment to the state based on laws payable to/from those obliged, the collection of which may be enforced, and there is no direct rewards to the payer, used for general spending to manage the government and to implement the sustainable national development. Before 1980s, taxes did not play their strategic, dominant, or significant role to the national income. However, in the early 1980s, oil crisis has brought serious threat to the national budget. At that time, government must have found good solution through collecting taxes and the government enacted tax reform in 1983 and implemented self-assessment system.
During the prolonged economic crisis, the role of fiscal policy tends to be more important, especially in supporting steps to save the economy and in pushing the national economy recovery process. As the main source of domestic revenue, tax revenue showed increasing trends during the past few years. In fiscal year 2007 as well as the projected fiscal year 2008, the tax revenue led the domestic revenue in the state budget. Collecting taxes for state budget is one of the hard tasks for the Directorate General of Taxes (DGT). However, the DGT has to pursue its mission, pursuing self-financing capability so that government can continue to serve the society. III.2 History of Indonesian Tax Law
The introduction of the self-assessment system in 1983 was a huge change in the taxation method in Indonesia and it was the start of a series of major tax reforms. Under the self-assessment system, the taxpayers are accorded greater trust and responsibility because the law authorizes taxpayer to determine the amount of taxes that should be paid; to calculate, pay and reconcile the prepaid taxes; and also to report the amount of taxes which have been paid to local tax authority. The only type of taxes that still uses the official assessment is land and building tax, as the amount of taxes to be paid by taxpayers are assessed and calculated by the tax authority. The legal framework for tax administration is contained in 2 sets of laws: the rules that apply to all taxes are set out in the General Provisions and Taxation Procedures, while the rules that apply to a particular tax are provided for in each substantive tax law.
The tax reform in the early 1980s yielded 2 original Indonesian Tax Law packages: Package I which consisted of three laws: General Provisions and Taxation Procedures (Law No.6/1983); Income Tax (Law No.7/1983); and Value Added Tax and Luxury Sales Tax (Law No.8/1983). Package II comprised 2 laws: Tax on Land and Buildings (Law No.12/1985) and Stamp and Duty (Law No.13/1985). Those tax laws were the fundamental step stone to another tax reform in the next following years.
The 1983 tax laws have been continually amended to keep up with the dynamics of society. First amendment was in 1991 on Income Tax Law, followed by the second amendment in 1994 on General Provisions and Taxation Procedures, Income Tax Law, VAT and Luxury Sales Tax, Tax on Land and Buildings. Those laws were applied starting on January 1, 1995.
In 1997 the Tax Dispute Settlement Agency was established, based on Law No.17/1997. This institution was outside the Supreme Court management and whose authorities are outside the District Court and State Administration Court. The Tax Dispute Settlement Agency decision was final, permanent and was not of State Administration Decision. In 2002, under the Law No.14/2002 about Tax Court, the role of Tax Dispute Settlement Agency was changed into Tax Court, an institution which performs judgmental authorities in tax dispute, objection, and lawsuits whether for central government or local taxes. Under this law, Tax Court is under the authority of State Administration Court and Supreme Court management. In 1997 the law of Tax Collections through Distress Warrants (Law No.19/1997) and the law of Acquisition Duty of Right on Land and Buildings (Law No.21/1997) also were being introduced.
The third amendment of the 1983 tax law was in the year 2000. Those are Law No.16/2000 about General Provisions and Taxation Procedures, Law No.17/2000 about Income Tax Law, Law No.18/2000 about VAT and Luxury Sales Tax, Law No.19/2000 about Tax Collections through Distress Warrants and
25

lastly the Law No.20/2000 regarding the Acquisition Duty of Right on Land and Buildings. Those laws were applied starting on January 1, 2001.
The latest Indonesian tax laws arising from the recent tax reform review are: a) General Tax Provisions and Procedures (Law No.28/2007); and b) Income Tax (Law No.36/2008). The General Tax Provisions and Procedures law were signed by the President on July 17, 2007 and
shall come into force as from January 1, 2008, while The Income Tax law were signed by the President on September 23, 2008 and applied from January 1, 2009.
The amendment of those law aims at providing better justice, enhancing service for taxpayers, legal certainty and law enforcement as well as anticipating advancements in the information technology sector and changes in material provisions in the taxation sector. In addition, the amendment is also intended to enhance professionalism of taxation apparatuses, transparency of taxation administration and voluntary compliance of taxpayers.
Simple system, mechanism and technical procedures for taxation rights and obligations become the nature and characteristic in the amendment to the law by adopting a self-assessment system persistently. The amendment is mainly related to enhancement of equilibrium between the rights and obligations of taxpayers so that the taxpayers can exercise their taxation rights and obligations better.
By sticking to the principles of legal certainty, justice and simplification, the direction and goal of the amendment refers to the following key policies:
a) enhancing efficiency of tax collection in the framework of supporting state revenue; b) enhancing service, legal certainty and justice for the people so as to drive up competitiveness in
the investment sector by supporting the development of small and medium-scale businesses; c) adjusting to demand of socio-economic developments as well as developments in the information
technology sector; d) enhancing the balance between rights and obligations; e) simplifying taxation administrative procedures; f) enhancing the application of self-assessment principles accountably and consistently; and g) supporting business climate towards a better conducive and competitive condition.
The implementation of the key policies is hopefully able to increase the state revenue in the medium
and long terms along with the increasing of voluntary compliance and the improving of business climate. III.3 Tax Administration in Indonesia III.3.1 Organization Structure
The Directorate General of Taxes (DGT) is one of the directorates under the Ministry of Finance. The main duties of DGT are: formulating the tax policy, collecting tax revenue, and administering taxation in national scale. In conducting its operation, DGT is led by a Director General, supported by 1 Secretariat of DGT, 12 Directorates, 1 Large Office of Data and Document Processing, and 31 Regional Tax Offices. Currently, in summary, the tax offices under The Regional Tax Office consist of: 3 Large Taxpayer Offices, 9 Specialized Taxpayer Offices, 19 Medium Taxpayer Offices, 269 Small Taxpayer Offices, 56 Land and Building Tax Offices, 15 Tax Audit and Investigation Offices, 94 Tax Counselling Offices, and 96 Tax Information and Surveillance of Taxation Potency Offices.
26

Figure 11: Organization Structure of Directorate General of Taxes
TAX AUDIT OFFICES
DIRECTORATE OF TAX REGULATION I
DIRECTORATE OF TAX REGULATION II
DIRECTORATE OF TAXATION INFORMATION
TECHNOLOGY
DIRECTORATE OF BUSINESS PROCESSING
TRANSFORMATION
DIRECTORATE OF TAX EXTENSIFICATION AND
APPRAISAL
DIRECTORATE OF TAX OBJECTION AND APPEAL
DIRECTORATE OF TAX POTENTIALITY,
COMPLIANCE, AND REVENUE
DIRECTORATE OF TAX COUSELING, SERVICE, AND PUBLIC RELATION
DIRECTORATE GENERAL OF TAXES
SECRETARY OF GENERAL
DIRECTORATE OF TAX AUDITING AND COLLECTION
DIRECTORATE OF INTELLIGENCE AND
INVESTIGATION
REGIONAL TAX OFFICESLARGE OFFICES OF DATA
AND DOCUMENT PROCESSING
DIRECTORATE OF INTERNAL COMPLIANCE
AND PERSONNEL RESOURCES
TRANSFORMATION
DIRECTORATE OF COMMUNICATION AND
INFORMATION TECHNOLOGY
TRANSFORMATION
LARGE/MEDIUM TAXPAYER OFFICES
SMALL TAXPAYER OFFICES
DISTRICT TAX OFFICES
LAND & BUILDING TAX
OFFICES
III.3.2 Tax Administration Reform
The Directorate General of Taxes launched its tax administration reform strategy in 2001. The main reason behind this strategy was the government’s 2002 budget which set a target of increasing tax revenue by 0.5 percentage points of GDP through improvements in tax administration. The strategy was also driven by the government’s desire to begin removing the impediments to the investment climate, especially those related to tax administration.
The creation of Large Taxpayers Office (LTO) in July 2002 was viewed as an important stepping stone in modernizing the DGT by providing a controlled environment for testing a wide range of new tax administration processes. The LTO initiative encompassed several major reforms. The LTO was re-organized into units based on tax administration function (e.g., taxpayer services, audit, arrears collection), which facilitated the development of specialized skills among staff. Service to large businesses was improved through the creation of a cadre of service-oriented tax officers who were trained in the complex tax law issues that often arise when dealing with large taxpayers. Refunds were accelerated through the introduction of a program which simplified the refund process for highly compliant businesses. Enforcement was strengthened through the quick identification and rapid treatment of taxpayers who filed their tax returns late, paid their taxes late, or committed other forms of noncompliance. Perhaps most notably, the LTO provided for a careful vetting of staff, substantially higher wages, a widely publicized code of conduct, and improved IT systems and office facilities. This quality work environment was crucial in promoting productivity and non-corrupt behaviour among LTO staff.
A key feature of the LTO’s taxpayer services function was the assignment of an “account representative” (AR) officer to each large taxpayer. For his assigned set of large taxpayers, the AR served as the first point of contact into the LTO for answering questions on the tax law, straightening out problems involving a taxpayer’s account with the DGT, and following up on such issues as delays in
27

issuing refunds. The AR also closely monitored the taxpayer’s filing and payment obligations, and was authorized to undertake some initial enforcement actions such as calling a taxpayer who filed a late tax return or did not pay tax on time.
The LTO administered the relatively small number of taxpayers who collectively accounted for the largest portion of tax collections. Originally the LTO administered 200 large enterprises and their 300 branches who contributed 23 percent of total collections. In 2004, the LTO was expanded by an additional 100 large corporations, which brought LTO tax receipts up to 27 percent of total DGT collections. The new tax administration features that were introduced at the LTO would later become the standard for the DGT and were gradually rolled-out to additional field offices.
In early 2005, the DGT’s Jakarta Region VI was chosen as the pilot region for designing and testing the next reforms. The region created 2 special tax offices: a Medium Taxpayer Office (MTO) to administer the region’s 200 largest taxpayers and a Small Taxpayer Office1 (STO) for businesses with small amounts of turnover. Although the STO and MTO were originally envisaged to customize their operations for small and medium taxpayers, in actuality the offices mainly implemented the more generic reforms that had been introduced for large taxpayers, with some modifications. These reforms included re-organizing the offices into units based on tax administration function, increasing staff salaries, enhancing communications with taxpayers, and introducing modern technology and improved office accommodations. By the end of 2007, the MTO and STO had achieved highly positive results in terms of improving compliance, revenue collection, and taxpayer satisfaction. Due to the successful of MTO and STO, the DGT then continue to expand the MTO and STO throughout every region in a carefully phased, step by step manner. III.3 Current Tax System
In Indonesia, taxes are levied under three laws that were introduced in December 1983. These cover: a) General Tax Provisions and Procedures; b) Income Tax; and c) Value-Added Tax (VAT) on goods and services, and Sales Tax on Luxury goods (STLG). The Indonesian Parliament approved the third amendment of the new General Tax Provisions and
Procedures Law and also the fourth amendment of the Income Tax Law. The General Tax Provisions and Procedures law were signed by the President on July 17, 2007 and shall come into force as from January 1, 2008, while the Income Tax law were signed by the President on September 23, 2008 and applied from January 1, 2009. The VAT and STLG bill is still being discussed.
With certain exceptions, withholding tax is imposed on payments to onshore and offshore parties, including payments such as dividends, interest, royalties and fees paid for services. The government also collects taxes on land and buildings, stamp duty, import duties and a fiscal exit tax. Local governments collect various other taxes.
The laws are supplemented by Regulations, Decrees of the President, Decrees and Letters of the Ministry of Finance (MOF) and Decrees and Circulars of the Director General of Taxation (DGT). The official tax year runs from January 1 to December 31. Companies may adopt different year-ends in their Articles of Incorporation and may change their financial years with prior approval. A financial year cannot exceed 12 months for tax purposes.
Indonesia has a self-assessment system under which returns are considered final if not queried by the Tax Office within 10 years under the old law. Under the new law this has become 5 years, starting from the 2008 fiscal year onwards. There are transitional arrangements whereby the year 2013 is the year of expiry of the statute of limitations for all tax years prior to and including 2007. The Tax Laws rely heavily on implementing regulations and these regulations need to be considered when assessing the impact of any provision contained therein. 1 The Small Taxpayers Office or called Pratama Tax Office in Indonesia is the merge of Tax Audit and Investigation Office and Land and Building Tax Office into one District Tax Office.
28

III.3.1 Corporate Income Tax (1) Introduction
Indonesian companies are required to register at the relevant DGT’s office for their location/status on or shortly after establishment. Companies must file annual returns to compute the income tax payable. The income to be reported includes all overseas income as Indonesian tax law adopts the worldwide income basis. Tax paid offshore in relation to foreign source income can be credited in the same year subject to certain limitations.
Any joint business enterprise is treated for tax purposes as a body corporate. Hence, a “company” as defined for income tax purposes includes a limited liability corporation, a limited partnership, a state-owned or regional government-owned enterprise in whatever name or form, a partnership, a body of persons or other association, a firm, a kongsi, a cooperative, a foundation or similar organization, an institution, a pension fund and other form of business entity and a permanent establishment (PE).
An unincorporated joint venture between companies (e.g. Joint Operations, Consortium, etc.) is however treated as transparent for corporate income tax purposes and each member should report their share of income in their own tax returns. (2) Residence
The law distinguishes between resident tax subjects and non-resident tax subjects. A corporate resident tax subject is any corporate organization incorporated in Indonesia. Corporate organizations include limited liability companies, other companies, partnerships, cooperatives, foundations, pension funds and associations.
Non-resident tax subjects are corporate organizations incorporated overseas, but which receive or accrue income from Indonesia. These tax subjects are obliged to register for tax purposes if they have a PE in Indonesia. Certain types of income payable to non-resident companies by resident taxpayers are subject to withholding tax. Resident organizations and PEs are required to register as taxpayers, pay tax on their own income, withhold tax on payments to employees and third parties, and lodge relevant tax returns.
Representative offices of foreign companies are also required to register as taxpayers, even though they may not be a PE. This is necessary as the representative office will have to withhold tax on payments to employees and third parties and lodge relevant tax returns. VAT registration is available only to registered taxpayers. (3) Tax Rates
The new income tax law Number 36 Year 2008 introduces interesting changes in income tax rates for corporate and permanent establishments. The most significant of these changes is the enactment of a flat rate (28 percent) on the income of corporate and permanent establishments, which replaces the progressive rates that previously applied. Further, the tax rate will be reduced from 28 percent to 25 percent, effective in fiscal year 2010. Public companies, subject to a minimum listing of 40 percent of its shares and other conditions, will have an extra tax cut of 5 percent from the prevailing rate giving them an effective tax rate of 23 percent in 2009 and 20 percent in 2010. The comparison of old and new income tax rate for corporate and permanent establishments are as follows: Table 19: Old Income Tax Rates for Corporate and Permanent Establishments
Annual Taxable Income (Rp.) Income Tax Rate Up to Rp. 50 million 10% Over Rp. 50 million to Rp. 100 million 15% Over Rp. 100 million 30%
Source: Republic of Indonesia, Law Number 17 Year 2000 on Income Tax Article 17
29

Table 20: New Income Tax Rates for Corporate and Permanent Establishments
Tax Rate Year Corporate & PE Qualifying Public Companies 2 2009 28% 23%
2010 & after 25% 20% Source: Republic of Indonesia, Law Number 36 Year 2008 on Income Tax Article 17
In addition, resident companies and other entities (excluding permanent establishments) whose gross revenue is no more than Rp 50 billion will potentially receive a reduction of up to 50 percent in the tax rate applicable to their taxable profit, calculated as follows:
a) If the gross revenue is equal to, or less than Rp 4.8 billion then 100 percent of the taxable profit will be subject to tax at a rate of 14 percent and 12.5 percent (for 2009 and 2010 tax year)
b) If the gross revenue is greater than Rp 4.8 billion, but less than or equal to Rp 50 billion, then the reduction is pro-rata based on the gross revenue.
(4) Taxable Income
The object of tax is income, which is defined as any economic benefit received or accrued by a taxpayer, whether originating from within or outside of Indonesia, which is used for consumption, or which increases the wealth of the taxpayer, in whatever name or form.
For a company, income can be defined as follows: a) Gross profits from business; b) Gains upon the sale or transfer of property (realized capital gains); c) Interest, dividends, and royalties (subject to certain exceptions); d) Rents; e) Income from debt forgiveness and f) Surplus on revaluation of assets (favourable tax rate may apply). Exchange gains or losses resulting from normal movements in currency exchange rates are, in most
cases, included in taxable income in the current fiscal year irrespective of whether they are realized or unrealized. Gains or losses arising from a change in currency rates resulting from a government regulation or decree (revaluation or devaluation) may be subject to special concessions. (5) Capital Gains Tax
Capital gains, regardless of the reason for the disposal of the asset, are taxable. The taxable gain is defined as net proceeds less adjusted tax basis at the time of disposal. Losses from the sale or transfer of property or rights used in a business to earn income are deductible.
Capital gains on the sale of shares listed on the Indonesian stock market are subject to a final tax rate of 0.1 percent of gross proceeds (plus an additional 0.5 percent for founder shares). There is also a final tax, being 5 percent of gross proceeds, on the sale of unlisted shares held by a foreign shareholder in an Indonesian company, unless protected by a Double Tax Agreement (DTA). (6) Dividends
Dividends and other shares of profit derived by resident limited liability companies, cooperatives, state-owned enterprises, or regional government-owned enterprises from participation in the capital of an enterprise established in Indonesia, may not be included in taxable income in certain situations. Companies, which do not meet these conditions, will be subject to tax on such income. Dividends and shares of profits from other sources must be included in taxable income. A foreign tax credit is allowed for any tax
2 To be eligible, a public company must have at least 40 percent of the outstanding shares owned by at least 300 persons, each holding less than 5 percent, and this condition must be maintained for at least 6 months in a year.
30

withheld on foreign-source dividends. A credit is however not available for foreign tax on underlying profits (7) Exempt Income
Excluded from the definition of taxable income are, among others: a) Gifts or donations that are not related to the business or profession of the parties involved; b) Dividends received by a resident company from another resident company, provided:
1) The dividend is sourced from retained earnings; 2) The recipient owns at least 25 percent of paid up capital.
The holding companies no longer need to undertake any other business activities due to removal of the ”active business” criteria for holding companies. Therefore any interest expense incurred in relation to the holding company’s investment will not be deductible since the dividends received are not taxable.
c) Income received by venture capital companies in the form of profits or dividends, as long as the investee companies meet certain requirements and the companies are not listed on the stock exchange and
d) Income or profits received by an investment fund company as long as all income or profits are distributed to shareholders.
(8) Deductions
Basically expenses are deductible if the “expenses are directly or indirectly connected to business activities”. Previously the Law only referred to expenses which were “directly” connected to business activities, which sometimes provided justification for tax auditors to argue that expenditures such as marketing and promotions might not be deductible. A. Allowable Deductions
For most activities, taxable income is determined after deducting from gross income: a) The costs of deriving, recovering and conserving such income including, the costs of materials,
wages, salaries of employees, employee bonuses, honoraria, cash allowances, interest, rent, royalties, travel expenses, waste treatment costs, insurance premiums, administrative costs, and taxes other than income tax;
b) Promotional and sales costs; c) Bad debts, provided strict conditions are fulfilled; d) Depreciation of the acquisition cost of property and amortization of costs incurred in obtaining
rights and other costs that have a useful life of more than one year; e) “Zakat” donations if paid to an approved body by a Moslem individual or Moslem-owned
business; f) Losses from the sale or transfer of assets; g) Foreign exchange losses; h) Costs of research and development performed in Indonesia; i) Scholarships, apprenticeships and training costs; j) Donations (as regulated by Government Decree) in relation to: National disasters, Research and
development in Indonesia, The provision of educational facilities, and Development of sports; k) The provisioning of reserves for re-afforestation and closure/maintenance of industrial waste
storage locations are deductible for these business sectors (as further regulated by Minister of Finance Decree);
l) Goodwill (“Muhibah”) can be capitalized and amortized; m) Office refreshments; n) Prior year losses; o) Contributions to a pension fund approved by the MOF. Entertainment costs are an allowable deduction where they relate to securing, acquiring and collecting
income, but substantiation requirements exist. Full details of each expense are required to be lodged with
31

the annual tax return. B. Non-allowable Costs
The following are not allowed as deductions from gross income in determining taxable income: a) Dividend payments or other profit distributions to shareholders; b) Formation of or additions to reserves (e.g. doubtful debts). Certain exceptions are permitted for
banks, insurance companies, finance companies and mining companies; c) Life, accident, health and scholarship insurance premiums, unless paid by the employer and
providing such premiums are treated as income in the hands of the employees; d) Costs of benefits-in-kind (i.e. fringe benefits) provided by a taxpayer for the needs of its
employees, including vacation costs, motor vehicles (50 percent), recreation, children’s education, housing (except for housing in certain isolated areas), and income tax paid by the employer and
e) Donations and certain promotional gifts. Inventory must be valued at cost using the average cost or first-in-first out (FIFO) basis for the
purpose of calculating net profits from business. The last-in-first-out (LIFO) basis is not an acceptable method of stock valuation for tax purposes. (9) Losses
The carry forward of losses is limited to 5 years, commencing the first year after the loss was incurred. This period may be extended for up to 10 years under the special facilities available for certain regions or industries. There is no provision for the carry-back of losses. Changes of shareholders do not affect the validity of the carried forward losses. Capital losses are treated the same as operating losses provided that the losses are reasonable based on sound market practice. No foreign losses can be included in the tax computation. (10) Tax Depreciation/Capital Allowances
Depreciation is an allowable deduction in determining taxable income. Depreciable property is defined as tangible property owned and used in the business or owned for the production, recovery and securing of income, which has a useful life of more than one year. Land is not depreciable, except for certain industries.
Depreciable assets other than buildings and construction are classified by tax regulations into one of four asset categories according to the type of asset. Buildings and construction are divided into permanent and non-permanent structures. In practice, the regulation defines the useful life, irrespective of the taxpayer’s own assessment of the asset’s life. If, however, the category of assets is not specified in the regulations then it may be depreciated based on the useful life. Buildings and other immovable property are depreciated only using the straight-line method.
For all assets other than buildings and other immovable property, depreciation is calculated using either the declining balance or the straight-line method at the company’s option. Expenditure incurred in relation to assets with a beneficial life of more than one year are categorized and depreciated from the month of acquisition by consistently using either the straight-line or declining-balance method as follows:
a) Category 1 – 50 percent (declining-balance) or 25 percent (straight-line) on assets with a beneficial life of 4 years. Examples of assets in this category are computers, printers, scanners, furniture and equipment constructed of wood/rattan, office equipment, motorcycles, special tools for specific industries/services, kitchen equipment, manual equipment for agriculture, farming, forestry and fishery industries, light machinery for the food and drink industries, motor vehicles for public transportation, and equipment for the semi-conductor industry.
b) Category 2 – 25 percent (declining-balance) or 12.5 percent (straight-line) on assets with a beneficial life of 8 years. Examples of assets in this category are furniture and equipment constructed of metal, air conditioners, cars, buses, trucks, speed-boats, containers and the like, machinery for agriculture, plantation, forestry, fishery, food and drink, and light machinery, logging equipment, equipment for construction, heavy vehicles for transportation, warehousing,
32

and communication, telecommunications equipment, and equipment for the semi-conductor industry.
c) Category 3 – 12.5 percent (declining-balance) or 25 percent (straight-line) on assets with a beneficial life of 16 years. Examples of assets in this category are machinery for general mining other than oil and gas, machinery for the textile, timber, chemical, and machinery industries, heavy equipment, docks and vessels for transportation and communication, and other assets not included in the other categories.
d) Category 4 – 10 percent (declining-balance) or 5 percent (straight-line) on assets with a beneficial life of 20 years. Example of assets in this category is heavy machinery for construction, locomotives, railway coaches, heavy vessels, and docks.
e) Building category – 5 percent (straight-line) on assets in the permanent building category with a useful life of 20 years; or 10 percent (straight-line) on assets in the non-permanent building category with a useful life of ten years. Included in the cost of buildings is the land and building transfer duty on building rights.
The table below shows the allowable useful life of the assets as categorized and the annual depreciation rates: Table 21: Depreciation Method
Method of Calculation Physical (Tangible) Asset
Useful Life (Years) Straight Line (%) Declining Balance (%)
I. Non Building: Category 1 4 25 50 Category 2 8 12.5 25 Category 3 16 6.25 12.5 Category 4 20 5 10
II. Building Permanent 20 5
Non Permanent 10 10 Source: Republic of Indonesia, Law Number 36 Year 2008 on Income Tax Article 11
Once applied, taxpayers are not allowed to change the method of depreciation without the DGT’s approval. Additions are depreciated from the month of acquisition. With approval from the DGT, depreciation can be deferred to commence from the year of first use of the asset. Businesses operating in economic development zones (KAPET) and companies, which make a new investment or expand an existing investment in certain business sectors or remote areas, are entitled to accelerated depreciation and amortization at double the normal rates. Special rules apply in the oil and gas, and mining sectors. (11) Amortization of Expenditure
The acquisition price of intangible property with a useful life of more than one year must be amortized consistently using either the straight-line or declining balance method over the useful life of the asset, following the rates of depreciation for tangible assets. For mining industries, forestry and other natural resources businesses, the taxpayer should use the unit of production method with a maximum of 20 percent per year.
Expenditure incurred during the construction or pre-commercial period should be capitalized and amortized after the commencement of commercial operations. However, operating costs (general and administration) cannot be capitalized and should be expensed in the year they are incurred. The costs of incorporation and expansion of capital can be expensed in the year incurred or amortized. Special rules apply in the oil and gas, and mining sectors.
33

Table 22: Amortization Method Method of Calculation Non-Physical Asset Useful Life (Years) Straight Line (%) Declining Balance (%)
Category 1 4 25 50 Category 2 8 12.5 25 Category 3 16 6.25 12.5 Category 4 20 5 10
Source: Republic of Indonesia, Law Number 36 Year 2008 on Income Tax Article 11 A The category is determined on the basis of the nearest useful life (i.e., an intangible asset with a useful
life of 6 years may be Category 1 or Amortization Category 2, while an intangible asset with a useful life of 5 years is Category 1). (12) Tax Instalments
Corporate taxpayers must pay monthly income tax instalments. For most taxpayers, instalments are based on the income tax payable, as reflected in the annual corporate income tax return of the prior year, after deducting taxes withheld and collected by other parties in that prior year divided by 12. For the first 2 months of the year or until the tax return is filed, the instalments will generally be equal to the December instalment of the prior year. Monthly instalments must be paid by the 15th of the following month and the corresponding monthly return must be filed by the 20th of that month. III.3.2 Personal Income Tax (1) Introduction
Indonesia adopts the self-assessment method for individuals to calculate, settle, and report income tax. The tax authorities have the right to audit any tax return to ensure the individual has correctly calculated the tax payable. For Indonesian-source income, there is an extensive framework of withholding taxes so that income tax is often collected by deduction at source, for example in relation to employment income, interest, dividends, royalties, rent and income from sales of property, and listed shares. The extent of the Indonesian income tax liability depends upon the individual’s residence status in Indonesia.
Resident individuals are taxed on their worldwide income, regardless of where such income arises or for whom work or services are performed. Non-resident individuals are exempted from the worldwide income reporting obligation and tax is imposed only on income derived in Indonesia. Deductions are limited to individual personal allowances. Income of a resident individual that exceeds the non-taxable income threshold for a calendar year is subject to income tax at progressive rates ranging from 5 percent to 30 percent. Income of a nonresident individual is subject to income tax at a flat rate of 20 percent on gross income. Income tax is calculated and paid in Indonesian Rupiah (IDR). Amounts in other currencies are converted for tax purposes into Rupiah using exchange rates published weekly by the Ministry of Finance.
(2) Residence Rules An individual is regarded as a tax resident if he/she fulfils any of the following conditions: a) Resident in Indonesia; b) Present in Indonesia for more than 183 days within any 12-month period; c) Present in Indonesia within a fiscal year and intends to reside in Indonesia. An expatriate is resident until the date of final departure from Indonesia. An Indonesian national is
considered resident from birth unless he/she leaves Indonesian permanently (dual-resident individuals may become non-resident where tax treaty tie breaker rules apply). An individual who is present in Indonesia for tax purposes is required to file an individual income tax return if he/she obtains income which exceeds the personal deduction threshold (non-taxable amount) of between Rp 15,840,000 per year. In order to file a tax return, an individual must be registered and obtain a tax identification number (NPWP). Non-residents do not have an obligation to register for an NPWP or file any individual income tax return.
34

Upon leaving Indonesia permanently, an expatriate should submit an application to cancel his/her tax registration. The tax office will perform a tax audit on the taxpayer’s returns and supporting documents prior to granting approval to deregister. Therefore, the individual should ensure all tax related documents, including bank statements, foreign tax paid documents, salary slip, employment contract, etc. are readily available in anticipation of a tax audit (3) Types of Taxable Compensation
Income is defined as any economic benefit received or accrued by a taxpayer that is used for consumption or that increases the wealth of the taxpayer, in whatever name or form.
The following types of income are subject to tax: a) Compensation or payments received or earned in connection with work or services. b) Lottery, prizes, and awards. c) Gross profits from individual business activities. d) Gains from the sale or transfer of assets. e) Refunds of tax payments already deducted as expenses. f) Interest. g) Dividends, in whatever name or form, paid by a corporation, payments of dividends by an
insurance company to policy holders. The monthly Indonesian individual tax return is due for payment and lodgment by the 15th and 20th of
the following month, respectively. The annual Indonesian individual tax return should be lodged by 31 March of the following year. Starting for the 2008 tax year, annual tax payment is due before the lodgment deadline.
(4) Tax-Exempt Income The followings are the types of income which are exempt from tax: a) Benefits in-kind:
1) Unless these amounts are taken as a deduction in determining the taxable income of the employers;
2) Unless the employer is tax exempt or is subject to tax on a final tax or deemed profit basis. b) Income tax borne by the employer (unless grossed-up); c) Gifts or assistance received from a close family member, and religious, educational or social
institutions or small scale entrepreneurs including co-operatives, unrelated to the business or profession of the parties involved;
d) Inheritances; e) Payments from an insurance company because of accident, illness, or death of the insured, and
payments of scholarship insurance; f) Proceeds from disposal of certain domestic mutual fund/investment funds. Income tax rates have been reduced in new Income Tax Law Number 36 Year 2008 for resident
individual taxpayers. The revised rates and related income tiers/layers for resident individual taxpayers are as follows: Table 23: Comparison of New and Old Income Tax Rates for Resident Individuals
New Old Taxable Income (Rp) Tax Rate Taxable Income (Rp) Tax Rate 0 – 50 million 5% 0 – 25 million 5% > 50 – 250 million 15% > 25 – 50 million 10% > 250 – 500 million 25% > 50 – 100 million 15% > 500 million 30% > 100 – 200 million 25% > 200 million 35%
* Non residents will be subject to withholding tax at a rate of 20 percent Source: Republic of Indonesia, Law Number 36 Year 2008 on Income Tax Article 17
35

Table 24: Annual Non-Taxable Income (PTKP) for Residents Individuals Exemption for (Rp)
Taxpayer (Self Allowance) 15,840,000 Married Taxpayer (Spouse) 1,320,000 Each Dependent (maximum of 3) 1,320,000 Wife whose income is combined with her husband 15,840,000 Occupational Expenses 1,296,000 Pension Expenses 432,000 Employee contribution for old age security savings 2% of gross income amount
*Married women are normally only allowed the “Self Allowance” Source: Republic of Indonesia, Law Number 36 Year 2008 on Income Tax Article 7
Previously, a married woman has to report her income in her husband’s tax return unless there is a prenuptial agreement. Based on the new law, a married woman can choose to have her own tax identification number and report her own income tax return separately from her husband. The tax calculation method will be the same as for married couple with prenuptial agreement. III.3.3 Withholding Taxes (1) Introduction
Indonesian income tax is collected mainly through a system of withholding taxes. Most withholding taxes must be paid by the 10th day of the month following payment or its accrual in the books, whichever is earlier. These withholding taxes are commonly referred to by the relevant article of the Income Tax Law.
a) Article 21 – salaries and other payments to individuals Employers are required to withhold Article 21 income tax from the salaries payable to their employees and pay the tax to the State Treasury on their behalf. The same withholding tax is applicable to other payments to non-employee individuals (e.g., fees payable to individual consultants or service providers).
b) Article 22 - imports Article 22 income tax is typically applicable in the following events:
1) Import of goods; 2) Sale of goods to the government calling for payments from the State Treasury, the State
Budget General Directorate, or certain state-owned companies; 3) Sale/purchase transactions of steel, automotives, cigarettes, cement, and paper products.
The tax rates for the designated events are as follows: Table 25: The Tax Rates for the Designated Events
Event Tax Rate (%) Tax Base 1. Import of goods-using an Importer Identification (API) 2.5 Import value, i.e., CIF value
plus duties payable
2. Import of goods – without API 7.5 Import value, i.e., CIF-value plus duties payable
3. Sale of goods to the government calling for payment from the State Treasury and certain state-owned companies
1.5 Selling prices
4. Purchase of steel products 0.30 5. Purchase of automotive products 0.45 Selling prices 6. Purchase of paper products 0.10 Selling prices 7. Purchase of cement 0.25 Selling prices 8. Purchase of cigarettes 0.15 Retail selling prices (Bandrol)
Notes: 1. The tax is exempt, either automatically or based on an Exemption Certificate issued by the DGT, for these types of imports:
a. Import of goods exempted from import duties and VAT; b. Temporary import of goods (to be re-exported); c. Re-import of goods (to be repaired or tested for subsequent re-export).
36
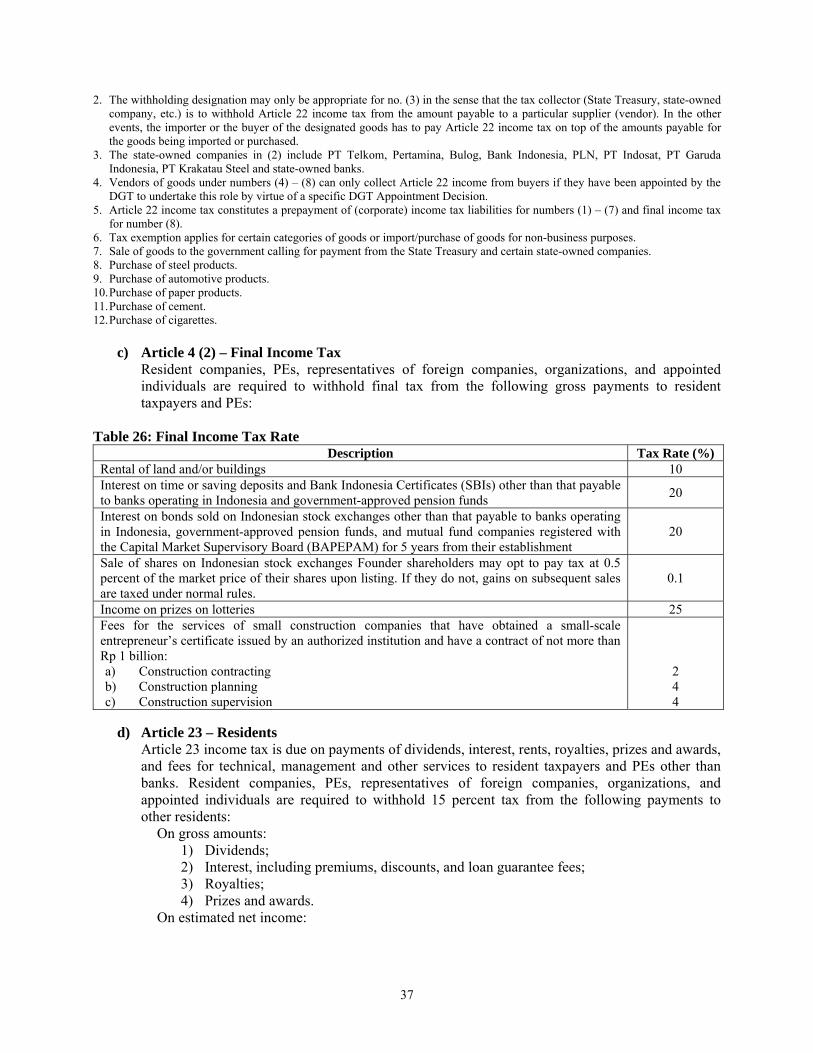
2. The withholding designation may only be appropriate for no. (3) in the sense that the tax collector (State Treasury, state-owned company, etc.) is to withhold Article 22 income tax from the amount payable to a particular supplier (vendor). In the other events, the importer or the buyer of the designated goods has to pay Article 22 income tax on top of the amounts payable for the goods being imported or purchased.
3. The state-owned companies in (2) include PT Telkom, Pertamina, Bulog, Bank Indonesia, PLN, PT Indosat, PT Garuda Indonesia, PT Krakatau Steel and state-owned banks.
4. Vendors of goods under numbers (4) – (8) can only collect Article 22 income from buyers if they have been appointed by the DGT to undertake this role by virtue of a specific DGT Appointment Decision.
5. Article 22 income tax constitutes a prepayment of (corporate) income tax liabilities for numbers (1) – (7) and final income tax for number (8).
6. Tax exemption applies for certain categories of goods or import/purchase of goods for non-business purposes. 7. Sale of goods to the government calling for payment from the State Treasury and certain state-owned companies. 8. Purchase of steel products. 9. Purchase of automotive products. 10. Purchase of paper products. 11. Purchase of cement. 12. Purchase of cigarettes.
c) Article 4 (2) – Final Income Tax Resident companies, PEs, representatives of foreign companies, organizations, and appointed individuals are required to withhold final tax from the following gross payments to resident taxpayers and PEs:
Table 26: Final Income Tax Rate
Description Tax Rate (%)Rental of land and/or buildings 10 Interest on time or saving deposits and Bank Indonesia Certificates (SBIs) other than that payable to banks operating in Indonesia and government-approved pension funds 20
Interest on bonds sold on Indonesian stock exchanges other than that payable to banks operating in Indonesia, government-approved pension funds, and mutual fund companies registered with the Capital Market Supervisory Board (BAPEPAM) for 5 years from their establishment
20
Sale of shares on Indonesian stock exchanges Founder shareholders may opt to pay tax at 0.5 percent of the market price of their shares upon listing. If they do not, gains on subsequent sales are taxed under normal rules.
0.1
Income on prizes on lotteries 25 Fees for the services of small construction companies that have obtained a small-scale entrepreneur’s certificate issued by an authorized institution and have a contract of not more than Rp 1 billion: a) Construction contracting b) Construction planning c) Construction supervision
2 4 4
d) Article 23 – Residents
Article 23 income tax is due on payments of dividends, interest, rents, royalties, prizes and awards, and fees for technical, management and other services to resident taxpayers and PEs other than banks. Resident companies, PEs, representatives of foreign companies, organizations, and appointed individuals are required to withhold 15 percent tax from the following payments to other residents:
On gross amounts: 1) Dividends; 2) Interest, including premiums, discounts, and loan guarantee fees; 3) Royalties; 4) Prizes and awards.
On estimated net income:
37

Compensation for the following services, including rentals, are subject to Article 23 withholding tax at 15 percent of the estimated net income (ENI), which is a specified percentage of the gross compensation.
Table 27: Article 23 ENI & Effective Tax Rate
ENI and effective tax rate (%) 10 131/3 20 262/3 30 Services 1.5 2 3 4 4.5
1. Rentals of land transportation vehicles ● 2. Rentals of other assets, excluding land and buildings ● 3. Technical services ● 4. Management services ● 5. Consulting except construction consulting ● 6. Construction supervision ● 7. Construction planning ● 8. Appraisal ● 9. Actuary ● 10. Accounting ● 11. Designing ● 12. Drilling services in oil and gas mining except those performed by
permanent establishment ●
13. Support services in oil and gas mining ● 14. Mining services other than oil and gas support ● 15. Flight and airport support services ● 16. Forest felling ● 17. Waste processing ● 18. Labour supply ● 19. Intermediary ● 20. Custodianship and storage services except those performed by
stock exchanges, KSEI, and KPEI ●
21. Sound dubbing ● 22. Film mixing ● 23. Computer and software-related services ● 24. Installation (electricity, machinery, telephone equipment, etc.) ● 25. Maintenance and improvement (electricity, machinery, telephone
equipment, etc.) ●
26. Construction contracting ● 27. Manufacturing services (Maklon) ● 28. Investigation and security ● 29. Event organizer ● 30. Packaging ● 31. Provision of space and/or time for disseminating information ● 32. Pest eradication ● 33. Cleaning Services ● 34. Catering ●
e) Article 26 – Non-residents
Resident taxpayers, organizations, and representatives of foreign companies are required to withhold 20 percent tax from the following payments to non-residents:
On gross amounts:
1) Dividends; 2) Interest, including premiums, discounts (interest), swap premiums, and guarantee fees; 3) Royalties, rents and payments for the use of assets; 4) Fees for services, work, and activities; 5) Prizes and awards; 6) Pensions and any other periodic payments;
38
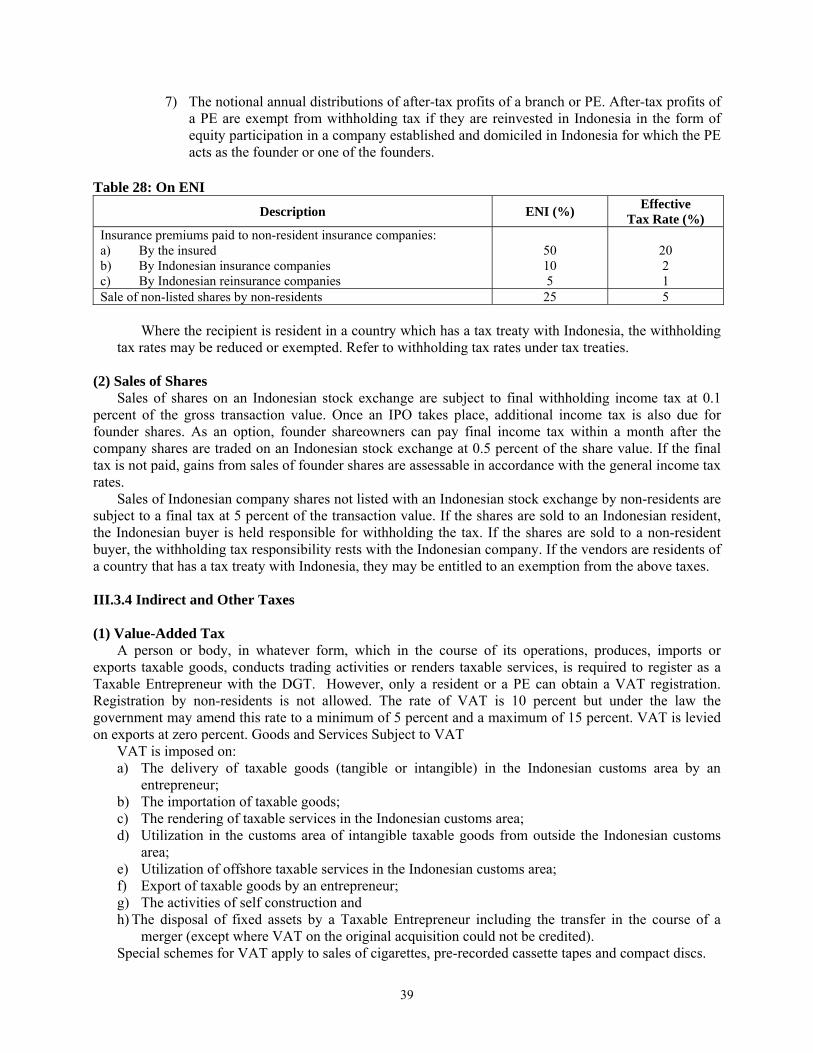
7) The notional annual distributions of after-tax profits of a branch or PE. After-tax profits of a PE are exempt from withholding tax if they are reinvested in Indonesia in the form of equity participation in a company established and domiciled in Indonesia for which the PE acts as the founder or one of the founders.
Table 28: On ENI
Description ENI (%) Effective Tax Rate (%)
Insurance premiums paid to non-resident insurance companies: a) By the insured b) By Indonesian insurance companies c) By Indonesian reinsurance companies
50 10 5
20 2 1
Sale of non-listed shares by non-residents 25 5
Where the recipient is resident in a country which has a tax treaty with Indonesia, the withholding tax rates may be reduced or exempted. Refer to withholding tax rates under tax treaties.
(2) Sales of Shares
Sales of shares on an Indonesian stock exchange are subject to final withholding income tax at 0.1 percent of the gross transaction value. Once an IPO takes place, additional income tax is also due for founder shares. As an option, founder shareowners can pay final income tax within a month after the company shares are traded on an Indonesian stock exchange at 0.5 percent of the share value. If the final tax is not paid, gains from sales of founder shares are assessable in accordance with the general income tax rates.
Sales of Indonesian company shares not listed with an Indonesian stock exchange by non-residents are subject to a final tax at 5 percent of the transaction value. If the shares are sold to an Indonesian resident, the Indonesian buyer is held responsible for withholding the tax. If the shares are sold to a non-resident buyer, the withholding tax responsibility rests with the Indonesian company. If the vendors are residents of a country that has a tax treaty with Indonesia, they may be entitled to an exemption from the above taxes. III.3.4 Indirect and Other Taxes (1) Value-Added Tax
A person or body, in whatever form, which in the course of its operations, produces, imports or exports taxable goods, conducts trading activities or renders taxable services, is required to register as a Taxable Entrepreneur with the DGT. However, only a resident or a PE can obtain a VAT registration. Registration by non-residents is not allowed. The rate of VAT is 10 percent but under the law the government may amend this rate to a minimum of 5 percent and a maximum of 15 percent. VAT is levied on exports at zero percent. Goods and Services Subject to VAT
VAT is imposed on: a) The delivery of taxable goods (tangible or intangible) in the Indonesian customs area by an
entrepreneur; b) The importation of taxable goods; c) The rendering of taxable services in the Indonesian customs area; d) Utilization in the customs area of intangible taxable goods from outside the Indonesian customs
area; e) Utilization of offshore taxable services in the Indonesian customs area; f) Export of taxable goods by an entrepreneur; g) The activities of self construction and h) The disposal of fixed assets by a Taxable Entrepreneur including the transfer in the course of a
merger (except where VAT on the original acquisition could not be credited). Special schemes for VAT apply to sales of cigarettes, pre-recorded cassette tapes and compact discs.
39
(2) Collection, Filing and Payment of Tax
VAT is determined by applying the tax rate of 10 percent to the sale, replacement or import price. The sales price is the money value including all costs of delivery, installation, insurance, technical and maintenance, commission, guarantees, interest and others, as long as they relate to the delivery of goods. Compensation for services is the money value, including all costs, which relate to the delivery of the services. Excluded from the sales price, are sales tax and discounts and rebates, as long as these are included on the tax invoice. For imported goods, the import value is the value used as the basis for calculating the import duty together with other levies imposed on the basis of the provisions in the customs law, but excluding VAT and Sales Tax on Luxurious Goods.
In cases where a special relationship exists between 2 parties involved in a transaction, the DGT may substitute a market price that becomes the basis on which the VAT is charged. Monthly remittances are required for the excess of output VAT over input VAT. Output VAT is VAT charged by a taxable entity on its sales of goods and services. Conversely, input VAT is the VAT incurred on purchases of goods and services used in the business. If input VAT exceeds output VAT for any month, a refund can be claimed. A refund claim triggers a tax audit. Input VAT, supported by a valid tax invoice, is only creditable if it is reported within three months after the end of the period stated in the tax invoice. There is a self-collection obligation in relation to input tax on offshore services purchased from non-residents for the benefit of residents. Certain government bodies, production sharing contractors and mining companies are subject to special rules as they are designated VAT collectors. These bodies are obliged to remit VAT related to their purchases directly to the tax authorities. (3) Credit of Input VAT
Input VAT can be credited against output VAT except for: a) Purchases not directly for business activities (e.g. costs for staff welfare or benefits); b) Purchases before registration as a “VAT-able” business; c) Purchases of certain passenger vehicles; d) Purchases with an incomplete VAT invoice; e) VAT stated in a simple VAT invoice; f) VAT collected through an assessment notice; g) VAT not declared in the VAT return which is discovered in a tax audit and h) VAT on expenditure relating to activities which are not subject to VAT.
(4) Exemptions and Relieves
The principal activities not subject to VAT are as follows: a) Goods produced by mining or drilling that are taken directly from their source, i.e. crude oil,
natural gas, geothermal energy, sand and gravel, coal (before processed into briquettes), and ores of iron, tin, gold, copper, nickel, silver and bauxite;
b) Basic necessities needed by the populace as a whole, i.e. rice, corn, sago, soybeans and salt; c) Money, gold ingots and negotiable instruments; d) Banking, insurance, leasing services and securities; e) Manpower services; f) Social, health, religious and education services; g) Public transportation, postal services, non-commercial broadcasting; h) Entertainment services; i) Hotel and catering services and j) Government services.
The following goods and services are granted an exemption from VAT: a) Machinery and capital equipment in certain situations; b) Electricity (unless for housing with capacity exceeding 6,600 watts); c) Piped water;
40

d) Livestock, poultry and fish feed and/or raw materials for the preparation thereof; e) Certain agricultural crops in their natural state delivered by farmers; f) Seeds from agricultural, plantation, forestry, animal husbandry, breeding and fishery sources; g) Polio vaccines; h) Textbooks; i) Charter or purchase of ships used by national shipping and fishing companies, together with
related components; j) Charter or purchase of aircrafts used by national airline companies, together with related
components; k) Purchase of railway trains by PT Kereta Api Indonesia and related components; l) Construction and sale of simple houses of various types and m) Equipment and supplies of certain kinds used by Defense and Police forces.
(5) Relief for Export Manufacturers
There are a number of relief schemes to allow exporter manufacturers to operate on a virtually VAT and duty-free basis. Such schemes include bonded zones, economic development zones (KAPET) and free trade areas. The Government has approved a number of Bonded Areas located throughout Indonesia. Free trade areas and free ports are located in Indonesia but are considered outside the customs area and, therefore, goods brought into these areas are exempt from import duties, VAT and STLG. Business activities that can be carried out in a free trade area include, among others, trade, services, mining, transportation, banking and manufacturing. Sabang, Batam, Bintan and Karimun are currently the free trade areas in operation.
An import incentive is granted to a manufacturer who imports raw materials to be used for processing, assembling, or installing in goods, provided those goods will be 100 percent exported. A manufacturer must be registered in order to be entitled to this incentive. A bank guarantee or customs bond is required for the full amount of the import duty, excise, VAT and STLG that would otherwise have been payable. When the goods are exported, the guaranty or bond is released. A refund can be granted on any import duty, excise and tax paid on imported goods that are later used in producing items for export. Under this facility, 25 percent of the goods may be sold on the domestic market provided the duties and taxes are paid on that portion. (6) Sales Tax on Luxury Goods
The VAT law also imposes a STLG on deliveries of luxury goods by manufacturers in Indonesia and on the importation of luxury goods. The rates vary depending on the category of the goods. The current rates range from 10 percent up to 75 percent. Conceptually, this tax is charged only once. Like VAT, no STLG is charged on the export of luxury goods. STLG is calculated by multiplying the applicable rate against the sales price or import price, excluding VAT. The STLG payable on the purchase of luxury goods can not be credited against the VAT collectable when the goods are subsequently sold.
In broad terms, some of the main types of goods subject to STLG include: a) Passenger vehicles; b) Alcoholic beverages; c) Certain food and non-alcoholic beverage products; d) Household appliances and electronic goods; e) Cosmetics and f) Luxury homes and apartments. It is necessary to determine the applicability of the STLG on a case-by-case basis as the rules are
complex and subject to change. There is an exemption from STLG on certain items for public use. III.3.5 Customs Duties
Customs duties are imposed on items imported into Indonesia. Customs duties are generally imposed on an ad valorem basis. Duties are payable based on the Harmonized System (HS) classification. Duties
41

are based on the cost, insurance and freight (CIF) value of the imported item and, in general, are imposed at rates of zero percent to 20 percent for most goods, 25 percent to 80 percent for cars, and 170 percent for alcoholic drinks.
Since April 1997, new Customs procedures have been in force. These procedures are based upon General Agreement on Tariffs and Trade (GATT) principles. The previous system of pre-shipment inspection by independent surveyors was replaced with post-arrival control procedures exercised by Customs officials.
Some key features of the current system are: a) Ports have a red and green channel system for imported goods. Red channel goods are all
inspected. Green channel goods should not normally be inspected unless there is some justification;
b) Duties and taxes shown on the import declaration must be paid through a designated bank in order for the goods to be released;
c) Valuation of goods is based on GATT conventions and d) The accuracy of the declaration and value is subject to subsequent audit of the importer’s records. Simplified procedures apply for goods entering bonded areas. Special rules apply for imports in the oil
and gas sector, and goods for government projects funded by loans or grants from other governments. Import duties are not payable in certain circumstances including: a) Imports used in the production of exports where the manufacturer is located in a bonded zone or
free trade area or which are registered for the KITE (import facility for export purposes) facility, formerly known as the BAPEKSTA facility and
b) Certain imports by the petroleum, geothermal and mining industries. Other relief includes:
a) For certain goods, which are imported on a temporary basis, the importer must pay 2 percent of the import duty and VAT each month for the period of usage. The remaining amount can be guaranteed. If the goods are not re-exported, the full amount of import duty and taxes plus a 100 percent penalty on the import duty must be paid and
b) Import duty tariffs are reduced to 5 percent on importation of goods by approved foreign and domestic investment companies using Master list facilities.
The ASEAN Free Trade Area (AFTA) is a free trade area covering the members of Association of South East Asian Nations (ASEAN). Under AFTA, ASEAN will become a free trade area with no tariff or non-tariff barriers on cross border transactions between ASEAN countries by 2015. To achieve the AFTA goal, the Common Effective Preferential Tariff (CEPT) was introduced as a mechanism to lower tariff rates on a wide variety of goods.
The first 6 signatories to the CEPT scheme – Brunei Darussalam, Indonesia, Malaysia, the Philippines, Singapore and Thailand – agreed to reduce tariffs to 0 percent to 5 percent on a large number of goods. These countries also agreed to the elimination of import duties on all Inclusion List goods traded in AFTA by 2010. The other 4 ASEAN member countries – Cambodia, Laos, Myanmar and Vietnam – have agreed to eliminate tariff barriers by the year 2015. III.3.6 Tax Treaties
Indonesia’s tax treaties provide for tax benefits in the form of withholding tax exemption for service fees and reduced withholding tax rates for dividends, interest, royalties, and branch profit tax received by residents of a country with which Indonesia has signed a tax treaty. Tax exemption on the service fees is typically granted only if the foreign party earning the income does not have a PE in Indonesia.
To claim the reduced rates, the foreign party must, at the least, present its certificate of residence (CoR) to the DGT through the Indonesian party paying the income. Without this document, entitlement to the tax benefit is denied and tax will be withheld at 20 percent. For interest, dividends, and royalties, only the beneficial owner is acknowledged as the party entitled to the tax treaty benefits. Beneficial owner is not clearly defined in tax law and regulations. However, conduit companies, pass-through companies, paper companies and the like are declared as non-beneficial owners.
42

The withholding tax rates applicable under tax treaties are summarized below: Table 29: Tax Treaty
Country Dividends (1) Interest (2) Royalties Algeria 15 15 15 Australia 15 10 10/15(3) Austria 10/15 10 10 Bangladesh 10/15 10 10 Belgium 10/15 10 10 Brunei 0/15 15 0/15(4) Bulgaria 15 10 10 Canada 10/15 10 10(5) China, P.R. 10 10 10 Czech Republic 10/15(6) 12.5 12.5 Denmark 10/20 10 15 Egypt 15 15 15 Finland 10/15 10 10/15(7) France 10/15 10/15(8) 10(9) Germany 10/15 10 7.5/10/15(10) Hungary 15 15 15 India 10/15 10 15 Italy 10/15 10 10/15(11) Japan 10/15(12) 10 10 Jordan 10 10 10 Korea, (Rep. of) 10/15 10 15 Korea (Dem. Rep) 10 10 10 Kuwait 0/10(4) 5 20 Luxemburg 10/15 10 10/12.5(10) Malaysia 15 15 15 Mexico 10 10 10 Mongolia 10 10 10 Netherlands 10 0/10(13) 10(14) New Zealand 15 10 15 Norway 15 10 10/15(15) Pakistan 10/15 15 15 Philippines 15/20 10/15 15 Poland 10/15(6) 10 15 Romania 12.5/15 12.5 12.5/15(15) Russia 15 15 15 Seychelles 10 10 10 Singapore 10/15 10 15 Slovak Republic 10 10 10/15(7) South Africa 10/15(16) 10 10 Spain 10/15 10 10 Sri Lanka 15 15 15 Sudan 10 15 10 Sweden 10/15 10 10/15(11) Switzerland 10/15 10 5/12.5(10) Syria 10 10 15/20(7) Taiwan 10 10 10 Thailand 15 15 10/15(7) Tunisia 12 12 15 Turkey 10/15 10 10 Ukraine 10/15(6) 10 10 United Arab Emirates 10 5 5 United Kingdom 10/15(17) 10 10/15(18) United States 10/15(12) 10 10 Uzbekistan 10 10 10 Venezuela 10/15 10 10/20(10) Vietnam 15 15 15
Notes: 1. Dividends - lower rate generally applies where shareholding exceeds 25 percent 2. Interest - interest paid to governments, or subdivisions thereof, is generally exempt 3. Royalties - lower rate applies to industrial, scientific or commercial equipment or information 4. Lower rate applies on payments to Government 5. Definition of royalties excludes technical services 6. Dividends - lower rate based on holding exceeding 20 percent
43

7. Lower rate applies to copyright 8. Interest - 10 percent rate applies to certain industries 9. Definition of royalties excludes use of equipment 10. Royalties - lowest rate applies to payments for technical services 11. Royalties - lower rate applies for equipment and information 12. Dividends - lower rate applies where voting stock exceeds 25 percent 13. Interest - zero percent applies on certain loans but application of clause under dispute 14. Royalties - definition excludes technical services 15. Royalties - lower rate applies other than copyright 16. Dividends - lower rate based on holding exceeding 10 percent 17. Dividends - lower rate applies where voting stock exceeds 15 percent 18. Royalties - lower rate applies on use of equipment III.3.7 Anti-Avoidance Rules
The income tax law contains specific anti-avoidance provisions. Where the Indonesian DGT considers that transactions have not been conducted at arm’s length due to the existence of a “special relationship” between the parties, the consideration paid may be adjusted. The DGT’s power extends to all domestic and cross border transactions. In addition to the power of the DGT to adjust transfer prices, there are thin capitalization considerations and controlled foreign company rules. These are summarized below. (1) Transfer Pricing
Any transaction determined to be “non arm’s length” may be subject to adjustment by the DGT, including:
a) Unreasonable selling prices; b) Unreasonable purchase prices; c) Allocation of overhead costs; d) Interest rates applied to inter-company loans; e) Payments of commissions, license fees, franchise fees, rentals, royalties and compensation for
managerial, technical and other services; f) Purchases of a company’s assets by shareholders (owners) or parties having a special relationship
at prices that are lower than market prices and g) Sale of goods to foreign partners through third parties having no substantive business (such as a
dummy company, letter-box company or re-invoicing center). A special relationship includes: a) A relationship between 2 or more taxpayers that are under common ownership or control, whether
directly or indirectly; b) A relationship between a taxpayer that owns 25 percent or more of the capital of another party, or
a relationship between a taxpayer that owns 25 percent or more of 2 or more parties, and the relationship between the 2 or more parties last mentioned and
c) A family relationship, either of the same blood or by marriage in one straight descent line and or one degree sideways.
It is important to note that the transfer pricing rules apply to domestic as well as international transactions. The DGT may enter into Advance Pricing Agreements (APA) on prices with companies and other tax jurisdictions. The DGT is still considering the policies and procedures that will be adopted in establishing such APAs. As an addition, based on elucidation of the amended Income Tax Law, profit split method and transaction net margin method can be regarded as ‘other’ transfer pricing methods that can be used by taxpayers having related party transactions for determination of the arm’s length pricing. (2) Permanent Establishment
A permanent establishment (PE) is any establishment that is regularly used to carry on business in Indonesia by an organization not established or domiciled in Indonesia, which might be in the form of: a place of management; branch office; representative office; office building, factory or workshop; a construction, installation or assembly project; a mine or natural resource site; a fishing area, a livestock breeding area, an agricultural area, plantation or forest area; a dependent agent; services rendered by an
44

employee or other person in whatever form for more than 60 days in a 12-month period; an insurance company not established or domiciled in Indonesia receiving insurance premiums or insuring risks in Indonesia; a consulting team; an individual or body acting on behalf of a body not established or domiciled in Indonesia. An individual or organization, which acts on behalf of a company domiciled abroad, may create a PE in Indonesia for the foreign company if a dependent agency is considered to exist.
In the absence of treaty provisions to the contrary, a PE is taxed on: a) Income from business activities of the PE and from property controlled or owned by the PE; b) Income of the head office of the same legal entity where the income is from a business activity or
the sale of goods and provision of services in Indonesia of the same type as those carried out by the PE in Indonesia and
c) Income in the form of dividends, royalties, interest payments and fees for services received by the head office, as long as there is an effective relationship between the PE and the property or operation producing the income.
A PE is therefore taxed on income from its own business activities as well as on certain items of income received by the head office. A PE is also subject to a branch profits tax of 20 percent, unless reduced by a tax treaty. (3) Thin Capitalization
Where a special relationship exists, interest may be disallowed as a deduction where such charges are considered excessive, such as interest rates in excess of commercial rates. Interest-free loans from shareholders may in certain cases create a risk of deemed interest being imposed, giving rise to withholding tax obligations for the borrower. The law allows the MOF to issue a decree defining the maximum ratio of debt to equity in determining deductible interest. Such a decree, proposing a maximum 3:1 ratio for all industries, was issued in 1984. However, a subsequent decree postponed its implementation indefinitely. The DGT later issued a draft proposal for a 5:1 ratio; however this has never been finalized. Special rules on tax deductibility of interest apply in the mining, and oil and gas sectors. (4) Controlled Foreign Company (CFC) Provisions
From January 1, 1995, CFC rules became effective under which Indonesian resident shareholders may be subject to tax on deemed dividends. A CFC is defined as a foreign corporation in which an Indonesian resident individual or corporate shareholder, either individually or as a group, hold 50 percent or more of the total paid in capital. Listed corporations are not CFCs. The countries where CFC rules apply are mainly low or no-tax jurisdictions.
1. Argentina 17.Macao 2. Bahamas 18.Mauritius 3. Bahrain 19.Mexico 4. Belize 20.Netherlands Antilles 5. Bermuda 21.Nicaragua 6. British Isles 22.Panama 7. British Virgin Islands 23.Paraguay 8. Cayman Islands 24.Peru 9. Channel Island Guernsey 25.Qatar 10.Channel Island Jersey 26.St.Lucia 11.Cook Islands 27.Saudi Arabia 12.El Salvador 28.Uruguay 13.Estonia 29.Venezuela 14.Hongkong 30.Vanuatu 15.Liechtenstein 31.Greece 16.Lithuania 32.Zambia The reference to British Isles (No. 6 above) is believed to apply to the Channel Isles and the Isle of
Man.
45

(5) Additional Anti-Avoidance Provisions
a) Use of SPVs to Purchase Shares: If a taxpayer uses another party or an SPV to acquire shares or a company’s assets the taxpayer will be regarded as the beneficial owner if there is a special relationship with that other party/the SPV and the purchase price is not an arms-length price.
b) Sale of Shares in Conduit Company: Where a conduit company (established or domiciled in a tax haven country) has a special relationship with an entity established or domiciled in Indonesia or a PE, then income from the sale/transfer of shares in the conduit company will be regarded as income from the sale/transfer of shares in the entity or the PE. Thus a non-resident selling share in the conduit company will be subject to 5 percent withholding tax under Article 26(2).
c) Offshore Salary Splitting: The amount of income of an individual who is an Indonesian tax resident may be re-determined if the employer has a special relationship with another company that is not established or domiciled in Indonesia and the employer transfers some or all of the income of the individual to that company in the form of expenses or other payments.
III.3.8 Stamp Duty
Stamp duty is nominal, at either Rp 6,000 or Rp 3,000 on certain documents. Examples of documents which are subject to stamp duty include: a) Letters of agreement and other letters (such as authorization letters, letters bestowing gifts,
declarations) which are prepared for the purpose of being used as evidence of act, fact, or condition of a civil nature.
b) Notarial deeds and their copies. c) Deeds prepared by a designated land notary (Pejabat Pembuat Akta Tanah). d) All documents bearing a sum of money which:
1) state the receipt of money; 2) state the recording or deposit of money in a bank; 3) contain notification of a bank balance; 4) contain the acknowledgement of debt wholly or partly paid or compensated; 5) are in the form of valuable documents such as drafts, promissory notes, acceptances; 6) are in the form of securities in whatever name or form; 7) are in the form of cheques
e) Documents to be used as instruments of evidence before a court: 1) ordinary letters or internal papers; 2) papers originally exempt from stamp duty on the basis of their purpose of use, if they serve
other aims or are used by other parties, and deviate from their original purpose. The Rp 6,000 rate is applicable to (a), (b), (c), and (e). For (d), the rate is Rp 6,000 when the money
value stated in the document is more than Rp 1 million, and Rp 3,000 when the value is between Rp 250,000 and Rp 1 million. Values below Rp 250,000 are not subject to stamp duty. For cheques, the rate is Rp 3,000 regardless of the money value stated. III.3.9 Land and Building (1) Land and Building Tax
Land and Building (L&B) tax is a type of property tax chargeable on every piece of land and/or building unless stated differently. The negative list containing L&B not subject to L&B tax includes those:
a) Used merely for the public interest in the areas of religious and social affairs, health, education and national culture, and not for the purpose of profit earning;
b) Used for a cemetery, ancient heritage or the like; c) Constituting protected forests, natural reserve forests, tourism forests, national parks, Grazing land
controlled by a village, and state land not yet charged with any right; d) Used by a diplomatic representative, based on the reciprocal treatment principle;
46

e) Used by an agency or representative of an international organization, as determined by the MoF. L&B tax rate is specified at 0.5 percent. The actual tax due for a particular object is calculated by
applying the tax rate to the taxable sale value (NJKP) of the object. NJKP is a predetermined proportion of the sale value of the tax object (NJOP) of a particular L&B. NJKP is currently stipulated to be either 20 percent (for NJOP up to Rp 1 billion) or 40 percent (for NJOP above Rp 1 billion). The government can increase the NJKP rate up to 100 percent of the NJOP. Hence, the effective L&B tax at present is either 0.1 percent or 0.2 percent of the NJOP.
NJOPs are to be determined by the DGT on behalf of the MoF and may be updated every one to three years depending on the economic development of the relevant regions. In accordance with MoF guidelines, NJOPs should take into account the market value of the L&B in the relevant regions. Where a piece of L&B is used for a business in the areas of plantation, forestry, mining, or breeding, the NJOP should also take into account the investment standard applicable thereon. L&B tax is payable annually pursuant to an official assessment issued by the DGT. The assessment process is typically initiated by the DGT submitting a Tax Object Notification Form (TONF) to a particular taxpayer. The form must be filled out by the taxpayer with the relevant data and returned to the DGT within 30 days. Based on the completed TONF and taking into account the NJOP-related information, the DGT issues a Tax Due Notification Letter (TDNL), presenting the official tax assessment made by the DGT. The taxpayer concerned has to pay the tax due within 6 months of receipt of the TDNL. Incorrectly filling in a TONF, late filing of the completed TONF, or ignoring the TONF can expose a taxpayer to a potential penalty of 25% of the L&B tax due.
An individual or an organization that “owns a right to a piece of land, and/or takes benefits there from, and/or owns, controls, and/or takes benefits from a building” can by law be regarded as the L&B tax taxpayer in respect of that piece of land and/or building. Each taxpayer is entitled to a non-taxable NJOP, which at present is stipulated to be Rp 12,000,000. The MoF is authorized by law to make adjustments to the non-taxable NJOP. (2) Tax on Land and Building Rights Transfer
A transfer of L&B rights will call for a tax on L&B right transfers to be charged to the transferor. The tax is specified to be 5 percent of the gross transfer value (tax base). This tax must be paid by the time the rights to L&B are transferred to the transferee. In general, the tax base is the higher of the transaction values stated in the relevant L&B right transfer deed or NJOP. However, in a transfer to the government, the tax base is the amount officially stipulated by the relevant governmental officer in the relevant document.
In a government-organized auction, the gross transfer value is the value stipulated in the relevant deed of auction. If the transferor is a corporate taxpayer not engaged in the property development business, the tax paid will constitute a prepayment of its corporate tax liability (Article 25 income tax). This tax is exempt if the transferor is a corporate taxpayer engaged in the property development business and the transfer is undertaken in the course of its business activities. Foundations and individual taxpayers, including individuals engaged in the business of L&B rights transfers, are also required to pay this tax on the transfers of L&B rights. In this respect, this tax constitutes a final tax. A notary is prohibited from signing a transfer of rights deed until the above taxes have been fully paid. (3) Duty on the Acquisition of Land and Building Rights
A transfer of L&B rights will typically also give rise to a liability of DAL&BR to the party receiving or obtaining the rights. Qualified L&B rights transfers include sale-purchase and trade-in transactions, grants, inheritances, contributions to a corporation, rights separations, the buyer designation in an auction, and the execution of a court decision with full legal force, business mergers, consolidations, expansions, and prize deliveries. Acquisitions of L&B rights in certain non-business transfers may be exempt from DAL&BR. DAL&BR is to be based on the Tax Object Acquisition Value (NPOP), in most cases being the higher of the market (transaction) value or the NJOP of the L&B rights concerned. The tax due for a particular event is determined by applying the applicable duty rate (5 percent) to the relevant NPOP minus
47

an allowable non-taxable threshold. The non-taxable threshold amount varies by region, the maximum being Rp 60 million, except for inheritance which may reach Rp 300 million. With a government regulation, the government may change the non-taxable threshold.
DAL&BR is typically due on the signing date of the relevant deed of L&B right transfer before a public notary. In a business merger, consolidation, or expansion, the duty is due on the date of signing of the merger, consolidation or expansion act. In an auction, the duty is due on the signing date of the Auction Report by the authorized officer. At the request of a taxpayer, the DGT may grant a DAL&BR reduction of up to 50 percent in respect of L&B rights transfers in business mergers or consolidation at book value as well as L&B rights obtained as compensation for the release of L&B rights for a public-interest governmental project. In certain non-business L&B rights transfers, at the request of a taxpayer, the DGT may also grant DAL&BR at 25 percent, 50 percent or 75 percent of the duty due. A notary is prohibited from signing a deed transferring rights until the DAL&BR has been paid. III.3.10 Tax Incentives (1) Takeovers, Mergers and Acquisitions
Assets may be transferred at book value as part of a merger or in the context of certain other reorganizations, subject to prior approval from the DGT. In addition, there may be partial relief from the 5 percent transfer of title tax on land and buildings and full relief from the 5 percent income tax on the transfer of land and buildings.
The following rules apply: a) An application must be filed with the DGT; b) Tax liabilities of the companies involved must be settled. Any overpaid tax in a company’s
account can be credited to the transferee after DGT audit; c) Tax losses can be carried forward from transferor to transferee companies provided a revaluation
of fixed assets on or prior to transfer is performed. Active business requirements must also be met; d) Depreciation of assets must be based on the remaining useful life of the assets and e) The transferee must record the book value immediately prior to the transfer (taking account of any
revaluation to obtain the loss carry forward benefit). The transfer of assets during a merger is subject to VAT according to normal rules and requirements.
(2) Direct Tax Incentives for New Enterprises
New enterprises organized under the Foreign or Domestic Capital Investment laws may apply for an exemption from the income tax payable on the importation of capital goods and raw materials. New enterprises should secure an exemption certificate from the DGT where the new enterprise is registered. The exemption is granted for goods indicated in the Master list and must be applied for each year.
(3) Investment in Certain Business Fields and or Certain Regions
Income tax facilities are available for investment in 15 selected sectors and 9 selected locations, effective January 1, 2007. Please also note the following section detailing tax facilities in the economic development zones (“KAPET”).
The tax facilities for the selected sectors/regions comprise of 4 incentives: a) Additional tax deduction of 5 percent of the realized capital investment (depreciable and non-
depreciable assets) each year up to 6 years (revoked if assets are transferred during facility period); b) Option to use accelerated tax depreciation at double normal rates; c) The period for tax loss carry forward may be extended to 10 years (instead of 5 years) and d) Withholding tax on dividends to non-resident shareholders is reduced to 10 percent (or a lower
DTA rate). The selected business sectors are economic sectors that have high priority on a national scale,
particularly in respect of boosting exports. The selected regions are remote regions, which are economically potentially worthy of development but whose economic infrastructure is generally
48
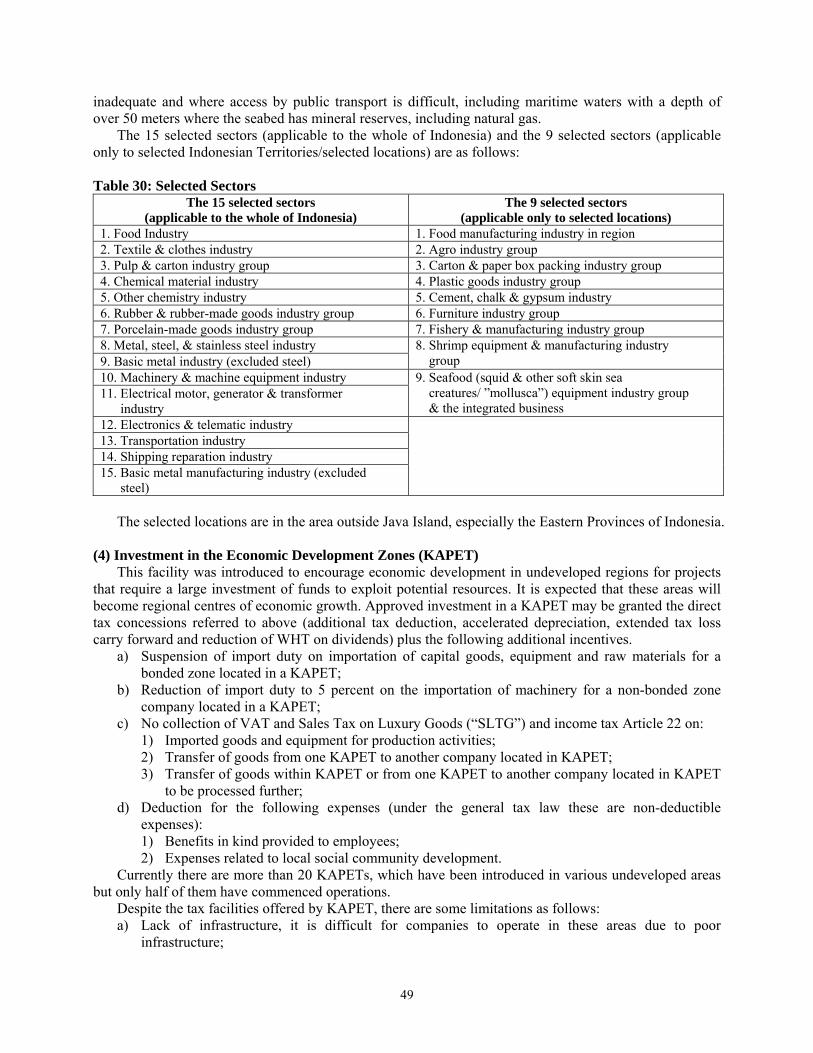
inadequate and where access by public transport is difficult, including maritime waters with a depth of over 50 meters where the seabed has mineral reserves, including natural gas.
The 15 selected sectors (applicable to the whole of Indonesia) and the 9 selected sectors (applicable only to selected Indonesian Territories/selected locations) are as follows: Table 30: Selected Sectors
The 15 selected sectors (applicable to the whole of Indonesia)
The 9 selected sectors (applicable only to selected locations)
1. Food Industry 1. Food manufacturing industry in region 2. Textile & clothes industry 2. Agro industry group 3. Pulp & carton industry group 3. Carton & paper box packing industry group 4. Chemical material industry 4. Plastic goods industry group 5. Other chemistry industry 5. Cement, chalk & gypsum industry 6. Rubber & rubber-made goods industry group 6. Furniture industry group 7. Porcelain-made goods industry group 7. Fishery & manufacturing industry group 8. Metal, steel, & stainless steel industry 9. Basic metal industry (excluded steel)
8. Shrimp equipment & manufacturing industry group
10. Machinery & machine equipment industry 11. Electrical motor, generator & transformer industry
9. Seafood (squid & other soft skin sea creatures/ ”mollusca”) equipment industry group & the integrated business
12. Electronics & telematic industry 13. Transportation industry 14. Shipping reparation industry 15. Basic metal manufacturing industry (excluded steel)
The selected locations are in the area outside Java Island, especially the Eastern Provinces of Indonesia.
(4) Investment in the Economic Development Zones (KAPET)
This facility was introduced to encourage economic development in undeveloped regions for projects that require a large investment of funds to exploit potential resources. It is expected that these areas will become regional centres of economic growth. Approved investment in a KAPET may be granted the direct tax concessions referred to above (additional tax deduction, accelerated depreciation, extended tax loss carry forward and reduction of WHT on dividends) plus the following additional incentives.
a) Suspension of import duty on importation of capital goods, equipment and raw materials for a bonded zone located in a KAPET;
b) Reduction of import duty to 5 percent on the importation of machinery for a non-bonded zone company located in a KAPET;
c) No collection of VAT and Sales Tax on Luxury Goods (“SLTG”) and income tax Article 22 on: 1) Imported goods and equipment for production activities; 2) Transfer of goods from one KAPET to another company located in KAPET; 3) Transfer of goods within KAPET or from one KAPET to another company located in KAPET
to be processed further; d) Deduction for the following expenses (under the general tax law these are non-deductible
expenses): 1) Benefits in kind provided to employees; 2) Expenses related to local social community development.
Currently there are more than 20 KAPETs, which have been introduced in various undeveloped areas but only half of them have commenced operations.
Despite the tax facilities offered by KAPET, there are some limitations as follows: a) Lack of infrastructure, it is difficult for companies to operate in these areas due to poor
infrastructure;
49

b) Limited skilled labour supply from local communities and c) Logistics may be difficult due to the remote locations. KAPET areas include: a) Papua Province: Biak; b) Kalimantan: Sanggau, Kakab, Batulicin, Sasamba; c) Maluku: Seram; d) Nusatenggara: Mbay, Bima; e) Sulawesi: Pare-pare, Manado Bitung, Batui and Bukari and f) Aceh: Sabang.
(5) Free Trade Zones (FTZ) and Free Port Areas (FEA)
FTZ and FEA are treated as if they are outside of the Indonesian customs territory. There are no import duties and other taxes on the importation of goods. Goods delivered to locations within the Indonesian customs territory are treated as imports and subject to normal customs and other impositions. The regulations provide specific area coordinates and boundaries, including maps of the area coverage of the above Free Trade Zones and Free Port Areas.
Business activities conducted in the Free Trade Zones and Free Port Areas include trading, maritime, industry, transportation, banking, tourism and other activities. The other activities are subject to further stipulation by separate Government Regulations. The regulations stipulate that the economic development of the Free Trade Zones and Free Port Areas will be conducted in accordance with the regional master plan. These Government Regulations do not revoke any agreements, arrangements or cooperation, as well as any licenses or facilities granted prior to the stipulation of the 2007 Government Regulations. These will still apply until expiration. (6) Aid-Funded Projects
Goods, materials and construction equipment imported by a main contractor in connection with an approved government project funded by foreign loans or grants are entitled to the following relief:
a) Exemption from import duty; b) No collection of VAT and STLG and c) Income tax is borne by the government for primary contractors, consultants and d) Suppliers working on such projects.
III.3.11 Fiscal Exit Tax
Fiscal exit tax amounting to Rp 1 million is payable by a resident upon each departure by air from Indonesia. Lower amounts apply on departure by sea or overland. This tax represents a prepayment of personal tax if paid by a tax-registered individual. Certain individuals (such as children under the age of 12) are exempted from paying this tax.
a) Commencing 1 January, 2009, fiscal exit tax will be applicable to individual taxpayers (at least 21 years old). If the individual has an NPWP then the fiscal exit tax is waived.
b) In addition, commencing 1 January, 2011, all individual taxpayers will not pay fiscal exit tax, irrespective of whether they hold an NPWP or not.
III.3.12 Tax Payments and Tax Return Filing
Tax liabilities for a particular period or year are typically to be paid to the State Treasury through a designated tax-payment bank (referred to as bank persepsi) and then accounted for to the DGT office by filing the relevant tax returns. The tax payments and tax return filing for a particular tax must be undertaken monthly, annually, or both.
A summary of these tax obligations is as follows:
50

Table 31: Monthly Tax Obligations Type of tax Tax payment deadline Tax return filing deadline
Article 21/26 Income Tax The 10th of the following month The 20th of the following month Article 23/26 Income Tax The 10th of the following month The 20th of the following month Article 25 Income Tax The 15th of the following month The 20th of the following month Article 22 Income Tax – Tax Collector The 10th of the following month The 20th of the following month Article 4(2) Income Tax The 10th of the following month The 20th of the following month VAT and LST – Taxable Enterprise The 15th of the following month The 20th of the following month VAT and LST – VAT Collector The 15th of the following month The 20th of the following month
Table 32: Annual Tax Obligations
Type of tax Tax payment deadline Tax return filing deadline
Corporate Income Tax The end of the forth month after the book year end before filing the tax return
The end of the forth month after the book year end
Individual Income Tax The end of the third month after the book year end before filing the tax return
The end of the forth month after the book year end
Land & Building (L&B) Tax Six months after the receipt of a Tax Due Notification Letter (SPPT) from the DGT Office
N/A
Duties on the Acquisition of L&B Rights On the acquisition date N/A
Late payments of the above taxes will incur an interest penalty at 2 percent per month, part of a month (e.g., 1 day) being considered as a full month.
Late filing of a tax return or complete failure to file a tax return will incur an administrative penalty at the following amounts: Table 33: Late Filling Penalty
Type of tax return Rupiah 1. VAT return 500,0002. Other monthly tax returns 100,0003. Individual income tax return 100,0004. Corporate income tax return 1,000,000
With respect to annual income tax returns, taxpayers may extend the time span for the tax return filing
by up to 2 months. This may be done by filing a written notification to the DGT before the deadline with a tentative tax calculation attached to it. The tax still due according to the tentative calculation, if any, must be settled before filing the extension notification. If the actual tax due based on the final tax calculation is higher than the tentative calculation, an interest penalty at 2 percent per month will apply to the difference until the shortfall is paid.
Failure to file a particular tax return by the deadline may lead the DGT to issue a warning letter to the taxpayer concerned. The warning letter will typically require the taxpayer to file the tax return within 30 days of the warning letter date. Ignoring such a warning letter can lead the DGT to issue an official tax assessment along with an administrative penalty at 50 percent of the assessed tax.
By default, except for corporate and individual income taxes, taxes are typically to be accounted for on a decentralized basis. A company with business units (branches) spread over the country must accordingly account for the performance of the tax obligations to the district service tax offices with which those units are registered. However, taxpayers registered with certain designated tax service offices (PMA, Go Public, state-own company tax offices, LTO, and MTO) are required to centralize their VAT reporting to those designated tax service offices.
51

In general, the main form of a tax return must be prepared in a conventional format (hard copy). However, the DGT is encouraging the use of e-tax returns in which the whole tax-related information is presented in soft files using DGT-provided applications. For taxpayers registered with the designated tax service offices above, e-tax returns have been mandatory since 1 January 2005. E-tax returns can be filed with the DGT office either in the conventional manner, i.e., submitting the hard copy and the soft copy of the tax returns to the relevant tax service office, or through an application service provider (e-filing). III.3.13 Accounting for Tax
Generally, for tax purposes a company’s books must be maintained in accordance with the prevailing accounting standards unless the tax law stipulates otherwise. By default, the books must be stated in Rupiah, composed in Indonesian, and stored in Indonesia.
Based on a specific DGT approval, foreign-investment (PMA) companies, PEs, and subsidiaries of foreign companies can maintain their books in USD and compose them in English. A collective investment contract (KIK) may qualify for maintaining USD accounting to the extent it issues USD-denominated investment funds. An application for DGT approval must be filed with the DGT office no later than three months before the commencement of the USD accounting year. The DGT is bound to decide on the application within a month. If no decision is made within a month, automatic DGT approval applies.
Companies governed by a Production Sharing Contract (PSC) or a Contract of Work (CoW) with the government may opt to apply USD accounting in English merely based on a written notification to the DGT. Such a notification must be submitted to the DGT office no later than a month before the commencement of the USD accounting year.
A company may also compose their books in English but still maintain them in Rupiah. In such a case, the company must submit a written notification to the DGT no later than three months after the beginning of the year in which the books are composed in English.
The use of a foreign language other than English and a foreign currency other than USD in a company’s books is not allowed. Irrespective of the currency and the language used, companies typically have to settle their tax liabilities in Rupiah (except for PSC companies) and file tax returns in Indonesian. With respect to corporate income tax, relevant assertions are to be presented in USD side by side with Rupiah in the annual corporate income tax returns.
A company that has obtained approval to maintain USD accounting may return to Rupiah accounting based on a specific DGT approval. Once such approval is granted, the company may not re-apply for USD accounting approval during the 5 years from the cancellation of the USD accounting. III.3.14 Tax Assessments and Tax Audits (1) Tax Assessments
Indonesian taxation relies on a self-assessment system under which taxpayers are trusted to calculate, pay, and report their own taxes by themselves in accordance with prevailing tax laws and regulations. However, the DGT may issue tax assessment letters to a particular taxpayer if it finds that, based on a tax audit or other information the taxpayer has not fully paid its tax liabilities. A tax assessment letter may also be issued by the DGT to a taxpayer who ignores a warning letter to file a tax return in a specified period. Failure to maintain books in accordance with the prescribed standards is another condition that may lead the DGT to issue an official tax assessment.
One tax assessment letter pertains only to one specific tax for one particular tax period or year and typically takes into account the following factors:
a) The tax due; b) The applicable tax credits; c) The resulting balance between the tax due and the tax credits (overpaid, nil, or underpaid); d) The administrative penalty (interest or a surcharge).
(2) Types of Tax Assessment Letter
52

The name of a tax assessment letter refers to the resulting balance between the tax due and the tax credits and accordingly there are three types of tax assessment letters:
a) Overpaid Tax Assessment Letter (OTAL) if the tax due is less than the tax credit amount; b) Underpaid Tax Assessment Letter (UTAL) if the tax due exceeds the tax credit amount; c) Nil Tax Assessment Letter (NTAL) if the tax due amount is equal to the tax credit amount. Where a UTAL is issued, this could include one of the following administrative penalties: a) Interest at 2 percent per month for a maximum of 24 months; b) A 50 percent surcharge for income tax liability; c) A 100 percent surcharge for withholding tax liability; d) A 100 percent surcharge for VAT and LST liabilities. Which penalties are applicable will depend on the type of wrongdoing the taxpayer has committed.
The penalty amounts are determined by applying the relevant rate to the underpaid tax amounts. (3) Statute of Limitation
Under the 2007 tax administration law, the DGT can issue an underpaid tax assessment letter for years up to 2007 only within 10 years after the incurrence of a tax liability, the end of a tax period (month) or the end of (part of) a tax year, but no later than 2013. For years from 2008 onward, the time spans to issue underpaid tax assessment letters is reduced to 5 years.
Once a tax assessment letter for a particular tax of a particular month or year has been issued, additional tax assessment letters may still be issued within the specified time limits (5 or 10 years depending on the tax years) to the extent there is a new data (novum) or certain information which was not (adequately) disclosed in the tax returns and/or during tax audits. The issue of an Additional Underpaid Tax Assessment Letter (AUTAL) will call for a 100 percent surcharge on the tax due as an administrative penalty. However, a taxpayer may avoid the surcharge if they voluntarily notify the DGT of the novum or the undisclosed information.
The tax due reported in a tax return is considered certain if no tax assessment letter is issued within the specified time limit. Nevertheless, a UTAL or AUTAL can still be issued beyond the specified time limit to a taxpayer who, by virtue of a court verdict, is found guilty of a taxation crime after the specified time limits. An UTAL or an AUTAL issued in such a situation will include an interest penalty totalling 48 percent of the underpaid tax. (4) Tax Audits
A tax audit of a company may cover only a particular tax or all taxes for a particular tax period (month) or tax year. It may be conducted in the company’s premises, at the DGT offices, or both. A. Conditions Triggering a Tax Audit
A tax refund request will always trigger a tax audit. Due to the requirement for the DGT to decide on a refund request within 12 months, a tax audit will typically commence within a few weeks to several months from the refund request date. A corporate tax refund request will normally trigger a complete tax audit covering all taxes. A refund request of any other tax will normally trigger a tax audit covering only one particular tax. The DGT will likely broaden the tax audit scope to include other taxes.
Some other conditions may trigger a tax audit, including: a) A tax return in an overpayment position (not necessarily accompanied by a refund request); b) An annual income tax return presenting/claiming a tax loss; c) A tax return not filed within the prescribed time; d) A tax return meeting certain (undisclosed) criteria of the DGT.
B. One-Month Rule
Taxpayers being audited are required to provide documents and information requested by the tax auditors within a month of the request date. This may include transfer pricing documentation if the
53
taxpayers are engaged in related-party transactions. Failure to provide the documents or information within a month may lead the DGT to determine the tax liabilities on a deemed basis. C. Closing Conference
At the end of a tax audit, the tax auditors will provide the taxpayer being audited with a written notification of the tax audit findings containing their proposed tax audit corrections. The taxpayer will typically have to respond to the notification in writing within 7 days. In certain cases, at the tax auditors’ discretion, the time limit can be extended up to 21 days. By the end of the third week of the notification, a final discussion about the tax audit findings (closing conference) will be held between the tax auditors and the taxpayer.
A closing conference will serve as the last opportunity for the taxpayer to reassert its position with regard to the tax audit corrections and to present the relevant supporting documents. The tax auditors may change some of the suggested corrections in light of the taxpayer’s response to the tax audit findings notification and the closing conference discussion. The results of the final discussion are then summarized in a closing conference document. The taxpayer will have to state agree or disagree with each of the proposed corrections therein. The document should also set out which part of the taxpayer’s arguments are accepted by the tax auditors and accordingly lead to the cancellation or reduction of some particular suggested corrections. By the end of the closing conference, the tax auditors and the taxpayer have to sign the closing conference document.
For certain tax years (2008 onward), the corrections agreed to in the closing conference document will constitute a basis for the minimum amount the taxpayer must pay of the tax assessment issued based on the document. D. Products of a Tax Audits
The legal products of a tax audit consist mainly of tax assessment letters and Tax Collection Letters (TCLs), which must be based on the closing conference document. A TCL typically serves as a legal instrument to collect administrative tax sanctions not covered in a tax assessment letter. In some other situations, it may also be used by the DGT to collect tax due in a particular tax period (month) within the current year and the interest penalty thereon. III.3.15 Tax Collection Using Distress Warrant
Based on a legal tax collection instrument, the DGT may by law issue a Distress Warrant to a taxpayer. The instruments include the following documents:
a) Tax Collection Letters; b) Underpaid Tax Assessment Letters; c) Additional Underpaid Tax Assessment Letters; d) Tax Objection Decision Letters (which demand an additional payment from the taxpayer); e) Tax Court Decisions (which demand an additional payment from the taxpayer); f) Correction Decision Letters (which demand an additional payment from the taxpayer). The relevant taxpayer is required to pay the underpaid tax stated in a tax collection instrument within a
month of the instrument date. Any late payments will trigger an interest penalty at 2 percent per month. Filing an objection, a revision request, an appeal, or a lawsuit is not an excuse for suspending the underpaid tax payment.
However, under the 2007 tax administration law, taxpayers are bound to pay only the minimum amount they have agreed in the closing conference provided that they file an objection or an appeal in respect to the particular tax assessment letter. The remaining part of the assessment not agreed during the closing conference will only be due after the DGT decides on the objection or the tax court rules on the appeal not in the taxpayer’s favour.
If the underpaid tax is not paid within the allowable time, as part of the execution of the Distress Warrant, the DGT may undertake the following steps:
a) Issue a Warning Letter if the underpaid tax is not settled within 7 days of the due date;
54

b) Issue a Distress Warrant if the underpaid tax is not settled within 21 days of the Warning Letter being issued;
c) Issue a Confiscation Order if the underpaid tax is not settled within 48 hours of the Coercion Letter being issued;
d) Publish an auction announcement with respect to the confiscated assets if the underpaid tax is not settled within 14 days of the Confiscation Order being issued;
e) Undertake a public auction if the underpaid tax is not settled within 14 days of the auction announcement.
III.3.16 Tax Dispute and Resolution
A tax dispute between a taxpayer and the DGT will typically arise following the issuing of a tax assessment letter or a TCL by the DGT which the taxpayer does not agree with. A UTAL, an AUTAL, and a TCL constitute legal tax collection instruments based on which the DGT may issue a Distress Warrant if the taxpayer fails to settle the underpaid tax on time. The way the DGT executes the Distress Warrant may still give rise to another tax dispute between the parties. Apart from this, a tax dispute may also arise between 2 taxpayers because one taxpayer has withheld too much tax from the income payable to the other taxpayer. What follows is a discussion on the ways available to resolve such tax disputes. (1) Objections and Appeals
A taxpayer who does not agree with a tax assessment letter can file an Objection with the DGT office within three months of the issue date. The Objection must state the tax due in accordance with the taxpayer’s calculation and set out the reasons for his/her disagreement with the DGT tax assessment.
In accordance with the 2007 tax administration law, as far as an underpaid tax assessment is concerned, the taxpayer must pay at least the amount agreed during the closing conference before filing the Objection. With respect the unpaid portion of the assessment penalties will subsequently be applied if the taxpayer’s objection is rejected or a subsequent tax appeal to the Tax Court is unsuccessful. The penalties are outlined below.
The DGT has to issue a decision on the tax Objection within 12 months of the filing date of the Objection. If no decision is issued by the DGT within 12 months, the objection is automatically deemed approved by the DGT.
If the objection is rejected by the DGT, any underpayment is subject to a surcharged of 50 percent. However, the underpaid tax and the surcharge are not payable if the taxpayer files an appeal with the tax court in respect of the objection decision.
An Objection may also be filed by a taxpayer with the DGT office with respect to tax withheld by a third party. The same time limits to file the Objection and for the DGT to decide upon it apply to this type of Objection.
A taxpayer who does not (fully) accept the DGT Objection decision can file an Appeal with the Tax Court within three months of the receipt of the DGT Objection. To the extent the DGT Objection Decision calls for a payment of tax due, according to the tax court law, at least 50 percent of the tax due must be settled before filing the Appeal. According to the 2007 tax administration law, this requirement is no longer applicable. This creates a mismatch and taxpayers are generally advised to pay the 50 percent amount to ensure the Tax Court accepts the case.
The Tax Court will typically have to decide on an Appeal within 12 months. Any underpaid tax amounts resulting from the tax court decision are subject to a surcharge of 100 percent. (2) Another Avenue for Tax Dispute Resolution
The DGT, following a taxpayer request or by virtue of its official position, may correct or cancel a tax assessment letter, a TCL, or their derivatives issued based on those letters. The derivatives include, among others:
a) Objection Decision Letters; b) Decision Letters on the Reduction or Cancellation of Administrative Sanctions;
55

c) Decision Letters on the Reduction or Cancellation of a Tax Assessment; d) Decision Letters on an Early Refund of Overpaid Tax. A Correction Request is an alternative for a taxpayer to the Objection by which to solve a dispute with
the DGT in respect of a particular tax assessment letter. This avenue is also applicable for other tax disputes arising from virtually any other DGT decision. However, lodging an objection is generally regarded as a more robust approach.
The DGT has to issue a decision on an Amendment Request within 6 months of the filing date. If no decision is issued by the DGT within 6 months, the Correction Request is automatically deemed to be approved by the DGT.
Taxpayers who do not (fully) accept the DGT Decision on an Correction Request can file a lawsuit with the Tax Court within 30 days of the receipt of the DGT decision. A lawsuit against the DGT can also be filed with the Tax Court with respect to the execution of Distress Warrant. In this respect, the lawsuit must be filed no later than 14 days of the execution date. The Tax Court will typically have to decide on an appeal within 6 months. (3) Reconsideration Request to the Supreme Court
A Tax Court Decision is considered to be a final decision bearing full legal force. However, the parties involved in a tax dispute may file a Reconsideration Request with regard to a Tax Court Decision with the Supreme Court. This can be done only if any of the following conditions prevail:
a) The Decision has been based on a perjury, a deception, or false evidence from the part of the opposing party;
b) A piece of important written evidence is found, which had it been considered previously would have led to a different Decision;
c) Some part of the claim has been ignored without reason; d) Something not demanded was granted; e) The Decision is patently inconsistent with prevailing tax regulations. A Reconsideration Request must be filed with the Supreme Court within an allowable time limit. For
those pertaining to conditions 1 and 2, the time limit is 3 months after the condition is identified. For those pertaining to conditions 3, 4 and 5, the time limit is 3 months after the court decision.
56

IV. Country-Specific Fiscal Issues Value Added Tax Amendment
Despite major reforms, there is tax legislation and administration issues remain to be addressed. The law on the value-added tax submitted to parliament in 2005 is yet to be approved, though the government is hopeful of early approval. The delay may be creating uncertainty in the business community. The current VAT law is complex and includes widespread exemptions and would benefit from streamlining. Optimism abounds that the discussion will be completed before year-end 2008 so that the whole tax reform package will take effect starting in 2009. The bill proposed the following changes:
a) Zero-rating VAT on the export of intangible goods and services. The export concept should apply not only to tangible goods but also to intangible goods and services. If it is approved, the rule will only relieve non-residents from Indonesian VAT on services and intangible goods provided by Indonesian entities.
b) Input VAT incurred in the pre-production stage of a business. Such input VAT will continue to be claimable as a tax credit and VAT refunds may be applied for during the pre-production stage. However, if the company concerned fails to reach the production stage, it should repay the refund obtained and pay an interest penalty at 2 percent per month starting from the refund date.
c) VAT in a business merger. Transfers of goods in a business merger would be regarded as a non-taxable event.
d) VAT in a finance leasing transaction. It is proposed that the goods in question would be deemed to be transferred directly from the supplier to the lessee. Under current legislation, the goods are understood to pass through the lessor before they reach the lessee.
People are hoping the discussion will be completed this year so that the full package of tax reform will be effective starting next year. Incentives to Register for Tax Identification Number (NPWP)
As is widely known, for the past couple of years the government has been trying to popularize tax registration among individual residents, who are considered to have great potential in contributing to the state revenue. In order to increase the number of taxpayers in Indonesia, the government issued incentives to register for tax identification number (NPWP). There are different treatments in tax rates and the obligation to pay the fiscal exit tax to those who do not have tax identification numbers.
Employees who do not have tax identification numbers will be subject to an additional 20 percent article 21 income tax surcharge.
a) Thus under article 21 the income tiers and tariffs for an individual that does not hold an NPWP would become:
Table 34: Tax rates for non NPWP holders
Taxable Income (Rp) Tax Rate (%)0 – 50 million 6 > 50 – 250 million 18 > 250 – 500 million 30 > 500 million 36
b) Under Article 22, the withholding tax rates are increased by 100 percent. c) Under Article 23, the withholding tax rates are increased by 100 percent - thus the rate of
withholding tax for payments of interest, dividends or royalties would become 30 percent and 4 percent for payments in relation to services.
d) Fiscal exit tax will be payable in 2009-2010 if the individual does not have an NPWP.
57

Introduction of Sunset Policy The Indonesian government issued regulatory rules for the implementation Article 37 A of the Law on
General Rules and Procedures for Taxation, which is commonly known as Sunset Policy. The Sunset Policy covers direct taxes only, i.e. Individual Income Tax and Corporate Income Tax and it does not cover withholding tax or VAT. With an intention to provide a mean to encourage taxpayers starting to declare their tax in compliance with the tax laws and regulations, the Sunset Policy provides relinquishment of interest penalty caused from tax underpayment resulting from filing of certain qualifying tax returns. The qualifying tax returns include:
a) Individual Income Tax Returns for year 2007 and before that are submitted by individual taxpayers voluntarily registering for a Tax Identification Number (NPWP) in 2008 (this needs to be submitted prior to 31 March 2009);
b) Amended Individual Income Tax Returns for years prior to 2007 that are submitted by individual taxpayers already registered prior to 1 January 2008 (this needs to be submitted prior to 31 December 2008);
c) Amended Corporate Income Tax Returns for years prior to 2007 submitted by corporate taxpayers already registered prior to 1 January 2008 (this needs to be submitted prior to 31 December 2008).
Tax returns/amended tax returns submitted under the Sunset Policy by individual taxpayers voluntarily registered in year 2008 will not be subject to a tax audit, to the extent that there is no data or information indicating the tax returns to be incorrect, or Tax returns or amended tax returns submitted would need to have a note stating that the tax return/amended tax return is submitted under Article 37 A of the Law on General Rules and Procedures for taxes. Tax underpayments declared in the qualifying tax returns or tax return amendments would need to be settled before the tax returns or the amendments can be filed.
Filing of the qualifying amended tax returns under the Sunset Policy is possible for tax returns that are already subject to an audit by tax authorities, to the extent that Formal Notification of Tax Audit Result has not been issued. Depending on tax being tax audited and circumstances of the tax audit, filing an amended tax return may cause to discontinuation of the tax audit. The Sunset Policy does not apply in the case where the respective tax return being amended is subject to an investigation for initial evidence, or any action relating to tax crime. Project for Indonesian Tax Administration Reform (PINTAR)
The World Bank, one of the country's major donors, has approved a US$ 110 million loan to the Indonesian government to help it improve taxation systems. Indonesia has already embarked on a major effort to reform its system of collecting tax revenues, most notably by revamping the directorate general of taxation, introducing modern compliance management systems, and passing the new Tax Law in 2008.
The US$ 110 million loan aims to help the office embark on an even more progressive reform in tax administration through a project called the Project for Indonesian Tax Administration Reform (PINTAR). Through PINTAR, the World Bank sets out to complement this effort by helping the Indonesian Government expand tax bases, both in terms of increasing the number of tax payers and of transactions coming into the tax system, which would in turn help generate more non oil and gas tax revenue.
The PINTAR program will help increase the directorate general's tax efficiency and capacity, through improved administrative systems, advanced training of human resources and better management. Through strengthened staff capacity, integrity standards and a more service-oriented approach, PINTAR will enable better taxpayer services reducing compliance costs for the private sector. A modern integrated IT system will also help raise productivity and facilitate information exchange across the Directorate General of Taxation.
58

V. Conclusion: Where We Stand and Where to Go? The World Economic Crisis
The world economy has changed dramatically since September 2008. What began as a downturn in the US housing sector is now a global crisis, spreading to both rich and poor economies. Many believe that this may go down in history as the worst crisis since the Great Depression of the 1930s. Developing countries like Indonesia are now much more vulnerable, with dwindling capital flows, huge withdrawals of capital leading to losses in equity markets, and skyrocketing interest rates.
The intensification of the financial crisis in the United States and its rapid spread since the middle of September 2008 to both other high-income and developing countries has changed growth projections dramatically. Growth in developing-countries, whose economies had been expected to expand by 6.4 percent in 2009, has been marked down to 4.5 percent and the economies of high-income countries, many of which have already entered into recession, are now expected to contract by 0.1 percent in 2009. Growth rates are projected to recover in 2010, although there is considerable uncertainty and much will depend on the policy responses in developed and developing countries. Global trade, which grew by 9.8 percent in 2006, is projected to fall in 2009 for the first time since 1982. Many Indonesians are afraid that the 1997 Asian Financial Crisis will happen again if the U.S. economy and others major world economies continues to deteriorate. Indonesia was badly hit during the 1997 economic crisis. Many people can still remember the huge negative impact of the regional recession a decade ago.
Currently, the Indonesian capital market has gone down around 47 percent since the beginning of the 2008, the rupiah value is depreciating and the bond price is under strong pressure, as portfolio investors are leaving Indonesia. The decline in commodity prices on one side hurts the capital market and it could reduce export revenue and thereby reduce growth. If commodity prices decline sharply, this would also affect domestic banks as their exposure in corporate credit is primarily to commodity-related companies, mainly CPO and coal. Domestic consumption and investment will be the main driver of economic growth throughout 2009. Decreasing Performance on Export-Oriented Businesses and Unemployment Threat
It is certainly a very difficult time for companies in Indonesia now and will continue to be so next year, as the economy begins to feel the devastating impact of the financial crisis and recession in the world's economic powerhouses -- the United States, Europe and Japan. Indonesian businesses are already feeling the pinch, as evidenced by the massive worker layoffs made or planned by companies already hit by the global economic downturn. Manpower Ministry data show that 21,000 workers could be laid off by the end of 2008, with another 13,000 or so other redundant employees receiving only nominal wages.
The situation this time around is different from 1997-1998 economic crises when companies that served the international market continued to do rather well. This time it is the export-oriented businesses -- most of which are natural resources based -- that are suffering the most because of the depressed demand in the developed world. Worse still, while companies badly need to cut costs to stay competitive in the international market, Indonesian labour regulations remain too rigid to allow for a realignment of employment structures. Firing workers remains the most expensive option, with severance allowances sometimes eight times as high as those in Malaysia, China, Bangladesh and India.
President Susilo Bambang Yudhoyono's Cabinet issued in October 2008 a joint ministerial decree designed to serve as a broad guideline for tripartite (government-employer-worker) negotiations for minimum wages for next year in anticipation of the tough economic times ahead. However, instead of providing a legal foundation for maintaining peaceful industrial relations, the ministerial ruling caused unrest among trade unions, which claim the regulation has weakened their bargaining power vis-à-vis employers. Workers, given their weak bargaining position, do need protective labour regulations because the market cannot always strike a good balance between the often opposing interests of workers and employers. They need a strong framework in which fair wages and working conditions can be set. The government also needs to consider companies' grievances more seriously, whether their problems are
59

redundant workers, lack of trade financing, inadequate export insurance, unnecessary delays of imports or bureaucratic red tape, and take the necessary corrective measures accordingly.
The 2009 state budget provides Rp 12.5 trillion (US$ 1 billion) for what it calls a "stimulus" for businesses to weather the difficult economic conditions ahead. The most helpful stimulus for businesses right now would be the creation of a better business environment through more efficient bureaucratic infrastructure and protection of the local market from smuggled foreign goods. Indonesia plans to spend more than 72 trillion rupiah on infrastructure and other projects to boost growth and create jobs. The planned spending equivalent to about 1.4 percent of forecast 2009 GDP comes as Indonesia sees weaker demand for commodities amid a global economic slowdown. Oil Subsidies Impact
The important area of growing concern in Indonesia is the central government budget. With fixed domestic prices for gasoline, transportation diesel and kerosene, (between them accounting for over 2/3 of fuel sales), subsidies have grown rapidly and will reach Rp 130 trillion (US$ 14.3 billion) in 2008. At this level, total energy subsidies (for electricity as well as fuel) will be equivalent to total central government capital and social spending. Driven by the increase in subsidies, measures are proposed to cut spending in line ministries, reduce subsidies on electricity, and ration kerosene to ensure that it only goes to the poor. With these measures the Government expects the budget deficit to rise from 1.7 percent of GDP to just over 2 percent of GDP.
The government may entirely end subsidizing fuel prices next year by adjusting subsidized prices to market prices, but up to a certain limit. In the future, the government expected subsidized fuels to follow the market prices automatically up to certain ceilings prices. The plan was expected to ease the government's burden in financing fuel subsidies, with subsidy allocations depending on the volatility of world crude oil prices. The oil price had reached a record high of about US$ 147 per barrel in mid-July 2008. The soaring oil prices in early 2008 forced the government to cut the subsidies and raise the price of fuels by an average 28.7 percent in May 2008. However, crude prices have since dropped as the world tilts into recession and economic downturn, reducing demand for oil. On November 2008, the government announced cutting the price of subsidized premium gasoline by Rp 500 per litre to Rp 5,500 starting on December 1, 2008 as this reflected the market price.
The House of Representatives has suggested the government cap the subsidies for fuel at a certain amount, while leaving them fluctuating based on the market prices. Such an approach would relieve the burden of the cost of the subsidies upon the government. Revenue saved from the subsidies could then be allocated to more beneficial expenditure, including improvement of education, infrastructure and health care programs. In the 2009 state budget, the fuel subsidy allocation is set at Rp 57.6 trillion (US$ 4.94 billion), much lower than the Rp 126.8 trillion set in the revised 2008 budget. The government could cut the subsidy for premium gasoline and diesel, and then it could shift its focus to subsidizing kerosene, which was more important for supporting the living costs of low-income people. But the reason why the government could not cut the price of subsidized diesel is because the current price was far below the market price. The government also had to bear the high costs for importing fuel due to Indonesia’s exchange rate soaring to above Rp 12,000 per U.S. dollar. The Rupiah’s Depreciation
Due to economic crisis, the local currency fell to above 12,000 per U.S. dollar, its weakest level since September 1998. Regarding this situation, the central bank issued new regulation to limit the purchase of foreign currencies above US$ 100,000 only to those who can provide underlying transactions. Through a new regulation, Bank Indonesia expects the policy to balance demand and supply in the foreign exchange market, reduce extreme pressure to the rupiah and minimize foreign exchange purchase for speculative means.
The regulation is based on the free foreign exchange system that Indonesia adopts now, in which every citizen is free to own and use foreign currencies, as stipulated on the Law No. 24/1999 on foreign exchange flow and exchange rate system. It is not a foreign exchange control policy or capital control that
60

limits capital flow between countries. Individual customers and registered Indonesian and foreign companies are still allowed to freely purchase foreign currencies through spot, forward, or derivative transactions. However, Indonesia citizens or firms wanting to purchase more than US$ 100,000 in foreign currencies need to provide underlying transactions, such as invoice used to import goods or paying debts. Meanwhile, foreign parties can purchase that amount of money through spot transactions only. The regulation is expected to limit speculative purchases of currencies. With the regulation in place, BI expects that banks to be able to detect which customers purchase dollar for speculative means.
Indonesia’s foreign exchange reserves, which stood at US$ 50.58 billion on October 2008, are deemed sufficient for the central bank to intervene in the market. Foreign exchange reserves are related to imports and imports are likely to slow in the coming months, meaning that Indonesia will have enough reserves. Greater concern to Indonesia is the impact of the drop in the rupiah on the real sector, as the country will start to feel the effects of imported inflation, which is a major threat to the economy. Foreign and local investors may shift their money to other countries if the rupiah keeps devaluating. Businesses have demanded the government provide a full guarantee of bank deposits to avoid a bank run to move deposits to overseas banks that have offered the guarantee. Demand is intensifying with the rupiah’s ongoing fluctuations against the U.S. dollar. Fight against Corruption
The Anti-Corruption Commission (KPK) recently has become more vigorous in its investigations and prosecutions of corruption cases, including those dealing with senior government officials. KPK was established in 2002 as an independent state agency, coordinates with other entities combating corruption, conducts investigations and prosecutions, performs preventative actions against corruption, and monitors state governance. Its mandate also includes the examination government officials’ wealth reports. Reflecting its efforts to combat corruption, the number of public complaints corruption received by KPK has increased noticeably since 2004. The ability of KPK to bring forward high profile cases have recently bolstered the perception that corruption is being addressed more aggressively. This action indicates that there is no discrimination in the handling of corruption cases. Elections in 2009
The next challenge for Indonesia will be the legislative assembly elections followed by presidential elections in 2009. Legislative elections for the 128 seats of the Regional Representatives Council and the 560 seats of the People's Representative Council will be held in 9 April 2009. Over 60 parties registered for the elections, but only 38 originally met the eligibility requirements. Presidential elections will be held in July 2009, to elect President and Vice President for 2009 - 2014 periods. Good economic growth, reduction of the unemployment and poverty rates will be the key to electoral sentiment in the 2009 general election.
61

62
References Bank of Indonesia (2008), 2007 Economic Report on Indonesia, Bank of Indonesia, Jakarta BPS Statistics Indonesia: Statistical Yearbook of Indonesia 2007, Badan Pusat Statistik, Jakarta Deloitte Touche Tohmatsu (2008), Indonesia International Tax and Business Guide, The Deloitte Touche
Tohmatsu, Jakarta International Monetary Fund (2008), IMF Country Report No. 08/298: Indonesia, Selected Issues, The
International Monetary Fund, Washington D.C. International Monetary Fund (2008), IMF Country Report No. 08/299: Indonesia: 2008 Article IV
Consultation, The International Monetary Fund, Washington D.C. International Monetary Fund (2008), IMF Working Paper No. WP/08/129: Tax Administration Reform and
Fiscal Adjustment: The Case of Indonesia (2001-07), The International Monetary Fund, Washington D.C.
International Monetary Fund (2008), World Economic Outlook October 2008; Financial Stress, Downturns, and Recoveries, The International Monetary Fund, Washington D.C.
International Monetary Fund (2008), World Economic Outlook Update November 2008; Rapidly Weakening Prospects Call for New Policy Stimulus, The International Monetary Fund, Washington D.C.
Ministry of Finance Republic of Indonesia (2008), Budget Statistic 2007-2008, Ministry of Finance Republic of Indonesia, Jakarta
Ministry of Finance Republic of Indonesia (2008), Financial Report of Central Government Year 2007, Ministry of Finance Republic of Indonesia, Jakarta
Price Waterhouse Coopers Indonesia (2008), Indonesian Pocket Tax Book 2008, The Price Waterhouse Coopers / PT Prima Wahana Caraka, Jakarta
The Government of the Republic of Indonesia, Law No. 16/2000 on General Tax Provisions and Procedures.
The Government of the Republic of Indonesia, Law No. 17/2000 on Income Tax Law. The Government of the Republic of Indonesia, Law No. 18/2000 on Value Added Tax Law. The Government of the Republic of Indonesia, Law No. 28/2007 on General Tax Provisions and
Procedures. The Government of the Republic of Indonesia, Law No. 36/2008 on Income Tax Law. The International Bank for Reconstruction and Development/The World Bank (2008), Doing Business
2009: Country Profile for Indonesia, The World Bank, Washington D.C. World Bank (2008), Indonesia: Economic and Social update, April 2008, The World Bank, Washington
D.C.


![USTA TrafficAnalysisBriefing V7 0 20150530 FINAL[1] · PDF file1."Executive"Summary" ... In2014thethreemajorGulfcarriers" –"Emirates,"Qatar"Airways"and"Etihad" Airways"–"carried"some"4.3"million"passengers"intoandout"of"the](https://img.dokumen.tips/doc/110x75/5aa125967f8b9a46238b5bf2/usta-trafficanalysisbriefing-v7-0-20150530-final1-in2014thethreemajorgulfcarriers.jpg)