Embed Size (px)
Citation preview

United Nations Development Programme
Human Development Report Office
OCCASIONAL PAPER
Background paper for HDR 2003
India: Towards the Millennium Development Goals
Nirupam Bajpai
2003

Background Paper
Human Development Report 2003
India:
Towards the Millennium Development Goals
Nirupam [email protected]
January 27, 2003

2
India: Towards the Millennium Development Goals
Nirupam [email protected]
January 27, 2003
Background Paper Human Development Report 2003
Abstract:
India’s performance vis-à-vis human development has been mixed in the last decade. A high and
sustainable rate of economic growth in the post reform period has reduced the number of people
below the poverty line. Literacy rates have not only continued their trend rise but there has been a
decline in the absolute number of illiterates for the first time. Population health, however, remains
an area of neglect. Health indicators, while recording improvements over time, point to
alarmingly high rates of malnutrition and mortality, especially among women and children, and
widespread lack of access to medical care.
Literacy rates have shown remarkable improvement in India in the last decade, both for males and
females. Total literacy rates increased from 52% in 1991 to 66% in 2001, with male literacy rates
increasing from 64% to 76% and female literacy rates increasing from 39% to 54%. The most
heartening aspect of India’s educational stride forward is the improvements recorded by the
educationally backward states, especially the state of Madhya Pradesh.
While there has been secular improvement in most health indicators, India continues to perform
inferiorly in terms of health. Infant mortality rates have fallen and life expectancy has been rising.
Maternal and child health, on the other hand, remain areas of neglect and as a result maternal
mortality rates remain high, there is pervasive under-nutrition among children and women, and
conditions of safe child birth elude large proportions of pregnant women.
Kerala has stood apart from the Indian experience in both education and health, achieving social
development levels that are close to those found in the rich developed countries. With vigorous
public action accompanied by financial commitment determinedly focused on providing access to
good education and health to every individual, Kerala boasts of high literacy rates of over 90%
for both males and females, and the highest life expectancy and lowest infant mortality rates
among all states of India. Moreover, the sex ratio in Kerala, unlike that for India as a whole and in
sharp contrast to those of the rich states of Punjab and Haryana, is quite favorable for women.
The state of Madhya Pradesh, historically one of the most socially backward states in India, has
made rapid strides in education in the last decade. Between 1991 and 2001, literacy rates in
Madhya Pradesh have jumped more than 20% points, increasing from 44.6% in 1991 to 64.11%
in 2001, recording the highest decadal increase in literacy among Indian states. Moreover, female
literacy rates in Madhya Pradesh improved more than male literacy rates, increasing from 39.29%
in 1991 to 54.16% in 2001. To pursue the goal of mass literacy, Madhya Pradesh established
26,000 new primary schools within a year (1997-1998), achieving universal access. The unique
feature of the state’s remarkable achievement has been the use of organizational support provided
by village councils (Panchayats) to spread education to rural areas and to its large population of
scheduled castes and tribes.
3
India: Towards the Millennium Development Goals
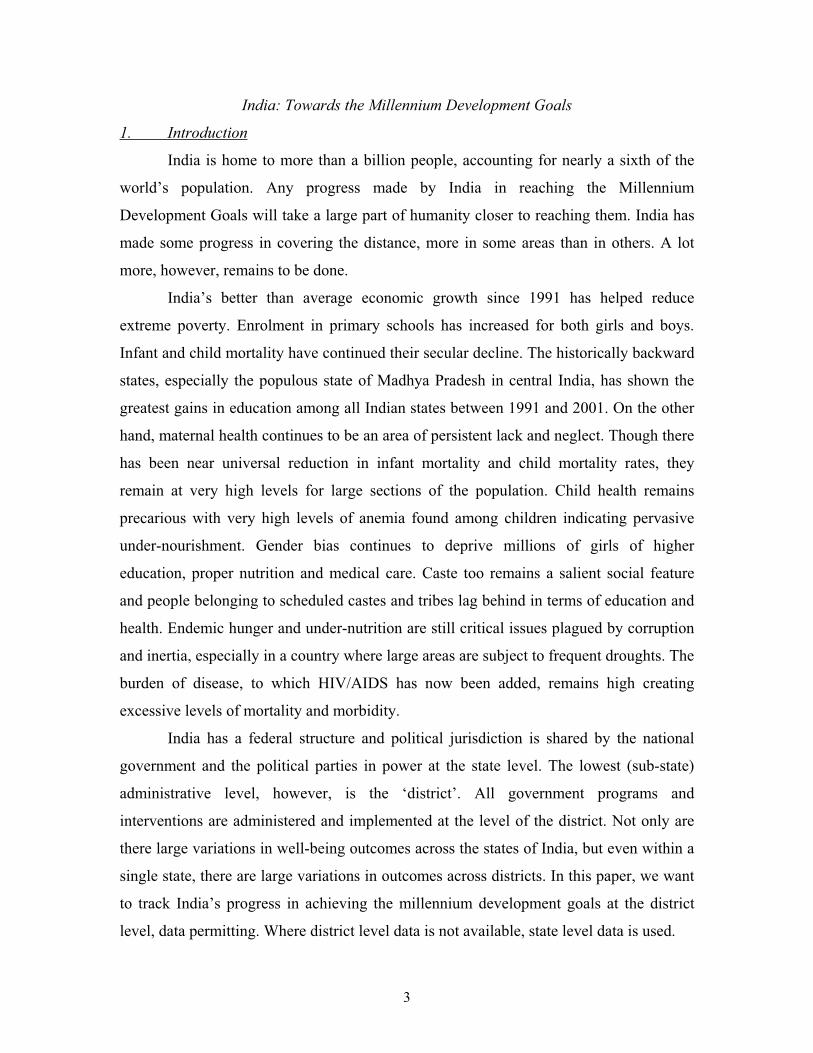
1. Introduction
India is home to more than a billion people, accounting for nearly a sixth of the
world’s population. Any progress made by India in reaching the Millennium
Development Goals will take a large part of humanity closer to reaching them. India has
made some progress in covering the distance, more in some areas than in others. A lot
more, however, remains to be done.
India’s better than average economic growth since 1991 has helped reduce
extreme poverty. Enrolment in primary schools has increased for both girls and boys.
Infant and child mortality have continued their secular decline. The historically backward
states, especially the populous state of Madhya Pradesh in central India, has shown the
greatest gains in education among all Indian states between 1991 and 2001. On the other
hand, maternal health continues to be an area of persistent lack and neglect. Though there
has been near universal reduction in infant mortality and child mortality rates, they
remain at very high levels for large sections of the population. Child health remains
precarious with very high levels of anemia found among children indicating pervasive
under-nourishment. Gender bias continues to deprive millions of girls of higher
education, proper nutrition and medical care. Caste too remains a salient social feature
and people belonging to scheduled castes and tribes lag behind in terms of education and
health. Endemic hunger and under-nutrition are still critical issues plagued by corruption
and inertia, especially in a country where large areas are subject to frequent droughts. The
burden of disease, to which HIV/AIDS has now been added, remains high creating
excessive levels of mortality and morbidity.
India has a federal structure and political jurisdiction is shared by the national
government and the political parties in power at the state level. The lowest (sub-state)
administrative level, however, is the ‘district’. All government programs and
interventions are administered and implemented at the level of the district. Not only are
there large variations in well-being outcomes across the states of India, but even within a
single state, there are large variations in outcomes across districts. In this paper, we want
to track India’s progress in achieving the millennium development goals at the district
level, data permitting. Where district level data is not available, state level data is used.

4
2. Social Attainments and Changes
Human Development in a society has come to mean how well a society is doing
in raising per capita incomes, education and health levels. While, it is not necessary that
there be a straightforward relationship between these different aspects of well being, in
general we would expect them to be correlated. In India, states that do better along one
dimension do not necessarily do so along others. For example, Kerala has achieved very
high levels of social development but has one of the lowest per capita incomes. Punjab,
the state with the highest per capita income, on the other hand has, one of the worst sex
ratios in the country. Human development at the state level in India depends not only on
its level of resources but also on cultural norms, political willingness and support for
human development.
The economic climate in India has changed a lot since 1991 when a program of
economic policy reform was put in place as a result of a fiscal and balance of payments
crisis. It moved towards economic liberalization and privatization and greater integration
with the world economy. More economic openness, both domestic and international, has
raised the average rate of economic growth from 5.8 % per year in the 1980s to 6.1 % per
year in the 1990s (World Development Report, 2000/2001).1 There has been some debate
on how much economic growth post-liberalization has contributed to poverty alleviation.
However, as per the statistics available from the National Sample Survey Organization
(NSSO)2 on consumer expenditure, the poverty ratio on a 30 day recall basis is estimated
at 27.09% in rural areas, 23.62% in urban areas and 26.10% for the country as a whole in
1999/00. The number of people below the poverty line has declined from 55% in 1973/74
to 36% in 1993/94 to 26% in 1999/00. Though the poverty ratio declined, the absolute
number of poor remained around 320 million for a fairly long period of two decades
(1973 – 1993) due to a countervailing growth in population. The latest 1999/00 NSSO
survey, however, shows a significant decline in this number to about 260 million out of a
total population of 997 million.
We need to investigate not only how changes in the macro-economy affect
growth, poverty and inequality, but also whether and how these pervasive changes have
1 The significant difference between the growth rates of the 1980s and the 1990s is not only that the latter is
higher but it is also sustainable. 2 NSSO 55th Round Survey Data July 1999 – June 2000.

5
affected health and educational attainments. In what follows, social development
attainments and changes are described and discussed at the district level where data is
available and where district level data is not available, the discussion is based on the state
as the unit of observation. Little work exists measuring such change in India before and
after the widespread economic reforms of 1991.
2.1 Poverty
Income poverty is an important component of economic and social deprivation.
Income levels determine consumption levels as well as access to health and educational
services. Poverty reduction has been an important goal of development policy in all poor
countries and India is no exception. With one sixth of the world population living within
its borders, any reduction in the number of poor people in India will make a vast
difference to the extent of poverty in the world.
Reduction in poverty requires raising income levels of the poor and the best
engine for doing that is broad-based economic growth. India’s rate of economic growth
has been higher than average in the post-reform period of the 1990s compared to the past.
The economic performance of different states, however, has been quite varied. According
to calculations performed by Sachs, Bajpai and Ramiah (2002), the per capita state
product in 1998-9 varied from Rs. 1010 per month in Bihar (population 82 million), the
poorest state, to Rs. 4853 per month in Maharashtra (population 96 million), the richest
state. The growth rate of income has been equally varied with Bihar registering a growth
rate of –0.2% per year between 1992-98 and Gujarat 7.8% per year. Sachs et al
hypothesize that the reason for such large differences in the economic performance of
states is differences in the marginal productivity of investments by sub-sector, which
depends on both the general business environment and specific geographical factors.
The poverty reduction performance of the states vis-à-vis the better economic
growth in the post-reform period has also been varied. Moreover, there are
heterogeneities within states (except Bihar which is uniformly poor). The large states of
Andhra Pradesh, Karnataka and Maharashtra show stark contrasts and some intra-state
variations also exist in the smaller and richer states of Haryana and Punjab. Very high
poverty rates of more than 60% exist in Southern Bihar, Southern Orissa, Madhya
6
Pradesh and Southern Uttar Pradesh. These regions are either mainly tribal or rocky and
dry, yet densely populated because of their agro-climactic features. Similarly, high
poverty of 41-60% exists in other areas of Bihar, parts of Madhya Pradesh, inland
Maharashtra, northern Tamil Nadu, eastern and central Uttar Pradesh and parts of West
Bengal. These are also tribal, semi-arid thickly populated areas, which have been
historically neglected.
In the poorest states, especially the states of Bihar, Madhya Pradesh, Rajasthan
and Uttar Pradesh which comprise what are known as the BIMARU (‘sick’) states and
Orissa, very high rates of poverty incidence are human failures rather than lack of natural
resources. Except parts of western Rajasthan, parts of western Madhya Pradesh and
southern Uttar Pradesh, the agro-climactic features have the potential to yield very high
returns in agriculture. According to Datt and Ravallion (2002), had the poorest states
participated more in post-reform economic growth, the historical trend in poverty
reduction could have doubled. The proximate reasons for the lower poverty reduction
response to economic growth by the poorer states are their initial low levels of rural and
human development and large disparities between rural and urban areas.
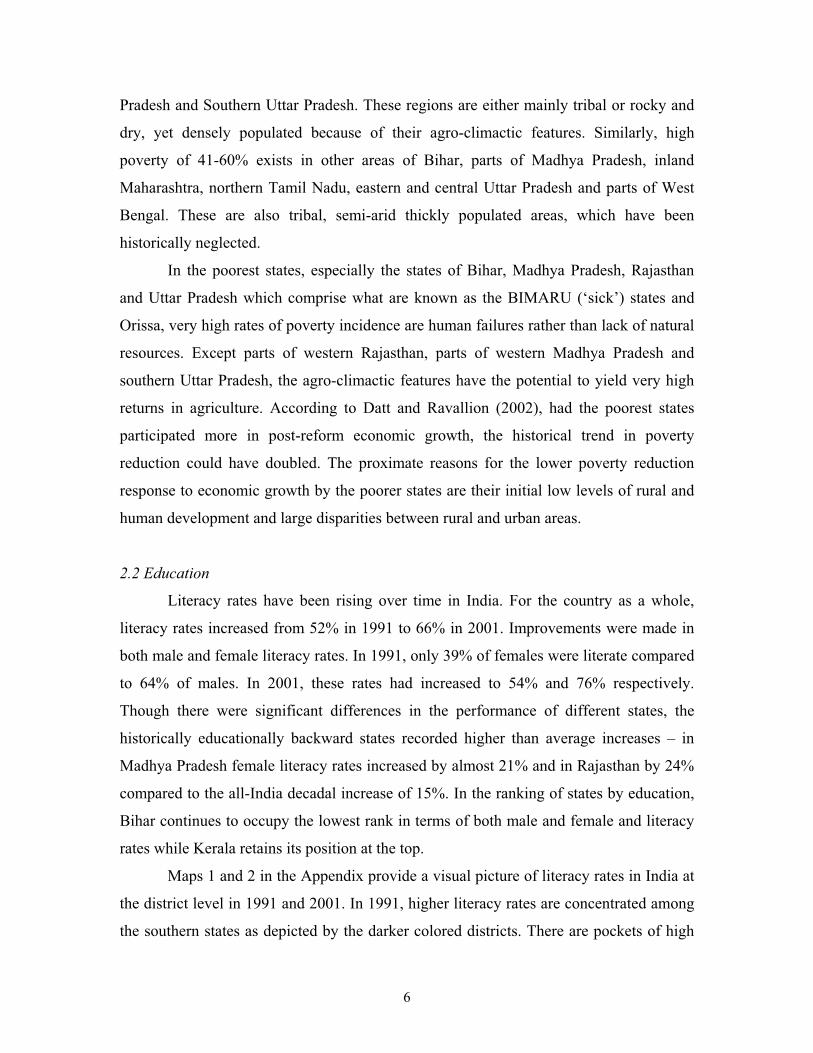
2.2 Education
Literacy rates have been rising over time in India. For the country as a whole,
literacy rates increased from 52% in 1991 to 66% in 2001. Improvements were made in
both male and female literacy rates. In 1991, only 39% of females were literate compared
to 64% of males. In 2001, these rates had increased to 54% and 76% respectively.
Though there were significant differences in the performance of different states, the
historically educationally backward states recorded higher than average increases – in
Madhya Pradesh female literacy rates increased by almost 21% and in Rajasthan by 24%
compared to the all-India decadal increase of 15%. In the ranking of states by education,
Bihar continues to occupy the lowest rank in terms of both male and female and literacy
rates while Kerala retains its position at the top.
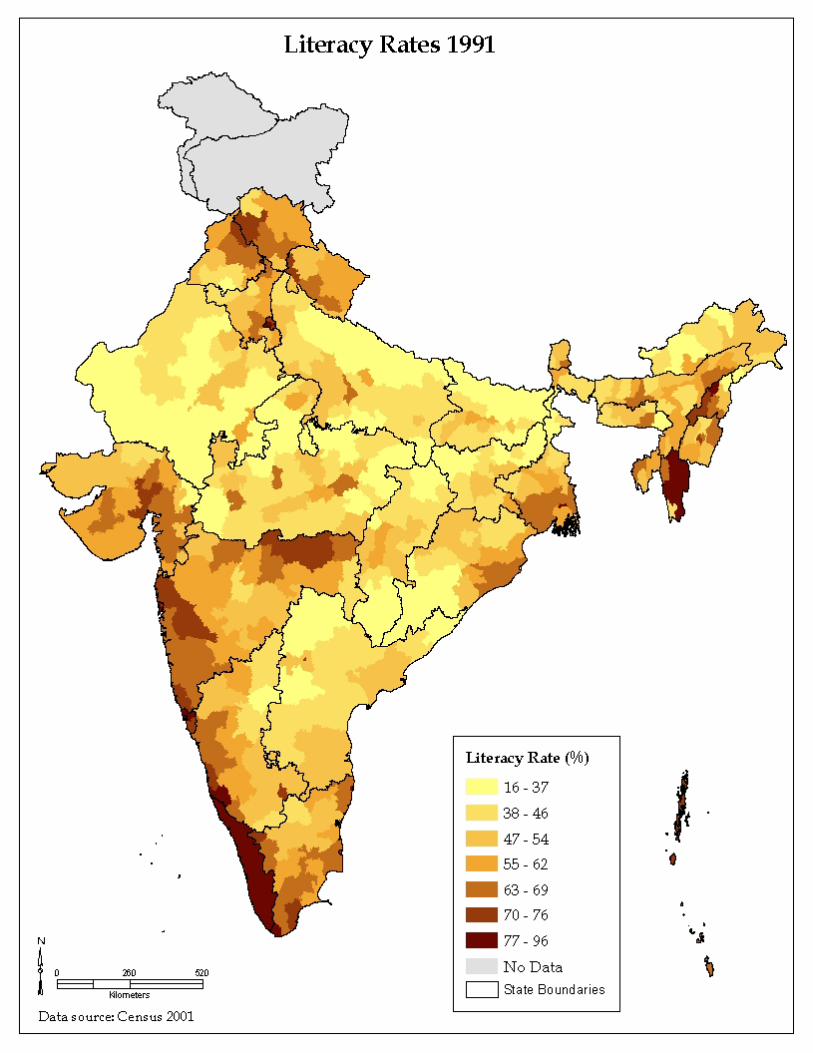
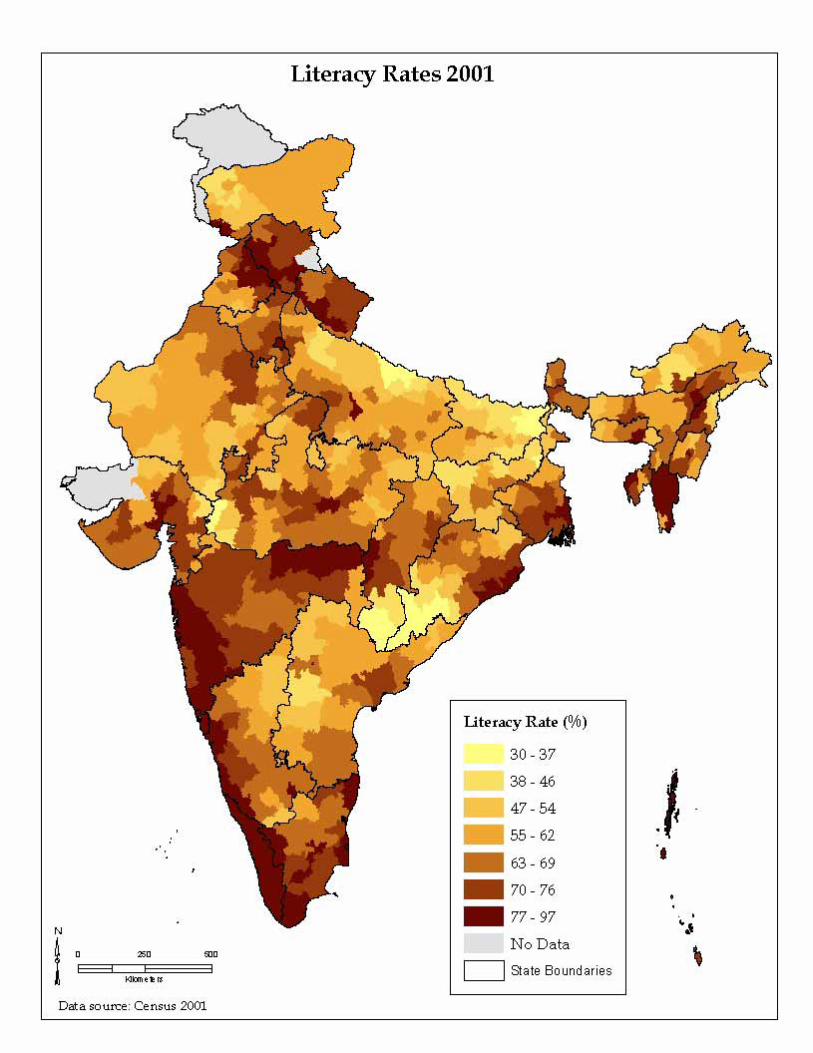
Maps 1 and 2 in the Appendix provide a visual picture of literacy rates in India at
the district level in 1991 and 2001. In 1991, higher literacy rates are concentrated among
the southern states as depicted by the darker colored districts. There are pockets of high

7
literacy in the North, mainly in the small hilly state of Himachal Pradesh and in districts
belonging to the North Eastern states. Low levels of literacy, as depicted by the light
yellow colored districts are concentrated in Rajasthan, Bihar, Uttar Pradesh, Bihar and
Orissa. Of the twenty-five districts with the lowest literacy rates in 1991 (2001), 3 (2)
were in Madhya Pradesh, 9 (12) in Bihar, 3 (4) in Rajasthan and 5 (5) in Uttar Pradesh,
the BIMARU states. The remaining 5 (6) districts were in Orissa. The picture changes
significantly in 2001, especially in Madhya Pradesh in central India. Very low levels of
literacy rates are now concentrated in northern Uttar Pradesh, western Rajasthan, Orissa
and Bihar, parts of Madhya Pradesh and Andhra Pradesh. In 1991 literacy rates ranged
from a low of 18.62% in Nabarangapur in Orissa to a high of 95.72% in Kottayam in
Kerala. In 2001, the district with the lowest literacy rate was Kishanganj in Bihar where it
was 31.02%. Kottayam retained its position as the district with the highest literacy rate
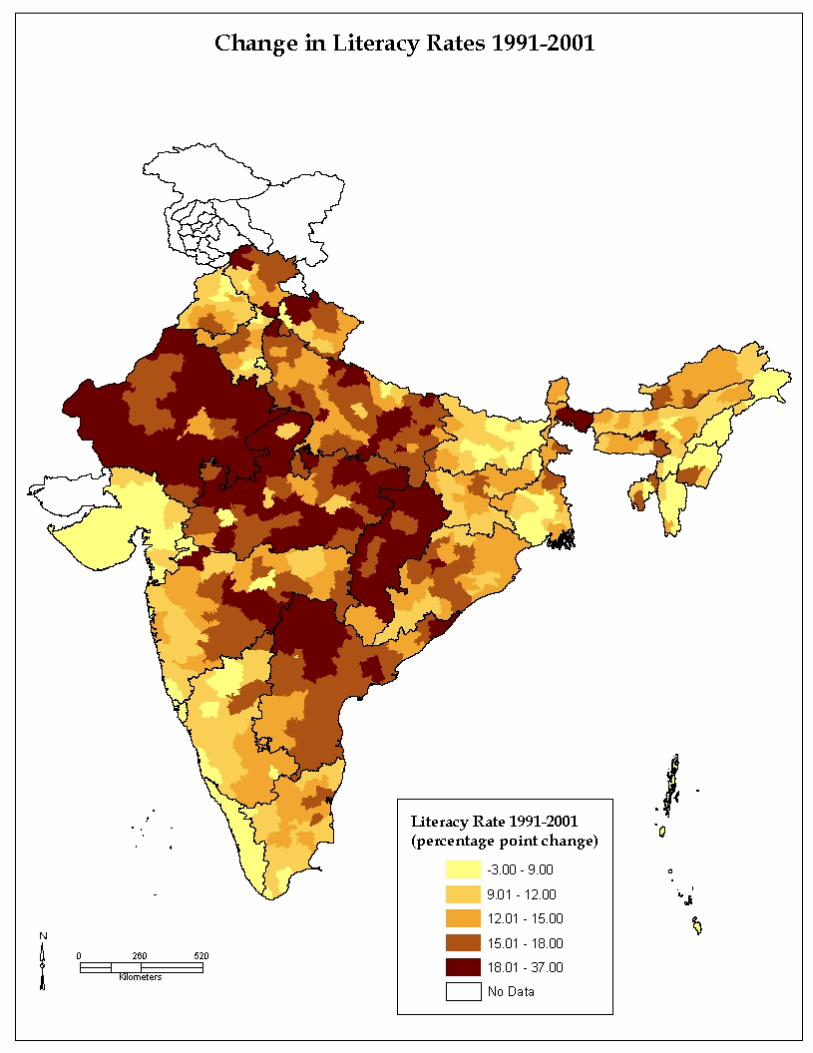
with 95.72% of its population literate. Map 3 shows absolute changes in literacy rates
between 1991 and 2001. In absolute terms, the highest changes are concentrated in
Rajasthan, Madhya Pradesh (including the new state of Chattisgarh) and northern Andhra
Pradesh. As the baseline literacy rates are some of the lowest in the country, we have to
be cautious in interpreting this map. However, it attaches a picture to the heartening fact
that laggard districts and states in India are making progress in education. Uttar Pradesh
too records absolute changes in literacy rates between 12-15% in many districts. Bihar,
however, continues on its extremely slow road forward. Districts in Bihar continue to
record the lowest literacy rates in the country and absolute improvement in the districts of
Bihar over time continue to be small.
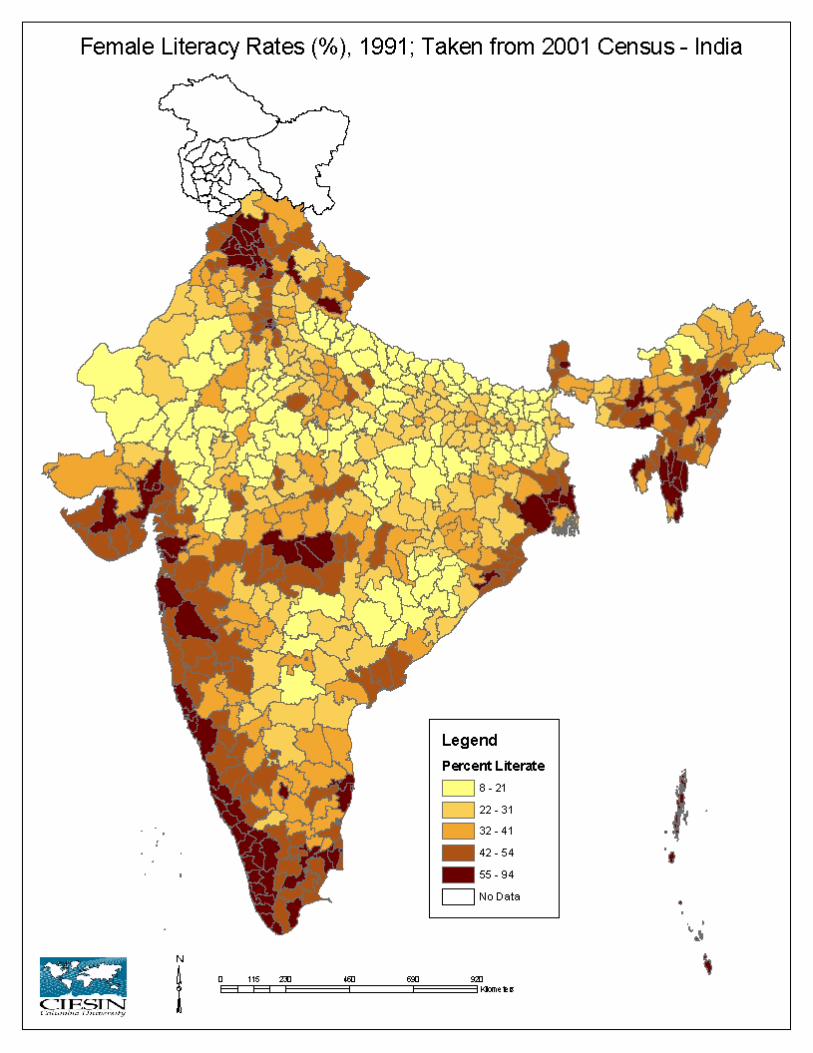
Maps 4, 5 and 6 depict female literacy rates at the district level for 1991, 2001 and
change between 1991-2001. The pictures are similar to those for overall literacy rates.
High female literacy rates in 1991 are concentrated in Kerala and along the western coast
of India, in Maharashtra and Gujarat, in the hilly state of Himachal Pradesh, in southern
West Bengal and the small north-eastern states with pockets of high literacy in central
India.
Within the overall jumps in both male and female literacy rates between 1991-
2001 are hidden disparities – between genders, between caste groups, between income
classes and between rural and urban areas. As the Census 2001 data on these measures

8
are yet to become available, a precise account of these disparities can be given only in the
future. However, studies based on earlier data do find that where overall literacy rates are
higher, in these regions literacy rates among the poor, females and caste groups also tend
to be higher and disparities lower. For example, based on NCAER data, Shariff and
Sudarshan (1996) show that in Rajasthan the overall literacy rates for males and females
were 60% and 19% respectively whereas literacy rates were 39% and 7% for males and
females for Scheduled Tribes and 52% and 9% for males and females for the Scheduled
Castes. The literacy rates among landless wage earners were 44% and 5.6% for males and
females respectively. Rajasthan ranks at the bottom in overall female literacy and this is
as true of females belonging to the higher castes as of those who are members of
scheduled castes and tribes. In general, historically, educationally backward regions do
particularly badly in terms of education attainment of the marginalized groups.
In what follows, we highlight some of the correlates of higher literacy: especially
urbanization and provision of infrastructure. Higher literacy rates are associated with
greater urbanization. As is well known, the rural-urban divide is much greater than
differences based on caste, class and gender. Urban populations have greater access to
schools and the quality of education is also better in urban areas. Moreover, the
incentives to invest in education are higher in urban areas given the proximity to more
and better paying jobs. Urban incomes are also higher compared to rural areas. As
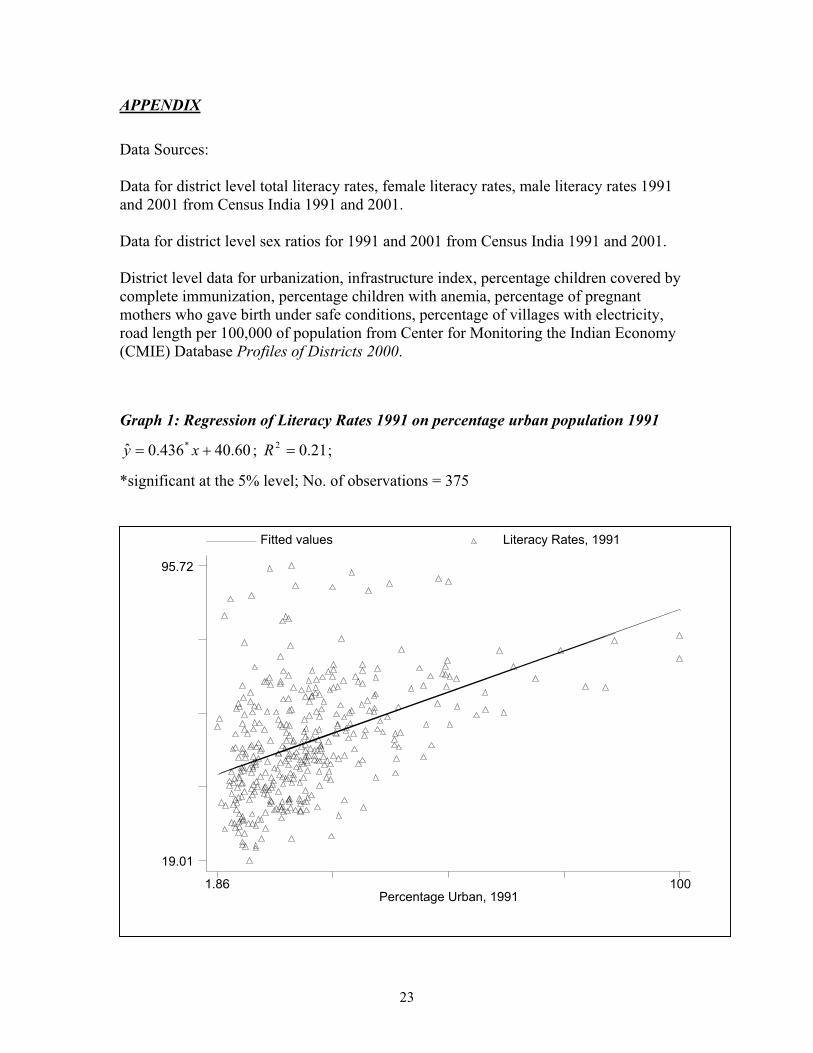
district-wise data on urban population is not yet available for 2001, Graph 1 in the
Appendix shows a simple regression of literacy rates on percent of urban population at
the district level for 1991. Without ascribing any causality to the association, according to
the simple regression result, a 10% increase in the urban population at the district level is
associated with a 2% increase in literacy rates.
Higher literacy rates are also associated with greater infrastructure availability as
can be seen from Graph 2 in the Appendix, which shows the results of simple OLS
regression of literacy rates on the infrastructure index at the district level. The data on
literacy rates belong to the year 2001 and the data on the infrastructure index for 1999.
Again, while correlation does not establish causality, the positive association of
urbanization and infrastructure with education indicates the kind of environment
conducive to the provision of, and demand for, education.

9
Regionally in India, southern states have historically done better in terms of
educational outcomes and continue to do so as is evident from the district level maps of
literacy rates. There is greater public awareness and collective action efforts on the part
of the people in the South. Politics is populist in almost all states but the governments of
the southern states have paid more attention to education compared to the northern states
and there has been effective intervention in terms of public schemes, an example being
the provision of mid-day meals in schools in Tamil Nadu. Kerala has been a model state
for some time in terms of human development not only for India but for the developing
world as a whole. Among the laggard states, Madhya Pradesh has shown commendable
improvement in literacy rates for both males and females. As has been noted above, some
districts in Madhya Pradesh have recorded the highest increase in literacy rates between
1991 and 2001.3 In section 3, Kerala and Madhya Pradesh are presented as case studies to
explore some of the reasons behind their attainments.
2.3 Health
Health is an important aspect of human development. One of the most important
predictors of health status is income. However, health is a dimension of human capital
and healthier people are more productive. The relationship between health and income is
bi-directional: the health status of a person influences his or her income status as well.
Given the prevalence of mass poverty in India, the question is not only how to raise the
incomes of the poor that will be instrumental in improving their health status but also to
identify policy interventions that can improve people’s health status at existing income
levels (and can be instrumental in raising incomes). Provision of public health services
3
Here mention must also be made of the hilly state of Himachal Pradesh situated in the north of
India in the foothills of the Himalayas. It is a small, sparsely populated state accounting for a little more
than half a percent of India’s population. Given the remoteness of its hilly topography and the fact that the
state is situated in the Hindi belt, same as the BIMARU States with which it shares similar institutional and
bureaucratic set-up, it’s achievements in education and health are remarkable. [] These achievements are
ascribed to the greater level of ‘social capital’, the better status of women and greater parental demand and
pressure for education for their children, in the state. For a more detailed description of Himachal
Pradesh’s achievements, see Dreze and Sen (2002).
10
such as access to basic and preventive health care, sanitation, clean water and raising
awareness about the causes of illness and their treatment are some of the ways in which
the now industrialized countries improved the health of their citizenry at comparable
levels of development and before the onset of the medical revolution.
Health indicators have continued to improve over time in India. Infant mortality
rates have shown a steady and secular decline in India and life expectancy too has
continued its upward climb. Yet, the state of affairs is far from satisfactory: health
indicators in India are inferior not only compared to the rich countries of the West but
also compared to the achievements of other developing countries like China and Brazil.
For example, despite greater resources, life expectancy in some states of India is similar
to those in some of the poorest sub-Saharan African countries. Only the state of Kerala
records achievements in health that are better than not only the rest of India but also the
rest of the developing world and often at par with the Western developed countries.
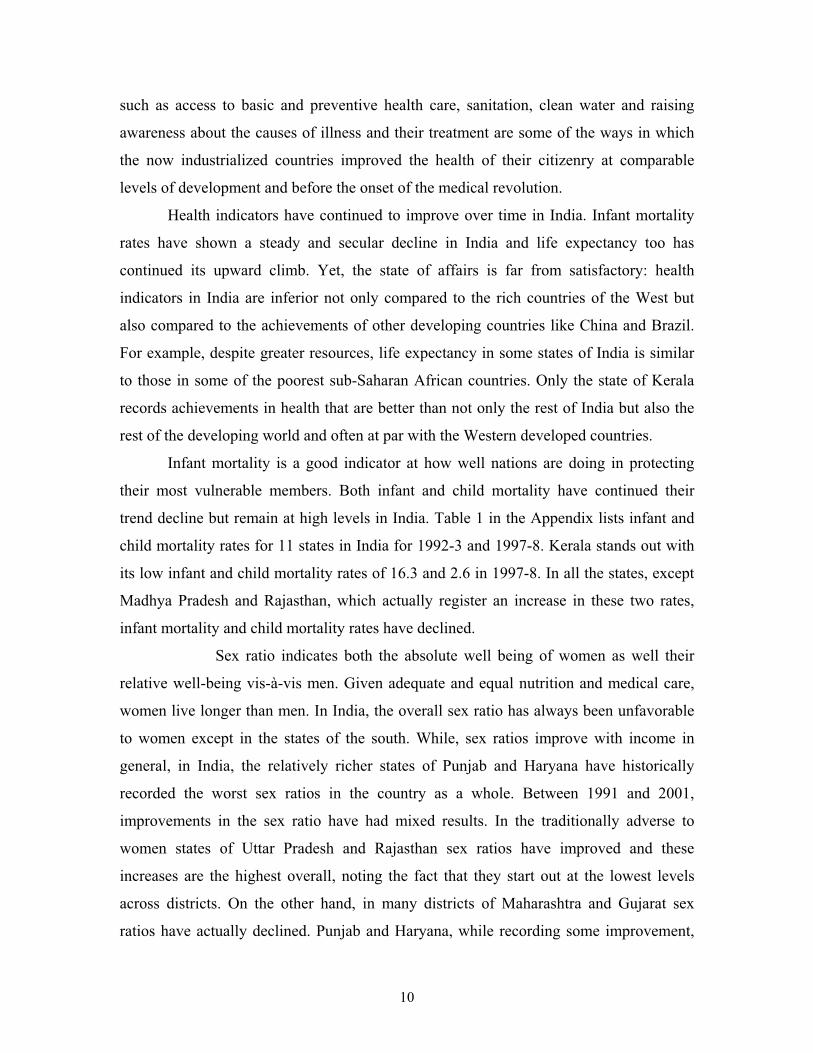
Infant mortality is a good indicator at how well nations are doing in protecting
their most vulnerable members. Both infant and child mortality have continued their
trend decline but remain at high levels in India. Table 1 in the Appendix lists infant and
child mortality rates for 11 states in India for 1992-3 and 1997-8. Kerala stands out with
its low infant and child mortality rates of 16.3 and 2.6 in 1997-8. In all the states, except
Madhya Pradesh and Rajasthan, which actually register an increase in these two rates,
infant mortality and child mortality rates have declined.
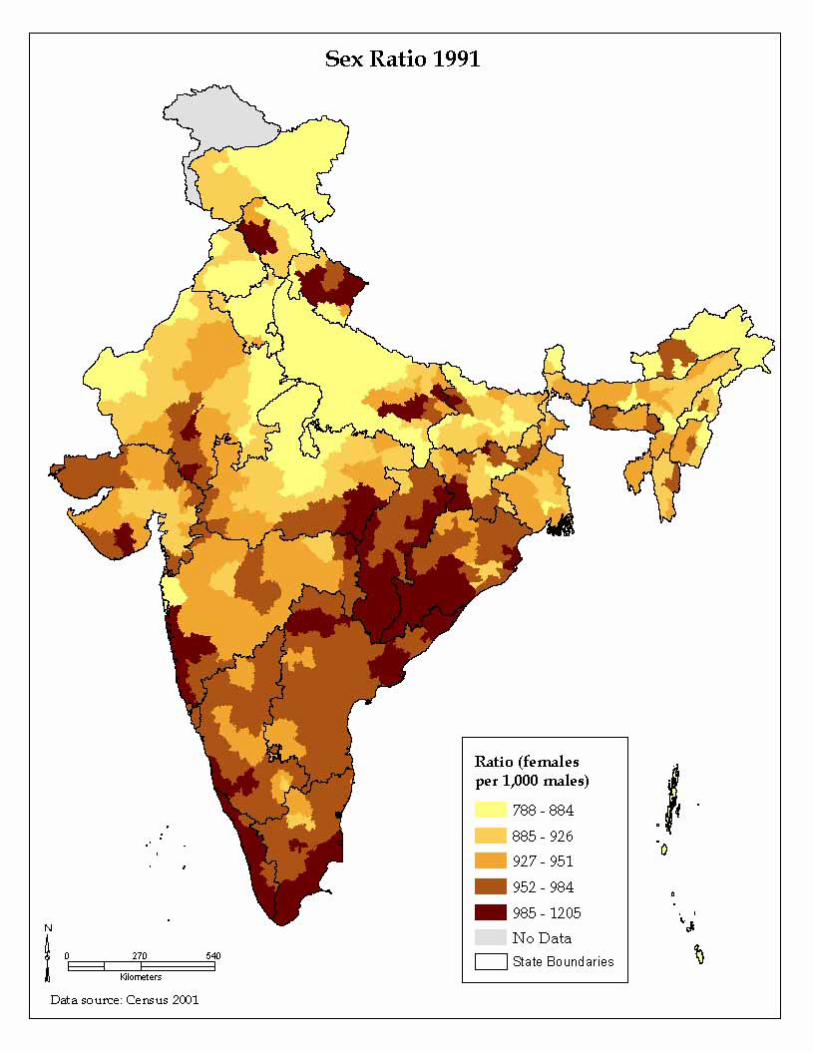
Sex ratio indicates both the absolute well being of women as well their
relative well-being vis-à-vis men. Given adequate and equal nutrition and medical care,
women live longer than men. In India, the overall sex ratio has always been unfavorable
to women except in the states of the south. While, sex ratios improve with income in
general, in India, the relatively richer states of Punjab and Haryana have historically
recorded the worst sex ratios in the country as a whole. Between 1991 and 2001,
improvements in the sex ratio have had mixed results. In the traditionally adverse to
women states of Uttar Pradesh and Rajasthan sex ratios have improved and these
increases are the highest overall, noting the fact that they start out at the lowest levels
across districts. On the other hand, in many districts of Maharashtra and Gujarat sex
ratios have actually declined. Punjab and Haryana, while recording some improvement,

11
continue to have some of the lowest sex ratios. Maps 7 and 8 in the Appendix provide a
visual picture of sex ratios at the district level for the years 1991 and 2001. The pictures
are not very different in the two years. The darker colors – russet and maroon –, which
depict higher sex ratios, dominate in the southern states, parts of southern Gujarat,
Himachal Pradesh and the small, hilly states of the northeast, in 1991. The picture
remains much the same in 2001, with the darker colors dominating in the states of the
South and their distribution in the rest of India follows a pattern similar to that in 1991.
2.4. Socio-economic differentials across gender, caste and rural location
There are wide disparities in poverty, health and education outcomes across
different sections of the population and across different regions of the country as have
been discussed to some extent in the section above. Rural and urban India record large
differentials in all social development indicators. Apart from the rural-urban divide,
gender, caste and class are also systematically associated with disparate well-being
outcomes.
Data on sex ratio and male and female literacy rates discussed above provide
some indication of discrepancies in social well being that systematically vary with
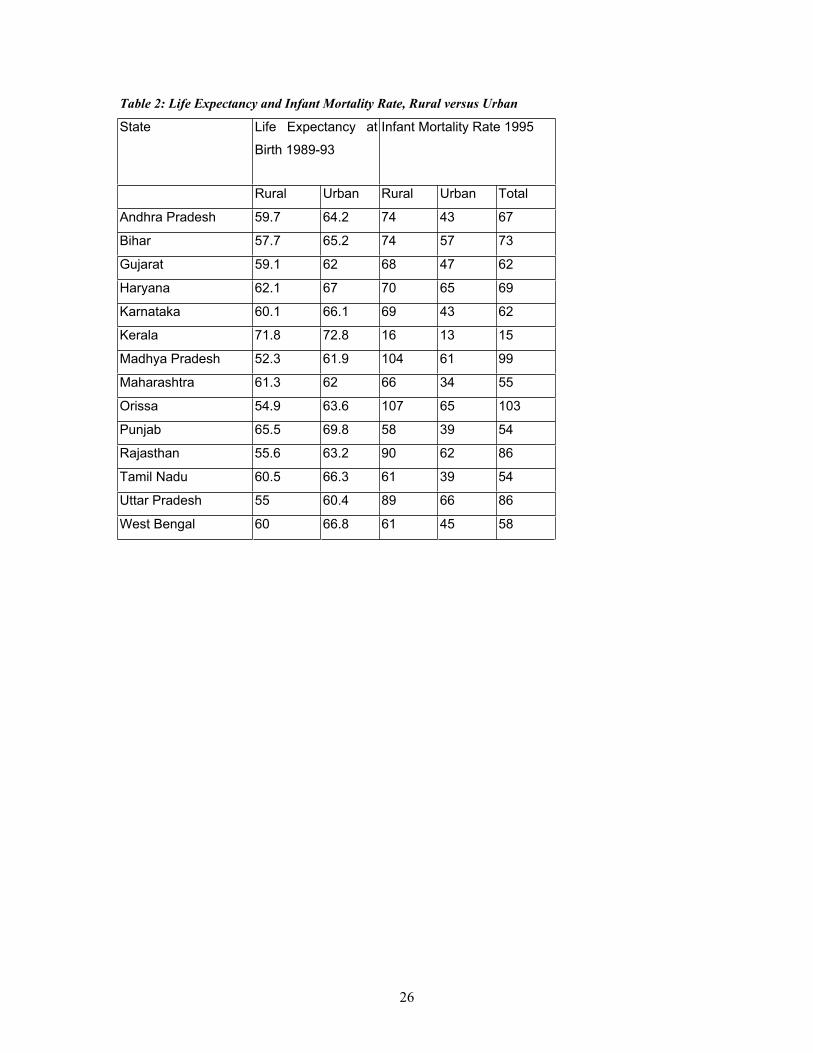
gender. Table 2 in the Appendix shows rural and urban life expectancy and infant
mortality rates for the 14 major states. Except Kerala, in all states there are large
discrepancies in these two health outcomes across rural and urban populations. This is
especially true of infant mortality rates. Post-independence, India has consciously
pursued a policy of affirmative action whereby the historically socially and economically
backward scheduled castes and tribes have been given preferential treatment. However,
even after 50 years since independence, the caste divide in India continues to mark the
social landscape, especially in the rural areas and the hinterlands. Membership of
scheduled castes and tribes systematically predicts education and health outcomes for the
population. As has been noted in section 2.1, poverty is concentrated in areas with a
greater presence of backward castes and tribes. As noted in section 2.2, Shariff and
Sudarshan (1996) found that female literacy rates among members of scheduled tribes in
Rajasthan and Madhya Pradesh were as low as 7% and 9% respectively. In order to
provide some idea of how members of scheduled castes and tribes fare vis-à-vis the rest
12
of the population, Table 3 in the Appendix provides 1991 literacy data for the 14 major
states, as 2001 Census data for Scheduled castes and tribes is not yet available. It can be
seen from the table that Scheduled castes and tribes, while they have lower than average
literacy rates in all states, fare particularly badly in the BIMARU states and in Haryana
and Andhra Pradesh.
Even as impressive advances have been made in the spread of literacy with the
number of non-literates actually falling as per the 2001 census, the gaps between the
education of males and females remains a cause for concern. The difference between
male and female literacy rates in 1991 was 25 percentage points. Even as both male and
female literacy rates recorded jumps in 2001, female literacy rates trailed behind male
literacy rates by 22 percentage points.
Education and health among Indian citizenry have been improving over time but
the large disparities across sections of the population are worrisome. In terms of health
and from the viewpoint of the framework of the epidemiological transition, different
sections of Indian society seem to belong to different phases of the transition: the poor
and vulnerable sections of the population suffer from diseases of poverty and under-
nutrition, largely infectious and gastro-enterical diseases; among the rising urban middle
class, the diseases of affluence such as heart and non-communicable chronic degenerative
diseases are more prevalent. Similarly, large sections of the population, especially rural,
tribal and female continue to be deprived of basic education and literacy.
3. Case Studies
Among the fourteen major states, Kerala has always stood out as a star in terms of
social development, closely followed by Tamil Nadu and in some respects West Bengal.
On the other hand, the BIMARU states have always ranked the lowest. However, in the
last two decades, Madhya Pradesh has recorded impressive achievements in education as
a result of greater and better public intervention. While there are lessons to be learnt from
the success of Kerala, there are important lessons to be learnt from the improvements
made by Madhya Pradesh. These lessons acquire great significance for the other
BIMARU states which share cultural contiguity with Madhya Pradesh. In the following
section, case studies for Kerala and Madhya Pradesh are presented to highlight the crucial

13
role played by public action in achieving social development at low levels of per capita
income.
Case Study: Kerala
Kerala’s achievements in social development are legendary especially in a
scenario of low levels of per capita income and low rates of income growth. The key to
Kerala’s success has been social intermediation and active public action and financial
commitment over time to provide education and health to every individual in the state. In
terms of both health and education, Kerala ranks the highest among all Indian states. In
1991, the human development index for Kerala was 0.775 compared to that of Punjab
which had a human development index of 0.770. On the other hand, Kerala’s per capita
income was only half that of Punjab in 1991 (Mehrotra and Jolly, 2000).
The state of Kerala was formed by combining the provinces of Travancore,
Cochin and Malabar. At the time of the formation of the state, Travancore and Cochin
provinces had already achieved high rates of literacy and good health for their population.
The statistics for Malabar, however, were not different from the average for India as a
whole. However, by implementing policies and programs in Malabar that were already
prevalent in the other two provinces and providing more budgetary assistance to it, within
the span of a single generation, health and education in Malabar converged to those in
Travancore and Cochin.
What distinguishes Kerala’s achievements is the promotion of education and
widespread and equitable provision of health care and other services from an early stage.
This has led to a snowball effect in social achievements over time. Helped by mass
literacy, political activism in Kerala, especially the political organization of the deprived
sections of society and the favorable position of women in society has played a crucial
role in the reduction of social inequalities and in enabling the disadvantaged sections in
participating in the economic and social development processes. Notwithstanding the
unique cultural and historical characteristics that may have been conducive to the early
social development achievements in Kerala, as the experience of Malabar in catching up
with the other two regions shows, political participation and public action has played an

14
important role in Kerala’s social development successes and that its experiences can be
emulated by the other states of the Indian Union.
Case Study: Madhya Pradesh
Madhya Pradesh, situated in central India, is the largest state in the Indian
Union geographically with a land area of 44,348 square kilometers. In 2001, it accounted
for 5.8% of the Indian population, which meant that its population density was 196
persons per square kilometers, one of the lowest population densities among the 14 major
states in India. Madhya Pradesh is a poor, tribal state and historically, it has been socially
and economically backward, being one of the ‘BIMARU’ states. In 1991, Scheduled
Tribes comprised 23.27% of the total population of Madhya Pradesh, while scheduled
castes comprised of 14.54% of the total population. The headcount index of poverty for
Madhya Pradesh in 1993-4 was 44%, the highest among the major states and it accounted
for 9.2% of national poverty (Datt and Ravallion, 2002).
Between 1991 and 2001, however, Madhya Pradesh has made impressive gains in
literacy rates, registering some of the largest increases in literacy rates for both males and
females across all districts of India. In 1991, the average literacy rate across districts of
Madhya Pradesh was 43% and the average for female literacy rates was only 27%. In
2001, the average literacy rates across had increased to 63% and for females to 49%. As
can be seen from Maps 3 and 6 in the appendix, districts in Madhya Pradesh registered
the largest increases in total and female literacy between 1991 and 2001.
The remarkable gains in literacy made by Madhya Pradesh can be explained by
the twin-pronged strategy of the Madhya Pradesh Government: (a) provision of schools
and guaranteeing access and (b) a model for spreading literacy that makes use of the
synergies between the community, the local and the state governments4. Between 1997
and 1998, under the newly initiated Education Guarantee Scheme (EGS), Madhya
Pradesh established 26,000 new schools, most of them in areas inhabited by Scheduled
4 The State government has empowered the Panchayats to set-up new schools in response to community
demand, appoint teachers and locate land for schools. Importantly enough, the Panchayats also have the
authority to dismiss teachers who are not performing. Education Committees comprising of Janpad
Panchayat and District Panchayat members oversee all matters of school education like location of new
schools, transfer of teachers within the District and staffing of District Institutes of Educational Training.
The Gram Panchayats also manage all such schools that are set-up through the Education Guarantee
Scheme.

15
Castes and Scheduled Tribes. This made possible for Madhya Pradesh to declare
universal access to education. In order to address the challenge of mass literacy, Madhya
Pradesh moved away from the Total Literacy Campaign (TLC) model at the national
level and pioneered a new scheme, the ‘Padhna Badhna Andolan’ (PBA). The PBA uses
the organizational support provided by the institution of the Panchayati Raj (village
councils) to broker the spread of education at the level of the community. The key
elements of the PBA process are as follows:
Non-literates come together as Padhna Badhna Samitis.
They choose an educated person from the locality to be their teacher or
Guruji.
They register at the nearest Panchayat (village council) or Jan Shiksha
Kendra (Cluster Resource Center) with their names and that of their
proposed teacher.
After verification of their non-literate status, the government registers the
teacher and provides him/her with training and teaching-learning material.
The teaching-learning material consists of 4 primers – the first three on
literacy and the fourth on rights (land, gender, forest, labor). The aim of
the fourth primer is to reposition the Padhna Badhna Samiti as a self-help
group.
The government’s role is only as an evaluator and for conducting
examinations.
There are monetary incentives for the teacher who receives an honorarium
of Rupees 100 per learner (to which the community may add if it wishes).
The response to the scheme was overwhelming with 217,000 Samitis with a total
enrolment of 5.18 million people being formed (Rajiv Gandhi Missions Occasional
Papers, 2001). The success of the scheme has translated into remarkable literacy results
for Madhya Pradesh, with every 6th
person removed from the category of illiterates
belonging to the state and every 5th
woman removed from the category of illiterates
belonging to the state. The strategies pursued by the state to spread education make use of
16
conditions that also exist in other states and therefore provide a valuable way forward for
similarly placed states.
4. Public Provision and Infrastructure
India is moving forward towards greater literacy and better health for its
population. While, gains in literacy have been impressive, those in health have been
lackluster. Moreover, average gains hide large differences across districts within the same
state and across different socio-economic groups.
In India, provision of public goods in health and education has always been
lackluster. One of the reasons why literacy rates displays a slow upward climb in the
laggard states is the inability of public services to keep up with the increase in population
size. Spread of education depends on the availability of, and access to, educational
institutions. The issue of availability of, and access to schools, becomes even more
critical in the face of increasing population size. In most districts, the availability of
primary schools per 100,000 of population has fallen between 1991 and 2001 indicating
the inability of the education system to keep up with population change. On the other
hand, as the success of Madhya Pradesh in spreading education shows, access to schools
is a crucial component of any policy effort towards the goal of mass literacy. The
education system in India has been criticized for its neglect of primary education and its
lopsided attention to higher levels of schooling. In a country where only a little over 10%
of the school going population can afford private schooling, it becomes imperative for the
government to provide its growing population with an adequate number of schools. The
quality of schooling in India is also suspect. Field studies find parents disenchanted with
the quality of education their children get in school. Bad schools reduce parental
motivation to send children to school and keep them there and increase their motivation
to put their children to work, contributing to the phenomenon of child labor. According to
Ramachandran and Saihjee (2002), aggregate data hides a social hierarchy of access at
ground level.
India’s performance in improving the health of its population has been much
inferior compared to educational development. Infant, child and maternal mortality rates
remain at very high levels. Among the proximate causes of infant and child mortality is
17
inadequate nutrition, among pregnant mothers and among small children. Rates of
anemia among children are very high in India as can be seen from Table 1. Barring
Kerala, where the percentage of children with anemia is 44%, all other states have more
than 65% of children suffering from anemia. In Bihar, Rajasthan, Maharashtra and Orissa
more than 70% children are anemic. Another proximate reason for childhood mortality is
the extent of protection from infections and diseases of childhood. Adequate and timely
immunization goes a long way in providing protection from polio, measles and
diphtheria. The prevalence of complete immunization among children is heterogeneous
across states and districts of India. In 1999, West Champaran in Bihar registered the
abysmally low figure of 14% for children with complete immunization, which was a
quarter of the mean of 60% for all districts. On the other hand, Madurai in Tamil Nadu
recorded near universal immunization with 99.5% of all children having received
complete doses. District averages clustered around 45% in the other four poorly
performing states of Uttar Pradesh, Madhya Pradesh, Rajasthan and Orissa. With less
than half of all children immunized, high childhood causalities are not surprising, though
unacceptable.
Maternal care, both pre-natal and post-natal is characterized by gross neglect in
India, which has one of the highest levels of maternal mortality in the world. The average
estimated maternal mortality rate between 1982-86 for the 14 major states was 580 per
100,000 birth. In Rajasthan and Uttar Pradesh, the estimated maternal mortality rates
were as high as 938 and 935 respectively in this period. The reasons for such high
maternal mortality range from poverty, high fertility rates, gender bias, under-nutrition
and high incidence of anemia among pregnant mothers to the lack of access to primary
medical care, lack of access to family planning and reproductive health services and non-
availability of trained medical personnel in rural areas. In Table 1, the percentage of
anemic women in 11 major states is listed for the year 1997-8. The percentage of anemic
women range from more than 63% in Bihar and Orissa to 22% in Kerala with the other
states clustering around 50%. Apart from lack of nourishment, many women lose their
lives in childbirth due to poor availability of medical infrastructure and personnel. For the
188 districts in the 14 major states for which data are available in 1999, the percentage of
pregnant mothers who delivered infants in hospitals or under the supervision of trained
18
medical personnel at home was as low as 7.9% in Samastipur in Bihar, while 100% of
mothers delivered their infants under proper supervision in Pathanamthitta in Kerala. The
mean for all districts was 49% with a very high standard deviation of 25 percentage
points. Districts with more than 50% of mothers who delivered babies with trained
medical attendants present belonged to the southern states of Kerala, Karnataka, Andhra
Pradesh and Tamil Nadu, the western state of Maharashtra and Gujarat, the northern
states of Punjab and Haryana and West Bengal. Only two districts each belonging to
Madhya Pradesh, Rajasthan and Orissa and three of Uttar Pradesh qualified in this area.
In all districts of Bihar fewer than half the mothers delivered babies under safe
conditions. Moreover, in these poorly performing states, the better statistics belonged to
the relatively more urban districts and large cities. In Madhya Pradesh, the two large
cities of Indore and Gwalior, 72% and 61% of mothers respectively delivered their babies
in a safe environment.
It is now widely accepted that aspects of women’s agency are instrumental in
reducing infant mortality rates and raising child health levels. High fertility rates and high
female illiteracy rates are generally associated with high infant and child mortality rates
and inferior child health outcomes. In India, fertility rates have been declining over time
with Kerala having achieved a below replacement fertility rate of 1.96. However, the
decline in fertility rates has been varied across Indian states as is evident from Table 1.
Although fertility rates have declined in all the states, in the BIMARU states, fertility
rates are still very high ranging from 3.27 in Madhya Pradesh to 3.96 in Uttar Pradesh in
1997-8. Empirically, it has been proven that higher female literacy is associated with
lower fertility. In a panel study for the districts in India, Dreze and Kingdon (2000) show
that women’s education is causal in lowering fertility. Moreover, more educated women
are more likely to experience lower infant mortality and child mortality rates and are also
more likely to invest more in their children’s education. More educated mothers’ process
information more effectively and are more likely to make use of maternal and child care
services. Large disparities exist between literate and illiterate mothers in the production
of child and infant health. These disparities are further exacerbated by membership of
scheduled and low castes and tribes. However, rural or urban residence cut across
education, caste and class groups with greater differentials in health outcomes between

19
rural and urban populations than across other socio-economic groupings. In order to
improve the health of its population, India will have to redress existing inequalities that
exist between rural and urban areas and across different socio-economic groups.
One of the most important reasons for high levels of mortality and morbidity in
India is under-nutrition. Food security continues to elude many. One of the contradictory
aspects of Indian development is the continuing lack of access to food by large sections
of the population in a period when national availability of food stocks per capita is at
historic high levels. Endemic under-nourishment claims many more lives than large-scale
famines. The former has less political visibility, which leads to its neglect in public
discussion and the political agenda of political parties. As a result a huge proportion of
the Indian population continues to suffer from chronic under-nutrition and the burden of
avoidable illness and morbidity.
Success at eradicating illness also depends on information available to people
about the causes of illness and their prevention and treatment. Such knowledge is
abysmally low, especially among the most vulnerable sections of the population. Added
to the existing bundle of diseases is the spread of HIV/AIDS, which also requires raising
public awareness as a critical component towards combating it.
In India the approach to health planning at the national and state levels has been
ad-hoc. Health policy has been pursued by way of multiple schemes, which are neither
integrated with each other nor with development strategy in general. Such an approach
further reduces the effectiveness of limited financial and human resources. Moreover,
public services in India have historically been of low standards in both quantity and
quality. The health infrastructure in India is either not in place, or is in place and non-
functional. However, the quality of what is available is so low that people would rather
see a private medical practitioner at great cost rather than make use of publicly provided
health services.
Better infrastructure is one of the keys to economic development in general.
India’s infrastructure network is large, developed and reaches all parts of the country.
Yet, it is not enough and it is rightly touted as one of the major constraints to the future of
economic growth and attainment of social development goals in India. States and districts
with better infrastructure also have higher rates of literacy and better population health.

20
Better and modern infrastructure may not be directly causal towards better education and
health as better infrastructure, literacy and health, all could be the result of a third factor
such as greater governmental intermediation. Districts in the state of Punjab have the
highest infrastructure index, yet Punjab has mixed results in social development terms.
Nevertheless, better roads, electricity and telephones allow greater access to markets,
schools and hospitals, and relevant and timely information. In general, better
infrastructure leads to greater knowledge and participation by the masses in economic
and social opportunities, especially for those who live in the hinterlands of the country.
For 334 districts on which data is available in 1999, the mean of the infrastructure index
across districts was 104, with Madras district in Tamil Nadu recording the highest with
472, followed by districts in Punjab and Mahbubnagar in Andhra Pradesh having a low of
65.
India has done reasonably well in providing electricity to most of its villages5.
Only 17 districts out of the 285 had less than 60% villages without electricity. Of these
17 districts, 9 were in Uttar Pradesh. Jehanabad in Bihar had only 22% of its villages with
electricity. The mean for all districts was 91%. In terms of availability of roads too, there
is large variation across districts. Lack of roads contributes to rural poverty, making
access to markets, health and educational facilities difficult. Due to lack of availability of
data, a detailed discussion on the availability of roads in Indian districts cannot be
provided but it can be surmised that districts with a higher infrastructure index also have
more roads per 100,000 of population.6
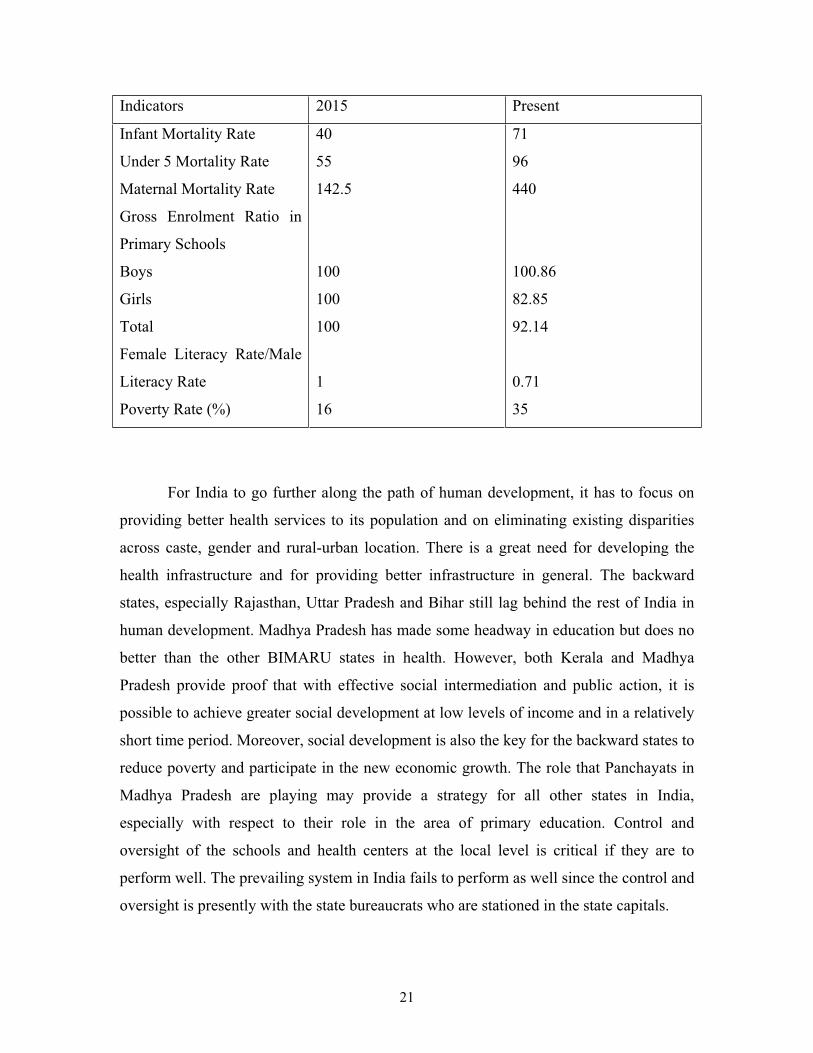
Towards the Millennium Development Goals:
The following table shows where India should be in 2015 if it achieves the
Millennium Development Goals and where it is located now7 and the distance it needs to
cover with respect to various indicators.
5 Of course, it should also be mentioned that almost all the State Electricity Boards (SEBs) are loss-making
since they implement social subsidy policies of state governments leading to inefficient patterns of energy
consumption, and even to non-recovery of their own costs. 6 For the 47 districts on which data is available for 1999, a simple regression of road length per 100,000
population on the infrastructure index was run: a 10% increase in the infrastructure index was associated
with an increase in 7 kilometers of road length. 7 The indicators for India’s present situation are based on the latest year for which information is available.
21
Indicators 2015 Present
Infant Mortality Rate
Under 5 Mortality Rate
Maternal Mortality Rate
Gross Enrolment Ratio in
Primary Schools
Boys
Girls
Total
Female Literacy Rate/Male
Literacy Rate
Poverty Rate (%)
40
55
142.5
100
100
100
1
16
71
96
440
100.86
82.85
92.14
0.71
35
For India to go further along the path of human development, it has to focus on
providing better health services to its population and on eliminating existing disparities
across caste, gender and rural-urban location. There is a great need for developing the
health infrastructure and for providing better infrastructure in general. The backward
states, especially Rajasthan, Uttar Pradesh and Bihar still lag behind the rest of India in
human development. Madhya Pradesh has made some headway in education but does no
better than the other BIMARU states in health. However, both Kerala and Madhya
Pradesh provide proof that with effective social intermediation and public action, it is
possible to achieve greater social development at low levels of income and in a relatively
short time period. Moreover, social development is also the key for the backward states to
reduce poverty and participate in the new economic growth. The role that Panchayats in
Madhya Pradesh are playing may provide a strategy for all other states in India,
especially with respect to their role in the area of primary education. Control and
oversight of the schools and health centers at the local level is critical if they are to
perform well. The prevailing system in India fails to perform as well since the control and
oversight is presently with the state bureaucrats who are stationed in the state capitals.

22
References
Datt, G and M. Ravallion, (2002), “Is India’s Economic Growth Leaving the Poor
Behind?” Manuscript.
Dreze, J. and G. Kingdon, (2000), Fertility, Education and Development: Further
Evidence from India, Development Economics Discussion Paper Series, STICERD,
London School of Economics.
Dreze, J. and A. Sen, (2002), India Development and Participation, Oxford University
Press, New Delhi.
Mehrotra, S. and R. Jolly (eds) (2000), Development With a Human Face: Experiences in
Social Achievement and Economic Growth, Oxford University Press, Oxford.
Ramachandran, V and A. Saihjee, (2002), “The New Segregation: Reflections on Gender
and Equity in Primary Education”, Economic and Political Weekly, April 27.
Sachs, J, N. Bajpai and A. Ramiah (2002), Understanding Regional Economic Growth in
India, Asian Economic Papers, MIT Press, Volume 1, Number 3.
Rededicating to the Continuing Challenge, Rajiv Gandhi Missions, Government of
Madhya Pradesh, Occasional Papers, Document 9, June 2001.
World Development Report 2000/2001, The World Bank, Washington D.C.
23
APPENDIX
Data Sources:
Data for district level total literacy rates, female literacy rates, male literacy rates 1991
and 2001 from Census India 1991 and 2001.
Data for district level sex ratios for 1991 and 2001 from Census India 1991 and 2001.
District level data for urbanization, infrastructure index, percentage children covered by
complete immunization, percentage children with anemia, percentage of pregnant
mothers who gave birth under safe conditions, percentage of villages with electricity,
road length per 100,000 of population from Center for Monitoring the Indian Economy
(CMIE) Database Profiles of Districts 2000.
Graph 1: Regression of Literacy Rates 1991 on percentage urban population 1991
60.40436.0ˆ * xy ; 21.02R ;
*significant at the 5% level; No. of observations = 375
Percentage Urban, 1991
Fitted values Literacy Rates, 1991
1.86 100
19.01
95.72

24
Graph 2: Regression of Literacy Rates 2001 on Infrastructure Index 1999
09.4420.0ˆ * xy ; 17.02R ;
*significant at the 5% level; No. of observations = 375
Infrastructure Index 1999
Fitted values Literacy Rates, 2001
57.41 216.49
31.02
95.9

25
Table 1: Health Indicators for Selected States
States Infant Mortality
Rate
Child Mortality
Rate
Total Fertility Rate % of Children
with Anemia
% of Women
with Anemia
1992-3 1997-8 1992-3 1997-8 1992-3 1997-8 1992-3 1997-8 1992-3 1997-8
Andhra
Pradesh
70.4 65 22.4 21 2.59 2.25 NA 68 NA 50
Tamil Nadu 67.7 48.2 20.1 15.9 2.48 2.18 NA 66.1 NA 56.5
Bihar 89.2 73 42 34.6 3.98 3.47 NA 79.1 NA 63.6
Uttar Pradesh 99.9 86.7 46 39.2 4.75 3.96 NA 70.8 NA 48.7
Madhya
Pradesh
85.2 86.1 49.3 56.4 3.85 3.27 NA 71.5 NA 54.4
Rajasthan 76.3 80.4 33.8 37.6 3.58 3.73 NA 76.4 NA 48.7
Karnataka 65.4 51.5 23.5 18.9 2.83 2.13 NA 65.8 NA 42.4
Kerala 23.8 16.3 8.4 2.6 2 1.96 NA 44.2 NA 22.6
Gujarat 73.5 62.2 32.7 24 2.97 2.7 NA 70 NA 46
Maharashtra 50.5 43.7 20.9 15 2.86 2.52 NA 72.2 NA 48.6
Orissa 112.1 82 21.3 25.5 2.92 2.45 NA 71.3 NA 63.1
Source: National Family Health Surveys Phases I and II
26
Table 2: Life Expectancy and Infant Mortality Rate, Rural versus Urban
State Life Expectancy at
Birth 1989-93
Infant Mortality Rate 1995
Rural Urban Rural Urban Total
Andhra Pradesh 59.7 64.2 74 43 67
Bihar 57.7 65.2 74 57 73
Gujarat 59.1 62 68 47 62
Haryana 62.1 67 70 65 69
Karnataka 60.1 66.1 69 43 62
Kerala 71.8 72.8 16 13 15
Madhya Pradesh 52.3 61.9 104 61 99
Maharashtra 61.3 62 66 34 55
Orissa 54.9 63.6 107 65 103
Punjab 65.5 69.8 58 39 54
Rajasthan 55.6 63.2 90 62 86
Tamil Nadu 60.5 66.3 61 39 54
Uttar Pradesh 55 60.4 89 66 86
West Bengal 60 66.8 61 45 58

27
Table 3: Literacy Rates, Scheduled Castes and Tribes, 1991
State % of
Population
SC 1991
% of
Population
ST 1991
Literacy
Rates 7+
1991
Literacy
Rates 7+
SC 1991
Literacy
Rates 7+
ST 1991
Andhra Pradesh 15.93 6.31 44.09 32 17
Bihar 14.56 7.66 38.48 20 27
Gujarat 7.41 14.92 61.29 61 36
Haryana 19.75 … 55.58 39 0
Karnataka 16.38 4.26 56.04 38 36
Kerala 9.92 1.1 89.81 80 57
Madhya Pradesh 14.54 23.27 44.2 35 22
Maharashtra 11.1 9.27 64.87 56 37
Orissa 16.2 22.21 49.09 37 22
Punjab 28.31 … 58.51 41 0
Rajasthan 17.29 12.44 38.55 26 19
Tamil Nadu 19.18 1.03 62.66 47 28
Uttar Pradesh 21.04 0.21 41.6 27 36
West Bengal 23.62 5.6 67.7 42 28
Source: Census of India, 1991