Embed Size (px)
Citation preview

For comments, suggestions or further inquiries please contact:
Philippine Institute for Development StudiesSurian sa mga Pag-aaral Pangkaunlaran ng Pilipinas
The PIDS Discussion Paper Seriesconstitutes studies that are preliminary andsubject to further revisions. They are be-ing circulated in a limited number of cop-ies only for purposes of soliciting com-ments and suggestions for further refine-ments. The studies under the Series areunedited and unreviewed.
The views and opinions expressedare those of the author(s) and do not neces-sarily reflect those of the Institute.
Not for quotation without permissionfrom the author(s) and the Institute.
The Research Information Staff, Philippine Institute for Development Studies5th Floor, NEDA sa Makati Building, 106 Amorsolo Street, Legaspi Village, Makati City, PhilippinesTel Nos: (63-2) 8942584 and 8935705; Fax No: (63-2) 8939589; E-mail: [email protected]
Or visit our website at http://www.pids.gov.ph
December 2006
DISCUSSION PAPER SERIES NO. 2006-23
Joseph Lim
Towards Financing the MillenniumDevelopment Goals of the Philippines

1
Sept. 18, 2006
Towards Financing the Millennium Development Goals of the Philippines*
A Study of the Philippine Institute for Development Studies With Funding from the United Nations Development Programme (UNDP)
* The project team is made up of Dr. Joseph Lim (Ateneo de Manila University), Dr. Rosario Manasan (Philippine Institute for Development Studies), Dr. Josef Yap (Philippine Institute for Development Studies), Clarence Pascual, Diana Del Rosario and Alvin Firmeza

2
ACKNOWLEDGEMENTS NEDA Assistant Director-General Rolando Tungpalan Director Erlinda Capones, Social Development Staff Director Dennis Arroyo, National Policy Planning Staff Dune Aranjuez Jocelyn Balugo Melanie Calumpang Janet Cuenca Cora Garcia Tess Madamba April Mendoza Sheryll Namingit Nar Prudente Raquel Rago Butch Rufino Arlene Ruiz Lia Tandoc Ria Constantino-Go Tian Marlene Vinluan Harrison Yu DFA Undersecretary Edsel Custodio, International Economic Relations Director Marilyn Alarilla, International Economic Relations Mr. Arnel Sanchez, International Economic Relations DOF Undersecretary Gil Beltran, Domestic Finance Undersecretary Roberto Tan, International Finance Group Director Edita Tan, International Finance Group Ms. Abigail Barbara Sanglay, Group Division Chief, Corporate Affairs Group Bureau of the Treasury Cristine L. Sanchez, OIC, Research and Accounting Service BSP Deputy Governor Diwa Guinigundo Director Celia Gonzales, International Department Staff of the International Dept and Dep. Gov. Guinigundo’s Office

3
DepEd Undersecretary Manaros Boransing, Undersecretary for Mindanao Affairs Assistant Secretary Lily Roces Mr. Selwyn Briones Ms. Ester Dijamco Mr. Ben Etrata House of Representatives Director-General Rodolfo Vicerra, Congressional Planning and Budget Department (CPBD) Department of Health Director Mylene Beltran, Health Policy Development and Planning Bureau (HPDPB) DBM Undersecretary Laura Pascua, Fiscal Planning Bureau Director Gisela C. Lopez, Fiscal Planning Bureau Members of Civil Society Mr. Ernest Leung, former Acting Secretary of the Department of Finance Mr. Romeo Bernardo, former Undersecretary of the Department of Finance Dr. Leonor Briones, Social Watch Ms. Ana Maria Nemenzo, Freedom From Debt Coalition (FDC) and staff of FDC Ms. Rina Maria P. Rosales of Resources, Environment and Economics Center for Studies, Inc. (REECS) Dr. Leonardo Lanzona, Professor, Ateneo de Manila University Mr. Filomena Sta. Ana and Ms. Janet Carandang, Action for Economic Reforms

4
Table of Contents Executive Summary Chapter One: Not Achieving MDG Targets Translate to Stunted Human Development 1.1 Poverty Profile 1.2 Regional Disparities: Depressed and Conflict Areas 1.3 The Philippines’ Poverty Compared With Its Asian Neighbors 1.4 Malnutrition in the Country 1.5 Universal Access to Primary Education 1.6 Basic Health 1.7 Environmental Sustainability 1.8 Access to Safe Water Supply and Sanitation Chapter Two: The MDG Financing Gap
Chapter Three: Policies to Bridge the MDG Financing Gap 3.1 Mobilizing Domestic Resource 3.2 Improving Employment Opportunities 3.3 Increasing the Foreign Exchange Earning Capacity 3.4 Equitable Sharing of Income and Wealth 3.5 Fiscal reforms: Increasing the Fiscal Capacity to Mobilize Resources 3.6 Efficient and Correct Use of External Development Assistance 3.7 Private-Public Sector Partnership 3.8 Better Governance and Institution Building
Chapter Four: Identifying MDG Funding and Safeguarding MDG Financing 4.1 A Broad and Integrated Approach 4.2 Identifying and Prioritizing MDG Activities and Projects for Funding 4.3 Promotion and Campaign to Ensure Significant Funding for Vital MDG Funding
4.3.1 Enhancing Existing Institutions and Mechanisms to Mobilize and Safeguard Funding for MDG Needs
4.3.2 Exploring the Creation of an MDG Fund 4.4 Focusing on Some MDG Projects and Their Funding
4.4.1 Education for Muslim Mindanao 4.4.2 Hunger Mitigation Program in Schools (Food for Education Program) 4.4.3 Identifying Other MDG Programs That Require Funding 4.4.4 The President’s Priority Program on Water (P3W)
4.5 Ensuring Transparency and Accountability in MDG Projects 4.6 Issues on Absorptive Capacity
4.6.1 Procurement 4.6.2 Other Bottlenecks and Obstacles: The Need to Develop LGU Capacity 4.6.3 Some Donor-Related Bottlenecks
Chapter Five: The Philippine Fiscal and Debt Problems: A Major Hindrance to MDG
Financing

5
5.1 Debt Servicing Cutting Into Vital Social and Economic Services 5.2 Large Debt Servicing Vis-à-vis Low Government Revenues Lead to More Debt
Dependence 5.3 The Need to Increase Revenue Generation, Reduce Debt Servicing, Stop
Expenditure Constriction of Social and Economic Services, and Improve Expenditure Allocation
5.4 A Look at the External Debt Composition
Chapter Six: The Prospects of Debt Reduction or Debt Conversions to MDG Financing for Middle-Income Countries
6.1 Debt-to-Equity and Debt-for-Development Swaps 6.2 Benefits of Debt-to-Development and Debt-to-Nature Conversions 6.3 Paris Club Debt Conversion
6.3.1 The Need for an IMF Debt Sustainability Assessment and an IMF-Supported
6.3.2 An IMF Debt Sustainability Assessment May Jeopardize Country’s Credit Worthiness
6.3.3 Limits on ODA and non-ODA debt 6.3.4 The Cut-Off Date
6.4 Creditor Countries’ Policies on Debt Conversions 6.5 Creditor Countries’, UN and Paris Club’s Responses to Philippine Debt-to-MDG
Financing Proposal 6.6 Other Debt Relief: Debt Reduction and Debt Rescheduling 6.7 Responses of Philippine Stakeholders to the Above Situation 6.8 The Indonesian Case
6.8.1 The Asian Crisis Retarded Poverty Reduction Progress 6.8.2 No Debt Reduction for Indonesia During the Asian Crisis 6.8.3 Indonesia’s Debt and Fiscal Position Better Than the Philippines’ 6.8.4 MDG Targets Also Lagging Behind in Indonesia 6.8.5 German Debt Conversions for Education and Nature: A Genuine Debt
Reduction for MDG Financing 6.9 Promoting Debt Conversions for Priority MDG Projects and Programs 6.9.1 Targeting Creditor Countries for Debt Conversions to MDG Financing 6.9.2 The Debt Conversion Schemes for MDG Financing 6.9.3 Debt Relief for Disaster Relief
6.9.4 Relying on a Menu of MDG Financing as Lobbying for Debt Conversion Might Take Time
6.10 Debt-to-Equity Conversions 6.11 Debt Audits, Debt Caps and Debt Composition: Ensuring Proper Debt
Management 6.11.1 Debt Audits
6.11.2 Debt Caps and Debt Servicing Caps 6.11.3 Proper Debt Management 6.12 Improving the International Financial System for Debt Conversions
6.12.1 More Responsive and Flexible Paris Club Rules

6
6.12.2 A Needed Change in the Concept of Debt Sustainability 6.12.3 Approach to Introduce Concepts of Debt Sustainability to Incorporate
Financing Needs of the Millennium Development Goals (MDG) 6.12.4 Different Conditionalities for the New Concept of Debt Sustainability 6.12.5 Practical Considerations to the New Concept of Debt Sustainability 6.12.6 Developed Countries’ Commitment to the Millennium Declaration and
Financing for Development; International Campaign of Low and Middle Income Countries Outside HIPC
Summary and Conclusions References
List of Tables
Implementation Matrix for Prioritization and Safeguarding of MDGs and Debt Reduction Campaign
Table 1.1 2003 Regional Poverty Estimates Table 1.2 Percentage of Population Below $1 (1993 PPP) Per Day Consumption Table 1.3: Poverty GAP Ratio: Mean Percentage Distance Below $1 (PPP) Per Day Table 1.4 Resource Gaps Table 1.5. Proportion of teachers who are non-science and non-math majors Table 1.6: Costing and Budget Gaps in MDG Health Programs and Projects Table 1.7. The Philippine MDG rate of progress Table 1.8. Statistics of Key MDG Targets That Need to Be Improved Table 2.1. Summary of Available Resource Requirement for MDG Table 2.2. Summary of Resource Gaps based on High Cost Assumptions Table 3.1: Gross Domestic Savings and Gross Investments and the Savings-Investment
Gap As % of GDP Table 3.2: Exports (X) and Imports (M) and Current Account Balance, as % of GDP Table 3.3: Share of GDP for 20% Richest Vs. 20% Poorest Table 4.1: Identified MDG-Supportive Programs and Projects to Be Expanded/ Replicated:
Funding for 2005 -2010 Table 5.1: Fiscal and Public Finance Figures for the Philippines
Table 5.2a: National Government Expenditures, Obligation Basis, By Sector, % of GDP
Table 5.2b: National Government Expenditures, Obligation Basis, By Expense Class, % of GDP
Table 5.3: Financing of the National Government Deficit Table 5.4: Short-Term Debt Ratio and External Debt Service Ratio Table 6.1: Philippine Debt Swaps under Various Schemes, 1986 to 1993 Table 6.2 Outstanding Loans Restructured in 1994 Under Paris Club Table 6.3: Paris Club Creditor Countries and the Bilateral Debt Available for Conversions Table 6.4: Responses of Entities Consulted on Debt-to-MDG Approach Table 6.5. List of Paris Club Debt Treatments Table 6.6: Indonesian and Philippine Fiscal and Debt Indicators Table 6.7: Potential Bilateral Debt Stock for Debt-to-MDG Conversions (as of December
2005)

7
List of Figures
Figure 1.1. Proportion of households with per capita intake below 100 percent dietary energy requirement
Figure 1.2. Projection on prevalence of underweight 0-5 year-old children Figure 1.3. Typical progression of a sample cohort of 100 pupils (Source: Department of
Education) Figure 1.4. Drop-out rates from 1998 to 2003 Figure 1.5. DepEd Budget Share of the National Budget, 2000-2006 (Source: DepEd) Figure 1.6. Maternal deaths, 1990-2002 (Source: NSO) Figure 3.1: Unemployment Rate and GDP Growth Rate Figure 3.2: Total, Visible and Invisible Underemployment, 1998-2006 Figure 3.3 Underemployment and Poverty Incidence by Region Figure 4.1. The Project Development Cycle (Source: Manual for Project Monitoring,
NEDA)
List of Boxes
Box 4.1: On Transparency and Accountability: The President’s Priority Program on Water (P3W)
Box 6.1: Philippine Debt-to-Nature and Debt-to-Development Swaps Box 6.2: The Evian Approach
List of Annexes
Annex A1: External Debt of the Philippines by Borrower, in Millions of US Dollars Annex A2: External Debt of the Philippines by Borrower, Breakdown as % of Total Annex A3: External Debt of the Philippines by Borrower, Breakdown as % of GDP Annex B1: External Debt of the Philippines by Institutional Creditor, in Millions of US
Dollars Annex B2: External Debt of the Philippines by Institutional Creditor, Breakdown as % of
Total Annex B3: External Debt of the Philippines by Institutional Creditor, Breakdown as % of
GDP Annex C: Outstanding Philippine External Debt Owed to Bilateral Creditors Annex D: External Debt by Length of Maturity Annex E: Philippine External Debt, By Maturity, By Creditor, By Borrower Annex F: MDG-Related Projects With Possible High Commercial Rates of Return

8
List of Acronyms ANCs Antenatal checkups ARMM Autonomous Region of Muslim Mindanao AusAID Australia’s Aid Program AWUIP Angat Utilization and Water Improvement Project BEAM Philippines-Australia Basic Education Assistance for
Mindanao BIR Bureau of Internal Revenue BNAQ Bicti - Novaliches Aqueduct BOC Bureau of Customs BOT Build-Operate-Transfer BWSA BWSA - Bildungswerk der Wirtschaft Sachsen-Anhalt eV CARP Comprehensive Agrarian Reform Program CBCP Catholic Bishops’ Conference of the Philippines CBO Community-based organization CDF Countryside Development Fund CIDSE Cooperation Internationale Pour le Developpement et la
Solidarite COA Commission on Audit CSO Civil society organization DA Department of Agriculture DENR Department of Environment and Natural Resources DFA Department of Foreign Affairs DepEd Department of Education DOE Department of Energy DOF Department of Finance DOH Department of Health DOLE Department of Labor and Employment DPWH Department of Public Works and Highways DTI Department of Trade and Industry ECA Export Credit Agency E-VAT Expanded value-added tax FDC Freedom From Debt Coalition FfD Financing for Development FIES Family Income and Expenditures Survey FIVIMS Food Insecurity and Vulnerability Information and Mapping
System FLEMMS Functional Literacy, Education and Mass Media Survey FSP Food for School Program GAA General Appropriations Act GEF Global Environment Facility GPPB Government Procurement Policy Board GPPB Government Procurement Policy Board GPRA Government Procurement Reform Act

9
HABITAT Habitat for Humanity HIPC Heavily Indebted Poor Countries HMP Hunger Mitigation Program HUDCC Housing and Urban Development Coordinating Council ICC Investment Coordinating Committee IMF International Monetary Fund KfW Kreditanstalt fur Wiederaufbau LAKASS Lalakas ang Katawang Sapat sa Sustansya LCF League of Corporate Foundations LGU Local government unit MCIHDC Multisectoral Committee on International Human
Development Commitments MDG Millenium Development Goal MIMAROPA The provinces of Occidental Mindoro, Oriental Mindoro,
Marinduque, Romblon and Palawan MMDA Metro Manila Development Authority MMR maternal mortality rate MTPDP Medium Term Philippine Development Plan MTPIP Medium-Term Public Investment Program NAPC National Anti-Poverty Commission NAPOCOR National Power Corporation NCRFW National Commission on the Role of Filipino Women NDHS National Demographic Health Survey SDS Social Development Staff NEDA National Economic and Development Authority NEP National Expenditure Program NHA National Housing Authority NHMFC National Home Mortgage and XX Corporation NPPS National Planning and Policy Staff NSCB National Statistical Coordination Board ODA Official development assistance PAMB Protected Area Management Board PAP Programs, activities and projects PBSP Philippine Business for Social Progress PGMA President Gloria Macapagal-Arroyo Philhealth Philippine Health Insurance Corporation PIO Project Implementation Officer PIS Public Investment Staff PITC Philippine International Trade Corporation PMS Project Monitoring Staff PRRC Pasig River Rehabilitation Corporation RDC Regional Development Councils RSDC Regional Social Development Committee SEAMEO INNOTECH Southeast Asian Ministers of Education Organization
Regional Center for Educational Innovation and Technology SNITS Simplified net income tax system

10
TEEP Third Elementary Education Project TFCA Tropical Forests Conservation Act TFCA Tropical Forests Conservation Act TFR Total fertility rate TIMSS Trends in Math and Science Survey TSP Total suspended particulates UN DESA UN Department for Economic and Social Affairs UNCTAD United Nations Conference on Trade and Development UNDP United Nations Development Programme UNICEF United Nations Children’s Fund UPCAT Philippines College Admissions Test WASCO Water and Sanitation Coordination Office Watsan Water and sanitation WTO World Trade Organization WWF World Wildlife Fund

Abstract This study resulted from UNDP’s interest in the Philippine proposal for debt-to-MDG financing presented to the United Nations in September 2005. It is based on an analysis of the problem and the processes involved as well as consultations with key Philippine stakeholders, and views of creditor countries. One of the salient points of the study is the need to improve the Philippines’ performance to meet the Millennium Development Goal (MDG) targets. The Philippines lags behind in terms of achieving the 2015 MDG targets as compared with her neighbors. There is obviously a need to hasten and broaden activities, projects, and programs that will quickly address the problems. Another key point is the large gaps in financing the attainment of the MDG targets in 2006-2015. Although the enactment of new tax measures eased the fiscal situation starting in 2006, the additional fiscal resources are still inadequate to fully cover MDG resource requirements. Bridging the MDG financing gaps calls for policies geared toward improving income and employment generation as well as the savings mobilization of Filipinos. The study suggests policies to promote equitable distribution of income and wealth to improve the MDGs substantially and reduce the MDG financing needs. It also proposes concrete recommendations to mobilize and safeguard MDG financing as well as policies for debt reduction or debt conversion to MDG financing. Keywords: millennium development goal (MDG), MDG financing, MDG projects and programs, financing gap, debt reduction, debt conversion, debt management

11
Executive Summary This study was born out of the UNDP’s interest in the Philippine proposal for Debt-to-MDG Financing presented to the United Nations in September 2005. It is based on an analysis of the problem and the processes involved as well as consultations with key Philippine stakeholders. It also takes into account the views of creditor countries, including members of the Paris Club. But the study concentrated on the opinions of the key Philippine stakeholders without whose cooperation, the study would not have been possible. We would like to thank most especially the National Economic and Development Authority (NEDA) Social Development Staff, Project Monitoring Staff, Public Investment Staff and the National Policy and Planning Staff (NEDA SDS, PMS, PIS and NPPS), Department of Finance (DOF) and Bureau of Treasury, Bangko Sentral ng Pilipinas (BSP), the Department of Education (DepEd), Department of Health (DOH), Department of Foreign Affairs (DFA), and the Office of the Speaker of the House of Representatives The following is a summary of the salient points of the study: 1. The Need to Improve the Philippines’ Performance to Meet the MDG Targets The Philippines is lagging behind in terms of achieving the 2015 MDG targets or compared with her neighbors. Using the medium assumption for population growth, in 2003, there were 24.4 million Filipinos below the poverty line, 11.0 million below the food subsistence threshold, around 3.4 million underweight children 0-5 years of age, 1.1 million children were not immunized for serious diseases, 9.3 million people eating below the required food intake for proper nutrition, 1.4 million children of elementary school age not enrolled, and 2,800 potential maternal deaths (annually). Thirty-six out of 100 new elementary school children will not finish elementary schooling. Less than 50% of Filipino couples were not practicing family planning or responsible parenthood. The latest data in 2005 and early 2006 show more than 4 million people openly unemployed and another 7 million underemployed. Other serious problems involve the provision of water and sanitation, destruction of natural resources, and child mortality. The MDGs aim to reduce substantially the above problems of many of our people and to increase our human, social and economic development. Obviously there is need to hasten and broaden activities, projects and programs that will quickly address the above needs. 2. Estimates of the MDG Financing Gap Manasan (2006) estimates large gaps in financing the attainment of the MDG targets in 2006-2015 (see Table below). Although the enactment of new tax measures (notably lifting of many exemptions in the VAT and an increase in the VAT rate from 10% to 12%) eased the fiscal situation starting in 2006, the additional fiscal resources is still inadequate to fully cover MDG resource requirements (including the backlog built up in earlier years). It will be recalled that the resource needs in the education, health and water and sanitation sectors in support of the MDGs have been severely under-funded in 1998-2003 because of the tight expenditure controls that were put in place in response to the deterioration in the revenue effort.

12
Summary of Resource Gaps in 2006 prices,
2007-2015 (in million pesos) (High cost assumption)
Year Resource gaps - MTPDP GDP growth rate
Educ Health Water/Sanitation Poverty Total Percent red'n to GDP
2007 30,592 5,126 171 59,131 95,020 1.46 2008 33,131 5,015 135 55,874 94,156 1.36 2009 38,517 4,840 91 51,949 95,397 1.29 2010 44,373 4,735 55 48,598 97,761 1.23 2011 41,812 4,443 (3) 28,891 75,144 0.88 2012 38,153 4,184 (60) 23,299 65,576 0.72 2013 28,402 3,891 (122) 17,276 49,446 0.51 2014 20,201 3,561 (190) 10,792 34,364 0.33 2015 9,971 3,197 (263) 3,879 16,784 0.15
2007-2010 146,613 19,716 452 215,553 382,334 1.33
2007-2015 285,153 38,992 (186) 299,689 623,647 0.80
Year Resource gaps - low GDP growth rate
Educ Health Watsan Poverty Total Percent red'n to GDP
2007 33,666 5,535 183 59,318 98,702 1.54 2008 38,011 5,514 156 56,856 100,537 1.48 2009 45,693 5,453 123 53,944 105,213 1.47 2010 54,000 5,463 99 51,707 111,270 1.48 2011 54,336 5,314 55 33,277 92,983 1.17 2012 53,902 5,211 14 29,118 88,244 1.05 2013 47,755 5,091 (31) 24,699 77,514 0.88 2014 43,574 4,953 (80) 20,006 68,453 0.73 2015 37,643 4,795 (132) 15,023 57,330 0.58
2007-2012 279,608 32,491 630 284,221 596,950 1.35
2007-2015 408,579 47,330 388 343,949 800,246 1.11
Source: Manasan (2006) Manasan (2006) updates the estimates made earlier in 2002 of the resource requirements and resource gaps that are pertinent to the attainment of the MDGs on primary education, child mortality, maternal health, HIV/ AIDS, malaria and other diseases, and environmental sustainability. The estimates of the resource requirement for the achievement of universal primary education (Table 2.1 and Table 2.2) assumes that the Grade 1 intake rate will increase from 74% in SY 2003-2004 to 100% in SY 2010-2011 and the grades I-VI cohort survival rate from 68% to 100% in SY 2015-2016. For this to

13
happen, adequate resources must be made available to ease the lack of teachers and classrooms in schools facing severe shortages in 2007-2013, and provide sufficient school inputs to meet the requirements of new entrants. Furthermore, the MDG cost estimate for education also includes the cost of additional programs to improve the quality of basic education. Manasan’s analysis shows that, depending on the growth rate assumptions, the total resource gaps for critical MDGs range from P623.647 billion to P800.246 billion pesos for the period 2007-2015. Using the current exchange rate of P51 to the US dollar, the MDG financing requirement is anywhere from $12.2 billion to $15.7 billion for the same period. 3. Policies to Bridge the MDG Financing Gap Bridging the MDG financing gaps calls for policies geared towards improving income and employment generation as well as the savings mobilization of Filipinos. Higher income and savings as well as greater employment allow self-financing of these needs, thereby reducing the need for public financing. Policies to promote equitable distribution of income and wealth will also improve the MDGs substantially and reduce the MDG financing needs. These policies include: a. Improving incomes and savings rate of the country since savings provide the
domestic resource base to finance human, social and physical investments. Specifically:
i) Promote quality and equitable economic growth. As incomes across all
income classes increase with economic growth, nominal and real savings, as well as the savings ratio, will naturally increase.
ii) Reduce the high dependency burden of Filipino families by placing greater
emphasis on family planning and population programs as well as programs for employment generation.
iii) Increasing government savings to ease the fiscal bind. Raising the levels of
government revenues and spending are necessary but not sufficient. More progressive tax and expenditure policies are key. It must also be pointed out that reducing the public debt burden helps improve government savings.
b. More equitable sharing of wealth and income. Reforms in land, agrarian assets,
housing and access to resources and social services are critical. c. Improving Employment Opportunities. An alarming situation in the Philippines is
the fact that unemployment rates have been increasing and have failed to ease with economic growth. Lack of employment opportunities leads directly to increases in poverty and retardation of human development. Promoting full employment (and reducing underemployment) requires not only high economic growth. It also requires policies and programs that go beyond micro-financing and towards

14
promotion of an integrated employment and industrial plan for the country and promotion of sectors that will be contributing to both growth and employment generation. It will also require better infrastructure in the rural and depressed areas, such as farm-to-market roads, improved transportation systems, rural electrification and local area development.
Policies to mobilize resources for MDG financing either through higher revenues or better use of public funds: d. Fiscal Reforms. Mobilizing taxes to generate public funding for vital projects,
reduce the fiscal deficits and to reduce dependence on debts to finance vital key expenditures are essential. The government has already implemented a series of tax reforms including, the expanded value-added taxation (E-VAT), the increase in the E-VAT rate from 10% to 12%, higher ‘sin’ taxes, increase in corporate income tax, and the lateral attrition law. Two tax bills are pending in Congress– rationalization of fiscal incentives and the simplified net income tax system (SNITS). The latter puts a ceiling on allowable deduction of business expenses by self-employed taxpayers. Improved tax administration – such as computerized tax audits and reshuffling of custom inspectors – aim to catch and prosecute big tax evaders and to run after smugglers. Prominent personalities have been prosecuted for tax evasion and highly publicized in the media. These must be accompanied by more progressive taxation that place emphasis on tax collection from big corporations and high-income individuals. The government must give bias to social and economic spending that will benefit the poor and vulnerable. It has committed to use the increased revenue collection from the E-VAT for vital social, economic and infrastructure spending. The MDG financing schemes will also contribute towards this end.
e. Mobilize external development assistance, especially grants, and financial
resources from the domestic business sector, church sectors, civil society organizations and community organizations in private-public and global partnerships in development and social financing.
f. Improve social accountability and transparency for development projects, and
reduce corrupt and wasteful use of funds in the public sector. This also includes more efficient and accountable allocation of budget funds in government expenditures.
4. Concrete Recommendations to Mobilize and Safeguard MDG Financing 4.1 Prioritizing and Planning for MDG Projects and Programs and Their
Financing NEDA has graciously provided a tentative list of prioritized list of MDG projects from the draft Medium Term Public Investment Program (MTPIP) for 2005-2010 (Table 4.1). The list is useful for lobbying for additional funding (and adding more projects and programs

15
as they are identified). The funding can come in the form of grants, debt conversions, external development assistance, public funds and tax revenues, domestic private financing from business, church groups and civil society organizations. Particular programs where financing may be inadequate and additional financing should be raised include: the Madrasah Muslim education program (where Muslim countries can be tapped for grants and debt conversions), Food for Education Programs, employment generating programs, family planning and population programs, maternal health projects and programs, water and sanitation programs, immunization of children (where the MDG target is retrogressing), hospitals for the indigents, school buildings in depressed areas, social insurance schemes for vulnerable groups, rural infrastructure such as farm-to-market roads, and irrigation systems. It must be emphasized that MDG programs should target poor and depressed provinces and regions, and areas where the magnitude of the poor is high. 4.2 Recommendations to Mobilize and Safeguard MDG Financing To mobilize and safeguard MDG funds, concerted action by key government agencies is recommended: a. A joint initiative by the MDG Committee in the House of Representative and the
Budget Appropriations Committees in the Lower Houses and the Senate can lead to the legislation of a bill prioritizing MDG-related spending in the budget appropriations, and protecting them from budget cuts, expenditure constriction or budget reallocation. Short of legislation, the MDG Committee and the Budget Appropriations Committees can agree on common guidelines that will prioritize and assure MDG funding and spending in the budget appropriations and protect it from budget cuts, expenditure constriction or reallocation of budget resources to other government spending. The MDG Committee and Budget Appropriations Committees in both Houses can also try to coordinate a strategy to channel part of the Countryside Development Fund (CDF) or ‘pork-barrel’ funds to MDG financing. (This is a recommendation of Social Watch and other civil society groups).
b. Since the line agencies, especially the DepEd, DOH, and local governments are free to
mobilize for the funding of their priority MDG projects and programs, the funds generated will be enhanced if there is an improvement in the identification and promotion of the vital MDG projects and programs consistent with the MTPDP and the MTPIP.
c. There is a need to strengthen and systematize reporting of MDG spending by the
various line agencies to DBM, and the consolidation of the budget for MDG spending by the DBM. In this regard, it is important: 1) to identify MDG budget funding in the line agencies, 2) use the definitions of the MDG and targets to define and identify MDG spending, 3) request DBM to require line agencies to report MDG funding in their agencies and to consolidate the reports for the whole national government. Monitoring MDG spending and their budget items will ensure that there will be a transparent mechanism to track MDG related budget items and their financing, and to identify programs that require additional funding. Tracking and monitoring the

16
financing of MDG projects and programs among the government’s line agencies will go a long way in identifying areas and sectors that need additional financing.
d. Another proposal is to replicate the success of appointing gender focal persons in the
various line agencies of the national government in order to mainstream gender sensitivity in the national government activities. It is worth exploring the establishment of MDG focal persons in key agencies (DepEd, DOH, DSWD, Department of Finance, Department of Budget and Management, Department of Agriculture, Department of Agrarian Reform, DPWH, DENR, DTI) to ensure MDG funding of vital activities and projects and to monitor MDG activities and projects. These MDG focal persons will be the key informants in their respective agencies for donors, private sector and other government agencies concerning MDG activities and projects in their respective areas.
e. It would also be beneficial to strengthen and link reports of the Regional Social
Development Committees (RSDCs) of the Regional Development Councils (RDC) on the MDG progress in the different regions of the country to the MDG plans in the MTPIP and to the budget appropriations process.
f. Similarly, it would be beneficial to strengthen and link reports of the Multisectoral
Committee on International Human Development Commitments (MCIHDC -- a subcommittee of the NEDA Board - Social Development Committee) on the progress of the country’s compliance on the MDGs and other international human development commitments to the MDG plans in the MTPIP and the budget appropriations processes. The Committee monitors compliance to five Conferences (the Millennium Declaration, World Summit on Social Development, Beijing Summit Platform on Women, HABITAT, International Committee on Population Development), all of which are related to the MDG targets.
g. Overall, there is a need to strengthen NEDA as the watchdog and key monitor agency
for the MDGs. Partly through the mobilization of external and domestic financing – and debt conversions to be discussed later -- there should be a mechanism to provide more funds and personnel in this department to monitor and to evaluate the MDG programs implemented by the various line agencies throughout the country. NEDA will also be the key agency that will sound off to the national government if funds for MDG are insufficient and if there is need to mobilize significant funding for the MDG needs.
4.3 Exploring the Establishment of an MDG Fund The paper also recommends a feasibility study on the setting up of an MDG Fund. The pro arguments are obviously in order to facilitate, systematize and institutionalize the channeling of ODA, debt conversion, government and private sector funds to priority MDG projects and programs. This will force the government and civil society to plan and prioritize MDG projects and activities more carefully and comprehensively. The con

17
arguments mostly have to do with the possibility of the political process using the funds for political objectives rather than for national and social objectives. To address the con arguments, it is recommended that the Fund be administered by a committee co-chaired by NEDA and UNDP. The membership of the committee may include the fiscal agencies of the government (DBM, DOF), key human development agencies (e.g. DOH, DepEd), local government representatives, key civil society groups (such as the church sectors, civil society organizations and the business sector), the House of Representative MDG Committee head, and key bilateral and multilateral donors. 4.4 Social Accountability for the MDG Projects and Programs and Improving
Their Absorptive Capacities It is important to address issues on transparency, auditing, accountability, procurement processes, monitoring and evaluation, and reducing corruption and inefficiencies in the planning, financing and implementation of MDG projects and activities. Improving social accountability is criticial to achieving the MDGs and is an integral part of MDG financing. To raise the absorptive capacity for MDG projects and programs calls for resolution of disputes arising from infrastructure projects, clear rules of procurement, auditing and accounting, better monitoring and evaluation processes, and improved local capacities to implement projects. Creditors and donors also have an equal responsibility of assuring these processes in the projects they are funding especially in the planning stage. There should clear agreements between donor/creditor and the local implementing agencies in terms of goals, implementation, monitoring, evaluation and auditing of the projects. 5. The Fiscal and Debt Burden of the Philippines: The Rationale for Debt
Reduction and Debt Conversions for MDG Financing The current fiscal situation is such that to lower fiscal deficits, total expenditures as a percentage to GDP had been reduced in 2004 to 2005, thus reducing all expenditures including social and economic services. Furthermore, debt servicing is eating up on vital social and economic services, further reducing the precious funds for MDG financing. Debt servicing for interest and principal payments comprised more than 85% of government revenues in 2005. - This means that less than 15% of government revenues can go to vital spending for
MDG financing and general administration of governance - This also means that the government will be forced to borrow substantially or constrict
expenditure drastically. Both encroach on vital spending for MDGs Hopefully, higher fiscal collection starting 2006 may reduce the above problem. But high debt servicing is foreseen to continue for a while due to the high debt incurrence in the previous years.

18
Furthermore multilateral and bilateral loans had been decreasing in the last two years as loan repayments exceed new loans incurred. There is thus strong motivation for exploring debt reduction and debt conversions for MDG financing. 6. Recommended Policies for Debt Reduction or Conversions to MDG Financing
for Middle Income Countries 6.1 Examples of Good Debt Conversions for Development and the Environment The Philippines and Indonesia had had very good experiences with debt-to-development and debt-to-nature conversions that had led to strong institutions delivering MDG activities. These include US AID and World Wildlife Fund support for biodiversity conservation for the Philippines, the Swiss debt conversion creating the Foundation for a Sustainable Society that supports community development projects, a German debt swap for forestry management in Quezon Province, a US debt swap for tropical forest conservation for the Philippines, a cancellation of French debt to build resettlement centers for victims of Mt. Pinatubo’s eruption, German debt swaps for training elementary school teachers and building junior high schools in depressed areas of Indonesia. 6.2 Limitations to Conversion of IMF and Paris Club Possibilities of debt reduction and debt conversions of bilateral debts to MDG financing are limited by the Paris Club rule of: a) requiring the debtor country to ask for an IMF debt sustainability assessment, enter an IMF program and request for a new Paris Club restructuring based on the more flexible Evian approach, or b) ask for current debt conversions based on debts incurred before the cut-off date of 1984, leaving very little debts eligible for conversion. The former is not acceptable to the economic managers of the country since it is based on a debt sustainability analysis of capacity to pay. This will give the wrong signal that the Philippines cannot pay its debts and will rattle the financial markets. The Indonesian MDG and debt situation is similarly constrained by the IMF and Paris Club rules and Indonesia suffered immensely during the Asian crisis as the international system did not allow it to achieve significant debt reduction and debt relief. The problem therefore is not just a specific Philippine problem but a general problem of indebted low-income and middle-income countries that are not part of the Heavily Indebted Poor Countries (HIPC). 6.3 Debt-to-Equity Conversions Debt-to-equity conversions by bilateral or commercial lenders and investors in the 2000s face different circumstances as when the Philippines faced default and got the debt-equity conversions at high discounts in the 1980s. Today the country is not seen by the financial markets as near default, and no discounts are given to Philippine debts. Thus investors or creditors interested in the debt-equity conversion will be convinced only if they find the MDG investment more attractive (i.e. it has a higher rate of return) than the commercial

19
sovereign debt papers (whose return is the international market interest rate plus risk premium). Debt to equity conversions should be guided by the following principles: a) the investments where debt-equity conversions are allowed must be a priority MDG project or program that lacks financing, b) the principle of additionality should be satisfied, i.e., the debt-equity scheme should not crowd out investors and financiers that would have invested in the project anyway without the debt-equity scheme, and c) the debt-equity conversion should abide by Philippine Constitution and laws concerning foreign equity participation rule in Philippine assets and ownership of public utilities. Appendix F gives some possible commercial projects with possible high rates of returns that may be considered: a) ecotourism to save marine resources and mangroves in Southern Palawan; b) bio-prospecting to save the forests and natural parks in Samar; c) investments in jatropha, a potential bio-fuel to provide cheaper fuel at a time of soaring world oil prices. 6.4 Debt Audit, Debt Caps and Debt Management Civil society organizations (especially Freedom From Debt Coalition) had been calling for a debt audit to ensure debts are being used correctly and for social and economic development. This is a worthwhile endeavor, especially with an appropriate bill or law. Similar calls for debt caps assume that fiscal deficits and government corporations’ losses are reduced (since public debts are incurred by these deficits). The government is pushing for the Fiscal Responsibility Bill to reduce the public debt burden by putting freezes on personnel increases in government agencies, and the ‘no additional revenue, no additional expenditures’ practice. In this regard, such debt cap proposals that call for reduced fiscal deficits have to ensure that the lower fiscal deficits are not at the expense of social and economic services vital for MDG needs. Debt service caps may also be considered (as called for by civil society organizations) limiting the payment of interest and principal payments for debts if they infringe on MDG financing. Proper debt management by the financial managers of the country is important to reduce the debt burden of the country. One important decision is the mix of domestic and foreign debt. Other important components of debt management involve the mix of short term, medium term or long term debts (with longer term debts evidently more desired – but dependent on their interest rates), and the mix among bilateral, multilateral and commercial debts. 6.5 An Urgent Call for an International Campaign for Debt Reduction for Middle-
Income Countries Given that the problem is mainly a general problem of indebted low-income and middle-income countries outside HIPC, the broader and international strategy recommended by this study, and consistent with the suggestions of the UN Secretary General and the Philippine stakeholders, is a two-pronged policy:

20
a) Offer attractive MDG projects and programs where bilateral debts can be channeled to, within or outside the Paris Club rules. This could be in the form of the MDG Fund or the system of prioritization of MDG programs discussed in section (chapter) 4. It must be emphasized that much of the MDG financing will have to go to depressed and poor areas of the country where poverty is rampant and the other MDG goals are far from the targets. Countries that should be approached are: Germany, Italy, Switzerland, US, Finland, Spain, France, Canada, United Kingdom, Denmark, Belgium, and Netherlands. Also to be approached should be non-Paris Club countries such as China, Taiwan, Singapore, Korea, Hong Kong, India and Muslim countries such as Malaysia, Brunei, Kuwait, Libya, Saudi Arabia. The latter countries can be tapped to specially fund Mindanao development programs including the Madrasah program. Demonstrating success with a few cooperative creditor countries can start a ‘snowball’ effect in convincing the bigger and more resistant creditor countries (such as Japan and Australia). For countries that frown on debt conversions, grants and ODA should be requested. The debt conversion schemes can be among the following:
i) Debt-to-development or debt-to-nature swaps where a third party (international
NGO, a UN agency) buys a sovereign debt and the Philippine puts peso counterpart (whether at a discount or not) on a priority MDG project,
ii) Conditional bilateral debt cancellation wherein a sovereign creditor agrees to write-off sovereign debts in exchange for the government putting a peso counterpart (whether at a discount or not) on a priority MDG,
As middle-income countries undertake the responsibilities above with the appropriate accountability and transparency processes, the international agencies and creditor countries should also accept their urgent responsibilities b) It is recommended that the UN system and UNDP spearhead an international campaign
to change the concept of debt sustainability of the Bretton Woods Institutions from capacity to pay to whether financing the MDGs are being blocked or hampered by debt servicing. This would change the Paris Club rules and allow a big chunk of bilateral debts to be reduced or converted without jeopardizing the country’s credit worthiness and rating. Debtor countries – both low-income and middle-income – should come together and support the change in the concept of debt sustainability. The Group of Non-Aligned Countries can also be mobilized to support this campaign, especially since the Philippines is co-chair of the Group starting this year. Once the change in debt sustainability concept is achieved and more debt conversions are allowed to non-HIPC countries, a multilateral and coordinated debt reduction initiative for MDG financing can then be undertaken along the Norwegian recommendation. There are billions of poor and vulnerable people in low and middle-income countries outside HIPC that the MDGs should serve. In this regard, it is recommended that UNDP and UN DESA, which are using the General Assembly meetings to discuss international bankruptcy and insolvency procedures already tabled, would do the following:
- Put on the agenda the new concept of debt sustainability and get as much support
from developing and developed countries, especially indebted countries

21
- The countries and the UN should develop a proposal to the G8 on this change of debt
sustainability concept and propose a change in the Paris Club Rules In employing the new concept of debt sustainability, the project team’s approach on this problem is not to come up with fixed and exact indicators of debt sustainability incorporating the MDG financing needs. Instead, a country is deemed eligible for debt relief if the following holds true: 1. The country is lagging behind in meeting at least one of the MDG targets and is facing
MDG financing gaps, and one or both of the following conditions hold: 2a. There are clear indicators that public sector debt service payments are encroaching or
reducing the potential and actual budget for social and economic services vital to meet the MDG targets.
2b. There are clear indicators that foreign exchange outflows to pay debt service are
impeding the economic and social development of the country and retarding the progress to achieve the MDG targets.
The Philippines and Indonesia satisfy the first two conditions. Whether one agrees or not with the economic conditionalities of the IMF and WB in HIPC and Paris Club-oriented debt initiatives, the new concept of debt sustainability primarily aims to release funds for meeting the MDG needs, which calls for a different set of conditionalities. The main conditionality should be the assurance by the debtor country that debt relief funds go to MDG financing and towards efficient, transparent and accountable systems that will optimize the use of debt relief funds for MDG needs. The above strategy requires mutual obligation and accountability. The developed countries should strive to achieve their commitments of providing external development assistance equivalent to at least 0.7% of their GNP (and this includes funds from debt reduction). Japan and the US, two of the Philippines’ top creditors fail miserably here, with Japan giving only 0.2% of its GNP in 2003, and the US giving a lower 0.15% of its GNP in the same year. It is hoped that as 2015 approaches, these and other developed countries would start to be more cooperative in financing vital MDG projects and programs, including those of low and middle income countries outside the Heavily Indebted Poor Countries (HIPC). The following matrix summarizes the implementation strategy for the paper’s recommendations:

22
Implementation Matrix for Prioritization and Safeguarding of MDGs and Debt Reduction Campaign
Implementing Agencies Time
Period Remarks I. Planning and Prioritization of MDG Projects Coordinating Body: NEDA ContinuingLine Agencies: DOH, DepEd, DSWD, DENR, DAR, DA, DOLE, NCRFW, NAPC, DPWH, other agencies
Continuing
Local governments and Civil society Continuing
Part of Development Plans and MTPIP
II. Monitoring and Evaluation of MDG Activities (Transparency and Accountability) A. On Implementation of Projects (Monitoring & Evaluation Incorporated in Project Plans)
NEDA, line agencies and local governments ContinuingNeed additional financing for project monitoring, transportation, evaluation activities, capacity building
B. On Use and Disbursement of Funds of MDG Projects and Activities NEDA, Line Agencies, COA, local governments Continuing III. Ensuring Absorptive Capacity for MDG Programs and Projects: Procurement; Resolution of Disputes; Procedures on Auditing, Accounting and Monitoring; National to Local Disbursements, Local Capacity Building NEDA, line agencies, local governments, foreign donors and creditors Continuing Need additional financing for local
capacity development IV. Safeguarding of MDG Financing A. Passage of Bill Prioritizing MDG Financing in the National Budget Congress, especially MDG Committee in Lower House and Budget Appropriations Committees in both Houses
6 months to a year
B. Strengthen and Systematize Reporting of MDG Budget Expenses by Line Agencies to DBM
DBM, Line Agencies To start as soon as possible
Recommend that DBM require line agencies to report MDG spending and that DBM consolidate the reports annually
C. Exploring the viability of establishing MDG focal persons in the line agencies, DBM and DOF
NEDA, line agencies, DBM, DOF 6 months to a year
D. Strengthen and Link Reports of Regional Social Development Committees (RSDCs) of the Regional Development Councils (RDC) on MDG Progress in the Regions to the MDG Plans and Budget Appropriations RSDC/RDC, NEDA, Line agencies Continuing E. Strengthen and Link Reports of the Multisectoral Committee on International Human Development Commitments (MCIHDC -- a subcommittee of the NEDA Board - Social Development Committee) on the progress of MDGs and human development to the MDG Plans and Budget Appropriations MCIHDC/NEDA, Lead agencies in charge of complying with the international commitments Continuing
F. Strengthen NEDA as the Watchdog and Key Monitor Agency of the MDGs
NEDA Continuing
Need additional financing for project and program planning, monitoring, evaluation and impact assessments and capacity building

23
V. Generating New Financing for MDG Activities and Projects A. Fiscal Reforms BIR, BOC, DOF, Bureau of Treasury, DBM, Congress (additional tax bills and fiscal reforms) Continuing
B. Mobilize Domestic Private Financing for MDGs in Public-Private Partnerships Civil society organizations, Business organizations, Church sectors, rich individuals, NEDA, NAPC, line agencies
Continuing
C. Mobilizing External Development Assistance, especially grants, for MDG financing
DFA, NEDA, line agencies, local governments, civil society, bilateral and multilateral donors/creditors and international civil society organizations
Continuing
D. Exploring the Establishment of MDG Fund NEDA, UNDP, MDG Committee of Lower House, Foreign Donors/Creditors, Private Sector
6 months to a year
VI. Identification and Promotion of Vital MDG Projects for Debt Conversions/ Grants/ Private-Public Partnerships MDG Fund Committee (if established), DFA, NEDA, line agencies, local governments, civil society, foreign donors
To start as soon as possible
VII. Policies to Ensure Proper Debt Management, Usage of Debt Funds and Reducing Debt Burden A. Ensuring Proper Debt Management of Debt Instruments (Best Mix of Domestic and Foreign Debts, Official and Commercial Debts, and Short/Medium/Long-term Debts)
Bureau of Treasury, Department of Finance, Bangko Sentral ng Pilipinas Continuing
B. Introducing Bills or Policies on Debt Audit and Accountability on Debt Funds Congress, especially the Finance Committees of Both Houses; Bureau of Treasury, DOF
6 months to a year
C. Passage of Fiscal Responsibility Bill to Reduce Public Debt Burden and Debt (Service) Caps Congress, especially Budget Appropriations and Finance Committees in both Houses, DOF, Bureau of Treasury
6 months to a year
VIII. International Campaign to Change Debt Sustainability Concept to Incorporate MDG Financing Needs in Order to Allow Developing Countries to Enjoy More Debt Reduction and Debt Conversions, and to Change the Paris Club Rules on Debt Reduction and Debt Conversions UN DESA, UNDP, Debtor Countries, Group of Non-Aligned Countries, Receptive Developed Countries, International CSOs
1 year to 5 years
Table this in the UN General Assembly; Present proposal to G8
Implementation Matrix for Prioritization and Safeguarding of MDGs and Debt Reduction Campaign (Cont.)
Implementing Agencies Time
Period Remarks
24
Chapter One: Not Achieving MDG Targets Translate to Stunted Human Development
Financing for MDG is vital to save millions of Filipinos from suffering between now and 2015. The recent Second Philippine Progress Report on the Millennium Development Goals (MDGs) shows that many indicators are pointing to inability to meet certain goals by 2015. Other indicators show that the Philippines is lagging behind many of its neighbors. These goals include poverty reduction, universal access to primary education, improvements in basic health, environmental sustainability, and access to safe water and sanitation. 1.1 Poverty Profile The latest (2003) data on poverty incidence in the Philippines show that 30.0 percent of the population was considered poor compared to 33 percent of Filipinos in 2000. This means that 3 out of 10 Filipinos live with less than Php 33.72 a day, an amount estimated sufficient to cover basic dietary requirements and other nonfood requirements such as clothing, medical care, education, among others. In terms of magnitude, this ratio signifies that close to 24,391,857 Filipinos subsist below the poverty line. Moreover, there is a decline in the proportion of people living below the subsistence food threshold from 15.8 percent in 2000 to 13.5 percent in 2003. Still, these figures translate to around 2 Filipinos for every 10 who are devoid of daily nutritional requirements that enable one to participate in income-generating and socially desirable activities. Again, in actual numbers, this turns into 10,976,335 family members who barely have something to eat thrice a day. Nonetheless, the good news is that these values illustrate a strong probability of achieving the target of halving poverty incidence from 45.3 percent in 1991 to 22.65 percent in 2015 (UNDP 2005b). In a way, it can be said that the country is on track in meeting the first MDG – slowly but surely. However, it must be taken into account that poverty measurements are not entirely free from inaccuracies. For one, the poverty data used excludes families without “official and permanent residence” (the ambulant poor who live under the bridge, squatter areas, on the streets, etc.), thereby understating the actual number of poor people in the country (Tiongson 2006). Moreover, the income and extreme poverty thresholds in the Philippines are much lower than the global figure of $1 a day. For instance, the per-capita daily food threshold is set at Php 22.33 in 2003. This value implies that enjoying three meals in a day comes at a cost of only Php 7.44 per meal, which leaves one wondering about the quality of nourishment that can be obtained from this amount of money (Tiongson 2006). As a result, lower poverty thresholds mean reduced numbers of people defined officially as poor. Furthermore, an ADB study showed that despite the country’s growth in GDP from 2000-2003, preliminary 2003 Family Income and Expenditures Survey (FIES) results indicate a

25
10-percent drop in real average family incomes. This means that sustained economic growth for this period had not been pro-poor (Tiongson 2006). 1.2 Regional Disparities: Depressed and Conflict Areas Indeed, the decline in the figures is not something to be totally happy about. In fact, such numbers overshadow the wide disparities in poverty incidence across regions. The poverty situation, based on 2003 data, reveals that the ARMM, Regions XIII (CARAGA), IX (Zamboanga Peninsula), and V (Bicol) are the poorest regions. As shown in Table 1.1, there are approximately 1 million Filipinos in ARMM, another 1 million in CARAGA, 1.6 million in the Zamboanga Peninsula, and 2.4 million people in the Bicol region who are considered as income poor. These are also the regions with incomes less than enough to attain proper nourishment in a day. Moreover, the same regions have the greatest difficulty in overcoming their state of poverty, as manifested in their large poverty gaps. Slackened growth and decrease in investments in these regions are reported due to peace and order concerns for these are exactly the conflict areas in the country (UNDP 2005a). Table 1.1 2003 Regional Poverty Estimates (Source: NSCB)
Poverty Incidence of Population
(%)
No. of people below poverty line (2.05%
pop’n growth rate)
Subsistence Incidence of Population
(%)
Poverty Gap Region
2003 2003 2003 2003
NCR 7.3 770,590 0.6 0.9
Region I 30.2 134,817 11.2 6.2
Region II 24.5 732,486 7.6 4.3
Region III 17.7 1,510,702 4.2 2.8
Region IV-A (CALABARZON) 18.8 1,823,092 4.9 3.5
Region IV-B (MIMAROPA) 47.9 1,358,755 22.9 11.9
Region V 48.4 2,410,731 26.6 13.2
Region VI 39.1 2,580,952 17.7 9.0
Region VII 28.4 1,722,510 14.6 6.8
Region VIII 43.3 1,661,410 21.0 9.6
Region IX 49.4 1,622,909 32.8 17.0
Region X 44.3 1,293,582 25.4 12.4
Region XI 34.4 1,897,183 17.6 8.5
Region XII 38.4 1,060,338 18.4 9.0
CAR 31.2 452,749 13.4 7.7
ARMM 53.1 1,361,255 24.1 12.7
Caraga 54.2 1,206,975 31.0 15.3
A regression analysis conducted by Bautista (2005) reveals a negative relationship between armed conflict (being in a conflict-ridden Mindanao province) and human

26
development. The results of the study indicate that, all other things constant, a province in Muslim Mindanao on average tends to have:
• an incidence of poverty that is higher by 32 percentage points; • income per person that is P11,000 lower (in 2000 prices); • cohort survival rates in basic education that are 31 percentage points lower; and • infant mortality rates that are 15 points higher.
An analysis of the evolution of the Moro conflict would show that the absence of basic services such as electric power, education, reliable water supply, and road transport is part and parcel of the conflict (UNDP 2005a). If current MDG financing gaps continue, these depressed and conflict areas will not be able to achieve their MDG targets, and peace and order in this region of Asia may be jeopardized. 1.3 The Philippines’ Poverty Compared With Its Asian Neighbors Comparing Philippine poverty data with those of other Asian countries reveals that the country is behind its neighbors in poverty reduction efforts. Table 1.2 shows that of the five countries, the Philippines displayed the slowest decline in poverty incidence at 25 percent from 1990 to 2002.
Table1.2 Percentage of Population Below $1 (1993 PPP) Per Day Consum ption
Country 1990 1991 1992 1993 1994 1995 1996 1997 1998 1999 2000 2001 2002 G rowth rate (1990-2002)
China 33 28 17 18 17 -48.48Indonesia 17 14 26 15 7 8 -52.94Philippines 20 18 14 15 -25.00Thailand 6 2 2 2 2 -66.67Viet Nam 15 4 2 -86.67Data last updated on 26 Aug 2005 Source: ww w.unstats.org
As to how far the income-poor people are from the $1 (PPP) threshold, Table 1.3 reveals that the Philippines comes second only to China in terms of having a high poverty gap. The data imply that the Philippines still has a lot of work to do in order to bring the proportion of the income poor in its population at or above the income threshold. Table 1.3: Poverty Gap Ratio: M ean Percentage Distance Below 1$ (PPP) Per DayCountry 1990 1991 1992 1993 1994 1995 1996 1997 1998 1999 2000 2001 2002China 8.9 7.3 3.8 4.2 3.9 Indonesia 2.7 2.2 5.4 2.3 1 0.9Philippines 4.2 3.9 2.9 3 Thailand 0.5 0.5 0.5 0.5 0.5 Viet Nam 2.5 0.5 0.5All 0.5% poverty gap estim ates indicate that actual values are less than or equal to 0.5% and should
be treated with caution.Data last updated on 26 Aug 2005 Source: www.unstats.org

27
1.4 Malnutrition in the Country Another vital aspect of poverty reduction is improving the nutrition of the population. Although the proportion of Filipino households with per capita intake below the 100 percent dietary energy requirement decreased from 69.4 percent in 1993 to 56.9 percent in 2003, the average annual percentage point reduction of 1.25 percent is not something to be proud about. There are still around 9,252,644 households or 46,263,222 Filipinos1 that do not meet the dietary requirement. Moreover, the actual rate of progress is lower than the required decrease of 1.85 percentage points per year to meet the 34.7 percent MDG target by 2015, as shown in Figure 1.1.
Figure 1.1. Proportion of households with per capita intake
below 100 percent dietary energy requirement (Source: The Second Philippine Progress Report on the Millennium Development Goals)
This means that more work needs to be done to bring the proportion of healthy Filipino families at the desired level. Eight regions (CALABARZON, V, VII, VIII, IX, X, XII, ARMM) register higher percentage of households with less than 100 percent energy adequacy than the national figure of 56.9 percent. Most of these areas, again, are plagued with peace and order concerns. On the other hand, the steepness of the lines in Figure 1.2 shows that the average annual rate of decline in the prevalence of underweight preschool children is also below the desired level to meet this MDG target. Data for 2003 show that there are 3,410,215 underweight children.
1 Assuming average household size of five

28
Figure 1.2. Projection on prevalence of underweight 0-5 year-old children (Source: The
Second Philippine Progress Report on the Millennium Development Goals) These scenarios imply the difficulty of meeting these goals on nutrition by 2015 (UNDP 2005b). A paper by former Education Undersecretary Juan Miguel Luz reveals that 30 percent of all pupils aged 6 to 12 is “underweight and under-height.” This condition is responsible for 25 percent of school dropouts before completion of Grade 4 and 35 percent before the end of Grade 6. The study also shows that 65 percent of pupils aged 6 to 12 are iodine-deficient, while one in every three suffers from iron-deficient anemia. Addressing health problems of school children, according to Luz, requires a multi-agency effort and some 20,000 doctors and nurses (del Mundo 2006). 1.5 Universal Access to Primary Education On education, there is a need for greater effort to increase completion rate at the primary level. As of 2003, the probability of attaining the target for the elementary cohort survival rate (CSR) is low, with ARMM the lowest CSR. The current rate of progress is at 0.13, way below the required rate of 1.04 (UNDP 2005b), as shown in Table 1.7.

29
100
8576
6658
43
2314
0102030405060708090
100
Grade1
Grade2
Grade4
Grade6
HS I HS IV CollegeI
CollegeGrad
Cohort Survival Trend
Figure 1.3. Typical progression of a sample cohort of 100 pupils (Source: Department of Education)
Based on the data from Figure 1.3, tracking the SY 1994-1995 age cohort (a typical cohort over the past thirty years) reveals that for every 100 children entering Grade 1 at either 6 or 7 years of age, 15 of them would not proceed to Grade 2. Of the 85 left by the end of Grade 2, another 9 will drop out by Grade 4, leaving 76 children from the original hundred. Sixty-eight percent of the cohort will reach Grade 6 with close to 66 percent graduating (34 out of 100 children entering elementary school will NOT graduate from elementary education). Out of the 66 graduates, only 58 will move up to the secondary level with 43 graduating. Further, 23 individuals from the 43 high school graduates will go to college and only 14 out of the 100 children who enrolled in Grade 1 will graduate with a university degree (DepEd 2005). It is important to note that the number of college graduates is less than half of the cohort from high school. This implies that a number of individuals drop out from school.2 Indeed, Figure 1.4 shows that the drop-out rate increased from 2001 to 2003 and was even higher than the 1998 level. There is a need then to address this gross dropout situation if the country is to raise the stock of professionals in the long term. One way to achieve this goal is by ensuring that more children stay in school in their earlier years. The Philippines envisions that for over a six-year period, a million pupils and students are added to the education sector, not through population growth, but by simply keeping these kids in school (DepEd 2005). The Department of Education (DepEd) then faces the challenge of fighting off the decreasing trend in elementary participation rate.
2 DepEd was able to calculate that out of the 15 that dropped out of high school from this cohort, five times more likely that these are boys than girls.

30
Drop-out Rates, 1998-2003
6.46.7
77.37.67.98.28.58.8
1998 1999 2000 2001 2002 2003
Year
Dro
p-ou
t rat
e (%
)
Figure 1.4. Drop-out rates from 1998 to 2003 (Source: NSO) In addition, the country’s dismaying performance in the aforementioned education indicators is only a façade to a more serious concern – the quality of education. According to the 2003 Functional Literacy, Education and Mass Media Survey (FLEMMS), 16 percent of Filipinos aged 10 to 64 years old or 9.2 million Filipinos are functionally illiterate, which means these Filipinos are unable to read, write, subtract and add, or understand simple instructions – something someone normally learns in Grade 4. Of Grade 6 kids, only 26 percent have a mastery of English, 15 percent of Science and 31 percent of Math. For high school students, only 7 percent had mastered English, 2 percent, Science, and 16 percent, Math. The national average scores in the Trends in Math and Science Survey (TIMSS) in 2003 leave much to be desired.3 In a presentation to the Cabinet in July 2005, DepEd said that, with present resources, it would take the Philippines 11 to 12 years to narrow the gap with the world average in achievement tests and 25 to 28 years to reach the Singapore level (del Mundo 2006) Indeed, there is a lot of work to be done to solve the issues confronting the quality of education. But before that, resource gaps have to be addressed first. The available classrooms, seats, textbooks, and teachers are not enough to meet the needs of the enrollees. As shown in Table 1.4, despite the 4,578 classrooms that can potentially be added in 2006, at least 5,971 classrooms still have to be built to fill in the gap. The same story also applies with the available seats, textbooks, and teachers.
3The scores were 378 in Math – 89 points behind the international average and 227 points away from the highest score matched by Singapore. In Science, the Philippines scored 377 – 96 points behind the international average and 201 points behind Singapore.

31
Table 1.4 Resource Gaps (Source: Department of Education)
SY 2006-2007 2006 NEP*** Gaps Satisfied Backlogs
2006 Unfunded Backlogs Resources Assumptions
No. Cost (Php) No. Cost
(Php) No. Cost (Php)
1:45* 45,775 20.00B 41,197 18.00BClassrooms 1:50** 10,549 4.61B 4,578 2.0B 5,971 2.61B1:1* 3.17M 1.90B 1.5M 0.90BSeats 1:2** 1.22M 0.73B 1.67M 1.0B 0 0
Textbooks 1:1 67.03M 4.69B 25.86 1.81B 41.32M 2.88B1:45 20,517 2.15B 10,517 1.10BTeachers 1:50 12,131 1.27B 10,000 1.05B 2,131 0.22B
Without Interventions 28.74B 22.88BWith Interventions 11.30B 5.86B 5.71B
*At single shift across all Regions except for NCR **At double shift in selected Divisions/Areas
Collectively, new investments for the four basic school resources alone would sum up to Php 28.74 billion. However, only 5.86 billion is potentially available to partially fund these resource gaps for SY 2006-2007. Hence, the Department still requires an amount of at least 22.88 billion to eliminate the gaps. In the General Appropriations Act (GAA) of 2006, which operated under a reenacted budget, the DepEd allocation is Php 112 billion, 11.31 percent of the national budget. This share of the national budget has been declining since 2000, with only a slight increase in 2004, as shown in Figure 1.5.
Department of Education's Share of the Budget
14.03%13.77%
13.49%13.24%
13.62%
12.35%
11.31%11.00%
11.50%
12.00%
12.50%
13.00%
13.50%
14.00%
14.50%
2000 2001 2002 2003 2004 2005 2006
Fiscal Year
Shar
e (%
)
Figure 1.5. DepEd Budget Share of the National Budget, 2000-2006 (Source: Department of Education) Former Education Secretary Florencio Abad stresses that the education’s share of the national budget should be raised to 20 percent. Vietnam, for instance, which basically has

32
the same number of students as the Philippines, is increasing education’s share of its budget to 22 percent in 2007. It is fielding about a million teachers for the same number of students as the Philippines’. The Philippines, on the other hand, has only half the number of teachers Vietnam has (del Mundo 2006). Initially, the Department has proposed a budget allocation for 2006 amounting to Php 119 billion. Given the actual amount allocated to DepEd under the GAA for the same year, it means that DepEd would be losing a little over Php 7 billion, representing the supposed increase in the Department’s budget under the 2006 National Expenditure Program (NEP). This amount could have been spent on the following projects:
• Creation of 10,000 new teaching positions (1.0B) • Schools First Initiative Fund (250M) • School Feeding Program • Basic Education Madrasah Program (100M) • Construction, Repair and/or Renovation of Building for 60 Library Hubs and 12
Regional Educational Learning Centers (120M) • Government Assistance for Students and Teachers in Private Education (1.975B) • Training and Development Fund for Teachers (581M) • Preschool Service Contracting Program (250M) • Textbook Procurement (1.8B) • Computerization Program (260M) • School Maintenance and Other Operating Expenses (500M) • Annualization of Salaries and Other Compensation Benefits of Teaching Positions
Created in 2005 (706.736M) • DepEd School Building Program (1.0B)
Let us take the case of the number of teaching staff. DepEd estimates show that 20,517 teachers have to be hired to bring the teacher-to-pupil ratio at 1:45. This amounts to Php 2.15 billion. However, for 2006, only 10,000 new teachers4 and teaching-related positions could (principals, registrars, etc.) be hired given that the 7-billion-peso supplemental budget will be passed. Moreover, there is a need to revise the teacher-hiring guidelines due to the increasing number of non-Science and non-Math majors who are teaching science and math at the high school level, as shown in Table 1.5.
Table 1.5. Proportion of teachers who are non-science and non-math majors
Subject Non-Majors Percentage
General Science 5,073 58% Biology 4,237 56%
Chemistry 4,566 66% Physics 4,687 73%
Math 5,303 20% Source: Department of Education
4 Salary of these teachers every month for 2006 is Php9,937.00 plus 2000 additional compensation. This is still taxable.

33
Teachers have to be constantly trained in their subject areas. Yet, the budget for the annual training (Training and Development Fund) of about 25,000 teachers in English, Science and Math for three weeks in institutions such as the University of the Philippines, Ateneo de Manila University, and De la Salle University has been one of those cut due to the reenacted budget. Indeed, it is imperative to increase the budget for education and to channel it to the right sectors. DepEd says that sending students to quality high school will cost more money but will increase their chances of entering quality universities5 (del Mundo 2006). Yet, as in previous years, as much as 85 percent of the allocated budget (P102.6 billion) immediately goes to salaries of teachers, with only a small portion of the budget channeled to maintenance and other operating expenditures (11%) and capital outlay (4%). This is despite the fact that basic education gets the biggest share of the country’s education funds. Hence, there is not enough money for operational needs in 42,000 barangays to allow “universal access” to education (Del Mundo 2006). 1.6 Basic Health Although infant and child mortality rates have shown decreasing trends for the past 10 years, a cause for concern is the repeated decline in the number of children fully immunized before they turn 2 years old. For instance, the 2002 figure of 62.9 percent is a three-percentage point decline from the 2000 figure of 65 percent. This means that there are 1,111,820 children not fully immunized based on 2002 data, according to the Maternal and Child Health Survey. Also, the number of maternal deaths from year 2000 to 2002 is alarming. Apparently, from the figure of 1,698 mothers who died from childbirth in 2000, the count increased in 2001 and further increased the year after to 1,801, as shown in Figure 1.6. The Philippine data for maternal mortality rate (MMR), which is a measure of the risk of death once a woman has become pregnant, is difficult to assess due to large sampling errors of the estimates, the latest of which is MMR data for 1998.
5 A regular public high school, where P4,600 is spent for each student, has a passing rate for the University of the Philippines College Admissions Test (UPCAT) of only 20 percent. In a science-oriented high school where P17,900 is spent per student, the UPCAT passing mark is 41 percent. Spending for each student in the Philippine Science High School is even higher at P68,800. Its UPCAT passing rate is 90 percent.

34
Maternal Deaths, 1990-2002
1000
1100
1200
1300
1400
1500
1600
1700
1800
1900
1990 1992 1994 1996 1998 2000 2002
Year
Mat
erna
l Dea
ths
Figure 1.6. Maternal deaths, 1990-2002 (Source: NSO)
The National Demographic Health Survey (NDHS) reported that only 7 out of 10 women, who had live births in the past five years before the survey, received a minimum of four antenatal checkups (ANCs) of which more than half (53 percent) were performed in the first trimester. On one hand, there is a decline in the actual total fertility rate (TFR) from 3.7 percent (1996-1998) to 3.5 percent (2001-2003). However, this is still one child more than the desired fertility rate of 2.5 children per woman. The lack of budget support for drugs/diagnostic and insecticide purchase has been reported as one of the hindrances in preventing malaria, TB, and other diseases. In 2002, the regions with the most number of TB cases were NCR, Central Luzon, Western Visayas, Bicol, Southern Tagalog, and Central Visayas. The report prepared by Department of Health (DOH) on the costing for the health-related MDGs show a 7.5-billion-peso budgetary gap in meeting the goals, as shown in Table 1.6.

35
Table 1.6: Costing and Budget Gaps in MDG Health Programs and ProjectsMDGs Programs and Projects Total Cost (P) DOH Funding (P) ODA Assistance (P) Budget Gap (P)Reduction of child mortality 1,469,938,544 370,544,000 3,500,000 1,095,894,544Improve maternal health 4,825,928,227 107,880,277 11,230,000 4,706,817,950Combat diseases 2,692,233,557 208,976,667 768,978,810 1,714,278,080
HIV/AIDS 358,253,587 22,899,667 153,377,920 181,976,000MALARIA 1,727,102,970 19,200,000 354,400,890 1,353,502,080TUBERCULOSIS 606,877,000 166,877,000 261,200,000 178,800,000
Grand Total 8,988,100,328 687,400,944 783,708,810 7,516,990,574Source: Department of Health
Despite increases in the DOH and local government unit (LGU) budgets, these have been insufficient to offset inflationary pressure during the period. In addition, 60 percent of the DOH budget is used for subsidies to 50 retained hospitals. Currently, about 48 percent of total public spending comes from out-of-the pocket. The contribution of social insurance is a mere five percent (UNDP 2005b). 1.7 Environmental Sustainability Pollution is a serious problem especially in the urban areas. Total suspended particulates (TSP) in air in 2003 show that air quality is not within standards, with the exception of cities of Cavite and Davao. Garbage disposal has also been a major concern. In October 2001, President Arroyo declared Metro Manila under the State of Emergency due to garbage problem. Only 65 to 75 percent of the total waste generated in Metro Manila is collected and only 13 percent is recycled. At present, there is no integrated treatment facility for hazardous waste in the country. These are approximately 50,000 tons of hazardous wastes stored on or offsite due to lack of proper treatment and landfill facilities. Moreover, of the 462 water bodies classified by the DENR as of 2003, only 35 percent meet the water classification of “Class C” or quality water, which can support life systems. About 48 percent of water pollutants are domestic waste, 37 percent are agricultural waste, and the remaining 15 percent are industrial wastes. According to the Department of Environment and Natural Resources, forests covered one third of the Philippines in the 1950s. Most of that was old-growth dipterocarp forest. The forest area has quickly decreased in recent twenty years at a rate of 2.5 percent per year. Today, less than half of that forest remains. The overwhelming majority of what’s left is severely degraded or young second-growth forest (JICA 2002). Moreover, it has been estimated that only 5 percent of coral reefs are in excellent condition while mangroves have declined by as much as 57 percent in the last 23 years. Seagrass losses have also been estimated at 30 to 50 percent over the last 50 years. 1.8 Access to Safe Water Supply and Sanitation The recent progress report on the MDGs in the Philippines shows that household access to safe water supply rose slightly from 78.69 percent in 2000 to 80 percent in 2002. On the other hand, households with sanitary toilet facilities increased from 81.97 percent in 2000 to 86 percent in 2002. ARMM, though, is the most disadvantaged region in the latest data

36
with only one-third of families using water coming from community water systems or tubed/piped wells, compared with 96 percent of families in Central Luzon having access to these types of sources. The said region also has the least proportion of families with sanitary toilets. Edillon’s (2005) study shows that the disparity in access to convenient water supply systems has contributed significantly to the incidence of armed conflicts in the country. It is further noted in the study that it is not just the provision of safe water that matters but the convenience of access as well. Lanao del Sur tops among the provinces with the widest disparity in water supply. In addition, most of the 119 proclaimed watersheds covering 1.36 million hectares are degraded. Increasing groundwater use and declining aquifer recharge rates have led to saline intrusion (in Metro Manila and Metro Cebu) and pollution of groundwater from domestic sewage, factory wastes and agricultural chemicals (JICA 2002). Table 1.7 may be helpful in showing how the Philippines is doing with regard to the MDGs that it has committed to meet by 2015. It must not be forgotten though that this summary has overlooked many of the concerns in each goal. Though the table reports that the probability of attainment of certain goals is high, there are still people out there who have nothing to eat, no access to clean water, no homes, are suffering from malaria, not enrolled in school – people who are marginalized. Efforts must be exerted to fulfill their needs. Table 1.8 translates the previous table to the number of Filipinos currently affected by the inadequate progress in certain MDGs.

37
Table 1.7. The Philippine MDG rate of progress (Source: 2nd Philippine Progress Report on the MDGs)

38
MDG
Baseline (1990 or
year closes t to 1990)
2003 level
No. of People
Affected in 2003
Status
Eradicate extreme poverty and hungerProportion of population below subsistence (food) threshold
24.3 a/ 13.5 e/ 10,976,335
Proportion of population below poverty threshold 45.3 a/ 30.0 e/ 24,391,857
Prevalence of malnutrition among 0-5 year-old children (% underweight) - based on international reference standards
34.5 27.6 3,410,215annual reduction rate of 0.53% is below the target of 0.69%
Proportion of households with per capita intake below 100 percent dietary energy requirement
69.4 b/ 56.9 9,252,644 annual reduction rate of 1.25% is lower than the target of 1.85%
Achieve universal primary education
Elementary participation rate 85.1 c/ 88.77 d/1,368,731 kids not enrolled
participation rate has been falling since 2002
Elementary cohort survival rate 68.4 c/ 64.15 d/
36 out of 100
elementary students will
eventually drop out
fell from previous year of 69.97%
Improve maternal and child health
Maternal mortality rate 209 f/ 172 f/ 2,809
difficult to conclude due to large sampling errors; absence of new official data makes assessment of maternal health difficult
Percent of children fully immunized children 65.2 h/ 62.9 g/1,111,820
not immunized
declining trend since 2000
Increase access to reproductive health services
Prevalence of men and women/couples practicing responsible parenthood 40 b/ 48.9 --
Medium rate of attainment according to MDG progress report
Source: UNDP, Second Philippine Progress Report on the MDGs , 2004.Population projection based on 2.05% growth rate (medium assumption) of year 2000 census estimates; household size of five.a/ 1991: Uses the old methodology considering special rice in the menu and using regional prices; family size is sixb / 1993c/ 1995d/ 2003; source: DepEd; partic ipation rate population covers 6-11 years old e/ 2003 (latest NSCB data); Uses ordinary rice and provincial prices; family size is fivef/ per 100,000 live b irths; current datum is 1998.g/ children 12 to 23 months of age; Source: Maternal and Child Health Surveyh/ 2000 data; Source: Maternal and Child Health Survey
low poverty threshold compared to international estimates; still alarming despite high probability of attainment
Table 1.8 Statistics of Key MDG Targets That Need Improvement

39
Chapter Two: The MDG Financing Gap
Manasan (2006) estimates large gaps in financing the attainment of the MDG targets in 2006-2015. Although the enactment of new tax measures (notably lifting of many exemptions in the VAT and an increase in the VAT rate from 10% to 12%) eases the fiscal situation starting in 2006, the additional fiscal space for MDG financing is still not enough to fully cover MDG resource requirements (including the backlogs built up in earlier years). It is recalled that the resource needs in the education, health and watsan sectors in support of the MDGs have been severely under-funded in 1998-2003 because of the tight expenditure controls that were put in place then as a response to the persistent deterioration of the country’s revenue effort during the said period in 1998-2004. Manasan (2006) updates estimates made earlier in 2002 of the resource requirements and resource gaps that are pertinent to the attainment of the MDGs on primary education, child mortality, maternal health, HIV/ AIDS, malaria and other diseases, and environmental sustainability. The estimates of the resource requirement for the achievement of universal primary education (Table 2.1 and Table 2.2) assumes that the Grade 1 intake rate will increase from 74% in SY 2003-2004 to 100% in SY 2010-2011 and the grades I-VI cohort survival rate from 68% to 100% in SY 2015-2016.
Source: Manasan (2006)
Table 2.1. Resource Requirement for Basic Education in 2006 prices, 2007-2015 (in million pesos) (High Cost Assumption)
Other cost
Year Teachers Textbooks Classrooms (excl books, Total Total rooms, % of GDP teachers)
With MTPDP
2007 112,253 1,672 16,982 37,088 167,995 2.59 2008 119,515 1,327 19,730 37,878 178,450 2.57 2009 126,374 1,463 26,713 38,875 193,425 2.61 2010 135,412 1,615 29,042 41,167 207,235 2.61 2011 143,743 2,332 28,567 42,017 216,659 2.55 2012 151,238 2,420 26,077 45,200 224,936 2.47 2013 158,391 1,772 21,154 46,746 228,063 2.34
2014 164,848 1,757 17,313 49,830 233,748 2.24 2015 170,647 1,726 14,523 51,414 238,310 2.14
2007-2015 1,282,422 16,083 200,101 390,215 1,888,821 2.43

40
For this to happen, it is further assumed that resources will be made available so that in addition to gradually addressing lack of teachers and classrooms in schools with severe shortages in 207-2013, enough school inputs will be provided so that the requirements of new entrants are fully met. Furthermore, the MDG cost estimate for education also includes the cost of additional programs that will improve the quality of basic education.
Source: Manasan (2006)
On the other hand, the estimates of the resource requirement for the reduction of child mortality, the improvement of maternal health, the reversal of the spread/ incidence of HIV/ AIDS, malaria and other diseases (Table 2.3 and Table 2.4) assumes that:
Table 2.2. Resources Available and Resource Gap in Basic Education in 2006 prices, 2007-2015, (in million pesos)
(High cost - MTPDP GDP growth rate assumption)
Year Available Available Available Resource Gap Resources Resources Resources Requirement from NG from LGU from NG and LGU w/ MTPDP GDP gr w/ MTPDP GDP gr w/ MTPDP GDP gr w/ MTPDP GDP gr w/ MTPDP GDP gr Levels In Million Pesos
2007 127,805 9,598 137,403 167,995 30,592 2008 135,068 10,251 145,318 178,450 33,131 2009 143,940 10,968 154,909 193,425 38,517 2010 151,125 11,736 162,862 207,235 44,373 2011 162,289 12,558 174,846 216,659 41,812 2012 173,347 13,437 186,783 224,936 38,153 2013 185,284 14,377 199,661 228,063 28,402 2014 198,163 15,384 213,547 233,748 20,201 2015 211,878 16,461 228,338 238,310 9,971
2007-2015 1,488,899 114,769 1,603,668 1,888,821 285,153
Percent to GDP
2007 1.97 0.15 2.12 2.59 0.47 2008 1.95 0.15 2.09 2.57 0.48 2009 1.94 0.15 2.09 2.61 0.52 2010 1.90 0.15 2.05 2.61 0.56 2011 1.91 0.15 2.06 2.55 0.49 2012 1.91 0.15 2.05 2.47 0.42 2013 1.90 0.15 2.05 2.34 0.29 2014 1.90 0.15 2.05 2.24 0.19 2015 1.90 0.15 2.05 2.14 0.09
2007-2015 1.92 0.15 2.06 2.43 0.37

41
• the proportion children aged 9-11 months who are fully immunized will rise from 85%
in 2004 to 100% in 2015; • the proportion of children aged 9-11 months who are given Hepatitis B vaccine will
increase from 46% in 2004 to 100% in 2015; • the proportion of children aged 0-5 years of age who are given Vitamin A will increase
from 79% in 2004 to 100% in 2015; • the proportion of pregnant women given tetanus toxoid vaccination will increase from
80% in 2004 to 100% in 2015; • the proportion of pregnant women and lactating mothers given Vitamin A will increase
from 53% in 2004 to 100% in 2015; • the mass treatment of some 200,000 commercial sex workers for STI; • the treatment of infectious diseases and clinical care of HIV/ AIDS cases; • the treatment of malaria cases and control of its spread; and • the treatment of TB cases.
Table 2.3. Resource Requirement for Basic Health in 2006 prices, 2007-2015, (in million pesos) (High cost assumption)
Other Premium
Year EPI for Micro- TB Malaria STI/ Public Policy Regulation Contribution Total Total Women & nutrients HIV Health to % of
Children programs Philhealth GDP with MTPDP
2007 580 220 576 1,688 206 822 279 217 3,514 8,101 0.12 2008 598 225 588 1,691 212 841 279 222 3,536 8,192 0.12 2009 616 231 601 1,694 217 861 279 227 3,557 8,283 0.11 2010 635 236 614 1,697 223 882 279 232 3,577 8,374 0.11 2011 654 242 627 1,698 229 902 279 238 3,596 8,466 0.10 2012 674 247 641 1,699 235 924 279 243 3,614 8,557 0.09 2013 694 253 655 1,699 242 945 279 249 3,631 8,648 0.09 2014 715 259 669 1,698 249 968 279 255 3,647 8,739 0.08 2015 737 265 684 1,696 255 991 279 261 3,661 8,830 0.08
2007-2015 5,902 2,179 5,656 15,258 2,068 8,136 2,515 2,145 32,332 76,190 0.10
Source: Manasan (2006)

42
Table 2.4. Resources Available and Resource Gap in Basic Health
in 2006 prices, 2007-2015, (in million pesos) (High cost - MTPDP GDP growth rate assumption)
Available Resource Gap
Year Resources Requirement w/ MTPDP GDP gr w/ MTPDP GDP gr w/ MTPDP GDP gr Levels In Million Pesos
2007 5,128 8,101 2,973 2008 5,419 8,192 2,773 2009 5,775 8,283 2,508 2010 6,063 8,374 2,311 2011 6,511 8,466 1,955 2012 6,955 8,557 1,602 2013 7,434 8,648 1,214 2014 7,950 8,739 789 2015 8,501 8,830 329
2007-2015 59,735 76,190 16,455
Percent to GNP
2007 0.08 0.12 0.05 2008 0.08 0.12 0.04 2009 0.08 0.11 0.03 2010 0.08 0.11 0.03 2011 0.08 0.10 0.02 2012 0.08 0.09 0.02 2013 0.08 0.09 0.01 2014 0.08 0.08 0.01 2015 0.08 0.08 0.00
2007-2015 0.08 0.10 0.02
Source: Manasan (2006)
Meanwhile, the estimates of the resource needs for reducing the proportion of people without access to safe drinking water and sanitary toilets assume that this proportion will go down from the 20% registered in 2002 to 13% in 2015 (Table 2.5).

43
Table 2.5. Resources Available and Resource Gap in Watsan in 2006 prices, 2007-2015 (in million pesos)
Available Resource Gap Percent to
Year Resources Requirement GDP w/MTPDP GDP gr w/MTPDP GDP gr w/MTPDP GDP gr
2007 677 848 171 0.003 2008 715 850 135 0.002 2009 762 853 91 0.001 2010 800 855 55 0.001 2011 859 857 -3 0.000 2012 918 858 -60 -0.001 2013 981 859 -122 -0.001 2014 1,049 859 -190 -0.002 2015 1,122 859 -263 -0.002
2007-2010 2,954 3,406 452 0.002
2007-2015 7,883 7,696 -186 0.000
Source: Manasan (2006)
This paper also provides estimates of the resource requirements and resource gaps with respect to the achievement of the MDG on poverty reduction of extreme poverty and hunger (Table 2.6). To do this, this study makes use of the results of Edillon (2006)6 and estimates the cost of investment in roads (so that the paved road density in all provinces will gradually increase to at least thrice the 2001 national average by 2015), electrification (so that all households will have access to electricity by 2010) and the completion of the land redistribution under the Comprehensive Agrarian Reform Program (CARP).
6 It is already well established in the literature that economic growth is a necessary condition for the reduction in poverty. Edillon (2006) explicitly models poverty reduction and economic growth in the Philippines. Her results show that asset distribution (i.e., land reform) and investments in infrastructure (roads and electrification, in particular) are significant determinants of poverty reduction. More importantly, her study shows that the distribution of the same investments so as to favor lagging regions contributes significantly to make growth more pro-poor.

44
Table 2.6. MDG 1 (poverty reduction) Requirements and Gaps in 2006 prices, 2007-2015 (in million pesos)
(MTPDP GDP growth rate assumption)
Year Investment needs Available resource Gap Percent
Roads Electri-
fication Total NG LGU Total to GDP
2005 97,707 97,707 31,926 14,320 46,246 51,461 0.89 2006 104,449 104,449 39,404 15,600 55,004 49,445 0.81 2007 112,245 244 10,309 122,797 47,052 16,614 63,666 59,131 0.91 2008 112,775 261 10,309 123,344 49,726 17,744 67,469 55,874 0.81 2009 113,358 261 10,309 123,927 52,992 18,986 71,978 51,949 0.70 2010 113,981 261 10,309 124,550 55,637 20,315 75,952 48,598 0.61 2011 104,449 5,926 110,375 59,747 21,737 81,484 28,891 0.34 2012 104,449 5,926 110,375 63,818 23,258 87,077 23,299 0.26 2013 104,449 5,926 110,375 68,213 24,887 93,099 17,276 0.18 2014 104,449 5,926 110,375 72,954 26,629 99,583 10,792 0.10 2015 104,449 5,926 110,375 78,003 28,493 106,496 3,879 0.03
2007-2015 974,604 1,025 70,864 1,046,493 548,143 198,661 746,804 299,689 0.39
Source: Manasan (2006)
The estimates of the resources that are likely to be made available in the relevant sectors takes into account (i) GDP growth and its likely impact on revenue, and (ii) the priority sectors that have already been identified by the government as indicated in the proposed 2007 President’s Budget.7 The resources that are likely to be forthcoming from local government units are also estimated. The paper also presents alternative scenarios that take into account lower GDP growth as well as lower cost of achieving the MDGs.8 The overall gaps in financing the MDGs under the MTPDP GDP growth scenario are presented in Table 2.7. The projected shortfall in the financial support for the attainment of the MDGs for education, health and watsan in 2006 prices amounts to PhP 21.9 billion (or 0.3% of GDP) in 2007 and is equal to cumulative total of PhP 139.5 billion (or 0.5% of GDP) in 2007-2010. If the investments needed to reduce poverty is added, the total resource gap reaches PhP 95.0 billion (or 1.5% of GDP) in 2007 and a cumulative total of PhP 382.3 billion (or 1.3% of GDP) in 2007-2010.
7 These sectors include basic education, infrastructure and compensation adjustment for government employees. 8 The low cost scenario assumes more efficient service delivery policies and arrangements are put in place. In education, this calls for the pursuit of a more aggressive program of teacher redeployment and lower cost arrangements in the construction of classroom. In health, this calls for lower wastage allowances in the delivery of vaccines and better targeting in micronutrient supplementation, malaria prophylaxis and distribution of contraceptive supplies.

45
Table 2.7. Summary of Resource Gaps in 2006 prices,
2007-2015 (in million pesos) (High cost assumption)
Year Resource gaps - MTPDP GDP growth rate
Educ Health Watsan Poverty Total Percent red'n to GDP
2007 30,592 5,126 171 59,131 95,020 1.46 2008 33,131 5,015 135 55,874 94,156 1.36 2009 38,517 4,840 91 51,949 95,397 1.29 2010 44,373 4,735 55 48,598 97,761 1.23 2011 41,812 4,443 (3) 28,891 75,144 0.88 2012 38,153 4,184 (60) 23,299 65,576 0.72 2013 28,402 3,891 (122) 17,276 49,446 0.51 2014 20,201 3,561 (190) 10,792 34,364 0.33 2015 9,971 3,197 (263) 3,879 16,784 0.15
2007-2010 146,613 19,716 452 215,553 382,334 1.33
2007-2015 285,153 38,992 (186) 299,689 623,647 0.80
Year Resource gaps - low GDP growth rate
Educ Health Watsan Poverty Total Percent red'n to GDP
2007 33,666 5,535 183 59,318 98,702 1.54 2008 38,011 5,514 156 56,856 100,537 1.48 2009 45,693 5,453 123 53,944 105,213 1.47 2010 54,000 5,463 99 51,707 111,270 1.48 2011 54,336 5,314 55 33,277 92,983 1.17 2012 53,902 5,211 14 29,118 88,244 1.05 2013 47,755 5,091 (31) 24,699 77,514 0.88 2014 43,574 4,953 (80) 20,006 68,453 0.73 2015 37,643 4,795 (132) 15,023 57,330 0.58
2007-2012 279,608 32,491 630 284,221 596,950 1.35
2007-2015 408,579 47,330 388 343,949 800,246 1.11
Source: Manasan (2006)

46
Chapter Three: Policies to Bridge the MDG Financing Gap
This paper is not proposing that debt conversion strategies are the primary means of bridging the MDG financing gap and to generate financial resources for the country’s development. It is just one among a package of policies. To bridge the MDG financing gaps, some policies will have to be geared to improving income and employment generation as well as savings mobilization and earning foreign exchange capacities of the Filipinos and the Philippine economy. This will reduce also the need for public financing of MDG needs since these needs will be significantly met through self-financing by the beneficiaries of higher income, savings and employment. Policies for equitable distribution of income and wealth will also improve the MDGs substantially and reduce the MDG financing needs. These policies are in detail: 3.1 Mobilizing Domestic Resource Definitely the main policy for bridging the MDG financing gap should be increasing the incomes of the population and mobilizing domestic resources to meet the Filipinos’ self-financing needs. This main strategy will make the Philippines and its government less dependent on borrowings for their financing needs, and will eventually lead to significant reduction in the debt burden of the country. It must be pointed out that mobilizing domestic resources for development needs is part and parcel of a successful development strategy. It means increasing domestic savings in order to finance the human development and physical investments required for the country’s social and economic development. Table 3.1 shows us the gross domestic savings and gross investment picture of the Philippines, as percentages of GDP. It also shows the savings-investment gap broken down crudely into the national government deficit and private savings-investment gap. The important points to consider from the table are: a) The savings and investment rates (below 20% in recent years) are low compared to
East Asian standards (China, Taiwan, South Korea, Malaysia and Thailand), which would exceed 30%. (Even Indonesia, which fell hard in the Asian crisis, had more than 20% investment rate and around 25% savings rate in recent years).
b) The Philippines had a chronic problem of high savings-investment deficits before the Asian crisis. This was corrected somewhat after the crisis, but with lower investment rates and lower growth rates. Recently there is a return to savings-investment deficits to significant levels (but still lower than before the Asian crisis) in 2003 to 20059.
9 The gross national savings is of course much higher than gross domestic savings because of the remittances of Filipino workers abroad. The gap between gross national savings and gross national investments (a measure of the current account deficit) is positive. But this does not in any way reduce the urgency to increase both savings and investments to strengthen the economy.

47
c) The savings rate seems to have fallen very low in the years 2003 to 2005. This may be partly due to the high statistical discrepancies during this period, but also reflects low savings out of GDP in recent years due to low public sector savings and low private savings.
d) The investment rate had fallen significantly since the Asian crisis (1998) and had been falling from 2001 to 2005. This is partly due to the fiscal crisis pulling down public investment, but is also due to the lack of investor confidence in the Philippine economy.
e) The Philippines went into a fiscal crisis after the Asian crisis. Although the fiscal deficit had been reduced from its 2002 peak, the lower budget deficit in recent years had been due to expenditure constriction, as a later section will clearly show.
f) The Philippines large trade deficits in the mid-1990s are reflected by the large investment-savings gaps in 1994 to 1998. Though, this has been reduced, the deficits had reappeared in a smaller but still significant scale in 2001 to 2005.
g) The high private savings-investment deficit in the pre-crisis years 1994 to 1997 is starting to show up again in the latest period of 2003 to 2005.
The need to increase the savings and investment rates – especially investments in genuine development and human development activities – is a vital challenge that should be addressed. As mentioned earlier, this is part of the development strategy itself as high quality economic growth in the country will naturally yield higher savings and more quality investments. The correct development strategy to achieve this is controversial and
Table 3.1: Gross Domestic Savings and Gross Investments and the Savings-Investment Gap As % of GDP*
Gross Domestic Savings
Gross Investments
Gross Domestic Savings Less Gross Investments
Consolidated Public Sector Deficit
Crude Estimate of Private Savings Less Private Investments
GDP Growth Rate
1994 17.3 23.4 -6.1 -0.5 -5.6 4.39 1995 14.6 22.4 -7.8 -0.3 -7.5 5.68 1996 15.1 23.9 -8.7 0.3 -9.0 5.85 1997 14.4 24.7 -10.3 -0.9 -9.4 5.19 1998 13.5 20.1 -6.5 -3.3 -3.2 -0.58 1999 18.1 17.9 0.2 -3.4 3.6 3.4 2000 21.8 20 1.8 -4.5 6.3 5.97 2001 16 19.2 -3.2 -4.7 1.5 1.76 2002 17.5 18 -0.5 -5.5 5.0 4.45 2003 11.1 18.5 -6.5 -5.1 -1.4 4.93 2004 14.1 18.3 -4.2 -4.9 0.7 6.18 2005 11.7 16.9 -5.2 -1.8 -3.4 4.97 * The GDP figures used here do not include the statistical discrepancies so that the various demand components add up to 100% Source: National Statistics Coordination Board

48
will not be tackled in this paper. But mobilizing domestic resources definitely has two components – increasing private savings and increasing government or public savings. Improving savings of the country can be achieved primarily by: i) quality and equitable economic growth. As incomes across all income classes increase
with economic growth, nominal and real savings, as well as the savings ratio, will naturally increase.
ii) There is also a need to reduce the high dependency burden of Filipino families. This requires more emphasis on family planning and population programs as well as programs for employment generation.
iii) Increasing government savings is one that will be discussed at length below when we discuss the fiscal bind and constraints of the Philippines and the current fiscal reforms. Suffice it to say here that increasing and making tax revenues and government spending more progressive is the key policy here. It must also be pointed out that reducing the public debt burden also helps in improving government savings.
iv) Secondary policies that may improve private savings are financial and monetary policies that strengthen the financial sector, reduce intermediation costs, develop long-term capital markets, and facilitate the mobilization of financial savings to fund private and public investments. Some of these policies are detailed in the Medium Term Philippine Development Plan (MTPDP) of the government.
Finally, it is most important to point out that relying more on domestic financial resources will reduce the reliance and dependence on external debt. Increasing the public capacity to mobilize domestically generated revenues will reduce both domestic and external debts owed by the public sector. 3.2 Improving Employment Opportunities Providing adequate quality employment is crucial to attaining the MDG targets and sustaining gains made in the areas of poverty reduction, improving health and education outcomes, and environmental sustainability. While it does not in itself raise financial resources for MDG financing, greater focus on job creation will accelerate progress towards the MDGs and will reduce public financing for the MDGs as income generation provides most of the self-financing needs of Filipino families. The importance of focusing on employment generation cannot be overemphasized in view of the current distressed state of the labor market. Despite seven years of sustained GDP growth, the crisis in the labor market that came in the wake of the 1998 recession refuses to go away. As Figure 3.1 shows, unemployment remains at historically high levels notwithstanding GDP growth in recent years. Unlike in previous periods when unemployment eased with GDP growth, albeit modestly, as the economy recovered, the current growth cycle has been accompanied by persistently high unemployment.

49
Source of basic data: National Statistics Office (NSO) and National Statistical Coordination Board (NSCB) A new dimension to the sustained crisis in the labor market is surging underemployment. Since April 2005 underemployment has been rising rapidly as the bulk of new job creation has come from agriculture and informal services. Total underemployment went up from 9% in 2004 to 12% in 2005 and 14% in the first half of 2006. Invisible underemployment, that is, the proportion of full-time workers wanting additional work hours, appears to have stabilized at 9.6% in April 2006 compared with 9.8% in April 2005. But visible underemployment, the proportion of part-time workers wanting additional work hours, remains on the uptrend, hitting a 20-year high in the first half of this year. (Fig 3.2)
Fig 3.1: Unemployment Rate and GDP Growth Rate
-2.0
0.0
2.0
4.0
6.0
8.0
10.0
12.0
14.0
1988 1989 1990 1991 1992 1993 1994 1995 1996 1997 1998 1999 2000 2001 2002 2003 2004 2005
Percent Unemployment RateGDP Growth Rate

50
Fig. 3.2 Total, visible and invisible underemployment, 1998-2006
-
5.0
10.0
15.0
20.0
25.0
1988
1989
1990
1991
1992
1993
1994
1995
1996
1997
1998
1999
2000
2001
2002
2003
2004
2005
2006
Total
Visible
Invisible
Source of basic data: National Statistics Office (NSO) Rising underemployment is important because it may indicate growing poverty incidence that is not yet reflected in currently available income statistics. Underemployed workers carry a high risk of becoming poor with incomes insufficient to carry themselves and their families above the poverty threshold. Poor families are likely to be found among the underemployed more than among the unemployed simply because they cannot afford to be unemployed. This fact shows up in the regional data: Regions with high underemployment rates (rather than unemployment rates) tend to have high poverty incidence while regions with low underemployment report low poverty rates. (Fig 3.3) Lack of employment opportunities and jobless growth lead directly to increases in poverty and retardation of human development. Promoting full employment (and reducing underemployment) requires not only high economic growth. It also requires policies and programs that go beyond micro-financing and towards promotion of an integrated employment and industrial plan for the country and promotion of sectors that will be contributing to both growth and employment generation.

51
Fig. 3.3 Underemployment and poverty incidence by region, 2003
0
10
20
30
40
50
60
10.0 15.0 20.0 25.0 30.0 35.0 40.0 45.0
Underemployment rate
Pove
rty in
cide
nce
(fam
ilies
)
Source of basic data: National Statistics Office (NSO) and National Statistical Coordination Board (NSCB) 3.3 Increasing the Foreign Exchange Earning Capacity Related to increasing domestic savings is significantly improving the foreign exchange earnings capacity of the country. Private and public debts accrue to foreigners once we have trade deficits, large foreign debt servicing and net capital outflows. This drains the economy of financial resources to finance the social and development needs of the country. Table 3.2 gives us exports and imports of the country as percentages of GDP. It is clear that there were significant increases in these trade variables starting the second half of the 1990s and exports and imports are, in 2005, near 50% of GDP. However, the increase of trade variables paled in comparison with the Philippines’ more successful neighbors. Exports for the Philippines amounted in 2005 to around $40 billion, while Thailand and Malaysia had exports way above $100 billion for the same year (and Thailand and Malaysia both have a smaller population compared to the Philippines). In fact, the Philippines is not competitive in its products and its exports are concentrated on one product – semiconductor and electronic products (comprising more than 60% of total merchandise exports). Its domestic products face stiff competition from cheap imports ranging from food and garments to cement and industrial spare parts. This can be seen in Table 3.2 with high trade deficits, even after the Asian crisis, although the deficits are reduced from the pre-crisis period. This situation persists despite (or because of, depending

52
on the point of view) substantial trade liberalization, tariff cuts and weakening of the currency since the second half of the 1990s. There is therefore a lot of work to do with respect to improving quality of our exports and diversifying them, and to compete with cheap imports. This is tantamount to improving efficiency and technology in the production of goods and services in the country. There is also an important task of not allowing the peso to appreciate too much in the current trend of currency appreciation.
Table 3.2: Exports (X) and Imports (M) and Current Account Balance, as % of GDP
X* M* X-M* Current Account Balance*
Net Foreign Direct Investment*
1994 21.0 33.3 -12.2 -4.6 2.0 1995 23.5 35.6 -12.1 -4.4 1.5 1996 24.8 38.5 -13.7 -4.8 1.6 1997 30.6 44.2 -13.5 -5.3 1.3 1998 45.3 45.3 0.0 2.4 2.4 1999 45.0 52.8 -7.8 -3.8 1.5 2000 49.2 57.1 -7.9 -2.9 2.8 2001 44.0 52.8 -8.8 -2.5 0.5 2002 44.8 52.0 -7.2 -0.5 1.9 2003 44.6 52.0 -7.4 0.4 0.2 2004 45.0 51.6 -6.6 1.9 0.1 2005 41.2 48.9 -7.7 2.4 1.0 *The figures here are based on the balance of payment accounts. The figures for 1999 to 2005 are based on a new methodology that includes changes in conceptual coverage and classification of accounts so that caution must be exercised to compare these with the figures in the years previous to 1999. Source: National Statistics Coordination Board, Bangko Sentral ng Pilipinas, IMF, International Financial Statistics
One saving grace for the Philippines is the remittances of overseas workers, which had cushioned the effects of large trade deficits throughout the 1990s and early 2000s, and had made current account balances increasingly positive starting 2003. Part of improving our foreign exchange capacity is the attraction of quality foreign investments. Net capital inflows from abroad provide additional financing resources for social and development needs, apart from imparting technological know-how, foreign market access and employment – especially from foreign direct investments. The table above shows that net foreign direct investment (as percentage of GDP) had as a whole gone down after 2000. This was most likely due to the instabilities in the political and economic fronts. This was very evident in 2001 when then President Estrada was impeached and removed by a shift in military allegiance to Vice-President Arroyo. This again occurred in 2003 and 2004, when the Philippine fiscal crisis became quite serious

53
and well-publicized. The slight recovery in net foreign investments in 2005 may be partly due to the alleviation of the fiscal deficits (to be discussed in Chapter Five), but the political and economic instabilities continue as current President Arroyo is accused of rigging the 2004 Presidential election, and tax revenue is just starting to increase and has yet to demonstrate sustainability. Hopefully these instabilities will be overcome. 3.4 Equitable Sharing of Income and Wealth Achieving the MDGs will require less financial resources if the economic, social and political system provide equitable sharing of income and wealth across social classes and geographic regions throughout the country. This of course requires progressive taxation and fiscal expenditures biased to the poor and vulnerable groups and depressed areas. This also requires social reforms in land, housing and access to resources and social services. One indication that more work has to be done in this area is the fact that recent economic growth in 2000 to 2005 had not been matched by lower unemployment rates. This is a strong indication that growth in recent years has yet to filter down to the lower classes and poorer sections of society. Table 3.3 shows that the richest 20% of the population got 53.4% of the country’s GDP, while the poorest 20% of the population obtained only 4.7%. This lopsided distribution only contributes to continuing poverty and inability to achieve the MDGs. Table 3.3: Share of GDP for 20% Richest Vs. 20% Poorest
54
The above four policies are important policies that will strengthen the economy and help the Filipinos self-finance their MDG needs. Other policies will have to directly mobilize funds to be used for MDG financing inasmuch as direct interventions in poverty reduction, and direct financial support to achieve the MDGs are required. This includes policies to reduce wastage in the use of public funds so that it can be channeled to vital MDG needs. These policies are: 3.5 Fiscal reforms: Increasing the Fiscal Capacity to Mobilize Resources Chapter Five will discuss the fiscal and debt problem of the country. No doubt fiscal reforms had been implemented in the country precisely because of this problem. The fiscal reforms instituted by the government in 2006 consist of new revenue measures and reforms in tax administration. The most important revenue measure is RA 9337 or the Expanded Value Added Taxation (E-VAT) law which was passed in November 2005. This expanded the coverage of value added taxation to include petroleum products, electricity and services which were previously exempted from VAT coverage under the old VAT law. In February 2006 the E-VAT rate was increased from 10% to 12%. The estimated additional revenues for 2006 due to the reform of the VAT law is PhP 81.4 B. In the first semester of 2006, PhP 31.5 B was collected from the E-VAT, broken down as follows: petroleum products PhP 14.3 B; petroleum industry PhP 9.58 B; electric power industry PhP 6.4 B; domestic air & sea transport PhP 387.6 M; electric coops PhP 258.5 M; medical services PhP 91.5 M; legal services PhP 66.6 M; passenger vessels PhP 25.7 M; non-food agri products PhP 19.5 M; natural gas PhP 16.5 M; professionals PhP 6 M. The revenue from VAT was able to offset the more than PhP 15 B shortfall in the targeted individual and corporate income tax for the first semester of 2006 and brought down the Bureau of Internal Revenue (BIR) shortfall to only PhP 2.8 B. (The Bureau of Custom (BOC) exceeded their revenue targets in the first semester of 2006.) In August 2006, the BIR overshot its target revenue collection due to the E-VAT collection. Thus, hopefully, the fiscal picture will sustain its improved performance in 2006 and beyond. The other important tax measure implemented was the increase in the excise (‘sin’) taxes of alcoholic beverages and cigarettes. Adjustment of the excise tax rates on “sin products” brought in PhP 4.34 billion in April, slightly higher than the target PhP 4.03-billion. Corporate income tax in November 2005 was also increased from 32% to 35%, but this has yet to exhibit some impact on tax collection. Another important fiscal reform was the passing of RA 9335 or the Lateral Attrition Act which established a system of incentives and reward for employees of the Bureau of Internal Revenue (BIR) and the Bureau of Customs (BOC). Employees who exceed their collection target will receive an equivalent monetary incentive of 15% of the 1st 30% in excess of target and 20% of the remaining surplus. Meanwhile, those who fail to reach their target by more than 7.5% will be reassigned and may even be dismissed from service.

55
Evaluation of this year’s performance and awarding of incentives will be in February 2007. The BIR and BOC have been given until August 31 to submit to the revenue performance board the specific positions that will covered by the evaluation. The revenue performance board is composed of the secretaries of the Department of Finance, National Economic and Development Authority, Department of Budget and Management as voting members, and the BIR & BOC commissioners, a 3rd level official and rank and file representative from both BIR & BOC as non-voting members. There are other fiscal reform bills on the planning board, including the rationalization of incentives given to foreign investors and the limiting of incentives, specifically tax holidays, being given by the Board of Investments. Another government-sponsored tax measure that it hopes Congress will enact is the simplified net income tax system (SNITS) which aims to put ceilings on the deduction of business expenses by self-employed taxpayers. There had also been measures to improve tax administration. Computerized tax audits and reshuffling of custom inspectors had been undertaken to improve the tax collection performance of BIR and BOC. Big fishes that are caught with tax evasion are highly publicized in media, legal suits are presented, and strict penalties imposed. There are also current measures to fight smuggling in the Bureau of Customs. It is recommended that more progressive taxation be pursued with more emphasis on tax collection from big corporations and high-income individuals, and to give bias to social and economic spending that will benefit the poor and vulnerable. The government is committed to use the increased revenue collection from the E-VAT for vital social, economic and infrastructure spending. The MDG financing schemes will also contribute towards this end. 3.6 Efficient and Correct Use of External Development Assistance Inasmuch as the Philippines needs several years to possibly achieve substantial domestic resource mobilization, it will have to rely, in the short and medium term, partly on external development assistance from bilateral and multilateral institutions. We will show the level of bilateral and multilateral debts in a later section. This has been falling in 2004 and 2005. On the policy front, the policy challenge here is to effectively and efficiently mobilize and channel external development assistance to the needed projects and programs to achieve the MDGs and economic development of the country. The country basically faces similar challenges as to where to channel debt conversion or debt reduction funds. The issue of correctly channeling external development assistance and debt conversion funds to MDG and development needs will be discussed in this paper, including issues of absorptive capacity, transparency and accountability (Chapter 4).

56
3.7 Private-Public Sector Partnership While the MDGs are public goods and governments are primarily responsible for meeting the MDG targets, public-private sector partnership is crucial to meeting the challenge. In the Philippines, the potential for private sector involvement in MDG attainment is evident in the significant social investments made by the corporate sector. For 1999 alone, corporate giving among 63 companies amounted to P628 million. From 2002 to 2004, combined social investments amounted to over P2.6 billion. This amount includes commitments of members of the Philippine Business for Social Progress (PBSP), the League of Corporate Foundations (LCF) and the Mirant Foundation. It represents only a fraction of the contributions of the entire business community. For 2005 to 2009, business sector spending is estimated by NEDA at P3.2 billion. To ensure that the available resources contribute to the achievement of the MDG targets, business leaders in the Philippines has agreed on a strategy to align the social investments of the business sector with the MDGs. (PBSP (2004)) The framework clusters the MDGs into four areas: poverty, education, health and environment. It identifies three modes of business involvement: own core business activity, social investment, and policy advocacy/dialogue. Clearly, the private sector contribution goes far beyond the amount spent on social investment activities. For example, the integration of the environmental agenda in mainstream business operations such as adopting green technologies and cleaner production would make an invaluable contribution to the MDGs. Apart from the enlightened business sector, the church sectors of the different faiths, civil society organizations, community organizations and people’s organizations have all contributed their share to MDG financing. It is therefore crucial to have a coherent, comprehensive and coordinated program to prioritize and implement MDG projects and activities and to improve the coordination and improvements in its financial and resource mobilization. This is what we turn to in the following chapter. 3.8 Better Governance and Institution Building Of course part of the strategy to instill confidence and stability in the economic system --vital for sustained growth and development -- is to qualitatively improve the governance and management of the political and economic system. This requires strengthening institutions so that economic and social incentives are performance-based, and that proper regulatory frameworks are operating to ensure fair competition, good manufacturing and servicing practices, quality products and services, and fair and reasonable pricing of essential goods and services. Needless to say, political stability, anti-corruption programs and anti-monopoly regulations are implied by all these. Better governance, transparency and accountability will also deliver more efficient use of funds for MDG purposes and will minimize leakages and wasteful use of public funds so that they can be channeled to proper MDG financing.

57
Chapter Four: Identifying MDG Funding and Safeguarding MDG Financing 4.1 A Broad and Integrated Approach Given the urgency of deriving MDG financing, it is but proper that debt reduction and debt conversions be incorporated in a broader and integrated scheme of generating funds for MDG financing. Also, it is imperative that the prioritization and safeguarding of MDG activities and projects in the national and local budgets be carried out. 4.2 Identifying and Prioritizing MDG Activities and Projects for Funding The most basic and urgent initiative consists of identifying and prioritizing activities and projects that are vital to achieving the MDGs. The array of programs/ projects/ investments will be among a list prepared by government agencies and consolidated by the National Economic and Development Authority (NEDA). Vital agencies that will contribute significantly to these prioritized projects and activities are the Department of Health (DOH), Department of Education (DepEd), National Anti-Poverty Commission (NAPC), National Commission on the Role of Filipino Women (NCRFW), Department of Public Works and Highways (DPWH), National Housing Agency (NHA), Department of Environment and Natural Resources (DENR), Department of Agriculture (DA), Department of Labor and Employment (DOLE), Department of Trade and Industry (DTI), Department of Energy (DOE), among others. Most important is the recommendation for programs and projects, based on development and MDG needs, compiled by the Medium-Term Public Investment Program (MTPIP) in conjunction with the Investment Coordinating Committee (ICC) and approved by the NEDA Board. NEDA has graciously assisted this endeavor by making a preliminary list of projects which its staff sees as the priority list of MDG projects and budget items in the current draft MTPIP (as of August 2006). Table 4.1 gives us the list of projects, their titles and the amount allotted to the programs and projects from 2005 to 2010. One can take a look at the list and their budgeted funds and see if some programs may need additional funding.

58
Table 4.1: IDENTIFIED MDG-SUPPORTIVE PROGRAMS AND PROJECTS TO BE
EXPANDED/REPLICATED: Funding for 2005-2010 MDG 1: ERADICATE EXTREME POVERTY AND HUNGER Target 1: Halve the proportion of people living in extreme poverty between 1990 and 2015
Target 2: Halve the proportion of population below the minimum level of dietary energy consumption and halve the proportion of underweight children (under five years old)
PAPs PAP Total
Cost estimate in PhP '000
(based on the MTPIP) I. Survival (Food/Nutrition) 1 Accelerated Hunger Mitigation Project (DSWD/DepEd)* 1,000,000.02 Food for School Program (DSWD/DepEd) 718,000.03 Garantisadong Pambata (GP) Program (DOH)* 4 Food Fortification Program (DOH)* 5 Micronutrient Supplementation (DOH)* 416,607.06 Aksyon para sa Nutrisyon/LAKASS Program Expansion II 7 Nutrition and Micronutrient Deficiencies Control (CPC 6) 8 Action for Nutrition Improvement (FAO Grant)
9 SOCKSARGEN Integrated Food Security Program/SOCKSARGEN Area Development Project Office 244,017.0
10 Enhancement of Cassava Production in Cagayan 15,000.011 Philippine Pig Production and Development 6,862.012 Romblon Rice Sufficiency Program 33,245.013 Food for Work Program (use of coupons) 60,000.014 Provision of Water Supply to Waterless Communities (DPWH) 3,000,000.015 Rural Water Supply for Waterless Communities (DPWH) 3,000,000.016 Provincial Cities Water Supply III (JBIC 19th Yen) 111,358.017 Provincial Cities Water Supply V (JBIC 21st Yen) 768,544.018 LGU Urban Water and Sanitation Project (APL 2) (WB) 12,920.0
19 Provincial Water Supply, Sewerage and Sanitation Sector Project (PW4SP) (JICA Grant) 15,000.0
20 Rural Water Supply and Sanitation Project Phase V (JBIC) 125,394.0
21 Water Supply and Sanitation Performance Enhancement Project (AusAID) 11,265.0
22 Rural Water Supply Development for Mindanao Provinces (JICA) 97,650.023 Rural Water Supply Project for Visayas and Mindanao (KfW) 2,704,651.0 II. Security (Livelihood/Employment) 24 Seaport Development, San Vicente Fishing Port Development 196,676.025 Self-Employment Assistance Kaunlaran Project 756,000.026 Balingasag Irrigation Project 382,255.027 Banaoang Pump Irrigation Project 2,943,966.028 Bohol Irrigation Project II 2,690,856.029 General Santos Fish Port Expansion/Improvement Project 1,304,000.030 Irrigation Systems Improvement Project 87,076.031 Lanao del Norte Dairy Cattle Breeding Center 64,500.032 Malaig River Irrigation Project 375,000.033 Malitubog-Maridagao Irrigation Project 121,298.0

59
34 Agno River Integrated Irrigation Project*** 6,180,500.035 Rizal (Aliog) Irrigation Project 456,873.036 Southern Philippines Irrigation Sector Project 2,605,911.037 Talakag Irrigation Project 390,000.038 Water Buffaloes & Beef Cattle Improvement Project 10,062.039 Participatory Irrigation Development Project Phase I 2,600,000.040 Transforming Marinduque into a Major Mango Producing Province 38,984.041 Water Resources Development Project 31,480.042 KALAHI-CIDSS: KKB (WB) 5,795,100.0 III. Enabling (Education/Training/Institutional/Capacity Building) 43 Agri-Institutional Development Project 60,000.044 Young Farmers Program 249,970.045 Farm Youth Empowerment for Rural Development 29,475.046 Support to Young Filipino Farmers Project 21,480.0
MDG 2: ACHIEVE UNIVERSAL PRIMARY EDUCATION
Target 3: Achieve universal primary education by 2015
PAPs PAP Total
Cost estimate in PhP '000
(based on the MTPIP) GOP
1 Construction of Elementary and Secondary Schoolbuildings in Areas Experiencing Acute Classroom Shortage 6,000,000.0
2 DTI-NDC Schoolbuilding Program 78,900.03 Regular Schoolbuilding Program 6,000,000.04 Textbook Program 10,246,595.05 Teacher Requirement at the Beginning of the School Year 5,763,073.06 Distance Education for Public Elementary Schools (DEPES) 30,672.07 Brigada Eskwela 13,541,408.08 Expansion of ESC Coverage of the GASTPE Program 16,594,464.09 Madrasah Education 13,450,851.0
ODA 10 Medium-Rise Schoolbuilding Project for NCR (JICA) 1,022,715.0
11 Support to the DepEd for an Improved Quality of Education through Training Programs and Provision/Rehabilitation of Classrooms (AECI) 79,930.0
12 Philippines-Australia Basic Education Assistance for Mindanao (BEAM) 2 (AusAid) 564,129.0

60
MDG 3: PROMOTE GENDER EQUALITY
Target 4: Eliminate gender disparity in primary and secondary education, preferably by 2005, and in all levels of education no later than 2015
PAPs PAP Total
Cost estimate in PhP '000
(based on the MTPIP) GOP 1 Development of Anti-VAWC Materials 500.0
2 Development/Enhancement, printing and dissemination of GAP Planning and Budgeting Guidelines 960.0
3 Strengthening Government Mechanisms in Mainstreaming Gender in Reproductive Health, Population and Anti-VAWC Programs 9,619,269.0
ODA
4
Enhancing the Capacity of Agencies on the Use of the Harmonized Gender and Development (GAD) Guidelines on Project Development, Implementation, Monitoring and Evaluation (WB/ADB) 2,326.0
MDG 4: REDUCE CHILD MORTALITY
Target 5: Reduce child under-five mortality rate by two-thirds by 2015
PAPs PAP Total
Cost estimate in PhP '000
(based on the MTPIP) GOP
1 Expanded Program on Immunization (including vaccine self-sufficiency) (DOH) 2,302,805.0
2 Family Health and Primary Health Care Programs (DOH) 86,834.0
3 Fund Augmentation for the Implementation of Bright Child in Nutritionally Depressed Municipalities (DOH) 6,700.0
4 Vitamin A Sufficiency (DOH)* 110,632.0

61
MDG 5: IMPROVE MATERNAL HEALTH
Target 6: Reduce maternal mortality rate by three-quarters by 2015
Target 7: Increase access to reproductive health services to 60% by 2005, 80% by 2010 and 100% by 2015
PAPs PAP Total
Cost estimate in PhP '000
(based on the MTPIP) GOP 1 Family Planning Initiatives (POPCOM) 338,490.02 Population Policy Initiatives (POPCOM) 21,774.03 Tetanus Toxoid Immunization (DOH) 141,994.0
ODA
4 Family Planning and HIV/AIDS Prevention Social Marketing Project Phase III (KfW Grant) 2,455,655.0
5 Women's Health and Safe Motherhood Project II (WB) 935,554.0
MDG 6: COMBAT HIV/AIDS, MALARIA AND OTHER DISEASES
Target 8: Halt and reverse the spread of HIV/AIDS by 2015 Target 9: Halt and begin to reverse the incidence of malaria and other major diseases by 2015
PAPs PAP Total
Cost estimate in PhP '000
(based on the MTPIP) GOP (All DOH) 1 Epidemiology and disease surveillance 81,556.02 Health operations including TB control, health promotion, etc for CHDs 625,120.03 Malaria Prevention and Control 21,473.04 Philippine National AIDS Council (PNAC) operations 61,557.05 Quarantine services and international health surveillance 120,482.06 Tuberculosis Control 1,022,157.0
ODA 7 Global Fund for TB, AIDS, Malaria (GFTAM)* US$ 69,000.0

62
GOAL 7: ENSURE ENVIRONMENTAL SUSTAINABILITY
Target 10: Implement national strategies for sustainable development by 2005, to reverse the loss of environmental resources by 2015
PAPs PAP Total
Cost estimate in PhP '000
(based on the MTPIP)
1 300 MLD Treatment Bulk Water Supply Project (Project development and tendering works) 8,400.0
2 300 MLD Treatment Bulk Water Supply Project (Project implementation) (Design & Build - BOT) 5,600,000.0
3 50 mld Wawa River Project - Feasibility Study (2004-2005) 8,270.04 50 mld Wawa River Project - Design and Build 2006-2007 819,000.0
5
Angat Utilization and Water Improvement Project (AWUIP): a) AWUIP (BNAQ-6 Phase I) - Construction and Consultancy for Construction Supervision; b) AWUIP (BNAQ-6 Phase 2) - Feasibility Study (ADB TA Loan) and Detailed Engineering Design (ADB TA Loan) 1,511,040.0
6 Laiban Dam Project Construction or Implementation (BOT) 24,000,000.0
7 Laiban Dam Project Updating and Feasibility Study (ADB TA Loan) Updating of Masteral and Physical Relocation 74,256.0
8 Manila Second Sewerage Project (WB) 433,755.09 Manila Third Sewerage Project (WB) ** 3,580,000.0
10 Angat Utilization and Water Improvement Projects (AWUIP) - Construction Phase (ADB, Co-fund OPEC) 7,300,000.0
11 Development of Water and Sanitation Advocacy Kits (UNDP) 100.0

63
Target 11: Halve the proportion of people with no access to safe drinking water and basic sanitation, or those who cannot afford it by 2015
PAPs PAP Total
Cost estimate in PhP '000
(based on the MTPIP) GOP 1 Provision of Water Supply to Waterless Communities (DPWH) 3,000,000.02 Rural Water Supply for Waterless Communities (DPWH) 3,000,000.0
ODA 3 LGU Urban Water and Sanitation Project (WB) 12,920.04 Provincial Water Supply, Sewerage and Sanitation Project (JICA Grant) 15,000.05 Rural Water Supply and Sanitation Project Phase V (JBIC) 125,394.0
6 Water Supply and Sanitation Performance Enhancement Project (AusAID) 11,265.0
7 Rural Water Supply Development for Mindanao Provinces (JICA) 97,650.08 Rural Water Supply Project for Visayas and Mindanao (KfW) 2,704,651.0
Target 12: Achieve a significant improvement in the lives of at least 100 million slum dwellers by 2020
PAPs PAP Total
Cost estimate in PhP '000
(based on the MTPIP) 1 Community Mortgage Program (NHMFC) 5,202,780.0
2 Development of Poor Urban Communities Sector Project (DPUCSP) (DBP/HUDCC) 1,677,500.0
3 Northrail Resettlement Project (NHA) 3,440,000.04 Southrail Resettlement Project (NHA) 2,725,000.05 Other Resettlement Projects (NHA) 1,439,000.06 Pasig River Rehabilitation (PRRC) 756,000.07 Presidential Proclamation (HUDCC) 184,550.08 Resettlement Assistance to Local Government Units (NHA) 1,450,000.09 Esteros Project (NHA) 2,253,000.0
10 NGC Housing Project (HUDCC) 15,380.011 PGMA Workers Inn (MMDA) 325,000.012 Sidewalk Dwellers (MMDA) 400,000.013 Waterways Dwellers (MMDA) 14,000,000.0 * Not included in the MTPIP list **New PAPs in the MTPIP
Source: Draft MTPIP 2006, NEDA

64
Note that some projects are identified more than once since they are deemed to serve more than one MDG target. 4.3 Promotion and Campaign to Ensure Significant Funding for Vital MDG Funding This portion discusses possible approaches to deriving significant amount of funding to vital MDG activities, projects and programs. 4.3.1 Enhancing Existing Institutions and Mechanisms to Mobilize and Safeguard Funding for MDG Needs Based on discussions and suggestions from the staff of the National Economic and Development Authority (NEDA), the following recommendations are made to use existing institutions and facilities to mobilize and safeguard MDG funding in the national and local government budgets and to strengthen MDG activities and projects. This approach assumes a more decentralized but coordinated system to employ existing institutions and facilities. The next section proposes a possible more centralized system through the creation of the MDG Fund. The recommendations using existing institutions and mechanisms are: 1. A joint initiative by the MDG Committee in the House of Representative and the
Budget Appropriations Committees in the Lower Houses and the Senate can lead to the legislation of a bill prioritizing MDG-related spending in the budget appropriations, and protecting them from budget cuts, expenditure constriction or budget reallocation. Short of legislation, the MDG Committee and the Budget Appropriations Committees can agree on common guidelines that will prioritize and assure MDG funding and spending in the budget appropriations and protect it from budget cuts, expenditure constriction or reallocation of budget resources to other government spending. The MDG Committee and Budget Appropriations Committees in both Houses can also try to coordinate a strategy to channel part of the Countryside Development Fund (CDF) or ‘pork-barrel’ funds to MDG financing. (This is a recommendation of Social Watch and other civil society groups).
2. The line agencies, especially the DepEd, DOH, and local governments should be free
to mobilize for the funding of their priority MDG projects and programs, as they are allowed to now. This is of course subject to national budget guidelines that require projects of more than P500 million to be reported to NEDA.
3. There is a need to strengthen and systematize reporting of MDG spending by the
various line agencies to DBM, and the consolidation of the budget for MDG spending by the DBM. In this regard, it is important: 1) to identify MDG budget funding in the line agencies, 2) use the definitions of the MDG and targets to define and identify MDG spending (see Table 1.4 or 4.1), 3) request DBM to require line agencies to
65
report MDG funding in their agencies and to consolidate the reports for the whole national government. Monitoring MDG spending and their budget items will ensure that there will be a transparent mechanism to track MDG related budget items and their financing, and to identify programs that require additional funding.
4. Another proposal is to replicate the success of establishing gender focal persons in the
various line agencies of the national government in order to mainstream gender sensitivity in the national government activities. It is worth exploring the establishment of MDG focal persons in key agencies (DepEd, DOH, DSWD, Department of Finance, Department of Budget and Management, Department of Agriculture, Department of Agrarian Reform, DPWH, DENR, DTI) to ensure MDG funding of vital activities and projects and to monitor MDG activities and projects. These MDG focal persons will be the key informants in their respective agencies for donors, private sector and other government agencies concerning MDG activities and projects in their respective areas.
5. It would also be beneficial to strengthen and link reports of the Regional Social
Development Committees (RSDCs) of the Regional Development Councils (RDC) on the MDG progress in the different regions of the country to the MDG plans in the MTPIP and to the budget appropriations processes.
6. Similarly, it would be beneficial to strengthen and link reports of the Multisectoral
Committee on International Human Development Commitments (MCIHDC -- a subcommittee of the NEDA Board - Social Development Committee) on the progress of the country’s compliance on the MDGs and other international human development commitments to the MDG plans in the MTPIP and the budget appropriations processes. The Committee monitors compliance to five Conferences (the Millennium Declaration, World Summit on Social Development, Beijing Summit Platform on Women, HABITAT, International Committee on Population Development), all of which are related to the MDG targets.
7. Overall, there is a need to strengthen NEDA as the watchdog and key monitor agency
for the MDGs. Partly through the mobilization of external and domestic financing – and debt conversions to be discussed later -- there should be a mechanism to provide more funds and personnel in this department to monitor and to evaluate the MDG programs implemented by the various line agencies throughout the country. NEDA will also be the key agency that will sound off to the national government if funds for MDG are insufficient and if there is need to mobilize significant funding for the MDG needs.
4.3.2 Exploring the Creation of an MDG Fund There had been suggestions in the past to establish an MDG or social fund to ensure sufficient funding of vital MDG projects and programs. These suggestions had been made from NEDA and from some civil society groups (e.g. Social Watch). There are pros and cons for such a proposal.

66
The pro arguments are obviously in order to facilitate, systematize and institutionalize the channeling of ODA, debt conversion, government and private sector funds to already identified and prioritized MDG projects and programs. This will force the government and civil society to plan and prioritize MDG projects and activities more carefully and comprehensively. The con arguments mostly have to do with the possibility of the political process using the funds for political objectives rather than for national and social objectives. Furthermore, there may be concerns that a centralized system may fail to address the local needs of far-flung depressed regions in the country. The biggest objection concerning the politicizing and misuse of the MDG Fund can be reduced if one clearly identifies the institutions in charge of the Fund. In this respect, it is suggested by this paper that, if an MDG Fund is proposed, the Fund be administered by a committee co-chaired by NEDA and UNDP. The members of the committee should be: the fiscal agencies of the government (DBM, DOF), key human development agencies (e.g. DOH, DepEd), local government representatives, key civil society groups (such as the church sector and the business sector), and key bilateral and multilateral donors. On the objection that a centralized system may be biased against distant far-flung provinces and regions, the MDG Fund should be set up in such a way so as not to displace fund raising for MDGs by line agencies, local governments and by civil society groups. Although coordination and reporting are needed between the MDG Fund and the various line agencies, local governments and civil society groups to avoid duplication of projects and activities, the line agencies and local governments should retain their independence and right to raise funds for their social and human development needs. The MDG Fund can have strategies and derive resources and staff to mobilize the financing of MDG needs through: 1. fiscal resources, 2. external development assistance and ODA, 3. debt reduction and debt conversion funds, and 4. civil society and private sector funding. The MDG Fund can also set up a financial department that can invest portion of the funds financially to increase the potential financial resource base of the MDG Fund. But before this is done, the paper recommends a feasibility study concerning the setting up of the MDG Fund and its required links to priority MDG projects and programs using the institutions and mechanisms mentioned in the previous section. 4.4 Focusing on Some MDG Projects and Their Funding The aforementioned section documents the existing institutions and explores recommendations that had been made before. This section would like to put more substance to the issues above by looking at specific vital MDG projects and the prospects of funding them.

67
4.4.1 Education for Muslim Mindanao The Madrasah, the Arabic name for school (Madaris is the plural form), is an appropriate response to the dismal state of education in Mindanao, particularly in the Autonomous Region of Muslim Mindanao (ARMM). The Madrasah is a community-based and community-managed school where the teaching is focused on the Qur’an, Islam and moral education. As a Muslim school, it teaches Arabic and Islamic studies, especially Qur’anic reading and Arabic language. It is considered an institution of learning in most Muslim communities and also a symbol of Islam. The Madaris are an important component in the educational system among the Muslim people. However, these have not yet been fully institutionalized and have not been adequately given support by the government. The government’s direct responsibility then is to address this institution of education for the country and its citizens. In the 2004 ARMM Roundtable Series, Madaris operators pointed out that there is a high degree of participation among Muslims in the Madrasah project. However, there is apprehension among Muslims because these schools are not accredited in the Philippine education system and so graduates from Madaris schools are not accepted in private schools, colleges or universities. Moreover, since the labor market prefers graduates from DECS-accredited institutions, Madaris students are perceived to lack the competitive and employability skills upon graduation. This deprives the Muslim youth who attend exclusively in Madaris with opportunities provided with those in the DECS schools. In response, the government is in the process of harmonizing the Madaris curriculum with that of the formal education system. Furthermore, the Madaris are beset with many critical problems ranging from administration, curriculum, and faculty and students performance. The perennial problems of school buildings, desks, textbooks and other basic needs continue to characterize the Madaris operations. Madaris owners and teachers cite problems such as the lack of financial assistance, and the lack of standardized/reconciliatory curriculum, among others. Since the Madaris are privately owned, they are neither supervised nor accredited by the DepEd (Daguino 2004). Table 4.1 shows that the project is foreseen to employ around P13.5 billion over time. A consultation with the DepEd Undersecretary for Muslim Affairs reveals an additional plan to raise $100 million for the Madrasah program in ARMM and other Muslim areas. Thirty million dollars will be used as tuition scholarships to the private Madrasah schools. The rest will be used as soft loans to the private institutions that will invest in these private schools. The goal of the government here is to provide the scholarships and soft loans to be able to have a leverage on the private institutions to include and strengthen subjects in mathematics, the sciences, Filipino, English, world and Filipino history – apart from Islamic studies -- so that the standards of the schools will be raised and their graduates will be able to enter better colleges and be employed in better jobs.

68
The expected funding for the Madrasah education for 2006 and after is expected to come from: Asia Foundation P1.7 million; SEAMEO INOTEC, P2 million; UNICEF, P1 million; TEEP/World Bank, P25 million; BEAM/AUSAID, P160 million, Libya (for Islamic textbooks), P480 million and national government fiscal allocation, P100 million. The DepEd Undersecretary is open to invite Muslim countries to participate in providing ODA or debt conversion funds for the plan to generate $100 million for the Madrasah program. Annex C shows that in 2005 the Philippines owed $59 million to Muslim countries (including Malaysia, Brunei, Kuwait, Pakistan and Indonesia). These countries could be approached to consider debt conversions of their debts to the Madrasah education program. The advantage of approaching the Muslim countries is that they are not Paris Club members and are not bound by the restrictive Paris Club rules. 4.4.2 Hunger Mitigation Program in Schools (Food for Education Program) The Hunger Mitigation Program (HMP), to be implemented by various government and nongovernmental agencies, aims to improve school attendance and prevent the further decline in the nutritional status of disadvantaged children. The HMP is an umbrella project consisting of the Food for School Program, Tindahan Natin (Our Store) Project, and the Development of Hunger Index. This program is perceived as a key policy to improve cohort survival rates of elementary and secondary students, an MDG target that is doing the worst in Table 1.4. Furthermore it improves the nutritional status of children (and reduce underweight children) that is a most serious problem in the nutrition target of MDG Goal 1. The Food for School Program (FSP) is a DepEd program that provides daily ration of rice to identified poor families through their children in school. Each child beneficiary (in day care or Grade 1) receives one kilo of rice everyday that he is present in school. The FSP, which was initially conducted in 17 provinces out of the 49 FIVIMS (Food Insecurity and Vulnerability Information and Mapping System) areas, resulted to some benefits to the recipient family. These benefits included additional food for the family, children being excited to go to school every day, and assurance of rice supply for the family as long as their children in Grade 1 and Day Care report to school. Moreover, it is reported that there has been a significant improvement in nutritional status of school children for the initial duration of the program. However, parent beneficiaries are worried on FSP’s continuity since their Grade 1 children will move to Grade II by the end of the school year. The FSP aims to cover 1,604 schools nationwide with 111,584 pre-school and Grade 1 students as beneficiaries. These figures represent 27.89 percent of hungry families. At this rate, it is expected that there will 25,338 bags of rice to be delivered to these families amounting to Php 25,338,000.00. The Summer Rice Distribution Program (also under the HMP) implemented from April 24 to June 2 this year required Php 335 million in funds – Php 304 million for DepEd and Php 31 million for DSWD. However, DSWD reportedly lacked Php 30 million to carry out the said project.

69
Again, DepEd and the National Nutrition Council representatives have yet to be met for further details and information. Table 4.1 shows that only P718 million is allotted for this urgent national program for 2005 to 2010. It is thus one important program where intense lobby has to be made so that urgent financing can be derived. Government and private funding, ODA and debt conversion schemes, such as the German debt conversion for education scheme in Indonesia (discussed later), should be pushed by the Philippines to possible donors. 4.4.3 Identifying Other MDG Programs That Require Funding A look at Table 4.1 shows some vital programs that have very little funding. Employment generating or self-employment programs have very little funding. Only two projects in Table 4.1 fall in this category (Self-employment Assistance Kaunlaran Project with P756 million, and the Food-for-Work program with only P600,000). There clearly is a need to allot more funds for employment generation programs, given that the unemployment rate of the Philippines now is even higher than during the Asian crisis and during the 1991-93 recession. Family planning and population control is allotted a measly amount of less than P400 million for the period 2005 to 2010. This is hardly enough to reduce the high population growth and high dependency burden of the country. Given the high maternal mortality and morbidity in the country, projects and programs for maternal health is vital. So far, the Women’s Health and Safe Motherhood Project by the World Bank is allotted less than P1 billion for the 2005 to 2010 period. There are many other programs that require supplement funds -- immunization of children (where the MDG target is retrogressing), hospitals for the indigents, school buildings in depressed areas, social insurance schemes for vulnerable groups, rural infrastructure such as farm-to-market roads, irrigation systems, etc. All these can be included in the priority projects that funds should be mobilized for. It is important to target financing for depressed areas and regions where the magnitude of the poor is high. 4.4.4 The President’s Priority Program on Water (P3W) The P3W is a six-year program (2005-2010) that is intended to: 1) increase access to water supply and sanitation services coverage to at least 50 percent of the community; 2) reduce incidence of diarrhea by 20 percent; 3) improve access of the poor to water supply and sanitation services by at least 20 percent; 4) maintain 100 percent sustainable operation of all water supply and sanitation projects constructed, organized, and supported by the program; and 5) achieve qualitative reduction of social tension and inequity brought about by inadequate access to water supply and sanitation in areas with peace agreements with the government.

70
The Program offers an “open menu” of water supply and sanitation projects to the communities so long as these projects improve the access of water supply and sanitation services to the pre-selected 212 barangays in Metro Manila and 432 municipalities outside Metro Manila whose households have less than 50 percent water service coverage. The main financing source for the program comes from government grant through the annual Department of Public Works and Highways (DPWH) budgetary allocation in the General Appropriations Act in the amount of Php 500 million. It shall be complemented by local counterpart contribution from LGUs and other sources. The Water and Sanitation Coordination Office (WASCO) and its partners will continuously try to mobilize other resources to augment this fund. WASCO is an office under the National Anti-poverty Commision (NAPC) that has been tasked to oversee and coordinate the planning and implementation of P3W (NAPC 2005). The prioritized provinces’ share of the 500-million peso annual budget for the P3W has already been pre-determined. It seems to show that the said annual budget will be just enough to carry out the goals of the project in each of the priority provinces. However, because WASCO relies only on the funds of National Anti-Poverty Commission (WASCO does not an Executive Order yet), WASCO has to use a portion of the P3W annual budget for the office’s mobilization and operation. This reduces the funds that are supposed to go to the implementation of the project itself. 4.5 Ensuring Transparency and Accountability in MDG Projects It is vital to ensure transparency, accountability, and check-and-balance mechanisms in all stages of the program especially if the endeavor involves surmountable amounts of financial and human resources. Pursuant to the ODA Act, the Project Monitoring Staff (PMS) of NEDA is tasked to monitor projects utilizing funds from Official Development Assistance (ODA), whether funded in part or in whole. On the other hand, pursuant to EO 230, PMS is empowered to monitor all development projects regardless of funding source. The function of PMS commences as soon as project implementation, Step 5 in the project development cycle in Figure 4.1, is considered ongoing, In turn, project implementation is considered ongoing if a Loan Agreement has been declared effective, or the Project Agreement has been signed between the Government of the Philippines and the ODA financing institution. PMS then starts its work once it receives the memorandum from the NEDA-Public Investment Staff (PIS) endorsing the project as ongoing. Figure 4.1 implies that monitoring takes off from actions and decisions prior to actual implementation, which provide the basis for monitoring. The baseline indicators and targets will then be the subject of monitoring. These indicators for monitoring are firmed up during the investment stage, particularly in the detailed design phase, wherein implementing agencies prepare Project Implementation Plans. The implementation plans specify details of work or activities, schedules, associated costs, manpower and

71
organizational support for the project. Information on these project variables and the outputs to be delivered are then collected and analyzed to manage performance during actual implementation. NEDA-PMS and other oversight agencies including the Department of Budget and Management (DBM) and the Department of Finance (DOF) monitor the progress of implementation of approved development programs. It is the task of DBM to monitor budget requirements and utilization of all government agencies to improve their operating efficiency. On one hand, DOF monitors the resource picture to determine resource requirements and fiscal implications. Finally, NEDA-PMS monitors the progress of development programs based on reports from the central offices of line agencies and the NEDA regional offices. The basic components of project monitoring done by PMS that are required during the implementation stage at the national level include input monitoring, output monitoring, process monitoring, and to some extent, sector monitoring.

72
Figure 4.1. The Project Development Cycle (Source: Manual for Project Monitoring, NEDA)
Input monitoring and output monitoring are carried out by comparing the actual cost and implementation period with the planned and budgeted cost and pre-established project timetable. Also, combined input and output (I/O) monitoring is concerned with efficiency of input use and quantity and quality of ouput. Process monitoring covers pre-implementation processes, procurement processes, ROW acquisition and resettlement activities, negotiation with LGUs, among others. Monitoring such processes requires systematically tracking whether prescribed timelines in relevant procurement rules are being followed by implementing agencies. There are three methods used for collecting data in the course of project monitoring, namely: verbal and written reports, technical-level meetings and reviews, and firsthand observations. Verbal and written reports should be obtained on a regular basis to update the Project monitor with the progress of the project. The desired frequency of submission

73
is quarterly at the least for loan-funded projects and twice a year for grant-assisted projects. Though this method has the advantage of being least time-consuming on the part of the Project Monitor, it also bears the risks of inaccuracy, lack of accountability, and misinterpretation. Technical-level reviews and meetings also serve as a venue for direct interaction among all the concerned parties, where accuracy and reliability of project data can be subject to direct inquiry. However, the best way to gather data is still through firsthand observations in the form of inspections and site visits. This method helps build rapport between the project management and the Project Monitor, which can lead to open communication, easier access to information and smoother coordination. Despite the benefits of a firsthand-observation method in data gathering, NEDA admits that it does not have the financial resources to conduct on-site visits to all projects PMS is monitoring. The most PMS can do in this aspect is to prioritize projects to be visited, for example: actual problem projects as first priority. This creates the problem of not being able to directly oversee other projects that might have dubious outcomes. Moreover, the Project Monitor should be careful about making generalizations about a project, especially one with a broad coverage, based on observations in a single or few sites visited. This situation then calls for the national government to allocate a separate budget for project monitoring. These additional financial resources will make it possible for the Project Monitoring Staff to conduct on-site visits on the projects being monitored. The separate budget will also relieve the Project Monitor from data overload, especially in data processing, by employing additional members in the team. An alternative solution to this predicament is for every ODA and debt conversion for MDG projects and activities to earmark a portion of the funds for the monitoring and evaluation of the specific project. Finally, there is a need to strengthen post-evaluation and impact assessment of projects by the line agencies and NEDA. These efforts will put more faith on the donors to contribute funds and debt conversions for MDG financing, and will ensure better, honest and more efficient implementation of the program and projects. Furthermore, the Commission on Audit (COA) is a very useful agency that will audit and ensure honest and efficient utilization of funds channeled to MDG activities and projects. 4.6 Issues on Absorptive Capacity Some multilateral and bilateral donors decry the low absorptive capacity of ODA projects and programs of developing countries like the Philippines. However, a closer analysis of the problems and bottlenecks show that some policies had already been undertaken to improve the bottlenecks, and that some bottlenecks, such as resettlement problems understandably take some time to resolve. It is also true that oftentimes multilateral and bilateral lenders themselves are to blame for some of the delays in funds disbursement due to strict rules and requirements, including the tying of the aid to purchases from identified firms or products of the creditor country. Other projects are delayed due to the mismatch between the objectives and viewpoints of the donor and the local area or local sector
74
targeted. The problem of absorptive capacity requires twin efforts from both borrower and lenders, not just the former. 4.6.1 Procurement Procurement is one of the most critical activities in project implementation. This refers to the acquisition of all the goods, supplies, and materials needed by the project, as well as the contracting of the entire or a portion of the works in an infrastructure project. Moreover, procurement is a very crucial step in project implementation because it involves the disbursement of funds. Under the Government Procurement Reform Act (GPRA), the procurement process from the opening of bids up to the award of contract shall not exceed three (3) months. However, previous experiences have shown that the procurement process could take as long as six months or even years. Factors that contribute to delay include change of government leader(s) at the national or local level, court cases filed by losing bidders, and right-of-way and resettlement issues, among others. In response to this problem, the Project Implementation Officers (PIO) system was created under the Estrada administration to hasten the procurement process and the progress of the project. PIOs are tasked to closely monitor procurement activities, institutionalize internal systems for tracking procurement activities, ensure strict adherence to timelines, delineate clear lines of responsibilities, and address systematic bottlenecks. They likewise study ways to further streamline procurement processes, e.g., through decentralization, delegation of authority, etc. At the same time, head implementing agencies enforce more stringent pre-qualification standards, in addition to imposing incentives and sanctions, to avoid poor performing and unqualified contractors. The fact that the PIO system has demonstrated capability to move problematic projects and improve ODA performance is reflected in the improvement of the procurement process. With the presence of PIOs, the estimated length of time it takes from the opening of bids up to the awarding of contract is already reduced to around 108 days, according to a NEDA Project Monitoring Staff Though this is a significant improvement, the desirable length of time for the procurement process stated under the GPRA still has rarely been met. 4.6.2 Other Bottlenecks and Obstacles: The Need to Develop LGU Capacity Acticle XI, section 38 of the GPRA states that the Notice to Proceed will be issued by the Procuring Entity not later than seven (7) calendar days from the date of the approval of the contract (ROP 2002). Projects, however, do not always start at the seventh day due to requests of project implementors to start at dates according to their customs and traditions. Right-of-way (ROW), resettlement, and compensation issues also prolong the progress of a project. The longer the time it takes to solve these issues, the more vulnerable external funding is to foreign exchange fluctuations. These problems in settlement are minimized through a strong coordination with the LGUs concerned.

75
Indeed, the LGUs take a great responsibility in fast-tracking projects in their vicinity, for example, by generating public support for expeditious ROW acquisition and resettlement activities, and ensuring that ROW and resettlement costs do not overshoot initial national government estimates through appropriate cost-sharing schemes. Hence, to encourage active cooperation of LGUs in projects that require LGU participation, the head implementing agency is tasked to ensure that costs of delays, non-performance, or withdrawal shall be carried by LGUs. In addition, the LGUs are monitored under the ODA performance monitoring system of the NEDA. Finally, the Government Procurement Policy Board (GPPB) further reviews performance of agencies which are observed to be unable to comply with prescribed timelines. GPPB then provides the necessary assistance. However, it is imperative to point out that various government agencies responsible for check-and-balance mechanisms only depend on progress reports submitted by agencies/LGUs/contractors concerned. There are no officers who are tasked to check whether the project has been carried out in high quality, or at least simply carried out. A reported reason for this lack of manpower is inadequate budget for such endeavor. Thus, the energy spent by some donors in criticizing absorptive capacities should be translated to developing LGU capacities to involve local participation, problem-solving, managerial know-how, and transparent mechanisms. All these will also require financial resources. 4.6.3 Some Donor-Related Bottlenecks Some bottlenecks may be related to: 1. Mismatch between creditors’ or donors’ requirements and rules with the local rules and
regulations, or mismatch of requirements with the local capacities to deliver the requirements.
2. Hurried financing of projects leading to mismatch between creditors’/donors’ objectives or viewpoints and the local proponents or target beneficiaries,
3. Creditors’ and government’s lack of consideration of potential corrupt or unfair processes that may arise in the project fund disbursement or implementation.
All of these problems can be addressed if both the Philippine government and the bilateral
and multilateral creditors/donors can agree on: 1) a priority list of projects or programs that will advance the MDGs and are consistent
with the Medium Term Development Plan of the Philippines, 2) a framework for a manageable set of indicators to use to measure the impact of the
MDG project or program, 3) a commonly accepted set of arrangements and procedures for
- public financial management - accounting - auditing - procurement - results frameworks

76
- monitoring 4) a country level common arrangement for planning, funding, disbursement, monitoring,
evaluating and reporting 5) a sufficient level of mutual trust and respect It is proposed that a team of government and representatives of bilateral and multilateral creditors/donors study the systems and procedures being undertaken now in the processes of the Medium Term Public Investment Program (MTPIP) of the government and the Investment Coordination Council (ICC) in the funding and implementation of MDG and development projects and programs. A more coordinated and consultative process that is developed by the team will go a long way to facilitating external development assistance and debt reduction/conversion funds into financing the MDG needs. Such processes can be part of the work of the MDG Fund Committee, if the government decides to create such an institution.

77
Box 4.1: On Transparency and Accountability: The President’s Priority Program on Water (P3W)
The program, P3W, is designed such that there will be community participation in the whole process of developing the project. The detailed proposal and budget, procurement plan, and local counterpart contribution plan are all presented to the barangay or community-based organizations (CBO) assembly or its representatives for approval prior to submission to the Municipal Water and Sanitation (WATSAN) Development Council through the Project Management Committee. Issues or questions raised by the community are addressed and suggestions entertained. Revisions are made, if necessary. This process is the best mechanism for internal control – the community is involved and there is full disclosure of all the details of the project. The following are the procurement policies of P3W (NAPC 2005):
• All procurement-related activities of the projects under this program shall follow the Implementing Rules and Regulations of Republic Act No. 9184 (Government Procurement Reform Act).
• Procurement for the projects whose beneficiaries involve BWSAs shall be the responsibility of the local government units (LGUs). Procurement of materials and labor for projects will be undertaken by the Water Districts themselves. Existing Procurement, and Bids and Awards Committees of implementing LGUs or water districts shall be utilized.
• In procuring the materials, preference should be given to procure the materials locally within the barangay or municipality.
• Transparency should be practiced in all stages of the procurement process, from the public announcement of invitation to quote or to bid, awarding of contracts, contract implementation to payment to suppliers, contractors and local workers. This shall be achieved through conduct of barangay assemblies and posting of notices and reports in the Project billboards or bulletin boards within the municipality or barangays.
• It shall be the responsibility of DPWH to assess the capability of LGUs to implement the projects. A Department Order should stipulate both the qualitative and quantitative criteria to be followed in assessing capabilities of LGUs. The DPWH District Engineering Office shall conduct the initial assessment and recommend action for approval or disapproval of selected LGUs. The final approval shall be decided by the Regional DPWH.
• If DPWH finds an LGU not capable to implement a project by itself, the DPWH shall implement the project by contract or by administration. Even in this case when the DPWH will implement the infrastructure portion of the project, stages and steps of the project development cycle will still be followed to ensure that adequate organizational development, participation and empowerment of the beneficiaries are developed. This social preparation and organization components of the project are critical to the sustainability of the project.
• The LGUs or the DPWH shall use the Lowest Calculated and Responsive Bid/Quotation as the criterion for the selection of suppliers and contractors as provided for in Section 32 of Implementing Rules and Regulations of Republic Act No. 9184 (Government Procurement Reform Act). This criterion shall be publicly announced to the community and to all interested parties.
On project monitoring and evaluation, it is the responsibility of the WATSAN Council and CBO to examine reports prepared by concerned parties on project outcomes. The case of P3W shows the need to have key general guidelines and rules towards making MDG projects and programs transparent and accountable, but at the same time maintain some flexibility in the administration and management of the project/program due to the specificity of the project and sector concerned. The implementation, monitoring and evaluation of the project at the line agencies and local levels are important components of the project.

78
Chapter Five: The Philippine Fiscal and Debt Problems: A Major Hindrance to MDG Financing
Reducing the debt burden has recently made a comeback (after the Philippines’ debt crisis in the 1980s) as a policy that can complement the above strategies. The recent fiscal crisis of the Philippines has increased public and government debt significantly. Debt servicing has increased and encroached on vital spending on social and economic services – public spending that is essential for reaching the MDG targets. Thus there has been increasing attention by some sectors to look at the government and public debt and its servicing, and to consider policies to reduce the debt burden so as to release financial resources for MDG and development needs. Almost all countries adversely affected by the 1997 Asian financial crisis reduced their debt burden from the peak values reached in 1997 and 1998. Only the Philippines entered a fiscal crisis as fiscal positions deteriorated instead of improved as economic growth turned positive after the crisis. Table 5.1 shows the deterioration of the national government deficit from 1.9% of GDP in 1998 (and this was a surplus from 1994 to 1997) to 5.3% of GDP in 2002. The public sector borrowing requirement (PSBR) – which is derived from the national government deficit, the deficits of 25 monitored non-financial government corporations, balances of the Central Bank, social security institutions and other public entities -- increased also alarmingly to dangerous levels by 2002 to 2004, due to the national government deficit and due to the large losses of the National Power Corporation (NAPOCOR). The PSBR improved in 2005 due to a sharp reduction in national government deficit and better economic performance from NAPOCOR. 5.1 Debt Servicing Cutting Into Vital Social and Economic Services Although there were improvements in the deficits from 2002 to 2005, the current situation is still significantly worse than in 1998 (the year of the Asian crisis). Furthermore, the fiscal position has not yet improved for the Filipino people. Table 5.1 shows that the government revenue and tax collection, as percentage of GDP, continued to deteriorate from 2002 to 2004, and only marginally improved in 2005. Table 1 shows that the deficit was reduced, especially in 2004 to 2005, mainly through expenditure constriction. Total expenditure fell from around 19% of GDP from 1998 to 2003 to 17.5% in 2005.

79
But the situation is worse. Tables 5.2a and 5.2b show this expenditure constriction in more detail. The share of interest payment increased from 3.5% of GDP in 1998 to 5.8% of GDP in 2005 (a full one-third of total expenditures). This means that expenditure constriction is even more severe starting in 2003 to 2005 due to the encroachment of interest payments in government expenditures. Table 5.2a shows that economic services fell from 5.1% of GDP in 2000 to 2.9% of GDP in 2005. This includes a sharp drop in communications, roads and other transportation. Social services fell from 6.4% of GDP in 2000 to 4.7% in 2005. This includes sharp falls in spending for education, housing and health. Total expenditures excluding interest payments and net lending (to debt-ridden government corporations) fell from 16.3% of GDP in 2000 to 11.1% in 2005.
Table 5.1: Fiscal and Public Finance Figures for the Philippines I t e m 1998 1999 2000 2001 2002 2003 2004 2005 National Govt Revenues (P Billion) 462.5 478.5 514.8 563.7 567.1 626.6 698.8 795.7 As % of GDP: National Government (NG) Revenues 17.4 16.1 15.3 15.5 14.3 14.6 14.5 14.8 of which: Tax 15.6 14.5 13.7 13.5 12.5 12.5 12.4 12.7 National Government Expenditures 19.3 19.9 19.3 19.5 19.6 19.3 18.4 17.5 Surplus/Deficit(-) -1.9 -3.8 -4.0 -4.0 -5.3 -4.7 -3.9 -2.7 Public Sector Borrowing Requirements -4.2 -4.6 -5.2 -5.2 -6.8 -6.4 -5.8 -3.4 As % of NG Revenues: NG Debt Service Payments 35.6 42.9 44.3 48.7 63.1 75.0 86.0 85.3 Interest 21.6 22.2 27.4 31.0 32.8 36.1 37.3 37.7 Principal 14.0 20.7 16.9 17.7 30.3 38.9 48.7 47.6 Total Outstanding Debt of the National Government (P B) 1496.2 1775.4 2166.7 2384.9 2815.5 3355.1 3812.0 3888.2 (as % of GDP) 56.1 59.6 64.6 65.7 71.0 78.2 79.0 72.3
Domestic Debt (P B) 850.9 978.4 1068.2 1247.7 1471.2 1703.8 2001.2 2164.3 (as % of GDP) 31.9 32.9 31.8 34.4 37.1 39.7 41.5 40.2 Foreign Debt (P B) 645.3 797.0 1098.5 1137.2 1344.3 1651.3 1810.7 1723.9 (as % of GDP) 24.2 26.8 32.7 31.3 33.9 38.5 37.5 32.0
Total Public Sector Debt 2522.5 3020.2 3623.8 3850.2 4369.1 5074.0 5297.6 5100.0 (as % of GDP) 94.6 101.5 108.0 106.0 110.2 118.2 109.8 93.4
Domestic Debt (P B) 937.7 976.5 1076.5 1187.1 1361.8 1531.1 1708.7 1800.0 (as % of GDP) 35.2 32.8 32.1 32.7 34.4 35.7 35.4 33.0 Foreign Debt (P B) 1584.8 2043.7 2547.3 2663.0 3007.3 3543.0 3588.9 3300.0 (as % of GDP) 59.5 68.7 75.9 73.3 75.9 82.5 74.4 60.4
Source: Bangko Sentral ng Pilipinas, Bureau of Treasury, NEDA

80
Table 5.2a: NATIONAL GOVERNMENT EXPENDITURES, OBLIGATION BASIS, BY SECTOR, % of GDP
1996 1997 1998 1999 2000 2001 2002 2003 2004 2005 P A R T I C U L A R S
ECONOMIC SERVICES 4.9 5.4 4.9 4.7 5.1 4.3 3.9 4.0 3.5 2.9
Agriculture, Agrarian Reform, and Natural Resources 1.3 1.7 1.2 1.1 1.1 1.1 0.9 0.9 0.7 0.6
Trade and Industry 0.2 0.2 0.1 0.1 0.1 0.1 0.1 0.1 0.1 0.1
Tourism 0.0 0.0 0.0 0.0 0.0 0.0 0.0 0.0 0.0 0.0
Power and Energy 0.1 0.1 0.1 0.1 0.0 0.0 0.0 0.0 0.0 0.0
Water Resource Development and Flood Control 0.1 0.3 0.1 0.2 0.1 0.2 0.2 0.2 0.2 0.1
Communications, Roads, and Other Transportation 2.0 2.0 2.2 1.8 2.3 1.7 1.4 1.6 1.4 1.0
Other Economic Services 0.2 0.1 0.1 0.2 0.1 0.1 0.1 0.0 0.1 0.1
Subsidy to Local Government Units 0.9 1.0 1.0 1.1 1.2 1.1 1.2 1.1 1.0 1.0
SOCIAL SERVICES 5.7 6.5 6.6 6.5 6.4 5.9 5.9 5.5 5.2 4.7
Education, Culture, and Manpower Development 3.4 3.9 4.0 3.7 3.5 3.2 3.2 3.0 2.7 2.5
Health 0.5 0.6 0.5 0.5 0.4 0.4 0.4 0.3 0.3 0.3
Social Security and Labor Welfare 0.5 0.8 0.9 0.8 0.8 1.0 0.9 0.9 0.9 0.7
Land Distribution (CARP) 0.0 0.0 0.0 0.1 0.1 0.1 0.1 0.0 0.2 0.1
Housing and Community Development 0.2 0.1 0.1 0.1 0.3 0.1 0.0 0.1 0.0 0.0
Other Social Services 0.0 0.0 0.0 0.0 0.0 0.0 0.0 0.0 0.0 0.1
Subsidy to Local Government Units 1.0 1.1 1.1 1.2 1.3 1.2 1.3 1.2 1.1 1.0
DEFENSE 1.4 1.2 1.2 1.1 1.1 1.0 1.0 1.0 0.9 0.8
GENERAL PUBLIC SERVICES 3.6 3.8 3.8 3.6 3.7 3.3 3.4 3.3 2.9 2.6
General Administration 1.5 1.5 1.5 1.2 1.2 1.1 1.1 1.0 0.9 0.8
Public Order and Safety 1.3 1.4 1.4 1.4 1.4 1.2 1.3 1.2 1.1 1.0
Other General Public Services 0.2 0.1 0.1 0.0 0.1 0.1 0.1 0.1 0.0 0.1
Subsidy to Local Government Units 0.7 0.8 0.8 0.9 1.0 0.9 1.0 0.9 0.8 0.8
TOTAL EXPENDITURES EXCL 15.6 17.0 16.4 15.8 16.3 14.5 14.3 13.8 12.4 11.1
INTEREST PAYMENTS, NET LENDING
NET LENDING 0.1 0.1 0.0 0.1 0.1 0.1 0.1 0.1 0.1 0.1
INTEREST PAYMENTS 3.5 3.2 3.7 3.6 4.3 4.8 4.8 5.3 5.4 5.8
TOTAL EXPENDITURES 19.2 20.3 20.2 19.5 20.7 19.5 19.1 19.2 18.0 17.1 Source: Department of Budget and Management

81
Table 5.2b: NATIONAL GOVERNMENT EXPENDITURES, OBLIGATION BASIS, BY EXPENSE CLASS, 1996-2005 (% of GDP) PARTICULARS 1996 1997 1998 1999 2000 2001 2002 2003 2004 2005 CURRENT OPERATING EXPENDITURES 12.0 13.1 12.9 12.6 13.0 11.8 11.7 11.3 10.3 9.3 Excl. INTEREST PAYMENTS Personal Services 6.4 7.4 7.7 7.2 7.1 6.8 6.9 6.5 5.9 5.4 Maintenance and Other Operating Expenses 3.0 2.9 2.5 2.3 2.5 2.1 1.8 1.6 1.7 1.6 Allotments to Local Government Units 2.1 2.3 2.3 2.6 2.8 2.6 2.8 2.6 2.3 2.3 Petroleum Price Standby Fund 0.0 0.0 0.0 0.0 0.0 0.0 0.0 0.0 0.0 0.0 Subsidies 0.5 0.5 0.4 0.4 0.5 0.3 0.2 0.5 0.4 0.1 Tax Expenditure Fund 0.0 0.0 0.0 0.0 0.0 0.0 0.0 0.0 0.0 0.0 CAPITAL OUTLAYS 3.6 3.9 3.5 3.2 3.4 2.7 2.5 2.6 2.2 1.8 Infrastructure 2.0 2.1 1.6 1.9 2.0 1.8 1.5 1.4 1.2 1.1 Corporate Equity 0.2 0.1 0.1 0.1 0.1 0.1 0.1 0.1 0.1 0.0 Other Capital Outlays 0.9 1.1 1.2 0.6 0.5 0.2 0.2 0.4 0.2 0.1 Capital Transfers to LGUs 0.5 0.6 0.6 0.7 0.7 0.7 0.7 0.7 0.6 0.6 NET LENDING 0.1 0.1 0.0 0.1 0.1 0.1 0.1 0.1 0.1 0.1 INTEREST PAYMENTS 3.5 3.2 3.7 3.6 4.3 4.8 4.8 5.3 5.4 5.8 TOTAL 19.2 20.3 20.2 19.5 20.7 19.5 19.1 19.2 18.0 17.1 Source: Department of Budget and Management

82
Table 5.2a shows that budget allotted to trade and industry, transportation and communications (especially roads and bridges), education, health and housing were all hard-hit. Table 5.2b shows that by expense class, capital outlays, especially infrastructure, as well as maintenance and operating expenses were the expenditures that suffered from the expenditure constriction. This means infrastructure and their maintenance, especially in poor and far-flung areas, are hard-hit by the fiscal bind. All these show that financing for social and economic services to attain the MDG targets are in grave jeopardy and had been suffering, especially in the last two years. 5.2 Large Debt Servicing Vis-à-vis Low Government Revenues Lead to More
Debt Dependence But the biggest indicator that the fiscal problem is really severe is the national government debt service payments as a proportion of national government revenues, shown also in Table 5.1. Principal and interest debt payments of the national government comprised 35.6% of national government revenues in 1998. This increased tremendously and was 85.3% of national government revenues in 2005. This means that 85.3% of national government revenue is eaten up by debt payments alone. This leaves less than 15% of the revenues to fund vital spending of the government. The rest will have to be financed by new debts.10 The results of this are a continuing rise in public debt and a continuing expenditure constriction happening at the same time. The increase in total public sector deficits had increased the size and burden of public sector debt, particularly for the national government. Table 5.1 also gives us the levels of national government and public sector debts, and their percentages to GDP. One can see that the national government debt had continuously increased from 56.1% of GDP in 1998 to 79% of GDP in 2004. Although there was an improvement in 2005 as national government debt fell to 72.3% of GDP, this level is still very high. All traditional analyses consider national government debt at below 50% as a more comfortable debt burden. It can also be seen in Table 5.1 that in the period from 1999 to 2005, the national government had increased domestic debt vis-à-vis foreign debt. This is clearly explained in Table 5.3 where the financing of the weight of national government deficit financing is tilting more towards domestic borrowing. This is because the Philippine financial sector is awashed with liquidity, and the financial institutions prefer government bonds to lending to the private sector. Thus, the government, since 1999, can get domestic financing relatively more cheaply than foreign financing. As of July 2006, domestic borrowings made up 62% of total government borrowings and foreign borrowings 38%. A discussion
10 It must be pointed out standard accounting practices does not treat principal payments for debt as fiscal or government expenditures. Only interest payments for debt are considered as government expenditures. The financing of the fiscal deficit is defined as new (external and domestic) financing less principal payments (or amortization of debt payments). This accounting practice simply emphasizes the fact that new loans have to be incurred to finance maturing principal payments. Other new loans will also have to be incurred to finance the deficit itself.

83
of the pros and cons of domestic borrowing versus foreign borrowing is discussed in section 6.11. Public debt – including national government, state corporations and social security financial institutions -- deteriorated from 1998 to 2003, growing from 94.6% of GDP in 1998 to more than 118% in 2003. This improved to 93.6% in 2005 due to improvements in the debts of government corporations and social security institutions primarily and an improvement of national government debt position in 2005, as shown earlier. This significant improvement still makes the Philippines the most indebted non-transition country in this part of the world, beating Indonesia, whose public debt reached a peak of only 90% of GDP in 2000 and fell to 54% in 2005. 4.3 Source: Bangko Sentral ng Pilipinas, Bureau of Treasury 5.3 The Need to Increase Revenue Generation, Reduce Debt Servicing, Stop Expenditure Constriction of Social and Economic Services, and Improve Expenditure Allocation One of the key solutions to the above problems is to significantly increase government revenues, which will reduce the fiscal deficits and make the government less dependent on debts. 2006 and 2007 will be critical years that will determine whether the increase in the VAT rate and expansion of its coverage, the increased excise taxes on alcohol and cigarettes, and government’s running after big tax evaders and smugglers will be successful and sustainable (see section 3.5 for improvements in the tax performance in 2006).
Table 5.3: Financing of the National Government Deficit 1999 2000 2001 2002 2003 2004 2005
Sources of Financing the NG Deficit 111.7 134.2 147.0 210.7 199.9 187.1 146.8 (% of GDP) -3.8 -4.0 -4.0 -5.3 -4.7 -3.9 -2.7
Borrowings (Net) 181.7 203.8 175.2 264.2 286.8 242.5 236.0
Domestic (Net) (P B) 98.9 119.5 152.3 155.0 143.0 161.4 143.3
(as % to total NG Deficit) 88.6 89.0 103.6 73.6 71.5 86.3 97.6
(as % of GDP) 3.3 3.6 4.2 3.9 3.3 3.3 2.6
Foreign (Net) (P B) 82.8 84.4 22.9 109.1 143.9 81.2 92.7
(as % to total NG Deficit) 74.2 62.9 15.6 51.8 72.0 43.4 63.1
(as % of GDP) 2.8 2.5 0.6 2.8 3.4 1.7 1.7 Less:
Change in Cash (Budgetary) 70.0 69.6 28.2 53.4 87.0 55.5 89.2
(as % to total NG Deficit) 62.7 51.9 19.2 25.3 43.5 29.7 60.8
(as % of GDP) 2.4 2.1 0.8 1.3 2.0 1.1 1.6

84
Despite positive signs of increased tax revenues in the first half of 2006, the improved fiscal position until May 2006 had been partly achieved by underachievement in the expenditure targets. This is mainly due to the failure of Congress to pass the 2006 budget and the reenactment of the 2005 budget. We had also shown in section 5.1 that education, health, infrastructure spending – all social and economic services -- had all fallen consistently (as percentages of GDP) from 2001 to 2005. This should be corrected mainly through increased fiscal revenue and reduction of the debt burden. A more efficient budget allocation should also be undertaken so that unproductive or less urgent expenditure items are shifted to vital development and MDG needs. 5.4 A Look at the External Debt Composition Annexes A to E give us a detailed picture of the external debt of the country. The following summarize some of the salient points: 1. The Philippines started from a high external debt level in 1990, equivalent to 73.6% of
GDP (Annexes A1 to A3). This was due to the debt overhang which afflicted the Philippines during the Latin American debt crisis and Marcos economic collapse in the early and mid-1980s. This ratio fell from 1992 to 1996 as the Brady Plan effected significant debt relief for the Philippines, and the Philippines got out of the decade-long debt trap.
2. The Asian crisis increased the external debt to GDP ratio back over 70% in 1997 due to the significant devaluation of the currency. The deterioration of the external debt worsened in 2000 to 2003 as both private and public sectors increased their demand for foreign debt, leading to an external debt ratio of 74% of GDP in 2003. Contributors to this upward trend in the ratio were the deficit-ridden national government and government corporations.
3. The ratios significantly improved in 2004 and 2005, as the external debt ratio fell to 53.5% by end of 2005. The improvement was due to a tame private demand for foreign debt (except for private domestic banks’ borrowings which was the only item to increase its ratio with GDP in 2005) and reduced borrowings from the public sector. The latter was due to the lower fiscal deficits shown earlier (which involved expenditure constriction) supplemented by a shift in deficit financing from foreign to domestic financing.
4. During 1990 to 1994, the government owed more than 80% of the external debt due to the high debts it inherited by taking over the debts of failed state companies and banks during the mid-1980s. The high confidence and growth in 1995 to 1997 brought the public share of the external debt down to two-thirds. This more or less prevailed in succeeding years, even during and after the Asian crisis. Since the Asian crisis did not hit the Philippines severely, there were not much private debts that fell into the government lap (as in Indonesia during the Asian crisis and as in the Philippine debt overhang from 1983 to 1992).

85
5. In terms of institutional creditors (Annexes B1 to B3), 1990 and 1991 saw the international financial institutions, bilateral creditors and the multilaterals more or less with equivalent shares of the external debt (between a quarter to a third). Suppliers held less than 10% share. With the Brady Plan introduced in 1992, the share of the international banks fell significantly in 1992 to 1994, and the share of the bilateral debts increased its share. Bondholders/noteholders also increased their share from practically nil to more than 10% during 1992 to 1994.
6. During the high confidence and growth period of 1995 to 1997, bondholders/ noteholders and the international financial sectors increased their share of the foreign debt, while bilateral and multilateral decreased their share. Suppliers’ share of the foreign debt continuously declined from the early 1990s.
7. The Asian crisis and its aftermath did not change the above trend. By 2005, the bondholders/ noteholders had the biggest share of 32%, the bilateral creditors next with 26%, the international financial institutions with 24%, the multilaterals with 14% and the suppliers with less than 4%.
8. Debts where creditors’ country of origin (whether official or private lenders) can be identified comprised more than 70% of the debts in 1990 and 1991. But due to the growing share of debts being held by bondholders and noteholders in succeeding years, the debts where creditors’ country of origin can be identified had fallen to around 54% to 56% in 1998 to 2005.
9. The country with the biggest exposure in the Philippines had been Japan (Annex B). The official and private creditors of Japan hold around 23% of the Philippines’ external debt in 2005. A far second is the US, with 6.4% of the foreign debt in 2005. Third and fourth are Germany and France with, respectively, 5.6% and 4.5% of the foreign debt in 2005.
10. In terms of bilateral official debts, Annex C gives us the bilateral debts of the creditor countries from 1996 to 2005. It can be seen that Japan far outstrips any country (comprising almost 80% of total bilateral debt in 2005). Germany and USA come as poor seconds (with 6.8% and 6.6%, respectively of total bilateral debt in 2006). Other top creditor countries are Finland, China, Australia, France, Spain and Canada.
11. It must be emphasized that Annexes B1 to B3 and Annex C show very clearly that multilateral and bilateral debts – which make up the external and official development assistance of the country – had gone down starting 2004 and fell very sharply in 2005. 2004 saw a 6.5% fall in multilateral debt stock, and a 0.6% fall in bilateral debt stock. In 2005, there was a 12.9% fall in the multilateral debt stock and a 15% fall in the bilateral debt stock. Total bilateral and multilateral debt stock fell 2.7% in 2004 and 14.3% in 2005. This means that there had been higher repayments of bilateral and multilateral debts than new external development assistance coming into the country – leading to net capital outflows on this item. The repayments in 2005 were quite consciously made by the Philippine government (as many indebted emerging markets decided to advance payments of their debts). But this simply means that given the fiscal bind of the Philippines, precious resources are being diverted away from MDG financing. The situation calls for an increased combination of positive net external development assistance inflows in the country and debt reduction so that debt service funds are re-channeled to MDG financing.

86
12. The term structure of Philippine external debt from 1990 to 2005 was mainly medium and long term, comprising 85% to more than 90% of the total (Annex D). This is especially true for the public external debts. The biggest exposure to short term debt occurred prior to and during the Asian crisis (1996 and 1997) when short term debt reached almost 15% of the total.
13. Annex E gives us in more detail the term structure of the Philippine external debt by creditor and by borrower as of end-March 2006. It shows us that the public sector’s maturity is much longer than the private sector’s. Only 1.9% of the total public external debt is short-term (due in one year or less) compared to 31% for the private sector external debt. Medium term loans due in one to five years make up 6.7% of the public sector external debt compared to 17.4% for the private sector external debt. Long-term debts of more than five years make up 91.4% of public sector external debt compared to 51.6% of private sector external debt. On the average, the medium and long-term debts of the public sector have an average maturity of 20 years, compared to 10.2 years for the private sector.
14. Table 5.4 shows us that the current situation had improved considerably from the debt overhang days of the early 1990s. Then, short-term debt ratio to gross international reserves was more than 300% in 1990 and more than 95% in 1991 to 1993. The situation improved considerably in succeeding years, but increased again to more than 85% in 1997, when the Asian crisis erupted. The ratio fell in succeeding years, fluctuating recently around 40%.
15. Table 5.4 also shows the picture of the external debt service ratio as a percentage of exports of goods and services plus foreign income. From almost 25% of current account receipts in 1990 to 1993, the external debt service ratio fell to around 12% in 1998. The ratio increased significantly because of the rise in external debts during 1999 to 2002, reaching 17% of current account receipts in 2002. This started to fall as external debt to GDP ratio fell in recent years, falling to 13.3% of current account receipts in 2005.
It must be pointed out that the shift of composition of the external debt to bondholders (is part and parcel of the ‘emerging market’ syndrome. There will be a demand at home and in the international market for ‘emerging market’ sovereign debt papers. At the same time, the government will want to float such bonds in the international market and at home to try to show the country’s credit worthiness. Many of the bondholders of sovereign debt papers are domestic financial institutions, which we had mentioned are awashed with liquidity, and prefer sovereign bonds to private lending. Annex B shows us that the big rise in bondholders’ share came in 1996 and 1997 and in 2002 to 2005. These are precisely the periods when the ‘emerging market’ syndrome intensified globally. Other advantages given to the shift to bondholders’ share are: 1) bond financing entails less transaction costs and can be undertaken in large bulks and quantities, 2) bond financing is free from conditionalites, which bilateral and multilateral debts require (even if they give more concessional rates).

87
Table 5.4: Short-Term Debt Ratio and External Debt Service Ratio
Short Term Debt Ratio to International Reserves (%)
External Debt Service Ratio to Exports of Goods and Services
1990 338.51 24.14 1991 115.07 20.80 1992 99.61 23.56 1993 95.84 25.34 1994 69.58 17.94 1995 63.49 15.55 1996 54.00 12.71 1997 86.96 11.64 1998 63.15 11.74 1999 37.30 14.63 2000 41.98 12.96 2001 44.52 15.72 2002 41.71 17.08 2003 45.25 15.88 2004 38.47 13.81
2005 40.15 13.33 Source: Bangko Sentral ng Pilipinas, ADB Key Indicators for Asia and the Pacific
All in all, the external debt picture does not indicate that the Philippines is in any grave danger of default or incapacity to pay. The graver picture is in the public sector debt shown in the previous section, both in terms of the measure of the public debt as a percentage to GDP, and the public debt service ratio to government revenues. The decline in government deficits and public debt ratios had led to slight upgrades in the Philippines’ sovereign credit rating. The debt sustainability perception of the Philippines in the international market, using the capacity to pay concept, seems to be improving. But what the international market and credit rating agencies fail to capture is the serious expenditure constriction that is happening because of debt servicing and the threat this poses to meeting the MDG targets. There is, thus, a need to change the traditional debt sustainability concept, which we shall discuss in detail in Chapter 6. This is aggravated by the fact that external development assistance in the last two years had been characterized by net capital flows out of the country. This further reduces the financial resources to fund MDG activities and projects, at a time when emphasis has to be given to MDG goals and targets that are lagging (as was discussed in Chapter 1).

88
Chapter Six: The Prospects of Debt Reduction or Debt Conversions to MDG Financing for Middle-Income Countries
Considering the huge debt stock and increasing debt service burden as discussed in the previous chapter, it is worth exploring what are the possibilities and extent of debt reduction and debt-to-MDG conversions that the Philippines and similar middle-income countries can derive to remove these severe bottlenecks to funding vital MDG needs. 6.1 Debt-to-Equity and Debt-for-Development Swaps Debt conversions emerged in the 1980s as part of mechanisms for settlement of debt owed by developing countries that were unable to service their external debt during the Latin American debt crisis, which also hit the Philippines simultaneous with its economic collapse in 1983-85. Chile was the first country to establish a debt-equity swap program in 1985. The Philippines adopted a debt-equity program in 1987. A debt-equity swap involves selling debt owed by a developing country government to a private sector creditor to an investor in the secondary debt market. Proceeds of the purchase are then converted into equity investment in the debtor country. The first debt-for-nature swap in Bolivia in 1987 led to the introduction of swaps in other sectors such as child development, education, health, environment, community-based. The impact on debt reduction has been far more limited than debt-equity conversions, but these mechanisms generated much-needed funding for development projects. Debt-equity swaps and debt-for-development swaps in the 1980s focused on three-party-transactions involving commercial debt or export credits. In 1990, bilateral debt became eligible for conversion with the introduction of a debt swap clause in Paris Club agreements. Originally intended for lower middle-income countries, it was later extended to low-income countries and to higher middle-income countries. This section focuses on conversion of bilateral debt for MDG financing. While it is part of debt conversions in general, debt-equity is treated separately because of the complexity of the mechanism and the fact that it deals more with commercial debt than bilateral debt. Essential to the debt conversions during the debt crisis is the element of discount. On the one hand, the creditor is willing to accept less than face value for the debt. This is the debt relief or concessional element of a debt conversion. On the other hand, the debtor is willing to repay the debt at an agreed price, but much less than 100% of face value of the original debt. This is the conversion element of the operation. A debt conversion typically involves an external debt, denominated in hard currency, being exchanged for an agreement to pay a price to redeem the debt in local currency that is less than 100% of the original value of the loan. The Philippines implemented debt conversions from the second half of the 1980s to the early 1990s, when it suffered severe debt overhang until the Brady Plan was formulated and implemented. Debt conversion schemes covering commercial and Paris Club debt for the period 1986-1993 totaled US$3.7 billion. (See Table 6.1) Of the total, debt-equity

89
conversions accounted for US$1.9 billion. The debt-equity conversions played an important role in financing the privatization of government assets. Because it was undertaken during crisis periods, the conversions were derived with significant discounts. But, at the same time, because the country was in a debt crisis, the values for the equities of privatized government assets were also very low (‘firesale price’ became a term used for such sales during crisis periods). The rest, US$1.8 billion, was in the form of debt-for-asset, debt-for-debt, debt-for-note, debt-for-nature and other forms of swaps. More important to the Philippine in terms of debt reduction is debt-buy-back (where the Philippine government bought back their debts at high discounts in the secondary market), which accounted for US$2.7 billion. The debt-to-development and debt-to-nature type of swaps amounted to even smaller amounts and is lumped in Table 6.1 under ‘Others’ (much less than the P800 million total for ‘Others’). Still these debt conversions were able to finance important institutions for the development and environmental protection of the country. (See Box 6.1 below) The Philippine International Trade Corporation (PITC) has also been active with debt-to-goods conversions. This entails government debt to be fully or partially paid with Philippine goods rather than actual cash payment. As of end-2005, PITC has retired $40.3 million of Philippine debts in this manner. The advantage is that this method of paying foreign debts does not entail using up fiscal and foreign exchange resources of the country. PITC has also been active in the promotion of debt-to-development conversions. PITC requested in 2005 the Italian government to convert $38.7 million export-credit debt of NAPOCOR owed to Mediocredito Centrale for a debt-to-development conversion (also see Table 6.4). The negotiation is stalled due to the stringent Paris Club rule requiring an IMF debt sustainability assessment in order for debts outside an active Paris Club debt treatment (and after the cut-off date) to be reduced or converted. This will be explained in detail in a following section. At the global level, the amounts of sovereign debt conversions are also modest. From 1991 to 2005, debt with total face value of US$5.6 billion has been swapped by Paris Club members compared with US$100 billion of debt cancelled (mostly for indebted least developed countries, which the Philippines is not part of). (Fayolle, 2006) Of total debt conversion, US$2.6 billion was in the form of debt-for-nature or debt-for-development swaps while debt-equity conversions accounted for US$3 billion. Introduced in 1990 for debt eligible for Paris Club treatment, debt swaps peaked in the mid-1990s, averaging US$650 million annually. In the last three years, annual debt swaps have stabilized at US$300 million of debt. Of the total debt swapped during that period, US$654 million was done through debt-for-aid or debt-for-nature schemes, with Germany, Italy, Spain and the United States accounting for 97% of this amount. The resulting aid flows went to two regions: Middle East and North African countries (50%), and Latin America (49%).

90
6.2 Benefits of Debt-to-Development and Debt-to-Nature Conversions The benefits of debt conversions programs are well-known, including debt reduction, balance of payment relief, investment promotion, and funding for development programs. The potential risks of conversions schemes on the budget deficit, inflation, policy conditionalities, or round-tripping by investors can be addressed through careful design of programs and strong monitoring and regulation of the use of debt conversion proceeds. Compared with straightforward grants, the conventional source of external financing for MDG programs, debt conversions possess a few advantages. (Fayolle, 2006) First, debt swaps may provide longer-term commitment of donors. Because repayment schedules are typically stretched over a long time, debt conversion allows creditors to commit aid (equivalent to foregone payments) on a long-term basis, securing funding for long term aid programs. This holds, of course, only to the extent that the debtor country abides by the debt swap agreement. Second, debt swaps generate instant cash in the beneficiary country and in local currency, as appropriated amounts for debt servicing are released for MDG and social projects. However, the cash can be dissipated or misappropriated; that is why a monitoring structure is sometimes establish to allow the creditor, the debtor and the public to monitor the use of the proceeds and the effectiveness of the project. Third, aid generated through a debt swap is less tied, hence possibly less costly than new grants, although as noted above, debt swap agreements may also come with policy conditionalities that are not without cost. (Result of consultation with Ernest Leung, former Department of Finance Undersecretary). 6.4 Paris Club Debt Conversion Conversion of bilateral debt is implemented as part of a Paris Club debt treatment. (UNCTAD, 2001) The Paris Club is the forum where major creditor countries negotiate terms for restructuring or resolving official government-to-government debt. It is an informal arrangement among creditor countries to abide by a fixed set of rules and principles for debt relief that have been agreed on by its members. The most organized of developed country creditors, and includes the major industrialized countries, the Paris Club starts debt relief negotiations and establishes the precedents for other bilateral and commercial creditors. 6.3.1 The Need for an IMF Debt Sustainability Assessment and an IMF-Supported Program The first requirement for a debt treatment is a debt sustainability assessment conducted by the International Monetary Fund (IMF) showing that the debtor country is not able to meet its debt obligations and thus needs a new payment arrangement with its external creditors. If the financing gap is deemed temporary, then the country is subject to a flow treatment

91
wherein payments falling due to Paris Club creditors during the period when a financing gap exists are consolidated and rescheduled.
Box 6.1: Philippine Debt-to-Nature and Debt-to-Development Swaps The debt swap schemes came up with some important debt-to-nature and debt-to-nature arrangements that ultimately resulted in beneficial outcomes for the Philippines. 1) The Foundation for the Philippine Environment In 1991, the USAID signed a cooperative agreement with the World Wildlife Fund (WWF) making the latter the trustee of an environment endowment. Pursuant to the agreement, the WWF bought Philippine debt papers in the international market and exchanged these for peso-denominated Central Bank bonds. This amount, together with a donation from the Bank of Tokyo and further grants from the USAID, all totaling US$21.2 million was used to establish the Foundation for the Philippine Environment (FPE) in 1992. The FPE used the endowment to give grants to Philippine non-government and peoples’ organizations for biodiversity conservation projects. 2) The Foundation for a Sustainable Society, Incorporated (FSSI) To celebrate the Swiss Confederation’s 700th anniversary, the Swiss government established the Swiss Debt Reduction Facility aimed at reducing the debt of developing countries through “creative debt relief” schemes. Through this facility, the Swiss and Philippine governments signed on August 11, 1995 an External Debt Reduction Agreement whereby 42,436,551.80 Swiss francs worth of Philippine bilateral debt to Switzerland was cancelled and a Peso fund equivalent to 50% of the face value of the debt cancelled was set aside by the Philippine government to finance development projects. This peso fund became the endowment of the Foundation for a Sustainable Society, Incorporated (FSSI) which was formally registered on 6 September 1995. In 2004, FSSI approved 48 new projects comprising 10 loan assistance; 10 development deposits; 2 joint ventures and 26 grant assistance. Project proponents included 24 NGOs; 10 cooperatives, 3 rural banks, 3 cooperative banks, 3 private enterprises, 2 Peoples Organization and 1 credit union. 3) Debt-for-Mt. Pinatubo Victims In 1991, the French Government agreed to write off 20 million French francs with the Philippine Government so that the latter can put an equivalent amount to rehabilitate areas hard-hit by the eruption of Mt. Pinatubo. The major project undertaken was the construction of Camp O’ Donnel in Tarlac – which became the resettlement area for the Mt. Pinatubo victims.

92
Box 6.1: Philippine Debt-to-Nature and Debt-to-Development Swaps (cont.)
4) RP-KFW Debt for Nature Swap On 31 October 1996, the Kreditanstalt fur Wiederaufbau (KFW) and the Philippine government through the finance department signed a Separate Arrangement Agreement whereby up to 6,531,776.70 Euros (DM 12,775,044.82) of Philippine bilateral debt to KFW will be cancelled as soon as the Philippines put up not later than 31 March 2002 an amount in pesos equivalent to 30% of the to be cancelled debt for a project mutually approved by both parties. The separate agreement implemented two Debt Rescheduling Agreements earlier signed in 1992 and 1993. In January 2002, the Department of Environment and Natural Resources (DENR) completed the agreed undertakings in January 2002 and after due evaluation by the KFW, the German government informed the Philippine government that effective 5 February 2002, GOP debt to KFW amounting to 6,531,776.70 Euros (DM12,775,044.82), including interest accrued thereon, was completely written off. The DENR used the peso fund for a community-based forestry management project covering 10 barangays in Quirino Province, adjacent to an on-going German funded grant on Community Forestry. 5) Tropical Forest Conservation Fund In 2001 the Philippines and the U.S. governments signed a Debt Reduction Agreement and a Forest Conservation Agreement under the debt reduction/rescheduling scheme of the U.S. Tropical Forest Conservation Act (TFCA) of 1998. Under the agreements, the Philippines, instead of paying the accumulated interest totaling US$8,247,538.00 on eight (8) loans contracted from the US before 1 January 1998, would use the peso equivalents to endow the Tropical Forest Conservation (TFC) Fund. Payments to the fund will be done in 28 semi-annual payments starting 2003. The Philippines will continue to pay the principal in dollars based on the original amortization schedule while the US appropriated US$5.5 million for the interest payment. The Fund, now totalling P137,414,697.05 as of 1 December 2004, will be used for forest conservation projects. Although the funds did not involve large amounts compared to the total external debt, they were able to fund worthwhile projects that advanced the MDGs. It is these types of arrangements that this paper would like to encourage so that the amount involved would be bigger and the projects covered would be much deeper, wider and broader.

93
Table 6.1: Philippine Debt Swaps under Various Schemes, 1986 to 1993 (in million US dollars) 1986-1993 1986 1987 1988 1989 1990 1991 1992 1993 Debt to equity conversion 1,870 15 267 635 181 140 286 150 196
Registered 1/ 1,520 15 267 456 105 115 239 130 193 Excluded invested 2/ 350 0 0 179 76 25 47 20 3
Debt for Asset swap 3/ 414 0 0 109 122 147 36 0 0 Debt for Debt swap 415 0 3 12 87 82 119 112 0 Debt for Note swap 153 0 0 0 152 1 0 0 0 Debt Buy-Back 2,715 0 0 0 0 1,335 100 1,263 17 Others (debt-for-nature, debt-for-bond, peso payments, offsets, donations) 815 66 180 175 88 8 48 117 133
Grand Total 6,382 81 450 931 630 1,713 589 1,642 346 1/ Includes $51.344 million debt converted into equity under CB Circular No. 1111 for which investment is temporarily placed in CB bills. 2/ Equity investments under Section 11 of CB Circular No. 1111 which are not entitled to CB registration or to capital/dividends repatriation anytime in the future. 3/ Effective December 1991 and pursuant to R.A. No. 7181, sales of assets under the Asset Privatization Trust should be settled in cash or in Land Bank bonds. Note: Figures for registered debt-to-equity conversion for the years 1991 and 1992 are based on closed bids under CB Circular No. 1267. Source: Excerpt of 1993 Central Bank 45th Annual Report, Vol. 1, p. 31.
If the IMF assessment shows that the debtor country’s resources are not sufficient to generate payments for its debt stock, then the country is given a debt stock treatment. In this case, the treatment applies not only to the payments falling due in a particular period of time but also to the entire stock of debt from which those payments fall due, in other words, debt reduction. In either case, an IMF-approved economic program becomes a requirement for debt treatments – a sort of conditionality required by the Paris Club members to ensure that the debtor country will undertake the ‘proper’ reforms and policies to avoid another liquidity or insolvency situation.

94
The IMF debt sustainability assessment is based on the capacity to pay. Thus the indicators used to determine whether a country has problem paying its external debt is based on such measures as (net present value of) debt to exports ratio, (net present value of) debt to government revenue ratio, (net present value of) debt to GDP ratio, external debt service ratio to exports or current account receipts, public debt service ratio to government revenues, and the like. 6.3.2 An IMF Debt Sustainability Assessment May Jeopardize Country’s Credit Worthiness Because the IMF debt sustainability assessment deals with the debtor country’s ‘capacity to pay’ the act of going to the Paris Club to negotiate for debt restructuring or debt reduction is deemed as sending the ‘wrong signal’ to financial markets and can hurt the country’s creditworthiness, possibly raising the cost of borrowing. The wrong signal is made operational by one of the principles adhered to by the Paris Club, namely, the principle of comparable treatment. A debtor country obtaining debt relief from creditor governments through the Paris Club process is required to obtain comparable relief from their commercial bank creditors. For example, if a debtor country obtains 60% reduction of its outstanding debt with Paris Club members, it must negotiate with its non-Paris Club official creditors as well as commercial creditors for debt reduction of the same magnitude. The Paris Club calls this burden sharing. 6.3.3 Limits on ODA and non-ODA debt Debt swaps are authorized through specific clause in Paris Club Agreed Minutes (the outcome of negotiations between the debtor and Paris Club members) which states that creditors may “sell or exchange [the eligible debt], in the framework of debt for nature, debt for aid, debt for equity swaps or other local currency debt swaps”. This clause, however, is implemented bilaterally and on a voluntary basis. The debtor country must negotiate separately with each creditor as to implementation of the debt swap clause. As discussed below, not all countries participate in debt conversions, thus limiting the volume of eligible debt. Paris Club rules set a ceiling on what debts can be converted. In the case of ODA debt, there are no limits on the amount that can be converted. In the case of non-ODA debt—debts held by export credit agencies or government guaranteed commercial debt—the limit is set at 20%, possibly 30%, for low income countries, and 10% up to 30% for middle higher income countries. The ceiling for non-ODA debt, in principle, limits the participation of third party investors since ODA debt is not normally sold. 6.3.4 The Cut-Off Date The debt treatment that a debtor country is given has a cut-off date. Debts identified by the Paris Club before the cut-off date are subject to the debt treatment, whether it be debt rescheduling or debt reduction. The clause allowing debt conversions by Paris Club members would involve only debts covered by that treatment (i.e., before the cut-off date).

95
This constrains the amount of debt conversions available for countries seeking debt conversions. For example, the Philippines’ cut-off date of its active Paris Club debt treatment (undertaken in 1994) is April 1, 1984. Thus based on the Paris Club rules, only the identified debts incurred before April 1, 1984 are eligible for conversions by Paris Club members. Obviously, this amount is very little since much of the debts incurred before April 1, 1984 would have been paid already. Table 6.2 gives the outstanding amount of the active debt treatment in 1994 (comprising bilateral debts incurred before April 1, 1984). Only $646.83 million debts remain unpaid as of June 30, 2005. From this we deduct the debts owed to Japan and Austria – which do not undertake debt conversions – and the non-ODA of Germany, Canada and Denmark, which these countries prohibit from being converted. The remaining amount is only $204.5 million possible for debt conversion, and much of this is due in 2006 and 2007. 6.4 Creditor Countries’ Policies on Debt Conversions A second consideration in looking at the potential of Paris Club debt conversion is the policies of individual creditor governments, especially those with significant exposure to the country. To the extent that creditor governments have different attitudes and policies towards debt swaps, this sets a ceiling as to what debts can actually rather than potentially be swapped. Differences in policies towards debt swaps pose a major obstacle to arranging multilateral debt conversion. Table 6.3 summarizes the policies of Paris Club members vis a vis debt conversion. (Pettifor, et al (2005)) Notable is the non-participation of Japan, by far the largest official creditor of the Philippines, accounting for 85% of total bilateral debt as of June 2005. It is also the biggest official creditor for Indonesia and many countries in Asia and the Pacific. Japan’s official position is that it does not implement debt conversions except on an occasional bilateral basis. In the wake of the East Asian financial crisis, for example, Japan allowed debt conversion in order to ease the balance of payments burden faced by the Indonesian economy at that time. Japan prefers grant aid to debt conversion, possibly due to commercial interests. Two other countries that do not participate in debt swaps are Austria and Australia. Australia is the Philippines’ sixth top creditor country, with debts owed to it amounting to around $175 million as of end-2005. The US, the Philippines’ third biggest bilateral creditor, allows debt conversion on a limited basis. US law requires appropriation for the cost of cancellation, which includes foregone interest earnings and the difference in the net present value of the loan that may result from restructuring. The Tropical Forests Conservation Act (TFCA) of 1998 appropriates fund for debts swaps dedicated to conservation of tropical forests. In addition, the USAID has a discretionary fund that can be used for ODA debt conversion.

96
Table 6.2 Outstanding Loans Restructured in 1994 Under Paris Club as of 30 June 2005 (in million US dollars) Loans Restructured under PC 1-4 ODA Non-ODA
Creditor Country Grand Total Grant Non-Grant
Export Credit
Agencies Others TOTAL 646.83 275.42 294.82 76.59
Japan 404.72 233.6 119.64 51.48 Germany 11.01 11.01 US 126.48 35.37 76.38 14.73 Finland 1.22 1.22 France 11.6 1.94 4.82 4.84 Canada 1.79 1.79 Spain 24.04 1.36 22.68 United Kingdom 10.53 1.11 9.42 Italy 9.52 9.52 Belgium 19.16 0.11 19.05 Austria 19.29 19.29 Denmark 7.47 1.93 5.54
Available for conversion* 204.48 41.82 161.16 25.11 of which the US: 126.48 35.37 76.38 14.73
*Excludes Japan and Austria which do not undertake debt conversions and non-ODA of
Germany, Canada and Denmark, which are not allowed to be converted Source: Bangko Sentral ng Pilipinas, International Department

97
France, the seventh biggest of France, the seventh biggest official creditor, limits debt-for-development swaps to HIPC countries, while most other conversion are private sector equity swaps. France did conclude a debt swap with the Philippine government to finance rehabilitation of victims of the Mt Pinatubo eruption in 1990. Germany – the second largest creditor country -- and Spain and Canada -- two of the Philippines’ top ten creditor countries -- participate in debt conversion but only as far as ODA debt is concerned; non-ODA debt is not eligible. There are various reasons for creditor countries’ reluctance to participate in debt-to-development and debt-to-MDG financing schemes. Even those who participate usually do
Table 6.3: Paris Club Creditor Countries and the Bilateral Debt Available for Conversions
COUNTRY Participates in Debt Conversion ODA Debt Eligible Non-ODA Debt Eligible USA Yes1/ Yes Yes Japan No No No United Kingdom Yes Yes Yes Germany Yes Yes No Denmark Yes Yes No2/ France Yes Yes Yes3/ Italy Yes Yes Yes Netherlands Yes Yes No4/ Canada Yes Yes No Belgium Yes Yes Yes Austria No No No Australia No No No Russia Yes Yes N/A Sweden Yes Yes Yes Finland Yes Yes Yes Spain Yes Yes N/A Debt conversion possible Debt conversion with limitations No debt conversion
1/ This is restricted to certain types of debt swaps for specific regions only, as converted by the EAI and TFCA legislation. 2/ The Danish ECA is, however, open to the possibility of debt sales for defaulted export credits. Though as a rule it does not engage in debt sales for conversions, it is willing to consider debt purchases by third-party investors that it regards as viable.
3/ Only HIPC countries are considered for debt-for-development swaps; most other conversions are private sector equity swaps.
4/ The Dutch ECA is currently engaged in a pilot debt swap scheme and will re-evaluate its debt swap policy based on the pilot's outcome.
Source: Pettifor, et al (2005)

98
not put too much of their loans into debt conversion schemes. First, the creditor countries have to explain these swaps and conversions (tantamount to debt reduction) to their citizens and taxpayers from where the money came from. Oftentimes approval of debt conversion schemes for the creditor countries would entail going through legislative and budget approval at home. These processes may take some time and reduce the amount of conversions that are undertaken. Second, some creditor countries use ODA and export credits to promote their own firms through what has been called as tied aid. These countries, whose objective in providing ODA and export credits is not necessarily humanitarian, would most likely not view bilateral debt conversion (tantamount to debt reduction) positively. Finally, as mentioned earlier, the Paris Club rules limit the amount of debts eligible for debt conversion. Most importantly, countries facing default problems and capacity to pay are given priority for debt restructuring and debt treatments. The Paris Club rules allow debt conversions only to the debts that are rescheduled and restructured. This does not allow countries which did not recently get debt treatments to avail of Paris Club debt conversions unless they ask for an IMF debt sustainability assessment and Paris Club debt restructuring. Few countries would want to do this and risk adversely affecting their credit worthiness and rattling the financial markets. All the creditor countries’ arguments for approaching debt reduction and debt conversions cautiously should be weighed against their strong commitments to MDGs and the Financing for Development (FfD), which requires them to spend 0.7% of their GNP on external development assistance to developing countries. As we will discuss later this has not been complied with by all the developed countries, except five countries. There is a way of the Philippines asking for an extension of the cut-off dates. This is through the Evian Approach of the Paris Club (See following Box 6.2). Although the Evian Approach on paper allows countries like the Philippines to apply for better terms in debt reduction and debt conversions, it requires the Philippines to still apply for an IMF debt sustainability analysis, which may adversely affect the country’s credit worthiness and financial markets. 6.5 Creditor Countries’, UN and Paris Club’s Responses to Philippine Debt-to-
MDG Financing Proposal The Paris Club rule is indeed a big obstacle to the debt conversions. Table 6.4 gives us some of the responses of countries and other entities (the UN Secretary General and the Paris Club Chair) to the Debt-to-MDG Financing proposal presented by the Philippines to the UN in October 2005. (Most of the responses came from comments and reactions to letters sent by the Speaker of the House or by the Department of Foreign Affairs to the various embassies and entities concerning the Philippine Debt-to-MDG Financing proposal).

99
With the exception of the response of UN Secretary General Kofi Annan, most of the responses advised the Philippines to either: a) Follow Paris Club rules, which is to use the Evian Approach, ask an IMF debt
sustainability assessment and a new Paris Club restructuring; b) Give up on the idea because:
i) it would result in negative impact on credit worthiness of the country (Spain, Sweden),
ii) the country requires policies other than debt conversion (Japan). iii) France and Italy assert that debt conversions using the cut-off date of the Paris
Club rule will yield amounts too little to even consider.
Box 6.2: The Evian Approach The Evian Approach adopted by the Paris Club in October 2003 provides a framework to deal with all non-HIPC countries with the aim of making the resolution of crises “more orderly, timely and predictable”. It formalizes the more flexible debt relief arrangements seen in the treatments given to Pakistan and Iraq under ad-hoc terms. It aims to ensure that debt restructuring is granted only in case of imminent default. At the same debt restructuring aims to ensure long lasting debt sustainability in debtor countries. The Evian approach requires a standard debt sustainability analysis to be conducted by the IMF not only to assess the financing gap but also to see whether there might be a sustainability concern. (Paris Club website) If a country is determined to be facing a liquidity problem but have sustainable debt going forward, then the existing terms are applied. If the country’s debt is deemed unsustainable, then a comprehensive treatment is designed. Eligibility to a comprehensive treatment is still decided on a case-by-case basis. Besides flow treatment and debt restructuring, a comprehensive debt treatment may include debt reduction, although this is considered only in exceptional cases and when the need is clearly demonstrated in the debt sustainability analysis. While debt reduction is not entirely new to middle-income countries, this has been on a purely ad hoc basis in the past, driven as much by geo-political concerns as concerns over debt sustainability. Still, the option of debt reduction for middle-income countries and the introduction of long-term debt sustainability as a criterion for debt relief assessments mark key improvements over previous approaches. Debt reduction in countries with sustainability problems is to take place in three stages linked to the debtor’s track record in adhering to IMF conditionalities and the debt repayment schedule. In the first stage, which may last between one and three years, a flow treatment is granted. This stage allows the debtor country to establish a track record. In the second and third stages, the country receives “exit treatment” based on debt reduction contingent on implementation of the IMF program and a satisfactory payment record with the Paris Club.

100
A comprehensive debt treatment could comprise flexible instruments such as debt buyback, debt swaps and debt relief and contingency clauses referring to debt relief that is activated or terminated by special triggers. In the past, debt conversion was a voluntary option to be negotiated on a bilateral basis. Under the Evian approach debt swaps can be incorporated as part and not merely on top of Paris Club agreements, opening the possibility of multilaterally coordinated debt swaps whereby debt is forgiven on condition that the debtor country uses the freed-up funds to carry out development or environmental projects. The adjustment of cut-off dates is a welcome feature of the Evian approach, which puts in writing an ad-hoc practice in the past. Old cut-off dates, sometimes 10 or 20 years old, restricts the volume of debt eligible for rescheduling or conversion. Adjustment will pay specific attention to the ‘age’ of the date, the consistency between the cut-off date and the financial crisis cycle, the share of post cut-off date debt, the age of this post-cut-off debt and burden-sharing among creditors. Finally, the Evian approach recognizes the problem posed by the principle of comparable treatment and calls for closer coordination with commercial creditors when this poses a challenge and where debt reduction is envisaged. It encourages coordination through preliminary meetings to exchange information, views and positions prior to the respective creditor groups’ negotiations with the country concerned. None of these ensure more generous treatment for debtor countries going to the Paris Club for debt relief since the Evian approach does not set new standards and specific rules. Debtors will be treated on a case-by-case basis, clearly a double-edged sword. But it does signify changing views among official creditors and sets new precedents that may create greater space for debt relief.
Recent Paris Club Cases Even with the Evian approach, certain rigidities remain that constrain the possibilities for debt relief under the Paris Club. The requirement that debtor countries must ask for an IMF debt sustainability assessment and pursue an economic reform program in cooperation with the IMF has been strengthened via the stage approach. The use of debt sustainability assessment based on capacity to pay remains, albeit modified by the criterion of long-term sustainability. Because no standard terms have been laid down, actual debt treatment under the Evian approach continues to take shape as it is applied to specific cases. Indeed, recent cases dealt with under the Evian framework contain new features, many of which open up possibilities for deeper debt relief. Iraq’s experience, it has been argued, sets new policy precedents for international debt relief. (Weiss, 2006) The Iraq case shows willingness by the international community to grant a stay on the enforcement of creditor rights to collect unpaid sovereign debt, a sticky point in negotiations for the creation of a Sovereign Debt Restructuring Mechanism (SDRM) by

101
the IMF. The protection to indebted debtors that was rejected in the shooting down of the SDRM in the Bretton Woods meeting of April 2003 was granted to Iraq through a United Nations Security Council Resolution, a radical move in the history of sovereign debt negotiations, according to financial analysts. This measure, however, has not been repeated in other recent financial crisis-afflicted countries, such as Argentina or Brazil, showing that policymakers are only willing to use such measures selectively and for geo-political reasons. It is notable that the stay was implemented through the United Nations, a political institution seen principally as focused on international security rather than the IMF, primarily a financial institution. Following Evian, Paris Club members introduced even greater flexibility by allowing countries to buy back their debt, a policy previously not allowed. Despite initial opposition from Germany, in 2005, Russia was allowed to buyback some of its debt, setting a precedent for others to follow. Russia’s buyback of US$15 billion of its debts at par was notable because no pre-payment penalty was required. Following the Russian agreement, two more buyback deals were reached with Nigeria and Peru. In October 2005, Nigeria was allowed to buy back some of its debt at a deep discount. The Peru buyback, like Russia, was at par, and will lead to Peru pre-paying US$17 billion of its Paris Club debt. Moreover, in the case of Nigeria, the requirement that a debtor country must abide by an IMF program was artificially followed by the IMF program approving Nigeria’s own poverty reduction program. More relevant to the case for debt relief for MDG financing is the fact that Nigeria was not a country in imminent default simply because it has large oil export earnings. However, it has never been far from a being a HIPC because of its low per capita income and its sizeable debt burden, hence considerable support existed for a deep debt reduction. Furthermore, the more democratic regime in Nigeria (after decades of authoritarianism) gave developed countries a geopolitical reason to assist the largest African country, which will be a vital ally in Sub Saharan Africa and a stable source of oil at a time when world oil prices were soaring (Nigeria is the fifth largest oil producer in the world). Even then, the deal for Nigeria was not as attractive as it seems. Although 60% ($18 billion) of its $30 billion foreign debt was written off, it had to pay the remaining $12 billion within six months. Very few indebted countries can come up with $12 billion in six months. In this case, Nigeria had oil reserves at a time when world oil prices were soaring. Thus, just based on the responses of the Paris Club countries, it seems that the main stumbling blocks to effecting significant debt conversions are the Paris Club rule: a) the need for IMF debt sustainability assessment and entry into an IMF-supported
program to extend the cut-off date; or else, b) without asking for an IMF debt assessment, the country is forced to use the old cut-off
date of 1984, which will yield very little eligible debt for conversion.

102
Table 6.4: Responses of Entities Consulted on Debt-to-MDG Approach Entity Consulted Main Position Additional Remarks UN Secretary General Proposes that debt sustainability concept Broadening the scale and scope of debt Kofi Annan should be redefined as the level of debt swaps would help provide debt relief that allows developing countries to achieve and release additional funds for financing the MDGs without an increase in their sustainable activities to attain the MDGs Debt ratios Paris Club Chair Paris Club instruments and Evian approach Xavier Musca are sufficient to address debt situation of
non-HIPC countries, based on debt sustaina-
Bility analysis by the IMF. Debt-to-equity
swaps will occur naturally with private creditors seeking high rates of return.
Japan Does not want to undertake debt conversions for Philippines since it thinks Philippines needs fiscal reforms and debt Management more and it has concern on 'moral hazard' from the Philippine side France Using the Paris Club rule, the pre-cut-off
date of April 1 1984 leaves only a balance of
3.53 million euros and $2.97 million due, adding up to around $7.25 million. They are due in 31 Jan 2006, 31 July 2006 and 31 Jan 2007. The debt is too little and 'almost over'.
Italy Has the same comments as France. The In order to avail of the Evian approach of extending
eligible amount too meager to matter. the cut-off date, the Philippines has to apply for
debt sustainability assessment by the IMF
and another debt treatment from the Paris Club
There was another request by the But this requires again that the Philippines ask
Philippine International Trade Corporation for debt restructuring from the Paris Club to extend
to convert a $38.7M ODA loan of the National
the cut-off date, so that this debt can be eligible
Power Co (NAPOCOR) owed to for conversion. Mediocredito Centrale to a debt-to-develop- ment swap. Italy was willing to discuss this and conversion of other bilateral loans.

103
Table 6.4: Responses of Entities Consulted on Debt-to-MDG Approach (cont.) Entity Consulted Main Position Additional Remarks Germany Positive on debt swap facility: Coverage of eligible debts restricted only to a) to protect and preserve environment bilateral ODA debts that have been rescheduled b) to reduce poverty under an existing or active Paris Club agreement. c) to support education Commercial (non-ODA) debt cannot be swapped due to budgetary and legal restrictions. Implication of eligible debts same as for France and Italy. UK Proposes that the Paris Club consider the debt-to-MDG proposal.
Australia Believes Paris Club and Evian approach best for non-HIPC countries. Supports IMF
debt sustainability assessments. Spain Spain has an active debt conversion Spain can determine whether or not a particular program which includes ODA and Debt conversion program can be done on a export credits, with ceilings of 10% of bilateral basis. If it is multilateral, Spain follows total for export credit. Spain extends the collective decision of the Paris Club. debt for education and other social Spain warns that debt conversion has investments with Latin America its downside for the debtor country -- damage to country's credit rating Sweden Believes Paris Club Evian approach with Advises debt conversion not best way for IMF debt sustainability assessment is non-HIPC countries and may negatively the proper venue affect credit worthiness Norway Says creditor countries back Paris Club Evian approach and will not back alternative approach. Calls for multilaterally coordinated debt-for- development approach instead of bilateral negotiations for debt-for-development. Also supports lifting of cap on non-ODA (commercial) bilateral loans for debt-to- development Belgium Belgium participates in debt conversion: But restricted only to LLDCs a) as part of Paris Club Only non-ODA commercial loans are eligible b) in its devt cooperation programs for debt conversion, because it feels ODA is which buys officially guaranteed already concessionary. commercial debt from the Belgian export But no Belgian laws on debt conversion so it can credit agency in exchange for debtor be pursued on a case-to-case basis country putting local currency in Urges exploring possible debt conversion development projects schemes with Belgian NGOs Canada Supports debt relief strategies But mainly to HIPC countries

104
Table 6.4: Responses of Entities Consulted on Debt-to-MDG Approach (cont.) Entity Consulted Main Position Additional Remarks Netherlands not keen on debt-to-equity scheme USA Senator Inouye praised Speaker de Venecia's through Senator Inouye Debt-to-MDG proposal and had the Speaker's speech printed into the Senate record
Source: Philippine Embassies in the Various Countries, Letters in Response to the Department of Foreign Affairs and to the Office of the Speaker of the House of Representatives
There is still a way out. The Paris Club is an informal organization with informal rules. If countries are sufficiently committed to MDG funding and to the Financing for Development (FfD), the Philippines can approach the countries bilaterally with a list of MDG projects and programs that are convincing enough to possibly persuade them to consider undertaking the debt-to-MDG conversions. We shall tackle this in the last sections of this chapter. 6.6 Other Debt Relief: Debt Reduction and Debt Rescheduling Apart from debt conversions, are there possibilities for the Philippines to get more significant debt relief, debt reduction or debt rescheduling? The Paris Club allows such debt treatments if a country is perceived to have problems in the capacity to pay after an IMF debt sustainability analysis. The Philippines in the 1980s to 1990s was able to get the classic and Houston terms of debt treatments in its decade-long debt crisis. The Houston terms apply for highly indebted middle-income countries like the Philippines and Indonesia.
Table 6.5. List of Paris Club Debt Treatments
Date of treatment Amount ($ m)
Type Cutoff date Debt swaps Status
July 19, 1994 585 Houston April 01, 1984 Yes Active June 20, 1991 1,096 Houston April 01, 1984 Yes Fully paid May 26, 1989 1,859 Classic April 01, 1984 - Fully paid January 22, 1987 870 Classic April 01, 1984 - Fully paid December 20, 1984
1,000 Classic April 01, 1984 - Fully paid
Total 5,350 Source: Paris Club website

105
As the table above shows, the Philippines has gone to the Paris Club for debt rescheduling five times over a period of 10 years since the debt crisis in the mid 1980s. The treatments covered a total face value of $5.4 billion of Paris Club debt incurred before April 1984. The last two treatments were under the so-called Houston terms, which lengthened repayment periods to 20 years with a maximum 10-year grace, reschedules ODA credits at concessional rate, and allows debts on a bilateral and voluntary basis. The last treatment concluded in 1994 remains active to date but the outstanding amount eligible for debt swaps is only $100 million. (DOF). On paper, the Philippines can use the Evian Approach of the Paris Club to get not just debt rescheduling but significant debt reduction like Nigeria and Iraq. However, again it will have to apply for an IMF debt sustainability assessment and enter an IMF-supported program. Most likely, the Houston criteria of debt assessment will be used if the Philippines apply for debt relief from the Paris Club. High indebtedness using the Houston criteria is defined as reaching at least two of the following criteria:
debt to GDP higher than 50%, debt to exports higher than 275%, scheduled debt service over exports higher than 30% have a stock of official bilateral debt of at least 150% of private debt.
The Philippines was able to get all the previous debt treatments from 1984 to 1994 due to satisfying the above definition of high indebtedness. In the last 1994 debt treatment, the Philippines satisfied the debt to GDP higher than 50% and the stock of official bilateral debt being at least 150% of private external debt. The 2005 Philippine figures for the Houston indicators are:
debt to GDP – 53.5% debt to exports – 128.1% scheduled debt service over exports – less than 20% stock of official bilateral debt to private debt – 81%.
Clearly, the latest figures in 2005 show that the Philippines will satisfy only one condition of the Houston terms – debt to GDP higher than 50%. Thus debt treatments such as debt rescheduling or debt reduction will not be given the Philippines even under the Evian approach given the above criteria which emphasizes a country’s capacity to pay, and gives debt treatments only if a country demonstrates a lack of capacity to pay. No consideration is given if debt servicing is retarding financing for the MDGs. 6.7 Responses of Philippine Stakeholders to the Above Situation The responses of the various Philippine stakeholders to the above situation are as follows:

106
Understandably, the economic managers of the country (especially Department of Finance and the Bangko Sentral ng Pilipinas) are wary of shaking the financial markets by asking for an IMF debt sustainability assessment and a new Paris Club restructuring. This is especially true since the current debt sustainability assessment and Paris Club restructuring are based on a concept of debt sustainability that would restructure and give debt relief only to countries with problems in capacity to pay. To offset these negative implications, the Speaker of the House and his economists suggest that we focus on debt-to-equity conversions wherein creditors (whether official or private) will be allowed to convert debts to equities in commercially profitable MDG projects. Suggestions range from ecotourism projects, to the privatization efforts of power corporations, to the development of bio-fuels. The Department of Foreign Affairs see the problems raised above and would like to focus on convincing bilateral creditor countries which will voluntarily agree to convert their bilateral debts to financing priority MDG projects. The National Economic and Development Authority (NEDA) is interested in identifying priority MDG projects under the Medium Term Public Investment Plan (MTPIP) in health, education and poverty reduction to convince bilateral creditors to finance, through ODA or debt conversions, these urgent projects. We had shown in Chapter Four the temporary list of priority MTPIP projects they had identified. The activist Freedom From Debt Coalition (FDC), which is a member of Jubilee South, believes debt conversions always entail very little amounts that do not result in significant debt reduction. They call for a stoppage of payment to questionable or odious debt. They are also calling for a debt audit to ensure proper usage of debt funds, and to determine which debts had been misused and abused. 6.8 The Indonesian Case To illustrate that the need for debt-to-MDG financing goes far beyond the Philippines and cover many middle-income countries, we consider the case of Indonesia and its MDG financing and debt problems. 6.8.1 The Asian Crisis Retarded Poverty Reduction Progress
Indonesia had been touted from the 1980s until the Asian crisis in 1997 as another ‘East Asian Miracle’ in the making. It doubled its GDP per capita from 1970 to 1986, and tripled it from 1970 to 1994. It also reduced its poverty at a remarkable pace as it was being proclaimed as a model of equitable growth and rural industrialization. From 1976 to 1987, for example, the proportion of the population in poverty (based on estimates of expenditures) dropped from 40.1 per cent to 17.4 per cent. From 1987 to 1996, during a major process of economic liberalization, the rate of decline of poverty continued but slowed somewhat, dropping from 17.4 percent to 11.3 percent.

107
But the Asian crisis that hit Indonesia in the second half of 1997 to 1999 had reduced this image as Indonesia became the worst hit country in the crisis, falling more than 14% in GDP per capita in 1998. Banks and conglomerates crumbled and collapsed, and had to undergo painful rehabilitation for at least five more years. All poverty estimates above show a drastic reversal in poverty reduction during the Asian crisis. The national poverty line shows a doubling of the percentage falling below the poverty line from 1996 to September 1998. By 2002, poverty incidence still registered 18.2%, still higher than the 17.7% in 1996. Thus Indonesia lost at least six years in its struggle against poverty because of the Asian crisis.
6.8.2 No Debt Reduction for Indonesia During the Asian Crisis
In the worst period of the Asian crisis, Indonesia never got any debt reduction. It only got debt reschedulings for debts totaling around $15 billion between 1998 and 2002, under the classic and Houston terms rescheduling maturing debt payments from 15 to 20 years.
In all the debt treatments from 1998 onwards, rescheduled ODA debts required interest payments at concessional rates (maximum of the original ODA concessional interest rates), while non-ODA debts required interest payments at market rates.
Since Indonesia was compelled to pay the interest payments for the rescheduled debts, there was effectively no debt reduction but just an extension of the period for the principal debt payments. The extension will incur additional interest payments that Indonesia had to pay as the principal payments will be servicing the debts over a longer period of time.
In May 10, 2005, Indonesia got a special ad-hoc debt treatment from the Paris Club to alleviate Indonesia’s debt burden after the tsunami of December 2004. Indonesia’s $2.704 billion debts due between Jan. 1, 2005 to Dec. 31, 2005 were rescheduled with both ODA and non-ODA credits rescheduled over 5 years with a 2-year grace period. This debt treatment fell far short of the debt reductions some Western countries were recommending for the tsunami-hit countries. One can compare the debt treatment with the 1998, 2000, and 2002 debt treatments, and one can see that the treatment in 2005 involved a much shorter period of rescheduling than the previous debt treatments. Again Indonesia did not get any significant debt reduction since it has to pay the current interest payments for the debts that were rescheduled.
In summary, it must be emphasized that the debt treatments that Indonesia got in 1998, 2000, 2002 and 2005 were only rescheduling of debts, extending principal payment over a longer period, but keeping interest rate payments current. The creditor is paid for extending the period of repayment since it effectively increases the time period interest payments are made.

108
6.8.3 Indonesia’s Debt and Fiscal Position Better Than the Philippines’ Table 6.6 shows that the Philippines’ current fiscal, external debt and public debt servicing indicators are far worse than Indonesia’s in the recent years, even if Indonesia suffered more in the Asian crisis. The Philippine budget deficits are higher than Indonesia’s. External debt to GDP ratio for Indonesia is below 50% in 2005, compared to 53.5% for the Philippines. Indonesia’s principal and interest payments make up almost 40% of national government revenues in 2005 compared to 85% for the Philippines. In both cases, debt servicing is quite severe and is putting pressures on economic and social services.
Source: Bank Indonesia, Ministry of Finance of Indonesia, Bangko Sentral ng Pilipinas, Bureau
of Treasury, Philippines
6.8.4 MDG Targets Also Lagging Behind in Indonesia Despite the financial crisis setback, Indonesia’s MDG Report 2004 claims that Indonesia is still on track to attain the targeted poverty reduction to achieve the MDG target in 2015. However, this is true only for the national picture. Many provinces and regions are far behind the national average and many of these are the regions with insurgencies and secessionist movements. A full 42% of Papua’s population is below the poverty line in 2002. In the same year, a full one-third of the population of Maluku, Gorontalo, East and West Nusa Tenggara and Aceh are below the poverty line. Conflict-torn Aceh saw a big deterioration in its poverty incidence. From 12.7% of the population falling below the poverty line in 1996, poverty worsened in succeeding years to reach 30% of the population by 2002. And this is three years before the big tsunami that devastated the province.
Table 6.6: Indonesian and Philippine Fiscal and Debt Indicators Indonesia 2000 2001 2002 2003 2004 2005 External Debt (% of GDP) 97.83 82.17 63.02 56.29 56.28 48.07 Government Deficit (% of GDP) -1.16 -2.40 -1.27 -1.72 -1.26 Government Principal and 32.72 34.32 36.20 31.77 39.90
Interest Debt Servicing (as % of GDP)
Philippines External Debt (% of GDP) 76.32 73.47 71.86 74.29 63.94 53.46 Government Deficit (% of GDP) -4.00 -4.00 -5.30 -4.70 -3.90 -2.70 Government Principal and 44.26 48.68 63.12 75.01 85.98 85.32
Interest Debt Servicing (as % of GDP)

109
Furthermore, to show that the impact of the financial crisis still lingers, the poverty gap increased from 1996 from 1.8% of the poverty-line income to 4.3% in 1999. Poverty gap is a measure of how far below the poverty line the average poor person’s income is. The poverty gap remains above the 1996 level in 2002 (3% in 2002 versus 1.8% in 1996). The poverty gaps of the majority of provinces are still worse in 2002 than in 1996. Thus the depth of poverty is worse in recent years than before the financial crisis. Again Aceh is one province where the poverty gap deteriorated consistently from 1996, to 1999, and to 2002. The provinces identified previously as the ones with high poverty incidence (Papua, Maluku, Gorontalo, East and West Nusa Tenggara and Aceh) are also some of the provinces with very high poverty gaps. It is not surprising that there are insurgencies and conflicts in some of these areas. The targets for malnourished children as measured by the prevalence of underweight children hardly improved from the mid-1990s to 2002. 31.6% of all children were underweight in 1995. This improved only to 27.3% in 2002, with hardly any improvements made from 1998 to 2002. This is a very serious situation as more than a quarter of children are underweight in Indonesia. The above situation is not surprising given that the percentage of the population below the minimum level of energy consumption had hardly improved from 1990 (69.5%) to 2002 (64.2%). Even more disturbing is that this figure moves in a volatile fashion and had deteriorated to over 70% in 1993 and 1999 (the latter as a result of the Asian crisis). The picture that is shown here is an urgent need to address malnutrition among the population, especially the children. MDG Goal 5 is in great jeopardy as available indicators seem to indicate that maternal mortality had not improved from 1990 to 2002. There were 390 maternal deaths per 100,000 live births in 1990. This improved very marginally to 307 maternal deaths per 100,000 live births in 2002. Much have to be done in order to prevent both maternal and infant mortalities in the pregnancies in poor and far-flung areas. For MDG Goal 7, sustainable access to improved water source did not improve significantly in the 1990s and 50% of the population are still deprived from this access in 2002. Similarly, access to improved sanitation hardly improved in the late 1990s to 2002, with more than one-third of the population (37%) not having this access in 2002. Obviously programs to improve water sources and sanitation have to be undertaken in poor and far-flung neighborhoods.
6.8.5 German Debt Conversions for Education and Nature: A Genuine Debt Reduction for MDG Financing
There are some exemplary attempts to reduce Indonesian debts and convert them to MDG-related projects. Between 2000 to 2003, the Indonesian government and Germany, through the German bank, KfW (Kreditanstalt fur Wiederaufbau), negotiated the debt

110
conversion of 48 million euros (equivalent to Rp 505 billion, or $57.6 million11) of debts due to Germany for the development of elementary education learning research centers. This consisted of the establishment of 511 science and technology study centers to be built in 17 provinces for the training and improvement of elementary teachers’ capacities.
In 2004, 23 million euros of Germany’s debt (around Rp 253 billion, or around $27.6 million12) was converted to funds to build junior high schools in 54 regions in 14 provinces in Eastern Indonesia (again in negotiations with KfW).
The two governments had began to establish another debt conversion scheme to convert 25 million euros (around Rp 275 billion and $ 30 million13 and again with KfW representing Germany) for a debt for nature swap concentrating on natural resources conservation.
In all these conversions, the agreement has been that the Indonesian government will have to provide the rupiah funds for the identified projects amounting to 50% of the debts to be cancelled. This effectively gives a debt discount of 50%. The debt conversions further allows what would have been part of the debt service payments to Germany in the years 2002 to 2006 to be re-channeled to the financing of educational facilities in depressed areas of Indonesia and of natural resource conservation in areas to be identified.
The UNDP Indonesia Office consulted with Mr. Keifer, director of KfW, the German bank that is managing the debt swap project for the German Government. The results of the consultation yielded the following information: 1. The Germans are quite satisfied with the debt swaps and the implementation of the
projects by the government counterparts. They are still waiting for the evaluation report of the projects.
2. Even if the amounts were small compared to total German debt (see following section), the success of the debt conversions can be used as a showpiece to attract media attention and to encourage Germany and other countries to seriously consider using more debt service funds or new ODA money for MDG-related projects
3. In terms of the debt cancellation, once the debt swap agreement is signed, the amount is deducted from the total debt owed by the Government of Indonesia (GOI) and the repayments are adjusted accordingly. However, if the government fails to deliver the rupiah funding of the projects or implements the projects badly, the German government can add the amounts back to the overall debt that Germany has to repay.
4. Project identification is done by the GOI. The GOI decides what its priorities are and how it wants to use the funds from the debt swap.
5. The Germans don't have any immediate plans to involve more debt conversion funds from the approximately $115 million debt stock to be cancelled from the conversions described above.
11 Assuming crudely an exchange rate of $1.2 to one euro – which is more or less the prevailing rate in early 2006. 12 Ibid. 13 Ibid.

111
Italy has plans to have similar debt conversions for Indonesia.
The successful German debt conversions for Indonesia compare well with the Philippine debt conversions to development and environmental protection described earlier. We had seen that debt-to-development and debt-to-MDG conversions comprise a small amount of total external debt. The goal here is to make it more widespread and more prevalent through national and international policies.
6.9 Promoting Debt Conversions for Priority MDG Projects and Programs
The strategy for indebted middle-income countries that require MDG financing is to convince creditor countries that are already open to the debt conversions to MDG project financing. The list, for example, of priority MDG projects in the MTPIP shown in Chapter Four should be further developed and promoted to key funders, including these creditor countries. 6.9.1 Targeting Creditor Countries for Debt Conversions to MDG Financing Countries that should be targeted for such schemes are: 1. Germany, Italy, Switzerland (for debt-to-education and debt-to-nature schemes):
these are the most open to debt conversions based on their actions in Indonesia and the Philippines
2. USA (for debt-to-nature schemes especially protection of tropical forests) 3. Finland, Spain, France, Canada, United Kingdom, Denmark, Belgium, Netherlands,
Sweden: Countries somewhat open to debt conversions, especially for MDG financing
4. Non-Paris Club members: a. Muslim countries (for Mindanao development and Madrasah education:
Malaysia, Brunei, Kuwait, Libya, Saudi Arabia), b. ASEAN and other Asian countries (China, Taiwan, Singapore, Korea, Hong
Kong, India) 5. Countries with political and economic interests in the region (Australia is keen to
fund Mindanao development, social accountability and good governance, prevention of communicable diseases like HIV/AIDS – although Australia prefers to give grants rather than debt conversions14).
Table 6.7 gives us the potential bilateral debt stock of creditor countries which might be open to debt-to-MDG conversions. The total amount is $ 3.1 billion, including non-Paris Club members. More than $11 billion of bilateral debts are not eligible because they are debts to countries who have asserted their disagreement with debt conversions (most of it debts to Japan.) Care must be exercised in interpreting the $3.1 billion since we must emphasize that debt-to-MDG conversions require government to put peso equivalents (usually the face value of the debts converted at a discount) in the identified MDG projects
14 World Vision had approached the Australian Treasury to consider giving debt conversions to the Philippines.

112
or programs. The peso inflows into MDG projects are constrained by fiscal resources and/or the amount of monetization that can be undertaken. Thus, it is recommended that the counterpart funding of the government should be within the fiscal resources of the government. This may involve debt conversions of debts either maturing in the short-term, or allowing the counterpart peso funding of MDG projects based on significant reduction of bilateral debts to be spread out over many years. The projects and programs to be presented for debt-to-MDG financing should include not only projects and programs directly contributing to MDG activities and achievement of the goals, but also projects concerning the monitoring, evaluation, and impact analysis of MDG projects and programs and providing the mechanisms and infrastructure for transparency and accountability of such programs (as discussed in Chapter 4). Thus countries that are interested in funding good governance and social accountability of public institutions should be approached to fund these types of activities. Once the MDG projects derived from debt conversions demonstrate high success and impressive results, other more resistant countries (like Japan) may be convinced to follow suit and consider debt conversions. Even for Japan and those countries which frown on debt conversions, there should be lobbies and requests for significant inflows of ODA and grants for the MDG projects. 6.9.2 The Debt Conversion Schemes for MDG Financing The debt conversion schemes that can be offered are: i) Debt-to-MDG, debt-to-development or debt-to-nature swaps where a third party
(international NGO, a UN agency) buys a sovereign debt and the Philippine puts peso counterpart (whether at a discount or not) on a priority MDG project,
ii) conditional bilateral debt cancellation wherein a sovereign creditor agrees to write-off sovereign debts in exchange for the government putting a peso counterpart (whether at a discount or not) on a priority MDG
Promoting debt conversions for such schemes is crucial for both Indonesia and the Philippines since, for both countries, external development assistance had been falling and exhibiting net capital outflows (more repayments than new loans). For the first type of debt conversion above, international civil society and UN organizations should also be tapped to broker these debt conversions. Organizations like World Wildlife Fund (WWF), World Vision, UNESCO and UNICEF should be asked to help the countries convince bilateral creditors to convert their debts into MDG financing. UNICEF and UNESCO both have debt-to-education and debt-to-child welfare programs that will be useful for achieving the MDGs.

113
Table 6.7: Potential Bilateral Debt Stock for Debt-to-MDG Conversions (as of December 2005)
In Million of US Dollars
Paris Club Countries That May Be Open To Debt-to-MDG Conversions 2,672
Germany* 958 United States of America 947
Finland 218 France 168
Spain 145 United Kingdom 88 Italy 57 Belgium 33 Netherlands* 29 Sweden 16 Denmark* 11 Canada* 2 Non-Paris Club Countries 410
ASEAN Countries 42 Brunei 16 Indonesia 4 Malaysia 23 Other East Asian Countries 322 China 180 Korea, Republic Of 89 Taiwan 53
Others 46 India 28 Kuwait 13 Pakistan 3 Norway 1 Open Paris Club Countries Plus Non-Paris Club Countries 3,083
Countries Not Open to Debt Conversions Japan 10,876 Australia 175 Austria 14 *Excludes Debts to Export Credit Agencies which the creditor countries do not allow for debt conversions. Source: International Department, Bangko Sentral ng Pilipinas

114
Since the first two debt conversions described above are undertaken not for commercial reasons but due to the developed countries’ obligation to fulfill their Financing for Development commitments, significant discounts can be given by the developed country, similar to the debt swap that Indonesia got from Germany (which carried a 50% discount on the face value of the debt), mentioned in an earlier section. This is possible even if the financial markets are not giving significant discounts to the debt papers (i.e. the country is not seen as having a problem in paying the debts). The discount relieves the fiscal pressure on the government to come up with the counterpart funding. We had discussed beneficial debt conversions for social development in the Philippines and in the Indonesia. What we want is to make this more prevalent and more widespread. And the way to achieve this is to convince Paris Club countries not to abide by the strict rules of the Paris Club inasmuch as the Paris Club is an informal organization with informal rules. Lobbies with non-Paris Club members, if productive, may also encourage Paris Club members to follow suit. 6.9.3 Debt Relief for Disaster Relief We had also seen how disaster relief can take the form of debt relief. The debt rescheduling in Indonesia to benefit the tsunami victims in Aceh by the Paris Club and the cancellation of some of the French debt in the early 1990s to benefit the Mt. Pinatubo victims in the Philippines are good examples of how developing countries and developed countries can cooperate to use debt relief to assist and rehabilitate victims of natural disasters. In August 2006, Norway pledged to swap part of its obligations from Pakistan into a 20 million dollar contribution to the Asian Development Bank (ADB) fund for earthquake relief, making it effectively a debt-to-grant conversion. The Philippines had suffered terrible floods in Leyte last year due to the destruction of forest cover that would have shielded the areas from floods. Such disasters and natural calamities need substantial financing to effect long-term rehabilitation and prevention of the recurrence of such disasters. Debt relief from bilateral and the Paris Club should be considered one of the important set of responses when serious and grave calamities beset the country. 6.9.4 Relying on a Menu of MDG Financing as Lobbying for Debt Conversion
Might Take Time Since it will take time to convince bilateral creditors to give debt-to-MDG conversions in large quantities (see section 6.11), at the same time as lobbies with the relevant bilateral creditors is being undertaken, it may be worthwhile in the short-run to simultaneously target MDG financing with the following types of financing in descending order of priority, starting with financing that do not entail costs to the economy:
1. grants from bilateral, multilateral and international civil society organizations (without conditionalities); donations from the private business sector, civil society and church sectors.
2. fiscal resources

115
3. concessional loans at low interest rates (without conditionalities) 4. domestic borrowings at commercial rates 5. foreign borrowings at commercial rates.
6.10 Debt-to-Equity Conversions The use of debt-to-equity conversions in Latin America and the Philippines had been during periods of debt crisis when the debt papers were converted to equities at a high discount. Both sides have incentives for the transaction as holders of debt papers fear default and would like to convert it to some asset even at a high discount. In the current context, the debt-to-equity conversions do not carry any discount. Thus, in the absence of discounts and lacking the strong probability of debt default, the only incentive for commercial and bilateral creditors or investors would be that the rate of return of the commercially profitable MDG project is higher than the interest earnings of the foreign debt. Thus investors or creditors interested in the debt-equity conversion should find the MDG investment more attractive (i.e. it has a higher rate of return) than the commercial sovereign debt papers (whose return is the international market interest rate plus risk premium). Debt to equity conversions should be guided by the following principles: a) the investments where debt-equity conversions are allowed must be a priority MDG
project or program that lacks financing, b) the principle of additionality should be satisfied, i.e., the debt-equity scheme should not
crowd out investors and financiers that would have invested in the project anyway without the debt-equity scheme. And
c) the debt-equity conversion should abide by Philippine Constitution and laws concerning foreign equity participation rule in Philippine assets and ownership of public utilities.
Annex G gives us three specific projects which might attract debt-equity conversions and other investments in MDG-related projects with potentially high commercial rates of return. It must be pointed out, though, that much of MDG financing needs -- such as building public schools, food for education programs, immunization of children, maternal care programs, employment generating programs -- may not be profitable undertakings and are considered public goods and services. Other type of debt conversions and financing are required for such projects that debt-to-equity conversions most likely will not be able to provide. 6.11 Debt Audits, Debt Caps and Debt Composition: Ensuring Proper Debt
Management 6.11.1 Debt Audits Civil society organizations have been calling for more transparency, monitoring and limitations in the incurrence and use of public debts. The Philippines’ Freedom From Debt Coalition (FDC) has had a strong campaign for a law legislating auditing of the debts of the government. There is also a separate bill introducing a debt auditing process in the

116
Senate. A good debt audit mechanism would be beneficial both for the country and the donors to ensure correct and efficient use of debt funds. This will be more crucial if we will be going full blast for MDG financing 6.11.2 Debt Caps and Debt Servicing Caps
There also had been calls for debt caps, or stipulated ceilings in the incurrence of public debts. The government is pushing for the Fiscal Responsibility Bill to reduce the public debt burden by putting freezes on personnel increases in government agencies, and the ‘no additional revenue, no additional expenditures’ practice. In the current fiscal context of the Philippines and Indonesia, the main increases in public debts are due to budget deficits and government corporations’ deficits. Debt cap calls should also ensure that the reduced incurrence of debts is not due to lower expenditure constriction of social and economic services vital to achieve the MDG needs. But indeed there is a need to reduce public debts over time in order to reduce the annual debt servicing burden. Higher growth, more progressive taxation (which increase revenue generation), more rational and efficient budget allocation, and other mobilization of non-debt financing (private sector participation, grants, and other policies discussed in Chapter 3) should be promoted in order for debt caps and debt ceilings to be successful. Congress and the economic departments may also consider putting debt servicing caps in the budget appropriation process to ensure MDG financing are not jeopardized. This can be part of the recommended legislation to prioritize MDG budget items and safeguarding them. 6.11.3 Proper Debt Management Another concern is the composition of public debts. It is of course obvious that long-term debts are preferred to short-term debts as long as their interest rates are not exorbitant. Much of easing current debt servicing by the Bureau of Treasury is the buying back of short term debts simultaneous with the issuance of longer term debts. This has the effect similar to debt rescheduling except that long term debts usually entail higher interest rates. A more complicated problem is whether to incur more foreign debts or domestic debt. The advantages of foreign debts are: 1. Much of the external development assistance given by bilateral and multilateral
creditors are grants or at concessional rates, and usually longer term than commercial debts. This reduces the interest payments of the country.
2. For Indonesia, the Philippines and other ‘emerging’ markets, successful sale of sovereign bonds in the international market with lower risk premiums than before usually give promotion to the country as good investment areas and good credit worthiness.
3. In the current international context where Asian currencies are appreciating vis-à-vis Western currencies (especially the US dollar), there may be gains in reducing the debt burden due to the appreciation of the currency.
The advantages of domestic debt are:

117
1. Foreign debts are subject to exogenous shocks beyond the control of the country, such as sudden currency depreciation (foreign exchange risk) due to a regional crisis like the Asian crisis or sudden increases in world interest rates (foreign interest rate risks as what happened during the early 1980s when the Philippines joined Latin American countries in a debt crisis and debt default).
2. When debt crises occurs, domestic debt is easier to deal with than foreign debt since debt workouts can be more easily arranged in the domestic setting than workouts including foreign nationals. High dependence on foreign debt also usually leads to sudden inaccessibility of credit and high capital flights during times of crises.
3. Bilateral and multilateral debts usually entail more conditionalities, which do not afflict domestic debts.
4. In the Philippine current setting, domestic interest rates are quite low, and are almost as low as the commercial international rates. This is due to the high liquidity in the Philippine banking system and the financial and private institutions’ preference for government securities.
5. Creating a strong base for domestic bonds with varying maturities will also help in invigorating the domestic capital market.
On balance, the government’s decision to rely more on domestic borrowings seems to have a good logical basis. Other decisions to be made by our debt managers are whether to incur more bilateral and multilateral debts at concessional rates – but with possibly strict conditionalities – or commercial notes and bonds with higher interest rates. Good debt management by the Treasury and Finance departments or ministries are important for indebted middle-income countries in order to ensure as little debt servicing burden as possible in the financing of their development needs. 6.12 Improving the International Financial System for Debt Conversions 6.12.1 More Responsive and Flexible Paris Club Rules The second set of more ambitious approach is to reduce the constraints faced by middle-income countries in the international financial system, especially in the Paris Club rules and IMF debt sustainability assessment. Given that this is a UNDP study, it is an important goal that the UN system – especially the UNDP, UNICEF, UNESCO, the General Assembly, the Department of Economic and Social Affairs (DESA) and the Office of the Secretary General – be encouraged to advocate and lobby to reform the international financial and credit system to make it conducive to converting debts and debt service to MDG financing. The target would be to change the concept of debt sustainability and the rules of the Paris Club and the Bretton Wood Institutions. UNICEF and UNESCO both have debt conversion schemes for

118
education, health, children and development projects which are constrained also by the stringent international rules on debt conversions. It should be noted that UN Secretary General Kofi Annan precisely proposed a change in the concept of debt sustainability along the lines we will discuss shortly (Table 6.4). There are also similar calls by the UN system (see UNDP 2003), Jubilee South and international civil society organizations like OXFAM, CAFOD, and Christian Aid. It must also be pointed out that none of the Philippine stakeholders (the economic managers, the DFA, the civil society groups) object to this strategy, especially if the UN system or UNDP will lead the international lobby and include as many debtor countries (not just the Philippines) in the campaign. A key target by the UN and international CSO lobby and campaign should be to convince the G8 group of countries to endorse the new concept of debt sustainability and make the current rules more flexible. This means allowing debt relief and debt reduction even if countries are not in any threat of default. Once the G8 is convinced, it will be easier to change the Paris Club and BWI perspectives and policies. But all these efforts will most likely not succeed until indebted developing countries unite in demanding a change in the current stringent rules. This is why the UN system is critical in getting this initiative moving. 6.12.2 A Needed Change in the Concept of Debt Sustainability The Paris Club relies on an IMF debt sustainability assessment for Paris Club debt restructuring and debt treatments. Because of this, and since they have multilateral funds for countries with debt crises, the Bretton Wood Institutions (BWI) – the International Monetary Fund (IMF) and the World Bank (WB) – determine to a very large extent whether a country will have access to debt relief from official and commercial creditors, based on their concept of debt sustainability. As practiced by the BWI, the concept of debt sustainability has centered on the countries’ capacity to pay the debts. In the Heavily Indebted Poor Countries (HIPC) Initiative, the most ambitious international debt relief initiative for poor countries, the ratio of the stock (net present) value of the external debt to the exports of goods and services is the main indicator whether a country can sustain its external debts. If this ratio is above 150%, the country (if it meets certain ‘poor country’ criteria) is considered one that cannot sustain its debt, and therefore a debt relief program is designed for that country. A secondary measure used by the HIPC Initiative is the ratio of the stock (net present) value of the external debt to government revenues. If this ratio is above 250% (and the country satisfies some other criteria), the country is again deemed as one that cannot sustain its debt, and therefore a debt relief program is designed for that country. The other indicators (e.g. the World Bank’s definition of severely or moderately indebted countries) follow similar type of indicators (such as the debt-to-GDP ratio and the ratio of debt service payments to export revenue or current account receipts, the ratio of short-term debts to international reserves, etc.).
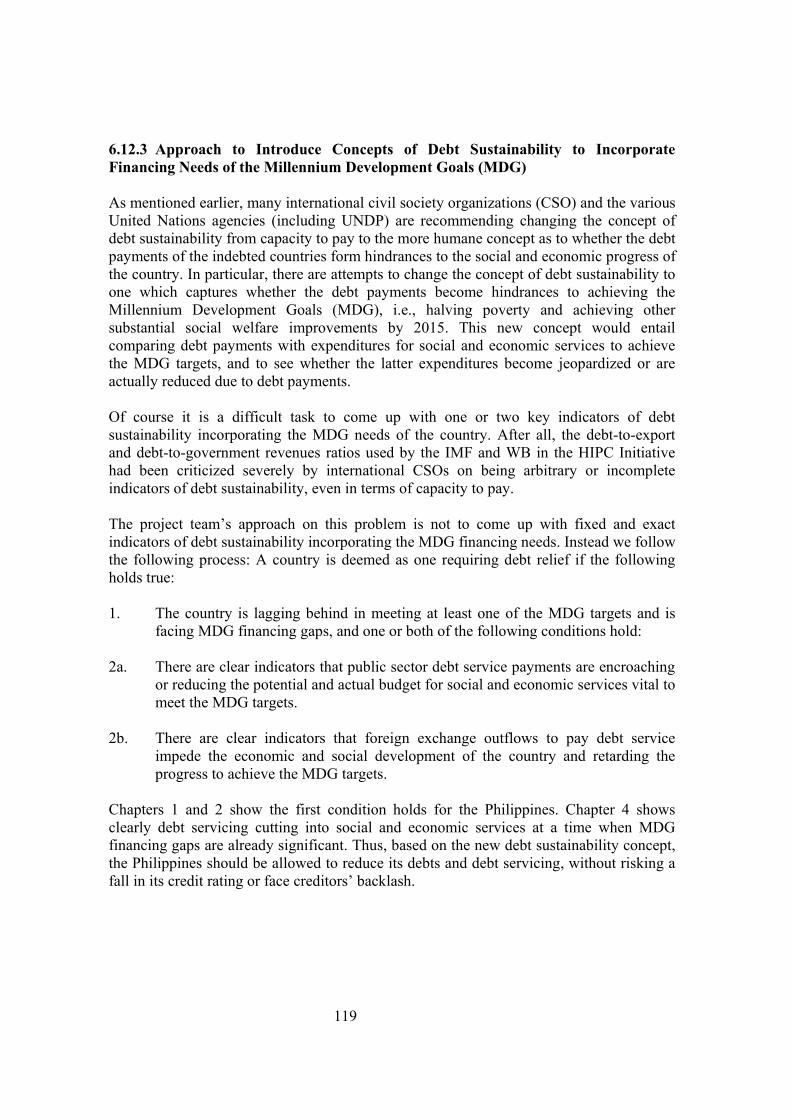
119
6.12.3 Approach to Introduce Concepts of Debt Sustainability to Incorporate Financing Needs of the Millennium Development Goals (MDG) As mentioned earlier, many international civil society organizations (CSO) and the various United Nations agencies (including UNDP) are recommending changing the concept of debt sustainability from capacity to pay to the more humane concept as to whether the debt payments of the indebted countries form hindrances to the social and economic progress of the country. In particular, there are attempts to change the concept of debt sustainability to one which captures whether the debt payments become hindrances to achieving the Millennium Development Goals (MDG), i.e., halving poverty and achieving other substantial social welfare improvements by 2015. This new concept would entail comparing debt payments with expenditures for social and economic services to achieve the MDG targets, and to see whether the latter expenditures become jeopardized or are actually reduced due to debt payments. Of course it is a difficult task to come up with one or two key indicators of debt sustainability incorporating the MDG needs of the country. After all, the debt-to-export and debt-to-government revenues ratios used by the IMF and WB in the HIPC Initiative had been criticized severely by international CSOs on being arbitrary or incomplete indicators of debt sustainability, even in terms of capacity to pay. The project team’s approach on this problem is not to come up with fixed and exact indicators of debt sustainability incorporating the MDG financing needs. Instead we follow the following process: A country is deemed as one requiring debt relief if the following holds true: 1. The country is lagging behind in meeting at least one of the MDG targets and is
facing MDG financing gaps, and one or both of the following conditions hold: 2a. There are clear indicators that public sector debt service payments are encroaching
or reducing the potential and actual budget for social and economic services vital to meet the MDG targets.
2b. There are clear indicators that foreign exchange outflows to pay debt service
impede the economic and social development of the country and retarding the progress to achieve the MDG targets.
Chapters 1 and 2 show the first condition holds for the Philippines. Chapter 4 shows clearly debt servicing cutting into social and economic services at a time when MDG financing gaps are already significant. Thus, based on the new debt sustainability concept, the Philippines should be allowed to reduce its debts and debt servicing, without risking a fall in its credit rating or face creditors’ backlash.

120
6.12.4 Different Conditionalities for the New Concept of Debt Sustainability The change in the concept of debt sustainability to that incorporating MDG financing needs also requires a change in the conditionalities that a country should abide by if it were to enjoy some debt relief. The IMF and WB conditionalities using the ‘capacity to pay’ concept usually involve economic reforms such as trade and market liberalization, privatization, deregulation, fiscal and financial sector reforms. Some of these reforms had been controversial, and many with alternative views see this as imposing a ‘one-size-fit-all’ approach to countries with diverse needs, cultures and economic structures. Whether one agrees or not with the economic conditionalities of the IMF and WB in HIPC and Paris Club-oriented debt initiatives, if one employs the new concept of debt sustainability as primarily to release funds for meeting the MDG needs, then the natural consequence should be a different set of conditionalities. The main conditionalities employing the new concept of debt sustainability will have to be towards ensuring that debt relief funds go to MDG financing and towards efficient, transparent and accountable systems that will optimize the use of debt relief funds for MDG needs. The implications of this is that the Paris Club rules have to be changed so that, at the very least, voluntary debt conversions of debts owed to Paris Club members should be allowed without any IMF debt sustainability assessment, an IMF economic program and without being subjected to cut-off dates. As mentioned earlier the only conditionality needed by the creditors would be that the assurance that the debt funds would be properly used in a project vital to advancing the MDGs. Once the new concept of debt sustainability is adopted and the rules changed accordingly, a multilateral and coordinated orchestration of debt reduction for MDG financing for non-HIPC countries can be undertaken, along the lines of the Norwegian recommendation. It is the purpose of this study to make debt conversion schemes for MDG financing a more accepted and prevalent practice of achieving the Financing for Development (FfD) goals as opposed to the current practice where debt conversions for development or environmental protection are very limited and focused on low-income countries. Furthermore, with the change in the concept of debt sustainability, debt reduction (as in reducing the total debts countries have to repay by giving them large discounts or canceling much of the debts) can become more acceptable for middle-income countries as they are now accepted for the HIPC. Multilateral debts should also be considered for possible debt reduction and debt relief as they are now for HIPC countries. 6.12.5 Practical Considerations to the New Concept of Debt Sustainability It is important to point out that the new concept of debt sustainability incorporating MDG needs, if sought for by a country, should not affect the country’s sovereign debt and credit rating since debt relief is given not because of incapacity to pay, but because the funds will be channeled to urgent social and economic services. To allay the fears that a debt
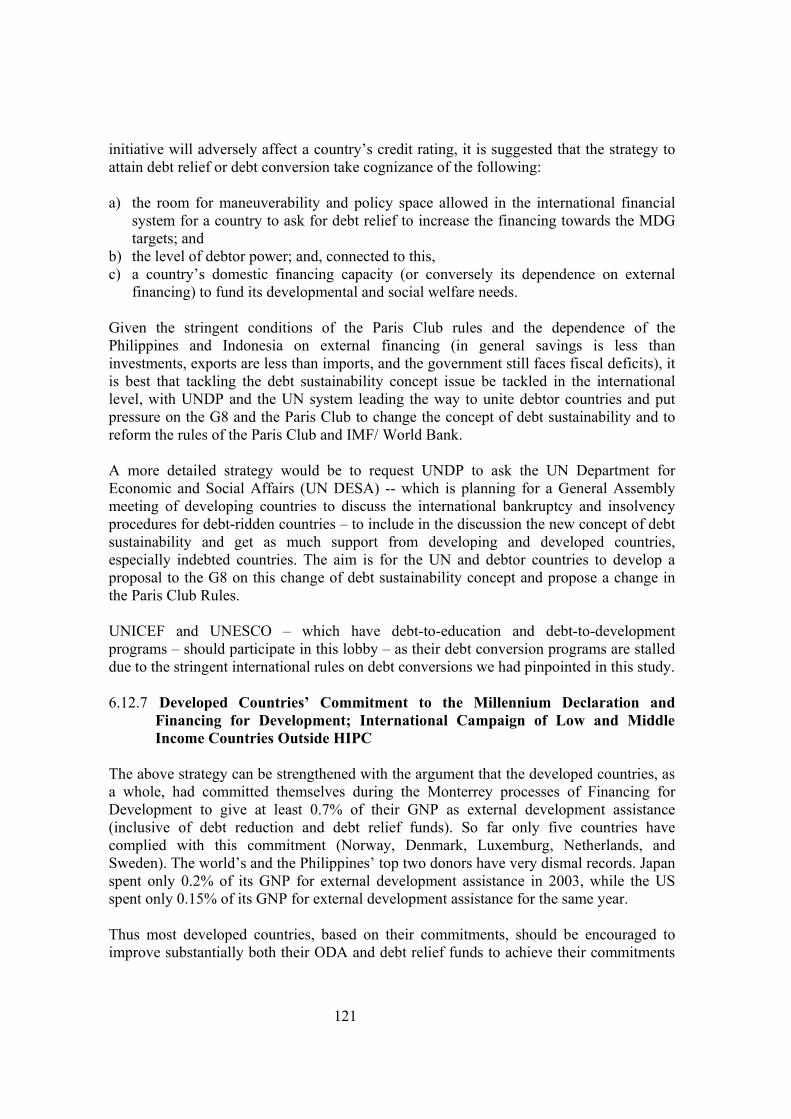
121
initiative will adversely affect a country’s credit rating, it is suggested that the strategy to attain debt relief or debt conversion take cognizance of the following: a) the room for maneuverability and policy space allowed in the international financial
system for a country to ask for debt relief to increase the financing towards the MDG targets; and
b) the level of debtor power; and, connected to this, c) a country’s domestic financing capacity (or conversely its dependence on external
financing) to fund its developmental and social welfare needs. Given the stringent conditions of the Paris Club rules and the dependence of the Philippines and Indonesia on external financing (in general savings is less than investments, exports are less than imports, and the government still faces fiscal deficits), it is best that tackling the debt sustainability concept issue be tackled in the international level, with UNDP and the UN system leading the way to unite debtor countries and put pressure on the G8 and the Paris Club to change the concept of debt sustainability and to reform the rules of the Paris Club and IMF/ World Bank. A more detailed strategy would be to request UNDP to ask the UN Department for Economic and Social Affairs (UN DESA) -- which is planning for a General Assembly meeting of developing countries to discuss the international bankruptcy and insolvency procedures for debt-ridden countries – to include in the discussion the new concept of debt sustainability and get as much support from developing and developed countries, especially indebted countries. The aim is for the UN and debtor countries to develop a proposal to the G8 on this change of debt sustainability concept and propose a change in the Paris Club Rules. UNICEF and UNESCO – which have debt-to-education and debt-to-development programs – should participate in this lobby – as their debt conversion programs are stalled due to the stringent international rules on debt conversions we had pinpointed in this study. 6.12.7 Developed Countries’ Commitment to the Millennium Declaration and
Financing for Development; International Campaign of Low and Middle Income Countries Outside HIPC
The above strategy can be strengthened with the argument that the developed countries, as a whole, had committed themselves during the Monterrey processes of Financing for Development to give at least 0.7% of their GNP as external development assistance (inclusive of debt reduction and debt relief funds). So far only five countries have complied with this commitment (Norway, Denmark, Luxemburg, Netherlands, and Sweden). The world’s and the Philippines’ top two donors have very dismal records. Japan spent only 0.2% of its GNP for external development assistance in 2003, while the US spent only 0.15% of its GNP for external development assistance for the same year. Thus most developed countries, based on their commitments, should be encouraged to improve substantially both their ODA and debt relief funds to achieve their commitments

122
to the Financing for Development processes and their commitment to the Millennium Declaration. But as mentioned earlier no international lobby and campaign is complete without a united stand among debtor countries, especially low and middle income countries outside HIPC. Developing countries are discovering that unity among them can make a dent in negotiation with developed countries. They found this out in the WTO talks in Seattle, Cancun and Hong Kong. The UN can play a positive role by bringing the debtor countries together to demand a new concept of debt sustainability. As mentioned earlier, countries such as Indonesia and the Philippines are important representatives of countries where millions of people will suffer due to the inability to meet the MDG targets. The Group of Non-Aligned Countries can also play a bigger role in calling for debt relief for MDG financing, especially now that the Philippines is to be the co-chair of the Group. With respect to debt relief, the international campaign of debtor countries would involve the following lobbies: a) to change the concept of debt sustainability to one that incorporates the needs for MDG
financing, b) to change the Paris Club rules accordingly so as not to necessitate capacity to pay
assessments before countries get debt relief for MDG financing, c) to change the Paris Club rules so that voluntary debt reduction and debt conversions
for MDG financing will be allowed without any constraints of cut-off dates and existing active debt treatments,
d) to change the conditionalities of debt reduction and debt relief to focus on efficient and proper channeling of funds to MDG needs.
The international commitment to the MDGs and its financing will be given a serious test when the above campaign is launched. We will see if developed countries take seriously their role as global partners in development, poverty reduction and attaining the MDGs. MDG 8 is also a key MDG goal! The following are two important quotes: From CIDSE (Cooperation Internationale Pour le Developpement et la Solidarite): “Debt sustainability assessments should be geared to ensure that debtor countries are able to fulfill the financing requirements to meet human development goals and the MDGs. The faithful implementation of this principle requires that: a) it be equally applied to all countries, without distinctions, including those based on income, b) debt relief and cancellation be actively promoted as a means to reduce the debts of countries when they are above sustainable levels, c) the methodology for performing Debt Sustainability Assessments deliberately seeks to measure the cost of achieving the MDGs and places it against the public revenue available to meet them.15” [italics provided by the authors] From UN Secretary General Kofi Annan: “[The] $54 billion committed for debt relief to 27 countries under HIPC still falls far short of what is needed. [T]o move forward, we
15 CIDSE (2006)

123
should redefine debt sustainability as the level of debt that allows a country to achieve the Millennium Development Goals and reach 2015 without an increase in debt ratios. For most HIPC countries, this will require exclusively grant-based finance and 100% debt cancellation, while for many heavily indebted non-HIPC and middle-income countries, it will require significantly more debt reduction than has yet been on offer16 .” (Italics provided by the authors).
16 United Nations (2005).

124
Chapter Seven: Summary and Conclusions 7.1 The Need to Improve the Philippines’ Performance to Meet the MDG Targets Key MDG targets are either lagging in terms of achieving the 2015 MDG target, or lagging in comparison to many of our neighbors. Assuming the medium assumption for population growth, in 2003, there were 24.4 million Filipinos below the poverty line, 11.0 million of the population below the food subsistence threshold, around 3.4 million children of 0-5 years of age that were underweight, 1.1 million children that were not immunized for serious diseases, 9.3 million people eating below the required food intake for proper nutrition, 1.4 million children of elementary school age not enrolled, and 2,800 potential maternal deaths (annually). 36 out of 100 new elementary school children will not finish elementary schooling, and below 50% of the couples were not practicing family planning or responsible parenthood. The latest data in 2005 and early 2006 show that there were more than 4 million people openly unemployed and another 7 million underemployed. Other serious problems involve water and sanitation, destruction of natural resources, and child mortality. The MDGs aim to reduce substantially the above suffering of many of our people and to increase our human, social and economic development. Obviously there is need to hasten and broaden activities, projects and programs that will quickly address the above needs. 7.2 Estimates of the MDG Financing Gap Manasan (2006) estimates large gaps in financing the attainment of the MDG targets in 2006-2015. Although the enactment of new tax measures (notably lifting of many exemptions in the VAT and an increase in the VAT rate from 10% to 12%) eases the fiscal situation starting in 2006, the additional fiscal space for MDG financing is still not enough to fully cover MDG resource requirements (including the backlogs built up in earlier years). It is recalled that the resource needs in the education, health and watsan sectors in support of the MDGs have been severely under-funded in 1998-2003 because of the tight expenditure controls that were put in place then as a response to the persistent deterioration of the country’s revenue effort during the said period in 1998-2004. Manasan (2006) updates estimates made earlier in 2002 of the resource requirements and resource gaps that are pertinent to the attainment of the MDGs on primary education, child mortality, maternal health, HIV/ AIDS, malaria and other diseases, and environmental sustainability. The estimates of the resource requirement for the achievement of universal primary education (Table 2.1 and Table 2.2) assumes that the Grade 1 intake rate will increase from 74% in SY 2003-2004 to 100% in SY 2010-2011 and the grades I-VI cohort survival rate from 68% to 100% in SY 2015-2016. For this to happen, it is further assumed that resources will be made available so that in addition to gradually addressing lack of teachers and classrooms in schools with severe shortages in 207-2013, enough school inputs will be provided so that the requirements of new entrants are fully met. Furthermore, the MDG cost estimate for education also includes the cost of additional programs that will improve the quality of basic education.

125
Manasan’s analysis shows that, depending on the growth rate assumptions, the total resource gaps for critical MDG goals are estimated in the table shown below (lifted from Table 2.7 in the text). This amounts to a resource gap of between P623.647 billion to P800.246 billion pesos for the period 2007 to 2015. Crudely, assuming a peso exchange rate of P51 to one US dollar, this translates to $12.2 billion to $15.7 billion. 7.3 Policies to Bridge the MDG Financing Gap To bridge the MDG financing gaps, some policies will have to be geared to improving income and employment generation as well as savings mobilization of the Filipinos. This will reduce also the need for public financing of MDG needs since these needs will be significantly met through self-financing by the beneficiaries of higher income, savings and employment. Policies for equitable distribution of income and wealth will also improve the MDGs substantially and reduce the MDG financing needs. These policies are in detail:
a. Improving the incomes and savings and savings rate of the country since savings provide the domestic resource base to finance human, social and physical investments. The policies here include:
i) Quality and equitable economic growth: As incomes across all income
classes increase with economic growth, nominal and real savings, as well as the savings ratio, will naturally increase.
ii) There is also a need to reduce the high dependency burden of Filipino families. This requires more emphasis on family planning and population programs as well as programs for employment generation.
iii) Increasing government savings is one that will be discussed at length later when we discuss the fiscal bind and constraints of the Philippines and the current fiscal reforms. Suffice it to say here that increasing and making tax revenues and government spending more progressive is the key policy here. It must also be pointed out that reducing the public debt burden also helps in improving government savings.
b. More equitable sharing of wealth and income: reforms in land, agrarian assets,
housing and access to resources and social services

126
Summary of Resource Gaps in 2006 prices, 2007-2015 (in million pesos)
(High cost assumption)
Year Resource gaps - MTPDP GDP growth rate
Educ Health Water/
Sanitation Poverty Total Percent red'n to GDP
2007 30,592 5,126 171 59,131 95,020 1.46 2008 33,131 5,015 135 55,874 94,156 1.36 2009 38,517 4,840 91 51,949 95,397 1.29 2010 44,373 4,735 55 48,598 97,761 1.23 2011 41,812 4,443 (3) 28,891 75,144 0.88 2012 38,153 4,184 (60) 23,299 65,576 0.72 2013 28,402 3,891 (122) 17,276 49,446 0.51 2014 20,201 3,561 (190) 10,792 34,364 0.33 2015 9,971 3,197 (263) 3,879 16,784 0.15
2007-2010 146,613 19,716 452 215,553 382,334 1.33
2007-2015 285,153 38,992 (186) 299,689 623,647 0.80
Year Resource gaps - low GDP growth rate
Educ Health Watsan Poverty Total Percent red'n to GDP
2007 33,666 5,535 183 59,318 98,702 1.54 2008 38,011 5,514 156 56,856 100,537 1.48 2009 45,693 5,453 123 53,944 105,213 1.47 2010 54,000 5,463 99 51,707 111,270 1.48 2011 54,336 5,314 55 33,277 92,983 1.17 2012 53,902 5,211 14 29,118 88,244 1.05 2013 47,755 5,091 (31) 24,699 77,514 0.88 2014 43,574 4,953 (80) 20,006 68,453 0.73 2015 37,643 4,795 (132) 15,023 57,330 0.58
2007-2012 279,608 32,491 630 284,221 596,950 1.35
2007-2015 408,579 47,330 388 343,949 800,246 1.11
Source: Manasan (2006)
c. Improving Employment Opportunities: An alarming situation in the Philippines is the fact that unemployment rates are increasing, or fail to fall, as economic

127
growth occurs. Lack of employment opportunities and jobless growth lead directly to increases in poverty and retardation of human development. Promoting full employment (and reducing underemployment) requires not only high economic growth. It also requires policies and programs that go beyond micro-financing and towards promotion of an integrated employment and industrial plan for the country and promotion of sectors that will be contributing to both growth and employment generation. It will also require better infrastructure in the rural and depressed areas, such as farm-to-market roads, improved transportation systems, rural electrification and local area development.
Other policies will have to directly mobilize funds to be used for MDG financing and to reduce wastage in the use of public funds. These are:
d. Fiscal Reforms: Mobilizing taxes to generate public funding for vital projects, reduce the fiscal deficits and to reduce dependence on debts to finance vital key expenditures are essential. The government had already implemented the expanded value-added taxation (E-VAT) and the increase in the E-VAT rate from 10% to 12%. It had also implemented an increase in ‘sin’ taxes, increase in corporate income tax, and the lateral attrition law. It is also planning to push for Congress to pass two more bills – the first to reduce fiscal incentives and tax holidays to generate more revenues, and the second the simplified net income tax system (SNITS) which aims to put ceilings on the deduction of business expenses by self-employed taxpayers. Improved tax administration – such as computerized tax audits and reshuffling of custom inspectors -- is trying to catch and prosecute big tax evaders and to run after smugglers. Big and prominent persons had been prosecuted for tax evasion and highly publicized in the media. It is recommended that more progressive taxation be pursued with more emphasis on tax collection from big corporations and high-income individuals, and to give bias to social and economic spending that will benefit the poor and vulnerable. The government has committed to use the increased revenue collection from the E-VAT for vital social, economic and infrastructure spending. The MDG financing schemes will also contribute towards this end.
e. Mobilize external development assistance, especially grants, and financial
resources from the domestic business sector, church sectors, civil society organizations and community organizations in private-public and global partnerships in development and social financing.
f. Improve social accountability and transparency for development projects, and
reduce corrupt and wasteful use of funds in the public sector. This also includes more efficient and accountable allocation of budget funds in government expenditures.

128
7.4 Concrete Recommendations to Mobilize and Safeguard MDG Financing 7.4.1 Prioritizing and Planning for MDG Projects and Programs and Their
Financing NEDA has graciously provided a tentative list of prioritized list of MDG projects from the draft Medium Term Public Investment Program (MTPIP) for 2005-2010 (Table 4.1). This is an important list to lobby for additional funding (and adding more projects and programs as they are identified). The funding can come from grants, debt conversions, external development assistance, public funds and tax revenues, domestic private financing from business, church groups and civil society organizations. The paper talks at length about particular programs where financing may be inadequate and additional financing should be raised: the Madrasah Muslim education program (where Muslim countries can be tapped for grants and debt conversions), Food for Education Programs, employment generating programs, family planning and population programs, maternal health projects and programs, water and sanitation programs, immunization of children (where the MDG target is retrogressing), hospitals for the indigents, school buildings in depressed areas, social insurance schemes for vulnerable groups, rural infrastructure such as farm-to-market roads, irrigation systems. 7.4.2 Recommendations to Mobilize and Safeguard MDG Financing The paper also identifies existing institutions and facilities that can mobilize and safeguard MDG funds. The accompanying recommendations are: a. A joint initiative by the MDG Committee in the House of Representative and the
Budget Appropriations Committees in the Lower Houses and the Senate can lead to the legislation of a bill prioritizing MDG-related spending in the budget appropriations, and protecting them from budget cuts, expenditure constriction or budget reallocation. Short of legislation, the MDG Committee and the Budget Appropriations Committees can agree on common guidelines that will prioritize and assure MDG funding and spending in the budget appropriations and protect it from budget cuts, expenditure constriction or reallocation of budget resources to other government spending. The MDG Committee and Budget Appropriations Committees in both Houses can also try to coordinate a strategy to channel part of the Countryside Development Fund (CDF) or ‘pork-barrel’ funds to MDG financing. (This is a recommendation of Social Watch and other civil society groups).
b. Since the line agencies, especially the DepEd, DOH, and local governments are free to
mobilize for the funding of their priority MDG projects and programs, the funds generated will be enhanced if there is an improvement in the identification and promotion of the vital MDG projects and programs consistent with the development plan and the MTPIP.

129
c. There is a need to strengthen and systematize reporting of MDG spending by the various line agencies to DBM, and the consolidation of the budget for MDG spending by the DBM. In this regard, it is important: 1) to identify MDG budget funding in the line agencies, 2) use the definitions of the MDG and targets to define and identify MDG spending, 3) request DBM to require line agencies to report MDG funding in their agencies and to consolidate the reports for the whole national government. Monitoring MDG spending and their budget items will ensure that there will be a transparent mechanism to track MDG related budget items and their financing, and to identify programs that require additional funding. Tracking and monitoring the financing of MDG projects and programs among the government’s line agencies will go a long way in identifying areas and sectors that need additional financing.
d. Another proposal is to replicate the success of establishing gender focal persons in the
various line agencies of the national government in order to mainstream gender sensitivity in the national government activities. It is worth exploring the establishment of MDG focal persons in key agencies (DepEd, DOH, DSWD, Department of Finance, Department of Budget and Management, Department of Agriculture, Department of Agrarian Reform, DPWH, DENR, DTI) to ensure MDG funding of vital activities and projects and to monitor MDG activities and projects. These MDG focal persons will be the key informants in their respective agencies for donors, private sector and other government agencies concerning MDG activities and projects in their respective areas.
e. It would also be beneficial to strengthen and link reports of the Regional Social
Development Committees (RSDCs) of the Regional Development Councils (RDC) on the MDG progress in the different regions of the country to the MDG plans in the MTPIP and to the budget appropriations processes.
f. Similarly, it would be beneficial to strengthen and link reports of the Multisectoral
Committee on International Human Development Commitments (MCIHDC -- a subcommittee of the NEDA Board - Social Development Committee) on the progress of the country’s compliance on the MDGs and other international human development commitments to the MDG plans in the MTPIP and the budget appropriations processes. The Committee monitors compliance to five Conferences (the Millennium Declaration, World Summit on Social Development, Beijing Summit Platform on Women, HABITAT, International Committee on Population Development), all of which are related to the MDG targets.
g. Overall, there is a need to strengthen NEDA as the watchdog and key monitor agency
for the MDGs. Partly through the mobilization of external and domestic financing – and debt conversions to be discussed later -- there should be a mechanism to provide more funds and personnel in this department to monitor and to evaluate the MDG programs implemented by the various line agencies throughout the country. NEDA will also be the key agency that will sound off to the national government if funds for MDG are insufficient and if there is need to mobilize significant funding for the MDG needs.

130
7.4.3 Exploring the Establishment of an MDG Fund The paper also recommends a feasibility study on the setting up of an MDG Fund. The pro arguments are obviously in order to facilitate, systematize and institutionalize the channeling of ODA, debt conversion, government and private sector funds to already identified and prioritized MDG projects and programs. This will force the government and civil society to plan and prioritize MDG projects and activities more carefully and comprehensively. The con arguments mostly have to do with the possibility of the political process using the funds for political objectives rather than for national and social objectives. To address the con arguments, it is suggested by this paper that, if an MDG Fund is proposed, the Fund be administered by a committee co-chaired by NEDA and UNDP. The members of the committee should be: the fiscal agencies of the government (DBM, DOF), key human development agencies (e.g. DOH, DepEd), local government representatives, key civil society groups (such as the church sectors, civil society organizations and the business sector), the House of Representative MDG Committee head, and key bilateral and multilateral donors. 7.4.4 Social Accountability for the MDG Projects and Programs and Improving
Their Absorptive Capacities The paper also details issues on transparency, auditing, accountability, procurement processes, monitoring and evaluation, and reducing corruption and inefficiencies in the planning, financing and implementation of MDG projects and activities. The importance of these processes merits the financing of such processes to improve social accountability. This is an integral part of MDG financing. Absorptive capacities of the MDG projects and programs will also improve once resolution of disputes arising from infrastructure projects, clear rules of procurement, auditing and accounting, better monitoring and evaluation processes, and improved local capacities to implement projects are achieved. The creditors and donors also have an equal responsibility of assuring these processes in the projects they are funding especially in the planning and formulation of the projects. There should also be a matching in the aims of both donor/creditor and the local implementing agencies and a mutual agreement in the implementation, monitoring, evaluation and auditing of the projects from the very start. 7.5 The Fiscal and Debt Burden of the Philippines: The Rationale for Debt
Reduction and Debt Conversions for MDG Financing The current fiscal situation is such that to lower fiscal deficits, total expenditures had been reduced in 2004 to 2005, as a percentage to GDP, thus reducing all expenditures including social and economic services. Furthermore, debt servicing is eating up vital social and economic services, further reducing the precious funds for MDG financing. Debt servicing for interest and principal payments comprises more than 85% of government revenues in 2005.

131
- This means that less than 15% of government revenues can go to vital spending for
MDG financing and general administration of governance - This also means that the government will be forced to borrow substantially or constrict
expenditure drastically. Both encroach on vital spending for MDGs Hopefully, higher fiscal collection starting 2006 may reduce the above problem. But high debt servicing is foreseen to continue for a while due to the high debt incurrence in the previous years. Furthermore multilateral and bilateral loans had been decreasing in the last two years as loan repayments exceed new loans incurred. There is thus strong motivation for exploring debt reduction and debt conversions for MDG financing. 7.6 Recommended Policies for Debt Reduction or Conversions to MDG Financing
for Middle Income Countries 7.6.1 Examples of Good Debt Conversions for Development and the Environment The Philippines and Indonesia had had very good experiences with debt-to-development and debt-to-nature conversions that had led to strong institutions delivering MDG activities. These include US AID and World Wildlife Fund support for biodiversity conservation for the Philippines, the Swiss debt conversion creating the Foundation for a Sustainable Society that supports community development projects, a German debt swap for forestry management in Quezon Province, a US debt swap for tropical forest conservation for the Philippines, German debt swaps for training elementary school teachers and building junior high schools in depressed areas of Indonesia. 7.6.2 Limitations by the IMF and Paris Club Possibilities of debt reduction and debt conversions of bilateral debts to MDG financing are limited by the Paris Club rule of: a) requiring the debtor country to ask for an IMF debt sustainability assessment, enter an IMF program and request for a new Paris Club restructuring based on the more flexible Evian approach, or b) ask for current debt conversions based on debts incurred before the cut-off date of 1984, leaving very little debts eligible for conversion. The former is not acceptable to the economic managers of the country since it is based on a debt sustainability analysis of capacity to pay. This will give the wrong signal that the Philippines cannot pay its debts and will rattle the financial markets. The Indonesian MDG and debt situation is similarly constrained by the IMF and Paris Club rules and Indonesia suffered immensely during the Asian crisis as the international system did not allow it to achieve much debt reduction and debt relief. The problem therefore is not just a specific Philippine problem but a general problem of indebted low-income and middle-income countries that are not part of the Heavily Indebted Poor Countries (HIPC).

132
7.6.3 Debt-to-Equity Conversions Debt-to-equity conversions by bilateral or commercial lenders and investors are facing different circumstances as when the Philippines faced default and got the debt-equity conversions at high discounts in the 1980s. Now the country is not seen by the financial markets as near default, and no discounts are given to Philippine debts. Thus investors or creditors interested in the debt-equity conversion will be convinced only if they find the MDG investment more attractive (i.e. it has a higher rate of return) than the commercial sovereign debt papers (whose return is the international market interest rate plus risk premium). Debt to equity conversions should be guided by the following principles: a) the investments where debt-equity conversions are allowed must be a priority MDG project or program that lacks financing, b) the principle of additionality should be satisfied, i.e., the debt-equity scheme should not crowd out investors and financiers that would have invested in the project anyway without the debt-equity scheme, and c) the debt-equity conversion should abide by Philippine Constitution and laws concerning foreign equity participation rule in Philippine assets and ownership of public utilities. Appendix F gives some possible commercial projects with possible high rates of returns that may be considered: a) ecotourism to save marine resources and mangroves in Southern Palawan; b) bio-prospecting to save the forests and natural parks in Samar; c) investments in jatropha, a potential bio-fuel to provide cheaper fuel at a time of soaring world oil prices. 7.6.4 Debt Audit, Debt Caps and Debt Management Civil society organizations (especially Freedom From Debt Coalition) had been calling for debt audits to ensure debts are being used correctly and for social and economic development. This is a worthwhile endeavor, especially with an appropriate bill or law. Similar calls for debt caps assume that fiscal deficits and government corporations’ losses are reduced (since public debts are incurred by these deficits). The government is pushing for the Fiscal Responsibility Bill to reduce the public debt burden by putting freezes on personnel increases in government agencies, and the ‘no additional revenue, no additional expenditures’ practice. In this regard, such debt cap proposals that call for reduced fiscal deficits have to ensure that the lower fiscal deficits are not at the expense of social and economic services vital for MDG needs. Debt service caps may also be considered (as called for by civil society organizations) limiting the payment of interest and principal payments for debts if they infringe on MDG financing. Proper debt management by the financial managers of the country is important to reduce the debt burden of the country. One important decision is the mix of domestic and foreign debt. Other important components of debt management involve the mix of short term, medium term or long term debts (with longer term debts evidently more desired – but dependent on their interest rates), and the mix among bilateral, multilateral and commercial debts.

133
7.6.5 An Urgent Call for an International Campaign for Debt Reduction for Middle-Income Countries
Given that the problem is mainly a general problem of indebted low-income and middle-income countries outside HIPC, the broader and international strategy recommended by this study, and consistent with the suggestions of the UN Secretary General and the Philippine stakeholders, is a two-pronged policy: a) Offer attractive MDG projects and programs where bilateral debts can be channeled to,
within or outside the Paris Club rules. This could be in the form of the MDG Fund or the system of prioritization of MDG programs discussed in section (chapter) 4. Countries that should be approached are: Germany, Italy, Switzerland, US, Finland, Spain, France, Canada, United Kingdom, Denmark, Belgium, and Netherlands. Also to be approached should be non-Paris Club countries such as China, Taiwan, Singapore, Korea, Hong Kong, India and Muslim countries such as Malaysia, Brunei, Kuwait, Libya, Saudi Arabia. The latter countries can be tapped to specially fund Mindanao development programs including the Madrasah program. Demonstrating success with a few cooperative creditor countries can start a ‘snowball’ effect in convincing the bigger and more resistant creditor countries (such as Japan and Australia). For countries that frown on debt conversions, grants and ODA should be requested. The debt conversion schemes can be among the following:
i) debt-to-development or debt-to-nature swaps where a third party
(international NGO, a UN agency) buys a sovereign debt and the Philippine puts peso counterpart (whether at a discount or not) on a priority MDG project,
ii) conditional bilateral debt cancellation wherein a sovereign creditor agrees to write-off sovereign debts in exchange for the government putting a peso counterpart (whether at a discount or not) on a priority MDG,
As middle-income countries undertake the responsibilities above with the appropriate accountability and transparency processes, the international agencies and creditor countries should also accept their urgent responsibilities b) It is recommended that the UN system and UNDP spearhead an international campaign
to change the concept of debt sustainability of the Bretton Woods Institutions from capacity to pay to whether financing the MDGs are being blocked or hampered by debt servicing. This would change the Paris Club rules and allow a big chunk of bilateral debts to be reduced or converted without jeopardizing the country’s credit worthiness and rating. Debtor countries – both low-income and middle-income – should come together and support the change in the concept of debt sustainability. The Group of Non-Aligned Countries can also be mobilized to support this campaign, especially since the Philippines is co-chair of the Group starting this year. Once the change in debt sustainability concept is achieved and more debt conversions are allowed to non-HIPC countries, a multilateral and coordinated debt reduction initiative for MDG financing can then be undertaken along the Norwegian recommendation. There are

134
billions of poor and vulnerable people in low and middle-income countries outside HIPC that the MDGs should serve. In this regard, it is recommended that UNDP and UN DESA, which are using the General Assembly meetings to discuss international bankruptcy and insolvency procedures already tabled, would do the following:
- Add to this the discussion on the new concept of debt sustainability and get as much
support from developing and developed countries, especially indebted countries - The countries and the UN should develop a proposal to the G8 on this change of debt
sustainability concept and propose a change in the Paris Club Rules In employing the new concept of debt sustainability, the project team’s approach on this problem is not to come up with fixed and exact indicators of debt sustainability incorporating the MDG financing needs. Instead we follow the following process: A country is deemed as one requiring debt relief if the following holds true: 1. The country is lagging behind in meeting at least one of the MDG targets and is facing
MDG financing gaps, and one or both of the following conditions hold: 2a. There are clear indicators that public sector debt service payments are encroaching or
reducing the potential and actual budget for social and economic services vital to meet the MDG targets.
2b. There are clear indicators that foreign exchange outflows to pay debt service impede
the economic and social development of the country and retarding the progress to achieve the MDG targets.
The Philippines and Indonesia satisfy the first two conditions. Whether one agrees or not with the economic conditionalities of the IMF and WB in HIPC and Paris Club-oriented debt initiatives, if one employs the new concept of debt sustainability as primarily to release funds for meeting the MDG needs, then the natural consequence should be a different set of conditionalities. The main conditionalities employing the new concept of debt sustainability will have to be towards ensuring that debt relief funds go to MDG financing and towards efficient, transparent and accountable systems that will optimize the use of debt relief funds for MDG needs. The above strategy requires mutual obligation and accountability. The developed countries should strive to achieve their commitments of providing external development assistance equivalent to at least 0.7% of their GNP (and this includes funds from debt reduction). Japan and the US, two of the Philippines’ top creditors fail miserably here, with Japan giving only 0.2% of its GNP as external development assistance in 2003, and the US giving a lower 0.15% of its GNP in the same year. It is hoped that as 2015 approaches, these and other developed countries would start to be more cooperative in financing vital MDG projects and programs, including those of low and middle income countries outside the Heavily Indebted Poor Countries (HIPC).
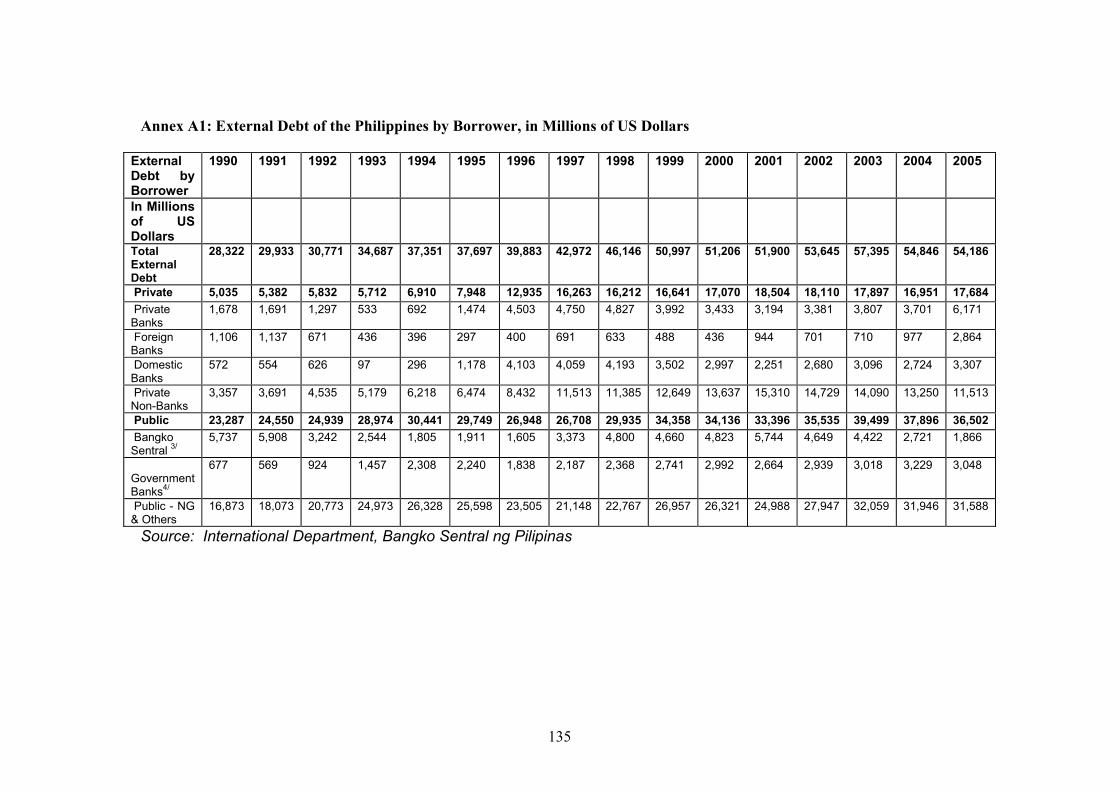
135
Annex A1: External Debt of the Philippines by Borrower, in Millions of US Dollars
External Debt by Borrower
1990 1991 1992 1993 1994 1995 1996 1997 1998 1999 2000 2001 2002 2003 2004 2005
In Millions of US Dollars
Total External Debt
28,322 29,933 30,771 34,687 37,351 37,697 39,883 42,972 46,146 50,997 51,206 51,900 53,645 57,395 54,846 54,186
Private 5,035 5,382 5,832 5,712 6,910 7,948 12,935 16,263 16,212 16,641 17,070 18,504 18,110 17,897 16,951 17,684 Private Banks
1,678 1,691 1,297 533 692 1,474 4,503 4,750 4,827 3,992 3,433 3,194 3,381 3,807 3,701 6,171
Foreign Banks
1,106 1,137 671 436 396 297 400 691 633 488 436 944 701 710 977 2,864
Domestic Banks
572 554 626 97 296 1,178 4,103 4,059 4,193 3,502 2,997 2,251 2,680 3,096 2,724 3,307
Private Non-Banks
3,357 3,691 4,535 5,179 6,218 6,474 8,432 11,513 11,385 12,649 13,637 15,310 14,729 14,090 13,250 11,513
Public 23,287 24,550 24,939 28,974 30,441 29,749 26,948 26,708 29,935 34,358 34,136 33,396 35,535 39,499 37,896 36,502 Bangko Sentral 3/
5,737 5,908 3,242 2,544 1,805 1,911 1,605 3,373 4,800 4,660 4,823 5,744 4,649 4,422 2,721 1,866
Government Banks4/
677 569 924 1,457 2,308 2,240 1,838 2,187 2,368 2,741 2,992 2,664 2,939 3,018 3,229 3,048
Public - NG & Others
16,873 18,073 20,773 24,973 26,328 25,598 23,505 21,148 22,767 26,957 26,321 24,988 27,947 32,059 31,946 31,588
Source: International Department, Bangko Sentral ng Pilipinas
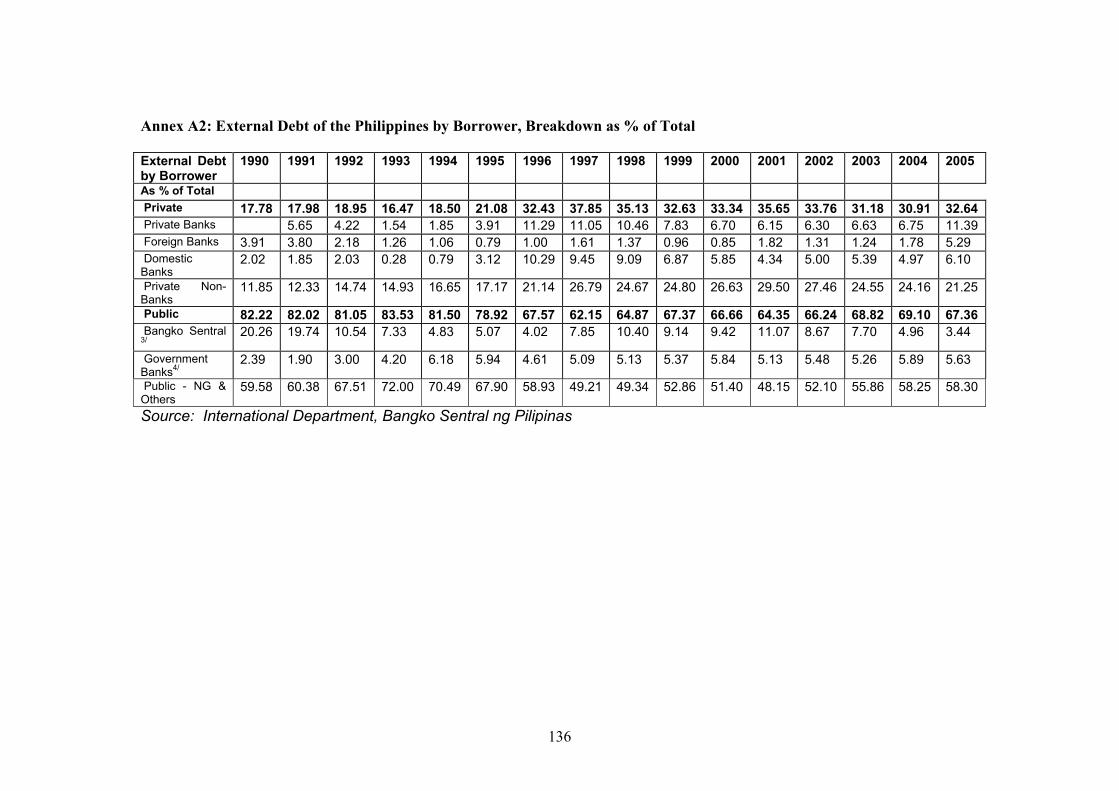
136
Annex A2: External Debt of the Philippines by Borrower, Breakdown as % of Total External Debt by Borrower
1990 1991 1992 1993 1994 1995 1996 1997 1998 1999 2000 2001 2002 2003 2004 2005
As % of Total Private 17.78 17.98 18.95 16.47 18.50 21.08 32.43 37.85 35.13 32.63 33.34 35.65 33.76 31.18 30.91 32.64 Private Banks 5.65 4.22 1.54 1.85 3.91 11.29 11.05 10.46 7.83 6.70 6.15 6.30 6.63 6.75 11.39 Foreign Banks 3.91 3.80 2.18 1.26 1.06 0.79 1.00 1.61 1.37 0.96 0.85 1.82 1.31 1.24 1.78 5.29 Domestic Banks
2.02 1.85 2.03 0.28 0.79 3.12 10.29 9.45 9.09 6.87 5.85 4.34 5.00 5.39 4.97 6.10
Private Non-Banks
11.85 12.33 14.74 14.93 16.65 17.17 21.14 26.79 24.67 24.80 26.63 29.50 27.46 24.55 24.16 21.25
Public 82.22 82.02 81.05 83.53 81.50 78.92 67.57 62.15 64.87 67.37 66.66 64.35 66.24 68.82 69.10 67.36 Bangko Sentral 3/
20.26 19.74 10.54 7.33 4.83 5.07 4.02 7.85 10.40 9.14 9.42 11.07 8.67 7.70 4.96 3.44
Government Banks4/
2.39 1.90 3.00 4.20 6.18 5.94 4.61 5.09 5.13 5.37 5.84 5.13 5.48 5.26 5.89 5.63
Public - NG & Others
59.58 60.38 67.51 72.00 70.49 67.90 58.93 49.21 49.34 52.86 51.40 48.15 52.10 55.86 58.25 58.30
Source: International Department, Bangko Sentral ng Pilipinas

137
Annex A3: External Debt of the Philippines by Borrower, Breakdown as % of GDP External Debt by Borrower
1990 1991 1992 1993 1994 1995 1996 1997 1998 1999 2000 2001 2002 2003 2004 2005
As % of GDP Total External Debt
73.62 63.92 57.14 65.16 53.87 51.85 48.27 70.79 67.63 69.06 76.32 73.47 71.86 74.29 63.94 53.46
Private 13.09 11.49 10.83 10.73 9.97 10.93 15.66 26.79 23.76 22.54 25.44 26.19 24.26 23.17 19.76 17.45 Private Banks 4.36 3.61 2.41 1.00 1.00 2.03 5.45 7.82 7.07 5.41 5.12 4.52 4.53 4.93 4.31 6.09 Foreign Banks 2.87 2.43 1.25 0.82 0.57 0.41 0.48 1.14 0.93 0.66 0.65 1.34 0.94 0.92 1.14 2.83 Domestic Banks
1.49 1.18 1.16 0.18 0.43 1.62 4.97 6.69 6.15 4.74 4.47 3.19 3.59 4.01 3.18 3.26
Private Non-Banks
8.73 7.88 8.42 9.73 8.97 8.90 10.21 18.97 16.69 17.13 20.32 21.67 19.73 18.24 15.45 11.36
Public 60.53 52.42 46.31 54.43 43.91 40.92 32.62 44.00 43.87 46.53 50.88 47.27 47.60 51.13 44.18 36.01 Bangko Sentral 3/
14.91 12.62 6.02 4.78 2.60 2.63 1.94 5.56 7.03 6.31 7.19 8.13 6.23 5.72 3.17 1.84
Government Banks4/
1.76 1.22 1.72 2.74 3.33 3.08 2.22 3.60 3.47 3.71 4.46 3.77 3.94 3.91 3.76 3.01
Public - NG & Others
43.86 38.59 38.57 46.91 37.97 35.21 28.45 34.84 33.37 36.51 39.23 35.37 37.43 41.50 37.24 31.16
Source: International Department, Bangko Sentral ng Pilipinas

138
Annex B1: External Debt of the Philippines by Institutional Creditor, in Millions of US Dollars
1990 1991 1992 1993 1994 1995 1996 1997 1998 1999 2000 2001 2002 2003 2004 2005 In Millions of US Dollars By Institutional Creditor 28,322 29,933 30,771 34,686 37,351 37,698 39,883 42,972 46,146 50,997 51,206 51,900 53,645 57,395 54,846 54,186 Banks and Other Financial Institutions
9,078 8,692 4,409 4,421 4,326 4,928 6,380 7,786 8,017 9,145 10,411 11,621 11,790 10,681 11,175 12,899
Suppliers 2,312 2,802 2,963 3,213 3,549 2,587 2,588 2,359 1,562 1,690 1,578 1,879 2,079 3,236 2,041 1,883 Multilateral 7,411 7,935 8,323 9,202 9,859 9,617 8,634 8,638 10,058 10,245 9,665 9,553 8,970 9,031 8,440 7,349 of which: I B R D 3,944 4,009 4,144 4,597 4,855 4,995 4,676 4,146 4,298 4,071 3,626 3,251 3,322 3,446 3,317 2,884 IMF 997 1,165 1,183 1,312 1,139 814 405 889 1,562 1,822 2,031 1,948 1,675 1,193 755 390 A D B 2,215 2,446 2,598 2,892 3,331 3,332 3,117 3,091 3,490 3,536 3,324 3,160 3,271 3,710 3,730 3,500 Bilateral 8,547 9,572 11,328 13,369 15,033 14,393 13,439 13,307 14,926 16,429 15,336 14,531 15,621 16,895 16,800 14,282 Export Agencies 3,689 3,659 3,351 3,997 4,487 3,939 4,677 4,718 5,312 2,089 1,925 2,380 2,495 2,281 2,027 1,690 Others 4,858 5,913 7,977 9,372 10,546 10,454 8,762 8,589 9,614 14,340 13,411 12,151 13,126 14,614 14,773 12,592 Bondholders/Noteholders 863 845 3,652 4,459 4,541 5,917 8,686 10,519 11,160 12,900 13,322 13,567 14,752 17,111 15,839 17,184 Others 110 87 96 22 43 256 156 363 423 587 894 748 433 440 551 588 By Country Profile5/ 28,322 29,933 30,771 34,687 37,351 37,697 39,883 42,972 46,146 50,997 51,206 51,900 53,645 57,395 54,846 54,186 Country 20,048 21,153 18,796 21,026 22,951 22,163 22,563 23,815 24,928 27,852 28,219 28,780 29,923 31,253 30,567 29,653 of which: USA 5,202 5,034 6,622 6,894 3,440 3,294 3,500 4,018 4,358 5,131 5,423 6,043 6,269 6,223 3,896 3,491 Japan 8,570 9,491 9,159 11,081 12,648 12,169 11,109 10,293 11,887 14,205 13,136 11,986 12,927 14,478 14,528 12,385 UK 1,200 1,064 594 1,233 288 577 511 445 399 438 662 527 541 688 472 894 France 639 424 455 420 283 322 682 661 564 982 779 689 935 923 1,387 2,411 Germany 619 691 678 710 840 952 1,298 1,635 2,122 2,435 3,133 3,467 3,156 2,690 2,693 3,013 Korea 459 407 269 216 265 286 253 279 Multilateral Agencies 7,411 7,935 8,323 9,202 9,859 9,617 8,634 8,638 10,058 10,245 9,665 9,553 8,970 9,031 8,440 7,349 Bondholders/Noteholders 863 845 3,652 4,459 4,541 5,917 8,686 10,519 11,160 12,900 13,322 13,567 14,752 17,111 15,839 17,184
Source: International Department, Bangko Sentral ng Pilipinas

139
Annex B2: External Debt of the Philippines by Institutional Creditor, Breakdown as % of Total
1990 1991 1992 1993 1994 1995 1996 1997 1998 1999 2000 2001 2002 2003 2004 2005 As % of Total By Institutional Creditor Banks and Other Financial Institutions
32.05 29.04 14.33 12.75 11.58 13.07 16.00 18.12 17.37 17.93 20.33 22.39 21.98 18.61 20.38 23.81
Suppliers 8.16 9.36 9.63 9.26 9.50 6.86 6.49 5.49 3.38 3.31 3.08 3.62 3.88 5.64 3.72 3.48 Multilateral 26.17 26.51 27.05 26.53 26.40 25.51 21.65 20.10 21.80 20.09 18.87 18.41 16.72 15.73 15.39 13.56 of which: I B R D 13.93 13.39 13.47 13.25 13.00 13.25 11.72 9.65 9.31 7.98 7.08 6.26 6.19 6.00 6.05 5.32 IMF 3.52 3.89 3.84 3.78 3.05 2.16 1.02 2.07 3.38 3.57 3.97 3.75 3.12 2.08 1.38 0.72 A D B 7.82 8.17 8.44 8.34 8.92 8.84 7.82 7.19 7.56 6.93 6.49 6.09 6.10 6.46 6.80 6.46 Bilateral 30.18 31.98 36.81 38.54 40.25 38.18 33.70 30.97 32.35 32.22 29.95 28.00 29.12 29.44 30.63 26.36 Export Agencies 13.03 12.22 10.89 11.52 12.01 10.45 11.73 10.98 11.51 4.10 3.76 4.59 4.65 3.97 3.70 3.12 Others 17.15 19.75 25.92 27.02 28.23 27.73 21.97 19.99 20.83 28.12 26.19 23.41 24.47 25.46 26.94 23.24 Bondholders/Noteholders 3.05 2.82 11.87 12.86 12.16 15.70 21.78 24.48 24.18 25.30 26.02 26.14 27.50 29.81 28.88 31.71 Others 0.39 0.29 0.31 0.06 0.12 0.68 0.39 0.84 0.92 1.15 1.75 1.44 0.81 0.77 1.00 1.09 By Country Profile5/ Country 70.79 70.67 61.08 60.62 61.45 58.79 56.57 55.42 54.02 54.61 55.11 55.45 55.78 54.45 55.73 54.72 of which: USA 18.37 16.82 21.52 19.88 9.21 8.74 8.78 9.35 9.44 10.06 10.59 11.64 11.69 10.84 7.10 6.44 Japan 30.26 31.71 29.77 31.95 33.86 32.28 27.85 23.95 25.76 27.85 25.65 23.09 24.10 25.23 26.49 22.86 UK 4.24 3.55 1.93 3.55 0.77 1.53 1.28 1.04 0.86 0.86 1.29 1.02 1.01 1.20 0.86 1.65 France 2.26 1.42 1.48 1.21 0.76 0.85 1.71 1.54 1.22 1.93 1.52 1.33 1.74 1.61 2.53 4.45 Germany 2.19 2.31 2.20 2.05 2.25 2.53 3.25 3.80 4.60 4.77 6.12 6.68 5.88 4.69 4.91 5.56 Korea 0.00 0.00 0.00 0.00 0.00 0.00 0.00 1.07 0.88 0.53 0.42 0.51 0.53 0.44 0.51 0.00 Multilateral Agencies 26.17 26.51 27.05 26.53 26.40 25.51 21.65 20.10 21.80 20.09 18.87 18.41 16.72 15.73 15.39 13.56 Bondholders/Noteholders 3.05 2.82 11.87 12.86 12.16 15.70 21.78 24.48 24.18 25.30 26.02 26.14 27.50 29.81 28.88 31.71
Source: International Department, Bangko Sentral ng Pilipinas

140
Annex B3: External Debt of the Philippines by Institutional Creditor, Breakdown as % of GDP 1990 1991 1992 1993 1994 1995 1996 1997 1998 1999 2000 2001 2002 2003 2004 2005 As % of GDP By Institutional Creditor 73.62 63.92 57.14 65.16 53.87 51.85 48.27 70.79 67.63 69.06 76.32 73.47 71.86 74.29 63.94 53.46 Banks and Other Financial Institutions
23.60 18.56 8.19 8.31 6.24 6.78 7.72 12.83 11.75 12.38 15.52 16.45 15.79 13.83 13.03 12.73
Suppliers 6.01 5.98 5.50 6.04 5.12 3.56 3.13 3.89 2.29 2.29 2.35 2.66 2.78 4.19 2.38 1.86 Multilateral 19.26 16.94 15.45 17.29 14.22 13.23 10.45 14.23 14.74 13.87 14.40 13.52 12.02 11.69 9.84 7.25 of which: I B R D 10.25 8.56 7.69 8.64 7.00 6.87 5.66 6.83 6.30 5.51 5.40 4.60 4.45 4.46 3.87 2.85 IMF 2.59 2.49 2.20 2.46 1.64 1.12 0.49 1.46 2.29 2.47 3.03 2.76 2.24 1.54 0.88 0.38 A D B 5.76 5.22 4.82 5.43 4.80 4.58 3.77 5.09 5.11 4.79 4.95 4.47 4.38 4.80 4.35 3.45 Bilateral 22.22 20.44 21.03 25.11 21.68 19.80 16.27 21.92 21.88 22.25 22.86 20.57 20.92 21.87 19.59 14.09 Export Agencies 9.59 7.81 6.22 7.51 6.47 5.42 5.66 7.77 7.79 2.83 2.87 3.37 3.34 2.95 2.36 1.67 Others 12.63 12.63 14.81 17.61 15.21 14.38 10.61 14.15 14.09 19.42 19.99 17.20 17.58 18.92 17.22 12.42 Bondholders/Noteholders 2.24 1.80 6.78 8.38 6.55 8.14 10.51 17.33 16.36 17.47 19.85 19.20 19.76 22.15 18.47 16.95 Others 0.29 0.19 0.18 0.04 0.06 0.35 0.19 0.60 0.62 0.79 1.33 1.06 0.58 0.57 0.64 0.58 By Country Profile5/ 73.62 63.92 57.14 65.16 53.87 51.85 48.27 70.79 67.63 69.06 76.32 73.47 71.86 74.29 63.94 53.46 Country 52.11 45.17 34.90 39.50 33.10 30.48 27.31 39.23 36.53 37.72 42.06 40.74 40.08 40.45 35.64 29.25 of which: USA 13.52 10.75 12.30 12.95 4.96 4.53 4.24 6.62 6.39 6.95 8.08 8.55 8.40 8.06 4.54 3.44 Japan 22.28 20.27 17.01 20.82 18.24 16.74 13.45 16.96 17.42 19.24 19.58 16.97 17.32 18.74 16.94 12.22 UK 3.12 2.27 1.10 2.32 0.42 0.79 0.62 0.73 0.58 0.59 0.99 0.75 0.72 0.89 0.55 0.88 France 1.66 0.91 0.84 0.79 0.41 0.44 0.83 1.09 0.83 1.33 1.16 0.98 1.25 1.19 1.62 2.38 Germany 1.61 1.48 1.26 1.33 1.21 1.31 1.57 2.69 3.11 3.30 4.67 4.91 4.23 3.48 3.14 2.97 Korea 0.00 0.00 0.00 0.00 0.00 0.00 0.00 0.76 0.60 0.36 0.32 0.38 0.38 0.33 0.33 0.00 Multilateral Agencies 19.26 16.94 15.45 17.29 14.22 13.23 10.45 14.23 14.74 13.87 14.40 13.52 12.02 11.69 9.84 7.25 Bondholders/Noteholders 2.24 1.80 6.78 8.38 6.55 8.14 10.51 17.33 16.36 17.47 19.85 19.20 19.76 22.15 18.47 16.95
Source: International Department, Bangko Sentral ng Pilipinas

141
Annex C: Outstanding Philippine External Debt Owed to Bilateral Creditors 1/
By Creditor Country in million US dollars as of end of periods indicated
1996 1997 1998 1999 2000 2001 2002 2003 2004 2005
Japan 10,209 9,390 10,697 12,513 11,486 10,169 11,110 12,575 12,752 10,876 United States of America 1,089 1,346 1,518 1,409 1,343 1,595 1,491 1,294 1,130 947
EU Countries Austria 45 45 38 14 Belgium 173 124 116 89 24 72 68 69 52 33 Denmark 70 53 49 40 29 24 23 22 18 11 Finland 100 93 72 59 50 37 251 189 238 218 France 82 200 219 185 170 154 183 204 208 168 Germany 900 997 1,095 1,169 1,171 1,223 1,232 1,204 1,144 966 Italy 67 137 132 132 120 105 95 84 73 57 Netherlands 9 23 36 43 178 162 154 143 108 30 Spain 233 199 184 155 140 148 162 171 166 145 Sweden 38 38 31 24 16 United Kingdom 140 120 122 106 127 148 137 128 117 88
ASEAN Countries Brunei 96 87 78 69 60 51 42 33 24 16 Indonesia 4 Malaysia 1 1 1 26 25 25 24 23 23 Vietnam 5 16
Others Australia 47 62 83 84 128 195 190 207 206 175 Canada 69 83 93 68 63 140 151 179 162 127 China 0 10 10 10 71 77 180 India 0 0 1 28 Israel 13 Korea, Republic Of 123 360 325 208 168 184 167 134 163 89 Kuwait 3 2 1 6 7 6 9 13 Norway 1 1 1 2 2 2 2 1 1 OPEC 10 Pakistan 0 3 3 Taiwan 6 29 102 98 40 37 37 61 65 53
Total 13,439 13,307 14,926 16,429 15,336 14,531 15,621 16,895 16,800 14,282 1/ Consist of loans from foreign governments, foreign government agencies, foreign government banks and export credit agencies Source: International Department, Bangko Sentral ng Pilipinas Date last modified: 6 July 2006

142
Annex D: External Debt by Length of Maturity
TOTAL EXTERNAL DEBT1/r/ as of periods indicated In million US dollars
1990 1991 1992 1993 1994 1995 1996 1997 1998 1999 2000 2001 2002 2003 2004 2005
By Type of Debt
28,322 29,933 30,771 34,687 37,351 37,697 39,883 42,972 46,146 50,997 51,206 51,900 53,645 57,395 54,846 54,186
Medium and Long-Term
25,193 26,198 26,385 30,206 33,149 33,636 34,452 36,626 40,289 46,048 45,711 45,900 48,086 51,216 49,800 47,791
Short-Term
3,129 3,735 4,386 4,481 4,201 4,061 5,431 6,346 5,857 4,949 5,495 6,000 5,559 6,179 5,046 6,395
Trade 2,746 3,415 4,000 2,925 2,388 1,419 2,280 1,896 1,190 1,008 1,151 1,197 1,026 1,299 1,675 2,178 Non-Trade 382 320 386 1,555 1,814 2,642 3,151 4,450 4,667 3,941 4,345 4,802 4,533 4,879 3,371 4,216 % of Total Medium and Long-Term
88.95 87.52 85.75 87.08 88.75 89.23 86.38 85.23 87.31 90.30 89.27 88.44 89.64 89.23 90.80 88.20
Short-Term
11.05 12.48 14.25 12.92 11.25 10.77 13.62 14.77 12.69 9.70 10.73 11.56 10.36 10.77 9.20 11.80
Trade 9.70 11.41 13.00 8.43 6.39 3.76 5.72 4.41 2.58 1.98 2.25 2.31 1.91 2.26 3.05 4.02 Non-Trade 1.35 1.07 1.25 4.48 4.86 7.01 7.90 10.36 10.11 7.73 8.49 9.25 8.45 8.50 6.15 7.78 As % of GDP
By Type of Debt
73.62 63.92 57.14 65.16 53.87 51.85 48.27 70.79 67.63 69.06 76.32 73.47 71.86 74.29 63.94 53.46
Medium and Long-Term
65.48 55.94 48.99 56.74 47.81 46.26 41.70 60.33 59.05 62.36 68.13 64.97 64.41 66.29 58.06 47.15
Short-Term
8.13 7.98 8.14 8.42 6.06 5.59 6.57 10.45 8.58 6.70 8.19 8.49 7.45 8.00 5.88 6.31
Trade 7.14 7.29 7.43 5.49 3.44 1.95 2.76 3.12 1.74 1.37 1.72 1.69 1.37 1.68 1.95 2.15 Non-Trade 0.99 0.68 0.72 2.92 2.62 3.63 3.81 7.33 6.84 5.34 6.48 6.80 6.07 6.32 3.93 4.16
Source: International Department, Bangko Sentral ng Pilipinas

143
Annex D: Outstanding Philippine External Debt Owed to Bilateral Creditors 1/
By Creditor Country in million US dollars as of end of periods indicated
1996 1997 1998 1999 2000 2001 2002 2003 2004 2005
Japan 10,209 9,390 10,697 12,513 11,486 10,169 11,110 12,575 12,752 10,876 United States of America 1,089 1,346 1,518 1,409 1,343 1,595 1,491 1,294 1,130 947
EU Countries Austria 45 45 38 14 Belgium 173 124 116 89 24 72 68 69 52 33 Denmark 70 53 49 40 29 24 23 22 18 11 Finland 100 93 72 59 50 37 251 189 238 218 France 82 200 219 185 170 154 183 204 208 168 Germany 900 997 1,095 1,169 1,171 1,223 1,232 1,204 1,144 966 Italy 67 137 132 132 120 105 95 84 73 57 Netherlands 9 23 36 43 178 162 154 143 108 30 Spain 233 199 184 155 140 148 162 171 166 145 Sweden 38 38 31 24 16 United Kingdom 140 120 122 106 127 148 137 128 117 88
ASEAN Countries Brunei 96 87 78 69 60 51 42 33 24 16 Indonesia 4 Malaysia 1 1 1 26 25 25 24 23 23 Vietnam 5 16
Others Australia 47 62 83 84 128 195 190 207 206 175 Canada 69 83 93 68 63 140 151 179 162 127 China 0 10 10 10 71 77 180 India 0 0 1 28 Israel 13 Korea, Republic Of 123 360 325 208 168 184 167 134 163 89 Kuwait 3 2 1 6 7 6 9 13 Norway 1 1 1 2 2 2 2 1 1 OPEC 10 Pakistan 0 3 3 Taiwan 6 29 102 98 40 37 37 61 65 53
Total 13,439 13,307 14,926 16,429 15,336 14,531 15,621 16,895 16,800 14,282 1/ Consist of loans from foreign governments, foreign government agencies, foreign government banks and export credit agencies Source: International Department, Bangko Sentral ng Pilipinas Date last modified: 6 July 2006
Annex E: TOTAL PHILIPPINE EXTERNAL DEBT BY MATURITY, BY CREDITOR, BY BORROWER Maturity Profile by Borrower and Creditor Based on Original Maturity as of 31 March 2006 (valued at 31 March 2006 rates)
in million US dollars Medium & Long Term
Total Outstanding
Short Term
% Share of Total
Medium & Long Term
% Share of Total
Over 1 to 5 Years
% Share of Total
Over 5 Years
% Share of Total
Weighted Average Maturity
(In Years)
TOTAL 55304.2 6148.2 11.1 49156.0 88.9 5589.5 10.1 43566.5 78.8 17.6 Multilateral 7158.2 0.0 7158.1 100.0 174.1 2.4 6984.1 97.6 20.9 Bilateral 14331.0 77.6 0.5 14253.4 99.5 353.8 2.5 13899.6 97.0 25.3 Banks & Other Financial Institutions 12061.1 3894.6 32.3 8166.5 67.7 2568.3 21.3 5598.2 46.4 10.3 Suppliers / Exporters 2412.5 1809.5 75.0 603.0 25.0 252.2 10.5 350.8 14.5 7.7 Bondholders / Noteholders 18768.9 0.0 18768.9 100.0 2208.8 11.8 16560.1 88.2 14.0 Others 572.6 366.4 64.0 206.1 36.0 32.3 5.6 173.8 30.4 7.7 PUBLIC SECTOR 37736.9 702.3 1.9 37034.6 98.1 2533.7 6.7 34500.9 91.4 20.0 Multilateral 6657.3 0.0 6657.3 100.0 99.1 1.5 6558.2 98.5 21.6 Bilateral 12168.6 0.0 12168.6 100.0 105.4 0.9 12063.2 99.1 27.7 Banks & Other Financial Institutions 2994.2 691.7 23.1 2302.5 76.9 792.7 26.5 1509.8 50.4 10.7 Suppliers / Exporters 29.1 0.0 29.1 99.9 8.9 30.6 20.2 69.4 10.4 Bondholders / Noteholders 15740.9 0.0 15740.9 100.0 1527.5 9.7 14213.3 90.3 14.8 Others 146.7 10.5 7.2 136.2 92.8 0.0 136.2 92.8 7.0 PRIVATE SECTOR 17567.3 5445.9 31.0 12121.4 69.0 3055.8 17.4 9065.7 51.6 10.2 Multilateral 500.8 0.0 500.8 100.0 74.9 15.0 425.9 85.0 11.5 Bilateral 2162.4 77.6 3.6 2084.8 96.4 248.4 11.5 1836.4 84.9 11.1 Banks & Other Financial Institutions 9066.8 3202.9 35.3 5864.0 64.7 1775.6 19.6 4088.4 45.1 10.2 Suppliers / Exporters 2383.4 1809.5 75.9 573.9 24.1 243.3 10.2 330.6 13.9 7.5 Bondholders / Noteholders 3028.0 0.0 3028.0 100.0 681.3 22.5 2346.8 77.5 10.0 Others 425.9 355.9 83.6 69.9 16.4 32.3 7.6 37.6 8.8 8.9 Source: International Department, Bangko Sentral ng Pilipinas

144
Annex F: MDG-Related Projects With Possible High Commercial Rates of Return17
This section documents some MDG-related projects that may yield high commercial rates of return, which may attract domestic or foreign investors, and debt-equity conversions. F.1 An Ecotourism Project to Save Marine Resources and Mangroves in Balabac, Southern Palawan Ecotourism has recently been advocated as a community-based endeavor to attract joint ventures with possible investors to save the natural resources in the area, and at the same time promote the natural resource environment as a tourist area. Balabac is a group of islands in Southern Palawan whose marine resources are being threatened by illegal fishing. The biodiversity there is quite high with marine attractions such as dolphins and whales that are sure to generate tourist interest. The mangroves are also being threatened with tan barking which is used for dyes in batiks. Furthermore, the local community is having an adverse relation with a prominent political clan which is monopolizing pearl farming in a declared marine sanctuary (sanctioned by DENR). The islands are quite remote and require speed boats to be accessible from the nearest town, Bataraza, in mainland (Southern) Palawan. The ecotourism project would involve investing in speed boats and converting the area into a resort – including the protection of the marine resources and mangroves, which will entail protecting the area from illegal fishing and illegal tan barking. By providing employment and higher income in the area, the deep resentment of the local people against the monopoly pearl farming nearby may be reduced. It is suggested that a joint venture be proposed and negotiated between the local government and community on one hand, and possible investors (including those proposing debt-equity conversions if such investors are not forthcoming), on the other. The project can be offered to either bilateral or private commercial investors. F.2 A Bio-prospecting Investment to Save the Forests, Natural Park and Terrestrial Area of Samar The destruction of large forested areas in Southern Leyte is notorious for causing fatal and disastrous floods in the area. The nearby island of Samar faces a similar threat if nothing is done to protect its natural forests and natural park. 17 The authors would like to thank Rina Maria P. Rosales of Resources, Environment and Economics Center for Studies, Inc. (REECS) for recommending the ecotourism and bio-prospecting projects; and Leonardo Lanzona of the Ateneo de Manila University Economics Department for recommending the jathropa project. All mistakes are by the authors.
145
The three provinces of Samar all are hosts to 333,000 hectares of a protected natural park and protected terrestrial area managed by the Protected Area Management Board (PAMB). The area, however, is threatened by large scale logging by a powerful national politician. The logging has been stopped temporarily because of sharp outcries from the Catholic Bishop Conference of the Philippines (CBCP). At the same time, attempts are being made to deprotect part of the park to allow mining of very high-grade bauxite (used to produce aluminum). To ensure that the natural park remains protected but to generate incomes in the area (to offset initiatives for the bauxite mining and logging), there is a proposal for a joint venture between PAMB and either a bilateral or commercial investor(s) to invest in wet bio-prospecting in the area. The area possesses rich biodiversity and thousands of seed-bearing flora. This may be a potentially good area to develop gene banks for non-dry land. Bio-prospecting for gene banking may be quite profitable if it yields commercially viable pharmaceutical and biotechnical products. This project may attract international, bilateral and commercial funds – such as the Global Environment Facility (GEF). Obviously bio-prospecting and gene banking requires large and lumpy investments. It is proposed that a feasibility study for a joint venture be studied between the investor and the PAMB and the three provincial governments. This is to ensure that whatever patents would be derived would be shared by the local areas and local communities. F.3 Investment in Biofuel: Jatropha The population is starting to suffer from higher world oil and gasoline prices. Some of the biggest victims are workers in the transportation sector (jeepney, tricycle, bus, taxi drivers) as transportation fares are not allowed to increase in pace with the gasoline and diesel prices. As transportation fares eventually increase, urban and rural workers dependent on much traveling will also be affected. Finally everybody eventually suffers from higher prices of LPG, kerosene, electricity charges, transportation costs and higher overall inflation. The government has emphasized the need to invest in biofuel alternatives, given that the world oil prices are expected to remain high for the medium and perhaps the long term. Ethanol had been studied and proposed more extensively than jatropha (‘tuba tuba’ shrub in the local dialect). Jatropha is a curcas shrub that grows well in Philippine soil. In the Philippines, it only takes six to eight months from planting to harvesting, compared to several years in other countries. Its seed is 40% oil, and this is the one that is a good substitute for oil and gasoline. It also provides several side products that increase its commercial attractiveness (fertilizers, soap, health [noni] juice and medicine). The processing of jatropha oil as substitutes for kerosene and cooking oil does not require large investments and are being done successfully through small-scale processing in India. But processing of high-grade substitutes to gasoline needs

146
higher scale of investments. It is claimed by firms interested in entering this sector that economies of scale requires 20,000 hectares of contiguous land planted to jatropha. Flying V (a local gas refining and distribution firm) and D-1 of Germany are considering entering the Philippine production of jatropha. D-1 was able to get the processing franchise in China but failed to do so in India. But in the Philippines, everybody is waiting for the biofuel tax incentive law that Congress is supposed to deliberate on. Together with settling the tax incentives, feasibility studies must be done if two areas of prospective investments can be promoted: 1. an agribusiness project for large-scale growing of the jatropha shrub employing significant number of workers in an
identified province or region, 2. a competitive bid by competent investors for jatropha processing for all levels of substitutes for oil and gasoline. The above can only be successful if there is a national plan with a definite timeframe on using jatropha to significantly reduce public transportation costs and fares. As of now, Germany is experimenting with transportation vehicles using primarily jatropha oil.

147
References: Asian Development Bank (2005), Poverty in the Philippines: Income, Assets and Access, January. Bautista, M.C.B. (2005), “Ideologically motivated conflicts in the Philippines: exploring the possibility of an early warning system” in Background paper for the 2005 Philippine Human Development Report. Cooperation Internationale Pour le Developpement et la Solidarite (CIDSE) (2006), “The New World Bank/ IMF Debt Sustainability Framework: A Human Development Assessment,” April. Daguino, D.S. (2004), Secular and Islamic Education in the ARMM, ARMM Roundtable Series no. 9. Del Mundo, F. (2006) “State of RP education: learning test scores below world average,” Philippine Daily Inquirer, 5 Jun 2006. Department of Education. FY 2006 Budget Proposal. December, 2005. Edillon, R.G. (2005), “Ideologically motivated conflicts in the Philippines: in search of underlying causes,” Background paper for the 2005 Philippine Human Development Report. Fayolle, Ambroise (2006), Debt swaps in the Paris Club, Powerpoint presentation at the Debt Swaps Conference-Madrid. Japan International Cooperation Agency (2002), Country profile on environment: Philippines. www.jica.go.jp/english/global/env/profiles/pdf/03.pdf. Accessed on June 24, 2006. Manasan, Rosario (2006), Financing the Millennium Development Goals: The Philippines, Report Submitted to the National Economic and Development Authority (NEDA). Moye, Melissa (2000) Overview of debt conversion. Debt Relief International. National Antipoverty Commission, 2005. Implementing guidelines on the president’s priority program on water. http://www.napc.gov.ph/10pt_agenda.htm. Accessed on June 24, 2006. National Economic Development Authority. (2004) Manual for Project Monitoring. Manila: NEDA. Paris Club (2006) “The Evian approach,” http://www.clubdeparis.org

148
Pettifor, Ann, Barwa and Paul Zeitz (2005), Global Fund Debt Conversions A Joint Report from Advocacy International and Global Aids Alliance, July. Philippine Business for Social Progress (PBSP) (2004), Responding to the Millennium Development Challenge: A Roadmap for Philippine Business. Republic of the Philippines. 2002. Government procurement reform act. www.tag.org.ph/phillaw/Gov_Pro_Ref_%20Act.pdf. Accessed on June 24, 2006. Rieffel, Lex (2005a), “After the tsunami, flexible debt relief is needed,” Financial Times (London), Jan 14, 2005. Rieffel, Lex. 2005b. Nigeria’s Paris Club debt problem. Policy Brief #144, The Brookings Institution.
Social Watch (2006), Moving forward with the Millennium Development Goals. Philippines: Tiongson, R. (2006) “Eradicate extreme poverty and hunger: Will we walk the line?” In May Pera pa ba? UNCTAD (2001) The conversion of Paris Club debt: procedures and potential. United Nations, New York and Geneva. UNCTC (2000) Debt equity conversions: a guide for decision makers. United Nations, New York City United Nations (2005), Report of the Secretary General of the United Nations, Ch. II, “Freedom From Want”, March 2005. United Nations Development Programme. (2005a) 2005 Philippine Human Development Report. Makati City: UNDP. _______. 2005b. The Second Philippine Progress Report on the Millennium Development Goals. Makati City: UNDP. _______. 2003, “Practice Note on the Heavily Indebted Poor Countries (HIPC) Initiative” Weiss, Martin A (2006) Iraq’s debt relief: procedure and potential implications for international debt relief. Congressional Research Service, The Library of Congress.

![[Millennium Development Goals 1 and 3] By [Author Name ... · MILLENNIUM DEVELOPMENT GOALS 1 & 3 4 were termedas “Millennium Development Goals” and United Nations Millennium Declaration](https://img.dokumen.tips/doc/110x75/5edb6813ad6a402d66659cfd/millennium-development-goals-1-and-3-by-author-name-millennium-development.jpg)