Embed Size (px)
Citation preview

Independent Review of Cost Forecasts
SEQWATER
Gold Coast Desalination Project
QE06934R001 | 3
Client Reference
24 July 2014
Gold Coast Desalination Project
QE06934R001 1
Independent Review of Cost Forecasts
Project no: QE06934
Document title: Gold Coast Desalination Project
Document no: QE06934R001
Revision: 3
Date: 24 July 2014
Client name: Seqwater
Client no: Client Reference
Project manager: Madeleine Kench
Author: Gerhard Joubert, Maddy Kench, Jamie Fellingham
File name: QE06934R001 - GCDP - Independent Review of Cost Forecasts - V4
Sinclair Knight Merz Pty Ltd (Jacobs)
ABN 37 001 024 095
32 Cordelia Street
PO Box 3848
South Brisbane QLD 4101 Australia
T +61 7 3026 7100
F +61 7 3026 7300
www.jacobs.com
COPYRIGHT: The concepts and information contained in this document are the property of Sinclair Knight Merz Pty Ltd (Jacobs). Use or copying
of this document in whole or in part without the written permission of Jacobs constitutes an infringement of copyright.
Document history and status
Revision Date Description By Review Approved
A 02/06/2014 For internal review M Kench S Hinchliffe S Hinchliffe
0 02/06/2014 Draft for client review M Kench S Hinchliffe P Nixon
1 11/06/2014 Final M Kench S Hinchliffe P Nixon
2 30/06/2014 Final M Kench S Hinchliffe P Nixon
3 22/07/2014 Final M Kench S Hinchliffe P Nixon

Gold Coast Desalination Project
QE06934R001 2
Contents
Executive Summary ............................................................................................................................................... 5
1. Introduction ................................................................................................................................................ 6
1.1 Scope of work ................................................................................................................................................................................. 6
1.2 Conflicts of interest ......................................................................................................................................................................... 7
2. Background ................................................................................................................................................ 8
2.1 Basis of Plant Operation and Maintenance..................................................................................................................................... 8
3. Outline of budget ..................................................................................................................................... 11
3.1 Information provided ..................................................................................................................................................................... 11
3.2 Overall budget .............................................................................................................................................................................. 11
3.3 Sample selection for detailed analysis .......................................................................................................................................... 12
3.4 Initial gap analysis ........................................................................................................................................................................ 14
4. Overall assessment ................................................................................................................................. 15
5. Preventative maintenance ...................................................................................................................... 18
5.1 Prudency assessment................................................................................................................................................................... 20
5.2 Efficiency assessment .................................................................................................................................................................. 22
5.3 Summary....................................................................................................................................................................................... 24
6. Direct employee costs ............................................................................................................................ 25
6.1 Provided information ..................................................................................................................................................................... 25
6.2 Prudency assessment................................................................................................................................................................... 27
6.3 Efficiency assessment .................................................................................................................................................................. 27
6.3.1 Total employee cost as a proportion of total operating expenditure ............................................................................................. 30
6.3.2 Water supplied as a proportion of total full-time equivalents ........................................................................................................ 31
6.3.3 Total employee cost as a proportion of total full-time equivalents ................................................................................................ 32
6.4 Summary....................................................................................................................................................................................... 33
7. Repair & Maintenance - Projects ........................................................................................................... 34
7.1 Provided information ..................................................................................................................................................................... 34
7.2 Background ................................................................................................................................................................................... 35
7.3 Prudency assessment................................................................................................................................................................... 35
7.3.1 Relocation of mapping lines to outside high pressure areas ........................................................................................................ 35
7.3.2 Relocation of RO sample panels to outside high pressure areas ................................................................................................. 37
7.4 Efficiency assessment .................................................................................................................................................................. 38
7.5 Summary....................................................................................................................................................................................... 38
8. Other Fixed Costs .................................................................................................................................... 39
8.1 Prudency and efficiency assessment............................................................................................................................................ 40
8.1.1 Potable water ................................................................................................................................................................................ 40
8.1.2 Security patrols ............................................................................................................................................................................. 40
8.2 Summary....................................................................................................................................................................................... 42
9. Summary .................................................................................................................................................. 43
9.1 Key findings .................................................................................................................................................................................. 43
9.2 Recommendations ........................................................................................................................................................................ 44

Gold Coast Desalination Project
QE06934R001 3
Appendix A. Initial data review and gap analysis
Appendix B. Organisation structure

Gold Coast Desalination Project
QE06934R001 4
Important note about your report
The sole purpose of this report and the associated services performed by Jacobs are to review the Gold Coast
Desalination Project budget proposal for period 2016-2018 in accordance with the scope of services set out in
the contract between Jacobs and the Client. That scope of services, as described in this report, was developed
with the Client.
In preparing this report, Jacobs has relied upon, and presumed accurate, any information (or confirmation of the
absence thereof) provided by the Client and/or from other sources. Except as otherwise stated in the report,
Jacobs has not attempted to verify the accuracy or completeness of any such information. If the information is
subsequently determined to be false, inaccurate or incomplete then it is possible that our observations and
conclusions as expressed in this report may change.
Jacobs derived the data in this report from information sourced from the Client (if any) and/or available in the
public domain at the time or times outlined in this report. The passage of time, manifestation of latent conditions
or impacts of future events may require further examination of the project and subsequent data analysis, and re-
evaluation of the data, findings, observations and conclusions expressed in this report. Jacobs has prepared
this report in accordance with the usual care and thoroughness of the consulting profession, for the sole
purpose described above and by reference to applicable standards, guidelines, procedures and practices at the
date of issue of this report. For the reasons outlined above, however, no other warranty or guarantee, whether
expressed or implied, is made as to the data, observations and findings expressed in this report, to the extent
permitted by law.
This report should be read in full and no excerpts are to be taken as representative of the findings. No
responsibility is accepted by Jacobs for use of any part of this report in any other context.
The information and analysis provided in this report has been inhibited by the client imposed time and budget
constraints.
This report has been prepared on behalf of, and for the exclusive use of, Jacobs’s Client, and is subject to, and
issued in accordance with, the provisions of the contract between Jacobs and the Client. Jacobs accepts no
liability or responsibility whatsoever for, or in respect of, any use of, or reliance upon, this report by any third
party.

Gold Coast Desalination Project
QE06934R001 5
Executive Summary
Jacobs undertook an independent review of Veolia’s pre-budget submission of operating expenditure for
2014/15 financial year (FY) for the Gold Coast Desalination Plant (GCDP). The GCDP has the capacity to
produce 133 ML of treated water per day, but utilisation has been low recently because of increased water
security in the region. The GCDP is currently on hot standby, ie it is not permanently in use, but is required to be
capable of being brought back on line within a set period.
Jacobs’ review included a brief review of trends in historical costs over the last two years. Over this period,
Veolia is expecting that its total fixed operating expenditure will increase from $10.5M (FY2012/13) to $13.1M
(FY 2014/15), which represents a 44% increase. The fixed expenditure component is largely independent of the
operational mode of the plant and refers to costs associated with routine operating and maintenance activities
and makes up the majority of the total operating expenditure. It is notable that there are significant variances
between the FY 2012/13 actual costs and the FY 2014/15 budgeted cost with increases in the employee and
preventative repair and maintenance costs and corresponding decreases in fixed energy and project related
repair and maintenance costs. These high expenditure categories formed the key focus of Jacobs’ review. The
review specifically considered:
Preventative maintenance costs
Direct employee costs
Repair & maintenance – projects
Other fixed costs
Jacobs found the majority of expenditure reviewed to be prudent and efficient. However, there are areas in
which Jacobs recommended savings could be made. The table below outlines the proposed savings from
Jacobs review.
Table 0.1 : Proposed savings
Category Saving Comments
Preventative
Maintenance
$11,800 With the exception of the intake and outfall structures inspections, expenditure on the main
preventative maintenance tasks reviewed is prudent. The need to undertake a detailed
inspection of the intake and outfall structures every six months is found to be not prudent.
Jacobs recommends that the detailed inspection should be scheduled to occur every two years
(ie next in 2016), with the timing reviewed following the major inspection in August 2014. This
represents an overall reduction in person hours of 118 person hours (or a reduction in costs of
$11,800, based on $100/hr).
Jacobs also recommends that consideration should be given to allocating calibration activities to
Veolia’s senior operator and determining the maintenance intervals for equipment on an hours-
run basis, rather than a fixed time basis.
Repair & Maintenance
- Projects
N/A The projects selected from review have already been excluded from Seqwater’s budget. Jacobs
supports this action as the prudency and or efficiency of these projects is yet to be established.
Other Fixed Costs $246,000 to
$306,000
Jacobs supports the findings of the business case to reduce these costs by utilising GCDP
potable water to substitute this consumption of potable water. This will also reduce GCDP’s
requirement for the GCCC supply to be available in order to run GCDP. Jacobs notes that this
project is already underway and understands that the benefits will be realised in the FY 2014/15.
Total $517,800 to
$577,800

Gold Coast Desalination Project
QE06934R001 6
1. Introduction
Seqwater engaged Jacobs to review five separate budget proposals relating to the Western Corridor Recycled
Water (WCRW) Scheme and the Gold Coast Desalination Plant (GCDP). The purpose of the investigation was
to assess the budget proposals provided by Seqwater’s operations and maintenance sub-contractor in context
of prudency and efficiency as determined by the Queensland Competition Authority (QCA).
This report outlines Jacobs’ findings for the review of the budgets submitted by the GCDP.
The GCDP was developed as an asset to address the impact of the drought, turning seawater into drinking
water using a reverse osmosis (RO) process. It has the capacity to produce 133 ML of treated water per day,
but utilisation has been low recently because of increased water security in the region. The GCDP is currently
on hot standby, ie it is not permanently in use, but is required to be capable of being brought back on line within
a set period.
The plant operates under a design-build-operate contract with the Gold Coast Desalination Alliance, comprising
Seqwater, John Holland and Veolia.
1.1 Scope of work
Seqwater requested an independent review of the operating expenditure proposed for the Gold Coast
Desalination Plant for the 2014/15 financial year (FY) and commissioned Jacobs to undertake this review. The
review seeks to establish whether the proposed operating expenditure supports the business objectives of
prudency and efficiency as required by the QCA.
The budgets reviewed, are the budgets as developed and provided by Seqwater’s relevant operations and
maintenance sub-contractor. For the GCDP, these are the budgets developed by the Gold Coast Desalination
Alliance partners of John Holland and Veolia. The costs reviewed are Veolia’s Pre-Budget Submission for
FY14/15. The costs included within this review exclude Seqwater’s internal costs, unless otherwise stated.
The QCA’s definitions for prudency and efficiency are included below for capital and operating costs. These
definitions have been taken from the QCA’s terms of reference for the last regulatory review. These definitions
have been applied in this review.
Operating Costs
Prudent - required to meet legal and regulatory obligations or contracts with customers; and
Efficient - undertaken in a least-cost manner over the life of the relevant assets and is consistent with
relevant benchmarks.
Capital Costs
Prudent - required as a result of a legal obligation, new growth, renewal of existing infrastructure or it
achieves an increase in the reliability or the quality of supply that is explicitly endorsed or desired by
customers, external agencies or participating councils
Efficient - capital expenditure is efficient if:
- The scope of the works is the best means of achieving the desired outcomes after having regard to
the options available, including more cost-effective regional solutions, the substitution possibilities
between capital and operational expenditure and non-network alternatives such as demand
management;
- The standard of the works conforms to technical, design and construction requirements in legislation,
industry and other standards, codes and manuals, Compatibility with existing and adjacent
infrastructure is relevant as is consideration of modern engineering equivalents and technologies.
- The cost of the defined scope and standard of works is consistent with conditions prevailing in the
markets for engineering, equipment supply and construction.

Gold Coast Desalination Project
QE06934R001 7
To assess the proposed expenditure against the objectives of prudency and efficiency the following questions
may typically be considered:
Has the need for the expenditure been thoroughly investigated, and is it clearly defined, justified and
documented?
Is evidence of the need, including all reference material that demonstrates the need well documented and
available?
Have all feasible expenditure options been identified and analysed and has the least cost option been
selected?
Is there a sound appraisal process in place to allow for consistency and transparency in approach?
Is the proposed operating costs accurate, capable of verification, consistent with internal costing method,
and has variations to previous plans been explained?
1.2 Conflicts of interest
Jacobs acknowledges a potential perceived conflict of interest in the following sections. Sinclair Knight Merz
(SKM) was acquired by Jacobs in December in 2013. SKM has had the following involvement with the GCDP:
SKM was involved with certain aspects of the design of the GCDP
SKM has previously undertaken surveys of various aspects of the GCDP (refer Section 5.2)
SKM undertook a Security Concept Report (June 2007) (refer Section 8.1.2)
Seqwater has been aware of SKM’s previous involvement with the GCDP from the proposal stage of this
project.

Gold Coast Desalination Project
QE06934R001 8
2. Background
2.1 Basis of Plant Operation and Maintenance
Veolia has developed operation and maintenance costs for the GCDP based on the following assumptions,
according to a letter from Veolia to Seqwater (Ben Bowen to Alex Fisher, 14 April 2014)1. Jacobs notes that
Veolia have advised that the assumptions below relate to forecast figure for 2016 to 2028 and do not
necessarily relate to FY 2014/15.
General Assumptions
No allowance made for foreign exchange movement
Cost codes used in monthly claims used to map to cost categories provided by Seqwater in the templates
Operational Assumptions:
Volume produced (3.4 million litres per day) is per the GCDP Proposed Operating Volumes Table provided
by Seqwater with the exception of 2013, 2014, 2015. Actual or budget volumes have been used for the
years 2013, 2014 and 2015.
Input seawater quality and temperature as per monthly averages for the last 12 months
Pre-treatment running of 18 hours prior to commencement of production and during production for all
months except December, January and February has been assumed
Pre-treatment running of 24 hours per day, 7 days per week for December, January and February.
Diffuser seawater bypass volumes per current operation
Potable water purchased from Gold Coast City Council for current internal functions and at current cost
plus 10%
Auto-flushing project complete and in operation
Access to RO building as described in the R2A Report2
Increased leak surveillance start up as described in the R2A Report
Availability Assumptions
Maintained in a state to be able to produce at 100% of capacity within 72 hours
Maintained in a state to be able to produce at 33% capacity within 24 hours
Economic Assumptions
All costs are in 2014 (Dec 2013) dollars with the exception of 2013 being in 2013 dollars and 2015 being in
2015 dollars.
Veolia did not produce 2013 Actual figures and Seqwater has not provided these to Veolia. 2013 invoiced
amounts (claim) have been used in the regulatory template provided to Seqwater.
Veolia did not produce 2014 Q2 figures and Seqwater has not provided these to Veolia. 2014 invoiced
amounts (claim) and Veolia’s Q3 submission have been used in the template provided to Seqwater.
The 2015 budget expenditure figures per Veolia’s submission have been used for the 2015 entries in the
template. Veolia has not been advised of any adjustments made to these figures by Seqwater.
Costs have been separated as per the OPEX template provided by Seqwater
No incidents will occur that would require construction phase Professional Indemnity Insurance run off to
respond
1 Note that assumptions may have been re-worded for clarity 2 Discussed further in Section 7
Gold Coast Desalination Project
QE06934R001 9
No regulatory/statutory changes, with the exception of Superannuation Guarantee (Administration) Act
Variable cost assumptions
Variable Electricity:
For the period of 1 November 2013 to 31 March 2014, 519ML were produced over 151 days ie. 3.4ML/d at
12ML twice per week. This has been used to calculate average electricity demand, consumption and
power factor
No 100% production testing has been included within the total annual volume parameters
Treatment Chemicals:
Dosing rates consistent with 2015 budget
Cleaning Chemicals:
One CIP of membranes/year
Sludge and Waste Disposals:
Sludge and waste disposal rates consistent with 2015 budget levels
Fixed Costs Assumptions
Employee Cost – Direct
Head count to remain constant throughout the 15 year reporting period from FY 2012/13 to FY 2027/28
Includes Superannuation Guarantee Charge increase to 12% by 2020
2014 operators Enterprise Bargaining Arrangement (EBA) rates applied from 2016
Employee Cost – Indirect
Training costs based on training forecast
External Consultant Costs
Costs consistent with 2015 budget
Motor vehicle Related Costs
The number of vehicles required for the plant will remain consistent during the 15 year period
Water Analysis & Lab Consumables
Water quality monitoring (operational and verification) for sea water and drinking (treated) water is carried
out as per the water quality monitoring program that is currently in place
Repair and Maintenance – Preventative
Based on predicted maintenance schedules as at April 2014
Hourly rates for mechanical and electrical contractors remain constant
Service contracts remain constant in scope for all forecast periods
_____________________________________________________________________________________
_________________________________________________
Preventative maintenance includes Corrective Maintenance costs
Corrective costs are constant and calculated period August to December 2013
Repair and Maintenance – Breakdown
Breakdown costs are constant and calculation period August to December 2013
Repairs and Maintenance – Projects
Gold Coast Desalination Project
QE06934R001 10
Project costs included in 2015 were not included in the 2015 Budget Submission as requested by Seqwater
at the time. These costs have been included in 2015.
Repairs and Maintenance – Asset Replacement
Membrane Replacement
Based on Hydraunautic’s projection software with operational experience
Membrane replacement as per membrane replacement program
Membrane change out is based on pump pressure constraint and not water quality constraints
Membrane flux and salt rejection decline is assumed constant with time
All Assets
No regulatory changes that require modification to the asset to comply eg. registration of RO pressure
vessels
No changes to water quality specification that require modification to the asset to comply eg chlorination of
potable water
Asset replacement is per Veolia’s System CARMs process not Seqwater’s provided useful/design lives, as
agreed with ________________
No replacement of major pipelines of all material types
No major failures of civil or marine assets eg marine structures damaged or major corrosion
No tank replacements or tank liner
No replacement of access and walkways
No replacement of RO pressure vessels
Spare Parts
It has been assumed that the required spare parts will not vary
Plant Consumables and Rentals
Costs consistent with 2015 budget, with the exception sludge bins being purchased and no longer leased.
Fixed Electricity
The period of 1 November 2013 to 31 March 2014 (519ML produced over 151 days, ie 3.4ML/d at 12ML
twice per week) has been used to calculate average electricity demand, consumption and power factor
Office and IT related Costs
Costs consistent with 2015 budget
Other Fixed Costs
Potable water has been included at cost plus 10% of the purchase price from the Gold Coast City Council. Note
that the 2015 budget did not include the full purchase price of potable water from GCCC or additional 10% as
requested by Seqwater at the time.

Gold Coast Desalination Project
QE06934R001 11
3. Outline of budget
3.1 Information provided
Jacobs used the following documents provided by Seqwater and Veolia for the review:
MWA Long term OPEX Template 2014-03-19
R and M 15yr Forecast Rev 3
15 Year Budget Membrane Replacementsv2
PM Schedule FY 15
20140328 2028 Budget Assumptions (Attachments 1 to 6)
GCD Asset Man Plan
GCD Energy Assumptions
Seqwater Recycled Plants Valuations (Client 29 04 2014)
3.2 Overall budget
The proposed operating expenditure for the period FY 2014/15 to FY 2027/28 is shown in the chart below and
comprises the project’s actual and budget costs for the fixed, variable and service fee components of
expenditure. Actual total operating costs summate to ____________________________________________
and reflects a 30% increase in expenditure over the period FY 2012/13 to FY 2014/15 (ie an annual increase
of around 1.9%) and a 28% over the period FY 2014/15 to FY 2027/28.
Peak expenditures in the FY 2019/20, FY 2023/24 and FY 2024/25 forecasts relates to periodic spot
expenditures associated with asset replacement and preventative maintenance activities as scheduled in the
Contract Asset Renewal Management System (CARMS) employed by Veolia. These peak expenditure periods
fall outside the scope of this assessment.
___

Gold Coast Desalination Project
QE06934R001 12
The operating cost for the GCDP consists of three key components of expenditure: variable expenditure, fixed
expenditure and a services fee. The variable component comprises expenditure associated with energy usage,
chemical treatment and cleaning, and sludge and waste disposal. These activities are largely dependent on the
mode of operation of the plant and can vary significantly according to the production rate. These costs generally
make up less than 20% of the total operating expenditure. Because of the variable nature of this expenditure
component and the low valve of this expenditure in FY 2014/15 and future years Jacobs did not further review
the variable costs.
The fixed expenditure component is largely independent of the operational mode of the plant and refers to costs
associated with routine operating and maintenance activities and makes up the majority of the total operating
expenditure. The following chart provides a breakdown of the fixed operating expenditure proposed by Veolia
for the period FY2012/13 to FY2015/16. The FY2014/15 proposed operating costs have been based on budget
cost submitted to Seqwater in November 2013 and revised3 to reflect better visibility on maintenance activities
and schedules.
To allow for a like-for-like comparison the costs in the chart have been adjusted to exclude inflationary costs
and FY 2014/15 was taken as the reference year.
Over this period, Veolia is expecting that its total fixed operating expenditure will increase from $10.5M (FY
2012/13) to $13.1M (FY 2014/15), which represents a 28% increase. The forecast expenditure in FY 2016 is
$10.5M.
3.3 Sample selection for detailed analysis
The Gold Coast Desalination Plant expenditure for FY 2014/15 was reviewed anticipating the same level of
scrutiny being required by Seqwater is required by the QCA for a regulatory review. To this extent, and taking
into consideration time and budget constraints, Seqwater requested that the review consider at least 80% of the
total budget value with a priority on the highest value items.
A breakdown of the FY 2014/15 budget, including decommissioning costs is shown in Table 3.1. Note that
these costs exclude Seqwater’s internal costs for the GCDP.
3 Jacobs notes that although revised values have been provided by Veolia, a revised budget has not been submitted.
-
500
1,000
1,500
2,000
2,500
3,000
3,500
4,000
4,500
$ m
illio
n
Gold Coast Desalination Plant Fixed Operating Cost Breakdown
2013 Actual 2015 Budget 2016 Forecast

Gold Coast Desalination Project
QE06934R001 13
Table 3.1 : Operating cost breakdown
Costs $000's
Veolia’s Actual
FY 2012/13
Veolia’s Q3
Submission
FY 2013/14
Veolia’s Pre-Budget
Submission
FY 2014/15
Variable Costs -
Variable Energy 1,593 1,907 1,825 ^
Treatment Chemical 553 747 523
Cleaning Chemical - - 36
Sludge and Waste Disposal 134 161 116
Total Variable Costs 2,280 2,815 2,501
Fixed Costs
Employee Cost - Direct 2,760 2,828 3,327
Employee Cost - Indirect 78 76 84
External Consultant Costs 92 119 65
Motor Vehicle Related Cost 46 39 39
Water Analysis & Lab Consumable 377 392 463
Repair & Maintenance - Preventative 2,794 3,863 4,235
Repair & Maintenance - Breakdown 646 334 351
Repair & Maintenance - Projects 29 68 1,292
Repair & Maintenance - Asset Replacement 25 5 469
Spare Parts 155 202 289
Plant Consumables and Rentals 364 326 363
Fixed Energy 1,675 2,054 1,501^
Office and IT Related Costs 197 199 199
Other Fixed Costs 717 803 769
Total Fixed Costs 9,956 11,309 13,447
Volumes Water (ML) 2,806 1,409 1,872
Source: MWA Long term OPEX Template 2014-03-19, ^Additional energy information provided by Seqwater
The key areas of fixed operating expenditure for FY 2014/15 are:
Direct employee costs
Preventative repair and maintenance costs
Project repair and maintenance costs, and
Other fixed costs.
As such, the selected sample is shown in Table 3.2.
Gold Coast Desalination Project
QE06934R001 14
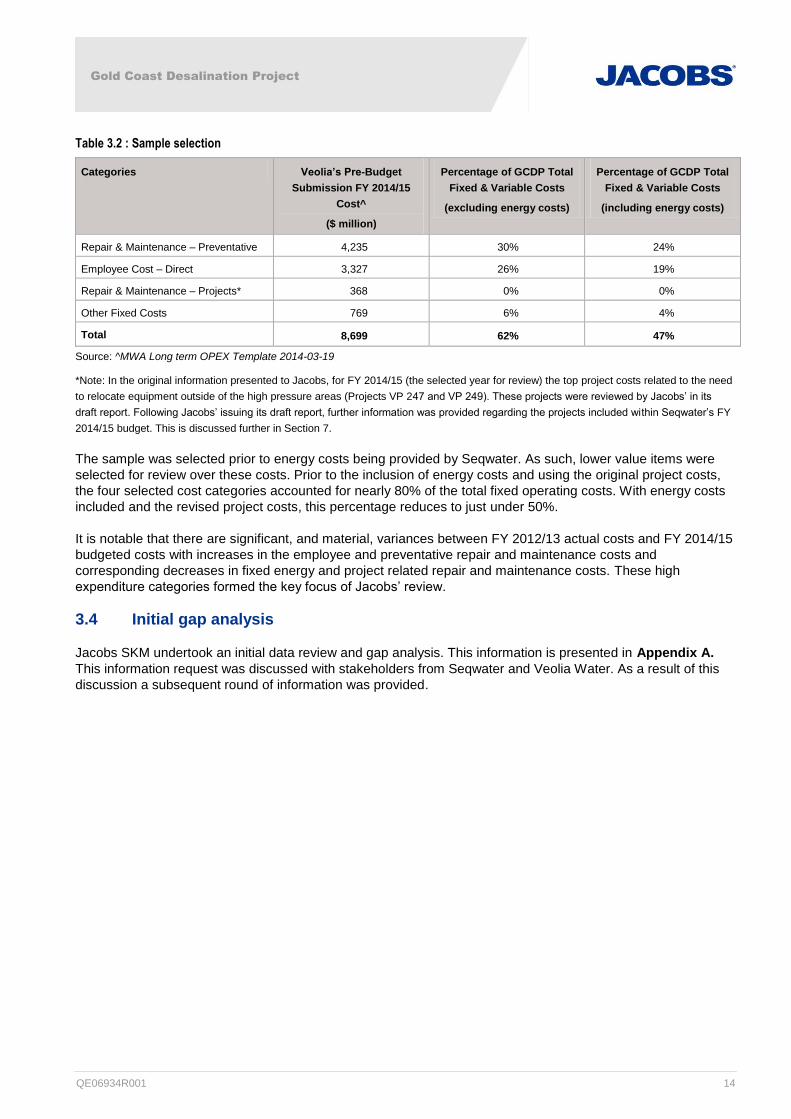
Table 3.2 : Sample selection
Categories Veolia’s Pre-Budget
Submission FY 2014/15
Cost^
($ million)
Percentage of GCDP Total
Fixed & Variable Costs
(excluding energy costs)
Percentage of GCDP Total
Fixed & Variable Costs
(including energy costs)
Repair & Maintenance – Preventative 4,235 30% 24%
Employee Cost – Direct 3,327 26% 19%
Repair & Maintenance – Projects* 368 0% 0%
Other Fixed Costs 769 6% 4%
Total 8,699 62% 47%
Source: ^MWA Long term OPEX Template 2014-03-19
*Note: In the original information presented to Jacobs, for FY 2014/15 (the selected year for review) the top project costs related to the need
to relocate equipment outside of the high pressure areas (Projects VP 247 and VP 249). These projects were reviewed by Jacobs’ in its
draft report. Following Jacobs’ issuing its draft report, further information was provided regarding the projects included within Seqwater’s FY
2014/15 budget. This is discussed further in Section 7.
The sample was selected prior to energy costs being provided by Seqwater. As such, lower value items were
selected for review over these costs. Prior to the inclusion of energy costs and using the original project costs,
the four selected cost categories accounted for nearly 80% of the total fixed operating costs. With energy costs
included and the revised project costs, this percentage reduces to just under 50%.
It is notable that there are significant, and material, variances between FY 2012/13 actual costs and FY 2014/15
budgeted costs with increases in the employee and preventative repair and maintenance costs and
corresponding decreases in fixed energy and project related repair and maintenance costs. These high
expenditure categories formed the key focus of Jacobs’ review.
3.4 Initial gap analysis
Jacobs SKM undertook an initial data review and gap analysis. This information is presented in Appendix A.
This information request was discussed with stakeholders from Seqwater and Veolia Water. As a result of this
discussion a subsequent round of information was provided.

Gold Coast Desalination Project
QE06934R001 15
4. Overall assessment
Desalination operating cost is impacted by several factors such as type of technology, energy availability,
geographic location, plant capacity, and feedwater quality. Other important factors affecting costs include costs
associated with transporting water from source to desalination plant, distribution of treated water, and
concentrate disposal.
Limited data is available on Australian desalination plants to enable a comprehensive benchmarking exercise to
be undertaken. Information on international desalination plants was therefore sourced to enable high level
comparisons to be performed. It is important to note that the operating costs for the plants used for
benchmarking were not necessarily calculated in a consistent fashion and therefore they are approximate at
best and do not represent a definitive picture.
Given the limited information available on desalination plants, the large number of variables and the unique
operating mode in Australia a true like-for-like comparison is not possible. However, this is not uncommon in
benchmarking, particularly for plants that tend to be unique and or few in numbers. It is therefore not possible to
get a true like-for-like comparison in such benchmarking. The purpose of this comparison is therefore not to set
a level or standard to achieve, but rather to make a general assessment of where the GCDP operation sit in
comparison with other similar operations and prompt investigations to understand the differences.
The international based operating costs have been sourced from a report developed by Sandia National
Laboratories in 2003. The report included a comprehensive review of literature and information on desalination
costs as summarised in the ‘Universities Council on Water Resources, Journal of Contemporary Water
Research & Education, Issue 132, Pages 39-45, December 2005’. To enable their use in this benchmarking, the
costs were adjusted for cost escalation and labour rate differences to a FY 2014/15 Australian equivalent.
The report provides a range of operating costs from a ten sources for the seawater reverse osmosis process. To
this extent no conclusive findings can be made from the comparison. However, the range of sources is
comprehensive enough to provide a reasonable understanding of the level at which the GCDP is operating
compared to the norm. Major differences would be the result of the base assumptions, including energy usage.
In the Australian context benchmark information were obtained from the Independent Pricing and Regulatory
Tribunal (IPART) Final Determination of July 2012 on the efficient operating expenditure of the Sydney
Desalination Plant (SDP). The SDP commissioned in December 2009 is one of the largest operating
desalination plants in the world with a design capacity of 250 ML/D. In comparison the GCDP has a design
capacity of 133 ML/D.
The Adelaide Desalination Plant was commissioned at the end of 2012 with a design capacity of 270 ML/D. In
April 2014, the Adelaide Desalination Plant produced an average of 168 ML/D. In September 2012, SA Water
submitted its first Regulatory Business Proposal to the Essential Services Commission of SA which stated that
the Adelaide Desalination Plant would be placed in stand-by mode’, following the 24 month proving period
(ending December 2014) while sufficient, cheaper water is available. Under the ‘stand-by mode’ the Adelaide
Desalination Plant is required to be back on stream within weeks, as compared to 24 hours for the GCDP. The
Adelaide Desalination Plant is owned by the SA Government and operated under a 20 year contract with
AdelaideAqua. The values presented in the following analysis are based on available data during 2012 based
on the plant operating during the proving period.
With the GCDP in standby mode a comparison based on actual volume of water produced is not sensible. To
allow for a comparison with fully operational plants, all plants are presented in the context of their design
capacities rather than their current production volumes. This has the potential to understate the total operating
expenditure as the variable component of the operating cost is understated and can have a significant impact.
The variable component refers to expenditures associated with treatment and cleaning chemicals, sludge and
waste disposal, and the variable component of energy costs. These expenditures are highly dependent on the
mode of operation and the volume of water treated. As an example the SDP’s variable operating cost makes up

Gold Coast Desalination Project
QE06934R001 16
around half of its total operating cost. No adjustments were made to the GCDP operating costs to account for
the variable component.
For the Australian comparison only fixed operating expenditures were used. The fixed expenditure refers to
costs associated with regular and routine operational and maintenance activities which are largely independent
of the plant operations and allows for a more reasonable comparison. It should be noted that the GCDP
operating expenditures presented in the comparisons excludes energy costs.
Figure 1 shows the proposed operating cost of the GCDP in relation to the International and Australian
desalination operations.
Although the comparison does not allow for conclusive findings it is notable that the operating cost of the GCDP
is around 20% of the average expected operating cost of a typical fully operational desalination plant, whereas
the proposed operating cost of the Adelaide plant is around 3% of the average expected operating cost of a
typical fully operational desalination plant. The difference is likely to be the result of the difference in the mode
of standby operation (although Jacobs has insufficient information to confirm that this is the case). The GCDP is
required to remain fully operational but at a very low output level, and capable of 100% output within 72 hours.
Figure 1: International Seawater Desalination Plant Comparison
Figure 2 takes a closer look at the proposed GCDP operating cost in the context of the Australian desalination
plants and compares the fixed operating expenditures in the context of their design capacities.
The GCDP is a much smaller plant at half the design capacity than both the Sydney and the Adelaide plants. In
comparison the proposed operating cost therefore are considered high at around 44% of the fully operational
Sydney plant and at around double the projected operating cost of the Adelaide plant operating in standby
mode.
Average Opex/kL
0.0
0.5
1.0
1.5
2.0
2.5
3.0
AU
$/k
L
Note: Hot standby plant opex/kL based on plant design/full operational capacity
Typical International Desalination Operating Costs

Gold Coast Desalination Project
QE06934R001 17
It should be noted that the comparison does not make a statement about the accuracy of the GCDP operating
expenditure; it only suggests the impact that the mode of operation and associated preventative and other
maintenance requirements have on costs.
Figure 2: Australian Seawater Desalination Plant Comparison
The above comparison provides a high level view of where the GCDP operating expenditure sits within the
general context of Australian operating seawater reverse osmosis desalination plants. The conclusions that can
be drawn are:
Being in standby mode it is expected that operating costs will be significantly lower than normal operating
costs and at 20% the proposed expenditure is considered reasonable considering the requirements of a
‘hot standby’ mode
However, and considering the comparison of fixed operating costs within the Australian context the
operating costs are high, although insufficient information is available about the Australian plant operational
requirements to make a conclusive finding. Further investigation will be required to fully understand the
impact of the operational requirements imposed on the GCDP.
Specific areas of operating costs are discussed in the following sections.
0
5
10
15
20
25
30
0
50
100
150
200
250
300
350
400
450
Gold CoastDesalinationPlant - Hot
Standby
PerthSeawater
DesalinationPlant - FullOperation
KurnellDesalination
Plant(Sydney) - Full
Operation
WonthaggiDesalination
Plant(Melbourne)
SouthernSeawater
DesaliantionPlant (Perth)
Port StanvacDesalination
Plant(Adelaide) -
StandbyP
roje
cte
d O
pe
rati
g C
ost
(M
$/A
nn
um
)
De
sign
Cap
acit
y (M
L/D
ay)
Australian Desalination Plants Design Capacity and Fixed Operating Costs
Design Capacity (megalitres/day) Projected Average Fixed Opex (Real M$)

Gold Coast Desalination Project
QE06934R001 18
5. Preventative maintenance
A breakdown of repair and maintenance costs is shown in Table 5.1 drawn from two spreadsheet sources;
R and M 15yr Forecast Rev 3 and MWA Long term OPEX Template 2014-03-19. Of these two sources, Jacobs
understands that the R and M 15yr Forecast Rev 3 spreadsheet presents the most recent information4. As such,
the costs from this source have been used in our review.
Table 5.1 : Repair and maintenance costs
Area Veolia’s Pre-Budget Submission FY 2014/15 Cost ($’000s)
Source: R and M 15yr Forecast Rev 3 Source: MWA Long term OPEX Template
2014-03-19
Repair & Maintenance – Preventative 1,577
(4,308 = Repair & Maintenance =
Preventative + Corrective + Asset
Refurbishment)
4,235
Repair & Maintenance - Breakdown 435 351
Repair & Maintenance - Asset Replacement 170 469
Spare Parts 373 289
Total 5,286^ 5,344
^ Including Preventative + Corrective + Asset Refurbishment in Repair & Maintenance – Preventative
A comparison is shown with historical repair and maintenance costs in Table 5.2 taken from published data
from a review undertaken for the QCA.
Table 5.2 : Historical repair and maintenance costs
FY Cost ($’000s) Increase Source Assumption
2011/12 4,655 QCA Review : Grid Service
Charges 2012-2013 Assessment
of Capital and Operating
Expenditure Seqwater (SKM,
June 2012)
Repairs and maintenance includes:
Planned mechanical, electrical and civil
maintenance
Repairs and maintenance projects
Reactive (unplanned) maintenance in
the case of break downs
Stockpiling of critical spare parts
2012/13 5,167 11%
2013/14 No data available
2014/15 6,368 24%
(over two periods)
R and M 15yr Forecast Rev 3 Includes:
Repair & Maintenance – Preventative
Repair & Maintenance - Projects
Repair & Maintenance – Breakdown
Spare Parts
The costs of repair and maintenance are projected to continue to increase at a rate of approximately 12% a
year (assuming consistent cost increases between FY 2012/13 and FY 2014/15). This rate is materially higher
than the increase in CPI and Jacobs’ projected increases due to labour and contractors (expected to be around
3% for labour and 4.6% for contractors – based on a recent review of the Wage Price Index).
4 Jacobs notes that this information was not the budget submitted by Veolia.
Gold Coast Desalination Project
QE06934R001 19
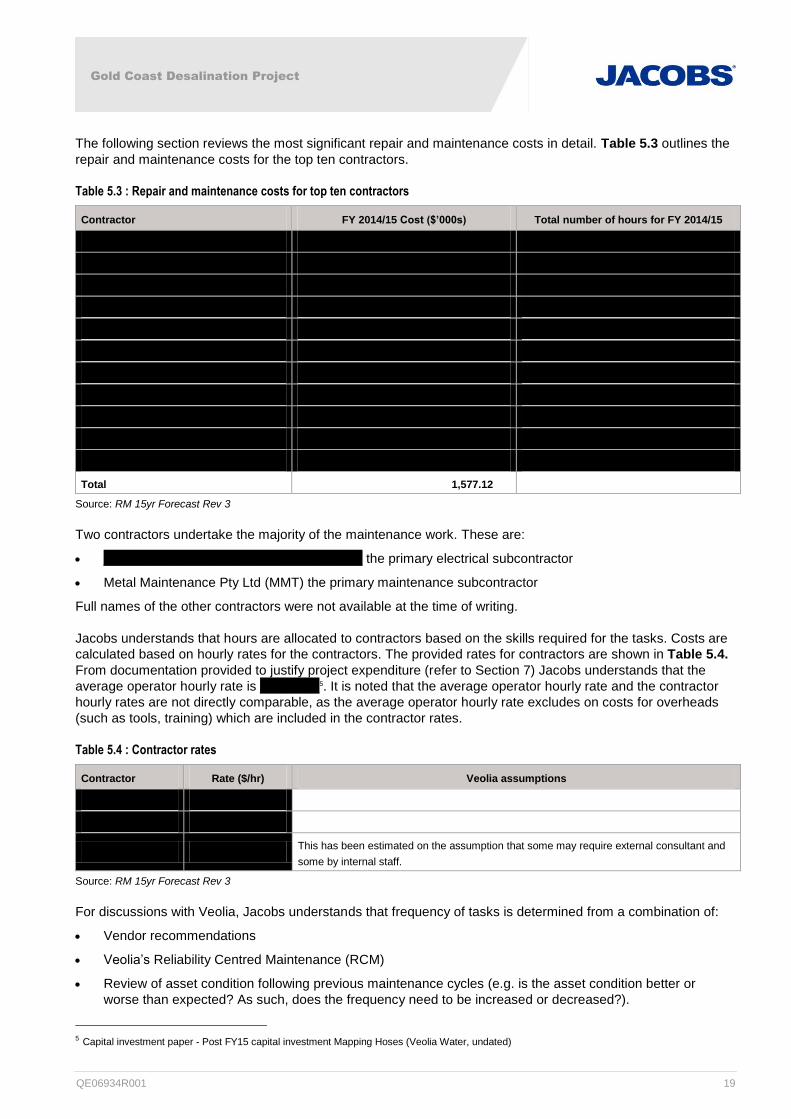
The following section reviews the most significant repair and maintenance costs in detail. Table 5.3 outlines the
repair and maintenance costs for the top ten contractors.
Table 5.3 : Repair and maintenance costs for top ten contractors
Contractor FY 2014/15 Cost ($’000s) Total number of hours for FY 2014/15
Total 1,577.12
Source: RM 15yr Forecast Rev 3
Two contractors undertake the majority of the maintenance work. These are:
___________________________________ the primary electrical subcontractor
Metal Maintenance Pty Ltd (MMT) the primary maintenance subcontractor
Full names of the other contractors were not available at the time of writing.
Jacobs understands that hours are allocated to contractors based on the skills required for the tasks. Costs are
calculated based on hourly rates for the contractors. The provided rates for contractors are shown in Table 5.4.
From documentation provided to justify project expenditure (refer to Section 7) Jacobs understands that the
average operator hourly rate is ________5. It is noted that the average operator hourly rate and the contractor
hourly rates are not directly comparable, as the average operator hourly rate excludes on costs for overheads
(such as tools, training) which are included in the contractor rates.
Table 5.4 : Contractor rates
Contractor Rate ($/hr) Veolia assumptions
This has been estimated on the assumption that some may require external consultant and
some by internal staff.
Source: RM 15yr Forecast Rev 3
For discussions with Veolia, Jacobs understands that frequency of tasks is determined from a combination of:
Vendor recommendations
Veolia’s Reliability Centred Maintenance (RCM)
Review of asset condition following previous maintenance cycles (e.g. is the asset condition better or
worse than expected? As such, does the frequency need to be increased or decreased?).
5 Capital investment paper - Post FY15 capital investment Mapping Hoses (Veolia Water, undated)

Gold Coast Desalination Project
QE06934R001 20
Jacobs has focused on the tasks with the highest number of hours assigned and hence are the highest cost
items. The tasks with the top number of hours assigned are listed in Table 5.5.
Table 5.5 : Significant preventative maintenance activities
PM Code Department Description Total estimated
hours for task
Total hours for
FY 2014/15
Contractor
Source: ^PM Schedule FY15, * RM 15yr Forecast Rev 3
The two source spreadsheets used to undertake this analysis (RM 15yr Forecast Rev 3 and PM Schedule
FY15) contain contradictory values for the number of hours assigned to each contractor. This is shown in Table
5.6. Jacobs understands that the information from R and M 15yr Forecast Rev 3 is more recent, and has used
these values in its analysis.
Table 5.6 : Comparison of overall contractor hours between sources
Contractor Total number of hours for FY 2014/15
Source: RM 15yr Forecast Rev 3 Source: PM Schedule FY15
The prudency and efficiency of the highest cost items is discussed in the following sections.
5.1 Prudency assessment
This section identifies whether the expenditure is prudent, i.e. whether the task is required to meet legal and
regulatory obligations or contracts with customers.
Cleaning and calibration of instruments
The GCDP will remain operational, albeit at a very low level of output, and is required to be capable of 100%
output within 72 hours. It is therefore prudent for the process instrumentation to be calibrated in order to meet
the plant’s availability requirements.

Gold Coast Desalination Project
QE06934R001 21
Compliance inspections of emergency lighting
AS/NZS 2293.2 states that emergency lighting shall be inspected and maintained in accordance with the six-
monthly and yearly procedures specified in the Standard. Expenditure is therefore prudent to meet regulatory
obligations.
Servicing of Lightnin mixers
Information provided by Veolia indicates that the Lightnin mixers in the lime, residuals and pre-treatment areas
require annual servicing. As with all mechanical equipment, it is prudent to maintain the mixers in accordance
with the manufacturer’s recommendations, RCM or other criteria.
Inspection of air conditioning units
AS/NZS 3666.2 specifies inspection and maintenance requirements for air handling systems, including monthly
inspections of intakes, exhausts and air filters. Expenditure is therefore prudent to meet regulatory obligations.
Inspection of intake and outfall structures
Jacobs requested additional information supporting and detailing the need to undertake inspection of intake and
outfall structures and the required frequency of this task. Veolia stated that:
“GCD-R-0067 is for the ‘6 monthly inspection of intake and outfall structures’. The PM schedule was first
set up due to a safety issue, if the structural steelwork was to fail in this location while a person is on the
structure then the consequence would be a fatality. SKM were [sic] engaged to inspect the outfall shaft
structural steelwork supporting the walkway over the outlet shaft, the hours for this work were not recorded
in this work order (WO). It was originally estimated to be 120 person hours for the SKM inspection, crane
mobilisation, use and demobilisation, to carry out the inspection. At the time it was set up as 6 monthly.
SKM inspected the structure in August 2012 and recommended re-inspection in two years. The PM
Schedule should have been amended from the findings of the SKM inspection but was not. And hence the
WO’s continued to be generated on a 6 monthly basis. The next two inspections in 2013 were conducted
by the operators and it was only a high level examination to ensure that no major corrosion had occurred
since the SKM inspection, hence the low hours recorded. Now in 2014 the next external consultant
inspection of the structure is due, and it will be estimated to be approximately 120 person hours in total.
This PM schedule is to be amended after the next external inspection. The amendment will be the
recommended frequency of the next inspection. Another PM will be created for the 6 monthly high level
(2hr) inspection of the structure which will be completed by the Operators. In order to mitigate the risk of a
fatality from the failure of the structural steel it is prudent to continue with the 2 yearly structural steel
inspection as well as the 6 monthly high level review for corrosion by operators.”
Jacobs agrees with Veolia that it is prudent to continue to inspect the outfall structural steel work for signs of
corrosion as per the frequency recommended by the specialists undertaking the inspection.
Jacobs also questioned the allowance for a separate ROV inspection. Veolia’s Asset Management Plan for
Gold Coast Desalination Plant (Veolia, September 2012) states that:
The intake and outfall pipelines will be inspected every two years. A plant shutdown will be required during
inspections to assure diver’s safety. Inspections will be by the use of Remote Operated Vehicles (ROV)
equipment and will determine the requirement and schedule for further maintenance.
Jacobs understands that the ROV is used for inspecting the tunnels and tanks. The budgeted amount for this
activity in FY 2014/15 is _______, with the following two years at _______. This pattern continues with ______
occurring every third year. Jacobs understands that the _______ coincides with the inspection of the outfalls,
the lower amount with inspection of the tanks only.
In response to Jacobs request for additional information regarding the ROV inspections, Veolia provided the
following information:

Gold Coast Desalination Project
QE06934R001 22
“The ROV inspectionof the intake and diffuser outlets takes into consideration the planning of the ROV
inspection, the weather conditions since the last dive, the intake friction factor and the analysis of the last
report. Consideration is given to the risk/likelihood of the plant being unable to ramp up to 100% production
when called in a water supply emergency vs the cost of undertaking the inspection in order to be able to
predict if/when cleaning of the inlet tunnel will be required. Costs and timing are also a consideration of this
task as the only ROV capable of carrying out the inspection is imported from the USA. After the review of
2013 ROV inspection and giving consideration to the rate of accumulation of debris in the inlet tunnel the
next inspection has been scheduled for 2015. There was an ROV inspection of the sediment build-up
within the riser of the offshore intake structure and the first 50m of the intake tunnel during 2012,prior to
this the inspections were 2009 and 2010”.
Jacobs is satisfied that the proposed inspection of the intake and outlet diffusers is necessary for the continued
operation of the GCDP. Jacobs recommends that the frequency of the next review be assessed following each
inspection, as is the current practice, to develop an optimised inspection schedule.
5.2 Efficiency assessment
This section identifies whether the expenditure is efficient, i.e. undertaken in a least-cost manner over the life of
the relevant assets and is consistent with relevant benchmarks.
Cleaning and calibration of instruments
The major instrument maintenance tasks (GCD-R-1010, GCD-R-0013, GCD-R-1071 and GCD-R-1072) are
planned to be carried out by the electrical sub-contractor, ___. We note that instrument calibration and
maintenance is included in the job description for a senior operator. Veolia’s senior operator for the GCDP has a
position description: GC16. However, we note that with the number of hours required being greater than a full
time equivalent (FTE), it would necessary to employ more than one resource to undertake this task. _______
_________________________________________________________________________________________
_________________________________________________________________________________________
________.
Actual hours spent performing instrument maintenance tasks between January 2013 and April 2014 correlate
closely to the budgeted hours for 2015. The required frequency of cleaning and calibration of instruments is not
expected to be significantly affected by the reduced future run times of the plant, and so we consider the
budgeted hours for 2015 to generally be appropriate and efficient.
Jacobs questioned why task GCD-R-0013 was duplicated in spreadsheet PM Schedule FY15, leading to an
apparent additional 260 hours of budgeted time. The duplicate rows are replicated in Table 5.5 above. In
response, Veolia provided the following information:
“In ‘Hot Standby’ the plant is started twice a week to produce 12ML of water each time. One line is for the
WO that is generated for the Monday night run and the other line is for the WO that is generated for the
Thursday night run. The verification of instruments prior to each start-up takes approximately 5 hrs.
Therefore 5hrs x 52weeks = 260hrs for the Monday runs.
And 5hrs x 52weeks = 260hrs for the Thursday runs”
Jacobs acknowledges this clarification and hence accepts that the specified hours for this task are appropriate.
Compliance inspections of emergency lighting
AS/NZS 2293.2 requires that the inspection and maintenance procedures be carried out by suitably qualified
and experienced persons. As such, it is appropriate that the work is performed to the electrical sub-contractor,
EIG.

Gold Coast Desalination Project
QE06934R001 23
As the emergency lighting system has aged, so the actual number of hours worked on the yearly inspection and
maintenance tasks in recent years has increased. In addition, at the last yearly inspection, it was estimated that
the next six-monthly inspection would require twice the amount of time. The number of hours allocated to the
tasks therefore is considered to be reasonable. Refer to the chart below.
Servicing of Lightnin mixers
The servicing of Lightnin mixers is carried out by the mechanical maintenance sub-contractor, ___. The
budgeted costs for 2015 are extrapolated from actual expenditure in recent years, as detailed in Table 5.7
below.
Table 5.7 : Lightnin Mixer Servicing Costs
Area Actual Costs
($’000s)
Budgeted Costs
($’000s)
2011 2012 2013 2015
Route 85 – Pre-treatment - 80 81 80
Route 86 - Lime 80 - 81 80
Route 88 - Residuals - 80 96.5 80
Total 80 160 258.5 240
Jacobs understands that the mixers are required to be operational, regardless of the operating mode of the
plant. This is to avoid particles within the solutions from settling out. As such, the operating hours for these
mixers is constant even when the plant is running at low output.
0
100
200
300
400
500
600
700
2011 2012 2013 2015
Ho
urs
Wo
rke
d
Gold Coast Desalination Plant Emergency Lighting Compliance Inspection Costs
Yearly compliance inspections Six-monthly compliance inspections
Actual Costs Budget

Gold Coast Desalination Project
QE06934R001 24
Jacobs notes that the mixers in each of the three areas have only been serviced in two of the last three years.
Jacobs questioned whether the mixers are required to be serviced annually, or whether a longer service interval
may be appropriate. In response, Veolia provided the following information:
“The mixers are due to be serviced on an annual basis. Historically this has not been achieved as process
and operational restrictions prevented the drives from been taken out of service.”
Jacobs accepts this clarification and hence, the hours for this task.
Inspection of air conditioning units
Actual hours spent inspecting air conditioning units between January 2013 and April 2014 correlate very closely
to the budgeted hours for 2015. The required frequency of inspections is stipulated in AS/NZS 3666.2 and
would not be affected by the reduced future run times of the plant, and so we consider the budgeted hours for
2015 to generally be appropriate and efficient.
Inspection of intake and outfall structures
Veolia’s information indicates that inspections of the intake and outfall structures will be conducted by a sub-
contractor, but a particular service provider has not been allocated. Veolia has indicated that the actual time
spent on this task in 2012 and 2013 is not clear, since the hours have been recorded against other work orders.
The latest information provided by Veolia supports the need for a single large inspection in August 2014.
However, on the basis of the recommendation arising from the last major inspection of two-yearly inspections,
Jacobs recommends that the person hours for GCD-R-0067 be reduced to 122; 120 person hours for a detailed
inspection and 2 hours for a 6 monthly high level inspection. This represents an overall reduction in person
hours of 118 person hours (or a reduction in costs of ______________________).
5.3 Summary
Jacobs considers that the expenditure on the main preventative maintenance tasks listed in Table 5.5 is
prudent. In addition, we have found that the majority of expenditure that has been reviewed in this exercise is
efficient. The exception is with respect to the proposed need to undertake a detailed inspection of the intake
and outfall structures every six months. On the basis of the recommendation arising from the last major
inspection, Jacobs is of the opinion that the detailed inspection should be scheduled to occur every two years
(ie next in 2016), with the timing reviewed following the major inspection in August 2014. This represents an
overall reduction in person hours of 118 person hours (or a reduction in costs of ______________________).
In general, Jacobs is of the view that consideration should be given to determining the maintenance intervals for
equipment on an hours run basis, rather than a fixed time basis.

Gold Coast Desalination Project
QE06934R001 25
6. Direct employee costs
6.1 Provided information
Jacobs understands that the MWA Long term OPEX Template 2014-03-19 was submitted to Seqwater in
November 2013. The budget was formed considering the number of FTEs at the time. Based on conversations
with Veolia, there are considered to be minimal changes since this budget was submitted (with the minor
exception of a change in EBA). As such, Jacobs has reviewed the direct employee costs as outlined in the
MWA Long term OPEX Template 2014-03-19 spreadsheet.
Table 6.1 provides a further breakdown of costs.
Table 6.1 : Employee cost breakdown
Employee Costs - Direct Veolia’s Pre-Budget Submission Costs ($’000s)
76400 - Salaries & Wages 2,866
76405 - Bonuses 133
76425 - Overtime 48
76495 - Workers Compensation 4
76520 - Contractors - Full/Part Time (long term) 223
76530 - Contractors - Temporary Staff Costs 53
Total 3,327
The largest cost component of the direct employee costs is salaries and wages, as would be expected. To
support this cost, Veolia has provided both an organisational structure and a breakdown of FTEs.
There are 22.5 FTEs assigned directly to the GCDP, comprised of 12 operators and the remaining staff
performing other tasks. In addition, there are a number of other staff who work with the scheme office or are
shared resources across all areas, which account for an additional 3.75 FTEs. In total there are 26.25 FTEs as
identified in Table 6.1.
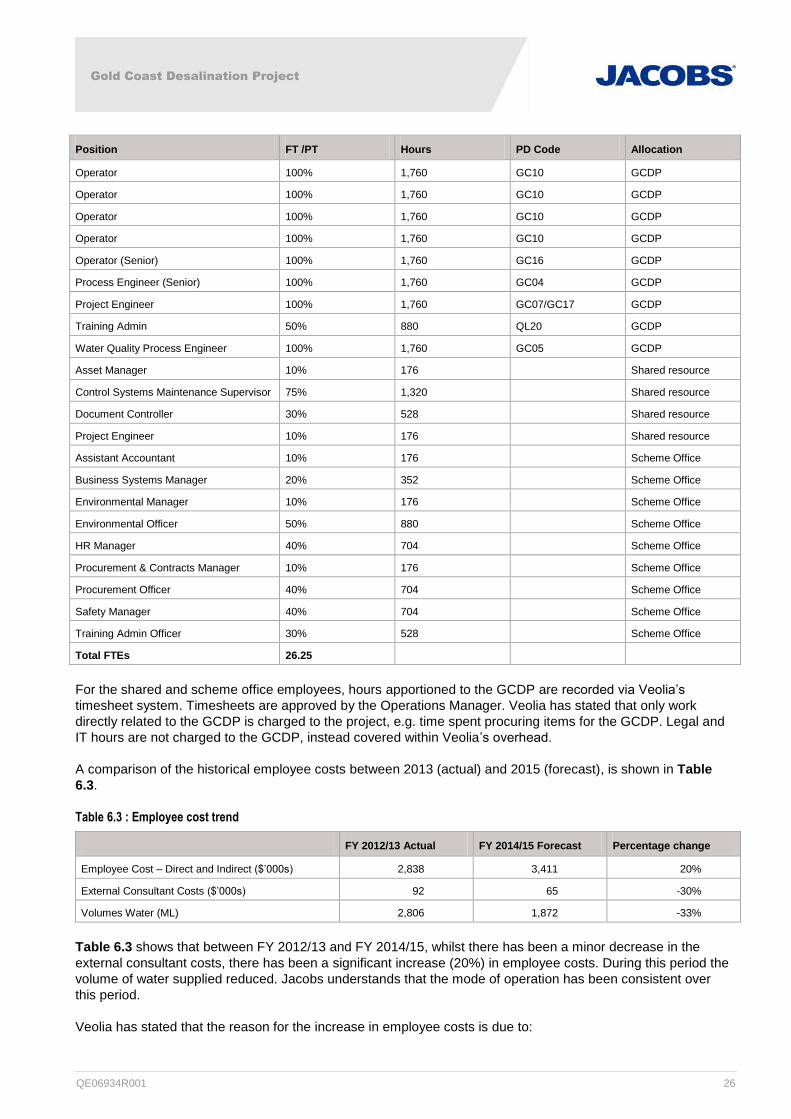
Table 6.2 : Employee breakdown
Position FT /PT Hours PD Code Allocation
Administration Officer 100% 1,760 GC08 GCDP
AP/Contracts Admin 100% 1,760 GC14 GCDP
Laboratory Technician 100% 1,760 GC06 GCDP
Maintenance Operations Coordinator 100% 1,760 GC18 GCDP
Maintenance Supervisor 100% 1,760 GC03 GCDP
Operations Manager 100% 1,760 GC01 GCDP
Operations Supervisor 100% 1,760 GC02 GCDP
Operator 100% 1,760 GC10 GCDP
Operator 100% 1,760 GC10 GCDP
Operator 100% 1,760 GC10 GCDP
Operator 100% 1,760 GC10 GCDP
Operator 100% 1,760 GC10 GCDP
Operator 100% 1,760 GC10 GCDP
Operator 100% 1,760 GC10 GCDP
Gold Coast Desalination Project
QE06934R001 26
Position FT /PT Hours PD Code Allocation
Operator 100% 1,760 GC10 GCDP
Operator 100% 1,760 GC10 GCDP
Operator 100% 1,760 GC10 GCDP
Operator 100% 1,760 GC10 GCDP
Operator (Senior) 100% 1,760 GC16 GCDP
Process Engineer (Senior) 100% 1,760 GC04 GCDP
Project Engineer 100% 1,760 GC07/GC17 GCDP
Training Admin 50% 880 QL20 GCDP
Water Quality Process Engineer 100% 1,760 GC05 GCDP
Asset Manager 10% 176 Shared resource
Control Systems Maintenance Supervisor 75% 1,320 Shared resource
Document Controller 30% 528 Shared resource
Project Engineer 10% 176 Shared resource
Assistant Accountant 10% 176 Scheme Office
Business Systems Manager 20% 352 Scheme Office
Environmental Manager 10% 176 Scheme Office
Environmental Officer 50% 880 Scheme Office
HR Manager 40% 704 Scheme Office
Procurement & Contracts Manager 10% 176 Scheme Office
Procurement Officer 40% 704 Scheme Office
Safety Manager 40% 704 Scheme Office
Training Admin Officer 30% 528 Scheme Office
Total FTEs 26.25
For the shared and scheme office employees, hours apportioned to the GCDP are recorded via Veolia’s
timesheet system. Timesheets are approved by the Operations Manager. Veolia has stated that only work
directly related to the GCDP is charged to the project, e.g. time spent procuring items for the GCDP. Legal and
IT hours are not charged to the GCDP, instead covered within Veolia’s overhead.
A comparison of the historical employee costs between 2013 (actual) and 2015 (forecast), is shown in Table
6.3.
Table 6.3 : Employee cost trend
FY 2012/13 Actual FY 2014/15 Forecast Percentage change
Employee Cost – Direct and Indirect ($’000s) 2,838 3,411 20%
External Consultant Costs ($’000s) 92 65 -30%
Volumes Water (ML) 2,806 1,872 -33%
Table 6.3 shows that between FY 2012/13 and FY 2014/15, whilst there has been a minor decrease in the
external consultant costs, there has been a significant increase (20%) in employee costs. During this period the
volume of water supplied reduced. Jacobs understands that the mode of operation has been consistent over
this period.
Veolia has stated that the reason for the increase in employee costs is due to:

Gold Coast Desalination Project
QE06934R001 27
There being vacancies in previous years which are now filled
Annual increases in salary
Changes to the EBA
6.2 Prudency assessment
Jacobs understands that the expenditure on employee costs is used to meet the following driver categories:
Legal obligations
Operations and maintenance of existing infrastructure
Veolia is required to supply drinking water to meet license conditions for public health and environmental
discharge limitations. The engagement of labour to operate and maintain the infrastructure under the
responsibility of Veolia is required to fulfil its obligations and therefore Jacobs is of the opinion that this
expenditure is prudent.
6.3 Efficiency assessment
Jacobs has compared the resources in Table 6.1 to the provided organisational charts and rosters for
operators. The above resources are included within the organisational chart, with the minor exception of the part
time Training Admin person who is likely to be captured within other charts. All of the operators named are
included on the rosters for operators, including the two operators who are listed as relief operators on the
organisational chart.
_________________________________________________________________________________________
_________________________________________________________________________________________
_________________________________________________________________________________________
_________________________________________________________________________________________
_________________________________________________________________________________________
_________________________________________________________________________________________
_________________________________________________________________________________________
_________________________________________________________________________________________
_________________________________________________________________________________________
___________________________________________________________.
Jacobs has reviewed the rosters for operators. The roster is arranged so that from Monday to Friday there are:
Two operators working an ordinary day (07:00 to 15:30)
Two operators working a day shift (06:00 to 18:00)
Two operators working a night shift (18:00 to 06:00).
During the weekends, this is reduced to four operators, with:
Two operators working a day shift (06:00 to 18:00)
Two operators working a night shift (18:00 to 06:00)
As such the plant is continually manned by at least two people at all times and by four people during ordinary
working hours between Monday and Friday.
Jacobs understands that the plant runs twice a week overnight. One of the key reasons for this is the limited
access to the plant during run hours (which is further described in Section 7).
The operators work in five week repeating shift patterns, working between 24 and 60 hours per week. Over the
five weeks, we understand that operators work on average 42 hours/ week Based on the total above hours, the
sum of the hours for the operators for the plant is approximately 504 hours a week.

Gold Coast Desalination Project
QE06934R001 28
Figure 6.1 shows the PM hours for Veolia Water. This shows a base line of approximately 40 hours a week,
rising to peaks of around 125 hours for short periods. A comparison with the number of available hours
available to the operators reveals that there are between 379 and 464 additional hours a week available to
operate the plant.
Figure 6.1 : PM hours for Veolia Water (Source: PM Schedule FY15)
Jacobs understands that this time is required to undertake regular operation of the plant including:
Managing chemical deliveries and sludge removal
Managing permits to isolate equipment
Operating the live equipment (e.g. the live pre and post treatment streams)
Taking samples
Jacobs requested that Veolia submit the routine lists for the operators to Seqwater to provide further justification
for the need to have up to four operators working during the working week. This information is presented in
Table 6.4, ranked from highest number of hours to lowest.
Table 6.4 : Activities undertaken by operators
Activity Activity Requirements
Total
Manhours
Per Week for
Activity
Duty Operator Acknowledge alarms, interrogate trends, issues brownfield (non-isolation) permits etc 168.0
ICC Operator Prepare isolation permits 84.0
Routine W/O Completion of weekly Routine Work orders 77.0
Membrane Management Based on doing 2 trains per week, Membrane Vessel Leak checks 12 trains per month, Leak
repairs 56.0
Annual Leave Based on 5 weeks A/L 44.0
Laboratory Sampling and
Analysis
Collection of samples, analysis in laboratory, entering data. Checking results of analysers,
confirm quality of water through process. 41.0

Gold Coast Desalination Project
QE06934R001 29
Activity Activity Requirements
Total
Manhours
Per Week for
Activity
Moving mapping hoses
on trains Moving 186 mapping hoses on trains 16.8
Housekeeping 14.0
Breakdowns/corrective
actions Breakdown/corrective actions averaged out 14.0
Training Training averaged 12.6
Site Walks and
Inspections (Rounds)
Physical Inspection of Site by Operator and Assistant. Should occur once a day start of night
shift 10.5
Daily Duties
Complete daily duties as per FM-GWA-GCD-2023-5 excluding Lab work, Plant Walk down,
lime plant, residuals -these are covered separately (Plant Walk through done on start of Night
Shift)
10.5
Sludge Management Inspect parking of trailers', filling of trailers, and operation of centrifuge. 0.5 hours per shift 7.0
Thinkener/Lime Saturator
Cleaning Cleaning Launders 7.0
Residuals area Bin Pickup and hose down 7.0
Safety Showers
inspection and
maintenance
Safety Shower Testing 5.0
Toolbox/Meetings Hours average over 5 days 4.9
Chemical Deliveries Supervise unloading deliveries, clean-up, and complete paperwork. 11 chemical types onsite
with 14 days max storage. Based on Hot Standby 3.5
Lime Plant Inspect and clean 3.5
Train Mapping Mapping trains during runs 2.1
Sick Leave 10 Days per Operator 2.1
Manual Loading
Chemicals
Chemicals onsite need to be manually loaded into hopper. These include poly, Fluoride,
Sodium Silicate, Anti Scalant . This is averaged at 2 hours per week @ 66 %. 0.7
Chemical Inventory Bulk Chemical automated only Poly, Sodium Silicate need to be checked 0.4
Fluoride Cleaning equipment /checks 0.3
Total 591.8
Jacobs notes that the top two tasks include issuing permits. The Duty Operator task allows for a resource to be
undertaking this task full time (24/7). The ICC Operator role also undertakes permitting as well for at least 12
hours a day. Veolia has advised that this equates to two different types of permitting and that there is no overlap
in activities. Jacobs still notes that this is a significant amount of time to spend on permitting.
For the third highest ranked task, Routine W/O, there is a mismatch between the hours suggested by Figure 6.1
and the recorded hours (77 hours). Figure 6.1 shows that on average 40 hours a week is spent on preventative
maintenance, rather than 77 hours.
_________________________________________________________________________________________
_________________________________________________________________________________________
_____________________________________________________________.
Jacobs notes that the costs currently allow for the Operations Manager to be employed full time on the GCDP.
Our understanding is that this resource shares his time with the WCRW Scheme. As such, Jacobs questions the

Gold Coast Desalination Project
QE06934R001 30
allocation of 100% of this resource to the GCDP. Jacobs notes that no costs are included for this resource in the
WCRW Scheme. This is further discussed in a separate report on the WCRW Scheme.
In June 2012, SKM undertook a benchmarking review of fixed and variable operating costs for the then grid
service providers (Seqwater, Linkwater and WaterSecure)6. In this review, SKM developed a number of metrics
regarding employee numbers and costs.
Applying these metrics, at the time of that review, the numbers for WaterSecure (responsible at the time for both
the WCRW Scheme and the GCDP) were generally favourable. This is not unexpected due to the business
model that WaterSecure implemented by contracting out a significant proportion of its activities and roles to
Veolia Water. As such, employee costs were relatively low, whilst contractor costs were high.
In this review, Jacobs has reviewed the following metrics, using the actual FTE numbers from Veolia Water.
Total employee cost as a proportion of total operating expenditure
Water supplied as a proportion of total full-time equivalents
Total employee cost as a proportion of total full-time equivalents
The results of this are presented in the following sections. The following benchmarking metrics were
considered, but not applied for the reasons as presented in Table 6.5.
Table 6.5 : Benchmarking metrics
Metric Reason not applied
Total operating expenditure as a proportion
of water supplied data
GCDP is in a hot standby mode, whereby volume of water supply is limited. As such, this
metric is not considered to be relevant for the GCDP.
Total operating expenditure as a proportion
of non-current assets
The GCDP is relatively new asset; as such it does not have a high value of non-current
assets. A review of Seqwater Recycled Plants Valuations (Client 29 04 2014) shows that
the average remaining life for assets is 39 years. This metric is not considered to be
relevant for the GCDP.
Total operating expenditure as a proportion
of total revenue
GCDP is in a hot standby mode, whereby volume of water supply is limited. As such, the
revenue will be limited by supply. This metric is not considered to be relevant for the GCDP.
Total revenue as a proportion of total full-
time equivalents
GCDP is in a hot standby mode, whereby volume of water supply is limited. As such, the
revenue will be limited by supply. This metric is not considered to be relevant for the GCDP.
Total full-time equivalents as a proportion
of non-current assets
The GCDP is relatively new asset; as such it is not expected to have a high value of non-
current assets. This metric is not considered to be relevant for the GCDP.
6.3.1 Total employee cost as a proportion of total operating expenditure
Figure 6.2 presents a comparison of the proportion of the total employee cost to the total operating expenditure
for a number of Australian water utilities based on data collected in FY 2012.
6 Gird Service Charges 2012-13: Phase 1 – 2011/12 Fixed and Variable Operating Expenditure Benchmark Review (SKM, June 2012)

Gold Coast Desalination Project
QE06934R001 31
Figure 6.2 : Total employee cost as a proportion of total operating expenditure (Source: Gird Service Charges 2012-13: Phase 1
– 2011/12 Fixed and Variable Operating Expenditure Benchmark Review (SKM, June 2012))
For the GCDP for FY 2014/15, the ratio of total employee cost (_____________________________________
_______________________________________________________. Note that this does not include any
operating costs experienced by Seqwater for which values are not available to Jacobs.
Given that employee costs form a large percentage of operating costs, Jacobs does not expect that these ratios
have changed substantially from 2012, with both employee costs and operating costs growing at a similar rate.
Jacobs considers that, based on the above information, the total employee costs for Veolia as a proportion of
total operating expenditure is consistent with that of an efficient operator.
6.3.2 Water supplied as a proportion of total full-time equivalents
Figure 6.3 presents a comparison of the proportion of the water supplied to the total FTEs for a number of
Australian water utilities based on data collected in FY 2012. A higher proportion of water supplied to the total
full time equivalents indicates broadly, for a given operation size, maintenance schedule and distribution
network, that the entity is more efficient.

Gold Coast Desalination Project
QE06934R001 32
Figure 6.3 : Water supplied as a proportion of total full-time equivalents (Source: Gird Service Charges 2012-13: Phase 1 –
2011/12 Fixed and Variable Operating Expenditure Benchmark Review (SKM, June 2012))
For the GCDP for FY 2014/15, the proportion of the water supplied (1,872) to the total FTEs (26.25) is 71.3.
Note that this does not include any Seqwater FTEs for which values are not available to Jacobs.
Whilst this metric appears favourable for GCDP, there are a number of items to consider:
The GCDP is entirely a water supply entity. The majority of comparator companies also undertake many
activities that are not related to water supply (such as wastewater treatment, retail and distribution).
The GCDP’s production is not based on the capacity of the plant, but a function of its hot standby
operational mode
Taking into account the above, Jacobs considers that, this metric cannot be sensibly used to review the GCDP.
6.3.3 Total employee cost as a proportion of total full-time equivalents
Figure 6.3 presents a comparison of the proportion of the total employee cost to the total of full-time equivalents
for a number of Australian water utilities based on data collected in FY 2012. A lower proportion of total
employee cost to total full-time equivalents indicates broadly, for a given operation size, maintenance schedule
and distribution network, that the entity is more efficient.

Gold Coast Desalination Project
QE06934R001 33
Figure 6.4 : Total employee cost as a proportion of total full-time equivalents (Source: Gird Service Charges 2012-13: Phase 1 –
2011/12 Fixed and Variable Operating Expenditure Benchmark Review (SKM, June 2012))
For the GCDP for FY 2014/15, the ratio of total employee cost (including direct and indirect costs -
$3.051million) to the total FTEs (26.25) is 116.2 (or $116,200 per FTE).
On the basis of similar investigations recently undertaken, Jacobs considers that annual increase in salary rates
would be between 2.3 and 3% per annum for this period. Using the upper end of this spectrum, the comparative
rate in FY 2012, would be $106,300). This metric places GCDP towards the top end of the costs. However, in
considering this, the following points should be noted:
There is likely to be a salary difference between workers in the public and private sectors
A desalination plant utilises high technology plant, and as such, employees must be highly skilled
Jacobs has recently undertaken work reviewing costs for another desalination plant in Australia. A comparison
of these costs shows that the costs per FTE are higher for the comparable desalination plant than for the
GCDP.
On the basis of the above, Jacobs considers that, whilst the costs per FTE are high when compared across the
overall water industry, there are reasons for this and costs are in line with other specific desalination plants.
6.4 Summary
Jacobs finds the direct employee costs to be prudent.
Jacobs recommends the following efficiency improvements:
_____________________________________________________________________________________
_____________________________________________________________________________________
___________________.
_____________________________________________________________________________________
_________.
_________________________________________________________________________________________
__________________________________________________.

Gold Coast Desalination Project
QE06934R001 34
7. Repair & Maintenance - Projects
7.1 Provided information
Table 7.1 provides a breakdown of the Repair & Maintenance – Projects costs for FY 2013/14 to FY 2015/16. In
the original information presented to Jacobs, for FY 2014/15 (the selected year for review) the top costs were
related to the need to relocate equipment outside of the high pressure areas (Projects VP 247 and VP 249).
These projects were reviewed by Jacobs’ in its draft report. Following Jacobs’ issuing its draft report, further
information was provided regarding the projects included within Seqwater’s FY 2014/15 budget. Table 7.1
shows this updated information. Projects VP 247 and VP 249 are no longer included within Seqwater’s FY
2014/15 budget. Jacobs supports the removal of these items as described in the following sections. In addition,
Jacobs believes that the following comments are relevant, should these projects be proposed for future years.
Table 7.1 : Project breakdown
VP No. Project Title
Project Cost
($’000s)*
FY^ Comment^
2013/14 2014/15 2015/16
VP 247 Relocation of Mapping lines to
outside HP Areas 400.00 - - -
Not included in Seqwater
2014/15 budget
VP 249 Relocation of Sample Panels to
outside HP Areas 300.00 - - -
Not included in Seqwater
2014/15 budget
VP 261 Pressure Warning Beacons 92.57 92.57 - - Included in Seqwater
2013/14 budget
VP 223 Emergency Communication 79.44 - 79.44 - Included in Seqwater
2014/15 budget
VP 222 Outfall Sample Pump Electric Winch 13.04 13.04 - - Included in Seqwater
2013/14 budget
VP 224 Internal Use of Potable Water 92.00 92.00 - Included in Seqwater
2014/15 budget
VP 230 SCADA Upgrade 196.57 196.57 - Included in Seqwater
2014/15 budget
VP 219 Fire System Ring Main Bolts 69.26 69.26 - - Included in Seqwater
2013/14 budget
Replacement of Emergency
Lighting 180.00 -
Not included in Seqwater
2014/15 budget
Australian Bay Lobsters - Not a
Veolia project - - - -
Not included in Seqwater
2014/15 budget
Sludge Bins purchase 110.00 110.00 - -
Included in Seqwater
2013/14 budget
FY Total 284.87 368.01 0
Source: *RM 15yr Forecast Rev 3, ^revised program from Seqwater.
Project VP 224 - The Internal Use of Potable Water Project is discussed in Section 8.1.1, with reference to
reducing potable water costs.
Jacobs specifically sought information on the largest projects (relocation of mapping lines to outside high
pressure areas and relocation of sample panels to outside high pressure areas).
The following information was provided:
Capital investment paper - Post FY15 capital investment Mapping Hoses (Veolia Water, undated)

Gold Coast Desalination Project
QE06934R001 35
Capital investment paper - Post FY15 capital investment Sample Panels (Veolia Water, undated)
Briefing Paper - BP264A High Pressure Safety at GCDP - Update FINAL - ALG approved (GCD Alliance,
April 2012)
Briefing Paper - BP236 Reintroduction of Personnel to HP Areas Rev 3 - ALG approved (GCD Alliance,
July 2013)
7.2 Background
Prior to August 2011, operations staff were allowed to enter the Reverse Osmosis (RO) Building when the plant
was operating. One of the tasks that the operations staff would conduct was the membrane mapping of the RO
vessels. This is a task that has to be conducted when the RO process is pressurised and therefore access to
the RO Building when the plant is operating is critical.
In August 2011 it was identified that several defects were present in the RO Building which created a risk of
release of high pressure water. It was recommended and approved by the APMT (BP241 – Exclusion Zone and
BP264A – High Pressure Safety) that all high pressure areas of the plant (>10 bar pressure) which includes the
RO Building are an exclusion zone when the plant was pressurised until the defects had been rectified.
In January 2012 a Briefing Paper was raised to document the high pressure risk failures and the required
controls. At the time it was agreed that once controls were put in place access could be granted to the building.
In July 2013 a second briefing note was issued documenting that whilst all original controls are in place, further
failure modes were identified. A detailed review of the issues was undertaken by an independent consultant
(R2A).
The outcomes of this review were that access would only be allowed into the building during operation under
specific conditions (e.g. to carry out safety critical inspections, during a water supply emergency, to prevent
major consequence asset damage (>$1 million) after the two-hour recommissioning exclusion). Membrane
mapping was specifically identified as an activity that was not permitted to occur within the RO building whilst
operational.
In this document a number of high pressure risk precautionary measures were identified and assessed. This
recommended an investigation into the permanent relocation of the mapping hoses. This was agreed to by all
Seqwater and Veolia stakeholders.
7.3 Prudency assessment
7.3.1 Relocation of mapping lines to outside high pressure areas
The identified drivers for the project are identified below:
Table 7.2 : Project driver- Relocation of mapping lines to outside high pressure areas
Driver Primary or secondary % weighting (sums to 100%)
Compliance The primary driver is that the project will address the issue of non-compliance with the
Building Fire safety Regulations whilst removing several OH&S issues.
80
Efficiency A secondary driver is that it will produce an OPEX cost reduction. 20
The Capital investment paper - Post FY15 capital investment Mapping Hoses states that:
For plants which use RO membrane filtration, the membrane part of the process is a key indicator of the
overall process performance. As a consequence it is essential to be able to track the behaviour of each
membrane for process optimization, fault finding and decision making purposes. The degradation of the
1st Pass membranes leading to higher conductivity feed to the 2nd Pass has been listed on the GCD plant
risk profile as a high risk due to the potential for the scaling of the 2nd pass membranes and the

Gold Coast Desalination Project
QE06934R001 36
subsequent need for increased CIP of the 2nd pass membranes. The current control measure for this is to
monitor the 1st Pass membrane performance and make further operational changes as required to reduce
the likelihood of the scaling of the 2nd pass membranes from occurring. The monitoring of membrane
performance becomes increasingly critical as the membranes age. To do this the overall performance of
each train is monitored and if there is an issue with high salt passage, i.e. an increase in the conductivity of
the permeate water from the train, then mapping is used to determine if the issue is with the entire train or if
there is just an issue with a solitary vessel. Also mapping is used in order to monitor the performance of
each vessel and trend each vessels performance.
Jacobs considers that it is necessary to undertake monitoring of the membranes to monitor the performance of
the GCDP.
Jacobs agrees that there is currently an unacceptable level of risk of working in the RO building on pressurised
equipment. We note that in other facilities, such as the desalination plant in Perth, blast screens have been
installed. From verbal discussions with Veolia we understand this option was reviewed and found to be
insufficient. This is documented at a high level in Table 3 in Briefing Paper - BP236. Whilst a review of the risk
level of working within the RO building is beyond the scope of this investigation, Jacobs is satisfied that the
decision making process to exclude personnel from the RO building has been robust and well documented.
The Capital investment paper - Post FY15 capital investment Mapping Hoses further states that:
In order to conduct mapping of the vessels, there was a set of 186 temporary mapping hoses procured and
used. These mapping hoses were connected to a train prior to a pressurisation, and the mapping tubes
are run to the nearest entry/exit point to the building and into an IBC that is located outside the building.
The discharge from the IBC is then ran back into the building and discharged on to the floor of the Reverse
Osmosis Building floor to run into the floor drains.
A restraint on this system is that the operations staff can only map one train per hot standby run.
The frequency of mapping is an important issue. At present the mapping frequency has been reduced to a 3
month period due to the plants mode of operation (hot standby). The operators currently have sufficient
equipment to map one train. Jacobs understands from the Capital investment paper that:
To relocate a set of temporary mapping hoses it takes approximately 4 hours and it is a two person activity
that requires a scissor lift. Therefore to relocate the mapping hoses once per week to ensure that the all the
trains are mapped within a 12 week period equates to $21,627 per annum.
Jacobs has reviewed the assumption for this number and agree that these costs are reasonable. The current
method of operation (two runs per week) means that it is possible for the operators to map two trains a week,
resulting in a doubling of the labour cost of $43,254 per annum.
It is apparent that the capital cost for this project ($460,000) far exceeds the current costs of moving the
temporary hoses to map the trains, even if the frequency of this is doubled. From direct enquiry, Jacobs
understands that there is very little evidence of scale in the second pass. We agree that as the first-pass
permeate quality decreases (as the membranes age) the likelihood of second pass scale formation increases.
However, there is not an immediate need to increase the mapping frequency.
Jacobs has attempted to contact Hydranautics (based in California) to determine its perspective on the required
frequency of mapping, but at the point of writing has been unsuccessful in this. At present, an in absence of
information to the contrary, Jacobs does not believe the need to increase the frequency of mapping has been
sufficiently justified. There may in future be a requirement to increase the frequency and this should be closely
monitored.
The secondary justifications for the project are as follows:
The Entry to Operating High Pressure Areas procedure that has recently been drafted. It states that ‘The
doors to the RO building will be locked physically or electronically when the process is pressurised.’

Gold Coast Desalination Project
QE06934R001 37
Currently the temporary mapping hoses are run out through one of these doors, therefore there is a need
to address this issue and ensure that the new procedure is adhered to.
It has been identified that the mapping hoses are contravening Building Fire Safety Regulation 2008 Part 2
Division 2 Keeping evacuation routes free from Obstruction – general…. Therefore it has been determined
that the placing of hoses on the floor of the RO Building that cross evacuation routes is contravening this
code.
Whilst Jacobs has not visited site, it may be possible through adjustment to the RO building doors, though a “cat
flap” or such arrangement, to allow the door to be locked whilst the hoses are in position.
Jacobs notes that the primary driver for this project is to address the issue of non-compliance with the Building
Fire safety Regulations whilst removing several OH&S issues. Veolia has identified the blocking of evacuation
routes as contravening this code. Jacobs agrees that the placement of the hoses across the floor of the RO
building is of concern. Whilst for most of the time the hoses are in place, the building is empty and physically
locked shut, it is recognised that there will be times (such as during the movement of the mapping hoses) that
these will be crossing evacuation routes. It is recommended that a procedure be developed (if not already in
place) to consider the best placement of hoses to keep evacuation routes as clear as possible at all times, such
as removing and storing hoses when not in use, and maintaining a clear alternative evacuation route.
In summary, Jacobs concludes that there is currently insufficient information to increase the frequency of the
mapping, and as such the prudency of the project at this time has not been demonstrated. As the need to map
the membranes becomes more frequent, there may be a need for this project in future. Jacobs recommends
that an options investigation, including a review of the risk status of the RO building should be taken into
consideration. We note that there are concerns regarding potential non-compliance with fire regulations, but
question whether there may be more economical or operational solutions to these problems.
7.3.2 Relocation of RO sample panels to outside high pressure areas
The identified driver for the project is identified below:
Table 7.3 : Project driver- Relocation of RO sample panels to outside high pressure areas
Driver Primary or secondary % weighting
(sums to 100%)
Service The primary driver is that the project will improve the reliability of service, because currently if there is
an issue with the trains conductivity and flow instruments then the issue cannot be investigated
because it is located with the high pressure area.
100
The Capital investment paper - Post FY15 capital investment Sample Panels states that:
The conductivity instruments for each train are installed inside the high pressure area. Currently
operations are unable to verify readings that are displayed on SCADA because of the inability to enter the
high pressure area to verify/calibrate the instruments. Therefore to address this issue it is proposed to
relocate the instruments outside the high pressure area.
The Capital investment paper - Post FY15 capital investment Sample Panels further states that:
A detailed investigation of this project is required to determine if the risk of an issue or failure of instruments
located it the RO building and the resulting damage to membranes or equipment or the failure to produce
potable water that meets minimum water quality limits is sufficient to warrant the relocation of the
instrumentation.
If we assume that the risk is sufficiently high and unacceptable then the project is prudent because it
addresses the risk of damage to membranes or equipment or the failure to produce potable water that
meets minimum water quality limits that result from instrument failure or erroneous measurement.

Gold Coast Desalination Project
QE06934R001 38
Jacobs notes that there is still work required to investigate and justify this work. At present we understand that
the monitors associated with each train will need to be checked, cleaned and recalibrated prior to pressurising
and running of each train anyway. We also consider that the issue of leaving long lag times between sample
source and sample monitor should be considered (i.e. additional 20m of hose pipe can add significant time lag).
In summary, Jacobs concludes that the prudency of the project at this time has not been demonstrated.
7.4 Efficiency assessment
As the prudency of these projects has not been established, Jacobs has not undertaken a full efficiency review.
We note that for both items are based on budget prices from sub-contractors. If the work proceeds, Jacobs
recommends that consideration be given to competitively tendering both projects as a combined package of
works.
7.5 Summary
As noted in Section 7.1, the projects selected from review have already been excluded from Seqwater’s budget.
Jacobs supports this action as the prudency and or efficiency of these projects is yet to be established.

Gold Coast Desalination Project
QE06934R001 39
8. Other Fixed Costs
A breakdown of the other fixed costs is provided in Table 8.1. No other details of specific costs were provided to
Jacobs for this review.
Table 8.1 : Other fixed costs breakdown
Item Veolia’s Pre-Budget Submission Costs ($’000s)
73000 - Bulk Water 323.00
76225 - Disposals - Garbage 8.89
76235 - Disposals - Trade Waste 0.23
77000 - Safety Equipment 7.18
77005 - Safety Clothing 12.30
77010 - Safety Other 30.32
77710 - Freight - Other 2.60
77800 - Security Patrols 277.36
77805 - Security Other 15.49
77405 - Subscriptions - Staff Memberships 1.23
77410 - Subscriptions - Publications / Web Sites 0.39
77415 - Subscriptions - Licences 3.04
77420 - Subscriptions - Other 1.77
78000 - Travel Airfares - Local 0.02
78005 - Travel Airfares - International 1.45
78020 - Travel Ground Transport 0.39
78030 - Travel Parking 0.62
78040 - Travel Accommodation 2.54
78050 - Travel All Other - Local 0.32
78075 - Food & Drinks - With Overnight Stay (<21days) 0.02
78090 - Food & Drink: Special Events 1.51
78730 - Gifts 0.43
77235 - Insurance - Other (EXCL VEHICLES) 13.50
76010 - CAPEX P&L - Plant 16.91
76015 - CAPEX P&L - Office Equipment & Fittings 6.66
77015 - CAPEX P&L - Tools & Equipment 41.00
Total 769.17
The most significant costs are the bulk water costs and the security patrols. These are considered in more detail
in the following sections.
Jacobs notes that the ‘Other’ fixed costs category is relatively consistent with historical costs. Assuming that the
components of this category remain consistent over time, the costs would be expected to increase in line with
bulk water prices and labour/contractor prices (for the security component).

Gold Coast Desalination Project
QE06934R001 40
The costs for bulk water have increased on average by 10% over the last two financial years, as shown in Table
8.2.
Table 8.2 : Bulk water price increases
FY 2012/13 FY 2013/14 FY 2014/15
Bulk water price – Gold Coast ($/ML) $2,225 $2,470 $2,715
Percentage increase 11% 10%
Source: Bulk water prices - DEWS7
Jacobs estimates that the cost for contractors is estimated to have increased by between 2.3 and 4.6%.
On the basis of the above, the increases in costs for the ‘Other’ fixed costs category are reasonable.
8.1 Prudency and efficiency assessment
8.1.1 Potable water
The GCDP utilises potable water for a number of purposes on site, including essential processes and services
during production, such as for mechanical seal quenching, pump cooling, site safety showers and eyewash
basins, as well as the supply for hand basins, the laboratory and the administration building. Currently there is
only one town water supply to the site. This is a single point of failure which has occurred on a couple of
occasions, once resulting in shutdown of the plant.
The GCDP has an approximate annual water utility bill of between $360,000 and $420,000 ($323,000 for FY15)
from Gold Coast City Council (GCCC). However, after factoring in revenue from Queensland Government State
Bulk Water charges, the real cost to Seqwater is approximately $150k per annum.
Seqwater has in place a business case (Business Case VP 224, Internal Service Water Upgrade, Version 4,
December 2013) to reduce these costs by utilising GCDP potable water to substitute this consumption of GCCC
potable water. This will also reduce GCDP’s requirement for the GCCC supply to be available in order to run
GCDP.
According to the business case, for an investment of $92k an operational saving of approximately $114,000 per
annum can be achieved by utilising site produced and network potable water in lieu of GCCC supply. This
project is shown in Table 7.1. The primary aim of the project is to reduce the GCCC water bill for the GCDP and
to improve plant reliability.
Jacobs has reviewed the business case and finds this project prudent. Jacobs notes that this project is already
underway and understands that the benefits will be realised in the FY 2014/15. As such the costs for potable
water should reduce from between $360,000 and $420,000 per annum, to approximately $114,000 per annum.
8.1.2 Security patrols
The following information was provided specific to security patrols:
Briefing Paper BP 048 Security Scope Change, including:
- Plant Security Design Change Approval Request (GCD Alliance, August 2007)
- Security Concept Report (GCD Alliance/SKM, June 2007)
Security daily logs for March and April (_________, as dated)
Standard Operating Procedures (_________, June 2011)
Courier Inductions (done by security) (GCD Alliance, February 2013)
7 http://www.dews.qld.gov.au/policies-initiatives/water-sector-reform/water-pricing/bulk-water-prices

Gold Coast Desalination Project
QE06934R001 41
Chemical Delivery Induction (done by security) (GCD Alliance, February 2013)
Chemical Induction Questionnaire (done by security) (GCD Alliance, February 2013)
Visitor Inductions (done by security) (GCD Alliance, December 2012)
Copy of subcontract for period 1 October 2009 to 30 September 2010 (GCD Alliance, various)
The GCD Alliance currently employs ______________________________ to undertake 24/7 security. This
occurs in two shifts: 6:00am to 6:00pm, and 6:00pm to 6:00am. There is one guard per shift. In addition a site
vehicle is provided. Duties include:
Manning the gate house
Inductions
Daily logs
Site patrols.
According to the Briefing Paper BP 048 Security Scope Change, in the initial design of the GCDP, allowance
was made for the security to a standard which was considered to be typical of the level of security at other water
treatment plants in the Gold Coast Area. The security measures allowed for included a standard 2.4m perimeter
fence, CCTV cameras at various locations linked to the operator console and entry control to doors using either
conventional lock or key or swipe cards. During design development, a Security Risk Assessment was
performed. This Risk Assessment highlighted a number of areas which required further consideration.
Subsequently a preliminary Security Concept Report was commissioned to identify areas of the GCDP which
required additional security measures. The Security Concept Report highlighted the need to address key
aspects of the plant security in order to comply with the National Guidelines for Critical Infrastructure Protection
(CIP) legislation, which was anticipated to be required at that time. This included the recommendation for a full
time (24/7) physical security presence.
Jacobs understands that the GCDP is not presently specifically classified as critical infrastructure. However,
according to the CIP legislation, owners and operators of major infrastructure are responsible for undertaking a
risk assessment to assess the risks and provide adequate security. Jacobs further understands that Seqwater is
currently reviewing the need to maintain full time security at this and other sites. It is noted that other water
treatment plants, which are fully operational, do not have the same level of security.
Jacobs recommends that as part of Seqwater’s overall review of security, Seqwater reviews the risk
assessments undertaken as part of the Security Concept Report taking cognisance of the revised operating
model of the GCDP. This should be benchmarked against Seqwater’s other water treatment plants. The aim of
this risk assessment would be to determine what level of security is appropriate for this, and other water
treatment plants owned and operated by Seqwater. This may result in a decision to reduce the amount of
security patrols, and to rely on other security measures, such as operators monitoring CCTV and managing
visitor/contractor and staff security control procedures. The impact of this on the availability of operators would
need to be considered. Jacobs is not able to comment definitively on the benefits of this measure as
undertaking a review of the risk register is beyond the scope of this report.
The GCD Alliance’s subcontract with _________ is based for period 1 October 2009 to 30 September 2010,
with the option to extend for 3 x 1 years. Jacobs notes that this contract should have expired in September
2013. It is presumed that an extension may have been granted whilst Seqwater reviews the requirement for
24/7 security.
Based on the information provided to date, and with the recommendation that further investigation be
undertaken prior to future contract award, Jacobs finds the requirement for security patrols to be prudent.
Jacobs has reviewed the efficiency of the security costs. Jacobs reviewed the tender evaluation for security
patrol_________ placed third of six in terms of costs (from lowest to highest). However, there were documented
reasons for not selecting the cheaper tenderers, including lack of experience and systems, high staff turnover
and poor past performance. Jacobs is satisfied that the tendering process and selection was reasonable. As

Gold Coast Desalination Project
QE06934R001 42
such the costs are in line with market conditions and are efficient. Jacobs recommends the competitive
tendering of future contracts to ensure that rates stay consistent with market conditions.
The subcontract with _________ outlines the following rates for the contract. There is no escalation clause in
the contract.
Table 8.3 : Security patrol - rates
Description Unit Rate per person
Based on the hourly rates from Table 8.3, and the assumption of 11 public holidays a year, the costs for 24/7
security are as presented in Table 8.4.
Table 8.4 : Security patrol – cost estimate
Description Period Cost
From Jacobs’ calculations, the total for 77800 - Security Patrols in the budget is based on a flat rate of _______
_________________________________________________________________________________________
____________________________________________.
8.2 Summary
The other fixed costs category contains two significant costs, bulk water and security patrols. Combined these
costs make up nearly 80% of this category for FY 2014/15.
In terms of bulk water costs Jacobs supports the findings of the business case to reduce these costs by utilising
GCDP potable water to substitute this consumption of GCCC potable water. This will also reduce GCDP’s
requirement for the GCCC supply to be available in order to run GCDP. Jacobs notes that this project is already
underway and understands that the benefits will be realised in the FY 2014/15. As such the costs for potable
water should reduce from between $360,000 and $420,000 per annum to approximately $114,000 per annum.
For security patrols, Jacobs finds the current costs to be prudent and efficient. Jacobs recommends that the
security requirements are reviewed in the event that the classification of the plant is reduced from being Critical
Infrastructure.
Gold Coast Desalination Project
QE06934R001 43
9. Summary
9.1 Key findings
Jacobs has reviewed the FY 2014/15 budget for the GCDP, including a brief review of trends in historical costs
over the last two years. Over this period, Veolia is expecting that its total fixed operating expenditure will
increase from $10.5M (FY2012/13) to $13.1M (FY 2014/15), which represents a 44% increase.
The fixed expenditure component is largely independent of the operational mode of the plant and refers to costs
associated with routine operating and maintenance activities and makes up the majority of the total operating
expenditure. It is notable that there are significant variances between the FY 2012/13 actual costs and the FY
2014/15 budgeted cost with increases in the employee and preventative repair and maintenance costs and
corresponding decreases in fixed energy and project related repair and maintenance costs. These high
expenditure categories formed the key focus of Jacobs’ review.
For the overall costs, given the large number of variables and the unique operating mode of the GCDP, it is
challenging to find a true like-for-like comparison with other facilities. It is noted that compared to figures for
another Australian desalination plant when run in a process proving mode, the costs are higher. This may be
due to the specific differences in the operating modes of the two plants.
For the preventative maintenance costs, with the exception of the intake and outfall structures inspections,
expenditure on the main preventative maintenance tasks reviewed is prudent. The need to undertake a detailed
inspection of the intake and outfall structures every six months is found to be not prudent. On the basis of the
last recommendation following inspection, Jacobs considers that this should be scheduled to occur every two
years (ie next in 2016), with the timing reviewed following the major inspection in August 2014. This represents
an overall reduction in person hours of 118 person hours (or a reduction in costs _______________________).
Jacobs has also found that the majority of expenditure that has been reviewed in this exercise is efficient.
However, there are areas in which savings could be made including allocation of calibration activities to Veolia’s
senior operator for the GCDP. Jacobs has insufficient information to be able to determine an estimate of
efficiency for this task.
Jacobs also recommends that consideration should be given to determining the maintenance intervals for
equipment on an hours run basis, rather than a fixed time basis.
For direct employee costs, the costs have found to be prudent. Jacobs recommends that the following
efficiencies may be achieved:
_____________________________________________________________________________________
_____________________________________________________________________________________
_________________.
_____________________________________________________________________________________
____________.
_________________________________________________________________________________________
______________________________________________________.
For Repair & Maintenance – Projects, Jacobs has found both key projects not to be prudent due to a lack of
justification. As such Jacobs supports the costs associated with both of these projects not be included in the
budget.
For other fixed costs, in terms of bulk water costs Jacobs supports the findings of the business case to reduce
these costs by utilising GCDP potable water to substitute this consumption of GCCC potable water. This will
also reduce GCDP’s requirement for the GCCC supply to be available in order to run GCDP. Jacobs notes that
this project is already underway and understands that the benefits will be realised in the FY 2014/15. As such
the costs for potable water should reduce from between $360,000 and $420,000 per annum to approximately
$114,000 per annum.
For security patrols, Jacobs finds the costs to be prudent and efficient.

Gold Coast Desalination Project
QE06934R001 44
9.2 Recommendations
For those expenditure items where the forecast cost has been determined not to be efficient, Jacobs
recommends that Seqwater requests that Veolia water revisits these forecasts in light of our findings.

Gold Coast Desalination Project
QE06934R001
Appendix A. Initial data review and gap analysis
Date 13 May 2014
Subject Independent cost review - GCDP
The following is a list of questions from Jacobs SKM regarding the GCDP forecast costs. The responses from
Veolia based on a meeting held on the 13 May 2014 are recorded in blue.
The questions below refer in part to the provided spreadsheets:
MWA Long term OPEX Template 2014-03-19
R and M 15yr Forecast Rev 3
15Year Budget Membrane Replacementsv2
PM Schedule FY 15
1) Please can you confirm that the MWA Long term OPEX Template 2014-03-19 spreadsheet contains all of
the budget costs for the GCDP, i.e. that the total proposed costs for FY 2014/15 are $14.135 million.
Alternatively please provide any additional costs (e.g. CAPEX cost spreadsheet)
The MWA Long term OPEX Template 2014-03-19 spreadsheet contains all of the budget costs for the
GCDP, with the exception of some additional “project costs”. Jacobs SKM will base its review on these
costs.
Based on a review of MWA Long term OPEX Template 2014-03-19, there are four costs we are particularly
interested in:
Area FY 2014/15 Cost Source
Repair & Maintenance –
Preventative
$4.235 million MWA Long term OPEX Template 2014-03-19
Employee Cost – Direct $3.327 million MWA Long term OPEX Template 2014-03-19
Repair & Maintenance - Projects $1.292 million MWA Long term OPEX Template 2014-03-19
Other Fixed Costs $0.768 million MWA Long term OPEX Template 2014-03-19
Repair & Maintenance – Preventative
2) For Repair & Maintenance – Preventative, please confirm that a breakdown for this cost is provided in R
and M 15yr Forecast Rev 3. Please clarify the difference in costs between these two spreadsheets (it could
be that this includes other costs from this spreadsheet, e.g. corrective and asset refurbishment). Also,
please confirm the reason for difference is other costs and confirm which source presents the most reliable
source of data. Whilst the overall total is comparable between spreadsheets, the allocation between areas
is different.
The MWA Long term OPEX Template 2014-03-19 was submitted to Seqwater in November 2013. The R
and M 15yr Forecast Rev 3 contains more recent costs. The costs from R and M 15yr Forecast Rev 3
should be used in the analysis of Repair & Maintenance – Preventative.

Gold Coast Desalination Project
QE06934R001
Area FY 2014/15 Cost ($’000s)
Source: MWA Long term OPEX
Template 2014-03-19
Source: R and M 15yr Forecast Rev 3
TO BE USED
Repair & Maintenance – Preventative 4,235 1,577
(4,308 - Repair & Maintenance - PS & CO & Refurb)
Repair & Maintenance - Breakdown 351 435
Repair & Maintenance - Projects 1,292 1,082
Repair & Maintenance - Asset
Replacement
469 170
Spare Parts 289 373
Total 6,636 6,368^
^ Including PS & CO & Refurb in Repair & Maintenance - Preventative
3) Please provide a key to the allocation of hours in R and M 15yr Forecast Rev 3 (PS tab, Column A), i.e. the
definitions of items such as ____________ and others. This should relate to an org structure (where
relevant).
___ is the primary electrical contractor
___ is the primary maintenance contractor.
The above two contractors undertake the majority of the maintenance work. Costs are calculated based on
the documented hourly rate.
There are other smaller lump sum contracts (e.g. ROV – remotely operated vehicle for inspecting the
tunnels and tanks) – see rows 11 to 28.
4) The values for Preventative Maintenance (PM) come from a tab called “PS Workings” (within R and M 15yr
Forecast Rev 3). Please can you demonstrate how hours are assigned to ____________ and others?
Hours are allocated based on skills required for tasks.
5) The information in “PS Workings” seems to align with the information in “PM Schedule FY15”, although
some of the dates are different. In addition, PM Schedule FY15 also shows breakdown to different groups.
A comparison of the overall numbers (see below) show that the total number of hours align over the July
period. Please confirm that the breakdown from PM Schedule FY15 can be used to identify hours for
categories other than ____________?
The information within PM Schedule FY15 and R and M 15yr Forecast Rev 3, PS Workings is considered to
be similar. If in doubt, the information from R and M 15yr Forecast Rev 3, PS Workings should be used.

Gold Coast Desalination Project
QE06934R001
From: PM Schedule FY15
JUL
07 14 21 28
Total Hours per week 635.2 407.1 160.4 261
From: R and M 15yr Forecast Rev 3, PS Workings
JUL
07 14 21 28
PMs hours not assigned 188.4 85.7 2 0
In particular, we will be focussing on areas with a high number of hours assigned, as follows:
PM Code Department Description Total Est Hours Total over FY 2014/15
GCD-R-1071 GCD-CO 1 Monthly Calibration Online Analytical Instruments 95 1,045
GCD-R-1010 GCD-CO 1 Monthly Cleaning of Online Instrument Panels 20 220
GCD-R-1072 GCD-CO 1 Weekly Calibration of Online pH and Temperature Analysers 10 510
GCD-R-0013 GCD-CO 1 Weekly Calibration Verification of Startup Instruments 5 255
255
GCD-R-0252 GCD-CO 1 Yearly Compliance Inspections Emergency Lighting 600 600
GCD-R-0251 GCD-CO 6 Monthly Compliance Inspections Emergency Lighting 300 300
GCD-R-2500 GCD-CO 1 Yearly Service of Lightnin Mixers 80 240
GCD-R-0261 GCD-CO 1 Monthly Inspection of Air Conditioning Units 40 480
GCD-R-0067 GCD-CO 6 Monthly Inspection of Intake and Outfall Structures 120 240
6) For the above tasks, please provide details of the task, basis for determining frequency and details of who
is performing the tasks (including which tasks are contracted out).
Frequency of tasks is determined by:
Vendor recommendation
RCM
Feedback following previous maintenance cycles
Organisational charts to be provided.

Gold Coast Desalination Project
QE06934R001
Employee Cost – Direct
7) For Employee Cost – Direct, please provide a breakdown of costs and associated organisation chart.
The MWA Long term OPEX Template 2014-03-19 was submitted to Seqwater in November 2013. Budget
was formed based on consideration of FTEs at the time. There are considered to be minimal changes since
this budget was submitted (minor change in EBA). Jacobs SKM to review Employee Cost – Direct as
outlined in the MWA Long term OPEX Template 2014-03-19 spreadsheet.
A cost breakdown to be provided.
Organisational charts to be provided.
8) Please provide information on the tasks undertaken by direct employees.
Task information to be provided. It is understood that tasks include supervision, management, support
functions (finance, procurement, admin etc).
9) Please identify critical and non-critical staff.
There are 23 FTEs, 12 operators and the remaining staff performing other tasks (as will be identified in the
organisational charts and task descriptions).
Projects
10) For Projects, please provide further information to allow a review of prudency and efficiency. We require
details for the three largest projects (Relocation of Mapping lines to outside HP Areas, Relocation of
Sample Panels to outside HP Areas, Replacement of Emergency Lighting). Details should include: basis
outline of project, project driver, basis of cost estimate, details of any options analysis undertaken, plus any
supporting documentation.
Projects may or may not have been submitted in the budget
_______ to confirm
Business cases to be provided for high value projects scheduled in FY 2014/15.
Other supporting documentation to be provided.
Other Fixed Costs
Breakdown of costs and supporting documentation to be provided.

Gold Coast Desalination Project
QE06934R001
Appendix B. Organisation structure
___