Embed Size (px)
Citation preview

INDEPENDENT POWER PRODUCERS OPERATION COST AND
ELECTRICITY TARIFFS IN KENYA
BY
MASIKA M. JAMES
D61/67812/2013
SUPPERVISOR: TOM KONGERE
A RESEARCH PROJECT SUBMITED IN PARTIAL FULFILMENT OF
REQUIREMENT FOR THE AWARD OF THE DEGREE OF MASTER
OF BUSINESS ADMNISTRATION, SCHOOL OF BUSINESS,
UNIVERSITY OF NAIROBI
2016

ii
DECLARATION
STUDENT DECRALATION
This project is my original work and has not been submitted for the award of degree in
another University.
Signed:…………………………… Date…………………………
Masika M. James
D61/67812/2013
APPROVAL
The project has been submited for the examination with my approval as the supervisor.
Signed:…………………………… Date…………………………
Supervisor name:………………………………………………………………………………

iii
ACKNOWLEDGEMENT
First, I thank the Almighty God for giving me a vision and bestowing me with ability to carry
out this research
Secondly, I wish to acknowledge Mr. Tom Kongere my supervisor and lecturer. In the spirit
of mentorship you guided me with passion and determination.
Finally I wish to acknowledge my moderator Dr. X. N. Iraki, all members of the Department
of Management Science and friends who in one way contributed to the success of this work.
Thank you all.

iv
DEDICATION
I dedicate this work to my family members. You are the happiness and joy of my life. God
bless you.

v
TABLE OF CONTENTS
DECLARATION………………………………………………………………………….. ii
ACKNOWLEDGEMENT………………………………………………………………… iii
DEDICATION…………………………………………………………………………….. iv
ABBREVIATION AND ACRONYMS………………....................................................... vii
LIST OF TABLES…………………………………………………………………………. viii
LIST OF FIGURES…………………………………………………………………………ix
ABSTRACT…………………………………………………………………………………x
CHAPTER ONE: INTRODUCTION……………………………………… ………………1
1.1 Background of the study………………………………………………………………. 1
1.1.1 Operations of Independent Power Producers ………………………………………3
1.1.2 Electricity tariffs in Kenya………………………………………… ………………5
1.2 Problem statement……………………………………………………………. ………6
1.3 Research objectives……………………………………………………………………9
1.4 Value of the study……………………………………………………………. ………9
CHAPTER TWO: LITERATURE REVIEW………………………………………………10
2.1 Introduction…………………………………………………………….. ………………10
2.2 Theoretical review…………………………………………………………………..10
2.2.1 Theory of Constraints………..……………………………………………...............10
2.2.2 Product switching Theory……………..…………………………………………….11
2.2.3 Systems Theory……….…………………………………………………..................12
2.3 Operation Cost…………………………………………………………………. ………13
2.4 Electricity Tariff…………………………………………………………………………13
2.5 Input Output Model……………………………………………………………..……….14
2.6 Empirical studies……………………………………………………….. ……………….15
2.7 Summary of Literature and Research Gaps……………………………..……………….17
2.8 Conceptual framework…………………………………………………. ……………….18
CHAPTER THREE: RESEARCH METHODOLOGY…………………… ……………….20
3.1 Introduction…………………………………………………………………... ……….20
3.2 Research Design……………………………………………………………………..20
3.3 Target Population…………………………………………………………….................20
3.4 Data collection………………………………………………………… …….................20
3.5 Data analysis…………………………………………………………………...……….21

vi
CHAPTER FOUR: DATA ANALYSIS, RESULTS AND DISCUSSIONS…… ………23
4.1. Introduction ……………………………………………………………………….. 23
4.2. Response rate ……………………………………………………………………… 23
4.3. Demographics……………………………………………………………………….23
4.3.1. Gender and age distribution of respondents…………………………………… 23
4.3.2. Number of years worked at the company by respondents………………………24
4.3.3. Highest level of academic qualification by respondents………………………..25
4.3.4. Operations and planning by IPPs………………………………………. ………26
4.4. Generation cost and cost of electricity……………………………............... ………28
4.5. Capacity utilization and cost of electricity……………………………….................29
4.6. Power supply cost and cost of electricity…………………………………............... 29
4.7. Correlation analysis………………………………………………………………….30
4.7.1. Generation cost………………………………………………………………….30
4.7.2. Capacity utilization cost…………………………………………………………31
4.7.3. Supply and demand cost……………………………………………………….. .31
4.7.4. Cost of electricity from IPPs per KWh………………………………………… .31
4.8. Regression analysis………………………………………………………………….32
4.9. Input Output model………………………………………………………………… 33
CHAPTER FIVE: SUMMARY, CONLUSSIONS AND RECOMMENDATIONS……. 36
5.1. Introduction………………………………………………………………………… 36
5.2. Summary of the findings……………………………………………….................... 36
5.3. Conclusions………………………………………………………………………….37
5.4. Recommendations………………………………………………………….. ………38
5.5. Limitations and recommendations for further studies……………………………... 38
REFERENCES…………………………………………………………….. ……................40
APPENDICES…………………………………………………………………………...… 45

vii
BBREVIATIONS AND ACRONYMS
IEA International Energy Agency
KP Kenya Power
MW Measure of Electricity energy (Mega Watts)
ERC Commission for Energy Regulation
IPP Independent Power Producer generating more than 40MW
ANOVA Analysis of Variance

viii
LIST OF TABLES
Table 2.1 Literature review, findings and research gaps 17
Table 4.1 Mean generation cost of electricity in KWh 28
Table 4.2 Capacity capitation electricity cost in KWh 29
Table 4.3 Cost of power distribution 30
Table 4.4 Correlation analysis from the variable 31
Table 4.5 Cost of electricity from IPPs 32
Table 4.6 Regression coefficients 33
Table 4.7 ANOVA 33
Table 4.8 Input Output table for the electricity energy sector 33
Table 4.9.1 Intersectoral demand for the electricity sector 34
Table 4.9.2 Technological matrix for the electricity sector 34

ix
LIST OF FIGURES
Figure 4.1 Response age bracket 24
Figure 4.2 Respondents number of years worked 25
Figure 4.3 academic data response 26
Figure 4.4 Responses on the IPPs operation 27

x
ABSTRACT
While electricity supply and demand is affected by various exogenous variables such as
amount of power generated, number of customers connected to the grid and various policy
regulations from the government, the burden of high electricity costs is a major concern to
most stake holders. The study aimed at establishing a relationship between IPPs operation
cost and the cost of electricity in Kenya. The objectives of the study were: to find out the
relationship between operation cost of IPPs and electricity tariff in Kenya and to test the input
output model in determining electricity tariff. The target population consisted of five licensed
IPPs in Kenya. A census approach was used in the study where all the 5 licensed commercial
IPPs were studied by the researcher. Descriptive survey design was used in obtaining data
from five IPPs in Kenya namely Westmont, Iberafrica, OrPower4-Kenya, Tsavo Power
Company (TPC) and Rabai. Questionnaires were administered to obtain primary data from
the respondents. Secondary data was obtained from published annual reports from Energy
Regulation, Kenya power and IPPs annual reports ranging from 2012 to 2015. Quantitative
data analysis, regression and ANOVA were used to analyze data. Graphs and tables were
used to present the results. It was found out, from the study, that operation costs of
Independent Power Producers affect the cost of electricity in Kenya. The study recommended
that the Energy Regulation Commission ought to review the pricing strategy for electricity
and that Kenya Power ought to determine a favourable generation mix by IPPs and minimize
system loses to reduce electricity tariffs paid by consumers.
1
CHAPTER ONE: INTRODUCTION
1.1. Background of the Study
Energy is an essential factor of production and its total consumption is a major
determinant of performance in the world economy (Stern, 2003). Stability of power
tariffs a major factor in development and growth (Ministry of Energy, 2013). According
to the IEA (2011), 80% of people who live in rural areas have no access to electricity in
Southeast Asia. However, with major efforts made in putting up electricity plants in
remote and urban areas, the electricity supply has move from 43.8% to 59.2% in only 7
years. Singapore has led this crucial process by 100%, as others like Brunei Darussalam
(88.8%); Malaysia (87%), Thailand (88%), and Vietnam (82%) take up the challenge.
This was as a result of introduction of Independent Power Producers in the energy supply
chain through private partnership.
For comparison, more than 20% of the population globally had no connection to power
by 2009 of which 85% live in remote areas (IEA, 2011). Since 2002, there is a decrease
by 161 million worldwide, although the world population has grown by 500 million
people. However, in global terms, power connectivity is going up since there is great
uptake of power from IPPs investments. As for Latin America and Asia they have
greatly increased power generation from IPPs but it is contrary with most of Sub Saharan
Africa which are lacking behind and do not even match the growing population of the
continent. In Sub-Saharan Africa less that 15% of the people who live in remote areas
have been connected to power. However, the population is growing very fast. It is
therefore undisputed that the people without power connection will be increasing in
Africa.

2
In Kenya as spelt out in vision 2030, electricity connectivity was cited as one of the
major determinants of a sustainable growth and development of our economy. Therefore
energy is a social economic pillar that is vital for the Kenyan government to sustain its
vision and meet the increase in per capita income for the citizen. According to vision
2030, the generation of electrical energy is expected to be approximately 15,026MW in
2030 against a capacity of 1,194MW available in 2011, a growth of 1,258%. Similarly,
70% of the Kenyan‟s households are expected to be connected to electricity during the
same period (Ministry of Energy, 2011-2012). However, energy management and
sustainability of electrical power tariffs in Kenya has been a concern for consumers over
time. In the 2011/2016 strategic plan, Kenya Power proposes engaging independent
consultants to carry out power market study and make recommendations on tariff changes
that can minimize burden to customers (KPLC, 2011).
Stern (2003) evaluated the dissatisfaction of the energy stakeholders in assessing demand
and supply of electrical energy and found out that while energy managers argue that
reliance on hydro power is the cause of upward review of power tariffs when thermal
generators are used during dry seasons, consumers perceive cost fluctuations on attitude
of Kenya Power as a major player in the electric energy sector. Since the current cost of
power has also been associated with high inflation rates, the government and other
stakeholders have been prompted to diversify power generation sources to feed more
power into the national grid. Off the grid sources are also being exploited (ERC, 2013).
Although the government intends to reduce the cost of power by forty percent by
increasing the current capacity from 2,000 to 5,538 Megawatts, energy economics argue
3
that with the constrained public funding, increased power production can only be attained
by engagement of more IPPs in the energy supply chain (ERC, 2013). While it is
important for government and other stakeholders to recognize the need for generating
more power, it is crucial to evaluate the operation cost of Independent Power Producers
(IPPs) in relation to cost of electricity in Kenya.
1.1.1. Operational Cost of Independent Power Producers
An Independent Power Producer (IPP) is private investment in electricity generation
(IEA, 2009). Operation is the transformation of resources in a defined system to add
value and achieve organizations goals through efficient acquisition and utilization of
resources (Boyles and Krajewski, 2007). While energy strategies provide estimates,
operations are determined by performance numbers in performance management
According to McEwan, (2001) in early 1990s, most power generation activities were
from donor funding by loans given to the state from financial institutions in the world.
This latter changed due to changes that were beyond the understanding of the
beneficiaries. These changes were occasioned by the withdrawal of such funds as a
matter of political re-alignment and balance of trade. Most countries were affected by
such withdrawals thus forcing them to use local resources for power generation. This
necessitated the introduction of IPPs to handle the growing demand for power as a result
of the growing population in the affected countries. Private firms were introduced to
compete in energy the projects (Dhole, 2010). IPPs were started with regulated power
purchase agreements to supplement power production and hence enable many people to
be connected to the national grid. (Iloranta, 2008). Dhole (2010) laments that although

4
IPPs were mean to help in reducing the stain on the state facility, their establishment
Kenya and other African countries is very low. This therefore does not provide a clear
benchmark in their operations and the intended competition as it was initially thought.
Strong growth in electricity demand in Kenya is being driven by a combination of normal
economic growth, increased efforts towards rural electrification, and reinforcement of the
transmission and distribution grids (KPLC, 2013). On the supply side, drought conditions
in 2006 reduced the capability of the hydro-electric plants to produce. This spotlighted
the high risk of over-reliance on hydro-electric power plants to secure power supply to
the country. Meanwhile, the government cannot sustain the power demand since the
funding of the energy sector is constrained thus electricity supply against demand is still a
challenges without IPPs (Ministry of Energy, 2011)
According to ERC (2011), although IPPs were introduced in 1996, the state still dominate
the generation of power in Kenya at 80% while IPPs range from 18% to 20%. Other
generation at 2% are from imports and small scae generator which means that IPP
investment is still low in Kenya.
Although KenGen‟s IPO of 30% of its shares of 2004 brought in more funds to facilitate
state capacity to generate more power, the country‟s population growth is higher in rural
areas which require that private investment is invetiable (IEA, 2011). This is a major
challenge to the economy.

5
1.1.2. Electricity Tariff in Kenya
A power tariff is the cost of electricity which is made up of capital costs of owning the
distribution network, the costs of purchasing power from power generators and the post-
acquisition costs in the form of operations and maintenance (McEwan, 2001). Operation
cost remains a significant determinant in the cost of electricity distribution which is
broadly categorized into variable and fixed costs (KPLC, 2011). While variable costs will
fluctuate based on the volume of electricity distributed, and therefore controllable, fixed
costs like depreciation of power equipment cannot be controlled.
Kenya Power acquires its electricity from various generators. Energy Regulation
Commission (2014) analyzed sources of electricity and tariff in Kenya and found out that
the major contributor to the national grid is KENGEN with most of its activities in hydro-
electric generation and most recently, geothermal. Other sources of electricity in Kenya
include the use of diesel as source of fuel for electricity generation and wind energy.
Solar energy and coal also contribute to the national grid but to a less extent. The
problem of overreliance on hydro-power generation is the periodic reduction of water
levels during periods of drought. Fuel generated electricity tariff on the other hand is
expensive and fluctuates with global fuel economics of demand and supply (KPLC,
2013).
A study by IEA, (2011) found out that politics had played a major role in determining
electricity tariff yet energy is major economic measure that requires a sound economic
theory base. Price discriminations are dominant arguing that most industrial sector has
the power to pay yet the price of commodities form this sector are high due to power
costs. It is also argued that household and agricultural customers do not have the ability

6
to pay and hence require a lower tariff. The high cost of power to industries translates
into high cost of goods produced which is passed to consumers. As a result, power tariffs
are a political theory yet they are supposed to be founded on an economic policy.
Energy Regulation Commission (2014) analyzed tariff reviews and found out that the
upward review of tariff is as a result of fuel cost arrears that needed to be recovered
during periods of diesel generated power. The consumer paid 7.22 shillings per unit of
electricity higher compared to 5.19 in March. Although it was expected that there would
be 20% decrease in power cost by September 2014. A report published by consumer
Federation of Kenya (COFEK) (2015) indicated that consumers were still paying more
for electricity despite efforts by the government to reduce energy bills yet there was a
drop in crude oil prices. Mostly, power generators and distributors have not been reliable
and sometimes they do not meet consumer demand thus the need for this study. There is
need to reform the energy sector in developing countries.
1.2. Research Problem
Although demand and supply are dependent on price, Coy (2010) found out that pricing
of most goods and services is based on „cost-plus‟ model which sets a price for a product
that is sufficient to recover the full cost with some profit margin. Therefore when
demand increases firms strive to produce more at minimal operational cost to attain a
competitive price (Bernard, Andrew & Redding, Stephen & Schott, Peter, 2010).
However with increased electricity demand in Kenya, IPPs have reduced with
government focus on public utility power generation. Due to low capital to fund such
large projects, future power demand may not be realized (ERC, 2013).

7
Since electricity generated must be used or lost (Mehta, 2012), Kenya Power determines
the amount power that is supplied by IPPs into the national grid. In order to recover the
operation cost, IPPs negotiate power purchase agreements with Kenya Power which also
determines the electricity tariff.
Input output model developed by Wassily Leontief can be used to determine price of
products when consumption is equal to production (Dietzenbacher, Erik & Michael,
2011). By use of the Leontief model and taking p as price per unit (X) and production
value for Xj units of good j as p1X1j + p2X2j + ... + PnXnj, the model is expressed as (I -
(1+r) A) p = 0 where I is identity matrix and (1+r) stands for profit rate (Michael et at.,
2011). The research sought to test this model in relation to the operation cost of IPPs and
the electricity tariff.
World Bank (2000) studied the economic impact of power generation in Asian countries
and found out that IPPs have generally been perceived as expensive and that producers
take advantage to reap from lack of water for hydro-generation. Parsons (2012) found out
that integrated wind power in the USA reduced the operation cost of power hence
reducing the overall power tariff. Although had to allow the operations of IPPs to
overcome power shortage, there is still need to encourage investment in IPPs as their
uptake is still low. There is very little competition realized since 1996. Studies by
Hannele, Meibom, Orths, Lange, Malley, Tande, Estanqueiro, Gomez, Söder and Hulle
(2010) in America indicate that turning to IPPs during emergence is not only a risk affair
but also an expensive venture. Hannele et al., (2010) further explicitly tested the
hypothesis regarding sequence of privatization and the introduction of competition in

8
government utility reforms in developing countries, and they found that delays in the
introduction of competition may adversely affect operation performance even after
competition is eventually introduced.
Odiambo (2010) analyzed the relationship between energy consumption and economic
growth and found out that African countries needed to augment government utility with
IPP energy supply in order to meet long run energy demand. However, studies by
Njoroge (2008), IEA (2011) and Kamau (2009) in Kenya depict power from IPPs as
expensive and that vandalism of electrical equipment which are outsourced using foreign
currency increase tariff depending on inflation and global energy rates. Yet, there is little
study on the operation cost of IPPs and the electricity tariff. Moreover, there is little
accurate description of the state‟s ability to finance and build competitive plants within a
short timeframe. As a result, unstable sourcing of power during emergencies will always
lead to unstable tariffs (IEA, 2011).
While it appears that some IPPs are closing down (Aggreko), their operation cost may be
among the factors influencing future investments in IPPs and the cost of electricity hence
the need for this study. This study sought to examine the operation cost of IPPs and the
electricity tariff in Kenya. Through the study, the government will be able to assess how
effective the IPPs have contributed to the stability of power and tariffs since their
inception. This will establish an effective power purchase agreements and electricity
tariff by answering the following research questions.
9
i. What is the relationship between operation cost of IPPs and cost of electricity
ii. How can the input output model be used to determine electricity tariff given the
production cost of power
1.3. Research Objectives
The general objective of the study was to evaluate the operations cost of IPPs and
electricity tariffs in Kenya
The specific objectives of the study were:
1. To establish the relationship between operation cost of IPPs and electricity tariff
2. To test the input-output model in determining power tariff
1.4. Value of the Study
The study provides an insight to Kenya Power management on areas of improvement on
the purchase of power operation cost. The study can also be used by other stakeholders in
the electrical energy sub sector in analyzing and determining best performing models for
the sector.
The research will provide an opportunity for further research and development in the
field of electrical energy management.
It is hoped that the findings of the study will be used by the energy sector regulators for
policy formulation, energy sector restructuring and standardization.

10
CHAPTER TWO: LITERATURE REVIEW
2.1. Introduction
This chapter details the study, location and analysis of documents containing information
related to the research problem being investigated. It reviews various theories related
operations of IPPs and electricity tariffs. The chapter also focuses on the conceptual
framework, empirical review and summary.
2.2. Theoretical review
Various theories have been fronted by various scholars on operation sectors of the energy
economy. To evaluate the operation cost of IPPs and the electricity tariff in Kenya, the
study is guided by the following theories: theory of constraints, product switching theory
and systems theory.
2.2.1. Theory of Constraints
According to this theory, a constraint is any aspect of a system or company, from product
design and marketing to manufacturing and distribution, which limits it from achieving
the system goal. Therefore, it is evident that the actions of marketing are guided by the
concept of cost and margins, even more than the actions of production (Birkin, Thomas
and Linda, 2009). Operation productivity can be improved by managing bottle necks
through elimination of bottlenecks and adding capacity (Birkin et al., 2012). This is
achieved when value added processes are emphasized while non-value added processes
are reduced or eliminated.
The operations of IPPs in Kenya is based on the on the decisions made by the company
that guide the signing of the power purchase agreements hence operation cost remains a
significant determinant in the cost of electricity generation and distribution (Jason,
11
2013). While studying increase in operation costs due to drastic load fluctuations,
Mungata (2012) found out that use of automated voltage regulator stabilizes power
systems and minimizes such costs hence reducing tariff. Therefore, there is need to study
the relationship between IPP operation costs and electricity tariff.
2.2.2. Product Switching Theory
The theory is based on models on industry dynamics where firms that are heterogeneous
in productivity are assumed to produce a single product. As a result, the firm and
product-market entry and exit are equivalent (Bernard, Andrew, Redding and Schott,
2005). When firms add and drop a product, large changes are induced in the firms
operations. Hence product switching contributes to reallocation of resources within firms
towards their most efficient use (Schott et al., 2007).
Existing empirical work on multiple-product firms typically examines product switching
at a point in time. Bush (2004) examined product diversification as a mode of market
entry distinct from plant birth, while Roberts (2010) investigated the empirical
relationship between the mode of market entry and plant death. It was found out that a
firm has the discretion to decide whether to enter or exit in participation of the production
of a certain product. This implies that a firm produces and supplies a certain product with
limited profit maximization problems during periods of low and high sales (Schott et al.,
2010).
Although large firms produce wider range of products which generate higher revenues to
cover fixed costs, IPPs reliance on power generation leads to idle equipment during low
demand periods. Although product switching theory does not provide options for idle
12
equipment during low power demand, it will help in determining its effect on tariff
changes.
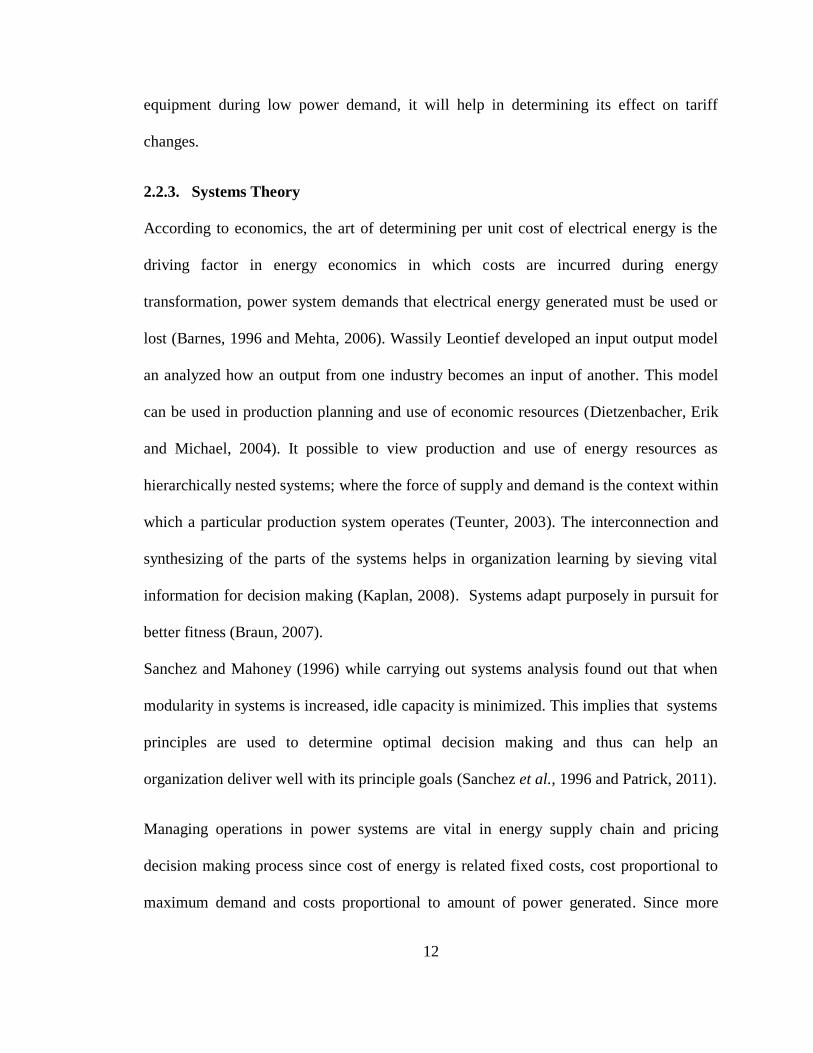
2.2.3. Systems Theory
According to economics, the art of determining per unit cost of electrical energy is the
driving factor in energy economics in which costs are incurred during energy
transformation, power system demands that electrical energy generated must be used or
lost (Barnes, 1996 and Mehta, 2006). Wassily Leontief developed an input output model
an analyzed how an output from one industry becomes an input of another. This model
can be used in production planning and use of economic resources (Dietzenbacher, Erik
and Michael, 2004). It possible to view production and use of energy resources as
hierarchically nested systems; where the force of supply and demand is the context within
which a particular production system operates (Teunter, 2003). The interconnection and
synthesizing of the parts of the systems helps in organization learning by sieving vital
information for decision making (Kaplan, 2008). Systems adapt purposely in pursuit for
better fitness (Braun, 2007).
Sanchez and Mahoney (1996) while carrying out systems analysis found out that when
modularity in systems is increased, idle capacity is minimized. This implies that systems
principles are used to determine optimal decision making and thus can help an
organization deliver well with its principle goals (Sanchez et al., 1996 and Patrick, 2011).
Managing operations in power systems are vital in energy supply chain and pricing
decision making process since cost of energy is related fixed costs, cost proportional to
maximum demand and costs proportional to amount of power generated. Since more
13
demand requires new plant facility which may not be utilized during low demand. This
can be a cost to the organization and more losses are incurred. Capacity cannot be
costless thus this results in inefficiencies which can only be recovered from high cost
(Hassan, 2010).
2.3. Operation Costs
According to power systems, (Mehta, 2012) defines operation cost as all process costing
that are consumed in power generation, maintenance and supply to determine the cost of
the output energy. Generation costs will entail plant and equipment acquisition,
utilization and depreciation whereas maintenance and supply cost will entail labour and
capacity utilization costs. Stern (2003) found out that while the existing IPPs appear to be
here to stay (save Westmont), future development remains uncertain due to recent
investments to the power sector which have been supported by multilateral agencies in
alliance with KenGen.
Energy economics do estimate the cost of energy using cost-plus method. This technique
compares the cost of centralized dispatch under and rate of transmission supply dispatch,
costs associated with rate of transmission start-up and operation costs (Eto, 2005 and
Black & Veatch, 2009). These costs are critical in determining tariffs.
2.4. Electricity Tariffs
Due to exogenous variables such as energy demand, water inflows, availability of
generation units and fuel costs, Fabra and Toro (2012) found out that the analysis of
electricity time series reflects a switching nature depending on discrete changes in
participants‟ strategies. They further proposed that input-output model can be used in

14
analyzing and forecasting electricity spot prices. Such electricity spot prices are called
tariffs.
According to the taxonomy of electricity price models, Agron (2009) and Fabra et al.,
(2012), used three models to study power tariff and found out that when price evolution is
studied stressing the analysis of the strategic behavior of the agent is called game theory
model. In this model the prices are set using the market equilibrium. The second model is
based on time series analysis where prices are set from a statistical analysis without
examining the underlying process detail. The third model is the structural model where
prices are set not only basing on production costs but also the impact of the agents
behavior on market price. It is evident that the input-output model can be tested in
determining tariff.
2.5. Input Output Model
According to Nagales (2010) electricity price is said to evolve through different market
states which is characterized by the interaction of demand and participants‟ strategies
which are reflected in electricity price time series. He further found out that if the market
is a particular state today, it is important to estimate both the probability that the market
remains in the same state tomorrow and the probability that the market changes to other
positions. Thus S (state) = {S1, S2 …Sn)
The model determines the market on a probabilistic method where a set of functions can
be from either hydro, thermal or nuclear resources. This is in line with the different
relationships among the variables and prices. Hence transitional state probability matrix
from a set of N emission probability density function is as follows: A = (a ij = P (st+1

15
=Si/St = Sj)) ᶓ [0, 1]NxN
this can be related to the function A = Z (XD)
-1 since the inputs are
proportional to the outputs.
2.6. Empirical Studies
A considerable number of studies have been undertaken on IPPs. During state monopoly
in the 1990s there were no IPPs. After their introduction in 1996, IPPs were perceived as
expensive and therefore little emphasis was put onto them. This led was coupled with
higher power outages in Asian countries (World Bank, 2004). However, It was later
found out that IPP would not only help the government reduce cost in energy sector but
also lead to further concentration in other areas of the economy thus efficient utilization
of energy resources.
Studies by Kamau (2009) show that outsourcing can help firms reduce production costs
by specializing in what they produce at least costs. However, Njoroge (2008) had
attributed vandalism of electrical equipment as a major contributor to power outages and
increased electrical tariff. This was augmented by Aberhard (2010) who assessed the
success of IPPs in Sub Sahara Africa using sample survey and found out that contracting
and outsourcing of power from IPPs that are well financed could curb power outages.
Nzila, (2010) attributes power outages in Africa to little emphasis on renewable energy
and recommended use of alternative sources of renewable energy to avert global energy
crisis. These studies did not analyze the operation cost of IPPs which will be addressed
by the proposed study.
According to Mustafa (2013) who carried out research on the benefits of IPPs in
Bangladesh using descriptive sample survey, IPP power is expensive and uneconomical
due to lack of government subsidy. They however did not relate IPP operation cost with

16
changes in tariff. This study intends to use census survey to relate IPP operation cost to
changes in power tariff.
Mujeri and Chaoudery (2013) found out that power outages were from inefficiencies and
poor production controls other than inadequate capacity. This studies do not relate
operations cost of IPPs and roles played by IPPs in electricity supply and tariff changes.
Kenya relied primarily on concessionary funding from multilateral and bilateral agencies
to finance new power investments but due to poor donor funding, the country‟s power
generation by private sector gradually emerged in the mid-1990s, paving the way for
contracting the first set of IPPs in 1996 (McEwan, 2001). While studies by International
Energy Agency (2011), classifies cost of power based on fixed and variable consumption
rates, ERC (2013) findings show that inflation and global sourcing causes tariff
instability. These studies do not exploit the relationship between IPP operation cost and
the power tariff.
According to Wendle (2013) while assessing the impact of new IPPs in Kenya found out
that the economic cost of not having power is higher than generating power from diesel
plants. Although Newbery and Commander (2013) found out that government incentive
and the isolation of power distribution from generation should prevail over decisions to
undertake private participation in power generation, their study did not exploit the
relationship between IPP operation cost and tariff changes.
17
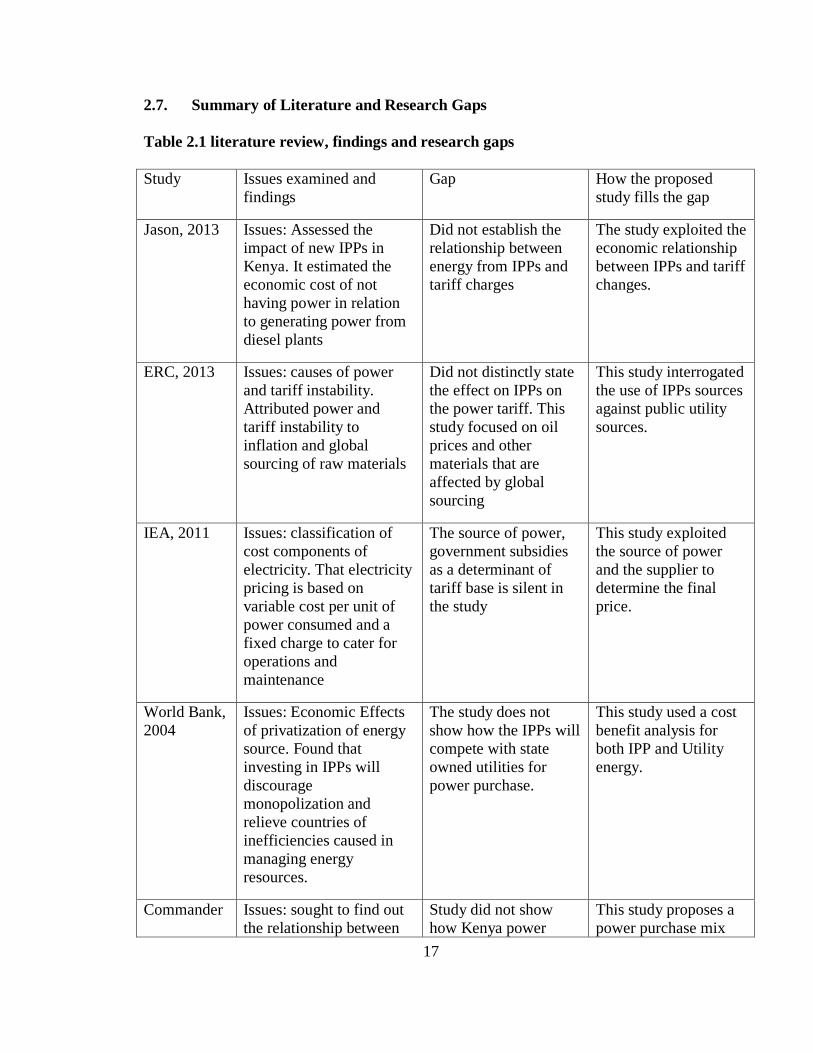
2.7. Summary of Literature and Research Gaps
Table 2.1 literature review, findings and research gaps
Study Issues examined and
findings
Gap How the proposed
study fills the gap
Jason, 2013 Issues: Assessed the
impact of new IPPs in
Kenya. It estimated the
economic cost of not
having power in relation
to generating power from
diesel plants
Did not establish the
relationship between
energy from IPPs and
tariff charges
The study exploited the
economic relationship
between IPPs and tariff
changes.
ERC, 2013 Issues: causes of power
and tariff instability.
Attributed power and
tariff instability to
inflation and global
sourcing of raw materials
Did not distinctly state
the effect on IPPs on
the power tariff. This
study focused on oil
prices and other
materials that are
affected by global
sourcing
This study interrogated
the use of IPPs sources
against public utility
sources.
IEA, 2011 Issues: classification of
cost components of
electricity. That electricity
pricing is based on
variable cost per unit of
power consumed and a
fixed charge to cater for
operations and
maintenance
The source of power,
government subsidies
as a determinant of
tariff base is silent in
the study
This study exploited
the source of power
and the supplier to
determine the final
price.
World Bank,
2004
Issues: Economic Effects
of privatization of energy
source. Found that
investing in IPPs will
discourage
monopolization and
relieve countries of
inefficiencies caused in
managing energy
resources.
The study does not
show how the IPPs will
compete with state
owned utilities for
power purchase.
This study used a cost
benefit analysis for
both IPP and Utility
energy.
Commander Issues: sought to find out
the relationship between
Study did not show
how Kenya power
This study proposes a
power purchase mix
18
et al., 2013 electricity demand and government incentives. It
was found out that
government incentives can
encourage IPPs
investment to cater for
increasing power demand
could buy the power from IPPs and reduce
off peak capacity
underutilization that
lead to peak load
pricing problems
that discourages peak load pricing dilemmas.
Mujeri and
Chaoudery
(2013)
Issues: sought to find out
the relationship between
outages and energy
efficiency. Showed that
inefficiency is not from
inadequate capacity but
from breakdowns, poor
maintenance and losses.
The study could not
show how losses from
inefficiencies affected
tariff bearing in mind
the various sources of
power
This study aimed at
finding out how the
source of power and
losses from
inefficiencies
contribute to tariff
changes
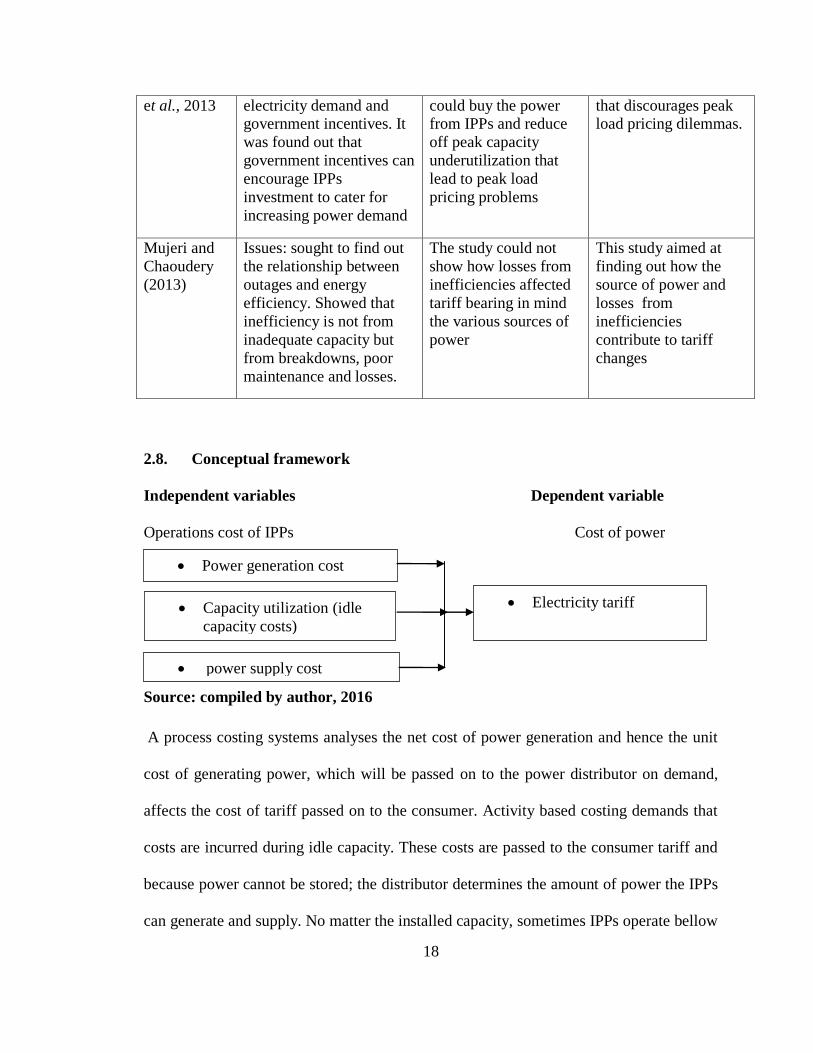
2.8. Conceptual framework
Independent variables Dependent variable
Operations cost of IPPs Cost of power
Source: compiled by author, 2016
A process costing systems analyses the net cost of power generation and hence the unit
cost of generating power, which will be passed on to the power distributor on demand,
affects the cost of tariff passed on to the consumer. Activity based costing demands that
costs are incurred during idle capacity. These costs are passed to the consumer tariff and
because power cannot be stored; the distributor determines the amount of power the IPPs
can generate and supply. No matter the installed capacity, sometimes IPPs operate bellow
Power generation cost
Capacity utilization (idle
capacity costs)
Electricity tariff
power supply cost

19
optimal level hence idle capacity. Since all power generated (supply) has to be consumed
or lost, the amount of power supplied and distributed (demand) affects consumer tariff.
20
CHAPTER THREE: RESEARCH METHODOLOGY
3.1. Introduction
This chapter outlines the research methodology that was used in collection and analysis
of data and presentation of the research findings. The chapter is divided into the
following parts; research design, target population, data collection methods, instruments
of data collection and finally the data analysis.
3.2. Research Design
Descriptive survey design was used in this study since it could provide accurate, reliable
and up to date information on the operation cost of IPPs and electricity tariff (Ravindra,
2014). Survey is an attempt to collect data from members of a population to determine
the current status of that population with respect to one or more variables. This design
allowed the researcher to collect information and examine single units of the variables
hence demonstrating relationships and describing the operation cost of IPPs and Kenya
Power tariff. Data collected was described to answer questions on the relationship of
operation cost of IPPs and the power tariff.
3.3. Target Population
Since the researcher was dealing with a small population, the study was a census of all
the five IPPs which are: Westmont, Iberafrica, OrPower4-Kenya, Tsavo Power Company
(TPC) and Rabai. Kenya Power was further studied to get the relationship on power
tariff.
3.4. Data Collection
Data collection instruments for this study were questionnaires which were used to
provide in depth information on operations of IPPs and Kenya Power tariff. Due to time

21
and resource constraints, the respondents were operational managers or their equivalent
selected from the IPPs. Open and closed ended questions were mailed to the respondents
to respond and return them to the researcher by post paid mail. The researcher preferred
the question since they were easy to administer and the research questions were
developed to focus on the specific objectives. Secondary data forms (appendix 2) were
also used to obtain annual information on operation cost and tariff. Secondary data
sources were obtained from ERC reports, Kenya Power tariff data and individual IPPs
operation cost data.
3.5. Data Analysis
Data collected was edited, coded, classified, summarized and analyzed using descriptive
statistics. The first objective, portrayed in the cost of generation, supply, and demand was
analyzed using summary statistics in the initial stages of the data analysis. This was
followed by cross tabulation of the variables, correlation analysis, and paired t tests. For
the second objective, ANOVA and regression analysis was used to measure the strength
of the relationship between operations of IPPs and the electricity tariff. The regression
model was in the form:
Y= β0+ β1X1+β2X2+ β3X3+α
Where, Y is the dependant variable (Electricity tariff), β0 is the regression coefficient (Y-
intercept), β1, β2, β3, are the slopes of the regression equation, X1 is the generation cost, X2 is the
capacity utilization cost, X3 is the supply and demand cost while α is the error term at 95%
confidence level.
The input output model was used to determine power generation mix in the form:
x = (I - A)-1
y.

22
Where: x is price demanded from IPP and y is price demanded from Kenya Power Consumers.
The (I - (1+r) A) p = 0 of the Leontief matrix was tested to determine changes in power
tariff. Where (I) is identity matrix, (1+r) is a rate of profit and p is tariff cost. Data was
presented in form of bar charts and graphs for further illustrations so as to be meaningful
to all information users.

23
CHAPTER FOUR: DATA ANALYSIS, RESULTS AND DISCUSION
4.1. Introduction
The chapter presents research findings to establish the relationship between the IPPs
operations cost and electricity tariff. Relative frequencies, means and multiple linear
regressions were used in analyzing the results.
4.2. Response Rate
The study was conducted in all the five IPPs and Kenya Power where a questionnaire was
given to the operation managers or equivalent. All the questionnaires were filled and
returned making response rate 100%. This was considered adequate as Zikmund (2012)
considers that a 40% to 80% response rate can be generalized to give the opinion of the
entire population.
4.3. Demographics
The researcher set out some demographics in order to understand the respondents and
validate the quality of the response given. These included gender, age and academic
qualification
4.3.1. Gender and Age Distribution of the Respondents.
The study sought to identify the gender distribution of the respondents in this decision
making level and found that it was male dominated at 100%. In all the companies under
study, it was established that majority of the respondents were between 40-50 years at
60% followed by 51 years and above at 30% and finally below 39 years at 10%.
Therefore most of the responded were in the best age to respond to the questions
appropriately.

24
Figure 4.1: Respondents and age brackets
(Source: research data, 2016)
4.3.2. Number of Years Worked at the Company by the Respondents
The study sought to find out the length of time the respondent had worked in the
company under study. This was very important in determining the decision process and
makes the researcher determine an appropriate conclusion from the responded. 50% of
the respondents had worked in the same company for more than 10 years, 19% of the
respondents had worked the same company between 6-9 years, and 21% of the
respondents had worked in the same company between 3-5 years while only 10% of the
respondents had worked in the same company for less than 2 years. It is therefore clear
that the respondents were conversant with the operation process within their area of work
and that their title meant they were the senior most in those operation departments.
25
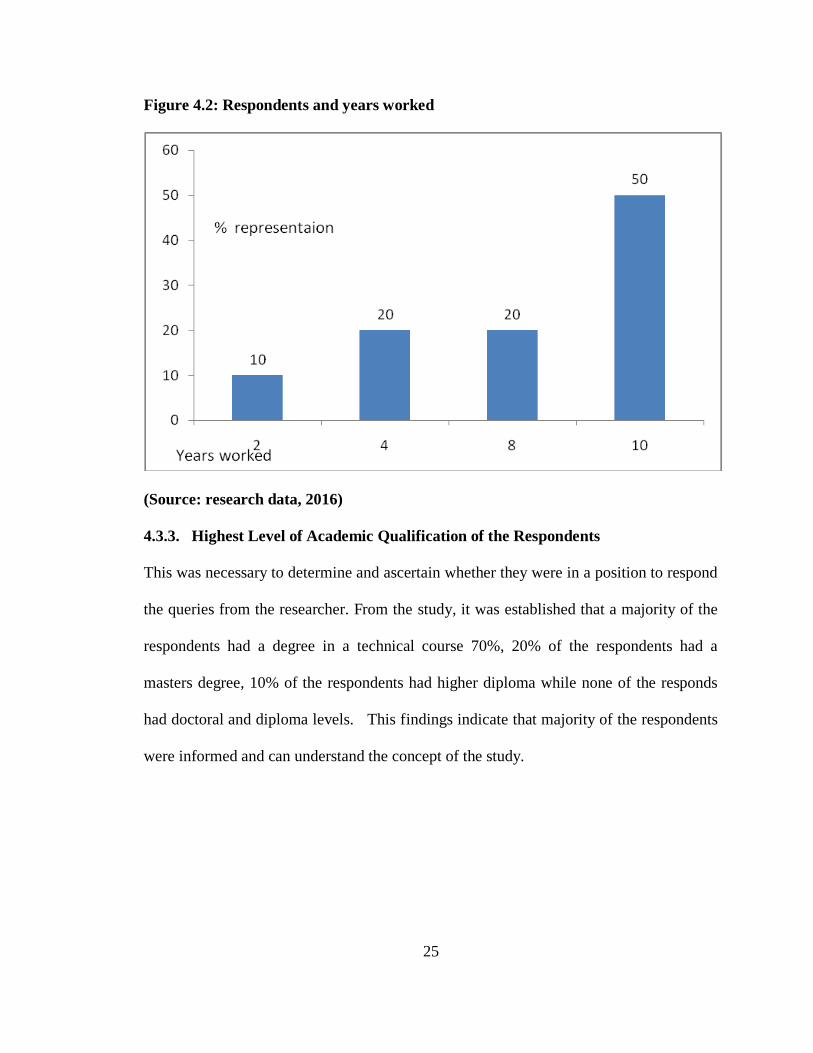
Figure 4.2: Respondents and years worked
(Source: research data, 2016)
4.3.3. Highest Level of Academic Qualification of the Respondents
This was necessary to determine and ascertain whether they were in a position to respond
the queries from the researcher. From the study, it was established that a majority of the
respondents had a degree in a technical course 70%, 20% of the respondents had a
masters degree, 10% of the respondents had higher diploma while none of the responds
had doctoral and diploma levels. This findings indicate that majority of the respondents
were informed and can understand the concept of the study.

26
Figure 4.3: respondents and academic qualification
(Source: research data, 2016)
4.3.4. Operations and Planning
The study sought to find out various parameters that determine the stability of power
supply from the IPPs and their future going concern. From the findings, 60% showed that
the amount of power generated has increased in the last five years, 80% indicated that
power generated fluctuated with demand, while 98% showed that peak demand was
sustainable.
From the findings, 70% indicated that the number of employees working in the company
had increased in the last five years, 40% indicated that power supply rate was fixed
throughout the year, 80% indicated that the rate for peak demand for power was equal to
that during low demand. It was also found out that 86% of those interviewed were trained
in operations and system efficiency and that 93% of them knew the bases for electrical
tariff which implies that they could negotiate for better power purchase agreements.

27
In regard to plant capacity and peak demand, from the findings, 90% of the respondents
indicated that operations were below 70% plant capacity while 10% indicated above 70%
plant capacity during peak demand.
Figure 4.4: Respondents views on operation of IPPs
(Source: research data, 2016)
From the findings, 10% of the respondents indicted fossil fuels as the convenient source
of power generation, 50% indicated hydro while geothermal was rated at 40%. It was
noted that fuel is expensive in terms of operation cost and that it led to some IPPs closing
down (Aggreko) and also high cost tariff when they used to supply power to the grid.
In regard to supply and demand, from the findings, 90% of the respondents indicated that
there was adequate energy capacity to meet the increasing electricity demand, 50%
indicated that there was sufficient established reserve capacity for export. However, 90%
disagreed that power generated was always equal to power sold. This indicated that in

28
most cases, the companies have to put in place measure to reduce power loses. This is
because power sold is equal to power produced minus losses. If losses increased less
power would be sold expensively to mitigate the loss otherwise the company recorded
loss of revenue.
4.4. Generation Cost and Cost of Electricity
According to the findings, secondary data showed that generation cost affected electricity
tariff. This was as a result of several operation cost involved in electricity generation
process. This was tabulated as in table 4.1 below with a mean generation cost of 10.1 per
KWh and a standard error of 0.05
Table 4.1 Mean generation cost per KWh electricity generated
Company Westmont Iberafrica Orpower4-
Kenya
Tsavo
Power
Rabai
Item Mean Std.
Dev
Mean Std.
Dev
Mean Std.
Dev
Mean Std.
Dev
Mean Std.
Dev
1 Cost of
generation
material
4.8 0.01 4.2 0.05 3.1 0.03 5.0 0.02 3.2 0.03
2 Logistics
and
transport
of
equipment
3.1 0.03 3.4 0.02 2.8 0.03 3.0 0.04 2.7 0.01
3 Disposal
cost of
non
recyclable
material
1.2 0.02 1.4 0.01 1.0 0.01 2.0 0.02 1.0 0.02
4 Labour 2.4 0.04 1.5 0.02 1.1 0.04 1.8 0.02 1.4 0.02
Source: research data, 2016

29
4.5. Capacity Utilization and Cost of Electricity
According to the findings capital utilization affected the cost of electricity. In most
companies this cost does not depend on the power generated and therefore has to be
incurred whether the plant is operational or not. The costs are fixed and therefore must be
recovered from the sale of power that is supplied to the distributor. They vary from
company to company as shown in table below with a mean cost of 12.5 per KWh and
standard error of 0.03.
Table 4.2: Capacity capitation per KWh of electricity generated
Company Westmont Iberafrica Orpower4-
Kenya
Tsavo
Power
Rabai
Item Mean Std.
Dev
Mean Std.
Dev
Mean Std.
Dev
Mean Std.
Dev
Mean Std.
Dev
1 Capacity
infrastructure
utilization
3.1 0.02 2.4 0.03 3.0 0.01 3.5 0.04 2.7 0.00
2 Regular
maintenance
2.2 0.02 1.4 0.01 2.3 0.02 1.4 0.01 2.1 0.02
3 Capital cost
for design
and project
management
9.1 0.01 8.1 0.02 8.7 0.02 8.2 0.01 8.2 0.01
4 Labour 2.0 0.05 1.2 0.03 1.1 0.01 1.6 0.03 1.3 0.02
Source: research data, 2016
4.6. Power Supply Cost and Cost of Electricity
According to the findings supply and demand influenced the cost of electricity as shown
in table below with a mean cost of 5.3 and a standard error of 0.02.. The respondents
agreed that since power produced must be sold, Kenya power has the sole discretion to
determine how much power it will purchase and distribute to the connected customers.
The monopolistic competition enjoyed by the company leaves IPPs without any other to

30
sell power. The controls that are put in place by ERC compel IPPs to sign power
agreements with Kenya power hence putting them under its sole control. Those IPPs that
which cannot sustain the power purchase agreement are therefore forced to shut down by
capacity constraints.
Table 4.3: cost of power distribution
Company Westmont Iberafrica Orpower4-
Kenya
Tsavo Power Rabai
Item Average
…
Std
.
De
v
Average
…
Std
.
De
v
Average
…
Std
.
De
v
Average
…
Std
.
De
v
Average
…
Std
.
De
v
1 Distribut
ion cost
2.6 0.0
4
3.3 0.0
1
3.1 0.0
2
3.0 0.0
3
3.4 0.0
3
2 System
loses
1.0 0.0
2
0.9 0.0
3
1.2 0.0
1
0.8 0.0
2
1.0 0.0
3
3 Other
levies
1.2 0.0
5
1.1 0.0
1
1.0 0.0
1
1.0 0.0
1
0.9 0.0
1
4 Cost of
energy
and other
supplies
2.2 0.0
1
1.3 0.0
2
1.4 0.0
2
1.0 0.0
1
0.9 0.0
2
Source: research data, 2016
4.7. Correlation Analysis
Pearson moment correlation analysis was used in the study to determine whether there
was a relationship between the study variables. The independent variables had the
following Pearson moment correlation coefficients. Generation cost (r = 661), capacity
utilization cost (r = 560) and supply and demand cost (r = 184).
4.7.1. Generation Cost
In order to establish a relationship between generation cost and the cost of electricity, the
results showed a strong correlation between the generation cost and the electricity cost.

31
4.7.2. Capacity Utilization Cost
In order to establish a relationship between capacity utilization cost and the cost of
electricity, the results showed s strong positive correlation between the generation cost
and the electricity tariff.
4.7.3. Supply and Demand Cost
In order to establish a relationship between supply and demand cost and the cost of
electricity, the results showed a strong correlation between supply and demand of the
distributed electricity and the electricity tariff.
Table 4.4: Correlation of the study variables at 0.05 significance level
Generation
cost
Capacity
utilization
cost
Supply and
demand cost
Electricity
tariff
Generation
cost
Pearson
correlation
1
2- tailed
N 41
Capacity
utilization
Pearson
correlation
0.433 1
2- tailed 0.005
N 41 41
Supply and
demand cost
Pearson
correlation
0.732 0.642 1
2- tailed 0.001 0.003
N 41 41 41
Electricity
cost
Pearson
correlation
0.621 0.614 0.721 1
2- tailed 0.000 0.002 0.001
N 41 41 41 41
4.7.4. Cost of Electricity from IPPs per KWh
In order to establish the relationship between the operation cost of IPPs and the cost of
electricity, secondary data showed that the cost of electricity from all the IPPs was above
the operation cost. From the findings, the IPP operation cost was (10.1 + 12.5 + 5.3) 27.9
32
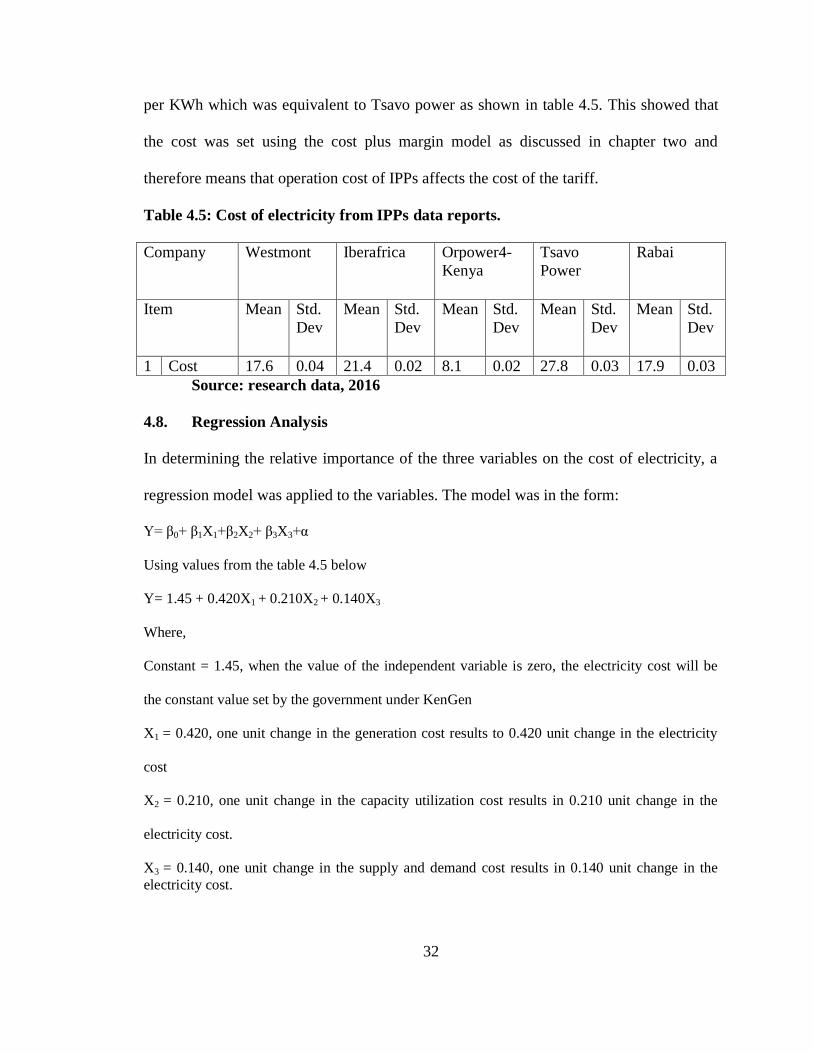
per KWh which was equivalent to Tsavo power as shown in table 4.5. This showed that
the cost was set using the cost plus margin model as discussed in chapter two and
therefore means that operation cost of IPPs affects the cost of the tariff.
Table 4.5: Cost of electricity from IPPs data reports.
Company Westmont Iberafrica Orpower4-
Kenya
Tsavo
Power
Rabai
Item Mean Std.
Dev
Mean Std.
Dev
Mean Std.
Dev
Mean Std.
Dev
Mean Std.
Dev
1 Cost 17.6 0.04 21.4 0.02 8.1 0.02 27.8 0.03 17.9 0.03
Source: research data, 2016
4.8. Regression Analysis
In determining the relative importance of the three variables on the cost of electricity, a
regression model was applied to the variables. The model was in the form:
Y= β0+ β1X1+β2X2+ β3X3+α
Using values from the table 4.5 below
Y= 1.45 + 0.420X1 + 0.210X2 + 0.140X3
Where,
Constant = 1.45, when the value of the independent variable is zero, the electricity cost will be
the constant value set by the government under KenGen
X1 = 0.420, one unit change in the generation cost results to 0.420 unit change in the electricity
cost
X2 = 0.210, one unit change in the capacity utilization cost results in 0.210 unit change in the
electricity cost.
X3 = 0.140, one unit change in the supply and demand cost results in 0.140 unit change in the
electricity cost.

33
Table 4.6: Regression coefficients
Item coefficients
Β Std Error
Constant 1.45 0.006
Generation cost 0.420 0.002
Capacity utilization
cost
0.210 0.004
Supply and demand
cost
0.140 0.003
From the findings electricity cost is a dependant variable while generation cost, capacity
utilization cost and supply and demand cost as independent variables. From the results in the table
4.4, the coefficient of regression (R = 0.6) shows a good strength of relationship between the
independent variables and the dependant variable. The coefficient of determination (R2
= 0.4)
show the predictive power of the model at 40% variation which is explained by the various
operation process costs within the independent variables.
Table 4.7: ANOVA
Model R R2 Standard error of the
estimate
1 0.720 0.518 0.003
From the ANOVA findings, the P-Value is of 0.001. This is less than 0.05 at 95% confidence
level indicating the existence of a strong relationship between the independent and the dependant
variables. The variable fits the regression model since from the results the significance of P-Value
and the F ratio at 0.000 shows that there was no much deference in means between the dependent
and the independent variables
4.9. Input Output Model
The input output analysis was used to show economic relationship between two economic
sectors (the IPPs operation costs and the electricity tariff). In testing the use of the input
output model in determining electricity tariff, the Leontief Matrix was applied as shown
in table 4.8

34
Table 4.8: Input output table for the electricity energy sector
Sector 1 (IPPs)
Sector 2 (Kenya
Power)
Sector 1 Sector 2 Final
demand (D)
Total
Production
Cost(IPPs)/KWh
Distribution
cost/KWh
% power
distributed
from IPPs
in relation
to total
power
distributed
Selling price
(IPPs)/KWh
Selling price
(consumer)/KWh
Primary inputs Capital/KWh Capital/KWh
Total - - - -
The Leontief matrix was obtained from the figure above as shown in table 4.8
Table 4.9 Intersectional demand for the electricity sector restricted to two players
Sector 1 (IPPs)
Sector 2 (Kenya
Power)
Sector 1 Sector 2 Final
demand (D)
Total
Mean
0.20
Mean
1.75
25% of per
distributed
by Kenya
power is
from IPPs
and 75% is
from
KenGen
2.20%
2.34%
Mean
0.89
Mean
0.70
Primary inputs 10.0 40.0 50.0
Total 11.09 40.45 100%
From the findings, the variables fit in the input output model.
Table 4.50: Technological matrix of the electricity sector
Sector 1 (IPPs) Sector 2 (Kenya Power)
Sector 1 (IPPs) 0.2/11.09 1.75/40.45
Sector 2 (Kenya Power) 0.89/11.09 0.7/40.45

35
From table 4.9 the technological matrix was simplified as:
0.02 0.04
0.08 0.02
If x is cost of power from IPPs and y is the cost of power (tariff) from Kenya power
demanded by customers, then applying
x = (I - A)-1
y.
From the findings,
(I - A)-1
= 13 -12 as Leontief inverse matrix
-12 13
From the findings, the installed capacity fluctuations from IPP power ranges from 20% to
30%. Applying the model above, IPPs stand to lose 12 shillings per unit when they are
switched off by Kenya Power and therefore it is prudent that IPP power can be bought at
a minimum of 13 shillings per unit throughout the year without switch off in order to
maintain their stability.
The objective of using the input output analysis is to balance the shifting in demand of
the amount of power purchased from the IPPs with that from the state utility. It also helps
to determine the amount money paid to the IPPs by the distributor hence avoiding
payment for power not delivered as the case when IPPs are portrayed as expensive in
demanding payment for power not delivered.

36
CHAPTER FIVE: SUMMARY, CONCLUSSION AND
RECOMMENDATIONS
5.1. Introduction
The chapter provides summary of the findings from chapter four. It also gives the
conclusions and recommendations of the study based on the research objectives. The
objectives of this study were to establish the relationship between operation cost of IPPs
and electricity tariff and to test the input output model in determining power tariff.
5.2. Summary of the Findings
Operations involved in the generation and distribution of power play a significant role in
determining the electricity cost passed on to the consumer. This is because power
generated must be used or lost yet the cost of generating remains a factor whether power
has been used or lost. Activity based costing remains a significant base for tariff.
Generation cost, capacity utilization cost and supply and demand costs are some of the
determinants of the electricity tariff in Kenya.
The correlation analysis for generation cost by IPPs was reported as 0.6. This means that
changes in the cost of generating power affected the electricity cost. This was depicted
when there was drought season that led to the shift from hydro generation to fuel thermal
generation making the electricity tariff to rise sharply.
During the period, capacity utilization and supply and demand costs showed positive
correlation. This means that when capacity is under-utilized, electricity tariff increases in
the long run in order to mitigate and recover invested capital and labour. It was also

37
found out that if electrical losses are not minimized, then it led to lost revenue by
companies or increased tariff which is passed on the customer.
On ANOVA test, since the P-value was less than 0.05, it therefore implies that the cost of
electricity in Kenya is dependent on the generation cost, capacity utilization cost and
supply and demand cost.
5.3. Conclusions
The study concludes that operation cost of IPPs significantly affect the cost of electricity
in Kenya. Generation cost affects tariff in that the bills that get to consumer have to bear
a cost that goes into fuel charges especially when thermal generator are used during dry
seasons. Depending on the fuel used to generate power, the study established that
consumers have to bear the price if the source for generating power changes.
The study established that when some plants fail to be commissioned on time yet capital
costs remain, the cost of electricity from such plants will be recovered from the consumer
through higher tariff as fixed cost.
The study found out that supply and demand of power affect the cost of power supplied
to the consumer. The study established that the cost of labour and distribution materials
was charged from consumers through fixed charges. Over the period Kenya power
increased fixed charge from one hundred and twenty shillings to one hundred and fifty
shillings. Therefore, even if the ERC policy were to determine the tariff per unit
consumed, consumers have to pay other factors that appear in the final bill. These charges
include forex charge, fuel adjustment, energy levy and monthly fixed costs.

38
5.4. Recommendations
Recommendations have been made by various stakeholders in the energy economy,
especially the electricity sector. In this study, which is about the determinants of the cost
of electricity, operation costs of IPPs were found to play a major role in determining the
final electricity tariff that consumers pay from their monthly bills. The findings of the
study formed the basis of the following recommendations:
a. The generation mix need to reviewed to give equal opportunity for the power
supply from the IPPs and the state utility (KenGen). IPP power should not only be
used during emergency hence a clear generation mix needs to be determined.
b. Kenya power needs to minimize energy distribution losses by adopting modern
technology and enhanced demand side energy management.
c. The pricing strategy should be reviewed to avoid passing the system inefficiency
costs to the customer. This can be done through management of the shifting in
demand hence avoiding switching of IPP power.
d. Further research and benchmarking need to be undertaken the determine better
pricing mechanism for power tariff to avoid high cost that are passed to consumer
as a result underutilized capacity in power generators.
5.5. Limitations of Study
The researcher faced a number of limitations while undertaking the study. In input
output model was only restricted to two players yet it can be extended to other player
in the energy sector. It was evident that some energy data kept by most IPPs were
incomplete or rather the parties did not give classified energy data. Secondly, there
39
was limited time and financial resources to collect date beyond five years yet IPPs
have been in operation since 1996. Lastly, there is need to study operations by
KenGen which is also a power generating company that sell power to Kenya power
so that a clear comparison can be made on the tariff.
5.6. Suggestion for Further Research
Future research should use census survey to study on the operation cost of all the
electricity plants both private and state owned relation to cost of electricity. It will be
also necessary to study the relationship between power purchase agreements and the
price of electricity set by the energy regulation commission. This will help in
determining better policies hence adopting favorable pricing models for electrical
power.

40
REFERENCES
Anderton A. (2012). Economics. Pearson Education India, NewDelhi
Bernard, Andrew B. and Redding, Stephen and Schott, Peter K. (2010) „Multiple-product
firms and product switching.‟ American economic review 100 (1).
Bernard, Andrew B., Stephen J. Redding and Peter Schott. 2007. „Comparative
Advantage and Heterogeneous Firms.” Review of Economic Studies.
Bernard, Andrew B., Stephen J. Redding and Peter Schott. 2005. “Products and
Productivity.” National Bureau of Economic Research Working Paper 11575.
Boyle, S. and Krajewiski (2007) "Impact of Changes in Organizational Structure on
Selected Key Performance Indicators for Cultural Organizations", International
Journal of Cultural Policy, Vol. 13 (3).
Bryman, A. and Cramer, D. (2001) Quantitative Data Analysis with SPSS Release 10 for
Windows: A Guide for Social Scientists, East Essex: Routledge
Cooper, D.R. and Schindler, P.S. (2008). Business Research Methods,10th Edition.
McGraw-HILL INTERNATIONAL EDITION
Charles Nzila and Dhole G.M (2010). Electric Power Distribution Automation. Laxmi
Publications Ltd, New Delhi.
Dietzenbacher, Erik and Michael L. Lahr, eds. Wassilly Leontief and Input-Output
Economics. Cambridge University Press, 2004.
Eberhard A. (2010). Independent Power Producers and Power Purchase Agreements:
Frontiers of International Experience.
Ebrahim S. Ann B (2005). Handbook of Health Research Methods: Investigation,
Measurement and Analysis, McGraw – Hill International, New York U.S.A

41
Energy Regulation Commission (2013). Updated Retail Tariffs Application in Kenya
F Birkin, T Polesie, L Lewis 2009. A new business model for sustainable development:
an exploratory study using the theory of constraints in Nordic organizations.
Business Strategy
Hayes, R., Pisano, G., Upton, D. and Wheelwright, S. (2005) Operations, Strategy and
Technology: Pursuing the Competitive Edge, New York: John Wiley.
Hannele Holttinen, “Wind integration: experience, issues, and challenges.” 18 September
2012
Hannele Holttinen, Peter Meibom, Antje Orths, Bernhard Lange, Mark O'Malley, John
Olav Tande, Ana Estanqueiro, Emilio Gomez, Lennart Söder, Goran Strbac, J
Charles Smith, Frans van Hulle “Impacts of large amounts of wind power on
design and operation of power systems,” results of IEA collaboration. 16 June
2010
Iloranta, K. (2008). Supply Management must become External Resource Management,
Aalto University, Department of Industrial Engineering and Management PB
15500, 00076
International Energy Agency (2009). World energy outlook. International Energy Agency
9, Rue de la federation 75739 Paris Cedex 15 France
International Energy Agency (2011). World energy outlook. International Energy Agency
9, Rue de la federation 75739 Paris Cedex 15 France
Jason Wendle (2013). Independent power producers: a solution for Africa: Private Sector
and Development Magazine No. 18.

42
Joe Agron 2009, Results from AS&U's 38th Annual Maintenance & Operations Cost
Study for Schools April 1, American School and University
J Von Braun 2007. The world food situtation: new driving forces and required actions
books.google.com
J Torriti, MG Hassan, M Leach 2010, Demand response experience in Europe: Policies,
programmes and implementation. Elsevier
Kenya Power (2013), Updated Retail Tariffs Application; Kenya Power, Nairobi
Kenya Power Lighting Company Annual Reports, 2002–2003 (http;//www.KPLC.co.ke).
Kenya Power Lighting Company Annual Reports, 2010–2011 (http;//www.KPLC.co.ke).
Kenya National Bureau of Statistics–KNBS (2000), Economic Survey. Government
Printer: Nairobi
Kamau C. W (2009). Employee perception of outsourcing strategy at Kenya Power.
Unpublished MBA project, University of Nairobi.
Kaplan, S (2008). Cognition, capabilities, and incentives: Assessing firm response to the
fiber optic revolution. Academy of Management Journal 51(4): 672-95
Njoroge J.K. (2008). The Challenges of Vandalism on Power Equipment. Kenya Power
and Lighting Company, Nairobi.
Pamela Edwards, Frank K. Birkin, David G. Woodward. Financial comparability and
environmental diversity: an international context. 12 November 2012
Patrick A. (2011). The Worth of Goods: Valuation and Pricing in the Economy. Oxford
University Press, London.
Peter Coy,''The Power of Smart Marketing," Business Week, April 10, 2010

43
Mustafa K. Mujeri 2013. Quick Rental Power Plants in Bangladesh: An Economic
Appraisal. New Delhi
Mujeri, M.K. and T.T. Chowdhury 2013. Electricity Consumption and Economic Growth
in Bangladesh: A Time Series Study, (mimeo), Bangladesh Institute of
Development Studies, Dhaka.
MoF 2010. Towards Revamping Power and Energy Sector: A Road Map, Finance
Division, Ministry of Finance, Government of the People‟s Republic of
Bangladesh, Dhaka.
MoF 2011. Power and Energy Sector Road Map: An Update, Finance Division, Ministry
of Finance, Government of the People‟s Republic of Bangladesh, Dhaka.
Ministry of Energy Report, (2011-2013).http://www.MOE.go.ke.
Newbery, David and Commender. 2000. Issues and Options for Restructuring Electricity
Supply Industries. Unpublished manuscript.
Ravindra Kumar 2014 · Council of Scientific and Industrial Research (CSIR), New Delhi
Rohit Mehta, 2012. Principles of Power Systems, S. Chand & Company press, New
Delhi, Revised Edition.
VDR Guide Jr, RH Teunter 2003. Matching demand and supply to maximize profits from
remanufacturing& Service Operations. pubsonline.informs.org
World Bank. (2010-2012). the political economy of reform: Moving from analysis to
action. Workshop Proceedings Final Report. June 21-22, 2010.
World Bank (2012) Doing Business in Kenya 2012: Comparing Regulation for Domestic
Firms in 13 Cities and 183 Countries. The International Bank for Reconstruction
and Development/The World Bank 1818H Street NW Washington, D.C 20433

44
Zikmund, W. Barry, B. and John C. (2012). Business Research Methods, Erin Joyner
Publisher, South Western 519, Natorp Boulevard Mason, OH 45040 U.S.A

45
APPENDICES
QUESTIONAIRRES
The questionnaire is divided into two parts as follows: personal data and operations and
planning. Please answer the questions as guided by the instructions in each part.
RESERCH QUESTIONAIRE
Part I. PERSONAL-DATA
Instructions: Please write in the space provided or tick ( ) appropriately as applies to you.
1. Name of employer ……………………number of years worked ………area of
work…………….
2. What is your highest level of Academic Qualification? [ ] Doctoral Degree [ ]
Masters
[ ] Bachelors [ ] Higher Diploma [ ] Diploma [ ]
Other……………………..
Part II: operation and planning
3. What would you say about the following statements? (Please tick in the box)
General operations Yes NO
Amount of power generated has increased in the last five years
Power generated fluctuate with demand
Peak demand is sustainable
Planning
The number of employees working in the company has increased in the last
46
five years
Power supply rate is fixed throughout the year
The rate for peak demand for power is equal to that during low demand
I am trained in operations and system efficiency
I know the bases for electrical tariff
(explain……………………..…………………………)
4. Please state the approximate plant capacity ………….…......and peak demand -----------------
5. Choose which power source is the most convenient for your operations
(a.) fossil fuel [ ] Yes [ ] No. (b.) hydro [ ] Yes [ ] No (c.) Any other,
specify…………………
6. What is your major source of fuel and why
……………………………………………………………….
7. Please rate the following statements regarding supply and demand for power
Demand and supply Yes NO
There is adequate energy capacity to meet the increasing demand
There is sufficient established reserve capacity and need to export
excess
Reactive power compensation has been well utilized hence power
generated is equal to power sold
Any other comment on power demand and supply.......................................................................